Shyft — Investor Day (June 2021)
60 slides from Shyft's investor day presentation, Jun 8, 2021
Slide 1: Delivering. The Road Ahead.

Slide 2: Video
Video SHYF Tero

Slide 3: Juris Pagrabs
Juris Pagrabs Group Treasurer / Head of IR
Slide 4: Forward-Looking Statement
Forward-Looking Statement The financial results included within this presentation are from continuing operations unless otherwise noted. (© 2021 THE SHYET GROUP, INC 4
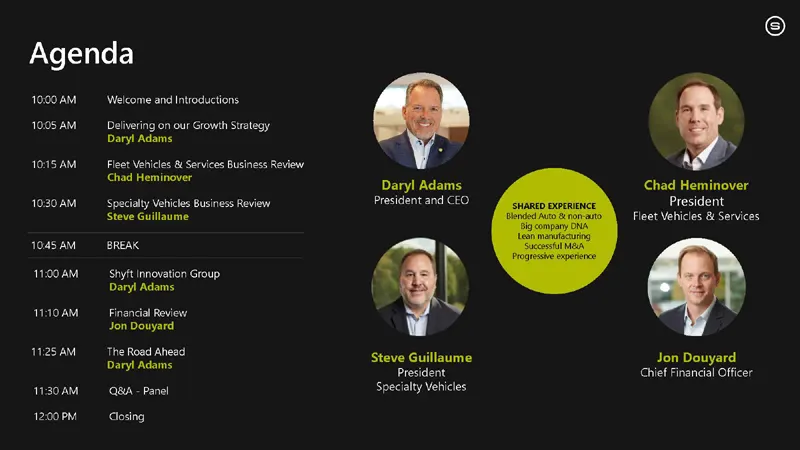
Slide 5: Agenda
Agenda 1000AM Welcome and Introductions 1005AM Delivering on our Growth Strategy Daryl Adams 1O1SAM Fleet Vehicles & Services Business Review Chad Heminover 1030AM Specialty Vehicles Business Review ‘Steve Guillaume 1045AM BREAK 11:09AM Shyft Innovation Group Daryl Adams 11:10AM Financial Review Jon
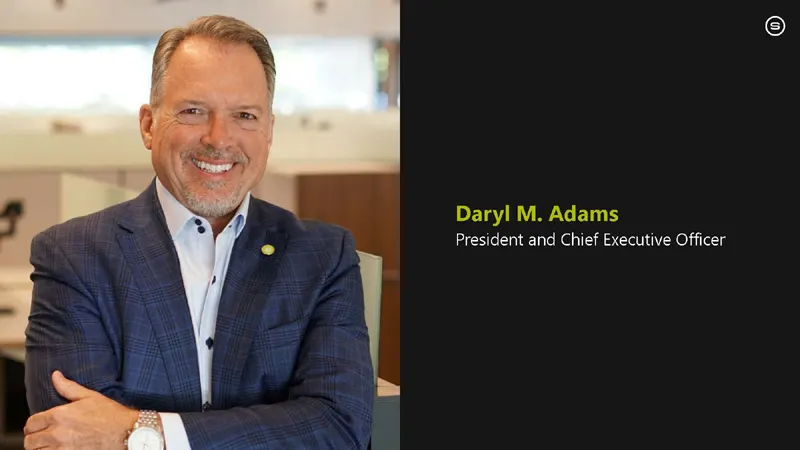
Slide 6: President and Chief Executive Officer
President and Chief Executive Officer
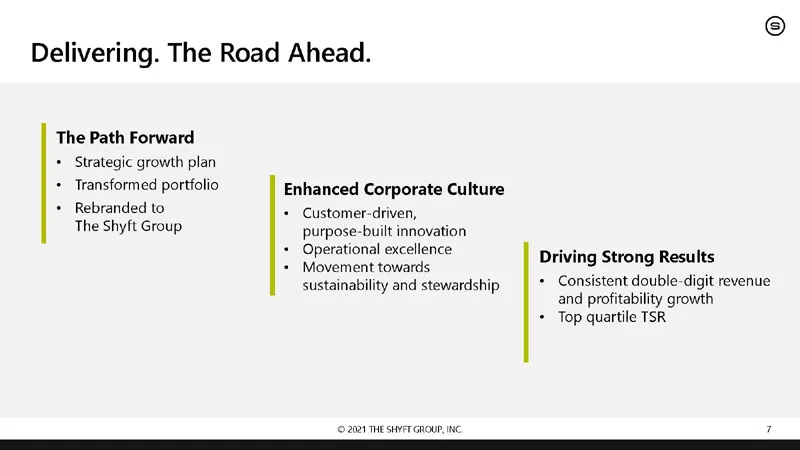
Slide 7: Delivering. The Road Ahead.
Delivering. The Road Ahead. The Path Forward + Strategic growth plan + Transformed portfolio Enhanced Corporate Culture + Rebranded to + Customer-driven, The Shyft Group purpose-built innovation Operational excellence Saleen Driving Strong Results sustainability and stewardship + Consistent double-d
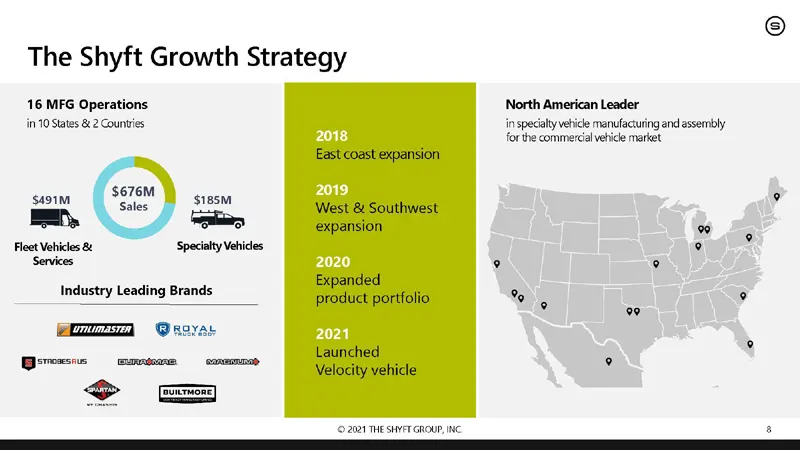
Slide 8: The Shyft Growth Strategy MFG Operations
The Shyft Growth Strategy 16 MFG Operations in 10 States & 2 Counties s491M sigsm Fleet Vehicles 8 ‘Specialty Vehicles Services Industry Leading Brands geyas Bovessns —ummione |= eats a North American Leader in specialty vehicle manufacturing and assembly forthe commercial vehicle market. cy ° ° e 0
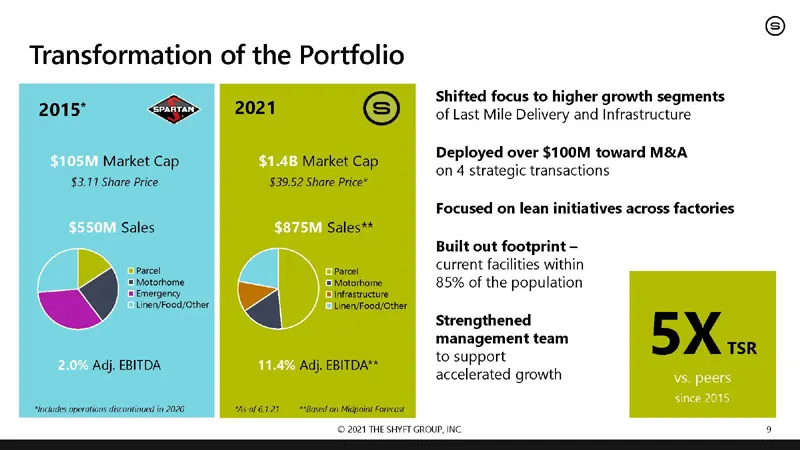
Slide 9: Transformation of the Portfolio
Transformation of the Portfolio 2015" QJ 2021 © Market Cap Market Cap $2.11 Share Price $3952 Share Prce* Sales Sales parcel Part = Norham = Motatoine 1 Emergeng, Se Tafrsrvcure Unenfood her Unenfocdisher Adj. EBITDA ‘Adj. EBITDA‘ stnctdes operations dco in 202 “Ao 6121 Mason Pipi Frcot Shifted focu
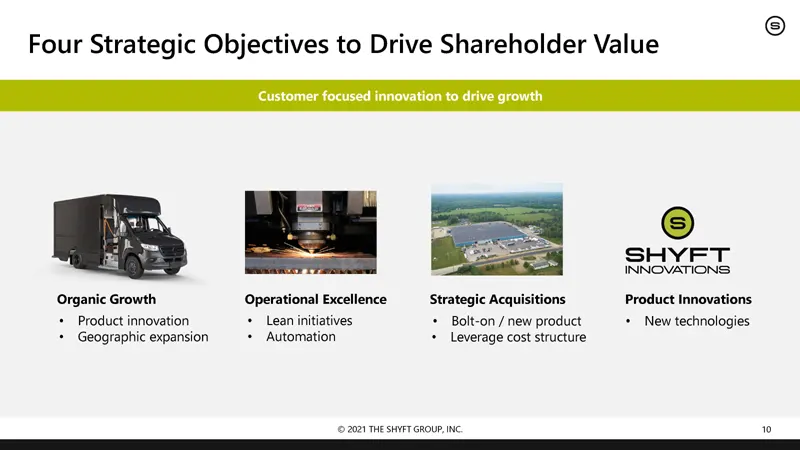
Slide 10: Four Strategic Objectives to Drive Shareholder Value
Four Strategic Objectives to Drive Shareholder Value Customer focused innovation to drive growth Organic Growth SHYF INNOVATIONS: Operational Excellence Lean initiatives Bolt-on / new product . Automation Strategic Acquisitions Product Innova Product innovation Geographic expansion + ns New technolo
Slide 11: Focused ESG Efforts Underway
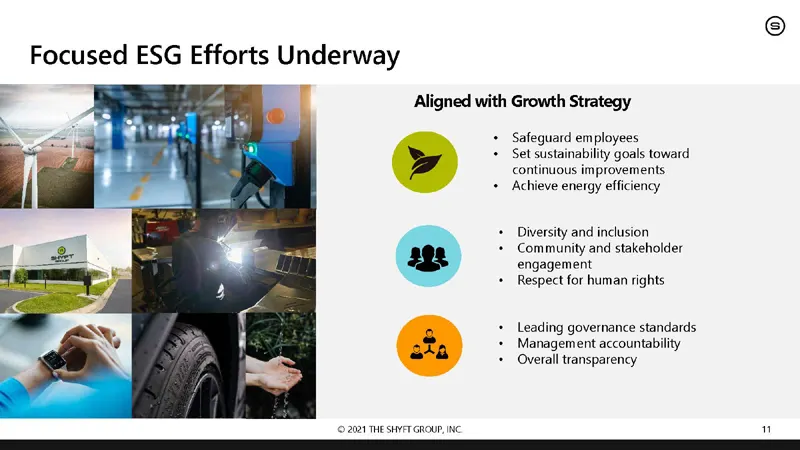
Focused ESG Efforts Underway (© 2021 THE SHYFT GROUP, INC Aligned with Growth Strategy Safeguard employees Set sustainability goals toward continuous improvements Achieve energy efficiency Diversity and inclusion Community and stakeholder engagement Respect for human rights Leading governance standa
Slide 12: The Road Ahead
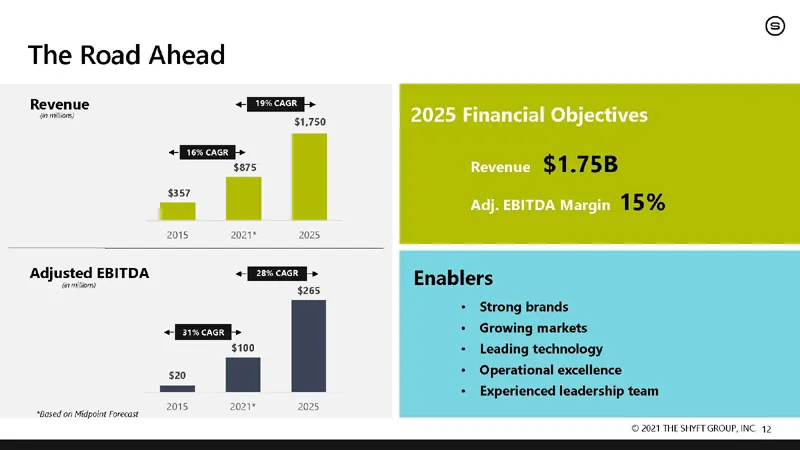
The Road Ahead Revenue + oman $1,750 $875 $357 Adjusted EBITDA Be csncacn ose on pie Forcast 2025 Financial Objectives Revenue Adj. EBITDA Margin Enablers Strong brands Growing markets Leading technology Operational excellence Experienced leadership team © 2021 THE SHYFTGROU
Slide 13: Chad Heminover
Chad Heminover President, Fleet Vehicles & Services
Slide 14: Fleet Vehicles and Services
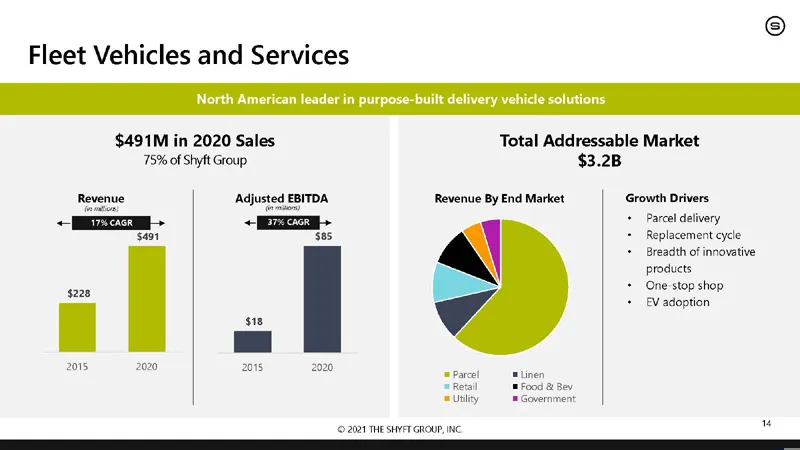
Fleet Vehicles and Services North American lead It delivery vehicle solutions $491M in 2020 Sales Total Addressable Market 75% of Shyft Group $3.2B Adjusted EBITDA Revenue By End Market Growth Drivers sao + Replacement cycle Breadth of innovative products _ ‘One-stop shop + EVadoption (© 2021 THE SH
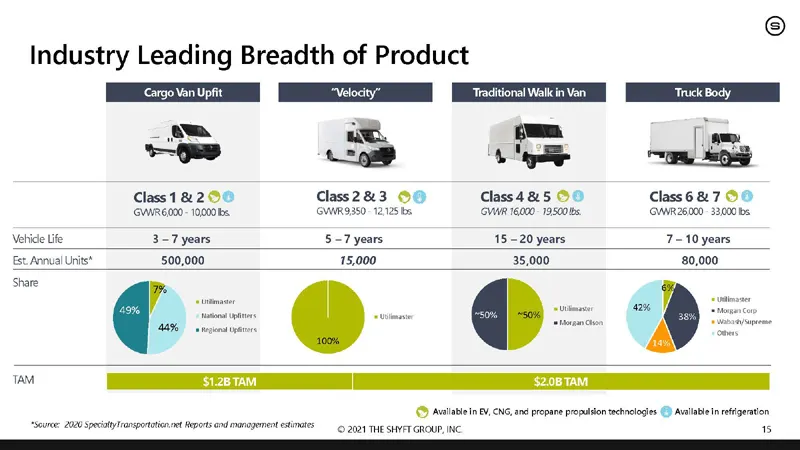
Slide 15: Industry Leading Breadth of Product
Industry Leading Breadth of Product as Class 1 & 220 Class2&3 OO Class4&5 OO Class 6 & 7 OO GwiR6000- 19000 GWWR9350- 12125 bs Gv 16000-19500 GuwR26000- 33000: Vehidle Life 3-7 years 5-7 years 7-10 years ft Annual Units" 500,000 15,000 80,000 Share 2% TAM $1.2BTAM $2.0BTAM © husinbioin e,6NG, a prop
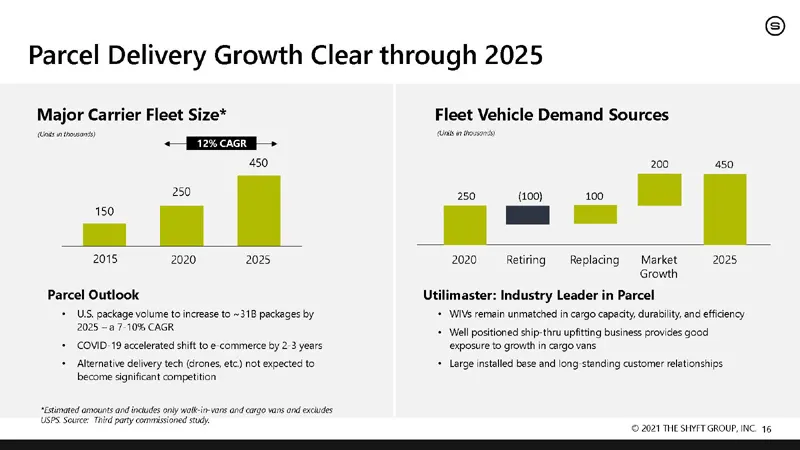
Slide 16: Parcel Delivery Growth Clear through 2025
Parcel Delivery Growth Clear through 2025 Major Carrier Fleet Size* seo Bie 2%.cAGR 450 250 150 2015 2020 2025 Parcel Outlook + US. package volume to increase to ~318 packages by ° 2025-07 10% CAGR COVID 19 accelerated shift to1e commerce by 2-2 years ‘Alternative delvery tech (drones, etc) not expe
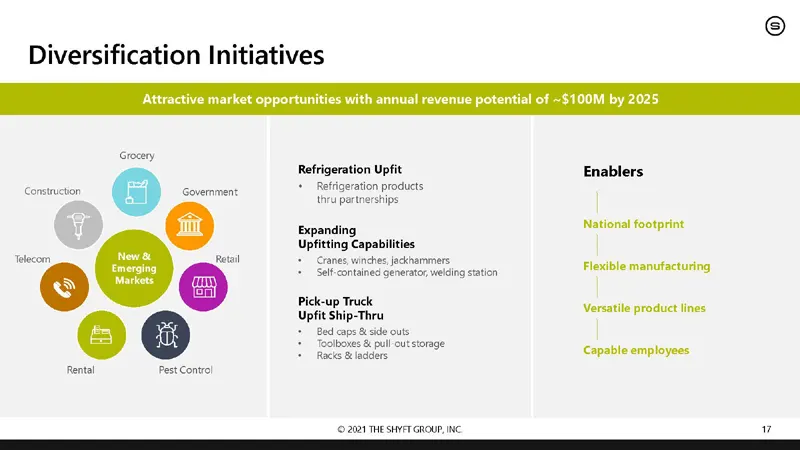
Slide 17: Diversification Initiatives
Diversification Initiatives Attractive market opportunities with annual revenue potential of ~$100M by 2025 @ Refrigeration Upfit, Enablers Construction ical eee + Refrigeration products thvu partnerships Expanding National footprint Upfitting Capabi © Sire eee ten Flexible manufacturing Pick-up Tru
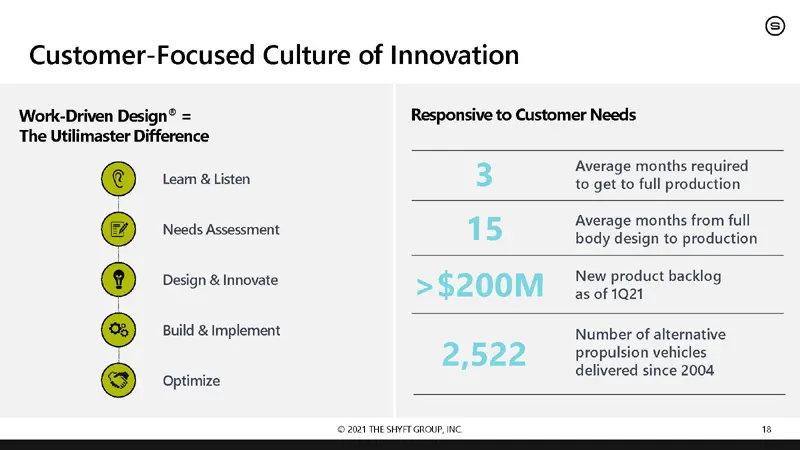
Slide 18: Customer-Focused Culture of Innovation
Customer-Focused Culture of Innovation Work-Driven Design® = Responsive to Customer Needs The Utilimaster Difference 3 Average months required Leam & Listen to get to full production Average months from full @ Rtesibcesesinien 15 body design to production Design & Innovate New product backlog @ ~ >$
Slide 19: Continuous Mindset of Innovation
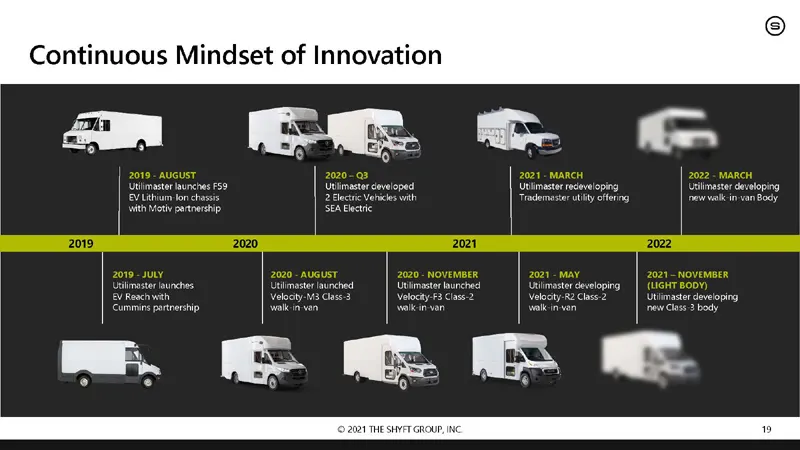
Continuous Mindset of Innovation tec reseeloping ste att oer = |
Slide 20: FVS Electric Vehicle Strategy
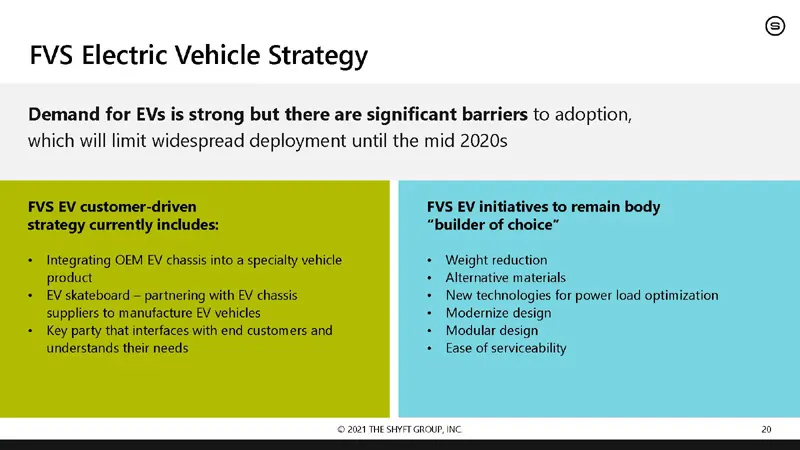
FVS Electric Vehicle Strategy Demand for EVs is strong but there are significant barriers to adoption, which will limit widespread deployment until the mid 2020s FVS EV customer-driven FVS EV initiatives to remain body strategy currently includes: “builder of choice” Integrating OEM EV chassis into
Slide 21: Margin Expansion through Operational Excellence
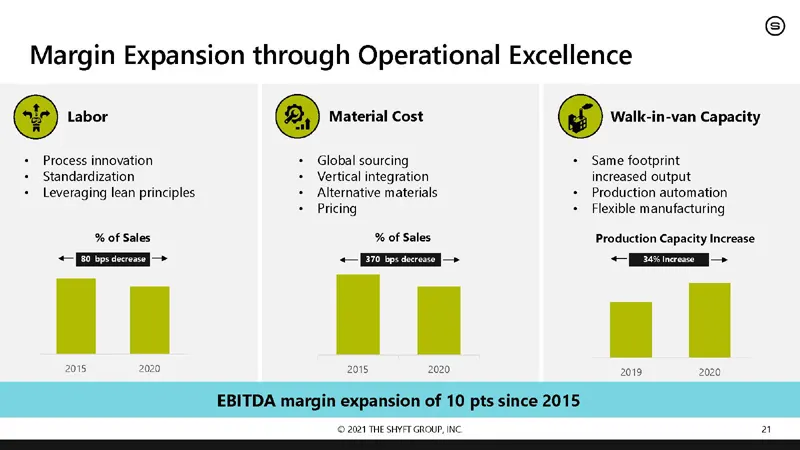
Margin Expansion through Operational Excellence @» Process innovation Standardization Leveraging lean principles % of Sales @) Material Cost Global sourcing : Vertical integration Alternative materials, Pricing % of Sales (© 2021 THE SHYFT GROUP, INC (CD) Walk-in-van Capacity ‘Same footprint increas
Slide 22: Continuous Improvement Case Study
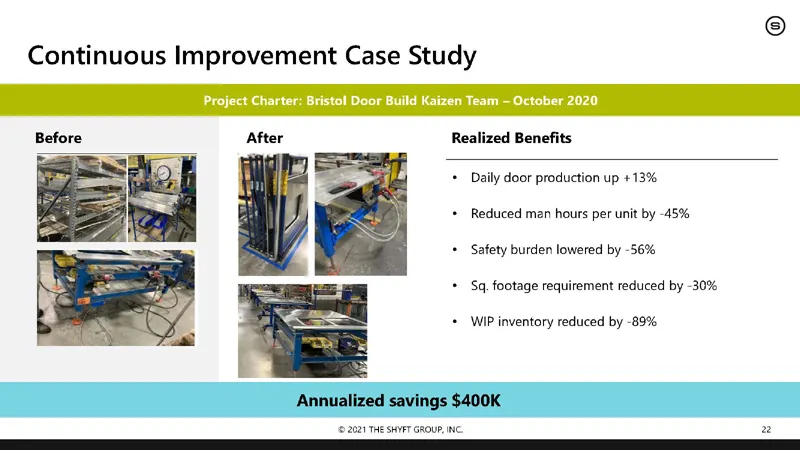
Continuous Improvement Case Study After Realized Benefits Daily door production up +13% Reduced man hours per unit by -45% Safety burden lowered by -56% Sq. footage requirement reduced by -30% WIP inventory reduced by -89% Annualized savings $400K {© 2021 THE SHYFT GROUP, INC 2
Slide 23: The Road Ahead
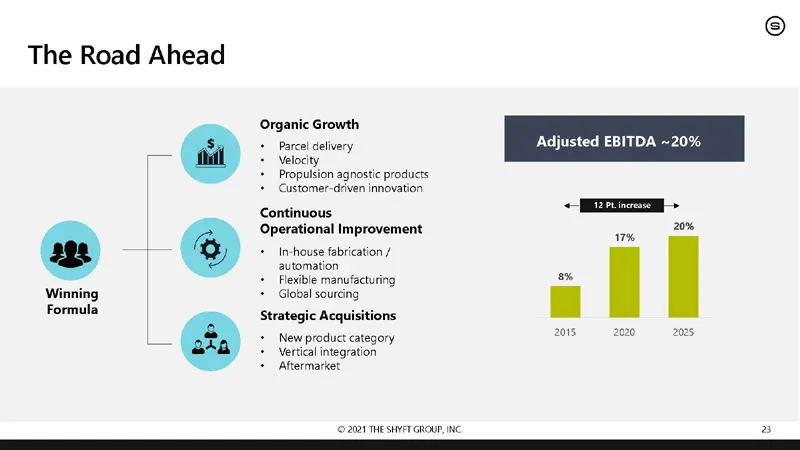
The Road Ahead Winning Formula Organic Growth + Parcel delivery Adjusted EBITDA ~20% + Velocity + Propulsion agnostic products + Customer-driven innovation = Continuous Operational Improvement me + In-house fabrication / automation + Flexible manufacturing 2% + Globsl sourcing | Strategic Acquisitio
Slide 24: Steve Guillaume
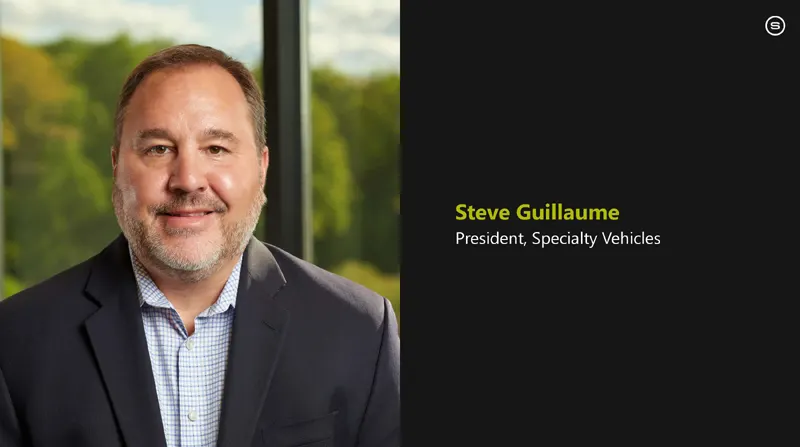
Steve Guillaume President, Specialty Vehicles
Slide 25: North American leader in service vehicle and specialty chassis manufacturing
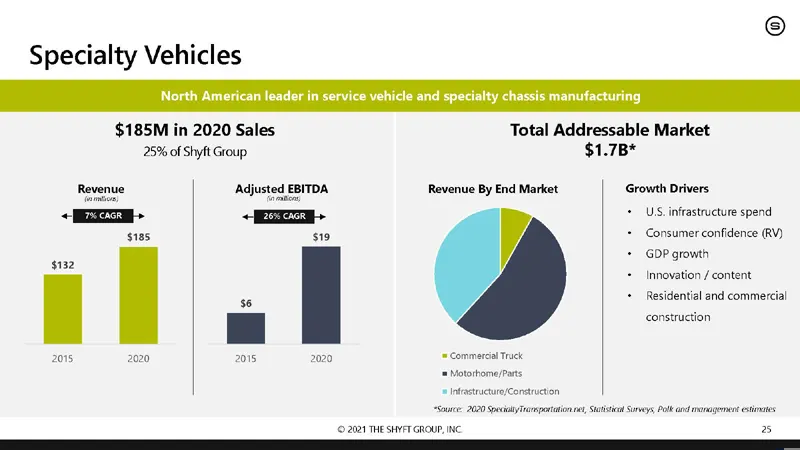
North American leader in service vehicle and ecialty chassis manufacturing $185M in 2020 Sales Total Addressable Market 25% of Shyft Group $1.7B* Revenue ‘Adjusted EBITDA Revenue By End Market Growth Drivers Prcack Bien ccna + US. infrastructure spend Sirs oD + Consumer confidence (RV) + GOP growth
Slide 26: Industry Leading Specialty Brands
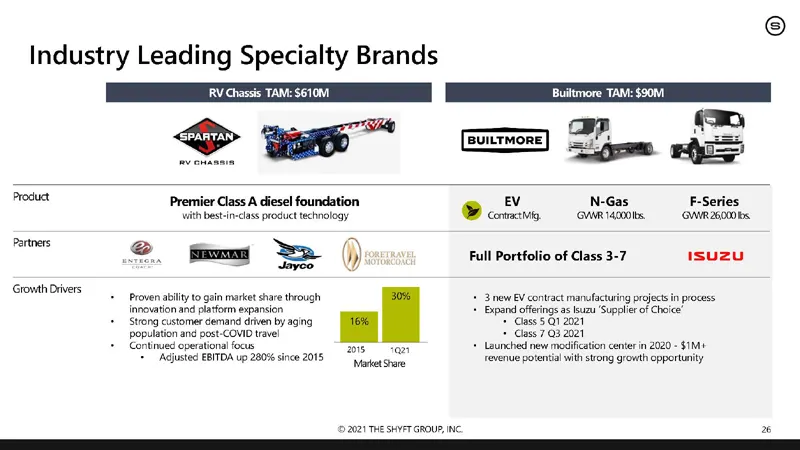
Industry Leading Specialty Brands RV Chassis TAM: $610M Builtmore TAM: $90M iam wh Premier Class A diesel foundation EV N-Gas F-Series With bestia: product technology Cerm,—GUIR AID GMMR Parnes So —_« Sp (OE . Full Portfolio of Class 3-7 Isuzu Growthowvers Proven ability to gain market share through
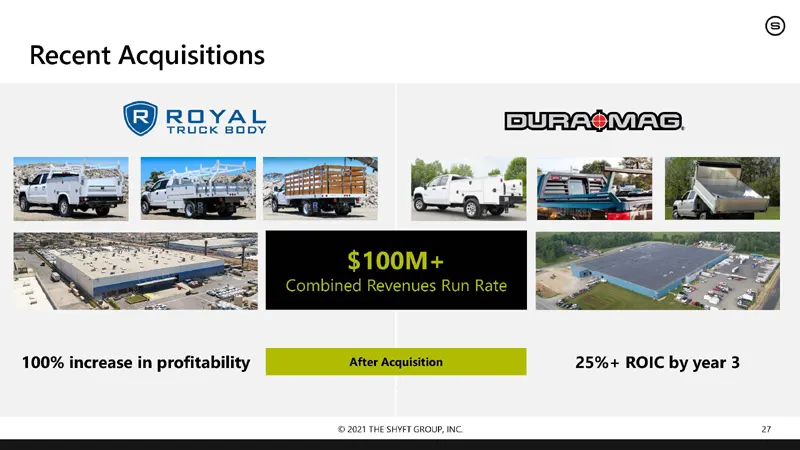
Slide 27: Recent Acquisitions
Recent Acquisitions 100% increase in profitability [QUARRY = 25% + ROIC by year 3
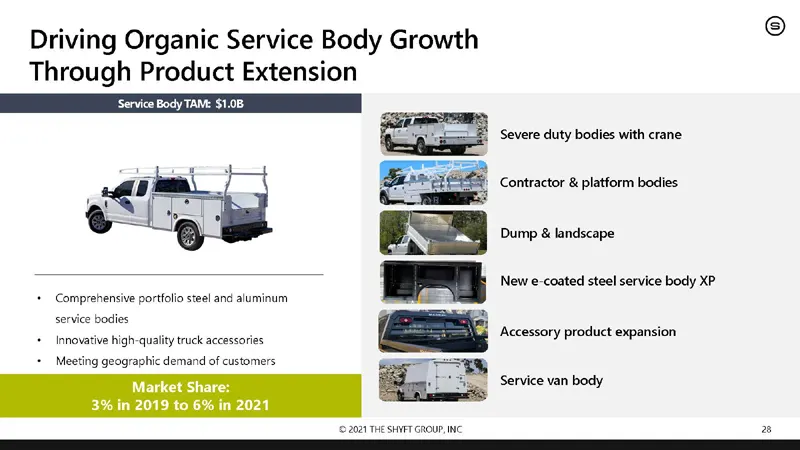
Slide 28: Driving Organic Service Body Growth
Driving Organic Service Body Growth Through Product Extension Severe duty bodies with crane | Contractor & platform bodies Dump & landscape New e-coated steel service body XP + Comprehensive portfolio steel and aluminum service bodies + Innovative high-quality truck accessories oscar product expen c
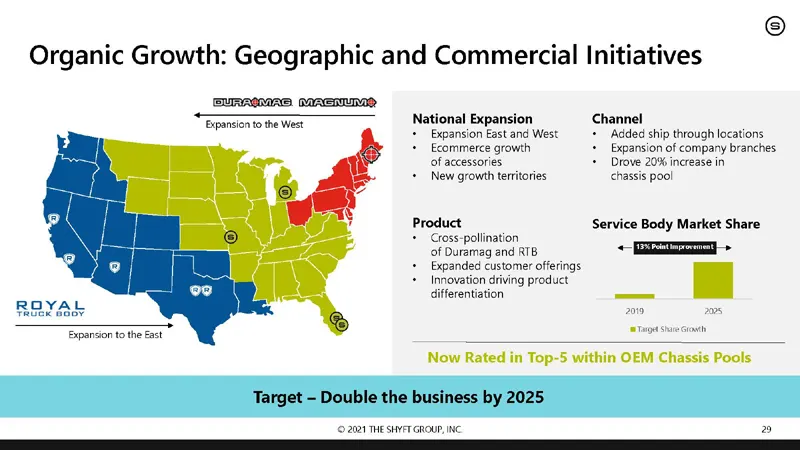
Slide 29: Organic Growth: Geographic and Commercial Initiatives
Organic Growth: Geographic and Commercial Initiatives SURREMAS CRASH Spoon eel National Expansion Channel + Expansion ast and West. + Added ship through locations + Ecommerce growth + Expansion of company branches of accessories + Drove 20% increase in + New growth territories chassis poo! Product S
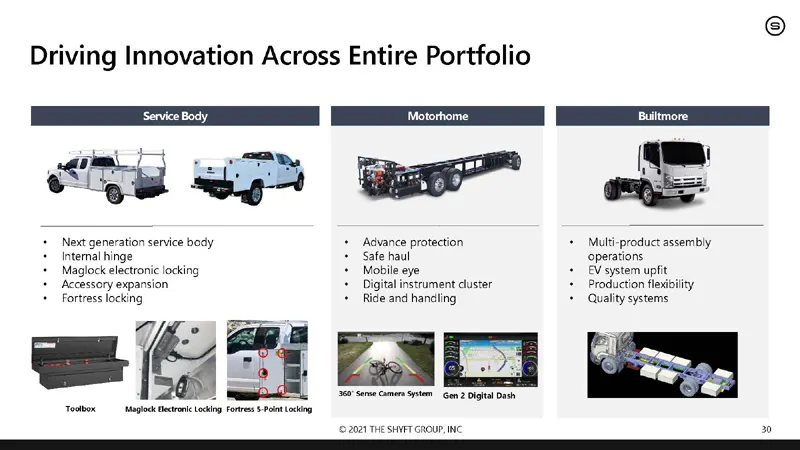
Slide 30: Driving Innovation Across Entire Portfolio
Driving Innovation Across Entire Portfolio + Next generation service body + Advance protection + Multi-product assembly + Intemal hinge + Safe haul operations + Maglock electronic locking + Mobile eye + EVsystem upft + Accessory expansion + Digital instrument cluster + Production flexibility + Fortr
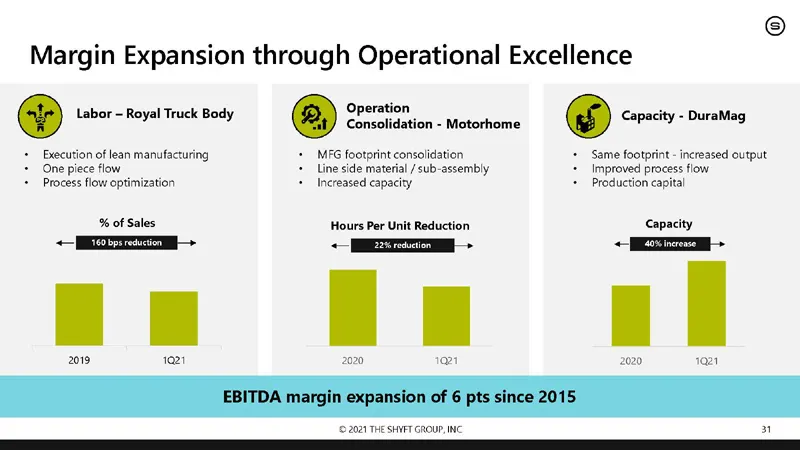
Slide 31: Margin Expansion through Operational Excellence
Margin Expansion through Operational Excellence @ Labor ~ Royal Truck Body ppecston ae oe ©) Capacity - DuraMag + Beecution of lean manufacturing + MFG footorint consolidation Same footprint - increased output + One piece flow + Line side material /sub-assembly + Improved process flow + Process flow
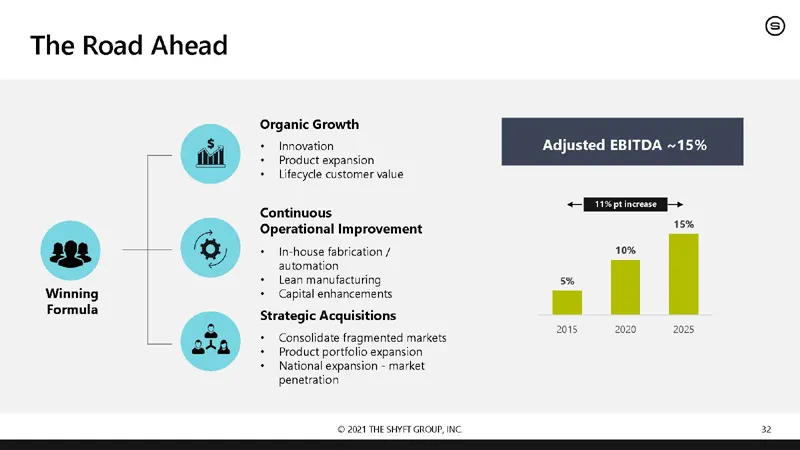
Slide 32: The Road Ahead
The Road Ahead Winning Formula Organic Growth + Innovation + Product expansion + Lifecycle customer value Adjusted EBITDA ~15 == Continuous Operational Improvement 19% + In-house fabrication / 10% automation + Lean manufacturing 5% + Gapital enhancements Strategic Acquisitions + Consolidate fragment

Slide 33: Intermission
Intermission

Slide 34: President and Chief Executive Officer
President and Chief Executive Officer
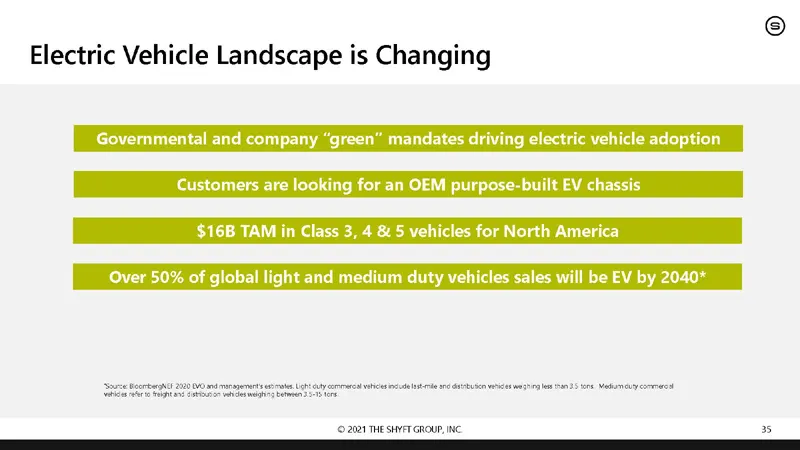
Slide 35: Electric Vehicle Landscape is Changing
Electric Vehicle Landscape is Changing Customers are looking for an OEM purpose-built EV chassis $16B TAM in Class 3, 4 & 5 vehicles for North America Over 50% of global light and medium duty vehicles sales will be EV by 2040* Governmental and company “green” mandates driving electric vehicle adopti
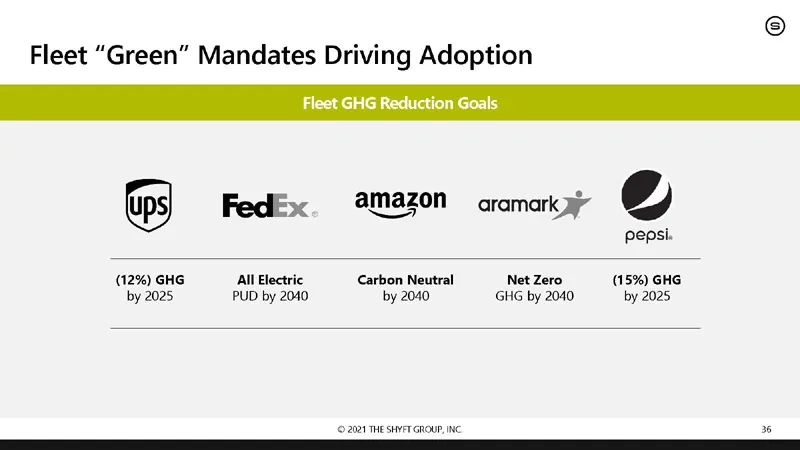
Slide 36: Fleet "Green" Mandates Driving Adoption
Fleet “Green” Mandates Driving Adoption Fleet GHG Reduction Goals FedEx. @Mazon = aramark yr pepsi. (12%) GHG All Electric Carbon Neutral Net Zero (15%) GHG by 2025 PUD by 2040 by 2040 GHG by 2040 by 2025 (© 2021 THE SHYET GROUP, INC 36
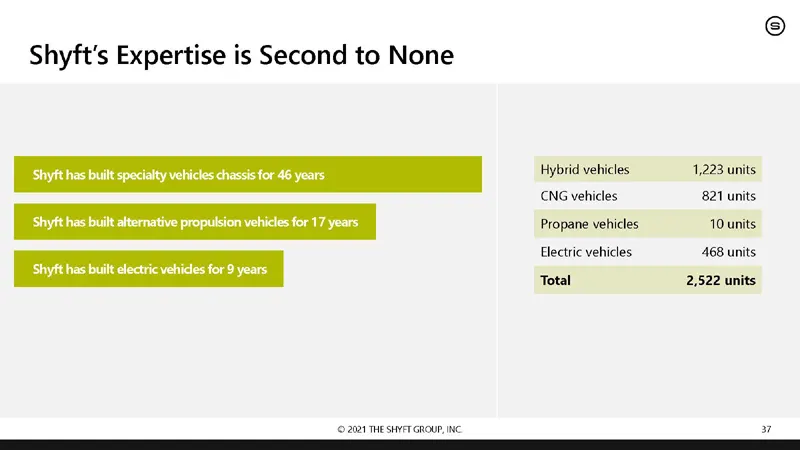
Slide 37: Shyft's Expertise is Second to None
Shyft's Expertise is Second to None Shyft has built specialty vehicles chassis for 46 years Hybrid vehicles 1,223 units CNG vehicles 821 units ‘Shyft has built alternative propulsion vehicles for 17 years Propane vehicles 10 units Electric vehicles 68 units Shyft has built electric vehides for 9 yea
Slide 38: Shyft Innovations
SHY F TinNNovaT ions New Technologies To Drive Future Growth

Slide 39: Video
Video SHYF Tero
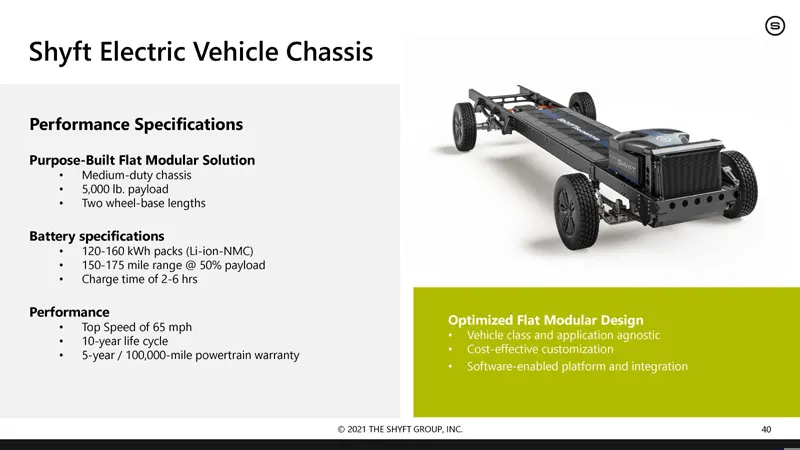
Slide 40: Shyft Electric Vehicle Chassis
Shyft Electric Vehicle Chassis Performance Specifications Purpose: Bullt Fiat Modular Solution + Medium-duty chs + 5,000 lb. Two wiesl vas lengths Battery specifications 120-160 kh packs (on-NMO) + 150-175 mile range @ 50% payload 8 Gagemnoe Be Performance *+ Top Speed of 65 mph + TOryear life cycle
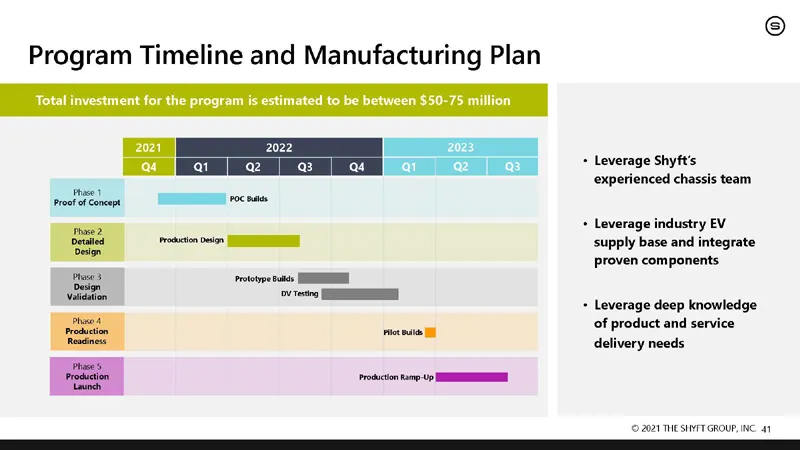
Slide 41: Program Timeline and Manufacturing Plan
Program Timeline and Manufacturing Plan Total investment for the program is estimated to be between $50-75 mi —————=————_- -teage Sy pea ja fa | a Hee Proof of Concept ‘NNT roc mate + Leverage industry EV = rote sig supply base and integrate proven components Phase 3 Prototype Guilds vildaten 2 es +
Slide 42: Chief Financial Officer
Chief Financial Officer
Slide 43: Historical Financial Performance
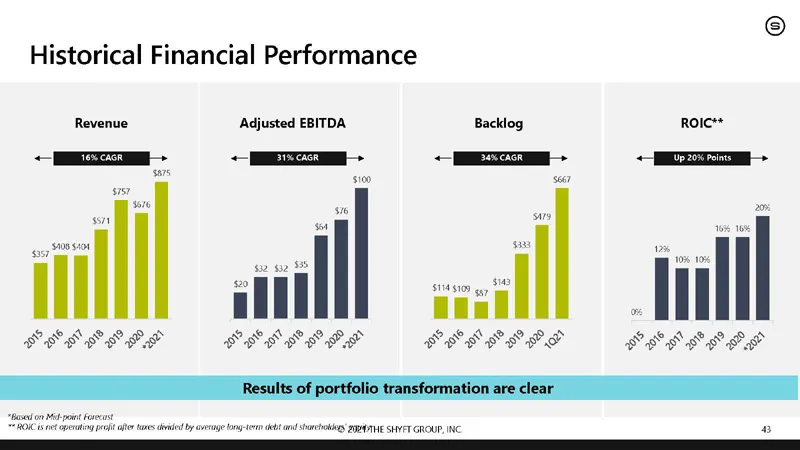
Historical Financial Performance Revenue Adjusted EBITDA Backlog ROIC** a -_—o- <= sr ey alll ei jill SLES PPK SSP PPK se " es SSCP
Slide 44: 2025 Roadmap
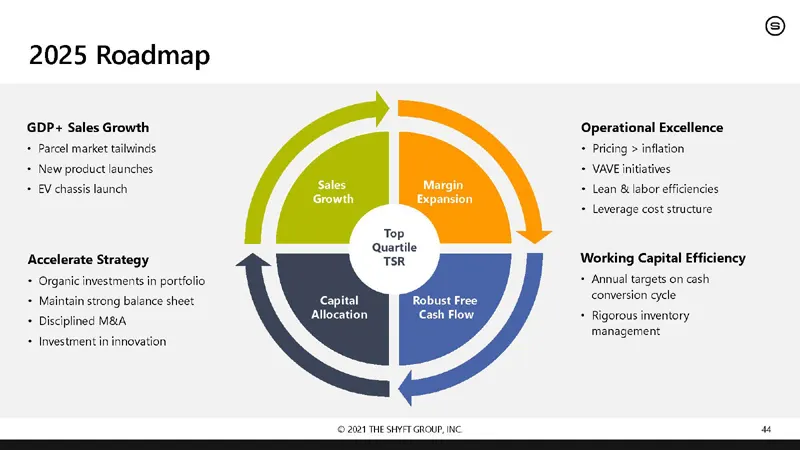
2025 Roadmap GDP+ Sales Growth + Parcel market tailwinds Operational Excellence + Pricing > inflation + VAVE initiatives + Lean & labor efficiencies + New product launches: + £V chassis launch + Leverage cost structure: Working Capital Efficiency + Annual targets on cash conversion cycle Accelerate
Slide 45: 2025 Revenue Roadmap
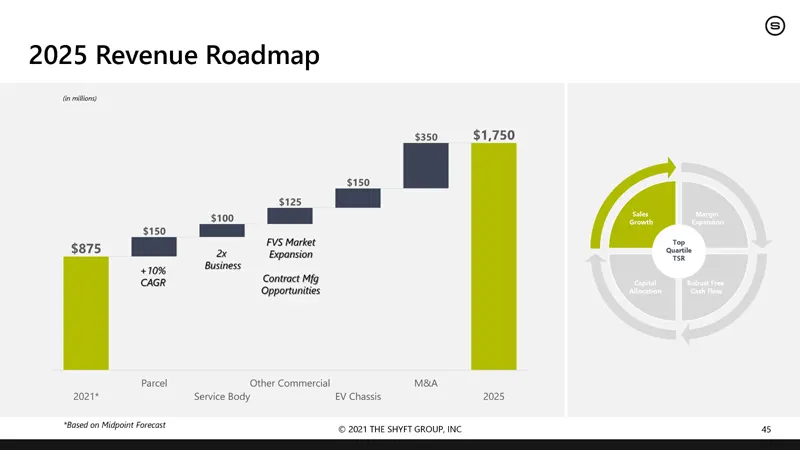
2025 Revenue Roadmap 3150 | VS Morket Sez ‘expansion Contract Mfg Opportunities 2021 Service Body EV chasis 350 $1,750
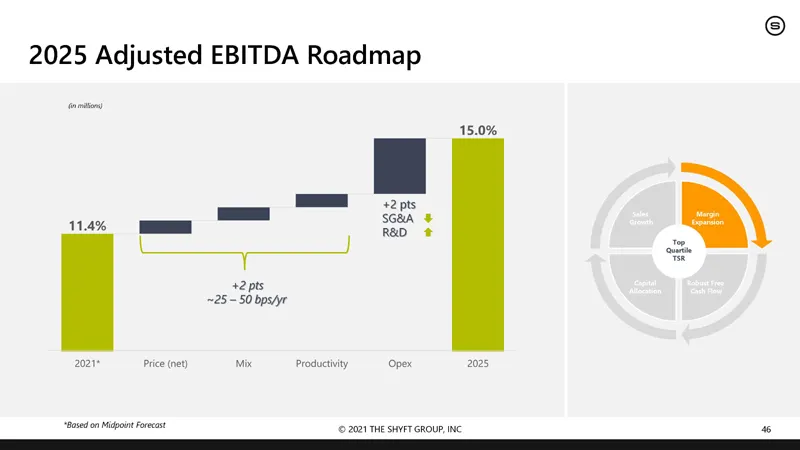
Slide 46: 2025 Adjusted EBITDA Roadmap
2025 Adjusted EBITDA Roadmap | | +2 pts 11.4% | eae oo R&D +2pts 25-50 bps/yr 02 Price (ne t Productivity Op 2025 © 2001 THE SHYFT GROUP, INC 4
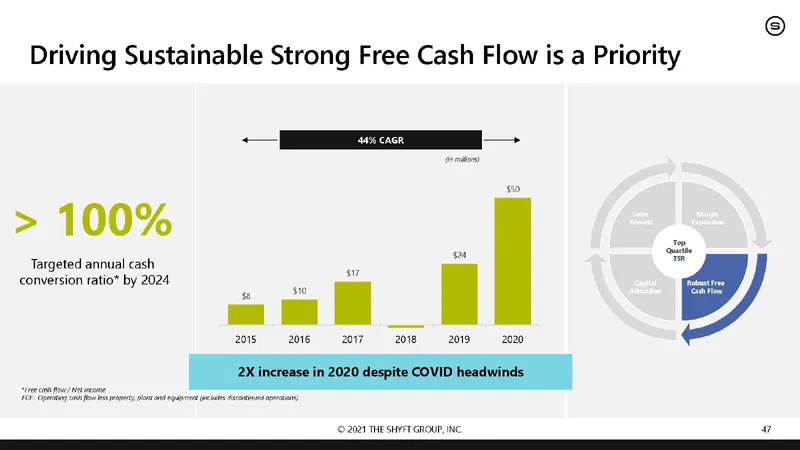
Slide 47: Driving Sustainable Strong Free Cash Flow is a Priority
Driving Sustainable Strong Free Cash Flow is a Priority > 100% (© 2021 THE SHYET GROUP, INC Targeted annual cash P = ™ conversion ratio* by 2024 e | | 208 2016 208 2019-2020
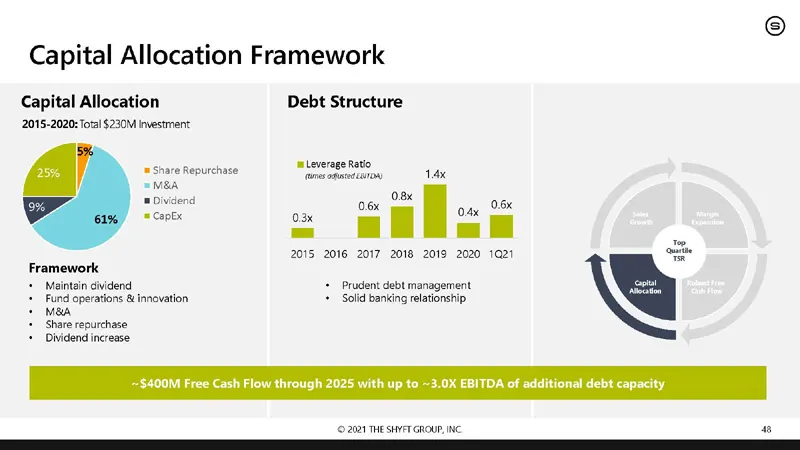
Slide 48: Capital Allocation Framework
Capital Allocation Framework Capital Allocation 2015-2020: Total $230M Investment are Repurchace = MBA 1 ioe Framework + Maintain dividend Fund operations & innovation en ‘Share repurchase Dividend increase Debt Structure se Leverage Ratio fomvoasnccoroy 1K 03x = 2015 2016 2017 2018 2019 2020 1021 4
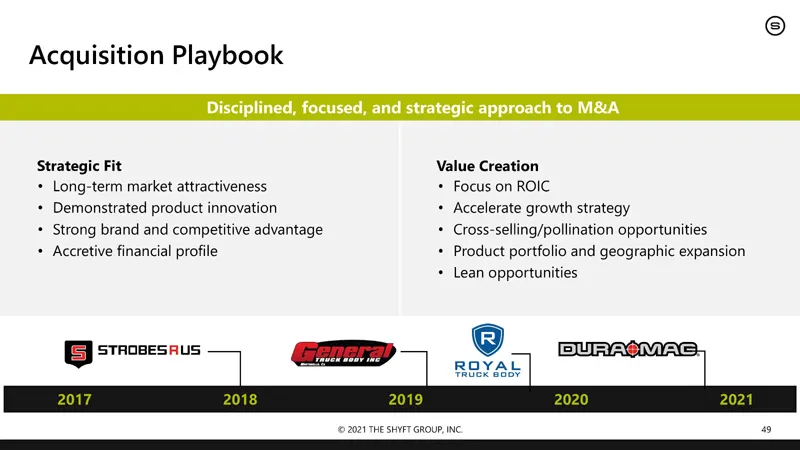
Slide 49: Acquisition Playbook
Acquisition Playbook Strategic Fit Value Creation + Long-term market attractiveness Focus on ROIC + Demonstrated product innovation Accelerate growth strategy + Strong brand and competitive advantage Cross-selling/pollination opportunities + Accretive financial profile Product portfolio and geograph
Slide 50: Why Invest in The Shyft Group
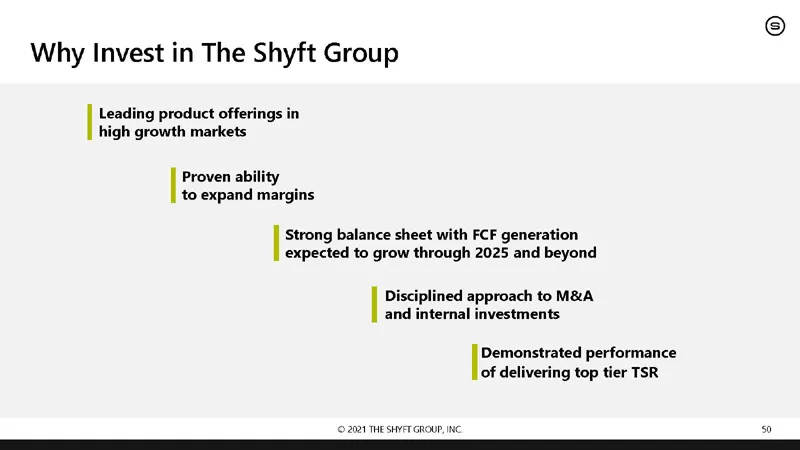
Why Invest in The Shyft Group Leading product offerings in high growth markets Proven ability to expand margins Strong balance sheet with FCF generation expected to grow through 2025 and beyond ined approach to M&A internal investments Demonstrated performance of delivering top tier TSR (© 2021 THE
Slide 51: President and Chief Executive Officer
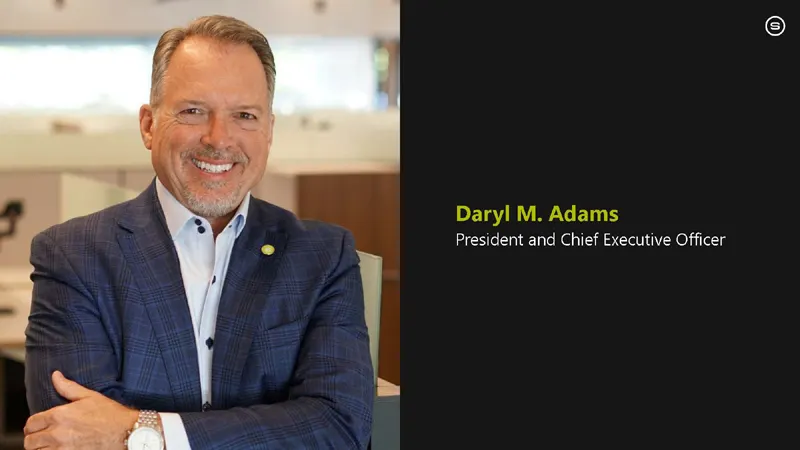
President and Chief Executive Officer
Slide 52: The Road Ahead.
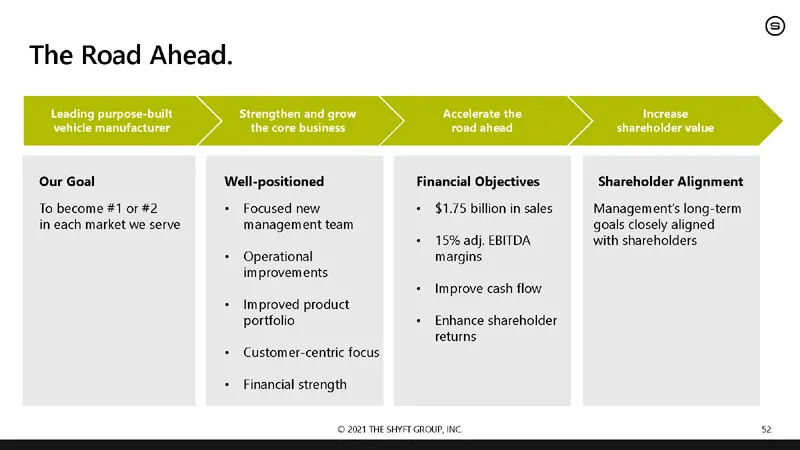
The Road Ahead. Leading purpose-built Strengthen and grow ‘Accelerate the Increase vehicle manufacturer the core business road ahead shareholder value Our Goal Well-positioned Financial Objectives Shareholder Alignment To become #1 or #2 + Focused new + $1.75 billion in sales Management's long-term
Slide 53: Q&A Session
Slide 54: Appendix
Slide 55: Reconciliation of Non-GAAP Financial Measures
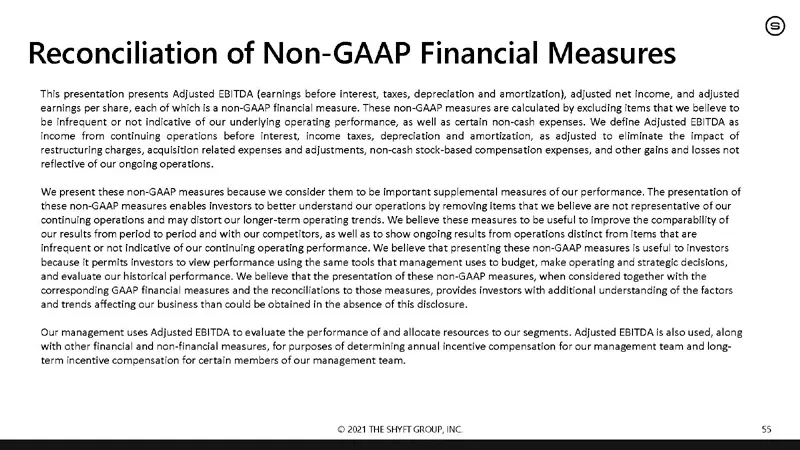
Reconciliation of Non-GAAP Financial Measures ‘This presentation presents Adjusted EBITDA (earnings before Interest, taxes, depreciation and amortization), adjusted net Income, and adjusted ‘earnings per share, each of which Is a non-GAAP financial measure. These non-GAAP measures are calculated by
Slide 56: Reconciliation of Non-GAAP Financial Measures
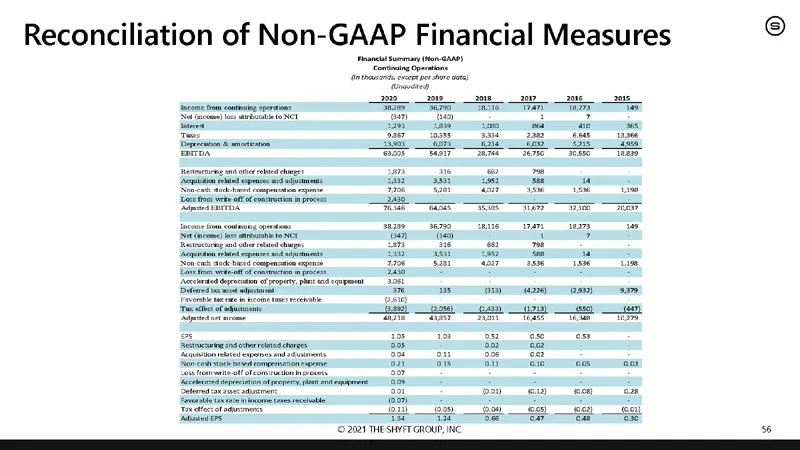
Reconciliation of Non-GAAP Financial Measures
Slide 57: Reconciliation of Non-GAAP Financial Measures
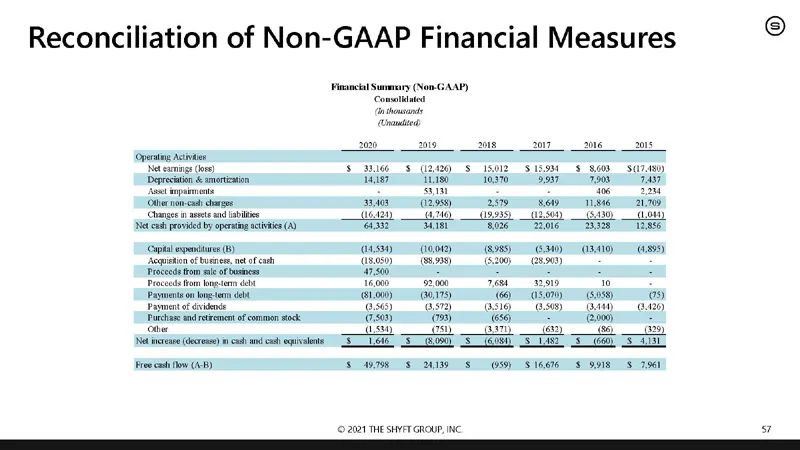
Reconciliation of Non-GAAP Financial Measures S$ B16 $29 S$ ISIS isso $ 009 su7A8) Mis) Law) 10379937780 TaBT ani 2959 2 TBH (Change nat an abe dey wn) 3939 250 1580 et cad roid by operating atts (A) G2 Mas 8s oe as (pal epenitrer (8) (ass) aoe) RH GM GRAD) ‘ewe of Boren, et of ea 8050) (S893) 5.200
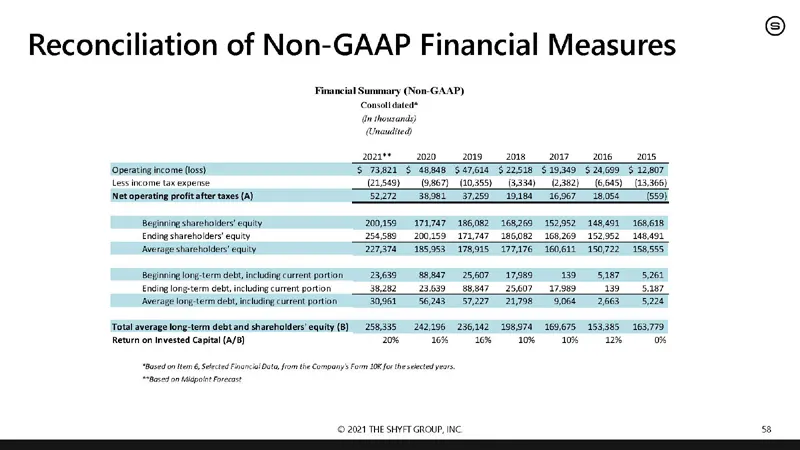
Slide 58: Reconciliation of Non-GAAP Financial Measures
Reconciliation of Non-GAAP Financial Measures Financial Summary (Now-GAAP) Gn thousands ‘operating income oss) % Tsai S Am Sarin G22518 S199 $24,609 § 12807 Lessincome tax expense 25)" (ose7) 40355) (3334) 382) (6515) (15.366) Netoperatngprofitafter taxes (A) 52772 36981 97250 19364 16967 28056 (559
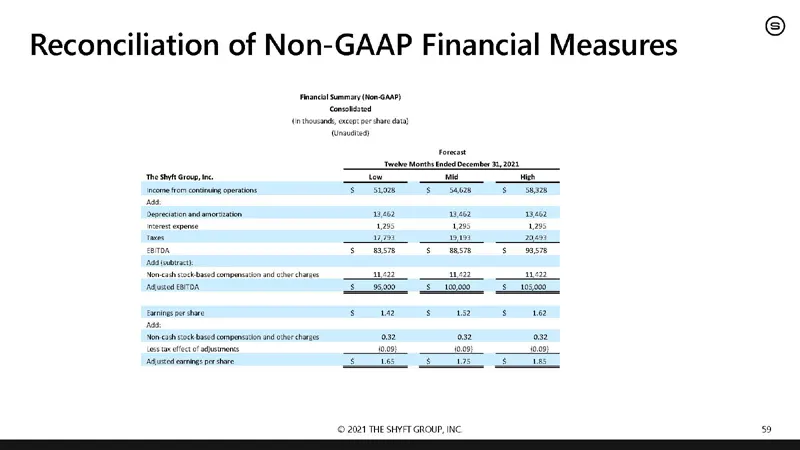
Slide 59: Reconciliation of Non-GAAP Financial Measures
Reconciliation of Non-GAAP Financial Measures (© 2021 THE SHYET GROUP, INC

Slide 60: Thank you.
Thank you. (© 2021 THE SHYET GROUP, INC
Source: SEC EDGAR · 8-K filed Jun 8, 2021
More decks from Shyft Group Inc
 Merger or Acquisition (April 2025)37 slides · Apr 29, 2025
 Q1 2025 Earnings Presentation18 slides · Apr 24, 2025
 Merger or Acquisition (April 2025)21 slides · Apr 4, 2025
 Q4 2024 Earnings Presentation17 slides · Feb 20, 2025
 Merger or Acquisition (January 2025)50 slides · Jan 13, 2025
 Merger or Acquisition (December 2024)22 slides · Dec 16, 2024