Tutor Perini Corporation · NYSE:TPC
Tutor Perini — Seaport Global Securities Infrastructure & Construction Conference 2016
17 slides from Tutor Perini's conference presentation, Mar 16, 2016

Slide 1: Seaport Global Securities Infrastructure & Construction Conference
Seaport Global Securities Infrastructure & Construction Conference March 16, 2016
Slide 2: Forward-Looking Statements
Forward-Looking Statements Statements contained in this presentation that are not purely historical are forward-looking statements within the meaning of the Private Securities Litigation Reform Act of 1995, including without limitation, statements regarding the Company’s expectations, hopes, beliefs
Slide 3: Company Overview
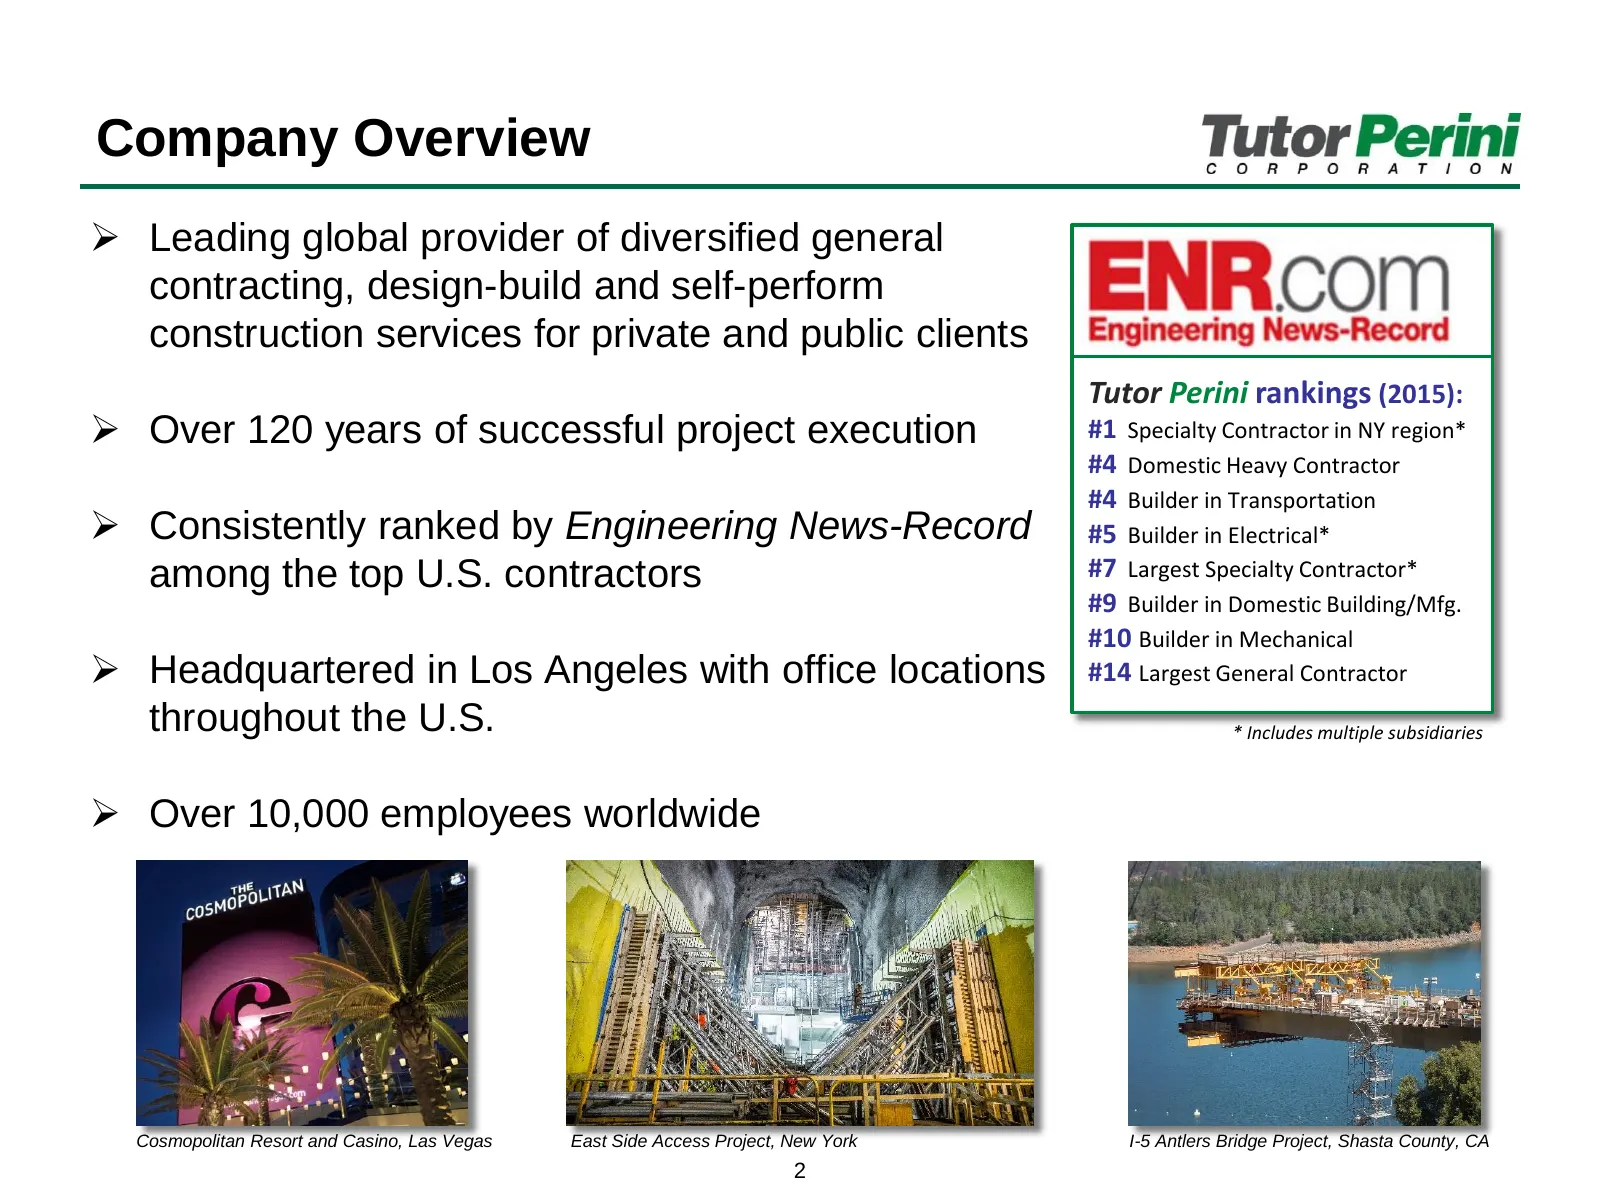
Company Overview Leading global provider of diversified general contracting, design-build and self-perform construction services for private and public clients Tutor Perini rankings (2015): Over 120 years of successful project execution #1 Specialty Contractor in NY region* #4 Domestic Heavy Con
Slide 4: Diverse Geographical Footprint
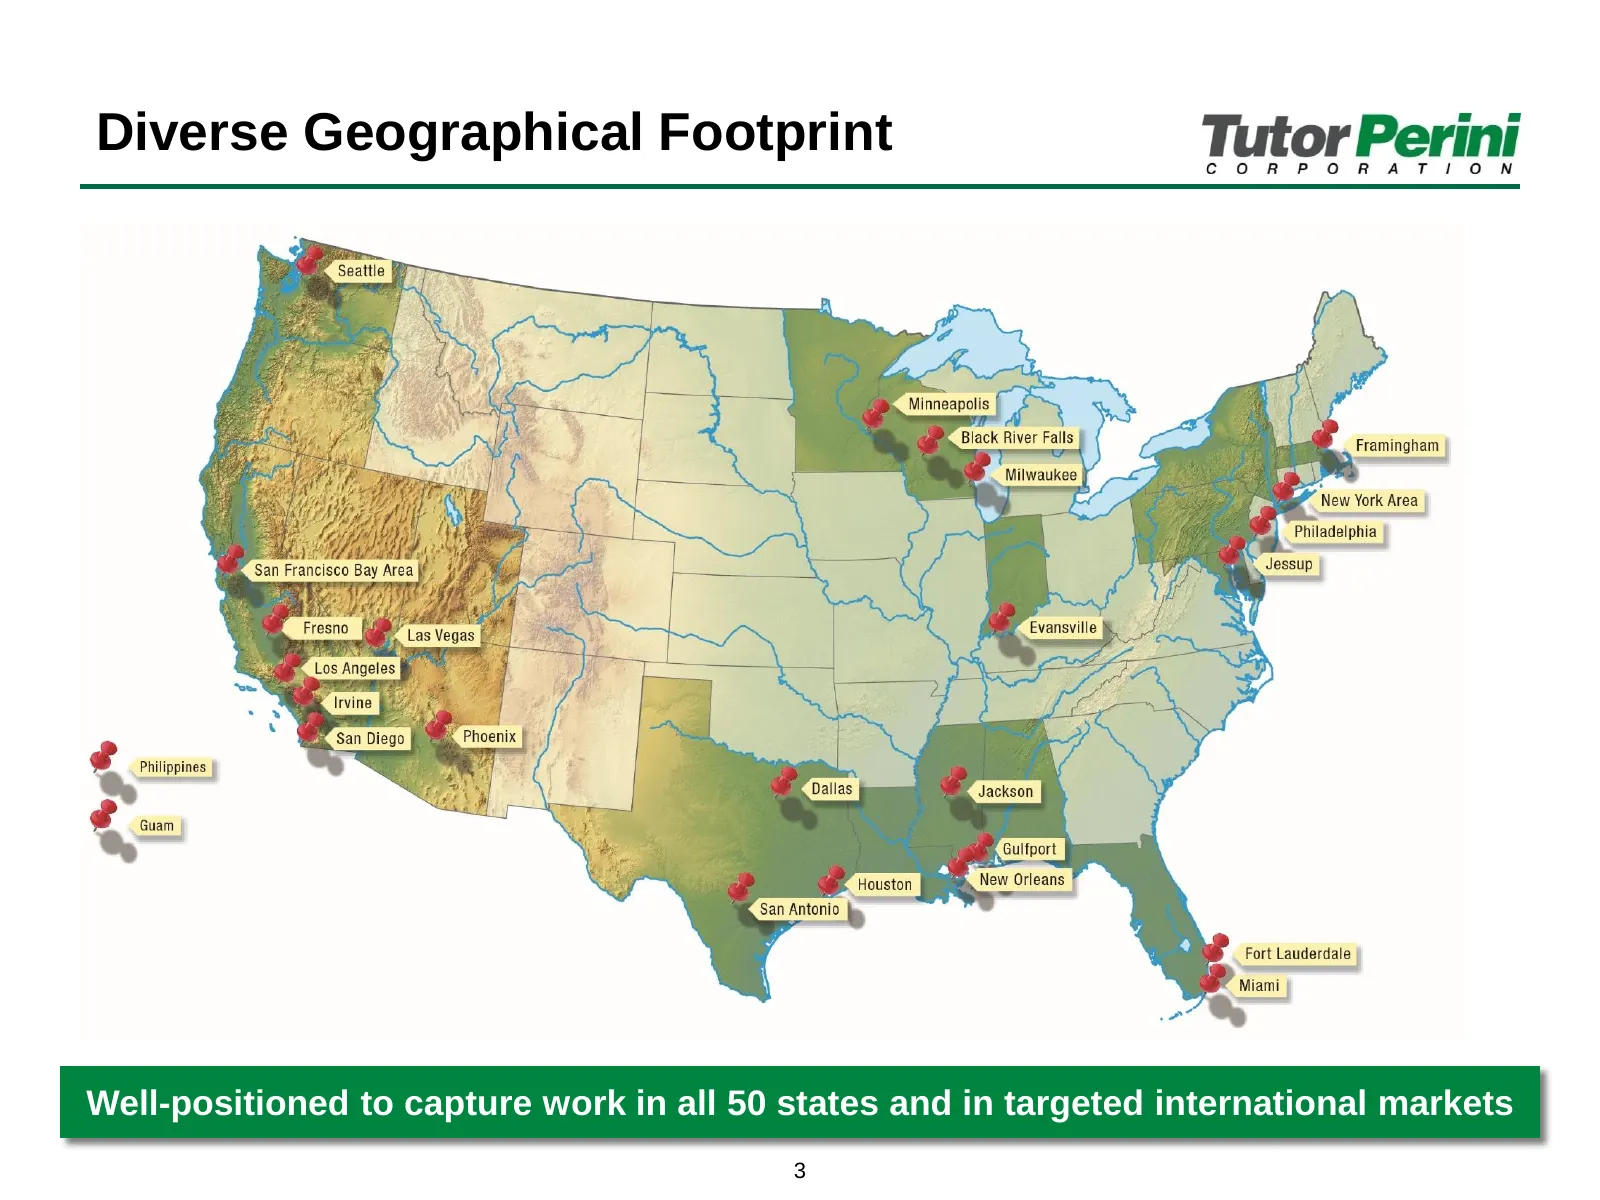
Diverse Geographical Footprint Well-positioned to capture work in all 50 states and in targeted international markets 3
Slide 5: Significant Projects Driving 2016 & Beyond
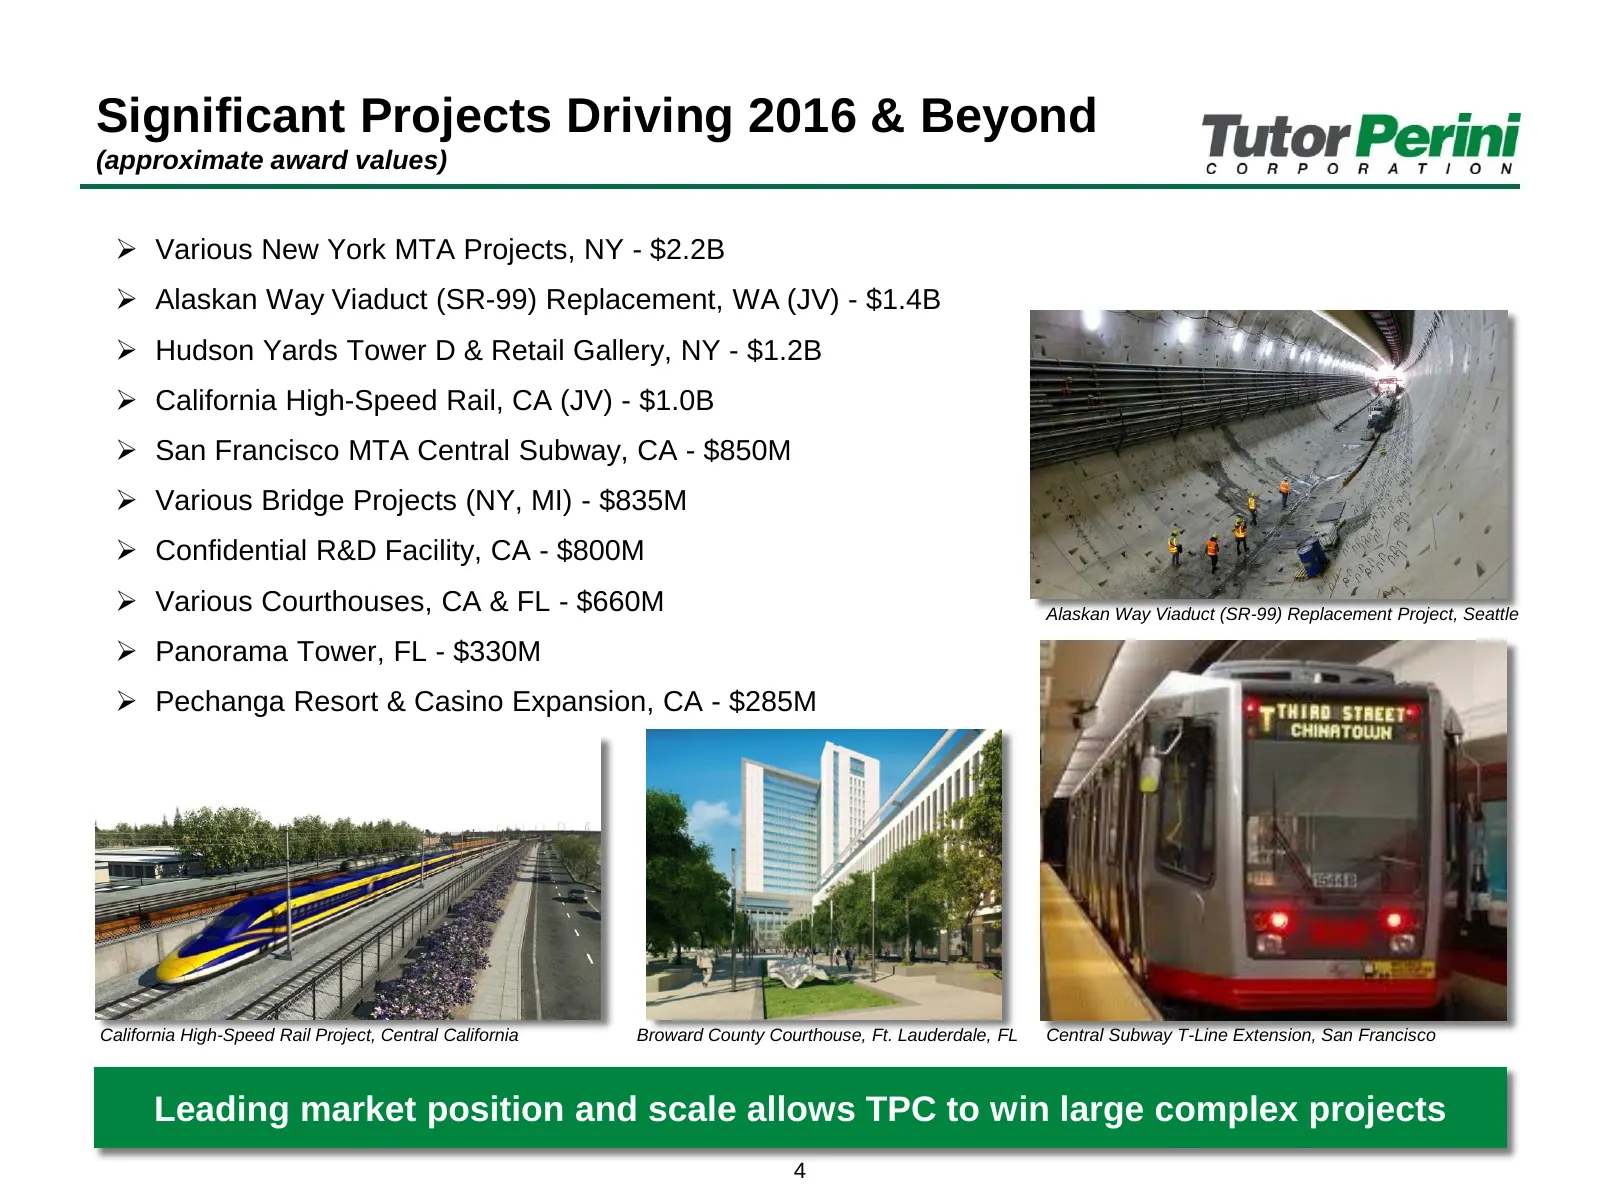
Significant Projects Driving 2016 & Beyond (approximate award values) Various New York MTA Projects, NY - $2.2B Alaskan Way Viaduct (SR-99) Replacement, WA (JV) - $1.4B Hudson Yards Tower D & Retail Gallery, NY - $1.2B California High-Speed Rail, CA (JV) - $1.0B San Francisco MTA Central S
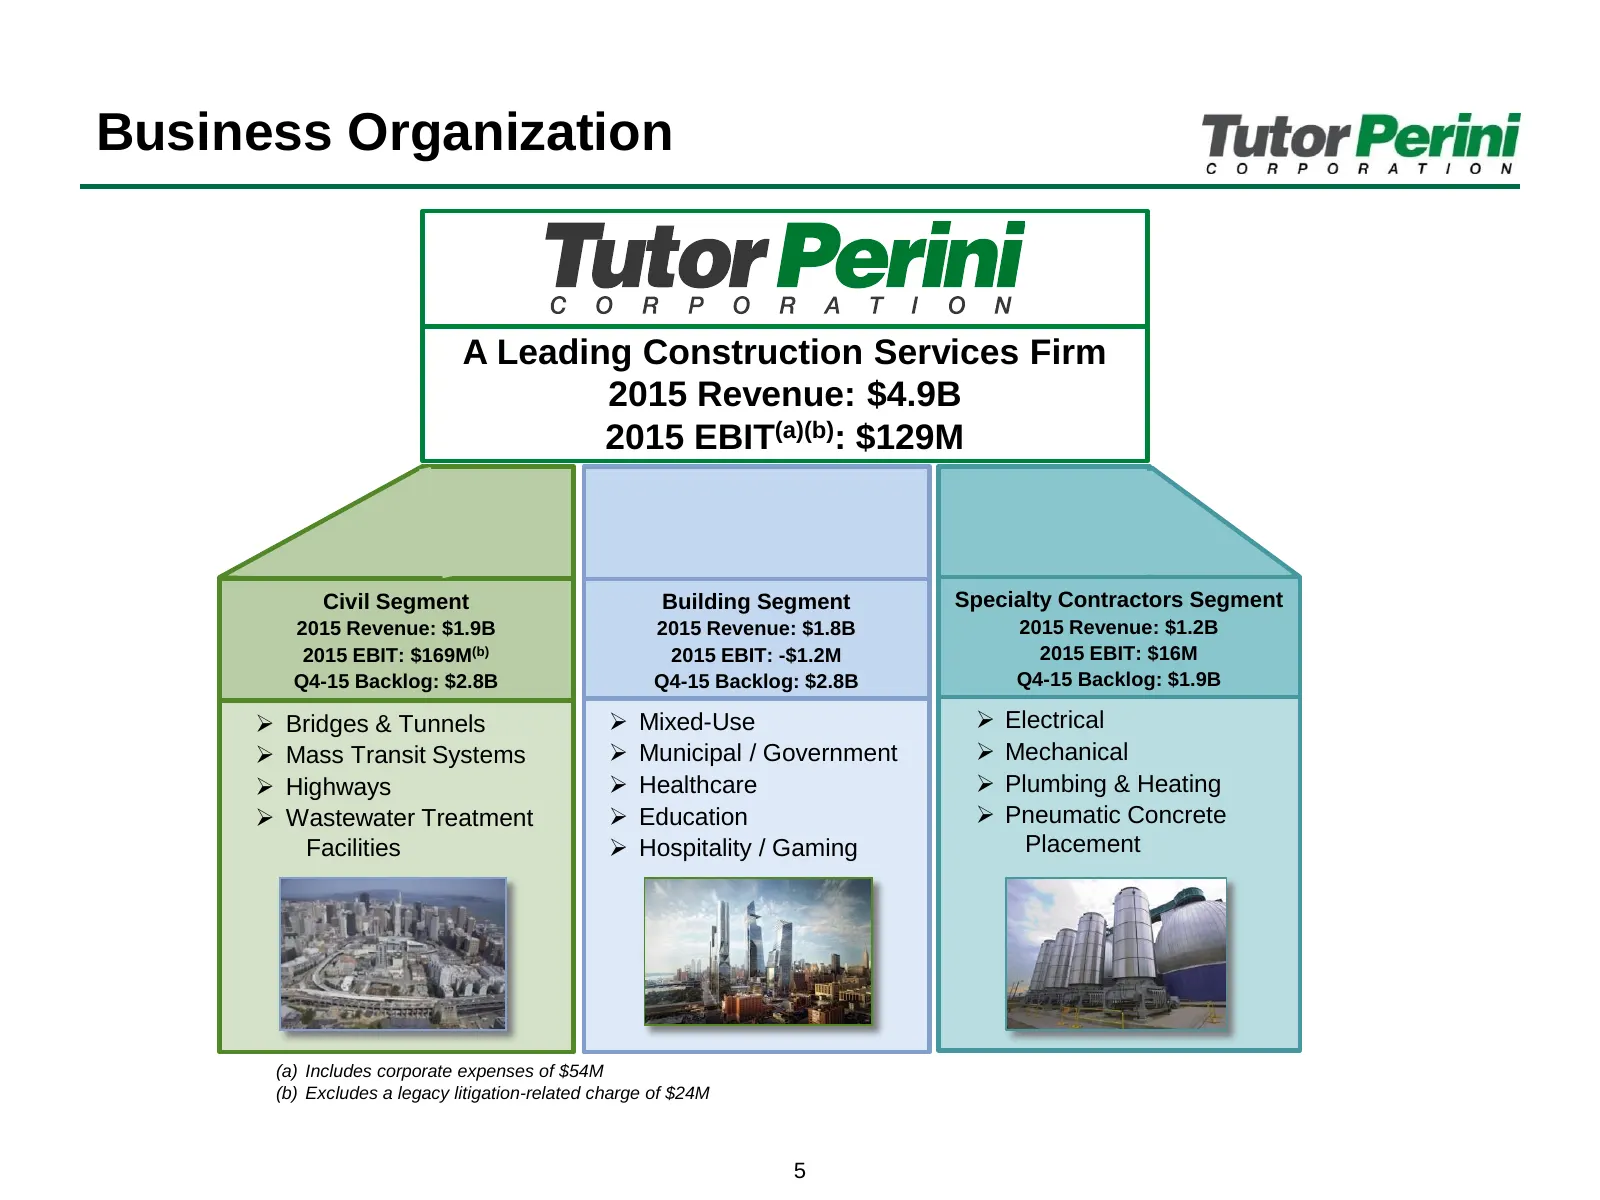
Slide 6: Business Organization
Business Organization A Leading Construction Services Firm 2015 Revenue: $4.9B 2015 EBIT(a)(b): $129M Civil Segment Building Segment Specialty Contractors Segment 2015 Revenue: $1.9B 2015 Revenue: $1.8B 2015 Revenue: $1.2B 2015 EBIT: $169M(b) 2015 EBIT: -$1.2M 2015 EBIT: $16M Q4-15 Backlog: $2.8B Q4
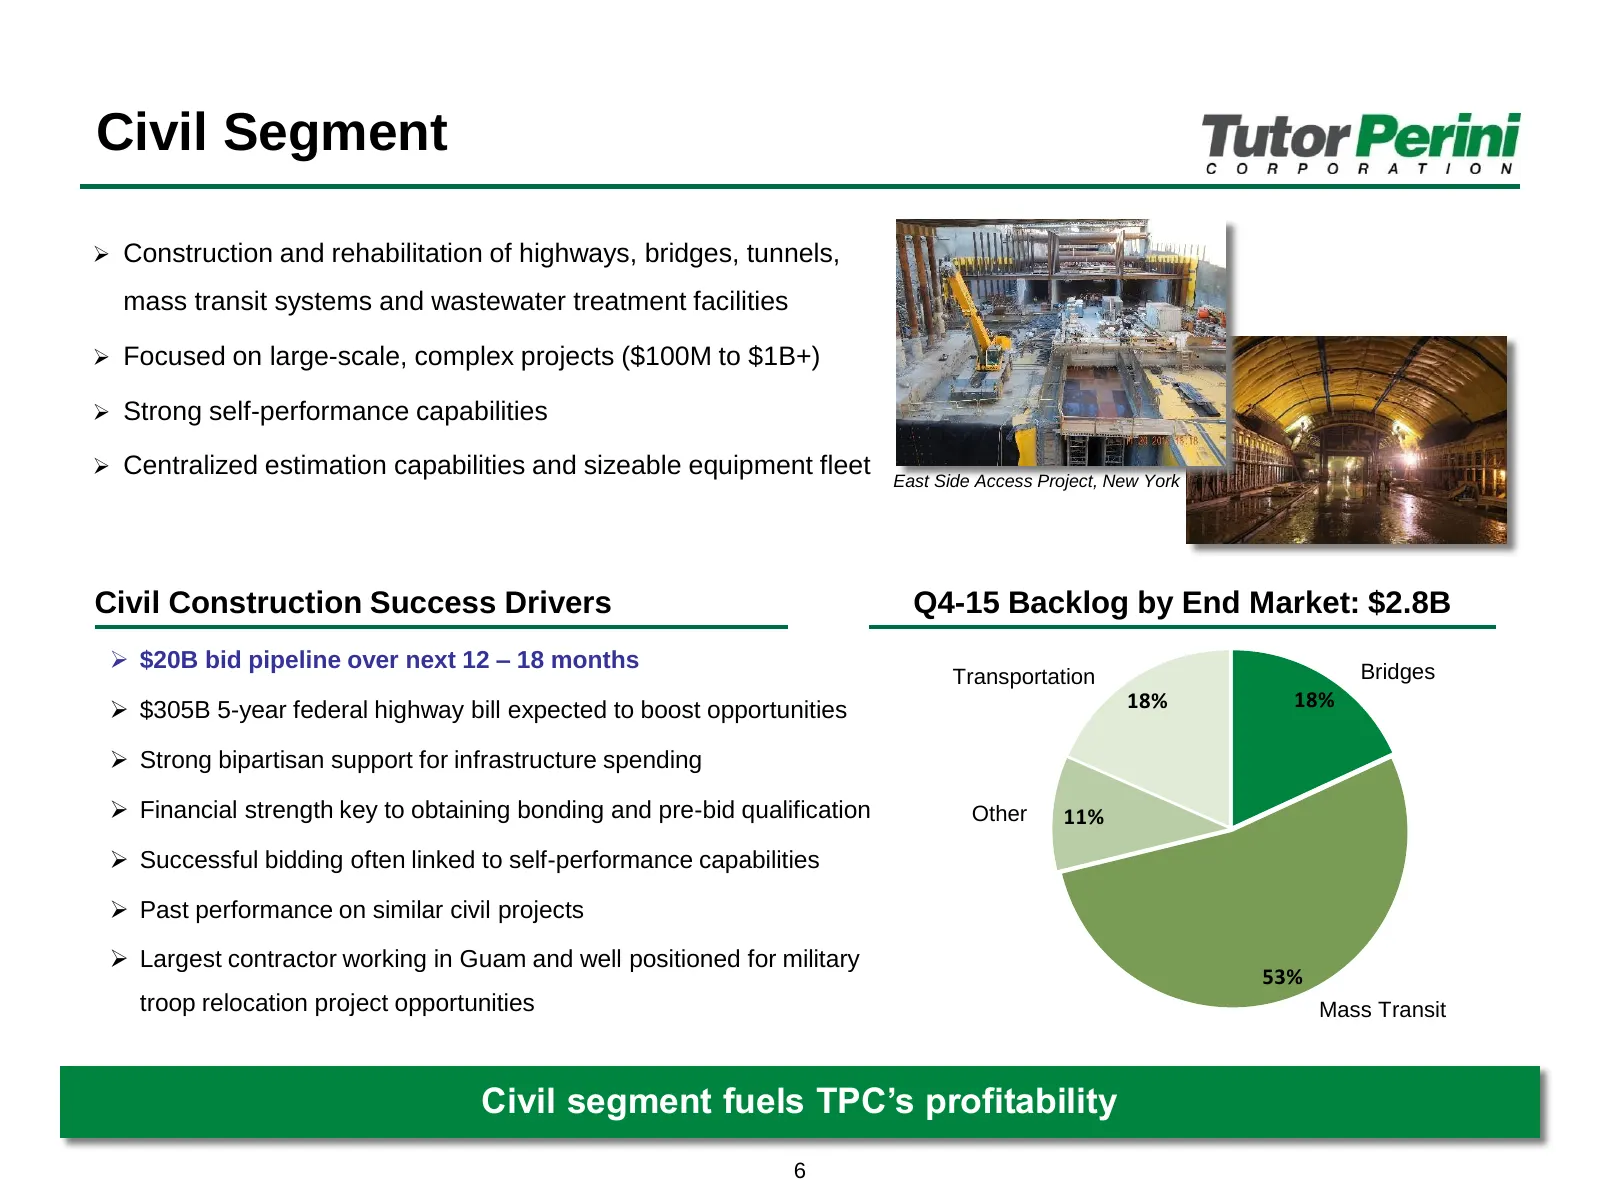
Slide 7: Civil Segment
Civil Segment Construction and rehabilitation of highways, bridges, tunnels, mass transit systems and wastewater treatment facilities Focused on large-scale, complex projects ($100M to $1B+) Strong self-performance capabilities Centralized estimation capabilities and sizeable equipment fleet
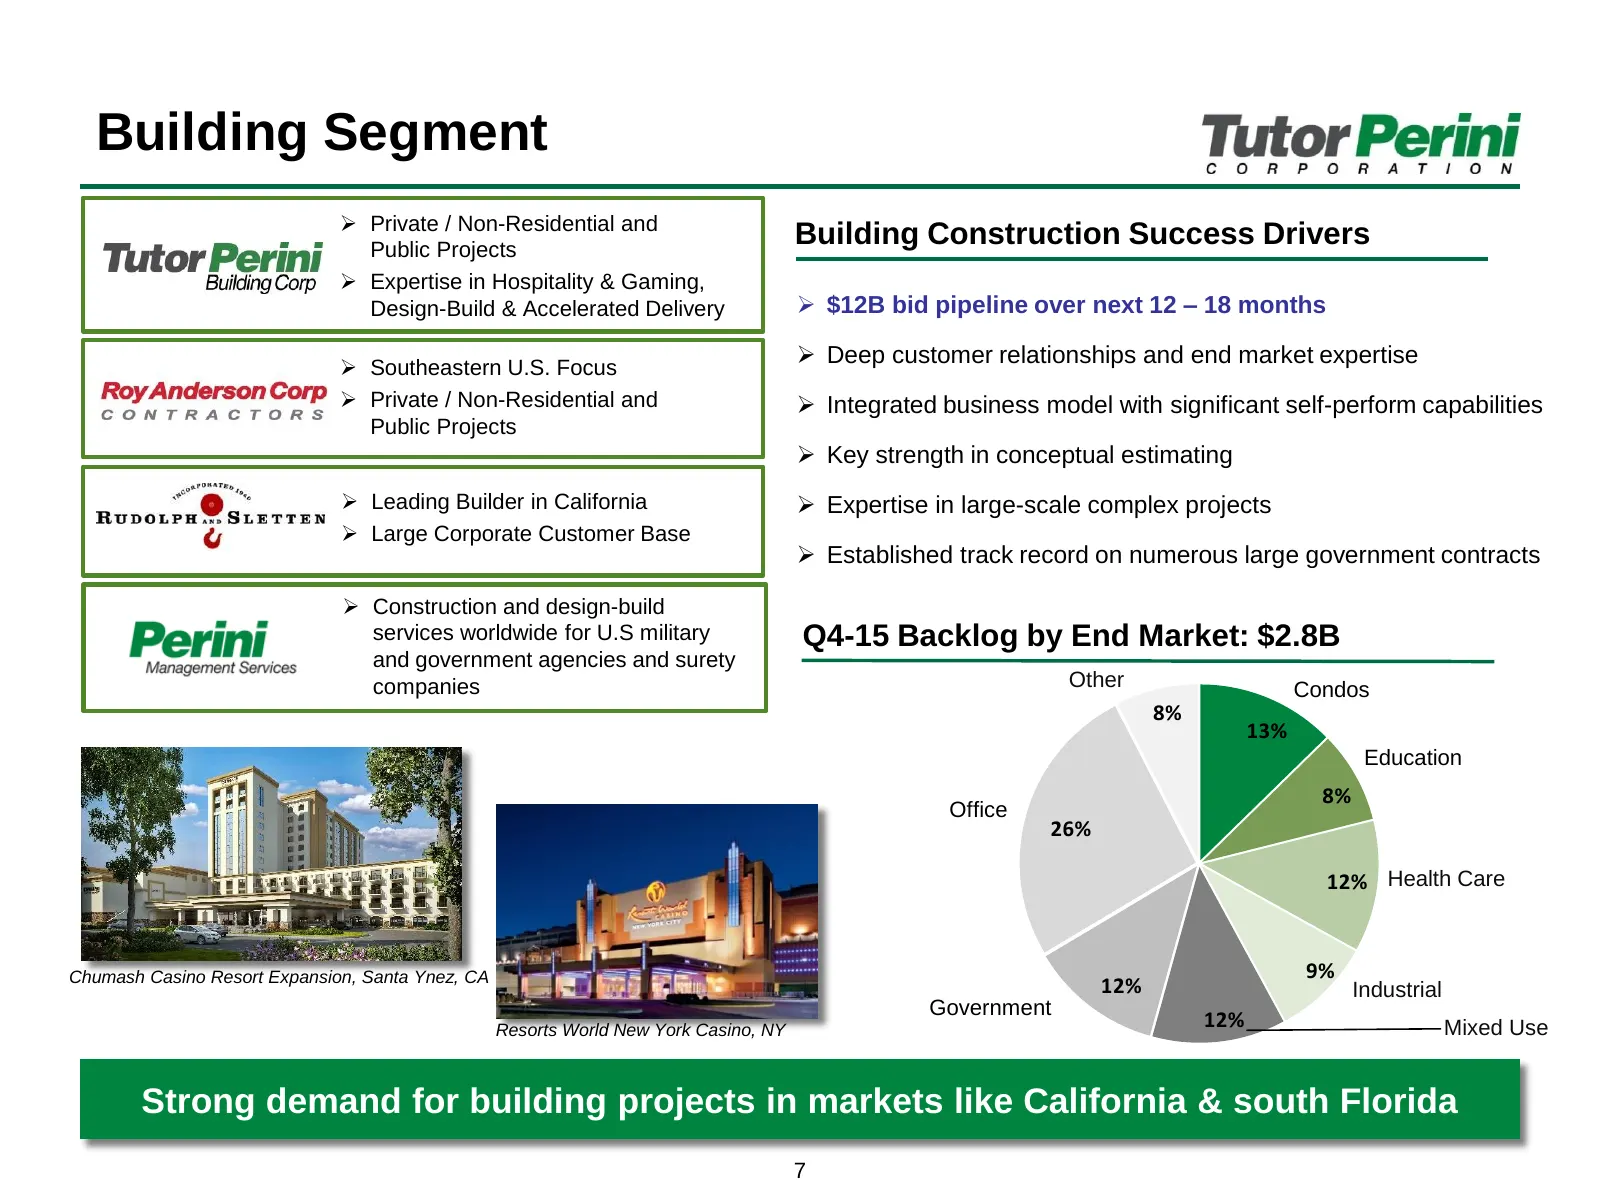
Slide 8: Building Segment
Building Segment Private / Non-Residential and Public Projects Building Construction Success Drivers Expertise in Hospitality & Gaming, Design-Build & Accelerated Delivery $12B bid pipeline over next 12 – 18 months Southeastern U.S. Focus Deep customer relationships and end market expertis
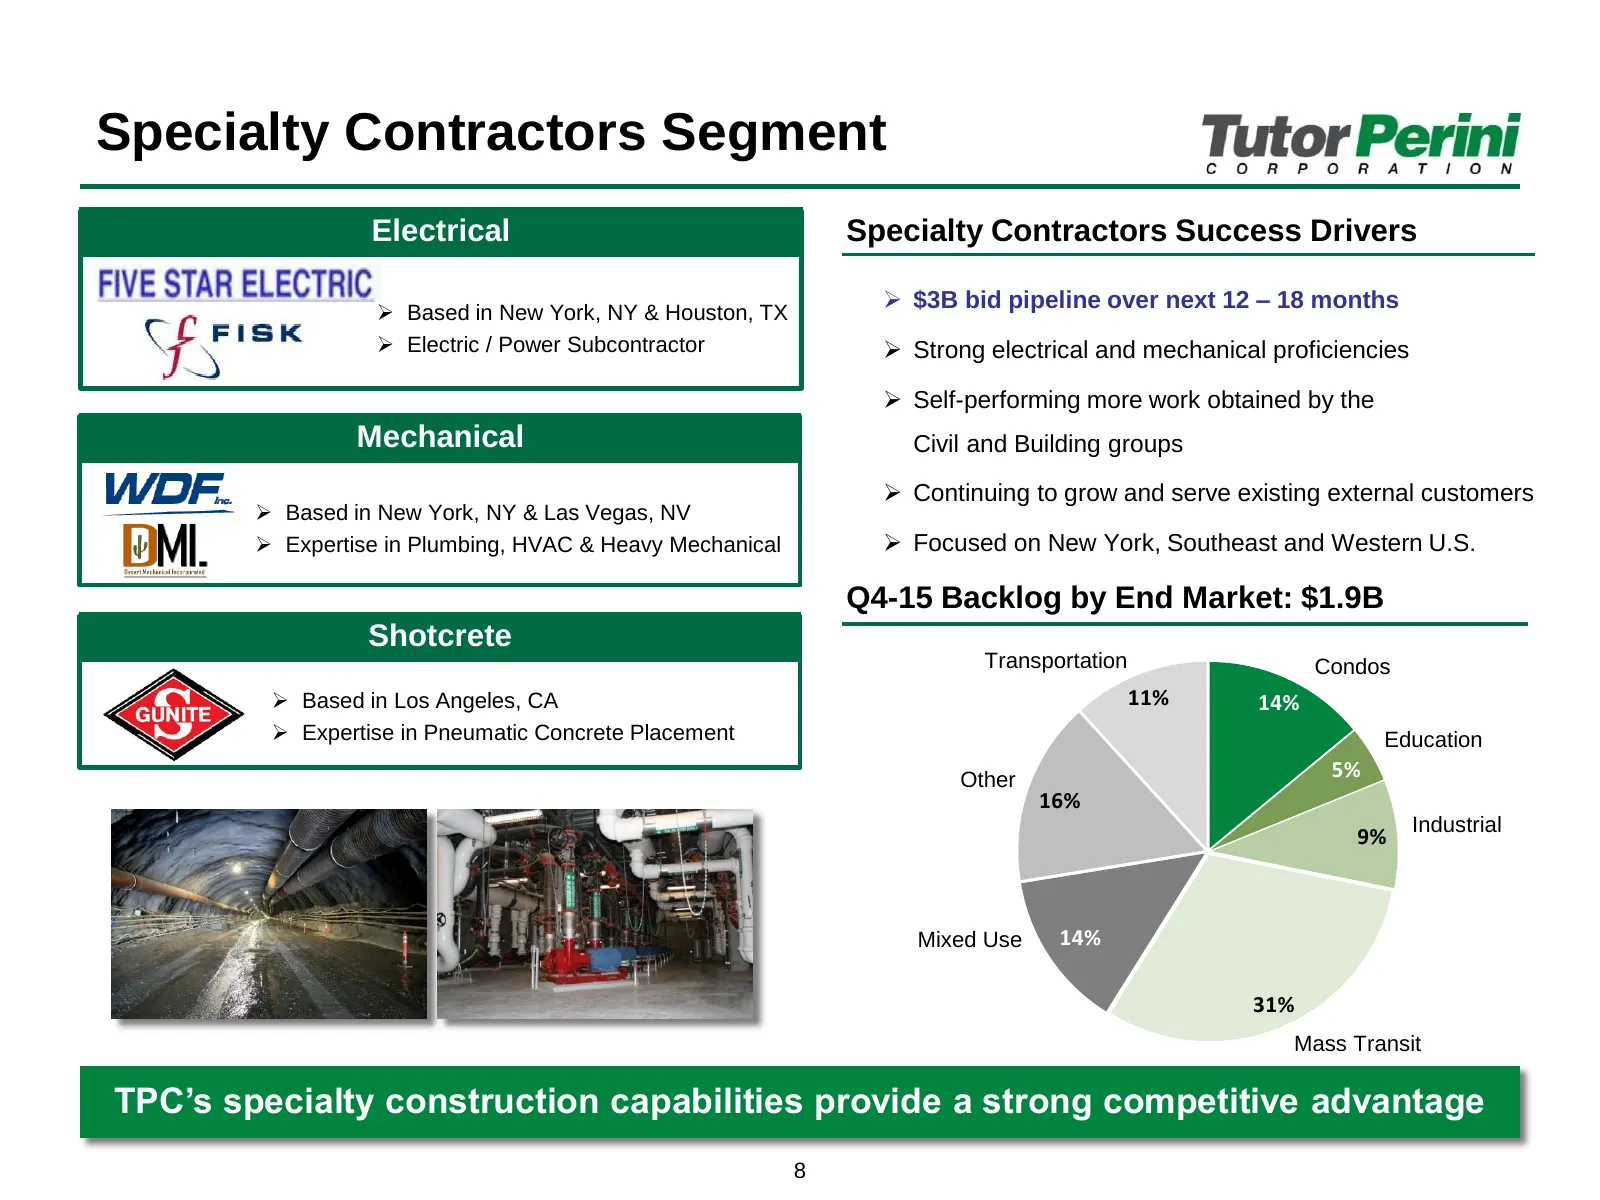
Slide 9: Specialty Contractors Segment
Specialty Contractors Segment Electrical Specialty Contractors Success Drivers Based in New York, NY & Houston, TX $3B bid pipeline over next 12 – 18 months Electric / Power Subcontractor Strong electrical and mechanical proficiencies Self-performing more work obtained by the Mechanical Ci
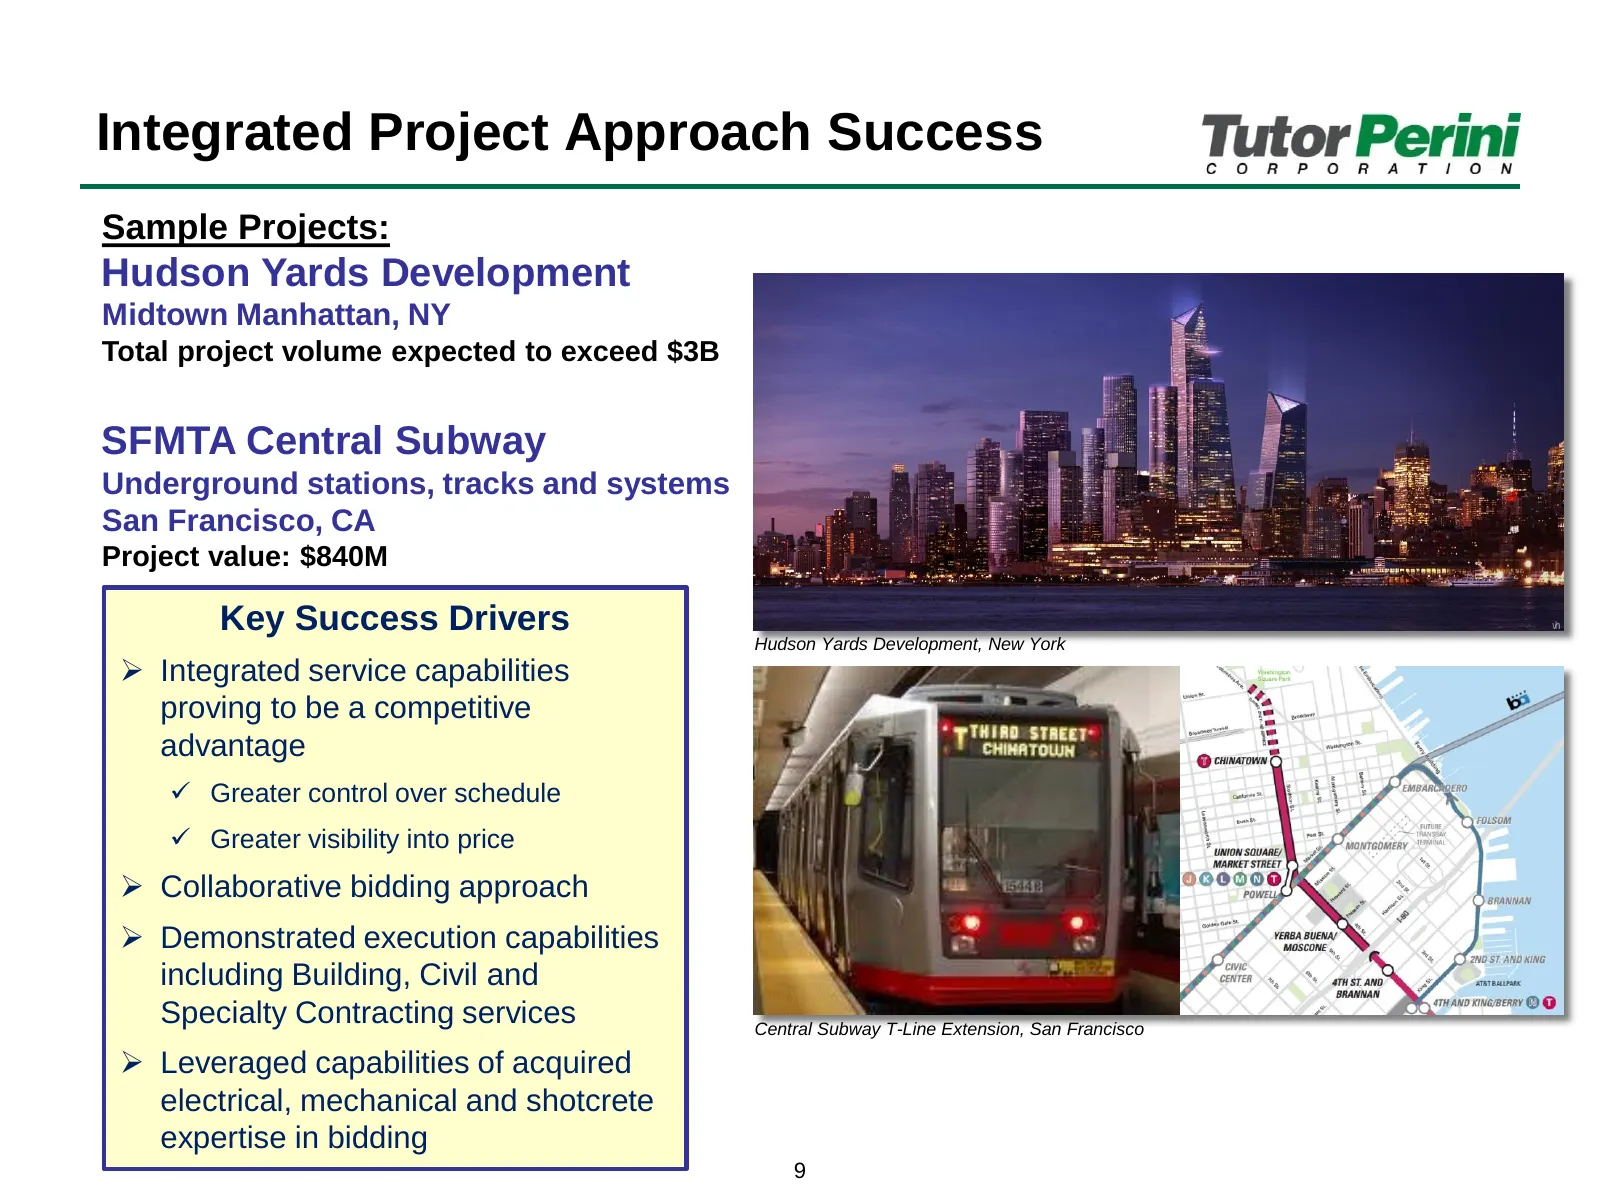
Slide 10: Integrated Project Approach Success
Integrated Project Approach Success Sample Projects: Hudson Yards Development Midtown Manhattan, NY Total project volume expected to exceed $3B SFMTA Central Subway Underground stations, tracks and systems San Francisco, CA Project value: $840M Key Success Drivers Hudson Yards Development, New York
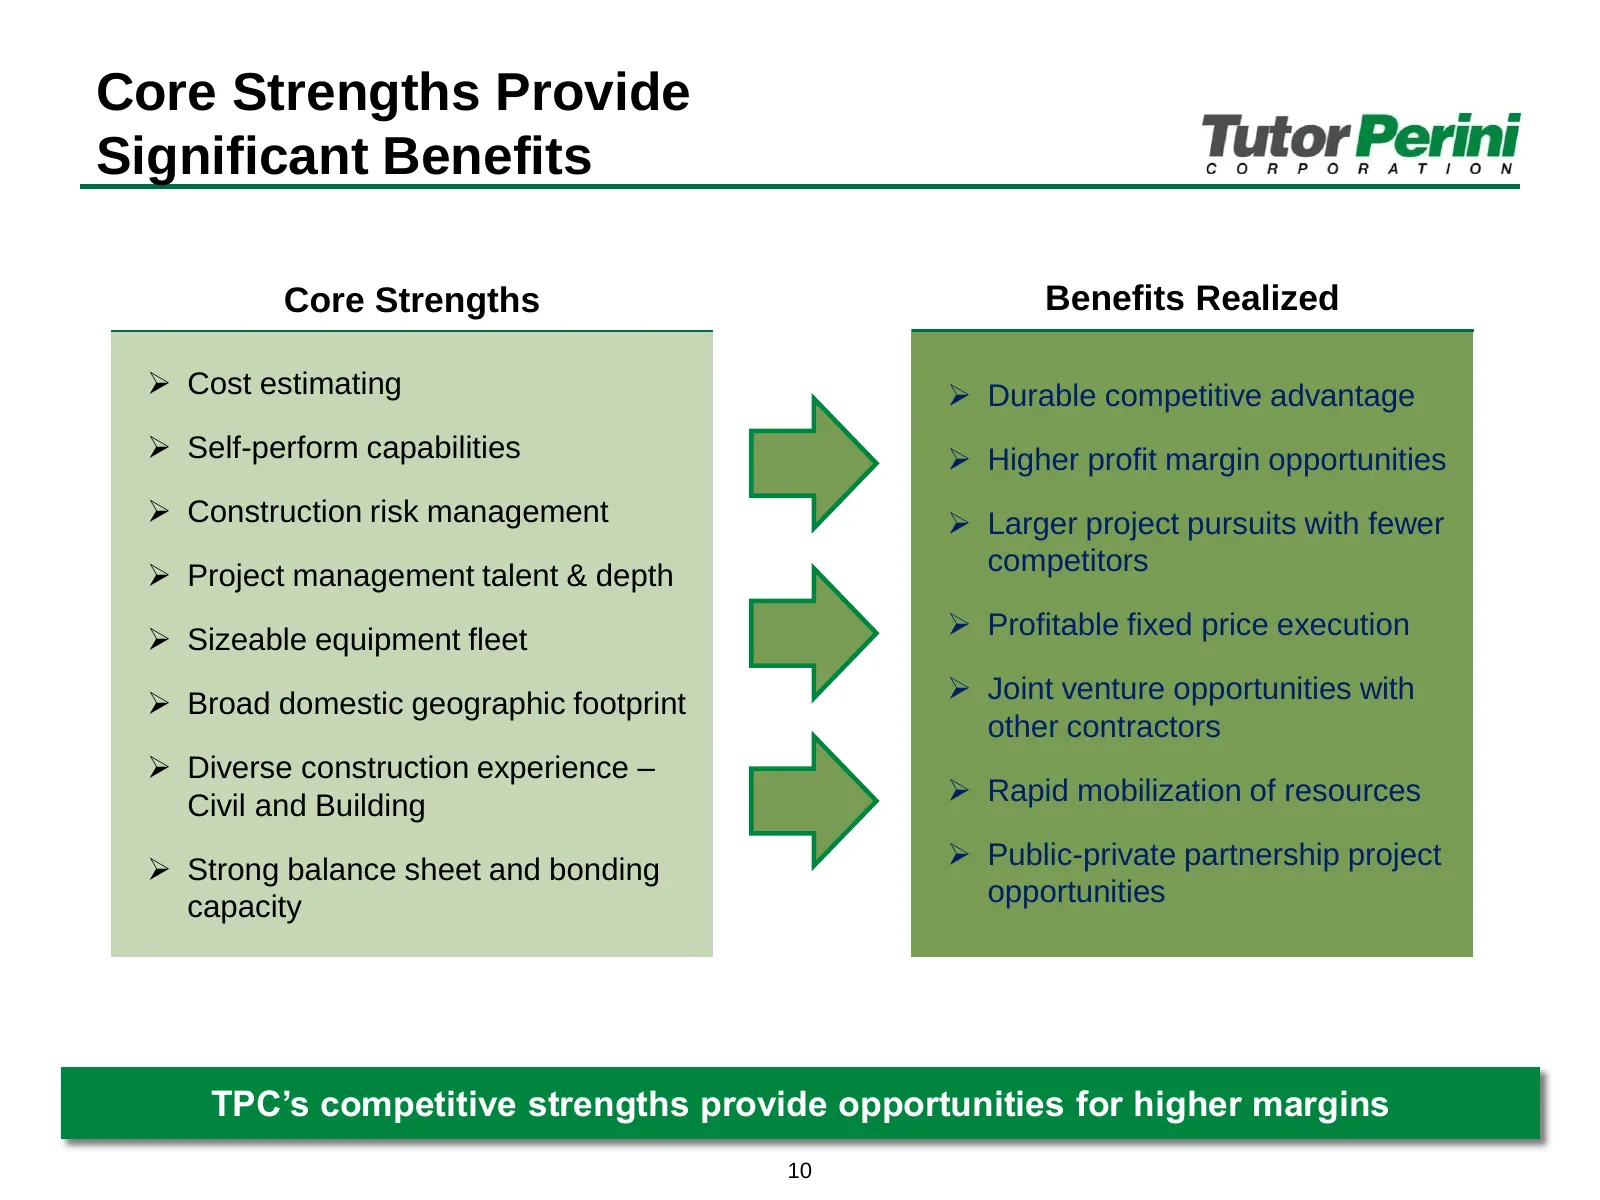
Slide 11: Core Strengths Provide Significant Benefits
Core Strengths Provide Significant Benefits Core Strengths Benefits Realized Cost estimating Durable competitive advantage Self-perform capabilities Higher profit margin opportunities Construction risk management Larger project pursuits with fewer Project management talent & depth comp
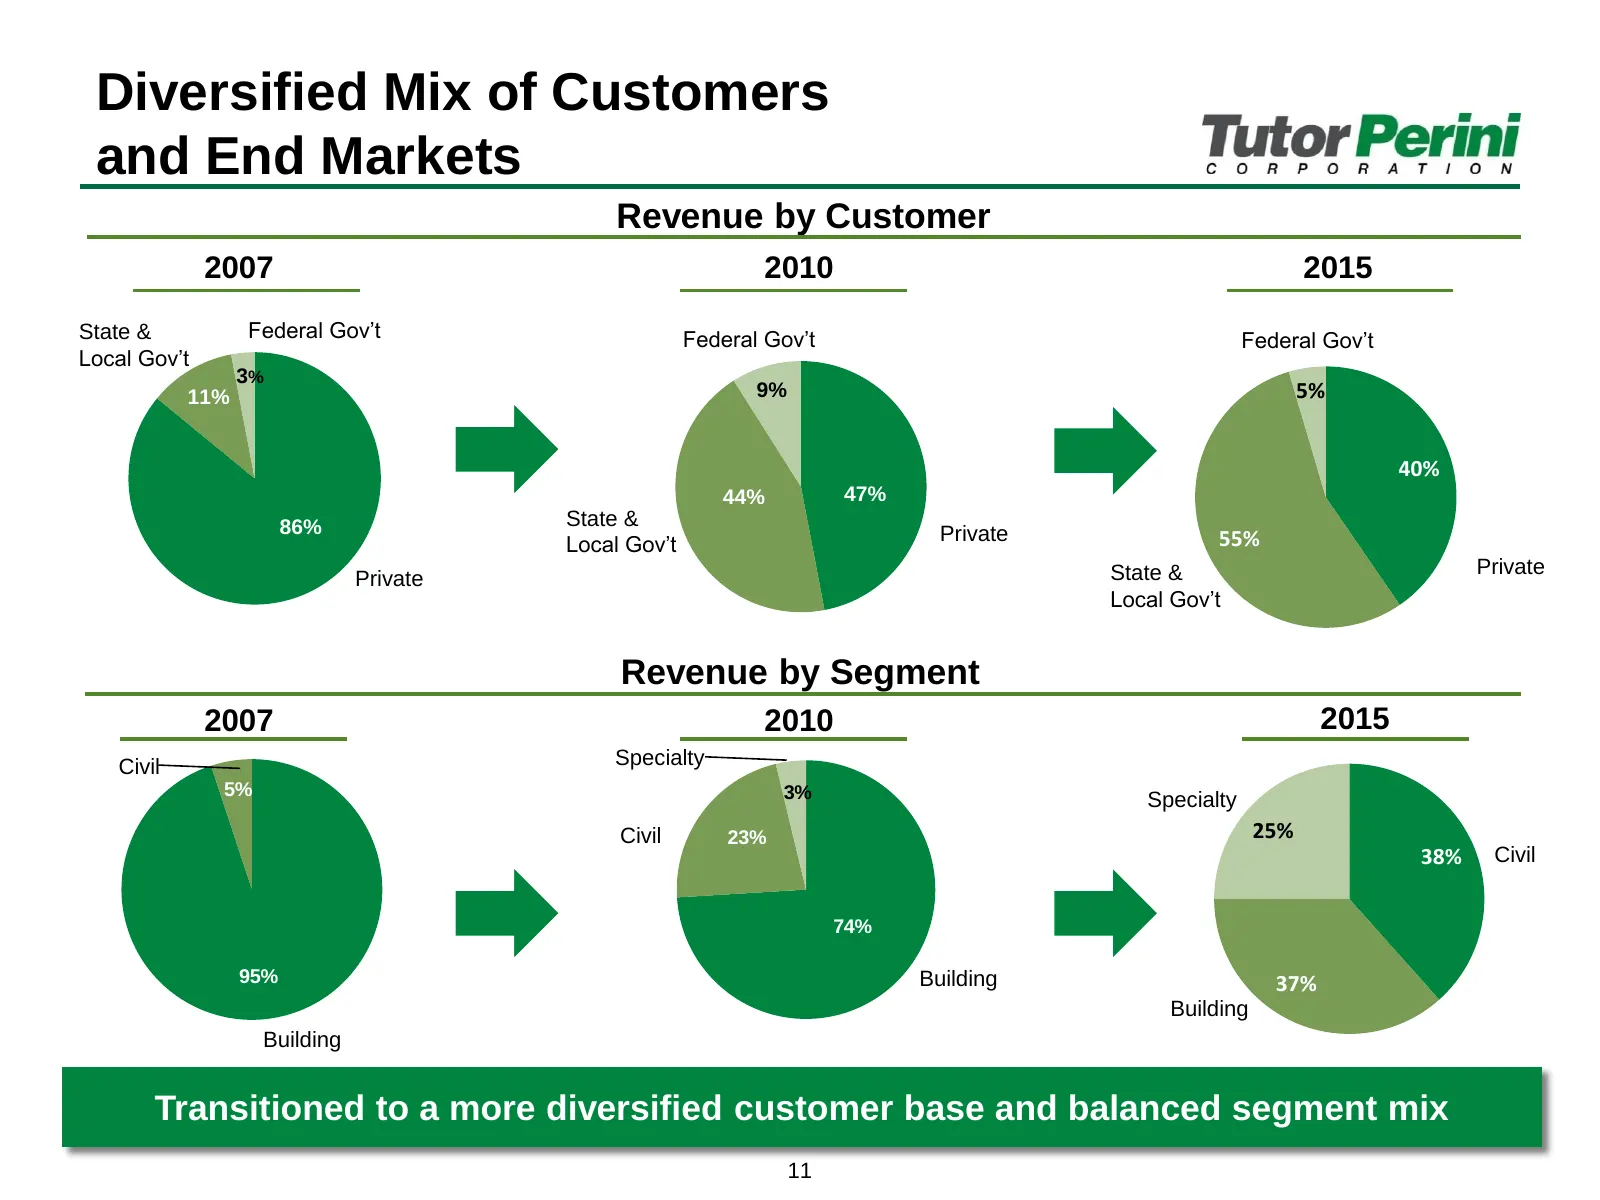
Slide 12: Diversified Mix of Customers and End Markets
Diversified Mix of Customers and End Markets Revenue by Customer 2007 2010 2015 State & Federal Gov’t Federal Gov’t Federal Gov’t Local Gov’t 3% 11% 9% 5% 40% 44% 47% 86% State & Private 55% Local Gov’t State & Private Private Local Gov’t Revenue by Segment 2007 2010 2015 Civil Specialty 5% 3% Speci
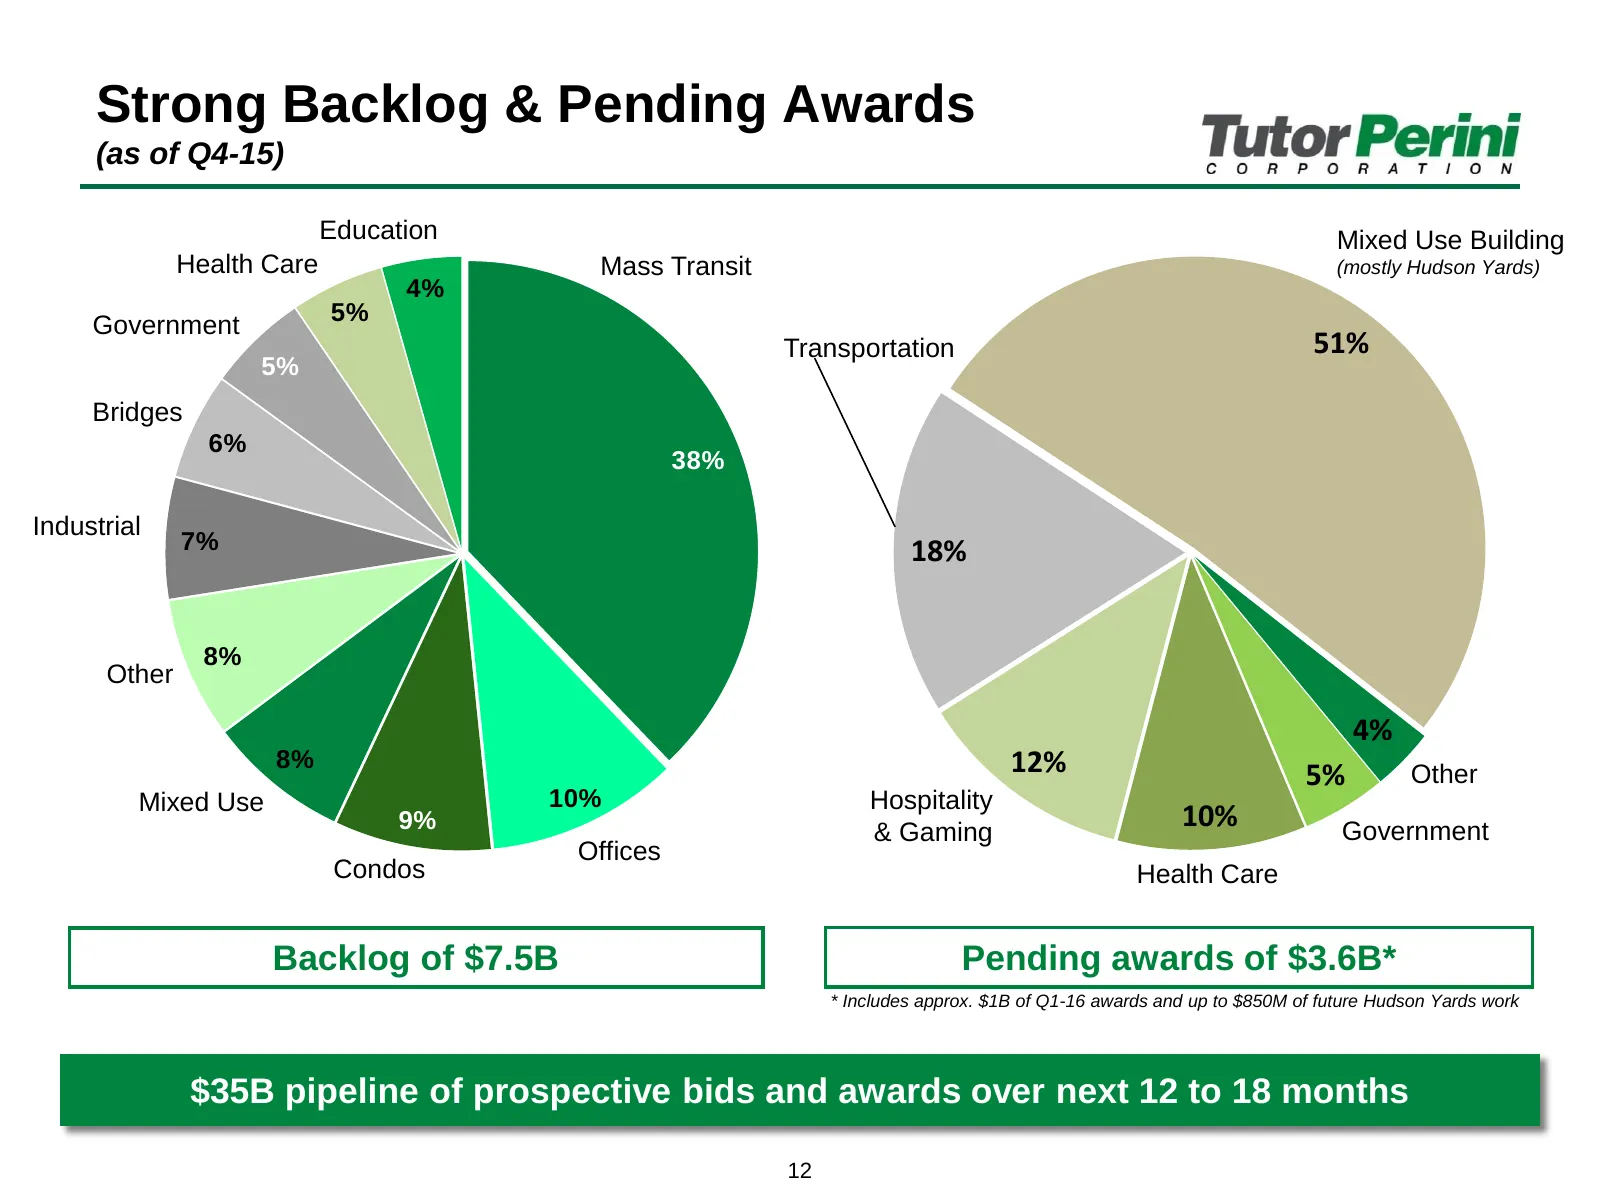
Slide 13: Strong Backlog & Pending Awards
Strong Backlog & Pending Awards (as of Q4-15) Education Mixed Use Building Health Care Mass Transit (mostly Hudson Yards) 4% 5% Government Transportation 51% 5% Bridges 6% 38% Industrial 7% 18% 8% Other 4% 8% 12% 5% Other Mixed Use 10% Hospitality 9% & Gaming 10% Government Offices Condos Health Car
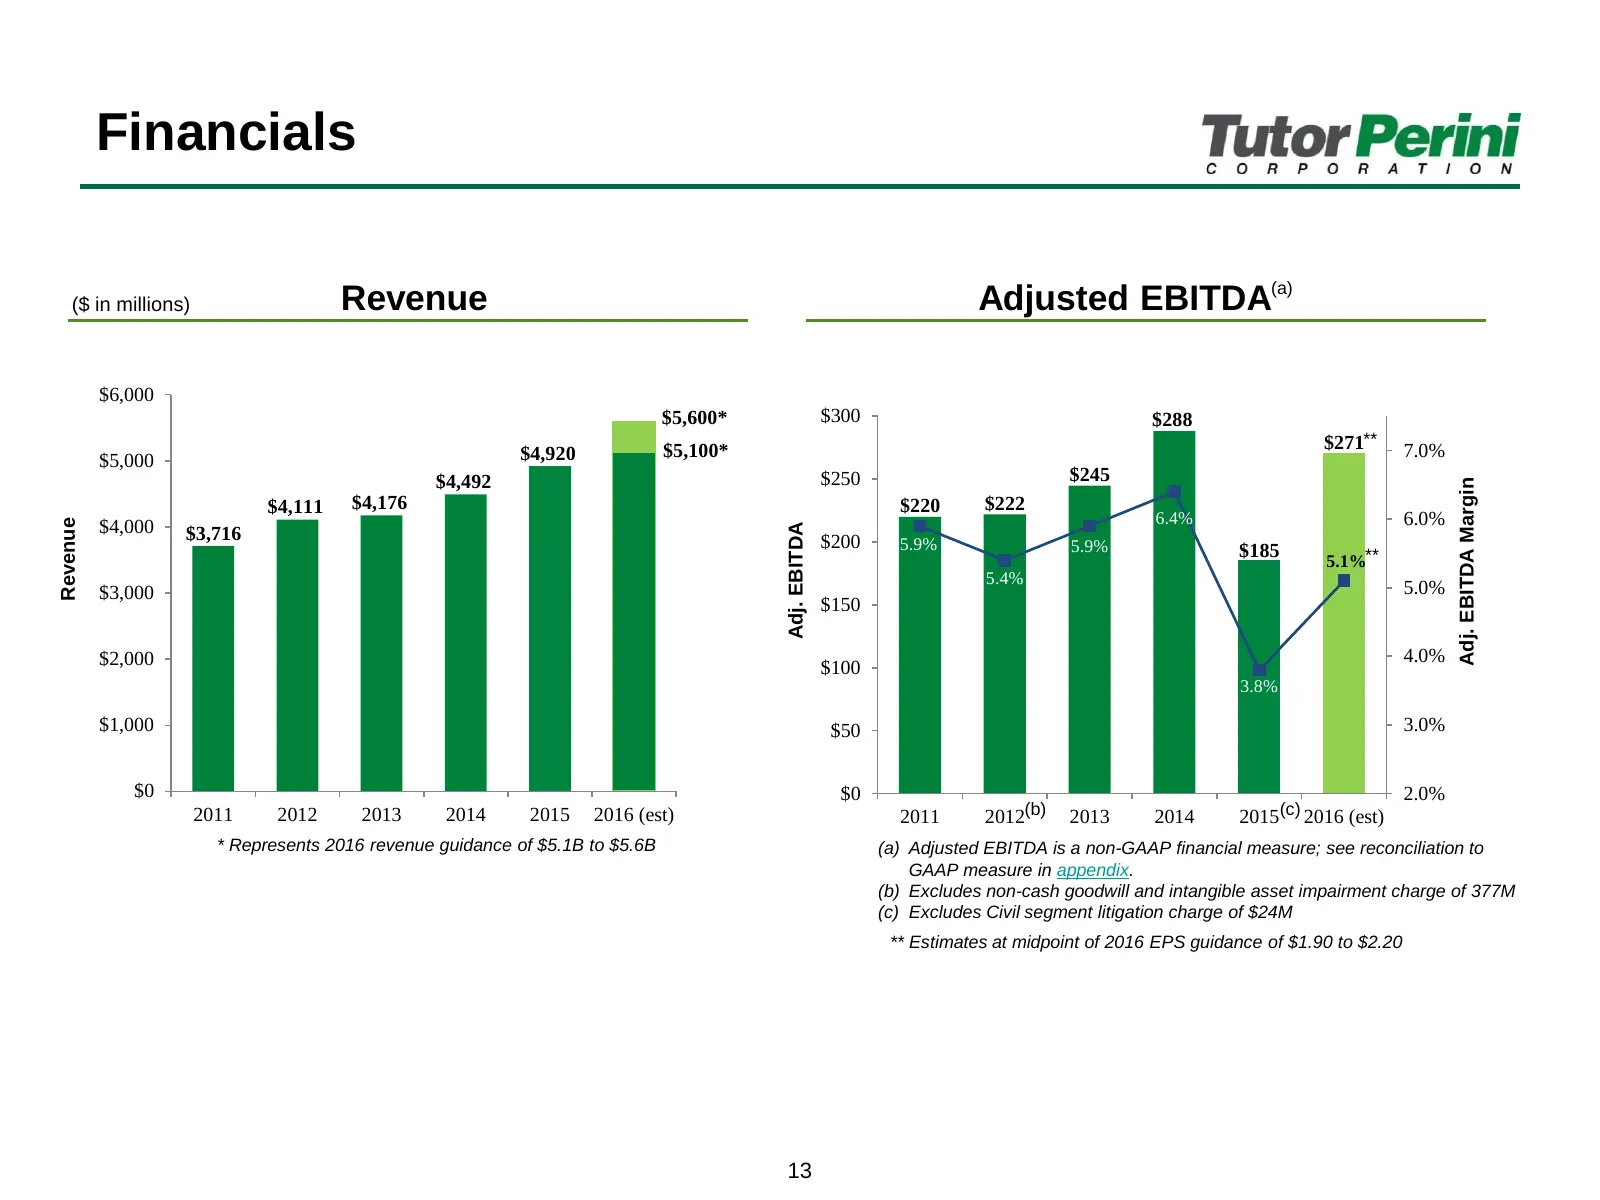
Slide 14: Revenue
Financials ($ in millions) Revenue Adjusted EBITDA(a) $6,000 $5,600* $300 $288 $5,100* $271** 7.0% $5,000 $4,920 $4,492 $250 $245 Adj. EBITDA Margin $4,111 $4,176 $220 $222 6.4% 6.0% Revenue $4,000 Adj. EBITDA $3,716 $200 5.9% 5.9% $185 5.1%** 5.4% $3,000 5.0% $150 $2,000 4.0% $100 3.8% $1,000 $50 3
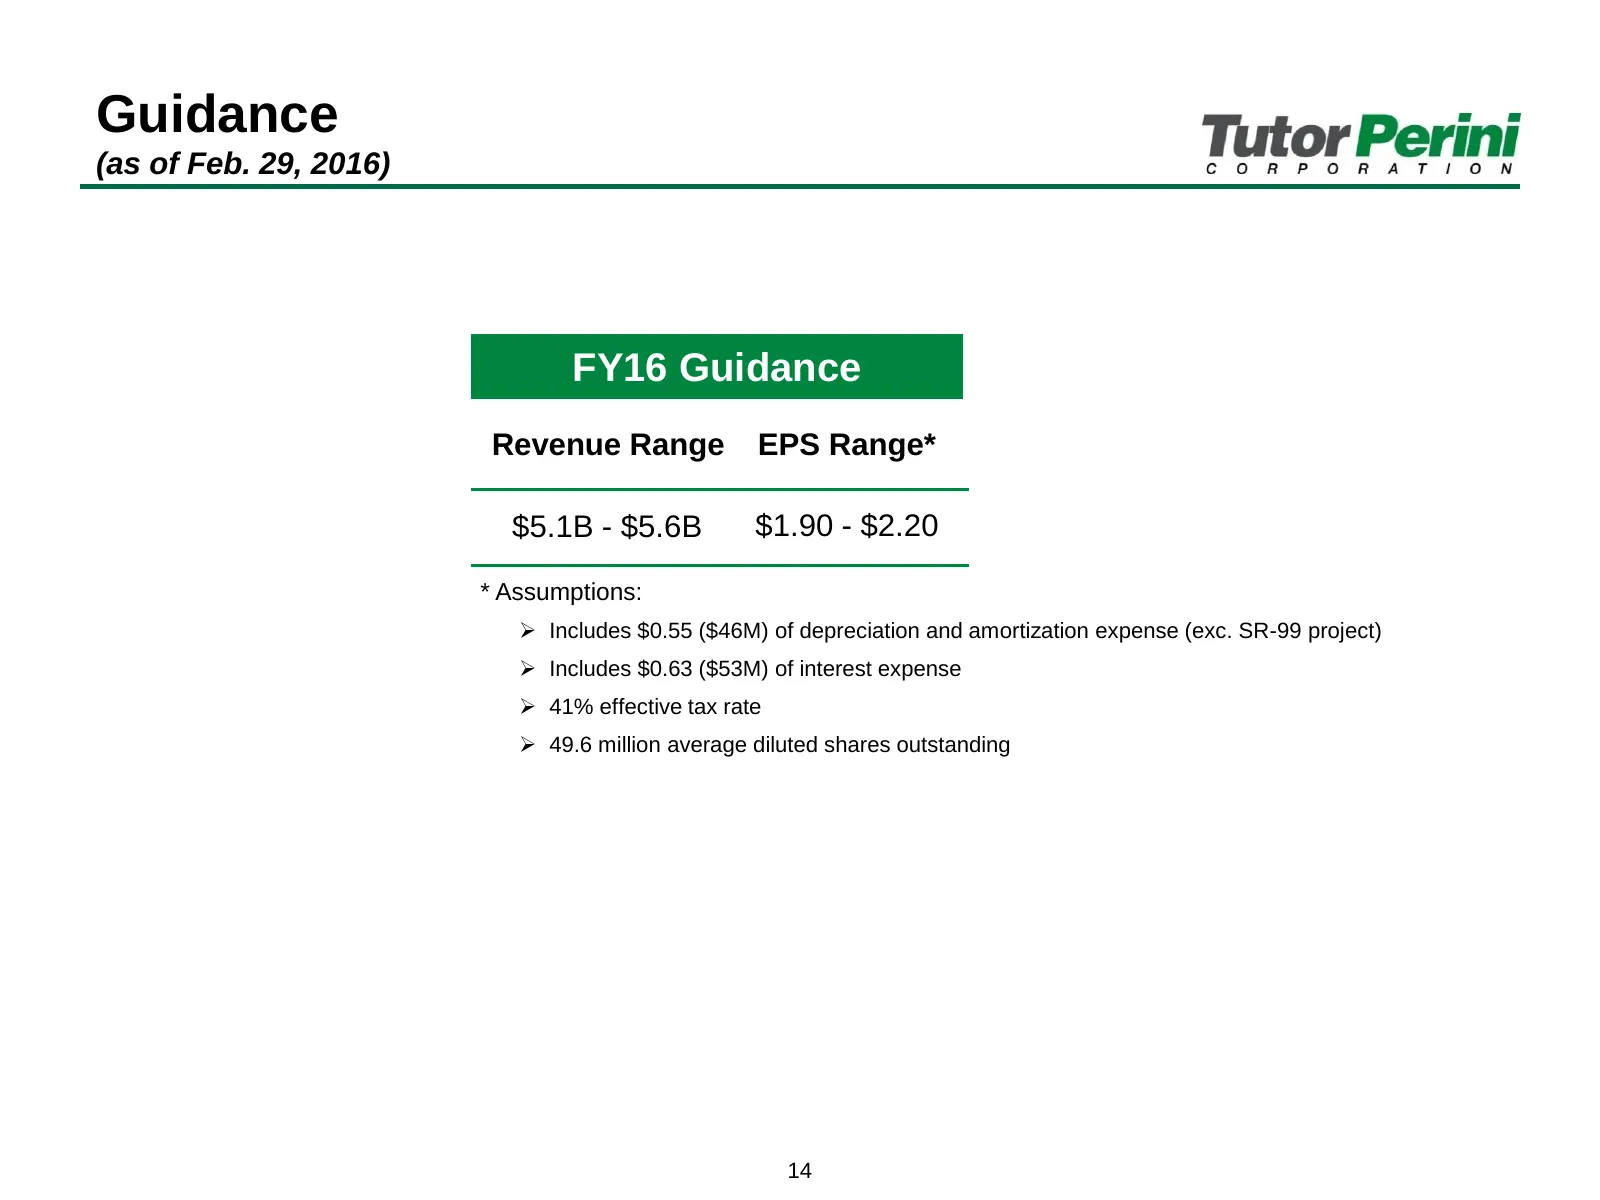
Slide 15: Guidance
Guidance (as of Feb. 29, 2016) FY16 Guidance Revenue Range EPS Range* $5.1B - $5.6B $1.90 - $2.20 * Assumptions: Includes $0.55 ($46M) of depreciation and amortization expense (exc. SR-99 project) Includes $0.63 ($53M) of interest expense 41% effective tax rate 49.6 million average diluted s
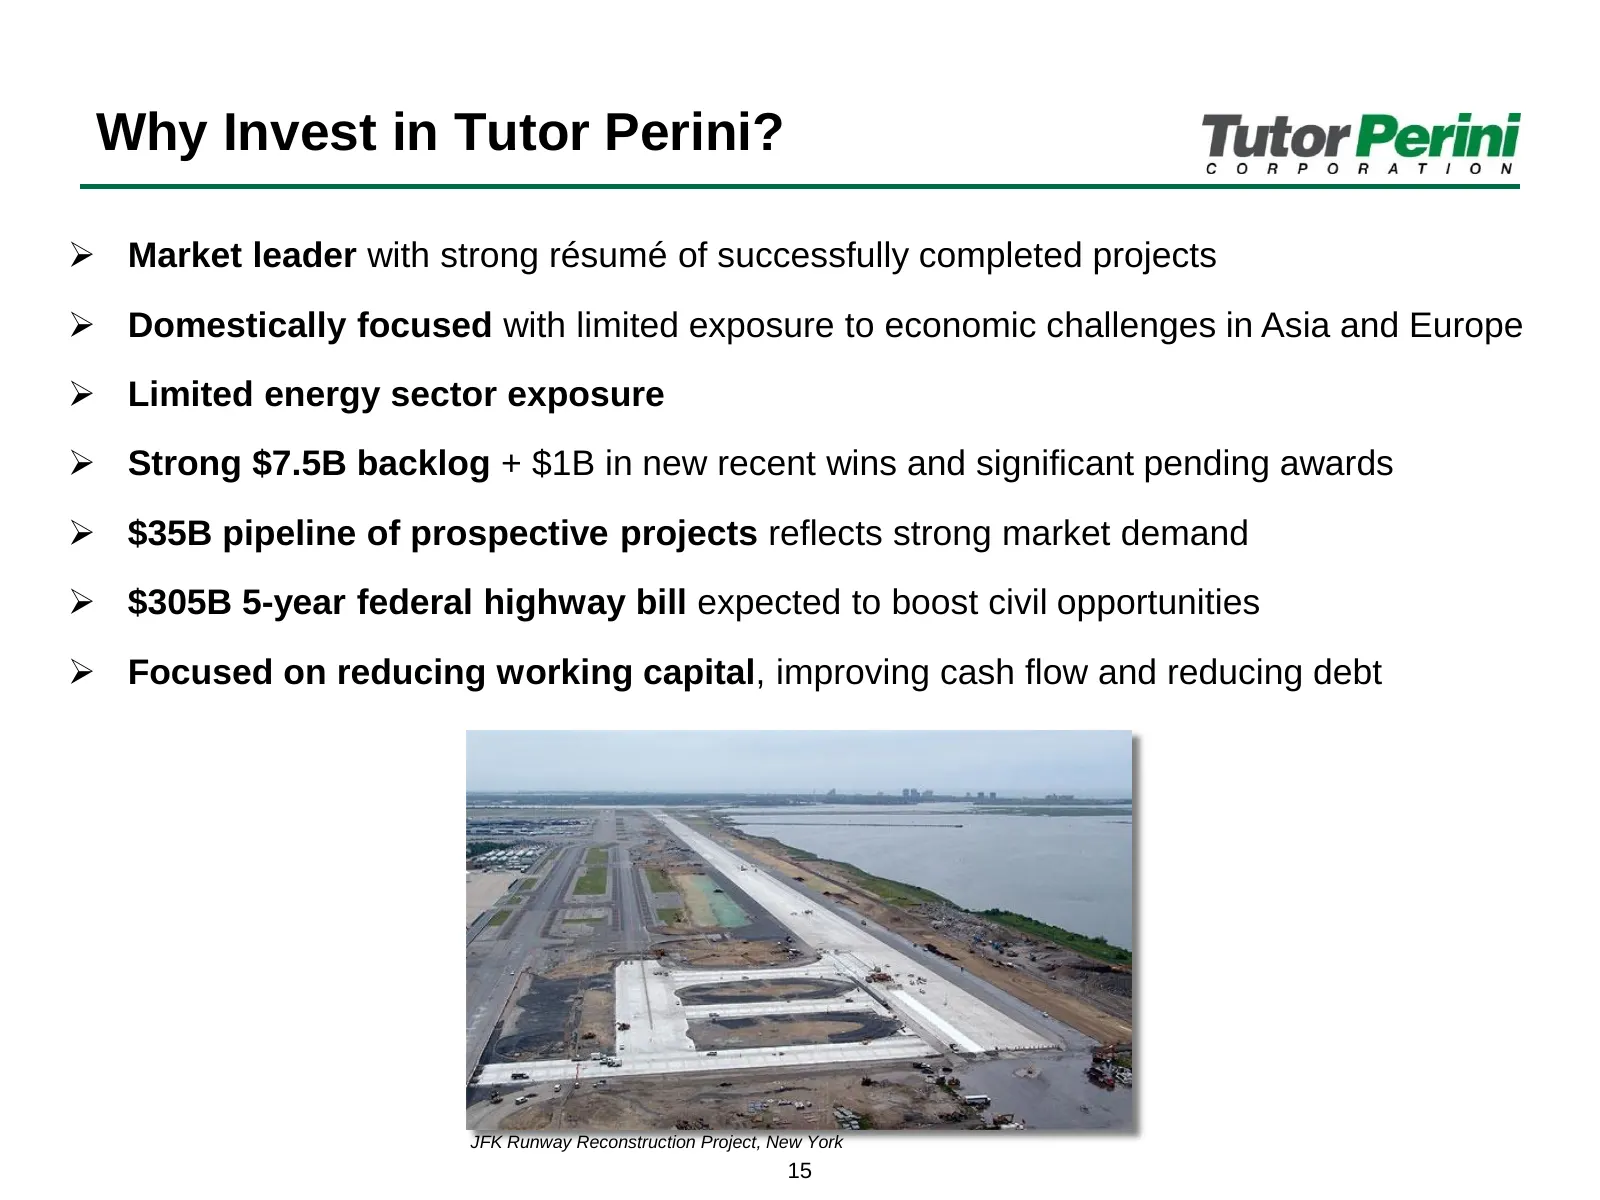
Slide 16: Why Invest in Tutor Perini?
Why Invest in Tutor Perini? Market leader with strong résumé of successfully completed projects Domestically focused with limited exposure to economic challenges in Asia and Europe Limited energy sector exposure Strong $7.5B backlog + $1B in new recent wins and significant pending awards $

Slide 17: Contact: Jorge Casado, Vice President, Investor Relations
Contact: Jorge Casado Vice President, Investor Relations (818) 408-5746 Jorge.Casado@tutorperini.com
Source: Internet Archive copy of investors.tutorperini.com
More decks from Tutor Perini Corporation
 Investor Presentation (August 2026)17 slides · August 2026
 Investor Presentation (May 2026)17 slides · May 2026
 Investor Presentation (February 2026)17 slides · February 2026
 Investor Presentation (November 2025)17 slides · November 2025
 Investor Presentation (August 2025)17 slides · August 2025
 Investor Presentation (August 2023)14 slides · August 2023