Apollo Commercial Real Estate Finance, Inc · NYSE:ARI
Apollo Commercial Real Estate Finance — Q2 2018 Earnings Presentation
21 slides from Apollo Commercial Real Estate Finance's earnings presentation, Jul 26, 2018
Slide 1: Supplemental Financial Information Q2 2018
Supplemental Financial Information Q2 2018 July 25, 2018 Exhibit 99.2
Slide 2: Forward Looking Statements and Other Disclosures
Forward Looking Statements and Other Disclosures This presentation may contain forward-looking statements that are within the meaning of Section 27A of the Securities Act of 1933, as amended, and Section 21E of the Securities Exchange Act of 1934, as amended, and such statements are intended to be c
Slide 3: Q2 Highlights
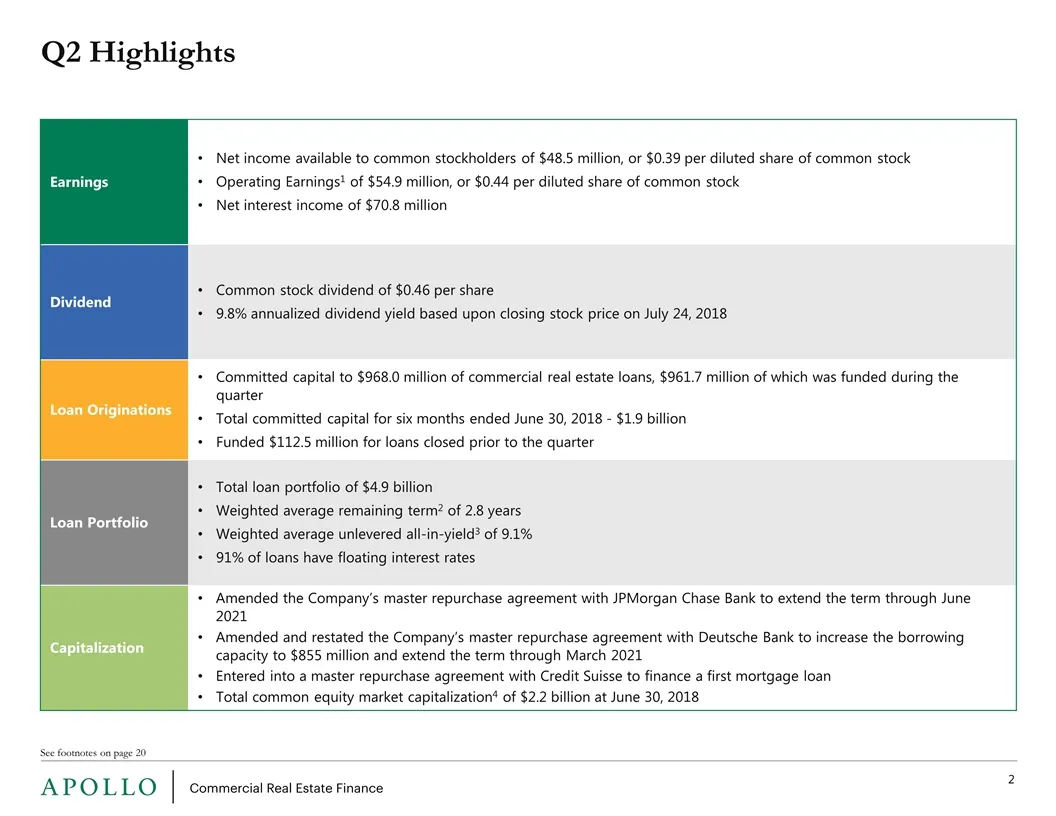
Q2 Highlights See footnotes on page 20 Earnings Net income available to common stockholders of $48.5 million, or $0.39 per diluted share of common stock Operating Earnings1 of $54.9 million, or $0.44 per diluted share of common stock Net interest income of $70.8 million Dividend Common stock dividen
Slide 4: Financial Summary
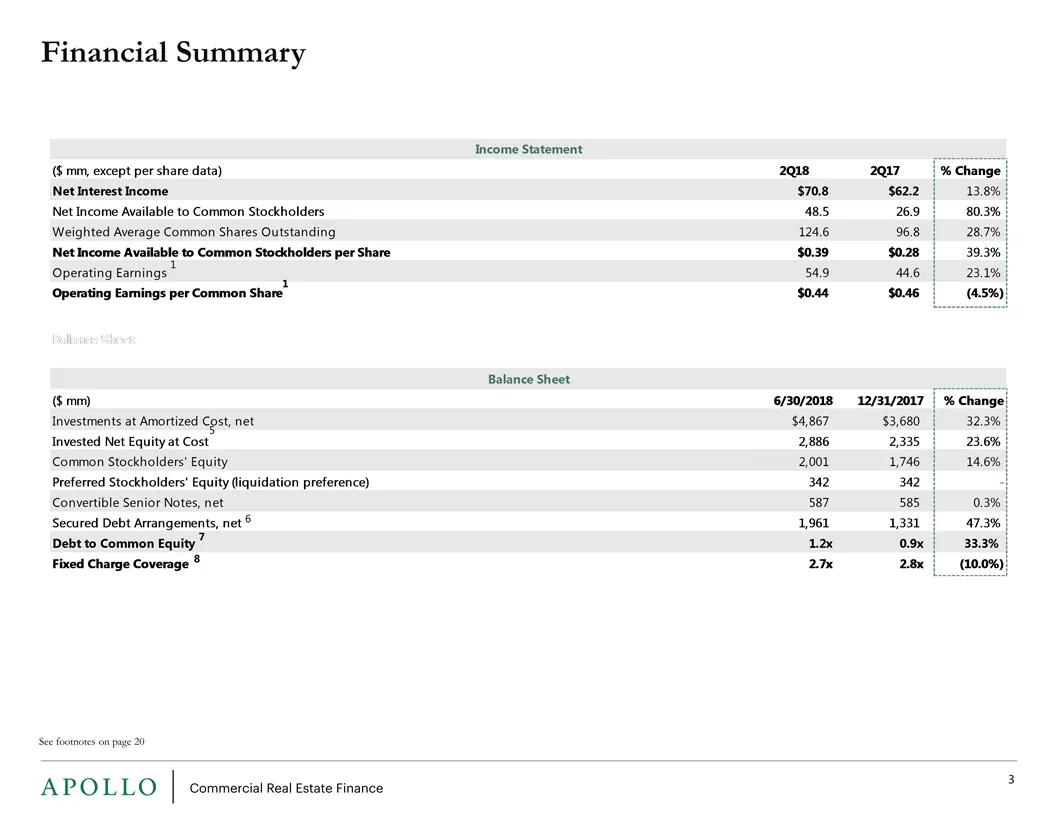
Financial Summary See footnotes on page 20 1 1 6 7 8 5
Slide 5: Q2 Investment Activity
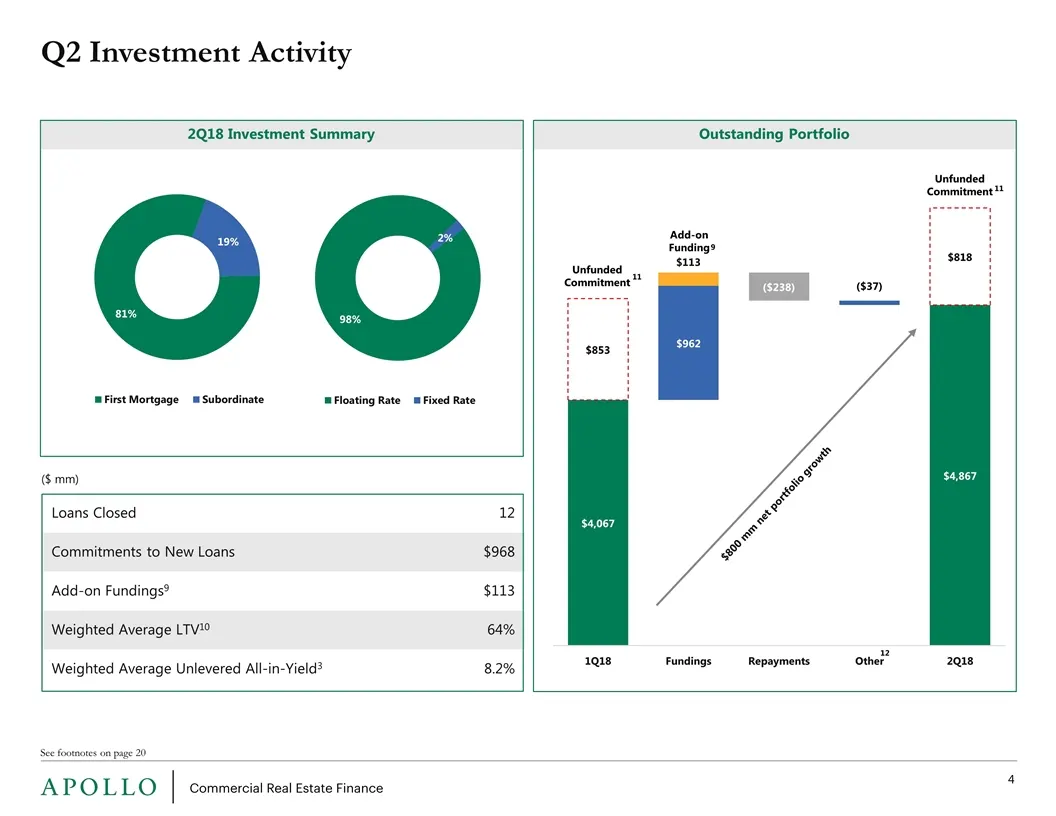
Q2 Investment Activity See footnotes on page 20 2Q18 Investment Summary Outstanding Portfolio Loans Closed 12 Commitments to New Loans $968 Add-on Fundings9 $113 Weighted Average LTV10 64% Weighted Average Unlevered All-in-Yield3 8.2% $800 mm net portfolio growth ($ mm) 12 11 11
Slide 6: YTD Investment Activity
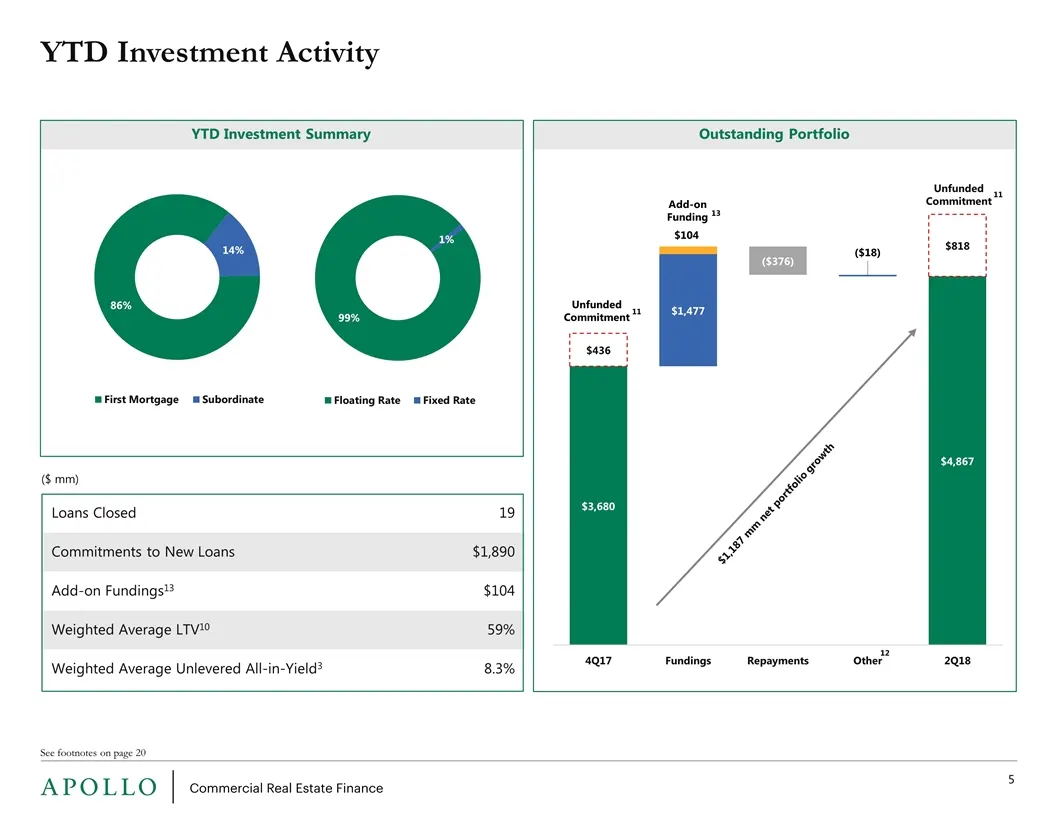
YTD Investment Activity See footnotes on page 20 YTD Investment Summary Outstanding Portfolio Loans Closed 19 Commitments to New Loans $1,890 Add-on Fundings13 $104 Weighted Average LTV10 59% Weighted Average Unlevered All-in-Yield3 8.3% $1,187 mm net portfolio growth ($ mm) 12 11 11
Slide 7: Q2 Investment Activity: Summary of New Investments
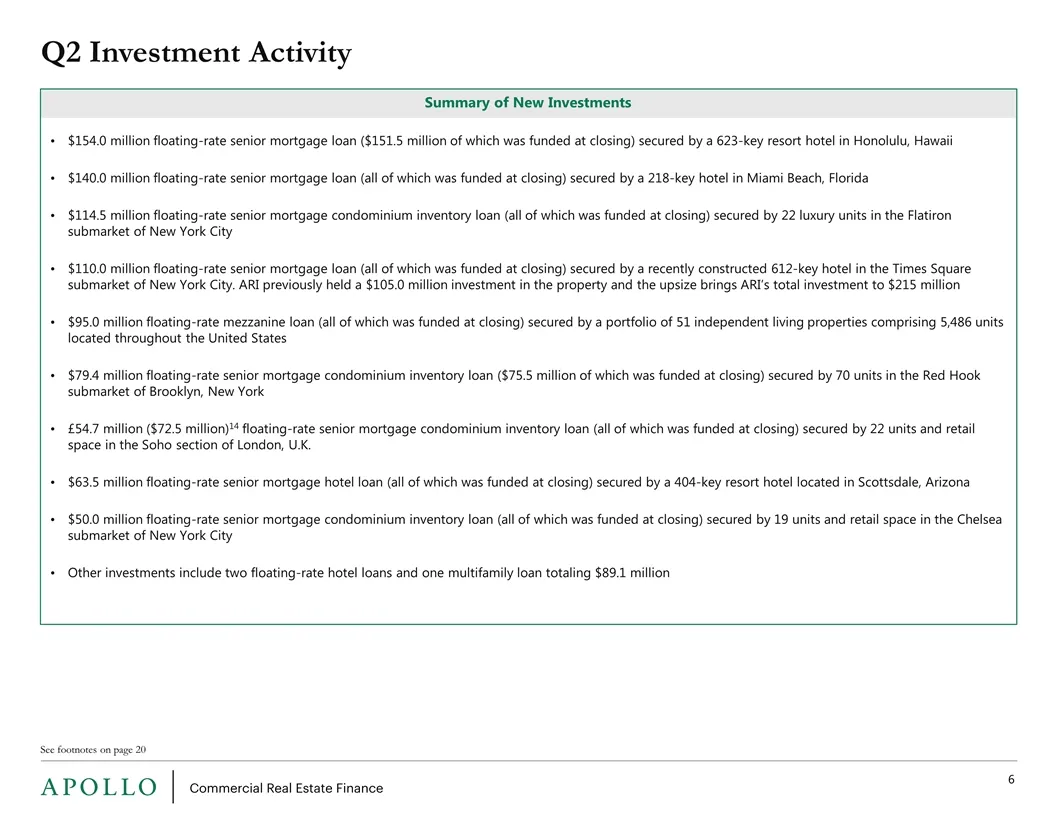
Q2 Investment Activity See footnotes on page 20 Summary of New Investments $154.0 million floating-rate senior mortgage loan ($151.5 million of which was funded at closing) secured by a 623-key resort hotel in Honolulu, Hawaii $140.0 million floating-rate senior mortgage loan (all of which was funde
Slide 8: Commercial Real Estate Loan Portfolio Overview
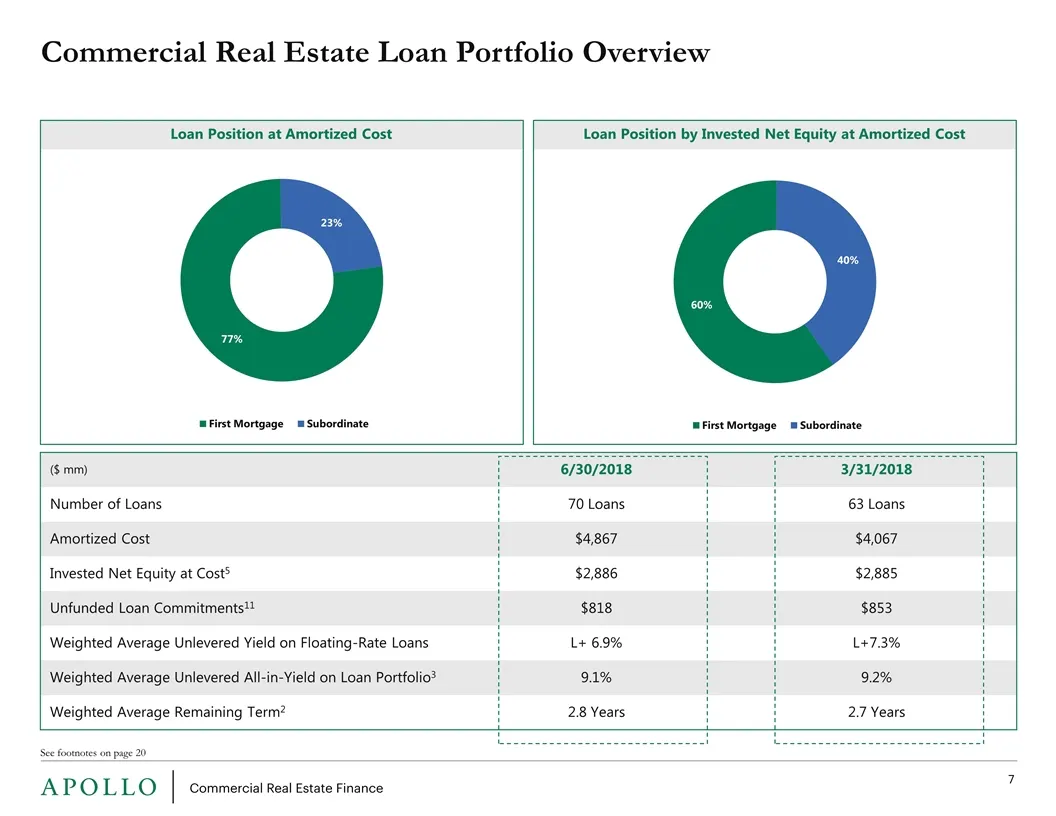
Loan Position by Invested Net Equity at Amortized Cost Commercial Real Estate Loan Portfolio Overview See footnotes on page 20 Loan Position at Amortized Cost ($ mm) 6/30/2018 3/31/2018 Number of Loans 70 Loans 63 Loans Amortized Cost $4,867 $4,067 Invested Net Equity at Cost5 $2,886 $2,885 Unfunded
Slide 9: Commercial Real Estate Loan Portfolio Overview: Geography and Property Type
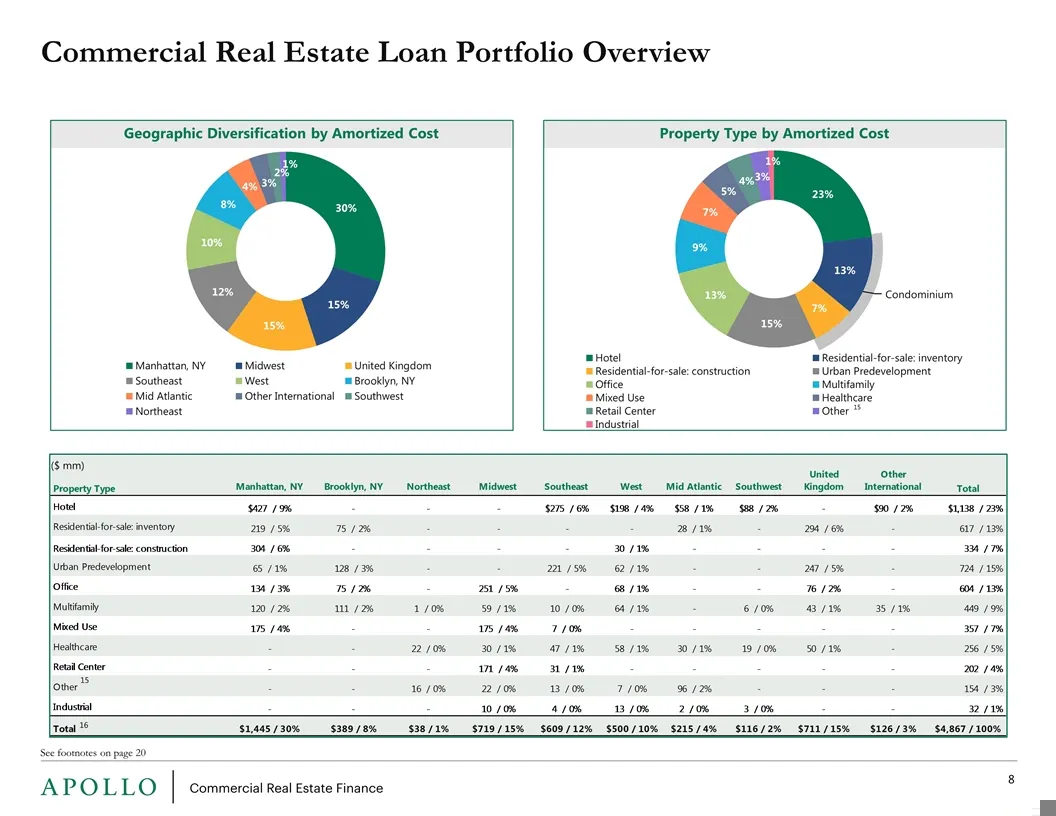
Commercial Real Estate Loan Portfolio Overview See footnotes on page 20 Geographic Diversification by Amortized Cost ($ mm) 15 16 Property Type by Amortized Cost
Slide 10: Senior Loan Portfolio Overview
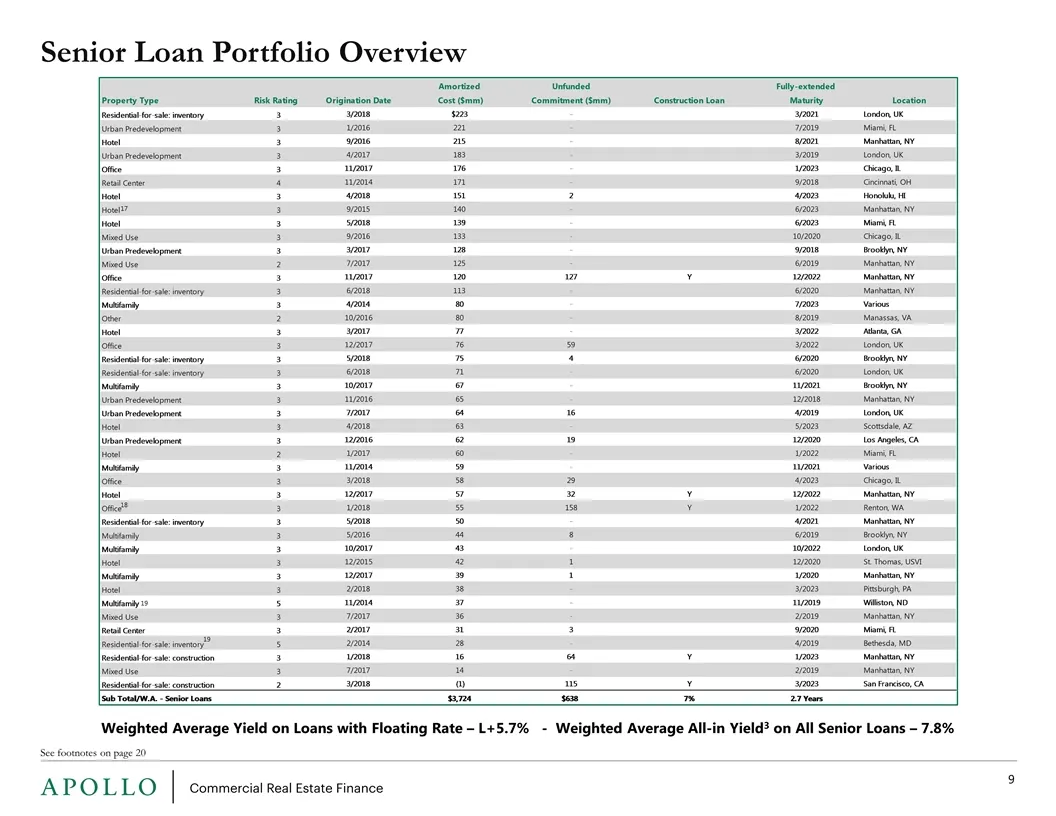
Weighted Average Yield on Loans with Floating Rate – L+5.7% - Weighted Average All-in Yield3 on All Senior Loans – 7.8% Senior Loan Portfolio Overview See footnotes on page 20 17 18 19 19
Slide 11: Subordinate Loan Portfolio Overview
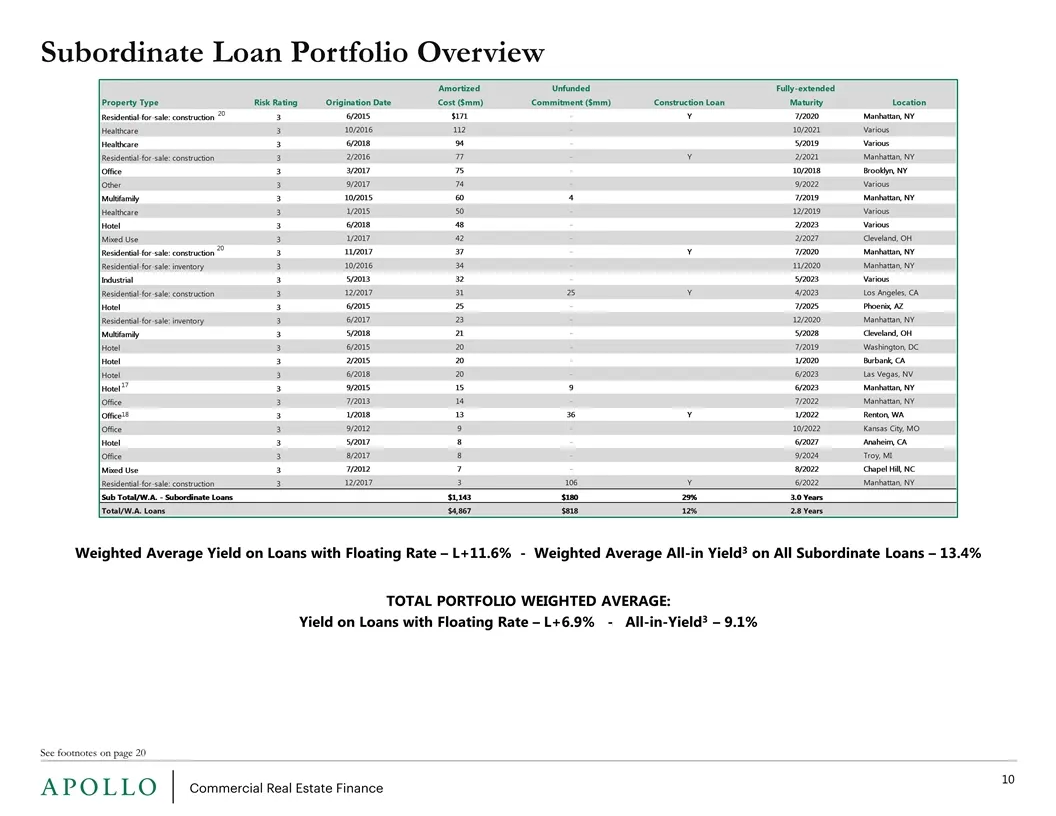
Subordinate Loan Portfolio Overview See footnotes on page 20 Weighted Average Yield on Loans with Floating Rate – L+11.6% - Weighted Average All-in Yield3 on All Subordinate Loans – 13.4% TOTAL PORTFOLIO WEIGHTED AVERAGE: Yield on Loans with Floating Rate – L+6.9% - All-in-Yield3 – 9.1% 17 18 20 20
Slide 12: Loan Portfolio Maturity Profile
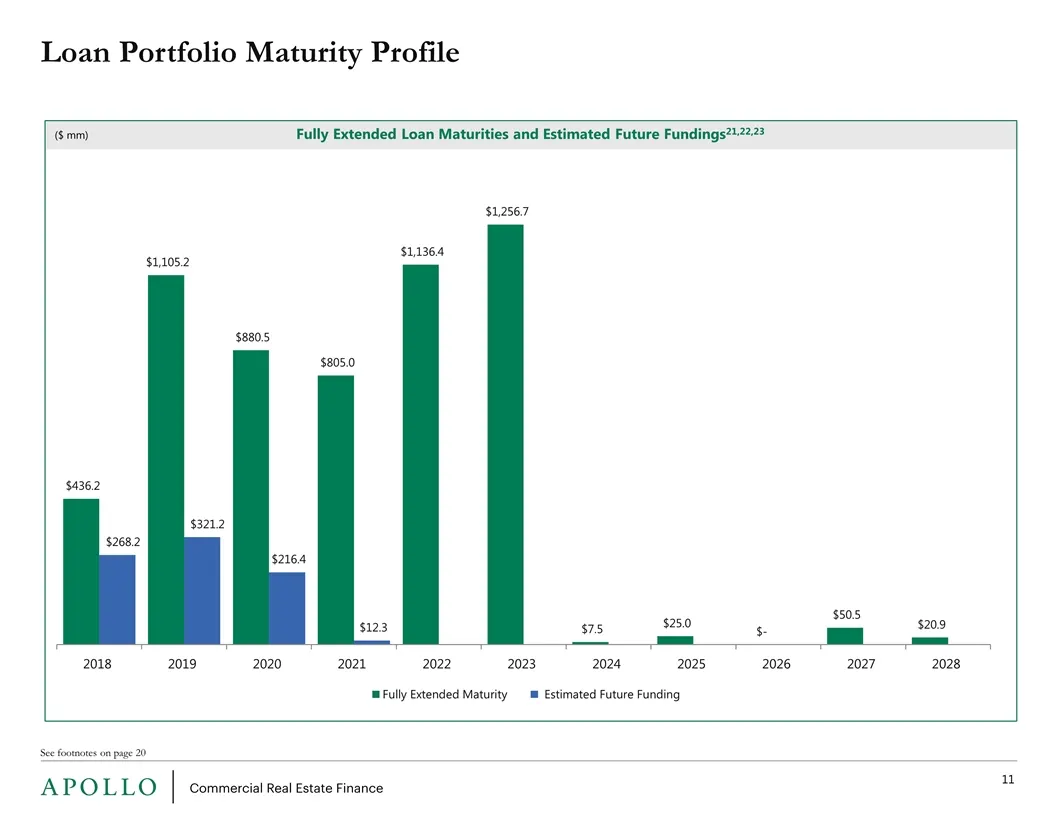
Loan Portfolio Maturity Profile See footnotes on page 20 Fully Extended Loan Maturities and Estimated Future Fundings21,22,23 ($ mm)
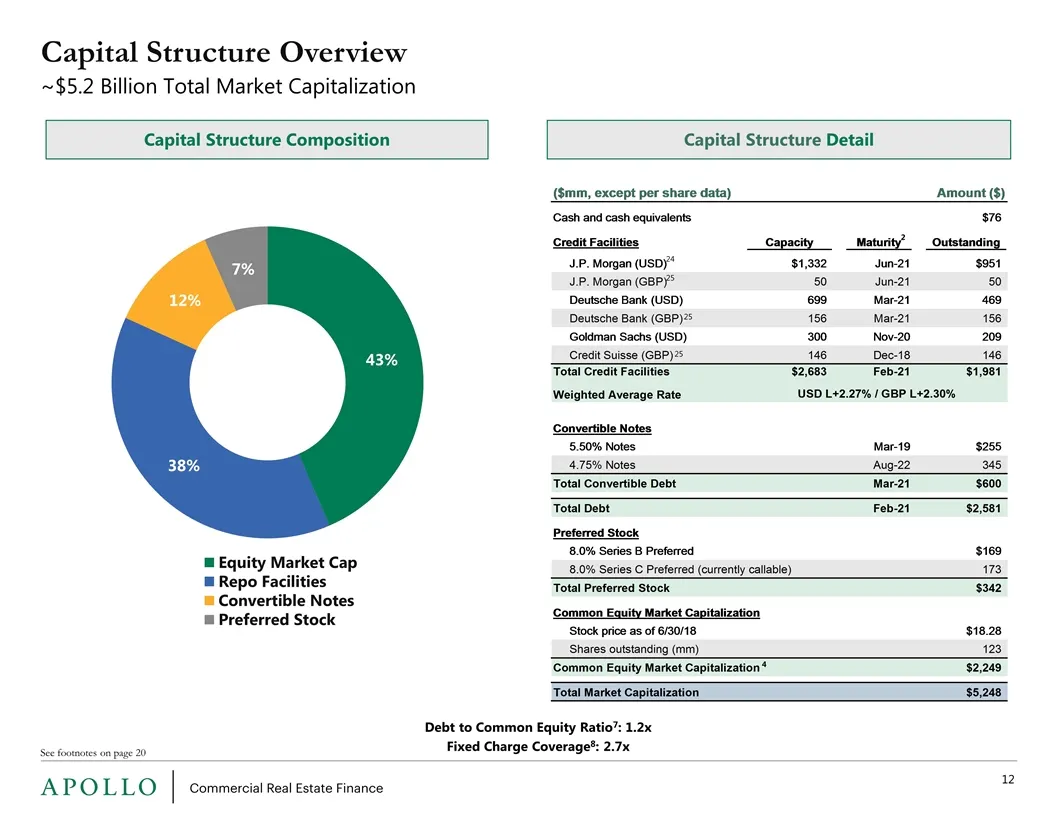
Slide 13: Capital Structure Overview
Capital Structure Overview See footnotes on page 20 Debt to Common Equity Ratio7: 1.2x Fixed Charge Coverage8: 2.7x ~$5.2 Billion Total Market Capitalization Capital Structure Detail Capital Structure Composition 24 25 4 2 25 25
Slide 14: Liquidity
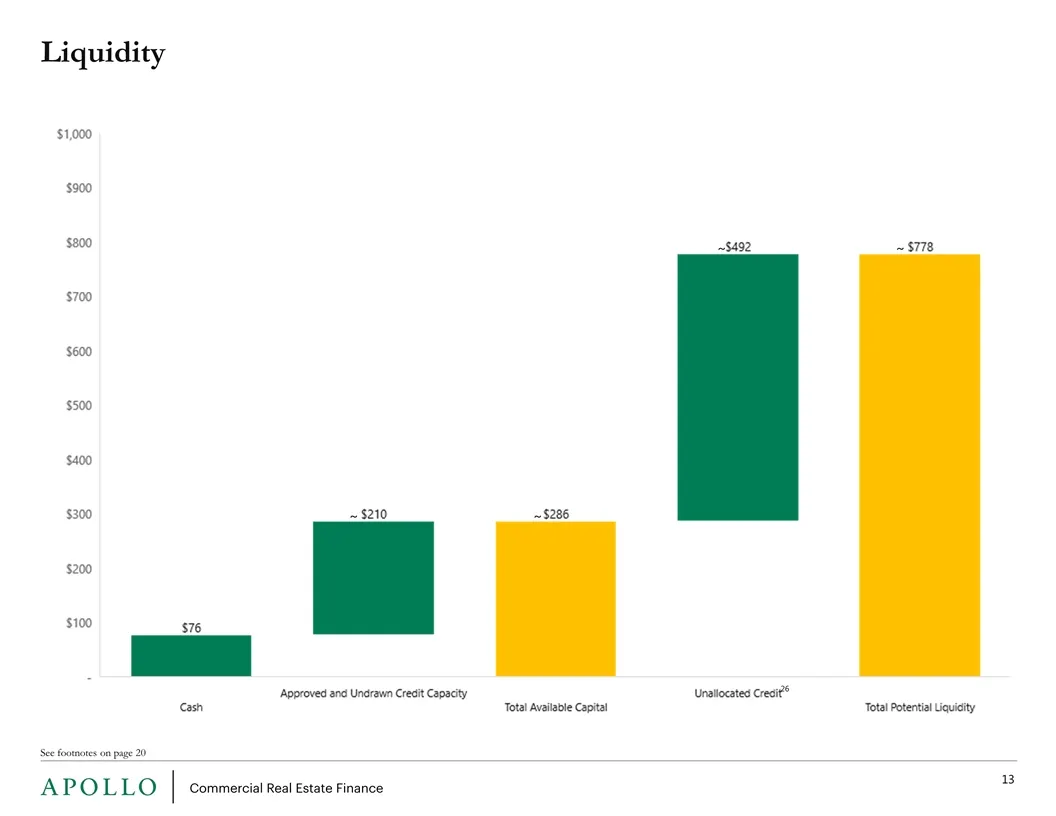
See footnotes on page 20 ~ ~ ~ ~ 26 Liquidity
Slide 15: Interest Rate Sensitivity
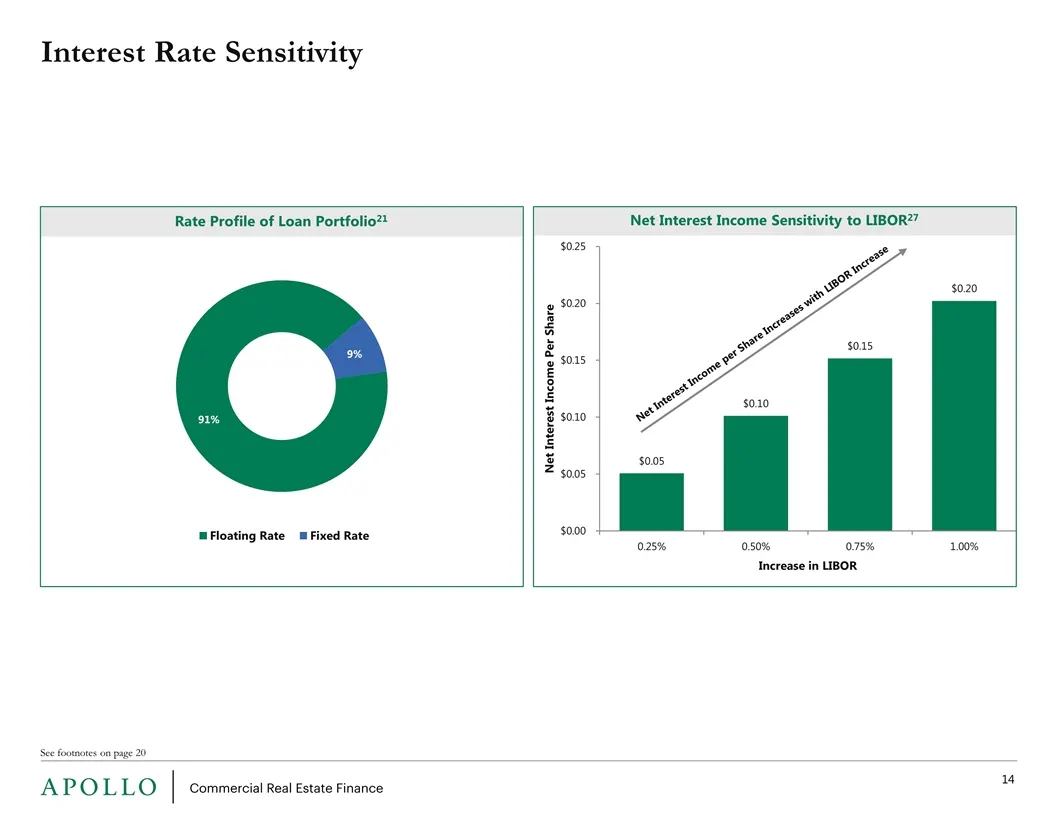
Interest Rate Sensitivity See footnotes on page 20 Rate Profile of Loan Portfolio21 Net Interest Income Sensitivity to LIBOR27 Net Interest Income per Share Increases with LIBOR Increase
Slide 16: Financials
Financials APOLLO
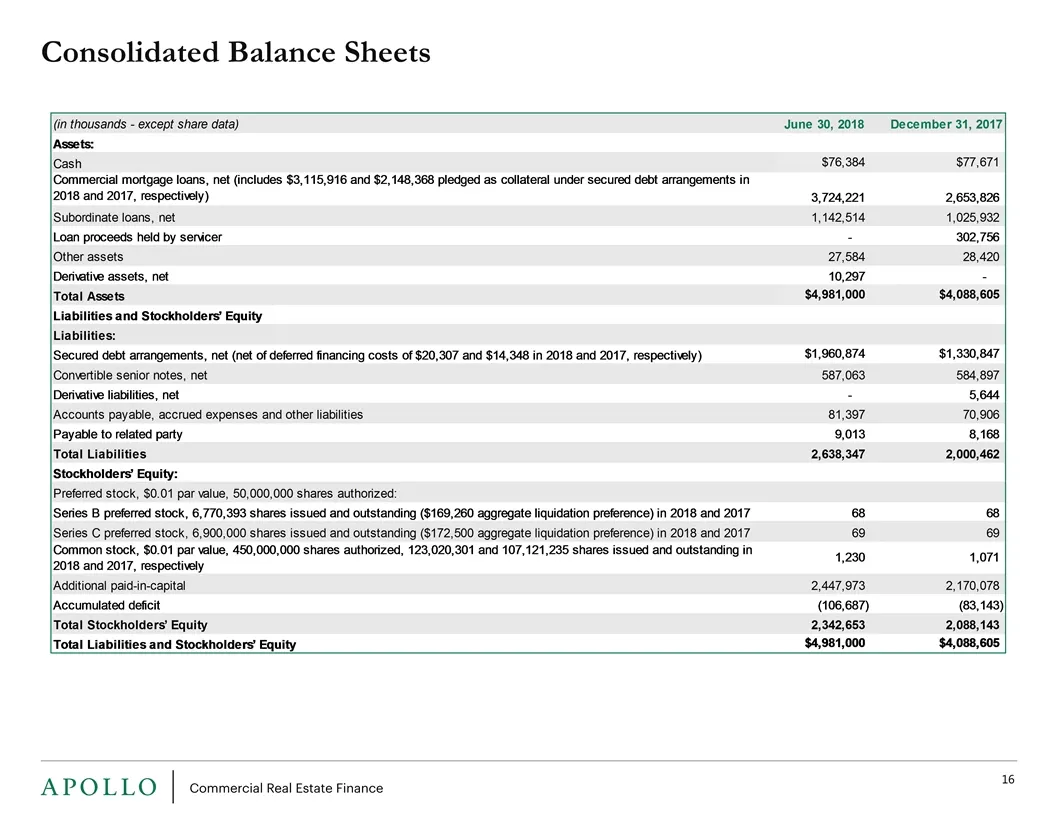
Slide 17: Consolidated Balance Sheets
Consolidated Balance Sheets
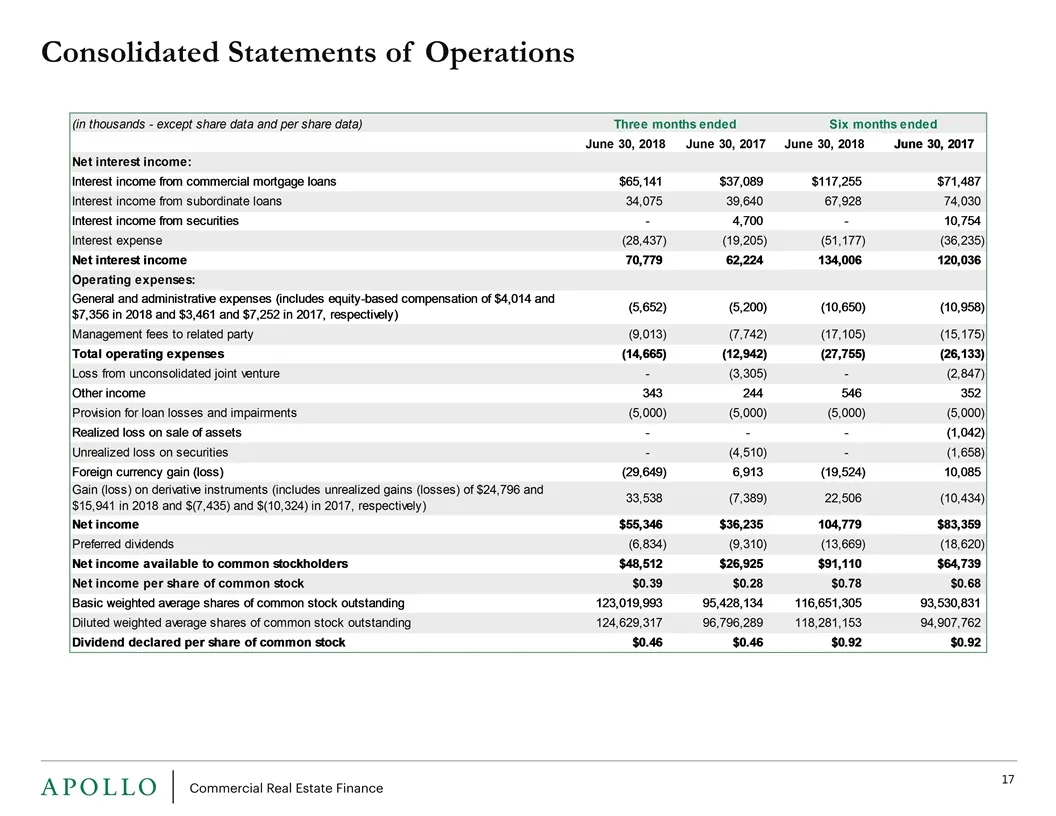
Slide 18: Consolidated Statements of Operations
Consolidated Statements of Operations
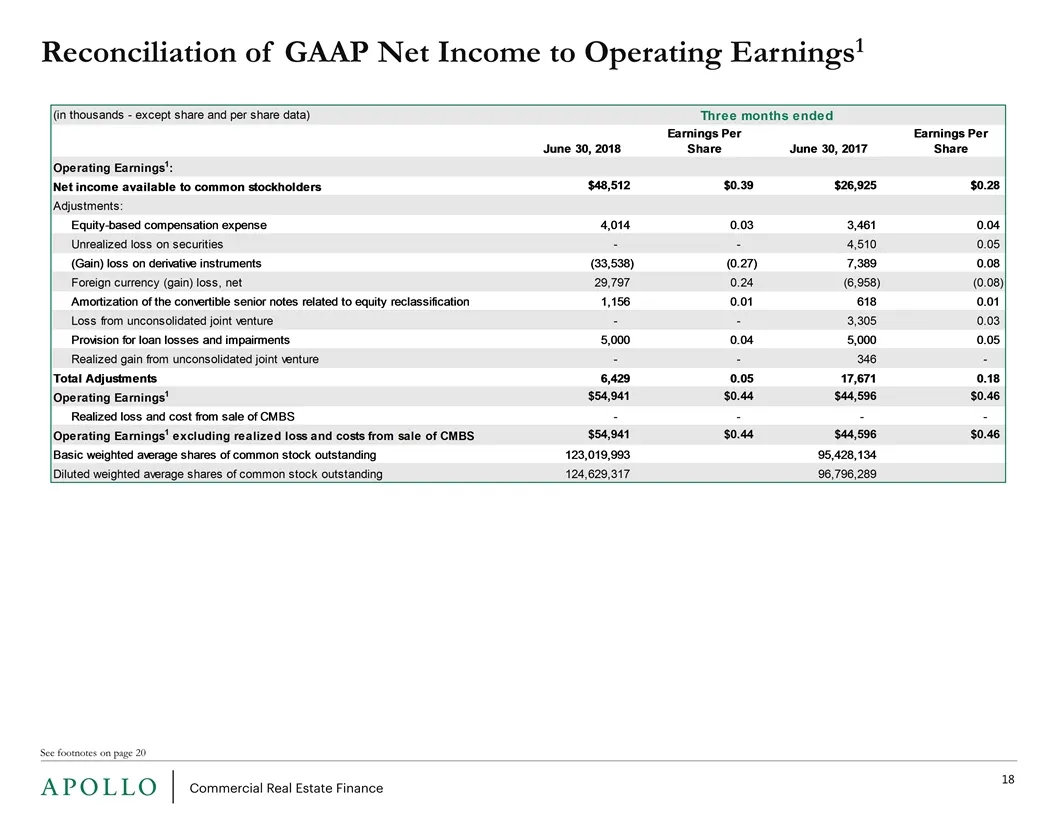
Slide 19: Reconciliation of GAAP Net Income to Operating Earnings
Reconciliation of GAAP Net Income to Operating Earnings1 See footnotes on page 20
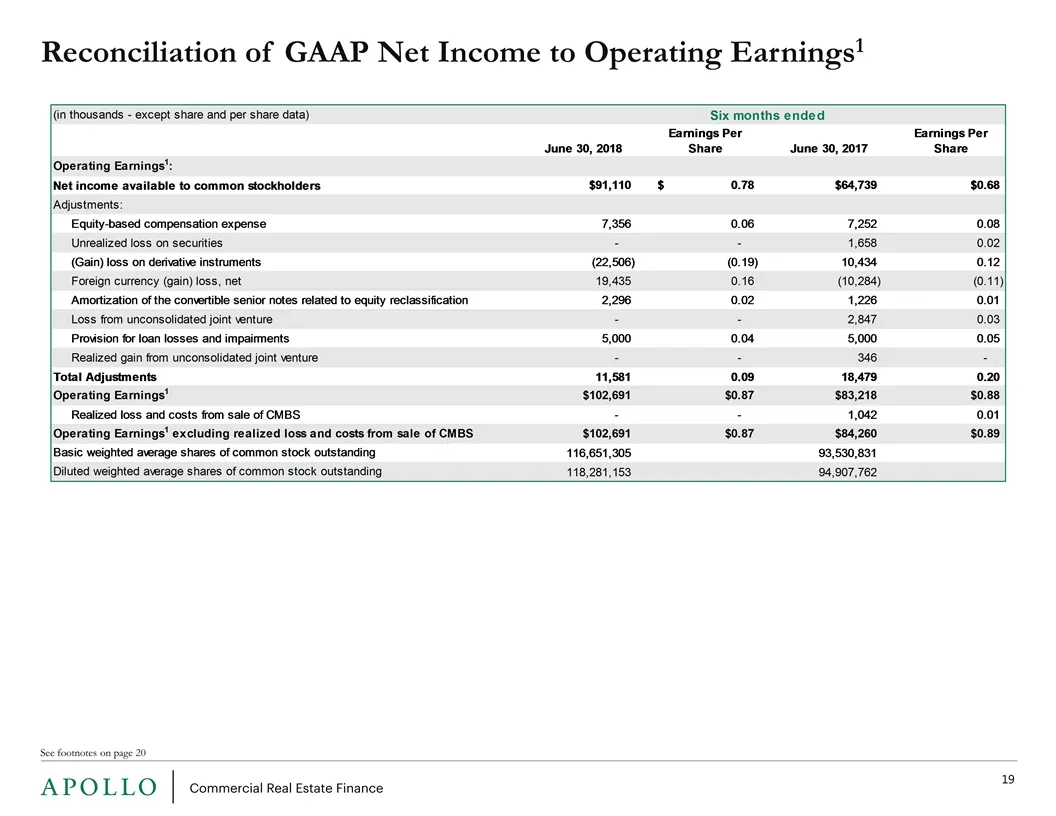
Slide 20: Reconciliation of GAAP Net Income to Operating Earnings
Reconciliation of GAAP Net Income to Operating Earnings1 See footnotes on page 20
Slide 21: Footnotes
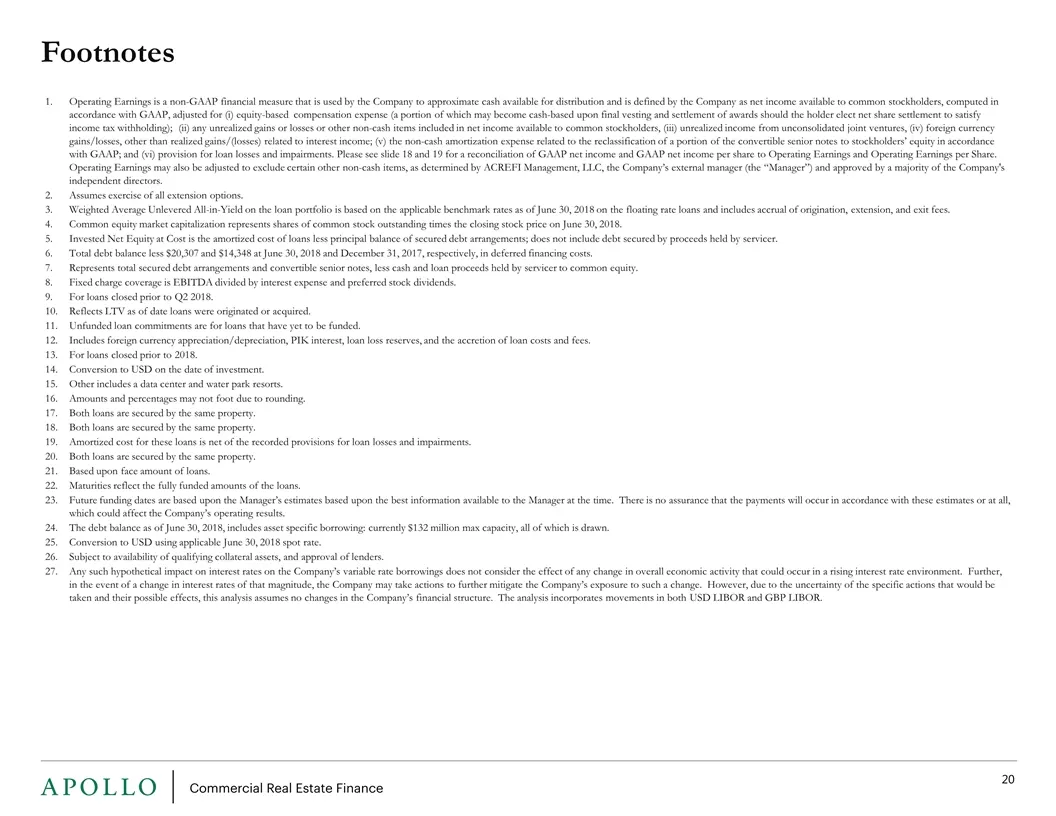
Footnotes Operating Earnings is a non-GAAP financial measure that is used by the Company to approximate cash available for distribution and is defined by the Company as net income available to common stockholders, computed in accordance with GAAP, adjusted for (i) equity-based compensation expense (
Source: SEC EDGAR · 8-K filed Jul 26, 2018
More decks from Apollo Commercial Real Estate Finance, Inc
 Q2 2026 Earnings Presentation11 slides · Aug 11, 2026
 Q1 2026 Earnings Presentation19 slides · Apr 29, 2026
 Investor Presentation (March 2026)21 slides · March 2026
 Q4 2025 Earnings Presentation22 slides · Feb 11, 2026
 Merger or Acquisition (January 2026)8 slides · Jan 28, 2026
 Investor Presentation (December 2025)22 slides · December 2025