Ellaktor SA · ATHEX:ELLAKTOR
Ellaktor SA — Q1 2022 Earnings Presentation
34 slides from Ellaktor SA's earnings presentation, May 2022
Slide 1: Q1 2022 Financial Results Restricted Group
May 2022 Q1 2022 Financial Results Restricted Group RG – Q1’22 Financial results 1 * Olympia Odos
Slide 2: Disclaimer
Disclaimer. This presentation has been prepared by ELLAKTOR S.A. The information included in this presentation maybe caution readers of this presentation not to place undue (the “Company”). subject to updating, completion, revision and reliance on these forward-looking statements as a amendment and
Slide 3: Contents
Contents. 1. 2. 3. 4. Financial & Key Financial Performance Appendix Operational Figures by Segment Update RG – Q1’22 Financial results 3

Slide 4: 1. Financial & Operational Update
1. Financial & Operational Update 4
Slide 5: Financial Highlights
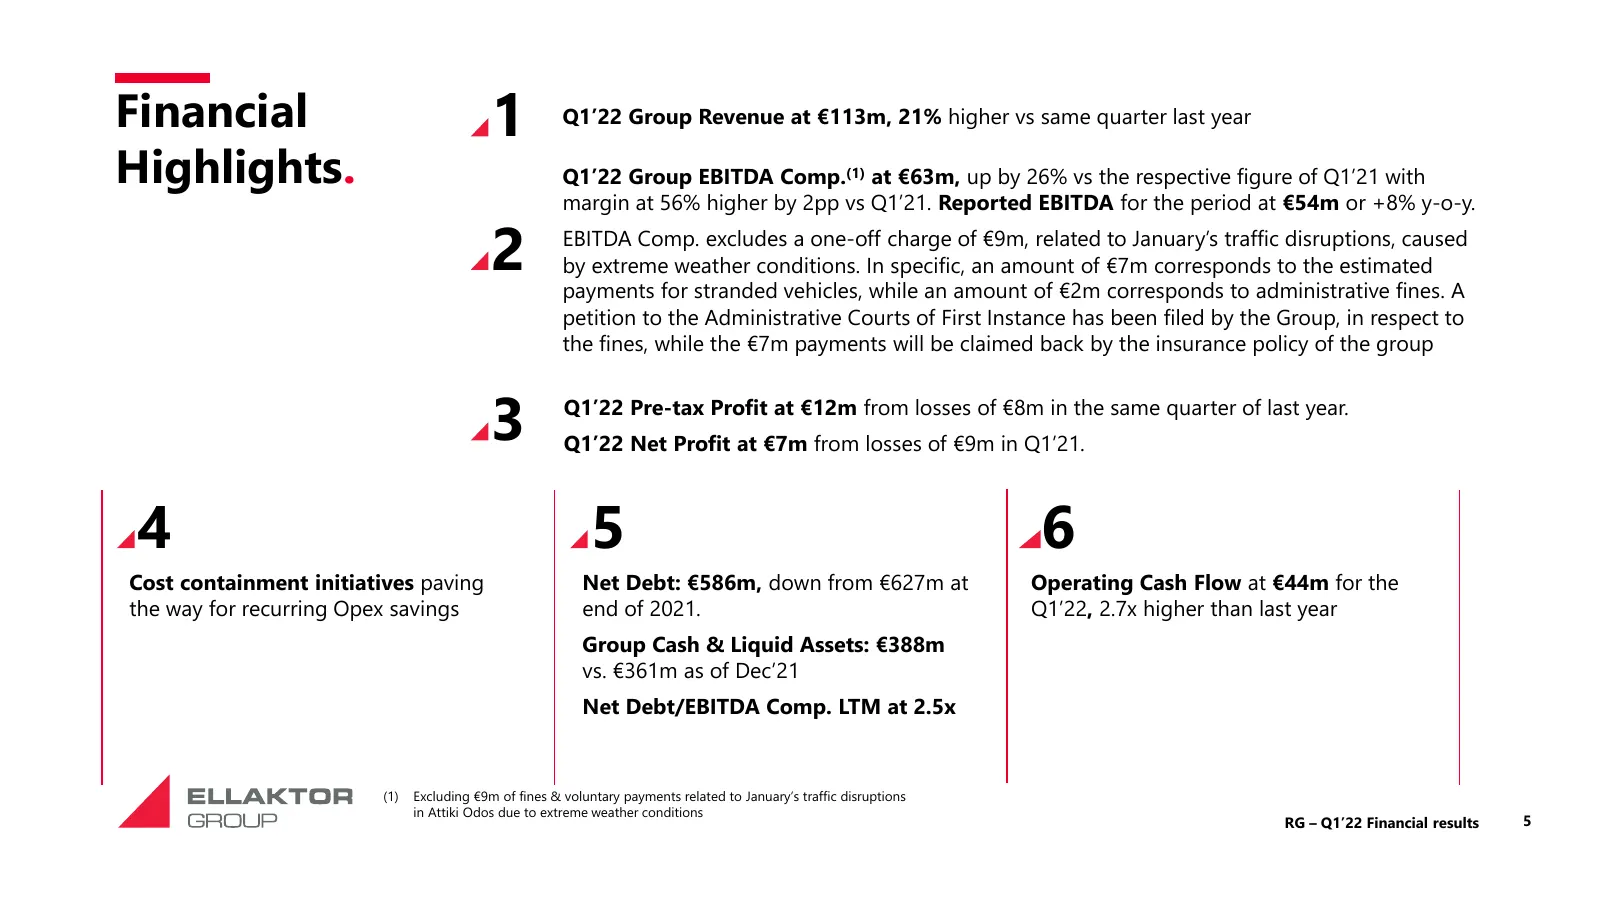
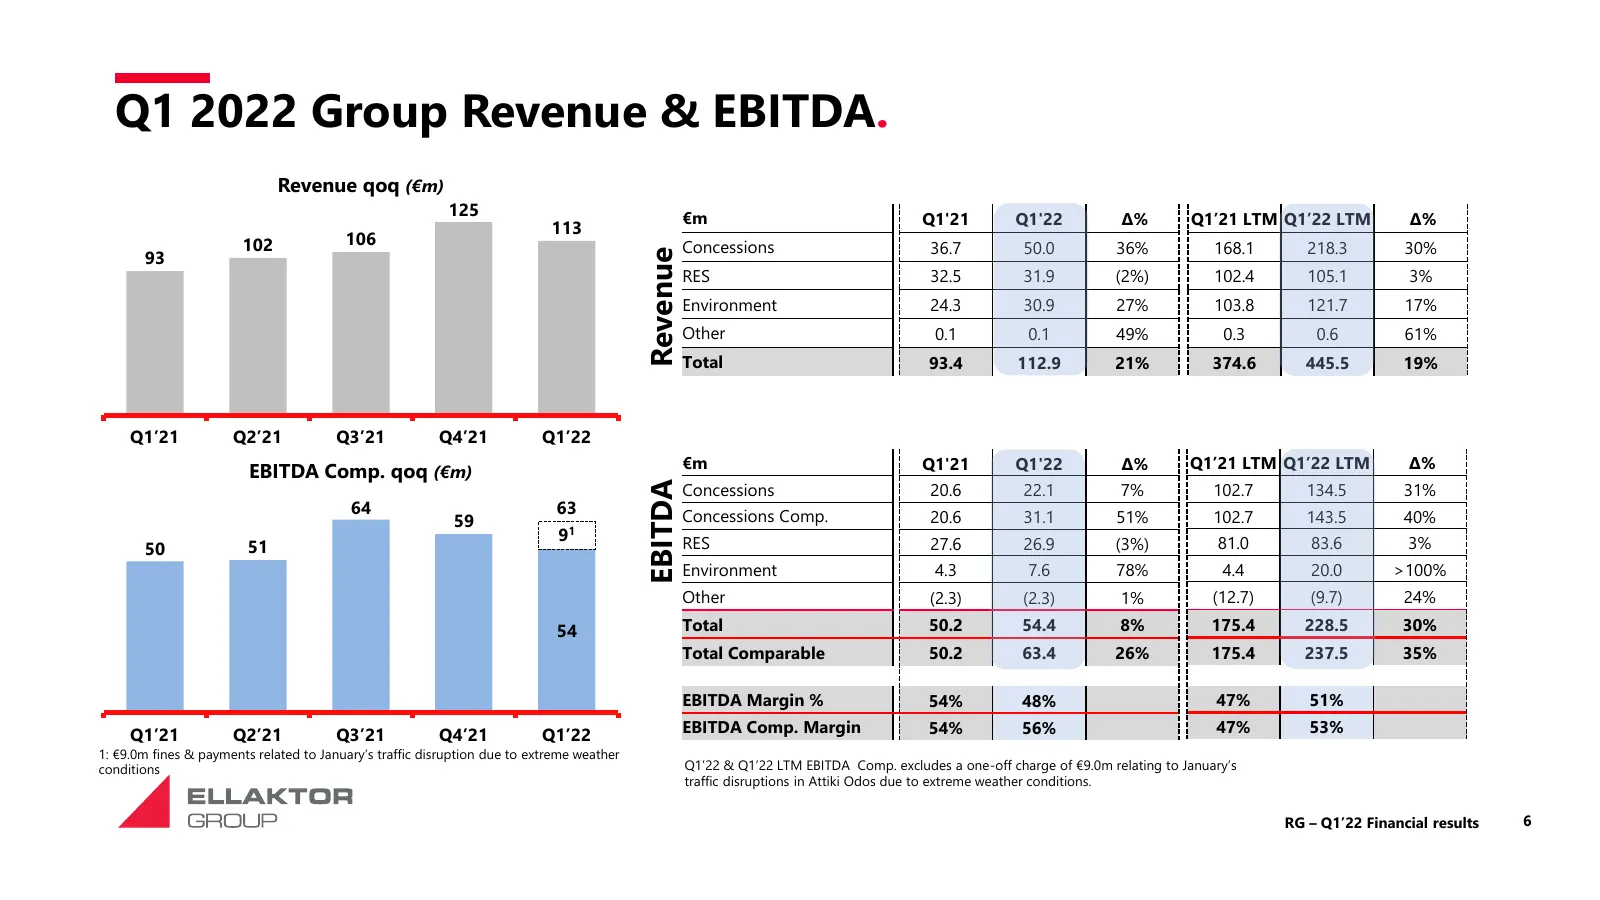
Financial 1 Q1’22 Group Revenue at €113m, 21% higher vs same quarter last year Highlights. Q1’22 Group EBITDA Comp.(1) at €63m, up by 26% vs the respective figure of Q1’21 with margin at 56% higher by 2pp vs Q1’21. Reported EBITDA for the period at €54m or +8% y-o-y. 2 EBITDA Comp. excludes a one-of
Slide 6: Q1 2022 Group Revenue & EBITDA
Q1 2022 Group Revenue & EBITDA. Revenue qoq (€m) 125 €m Q1'21 Q1'22 Δ% Q1’21 LTM Q1’22 LTM Δ% 113 102 106 Concessions 36.7 50.0 36% 168.1 218.3 30% 93 Revenue RES 32.5 31.9 (2%) 102.4 105.1 3% Environment 24.3 30.9 27% 103.8 121.7 17% Other 0.1 0.1 49% 0.3 0.6 61% Total 93.4 112.9 21% 374.6 445.5 19
Slide 7: Recent developments [May 6th 2022]
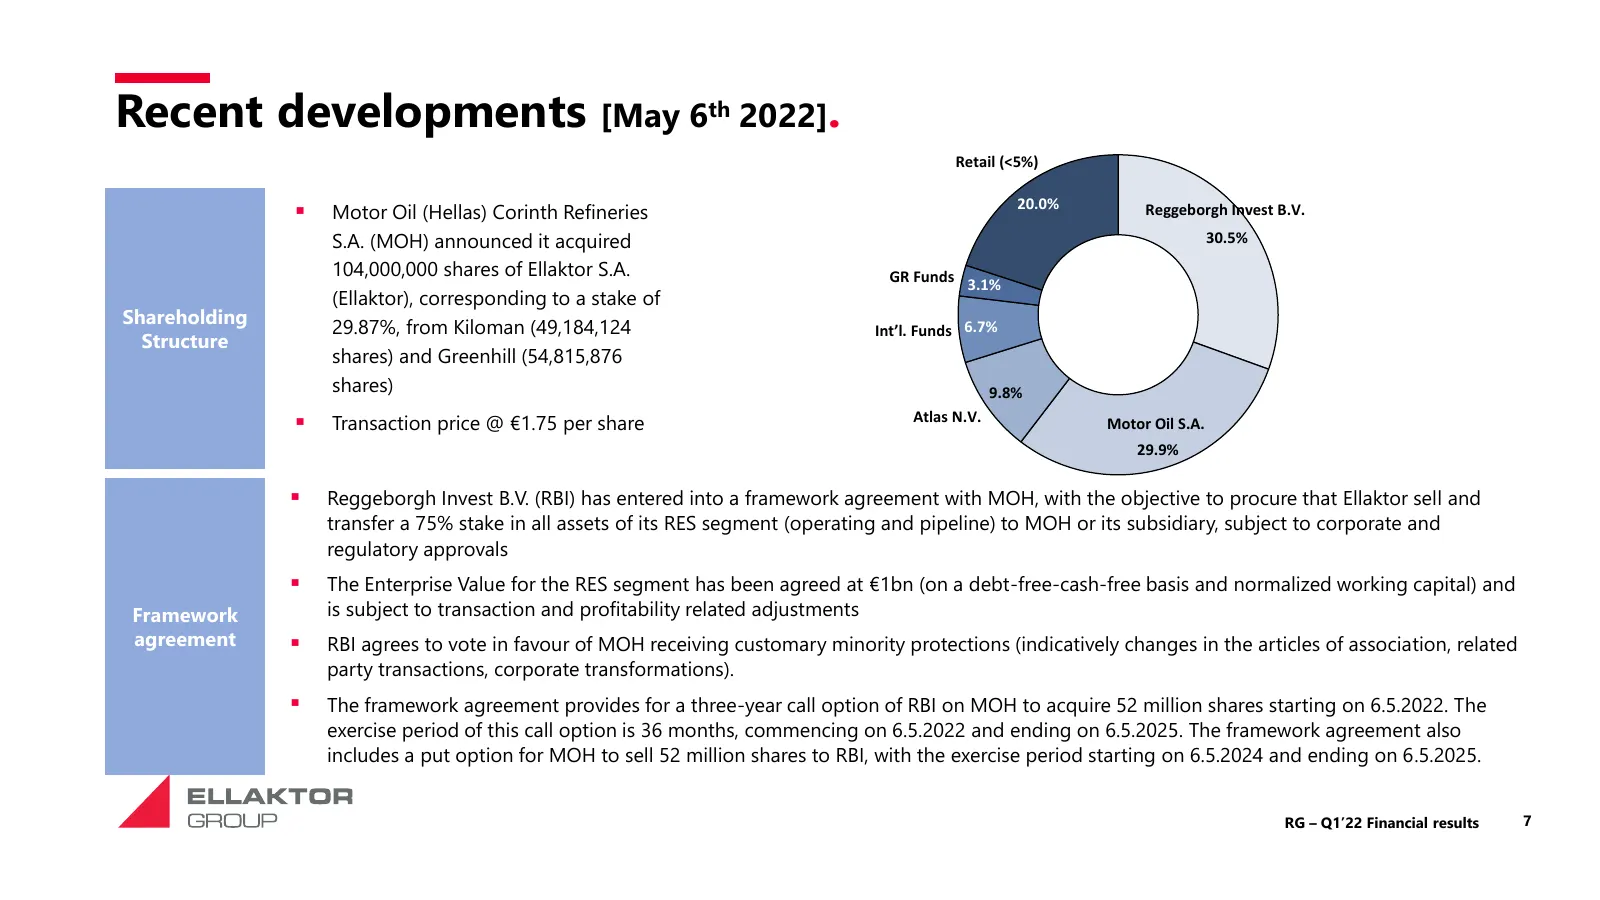
Recent developments [May 6th 2022]. Retail (<5%) 20.0% ▪ Motor Oil (Hellas) Corinth Refineries Reggeborgh Invest B.V. S.A. (MOH) announced it acquired 30.5% 104,000,000 shares of Ellaktor S.A. GR Funds 3.1% (Ellaktor), corresponding to a stake of Shareholding 29.87%, from Kiloman (49,184,124 Int’l.
Slide 8: Recent developments [May 6th 2022]
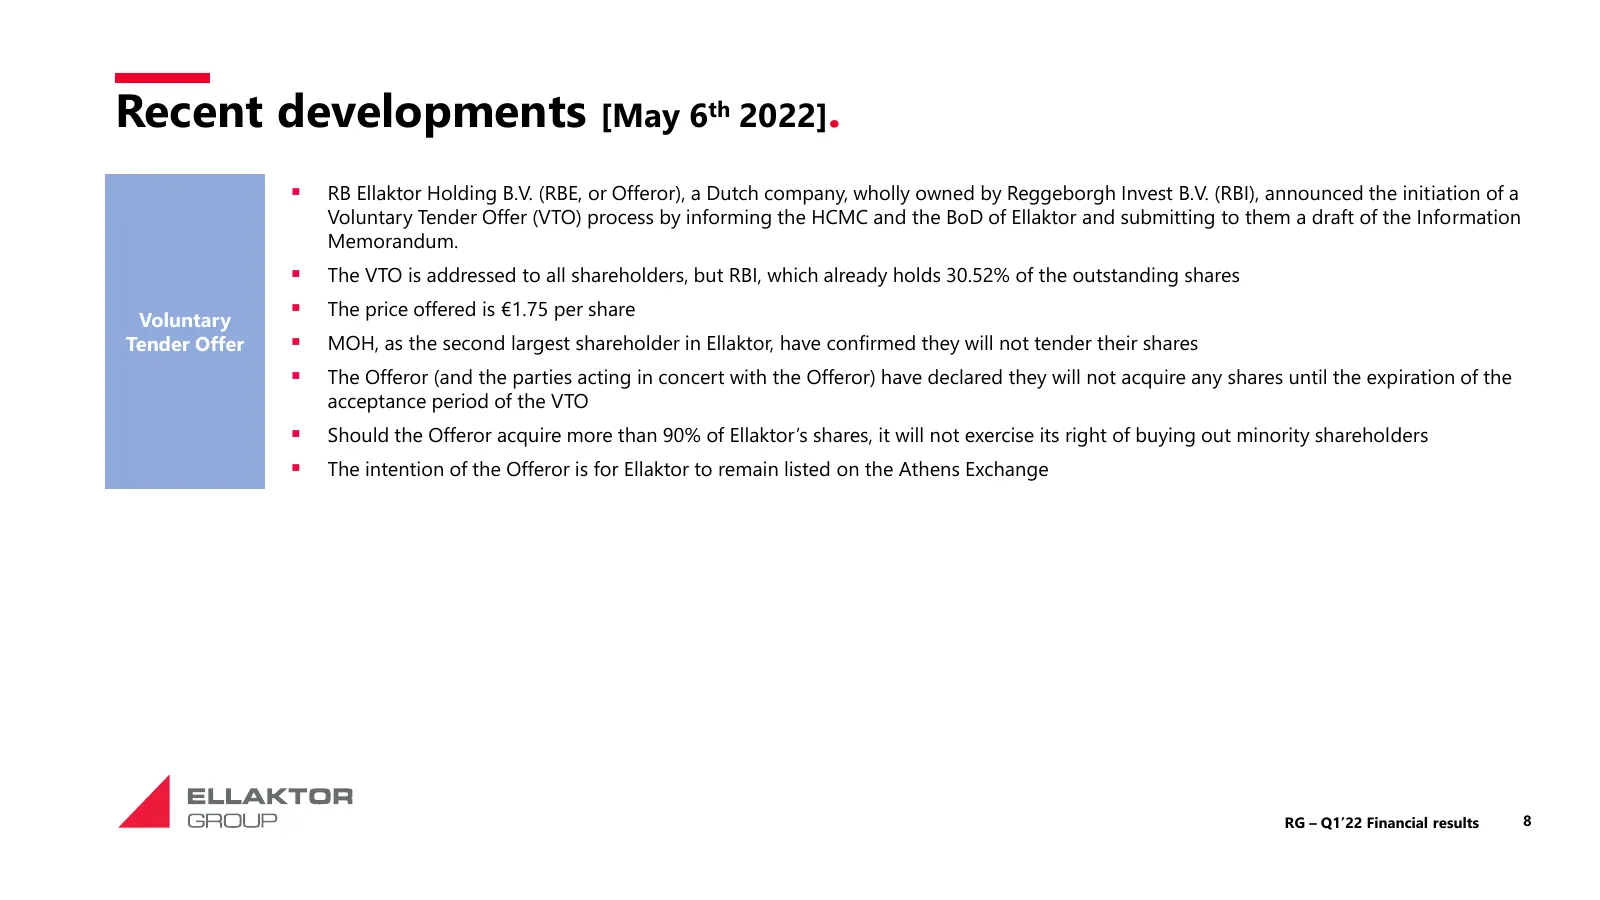
Recent developments [May 6th 2022]. ▪ RB Ellaktor Holding B.V. (RBE, or Offeror), a Dutch company, wholly owned by Reggeborgh Invest B.V. (RBI), announced the initiation of a Voluntary Tender Offer (VTO) process by informing the HCMC and the BoD of Ellaktor and submitting to them a draft of the Info
Slide 9: Update on Recent developments
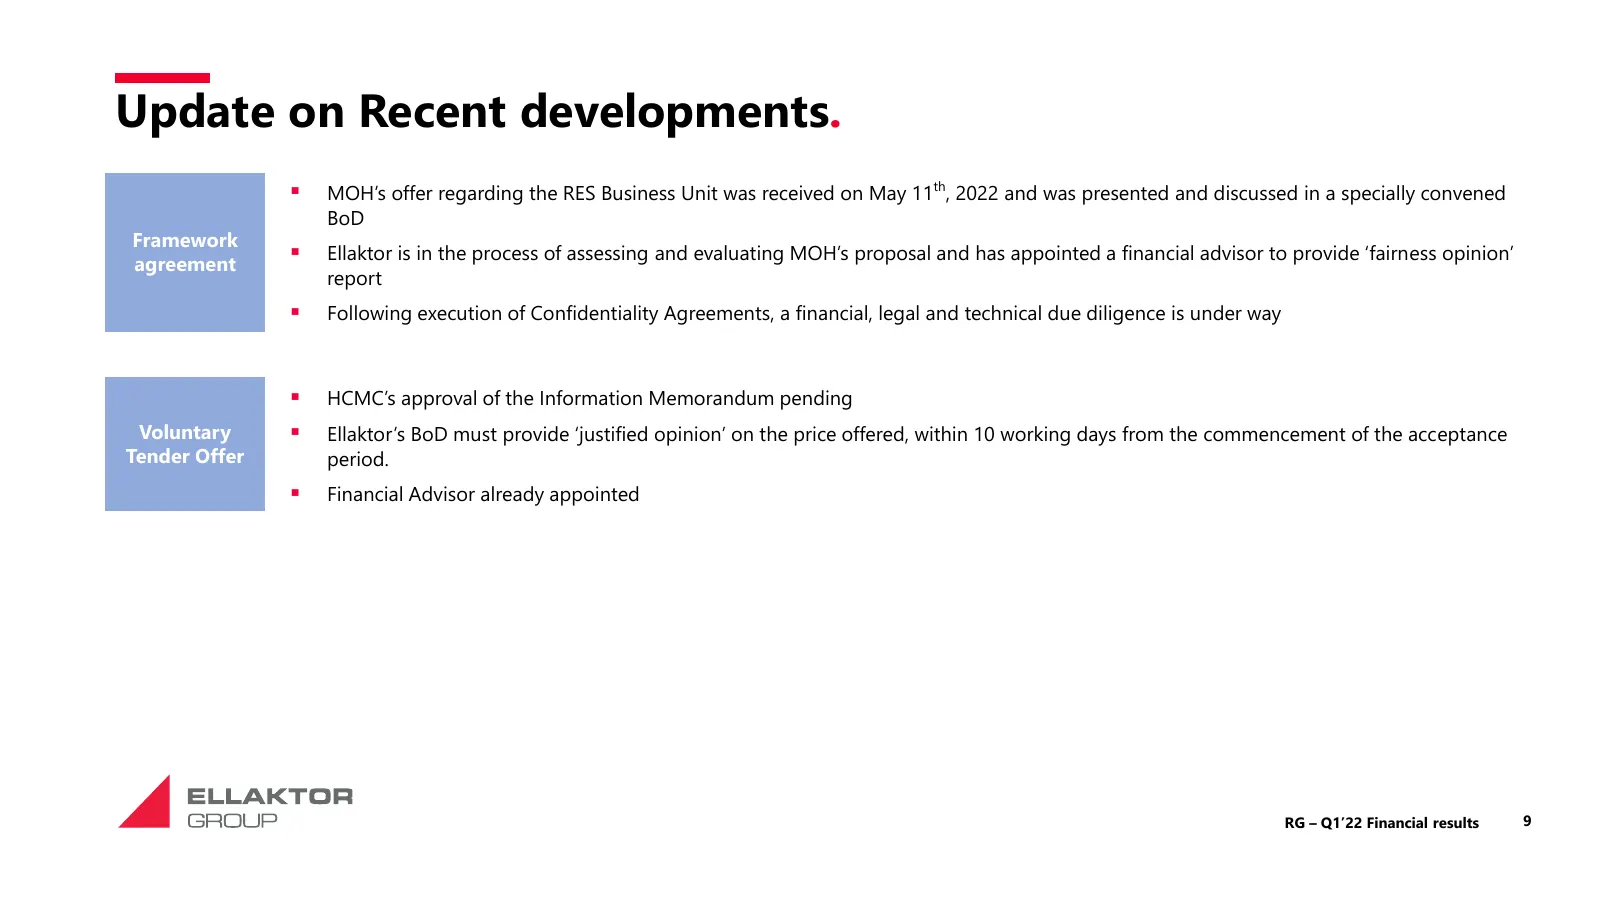
Update on Recent developments. ▪ MOH’s offer regarding the RES Business Unit was received on May 11th, 2022 and was presented and discussed in a specially convened BoD Framework ▪ Ellaktor is in the process of assessing and evaluating MOH’s proposal and has appointed a financial advisor to provide ‘
Slide 10: Sectoral Operational Update
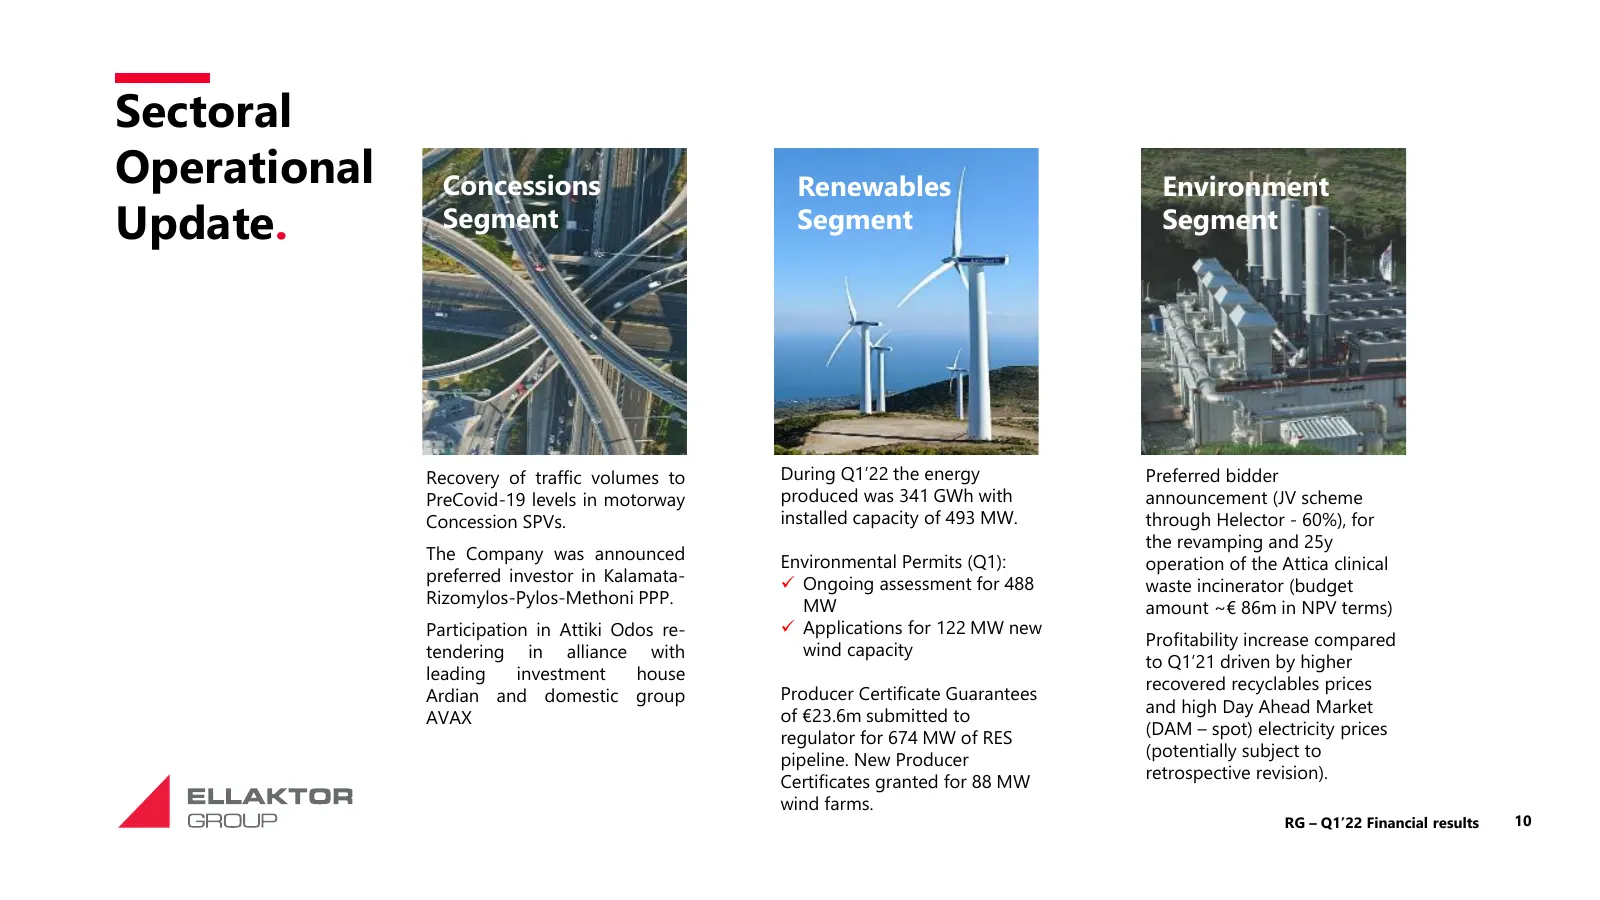
Sectoral Operational Concessions Renewables Environment Update. Segment Segment Segment Recovery of traffic volumes to During Q1’22 the energy Preferred bidder PreCovid-19 levels in motorway produced was 341 GWh with announcement (JV scheme Concession SPVs. installed capacity of 493 MW. through Hele
Slide 11: ESG Footprint
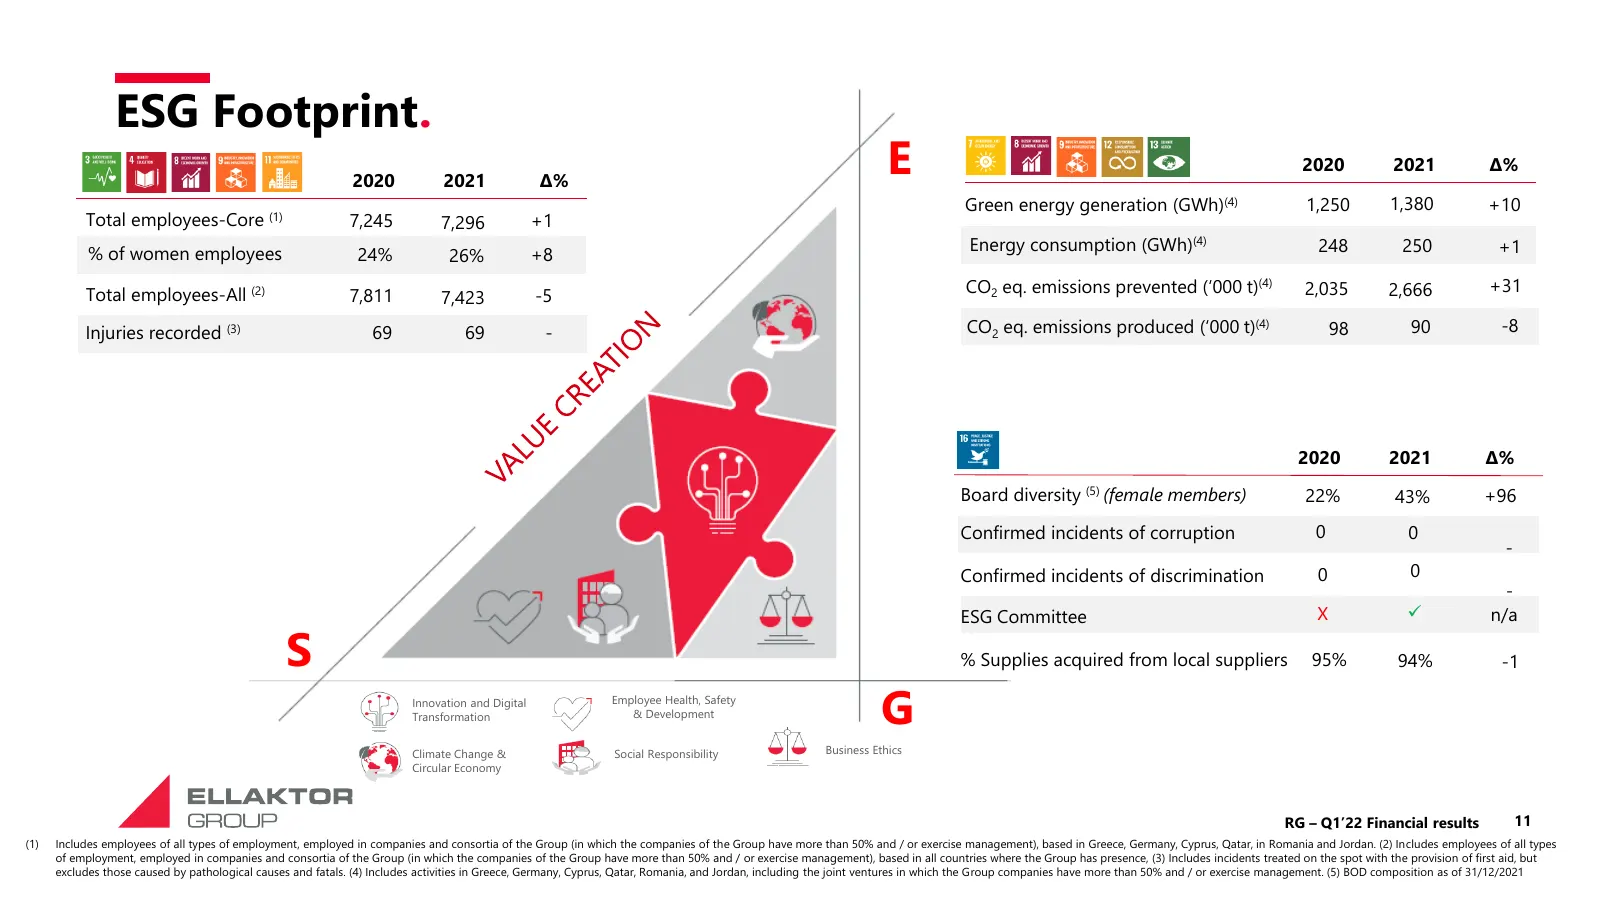
ESG Footprint. 2020 2021 Δ% E 2020 2021 Δ% Green energy generation (GWh)(4) 1,250 1,380 +10 Total employees-Core (1) 7,245 7,296 +1 % of women employees Energy consumption (GWh)(4) 248 250 +1 24% 26% +8 Total employees-All (2) CO2 eq. emissions prevented (‘000 t)(4) 2,035 2,666 +31 7,811 7,423 -5 In
Slide 12: 2. Key Financial Figures
2. Key Financial Figures 12
Slide 13: Consolidated P&L
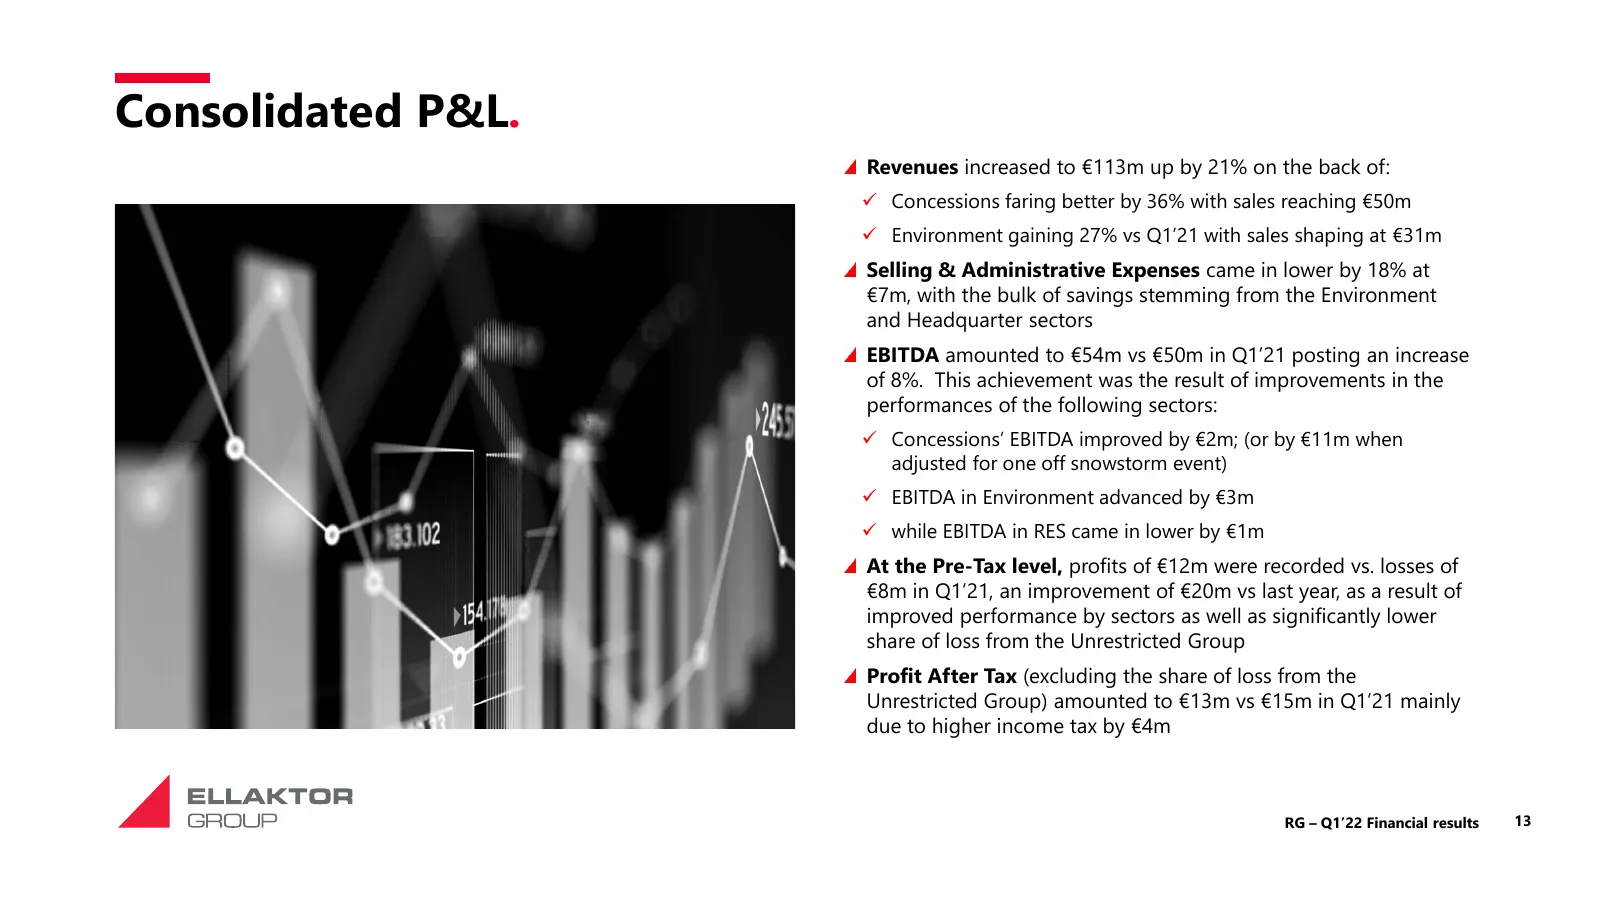
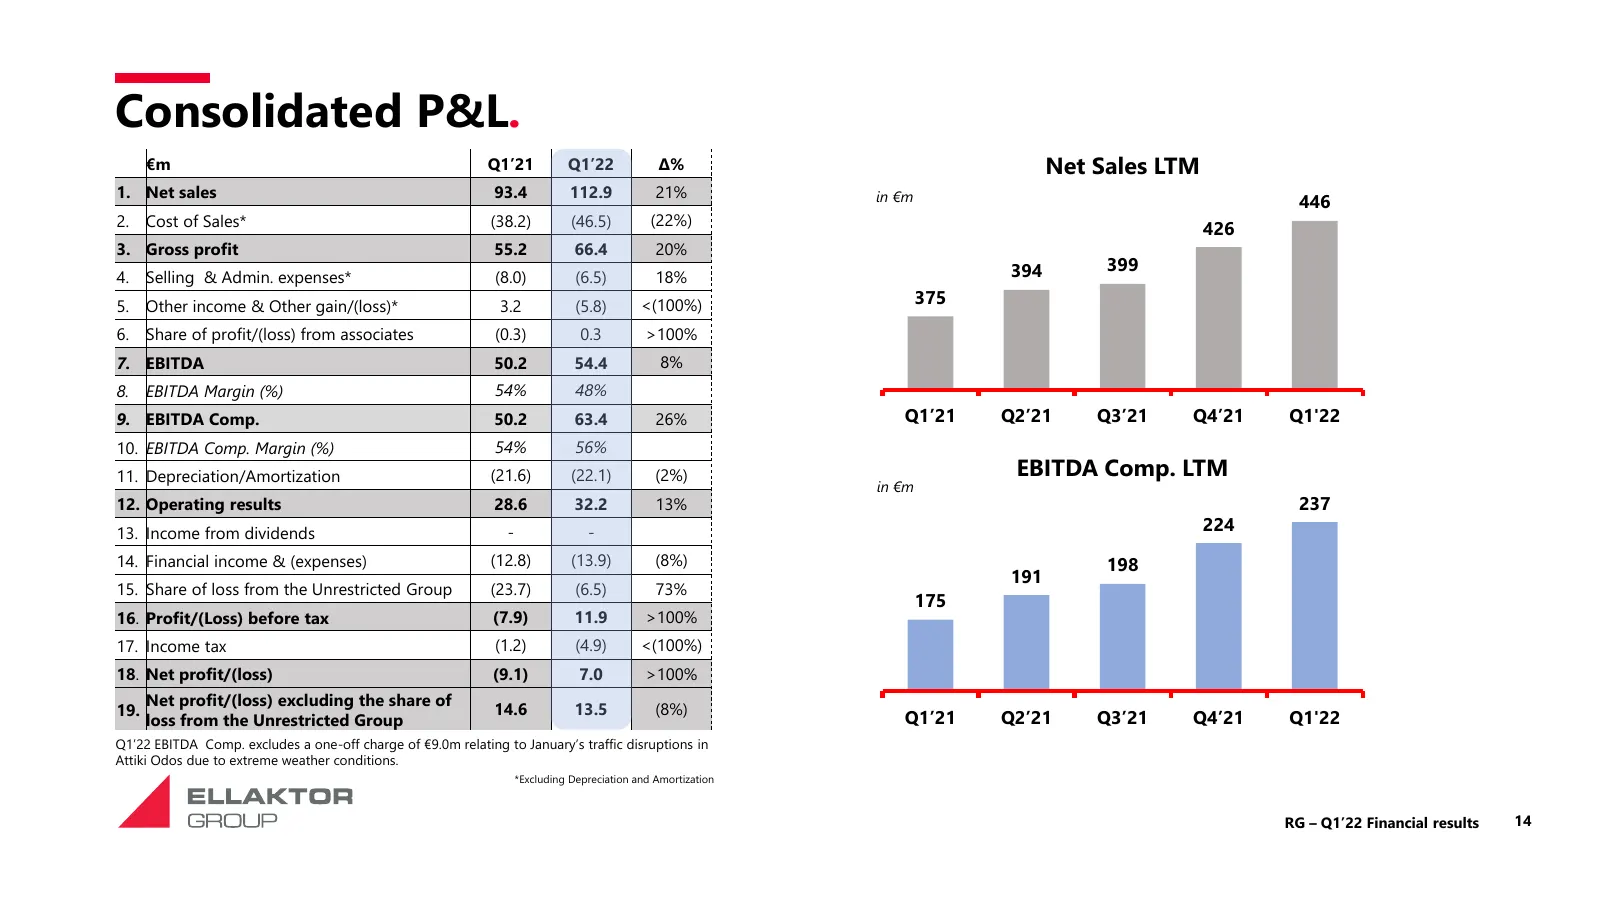
Consolidated P&L. Revenues increased to €113m up by 21% on the back of: ✓ Concessions faring better by 36% with sales reaching €50m ✓ Environment gaining 27% vs Q1’21 with sales shaping at €31m Selling & Administrative Expenses came in lower by 18% at €7m, with the bulk of savings stemming from the
Slide 14: Consolidated P&L
Consolidated P&L. €m Q1’21 Q1’22 Δ% Net Sales LTM 1. Net sales 93.4 112.9 21% in €m 446 2. Cost of Sales* (38.2) (46.5) (22%) 426 3. Gross profit 55.2 66.4 20% 394 399 4. Selling & Admin. expenses* (8.0) (6.5) 18% 5. Other income & Other gain/(loss)* 3.2 (5.8) <(100%) 375 6. Share of profit/(loss) f
Slide 15: Consolidated Balance Sheet
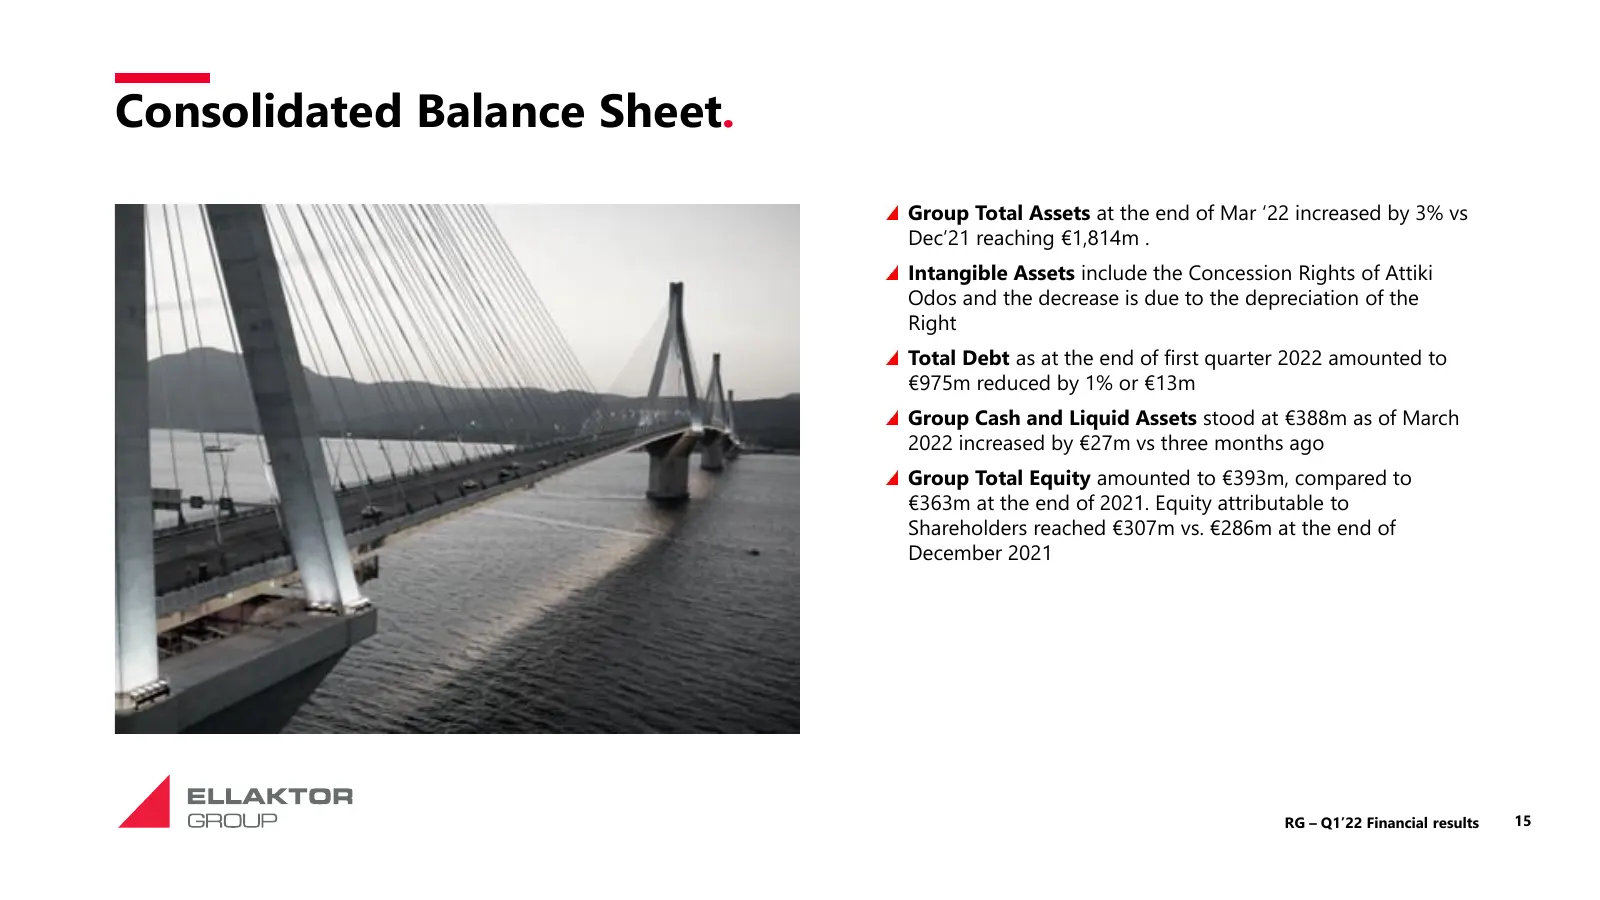
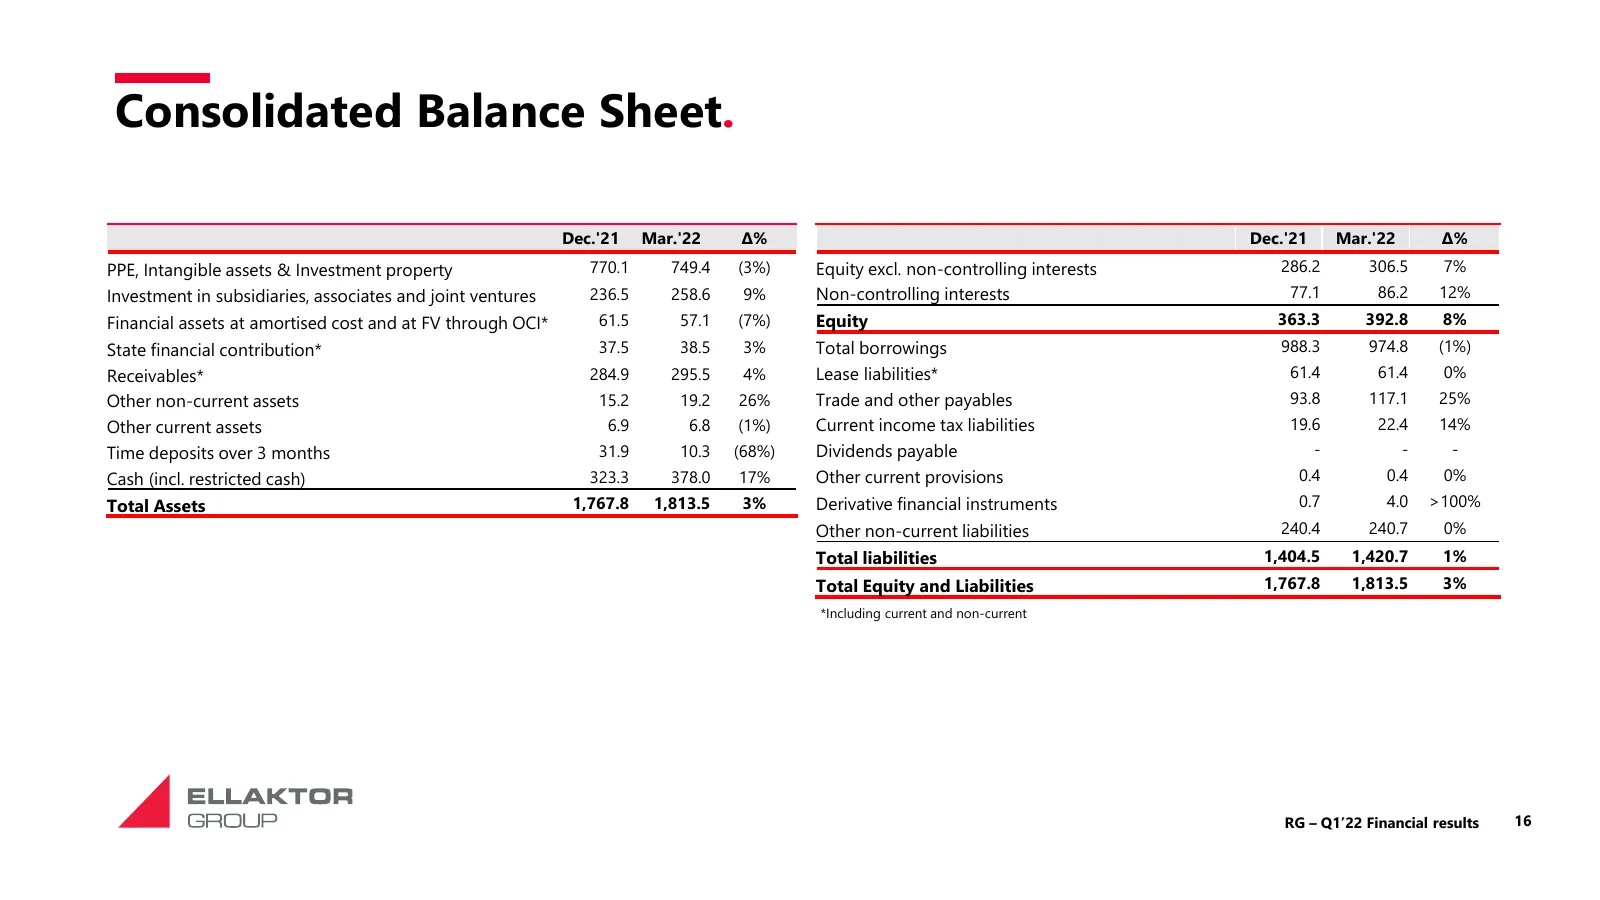
Consolidated Balance Sheet. Group Total Assets at the end of Mar ‘22 increased by 3% vs Dec’21 reaching €1,814m . Intangible Assets include the Concession Rights of Attiki Odos and the decrease is due to the depreciation of the Right Total Debt as at the end of first quarter 2022 amounted to €975m r
Slide 16: Consolidated Balance Sheet
Consolidated Balance Sheet. Dec.'21 Mar.'22 Δ% Dec.'21 Mar.'22 Δ% PPE, Intangible assets & Investment property 770.1 749.4 (3%) Equity excl. non-controlling interests 286.2 306.5 7% Investment in subsidiaries, associates and joint ventures 236.5 258.6 9% Non-controlling interests 77.1 86.2 12% Finan
Slide 17: Net Debt and Liquidity
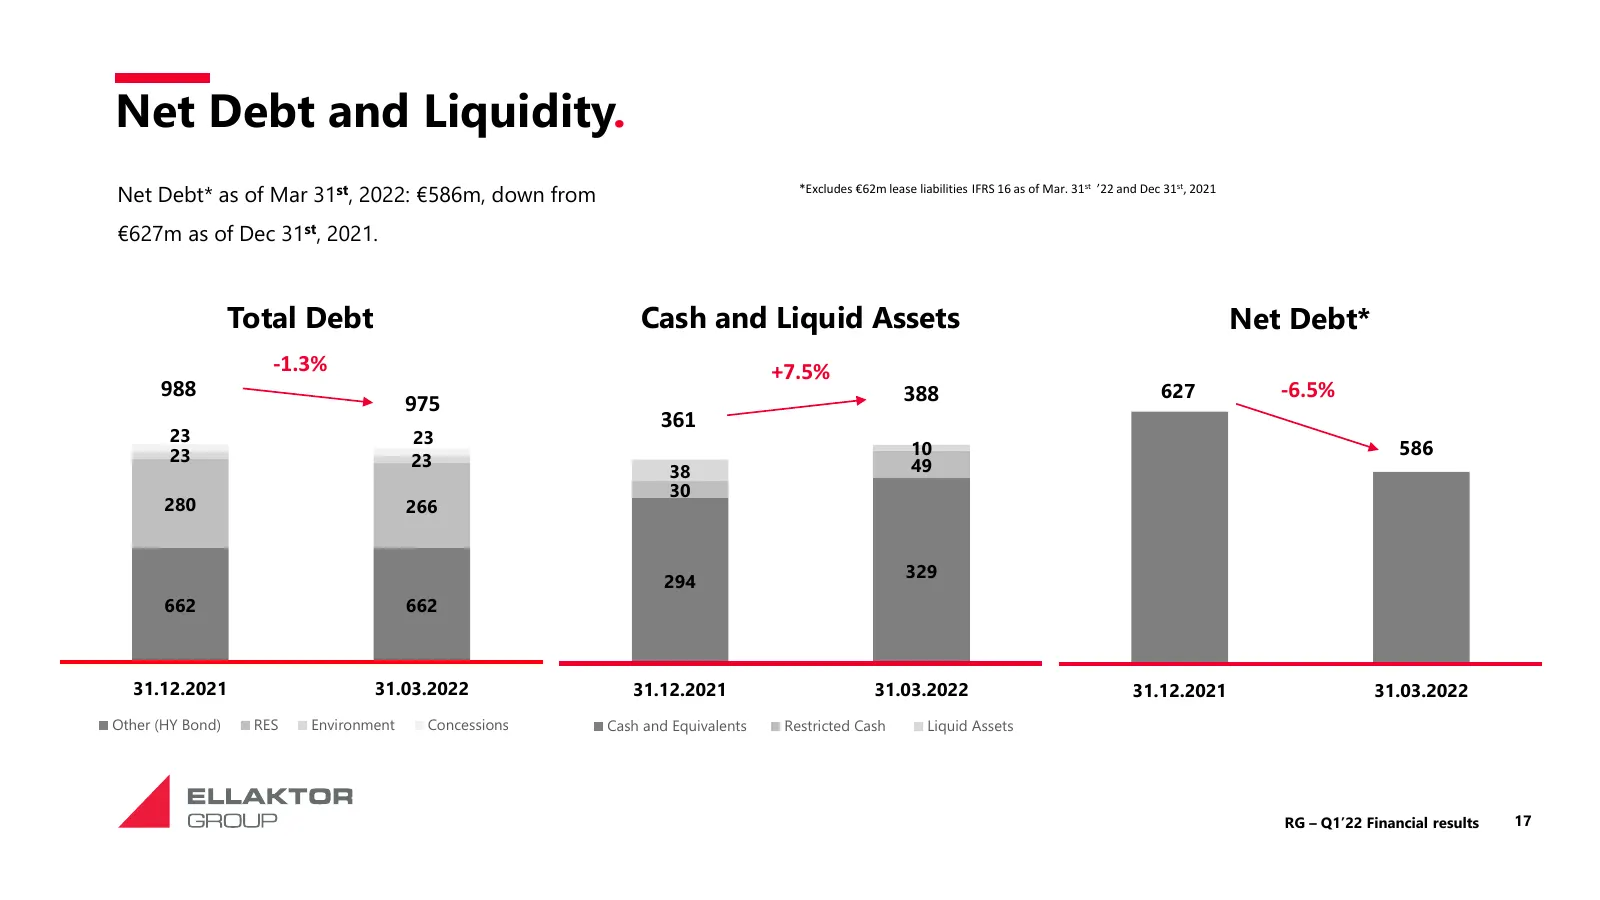
Net Debt and Liquidity. Net Debt* as of Mar 31st, 2022: €586m, down from *Excludes €62m lease liabilities IFRS 16 as of Mar. 31st ’22 and Dec 31st, 2021 €627m as of Dec 31st, 2021. Total Debt Cash and Liquid Assets Net Debt* -1.3% +7.5% 988 388 627 -6.5% 975 361 23 23 23 10 586 23 49 38 30 280 266 3
Slide 18: Consolidated Cash Flow
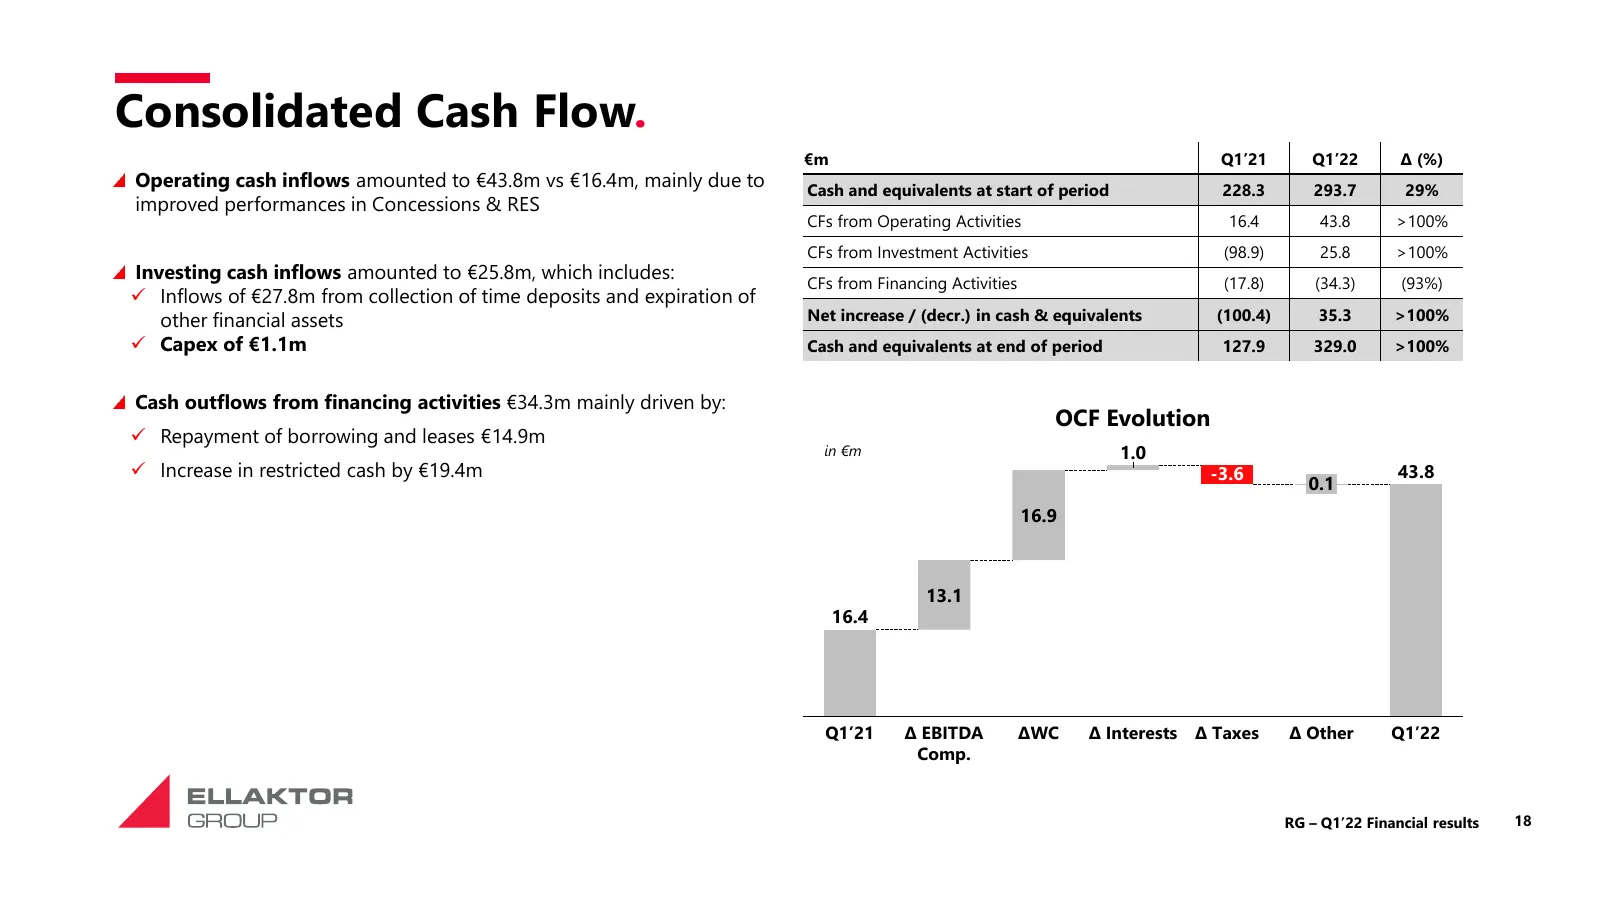
Consolidated Cash Flow. €m Q1’21 Q1’22 Δ (%) Operating cash inflows amounted to €43.8m vs €16.4m, mainly due to Cash and equivalents at start of period 228.3 293.7 29% improved performances in Concessions & RES CFs from Operating Activities 16.4 43.8 >100% CFs from Investment Activities (98.9) 25.8
Slide 19: 3. Performance by Segment
3. Performance by Segment RG – Q1’22 Financial results 19
Slide 20: A. Concessions
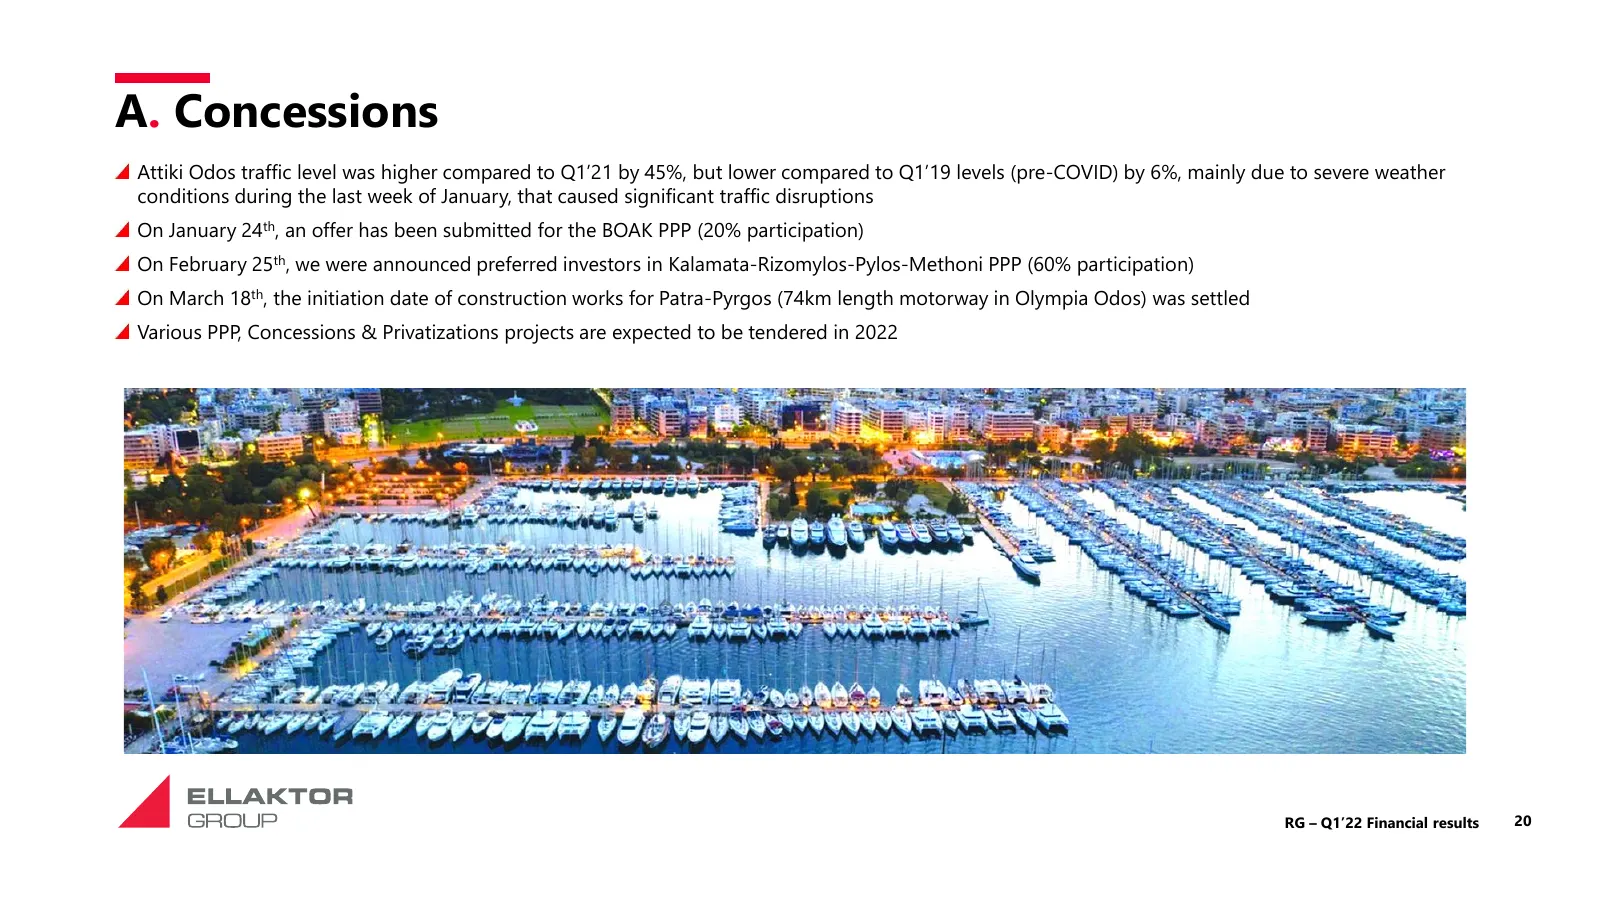
A. Concessions Attiki Odos traffic level was higher compared to Q1’21 by 45%, but lower compared to Q1’19 levels (pre-COVID) by 6%, mainly due to severe weather conditions during the last week of January, that caused significant traffic disruptions On January 24th, an offer has been submitted for th
Slide 21: A. Concessions
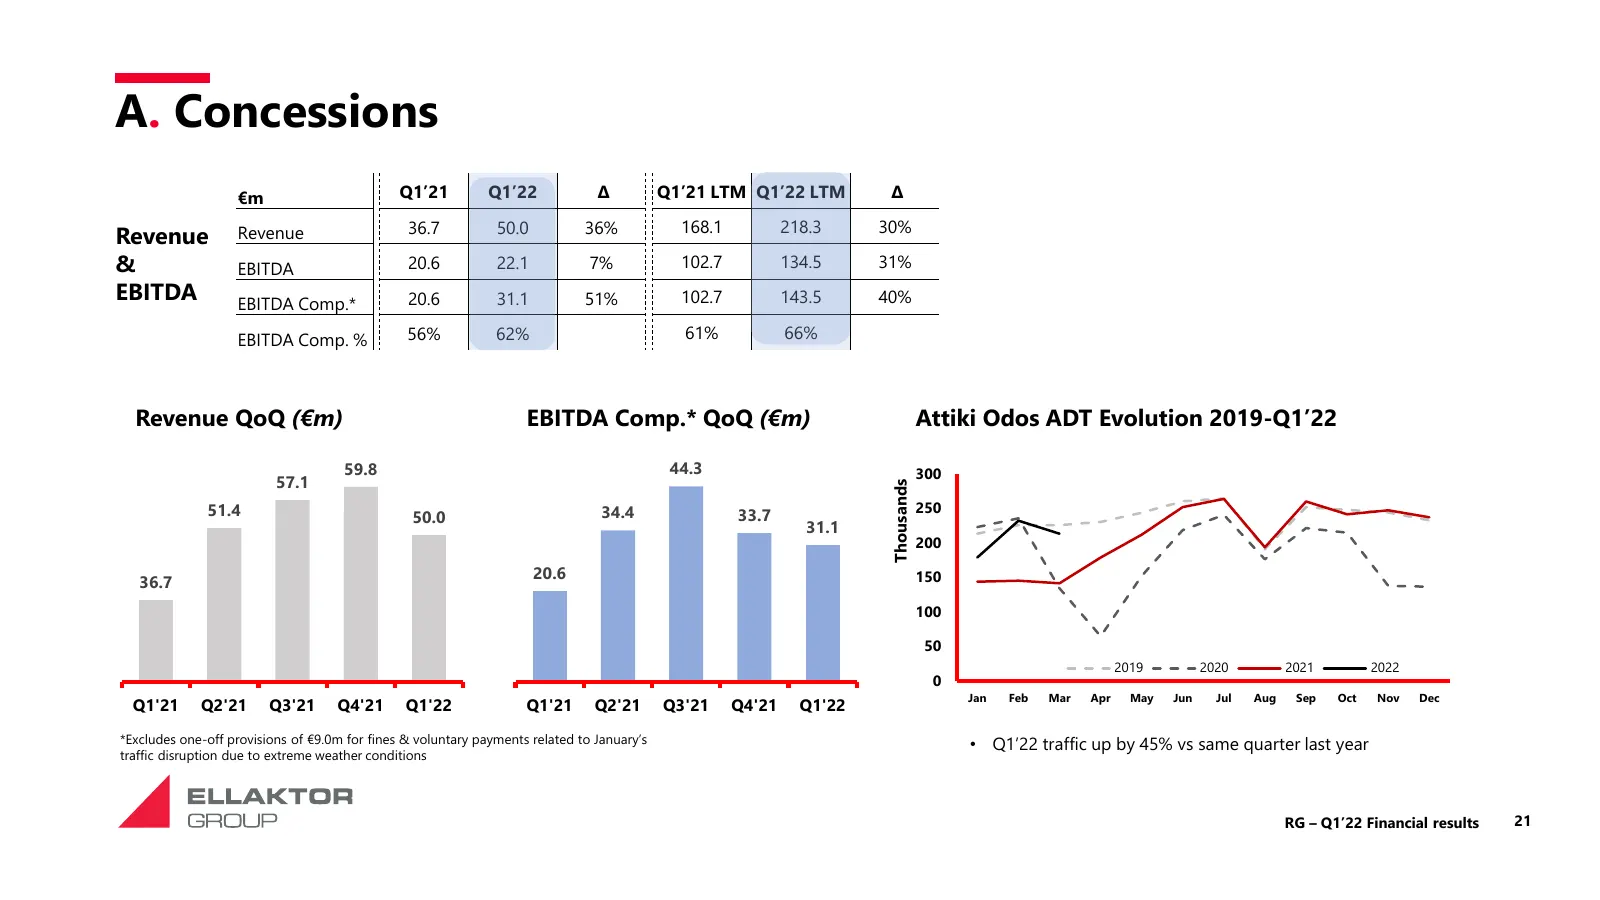
A. Concessions €m Q1’21 Q1’22 Δ Q1’21 LTM Q1’22 LTM Δ 36.7 50.0 36% 168.1 218.3 30% Revenue Revenue & EBITDA 20.6 22.1 7% 102.7 134.5 31% EBITDA EBITDA Comp.* 20.6 31.1 51% 102.7 143.5 40% EBITDA Comp. % 56% 62% 61% 66% Revenue QoQ (€m) EBITDA Comp.* QoQ (€m) Attiki Odos ADT Evolution 2019-Q1’22 59.
Slide 22: B. Renewable Energy Sources
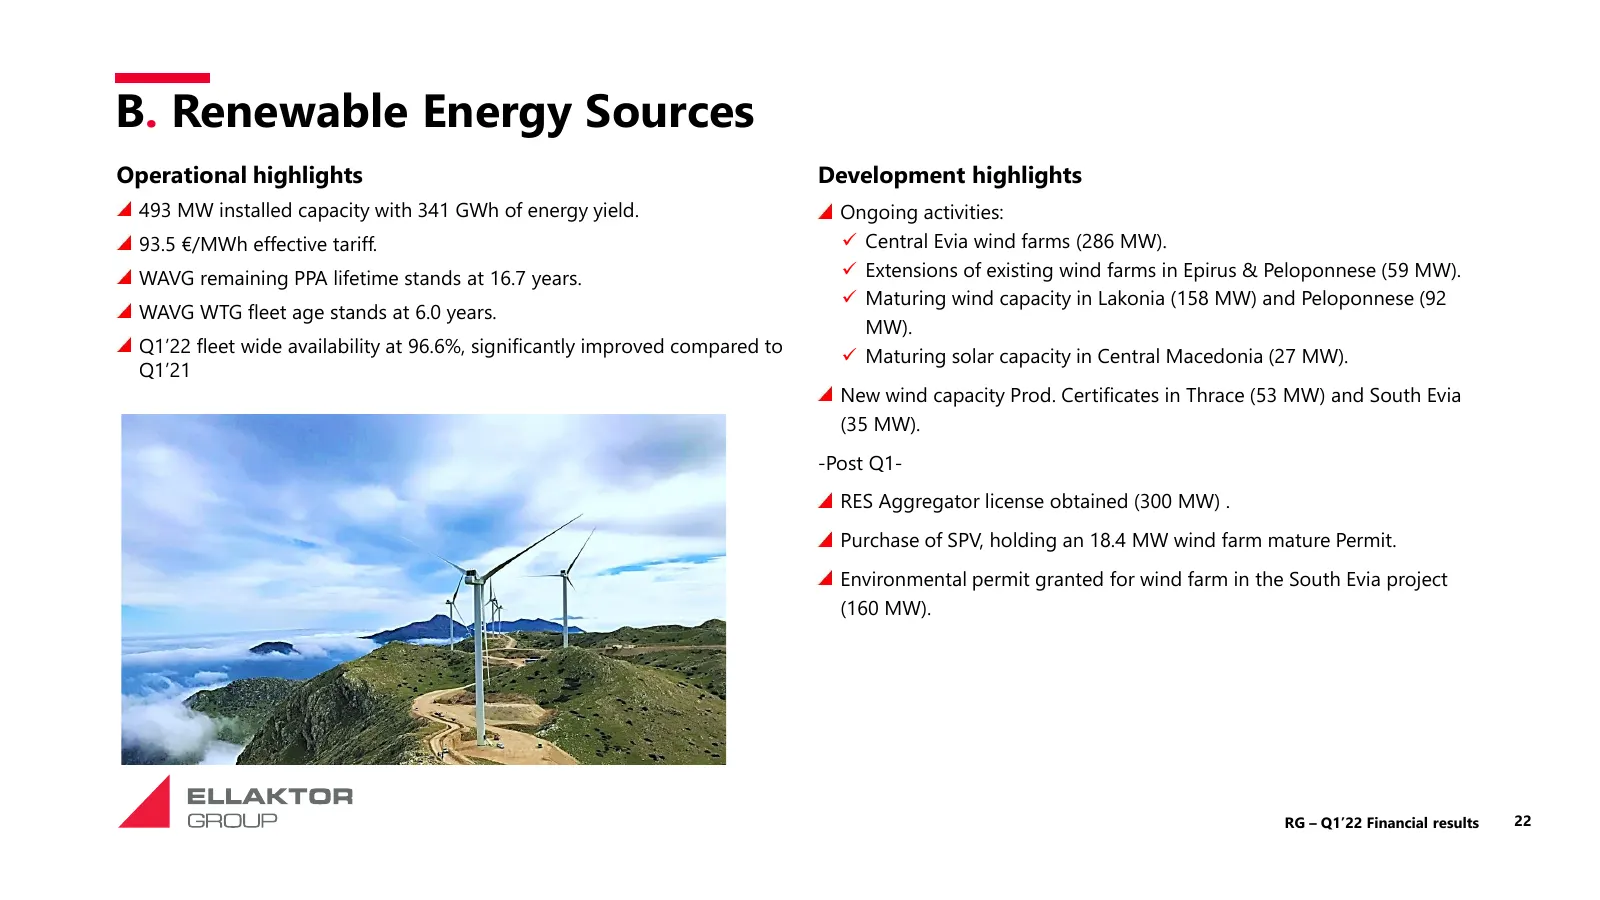
B. Renewable Energy Sources Operational highlights Development highlights 493 MW installed capacity with 341 GWh of energy yield. Ongoing activities: 93.5 €/MWh effective tariff. ✓ Central Evia wind farms (286 MW). WAVG remaining PPA lifetime stands at 16.7 years. ✓ Extensions of existing wind farms
Slide 23: B. Renewable Energy Sources
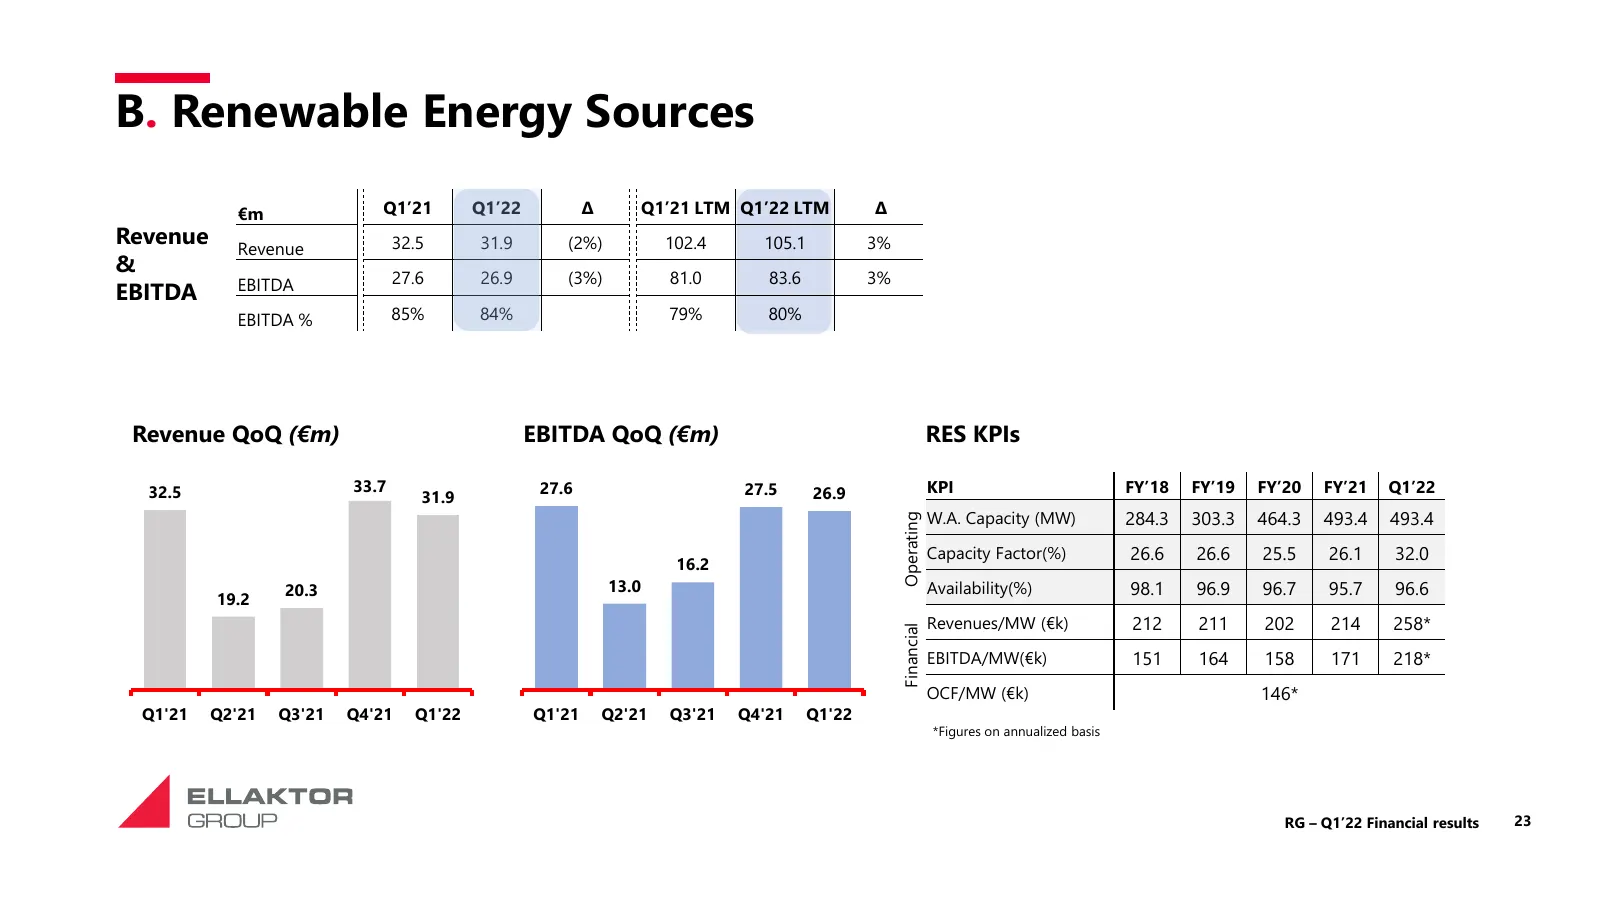
B. Renewable Energy Sources €m Q1’21 Q1’22 Δ Q1’21 LTM Q1’22 LTM Δ Revenue Revenue 32.5 31.9 (2%) 102.4 105.1 3% & EBITDA 27.6 26.9 (3%) 81.0 83.6 3% EBITDA EBITDA % 85% 84% 79% 80% Revenue QoQ (€m) EBITDA QoQ (€m) RES KPIs 32.5 33.7 27.6 27.5 26.9 KPI FY’18 FY’19 FY’20 FY’21 Q1’22 31.9 W.A. Capacit
Slide 24: C. Environment
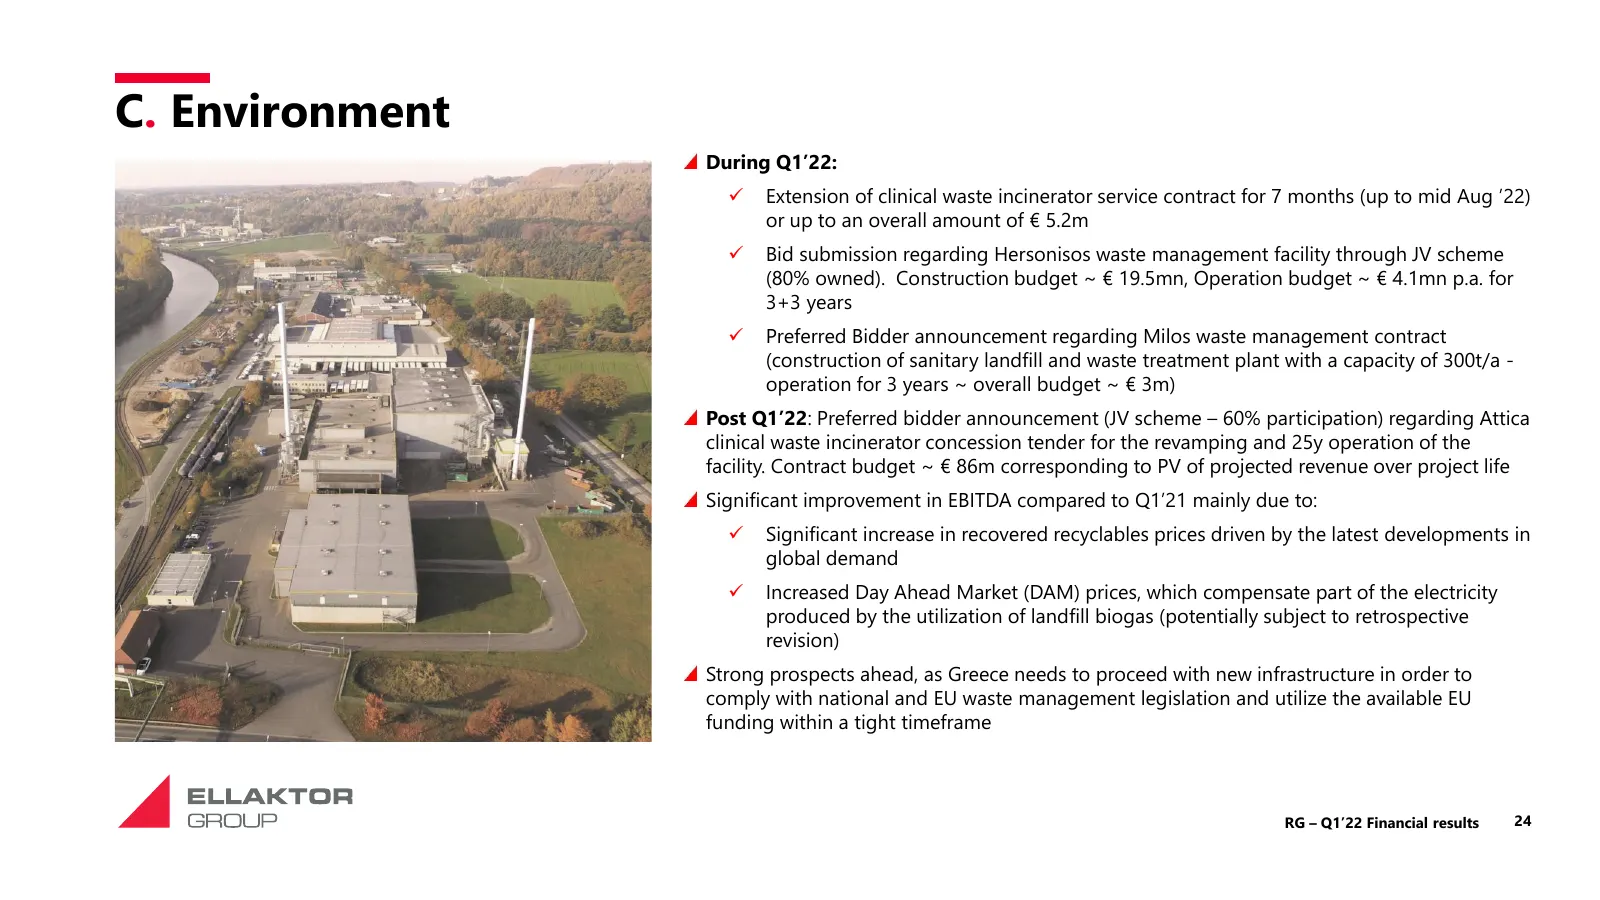
C. Environment During Q1’22: ✓ Extension of clinical waste incinerator service contract for 7 months (up to mid Aug ’22) or up to an overall amount of € 5.2m ✓ Bid submission regarding Hersonisos waste management facility through JV scheme (80% owned). Construction budget ~ € 19.5mn, Operation budge
Slide 25: C. Environment
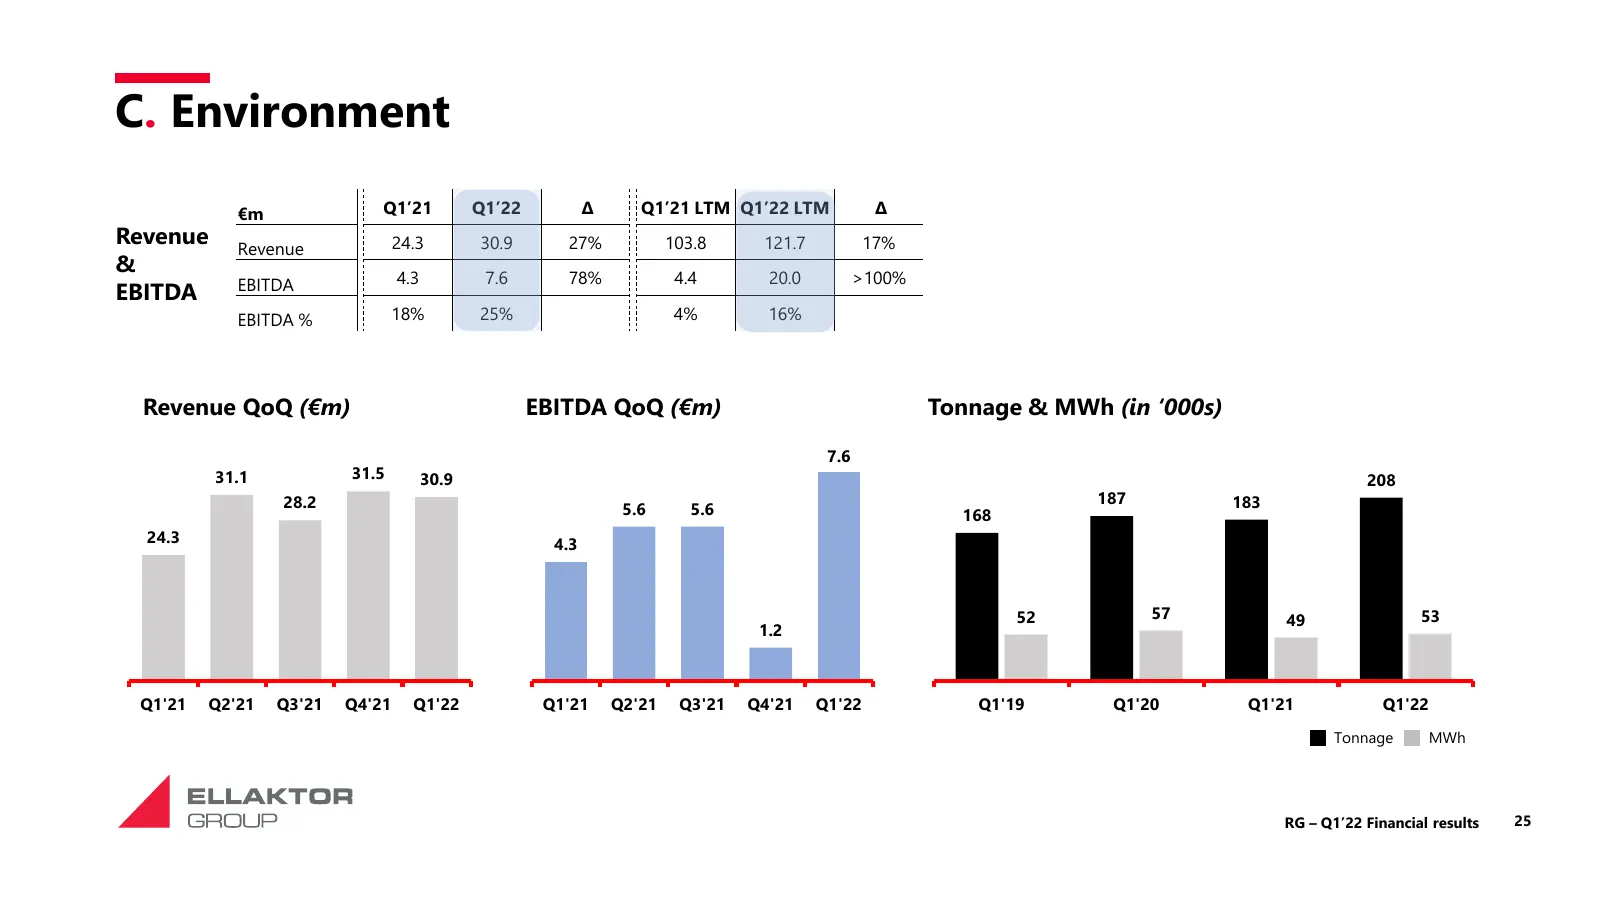
C. Environment €m Q1’21 Q1’22 Δ Q1’21 LTM Q1’22 LTM Δ Revenue Revenue 24.3 30.9 27% 103.8 121.7 17% & EBITDA 4.3 7.6 78% 4.4 20.0 >100% EBITDA EBITDA % 18% 25% 4% 16% Revenue QoQ (€m) EBITDA QoQ (€m) Tonnage & MWh (in ‘000s) 7.6 31.1 31.5 30.9 208 28.2 187 183 5.6 5.6 168 24.3 4.3 52 57 49 53 1.2 Q1
Slide 26: 4. Appendix
4. Appendix RG – Q1’22 Financial results 26
Slide 27: P&L by Segment Q1 2022
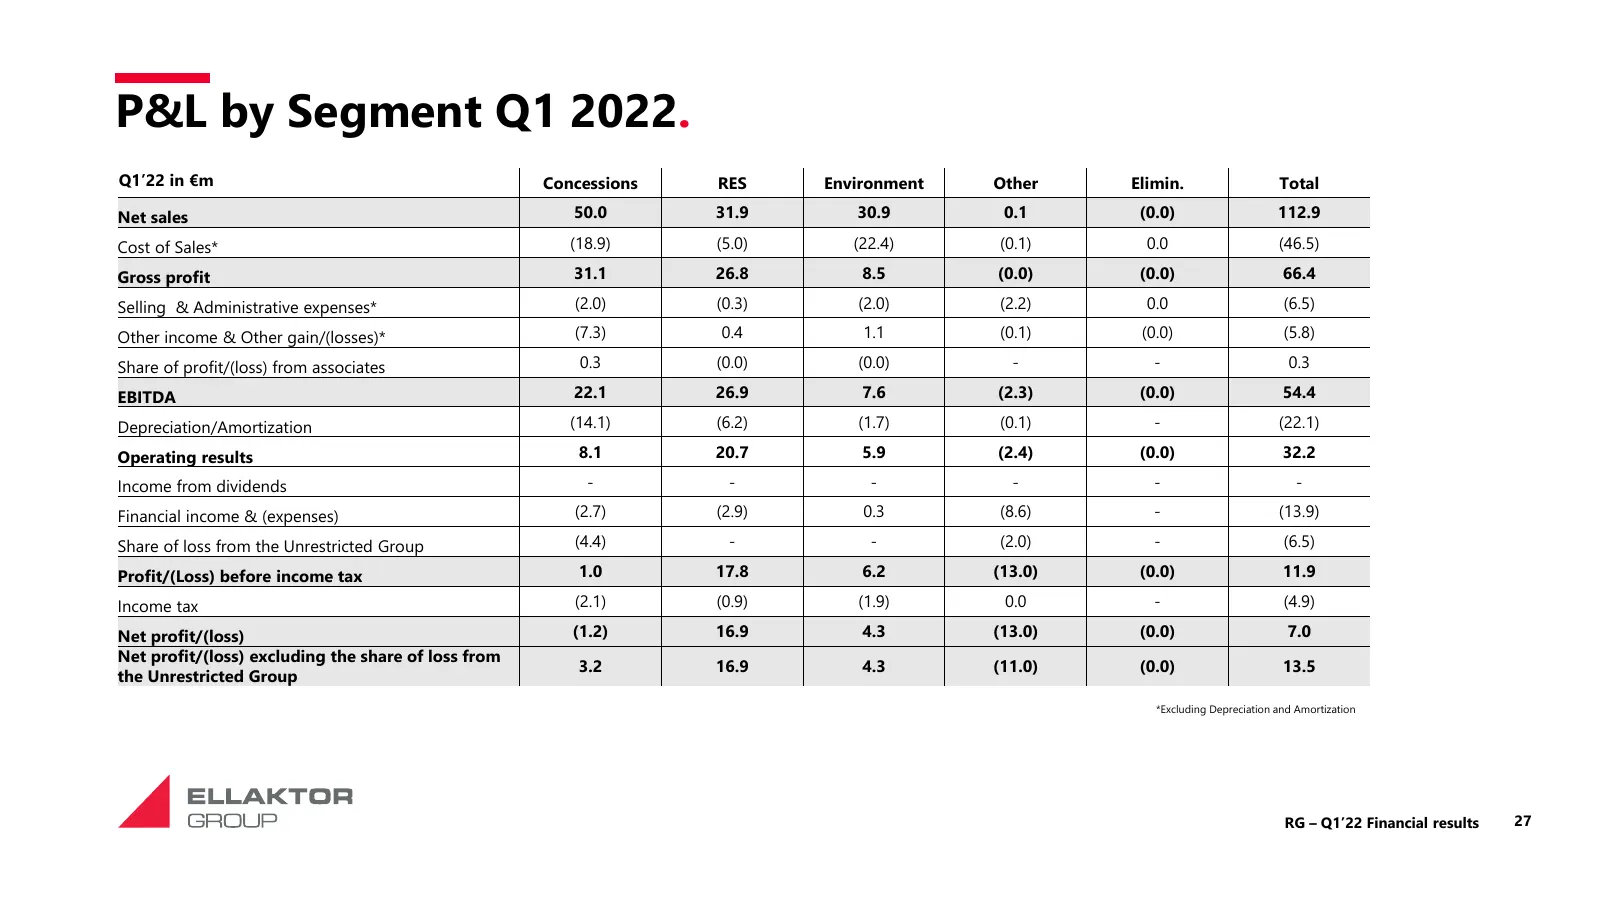
P&L by Segment Q1 2022. Q1’22 in €m Concessions RES Environment Other Elimin. Total Net sales 50.0 31.9 30.9 0.1 (0.0) 112.9 Cost of Sales* (18.9) (5.0) (22.4) (0.1) 0.0 (46.5) Gross profit 31.1 26.8 8.5 (0.0) (0.0) 66.4 Selling & Administrative expenses* (2.0) (0.3) (2.0) (2.2) 0.0 (6.5) Other inco
Slide 28: P&L by Segment Q1 2021
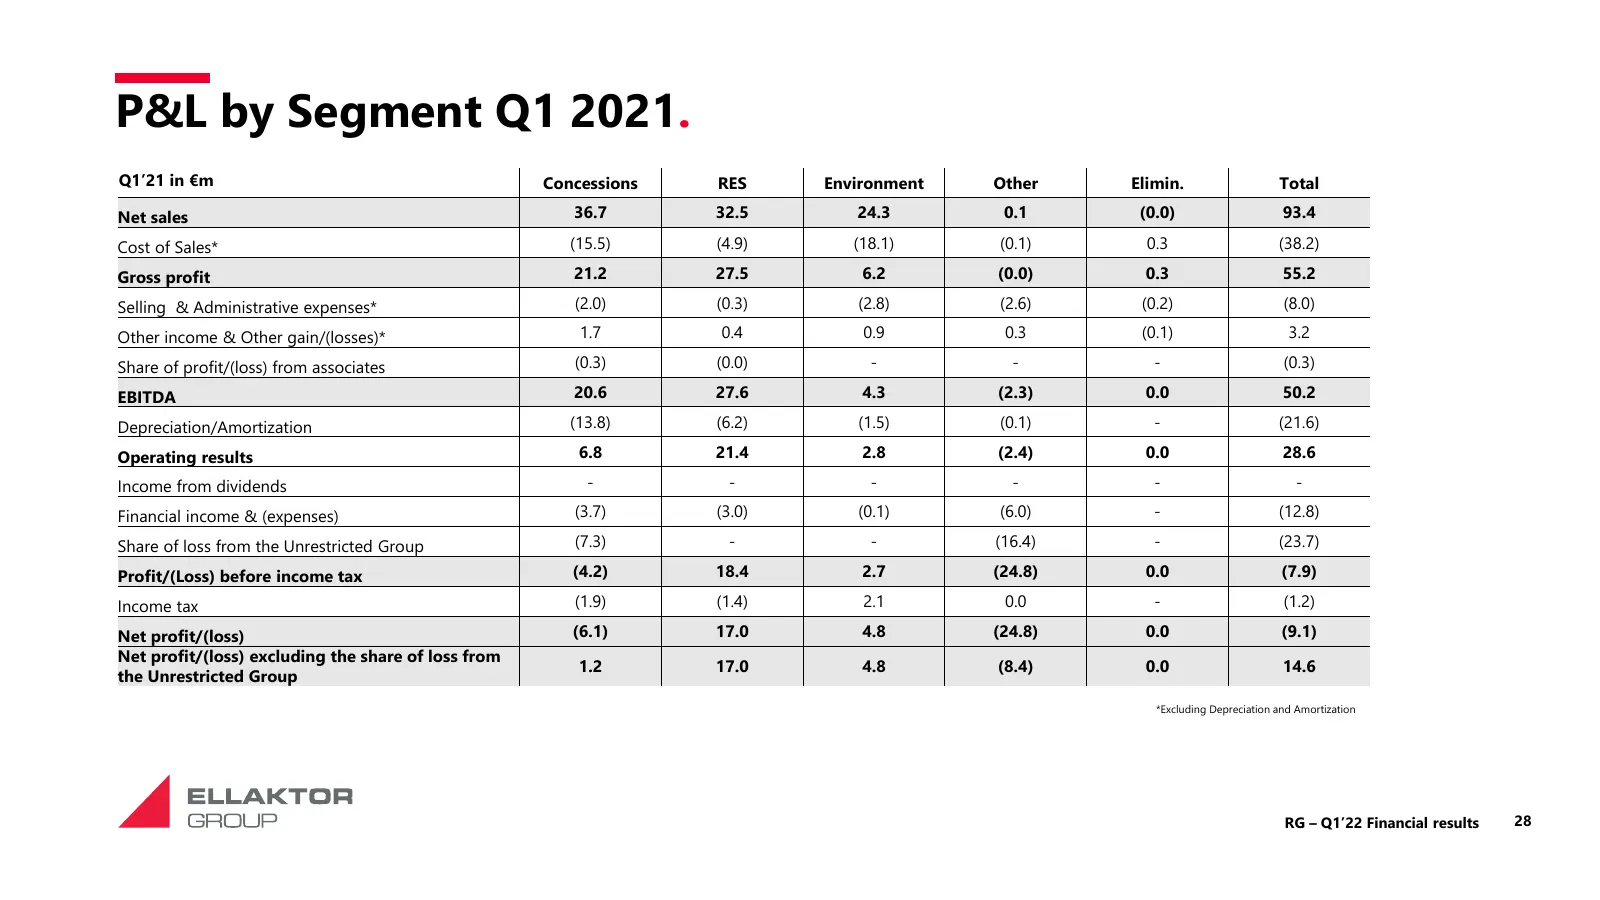
P&L by Segment Q1 2021. Q1’21 in €m Concessions RES Environment Other Elimin. Total Net sales 36.7 32.5 24.3 0.1 (0.0) 93.4 Cost of Sales* (15.5) (4.9) (18.1) (0.1) 0.3 (38.2) Gross profit 21.2 27.5 6.2 (0.0) 0.3 55.2 Selling & Administrative expenses* (2.0) (0.3) (2.8) (2.6) (0.2) (8.0) Other incom
Slide 29: Net Debt by Segment
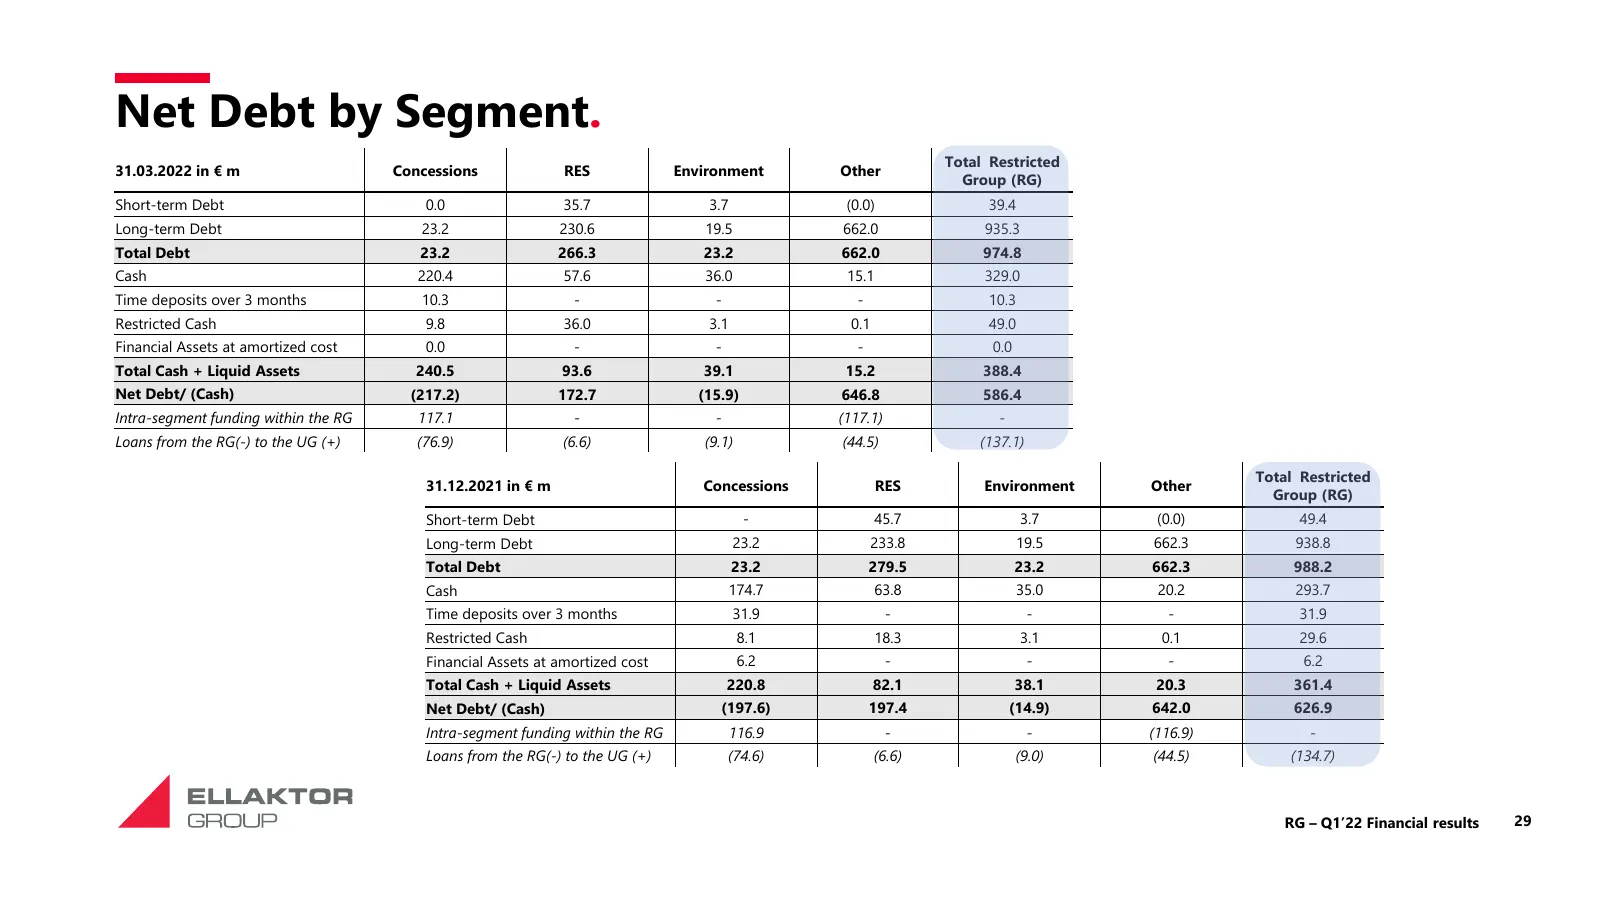
Net Debt by Segment. Total Restricted 31.03.2022 in € m Concessions RES Environment Other Group (RG) Short-term Debt 0.0 35.7 3.7 (0.0) 39.4 Long-term Debt 23.2 230.6 19.5 662.0 935.3 Total Debt 23.2 266.3 23.2 662.0 974.8 Cash 220.4 57.6 36.0 15.1 329.0 Time deposits over 3 months 10.3 - - - 10.3 R
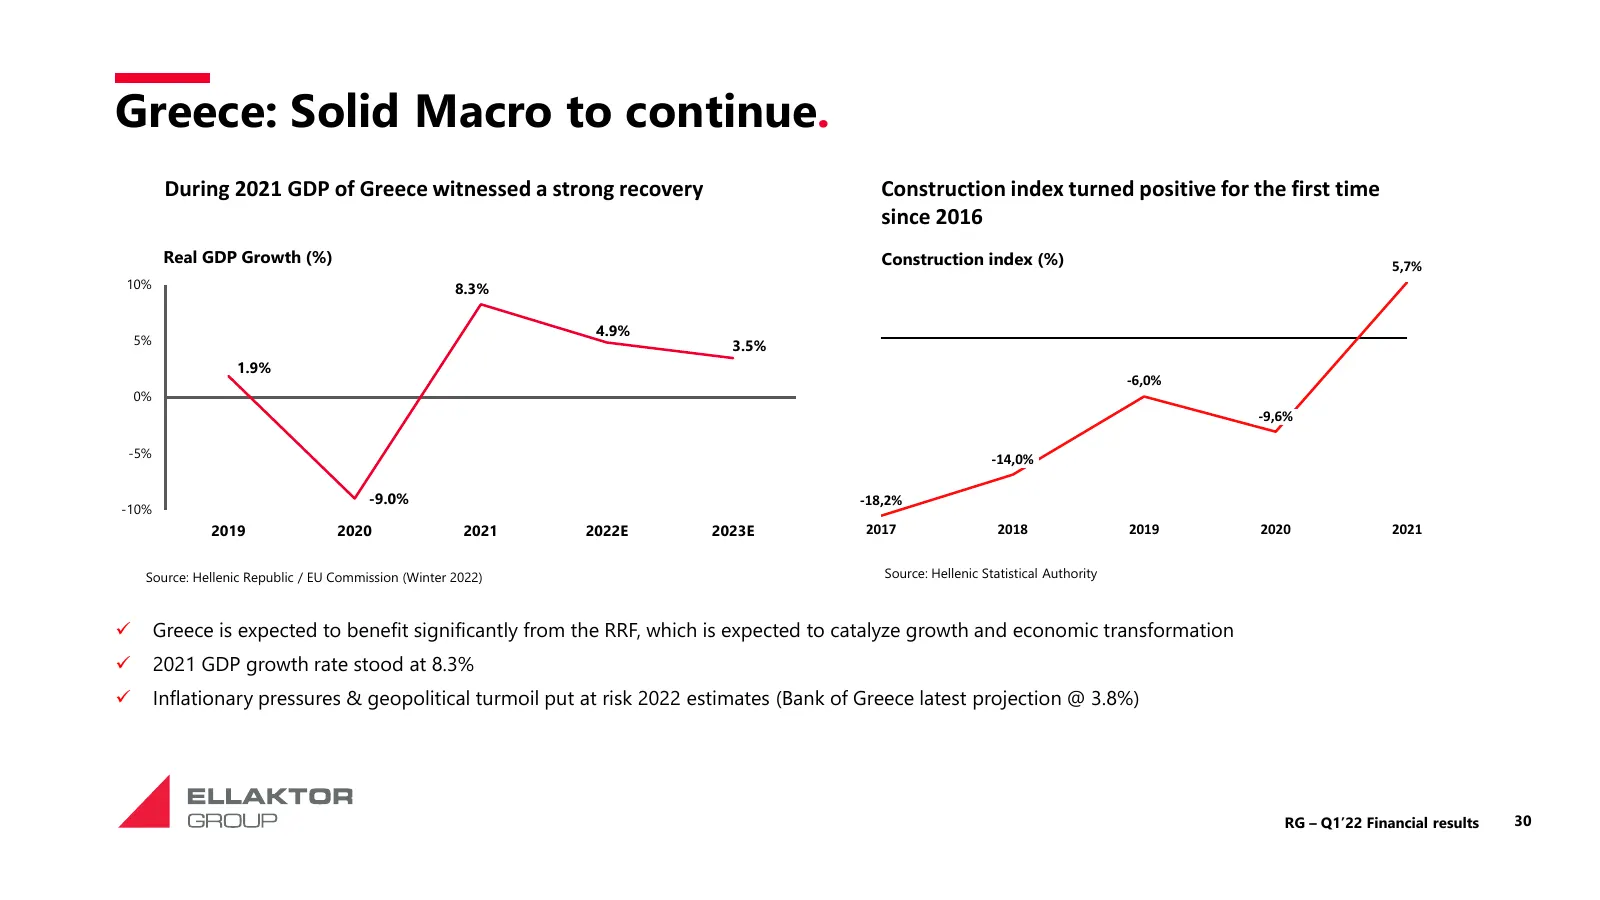
Slide 30: Greece: Solid Macro to continue
Greece: Solid Macro to continue. During 2021 GDP of Greece witnessed a strong recovery Construction index turned positive for the first time since 2016 Real GDP Growth (%) Construction index (%) 5,7% 10% 8.3% 4.9% 5% 3.5% 1.9% -6,0% 0% -9,6% -5% -14,0% -9.0% -18,2% -10% 2019 2020 2021 2022E 2023E 20
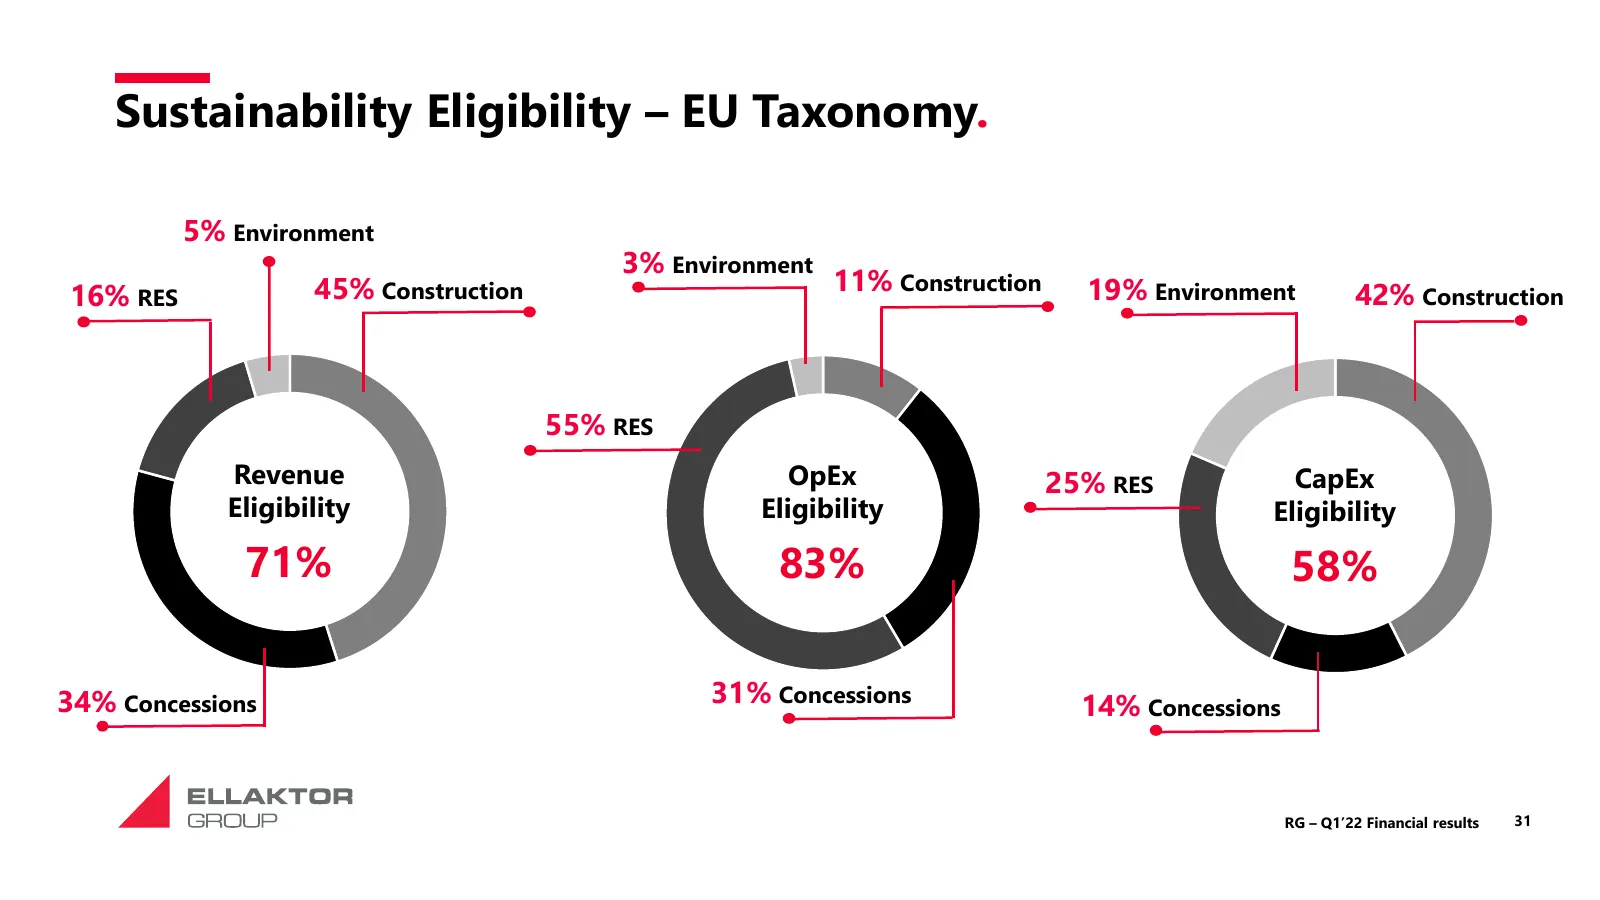
Slide 31: Sustainability Eligibility – EU Taxonomy
Sustainability Eligibility – EU Taxonomy. 5% Environment 3% Environment 16% RES 45% Construction 11% Construction 19% Environment 42% Construction 55% RES Revenue OpEx 25% RES CapEx Eligibility Eligibility Eligibility 71% 83% 58% 34% Concessions 31% Concessions 14% Concessions RG – Q1’22 Financial r
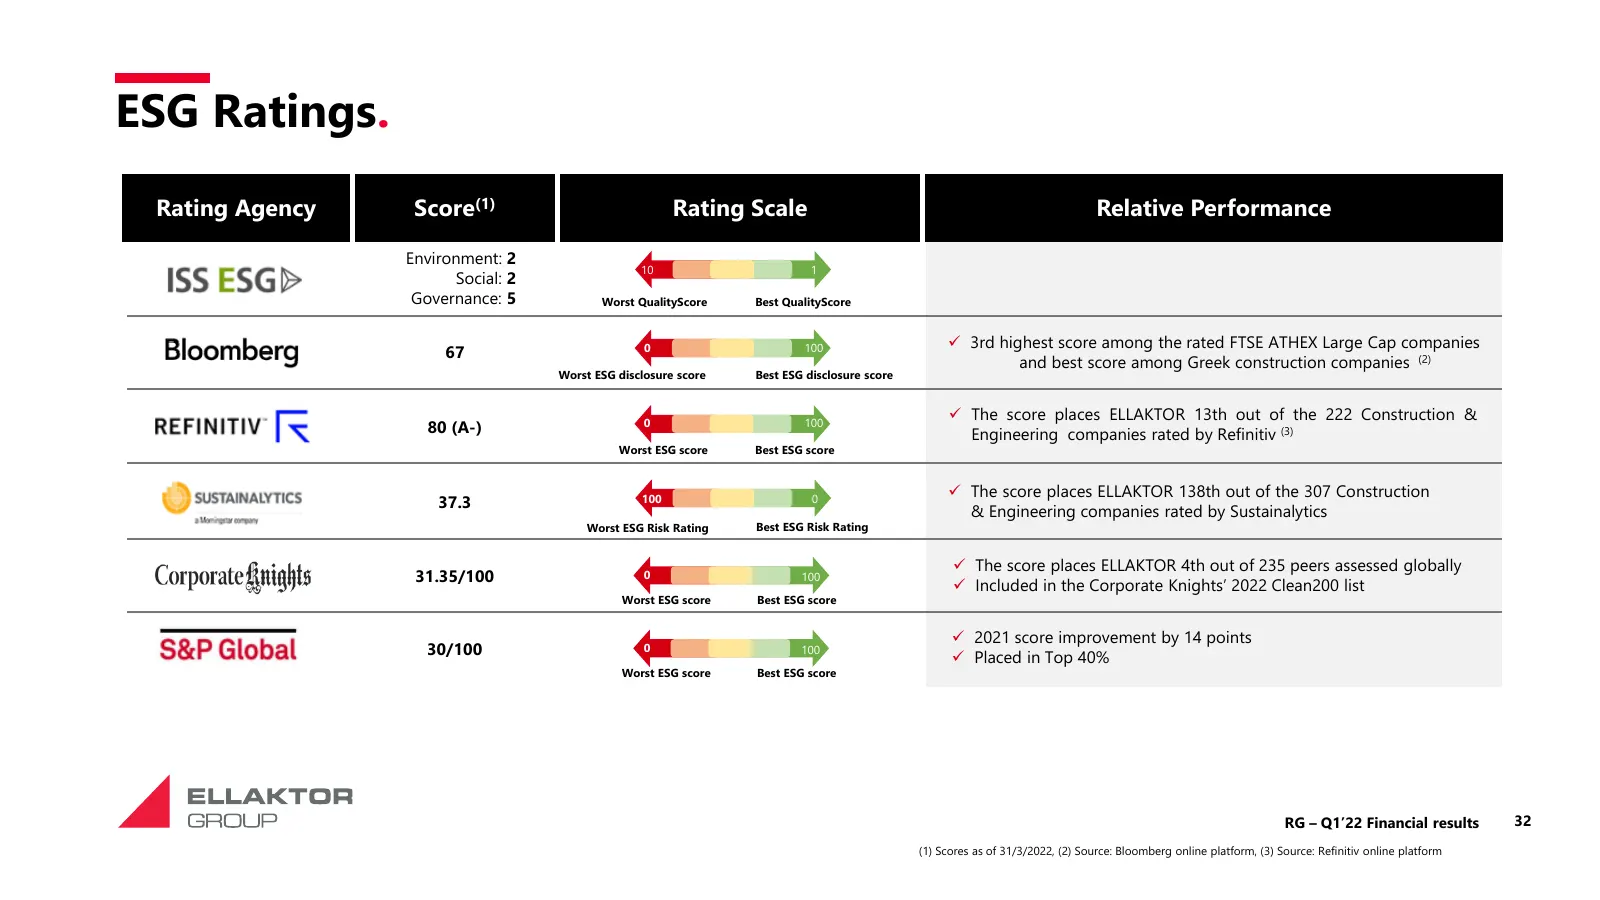
Slide 32: ESG Ratings
ESG Ratings. Rating Agency Score(1) Rating Scale Relative Performance Environment: 2 10 1 Social: 2 Governance: 5 Worst QualityScore Best QualityScore 0 100 ✓ 3rd highest score among the rated FTSE ATHEX Large Cap companies 67 and best score among Greek construction companies (2) Worst ESG disclosur
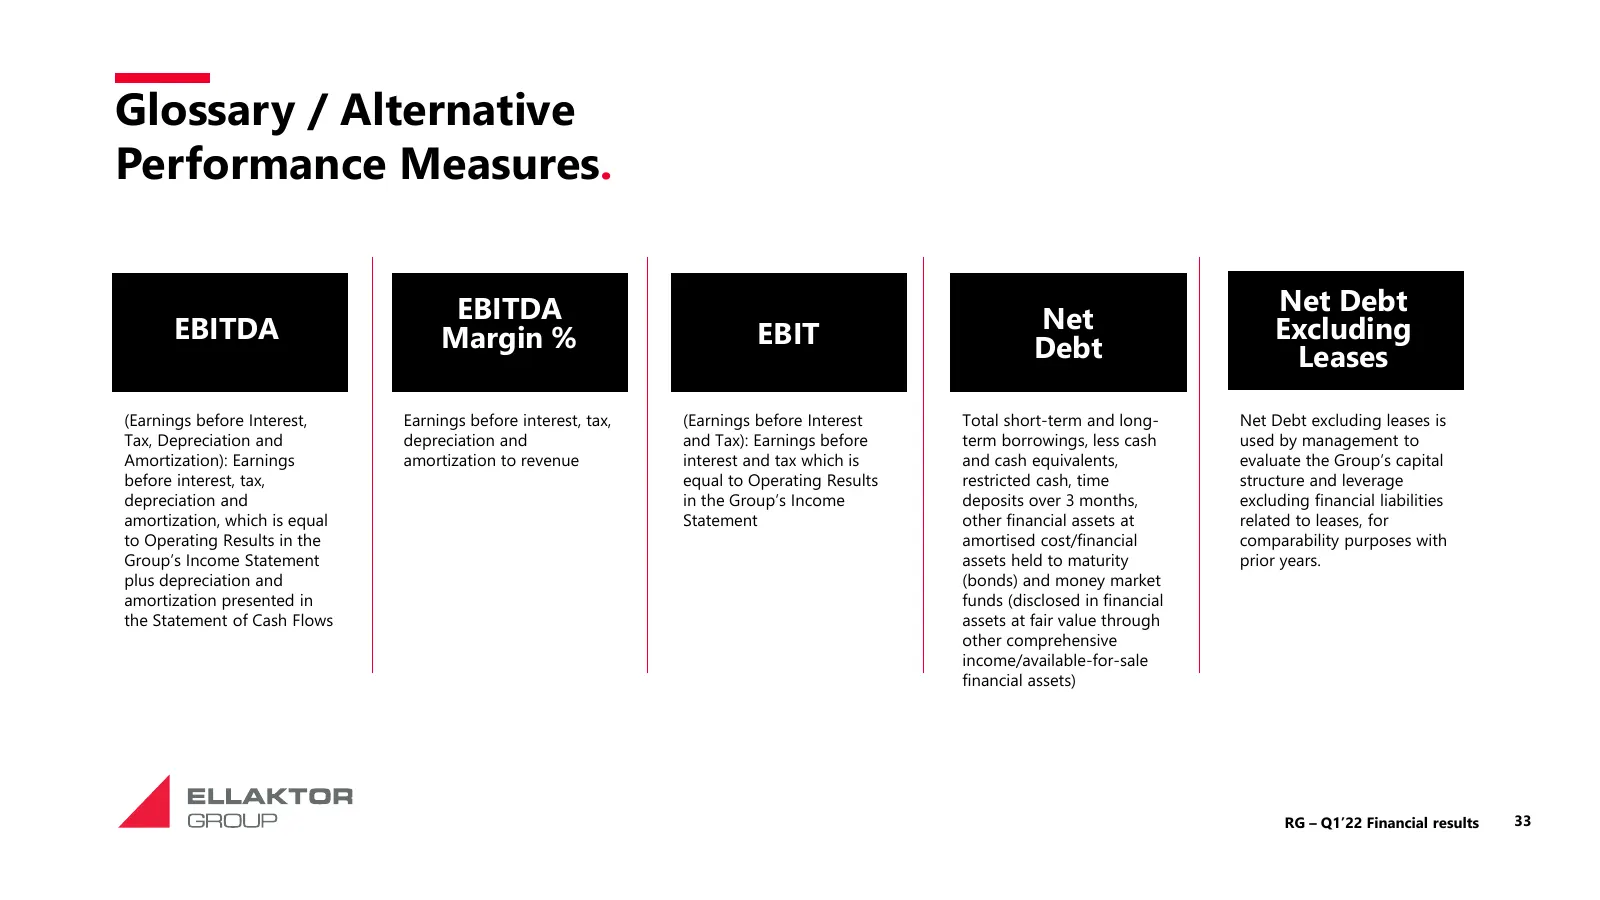
Slide 33: Glossary / Alternative Performance Measures
Glossary / Alternative Performance Measures. EBITDA Net Debt EBITDA EBIT Net Excluding Margin % Debt Leases (Earnings before Interest, Earnings before interest, tax, (Earnings before Interest Total short-term and long- Net Debt excluding leases is Tax, Depreciation and depreciation and and Tax): Ear
Slide 34: Contact / Ellaktor Headquarters
Dimos Revelas Group CFO drevelas@ellaktor.com Yiannis Mamakos Investor Relations Officer ymamakos@ellaktor.com ir@ellaktor.com ELLAKTOR HEADQUARTERS 25, Ermou St., GR 145 64 Nea Kifissia Athens - Lamia National Road, Olympic Village Interchange Greece TEL: +30 210 8185000 | FAX: +30 210 8185001 e-ma
Source: Internet Archive copy of ellaktor.com
More decks from Ellaktor SA
 FY2025 Earnings Presentation23 slides · Apr 17, 2026
 FY2024 Earnings Presentation30 slides · Apr 24, 2025
 H1 2024 Earnings Presentation30 slides · Sep 12, 2024
 FY2023 Earnings Presentation32 slides · Apr 18, 2024
 9M 2023 Earnings Presentation31 slides · Nov 23, 2023
 9M 2023 Earnings Presentation48 slides · November 2023