Grenergy Renovables S.A · BME:GRE
Grenergy Renovables — Investor Presentation (January 2021)
38 slides from Grenergy Renovables's investor presentation, January 2021
Slide 1: Investor Presentation January 2021
INVESTOR PRESENTATION January 2021
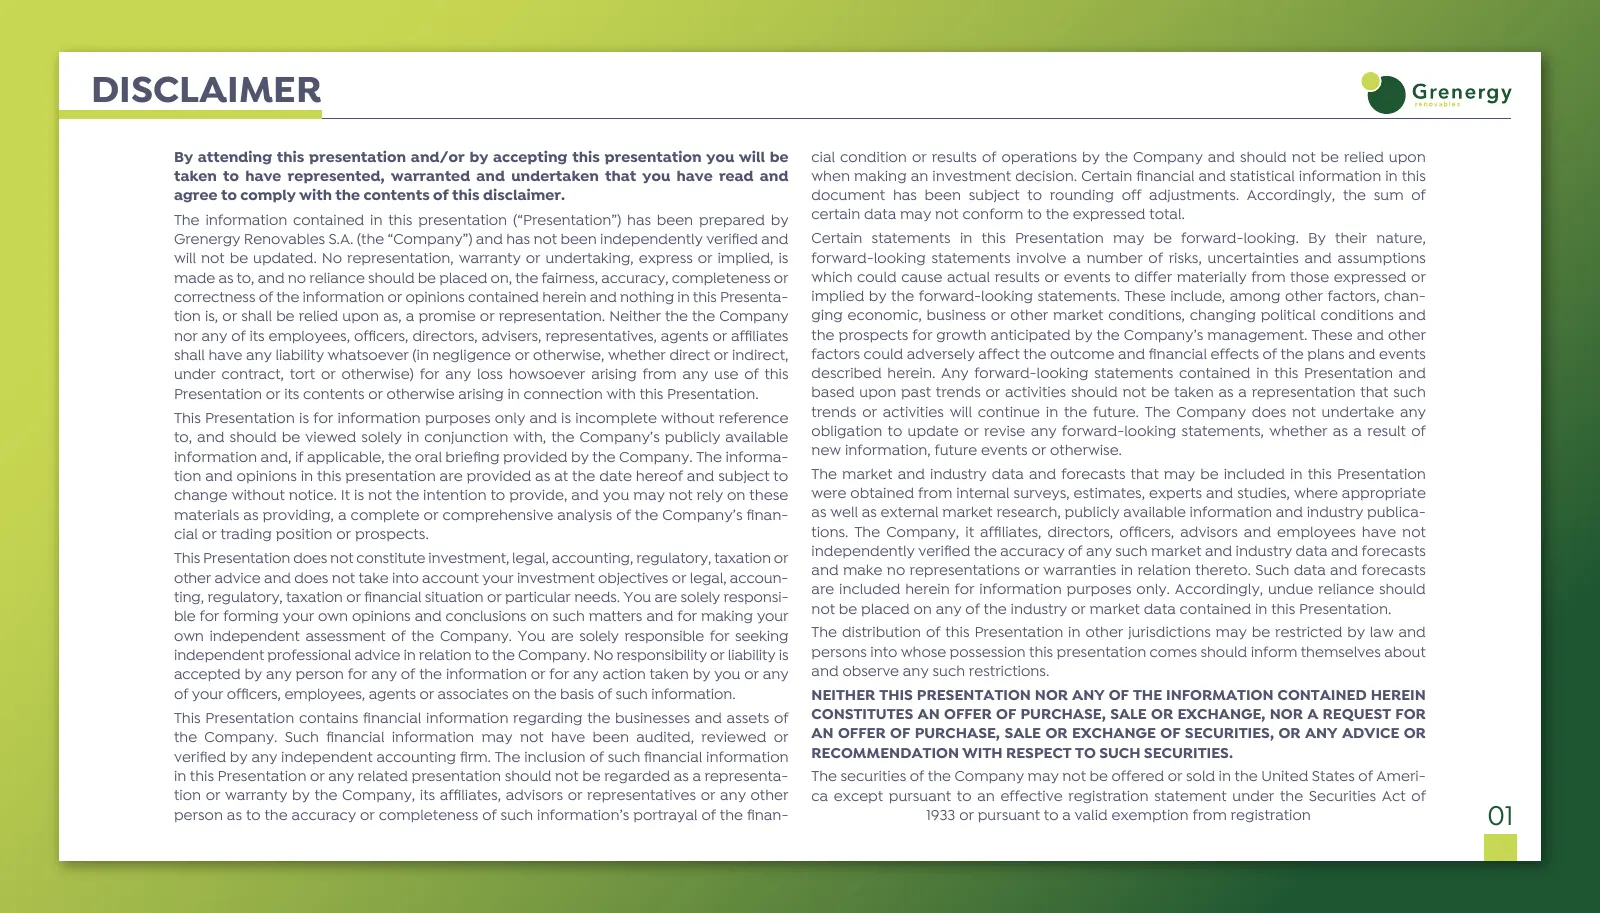
Slide 2: Disclaimer
DISCLAIMER By attending this presentation and/or by accepting this presentation you will be cial condition or results of operations by the Company and should not be relied upon taken to have represented, warranted and undertaken that you have read and when making an investment decision. Certain finan
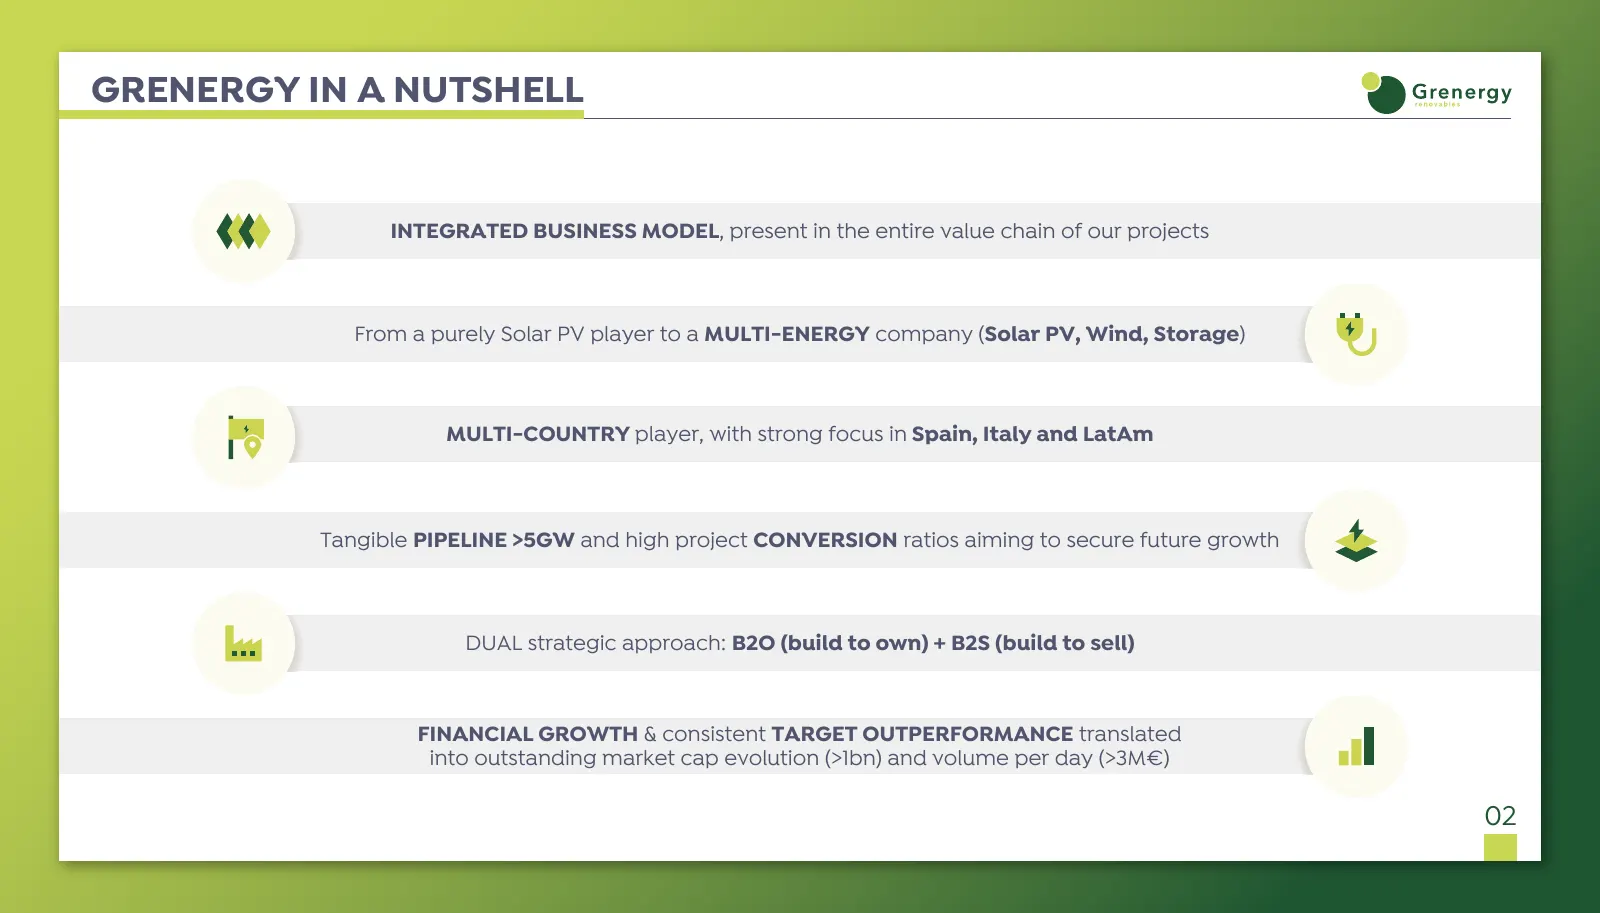
Slide 3: Grenergy in a Nutshell
GRENERGY IN A NUTSHELL INTEGRATED BUSINESS MODEL, present in the entire value chain of our projects From a purely Solar PV player to a MULTI-ENERGY company (Solar PV, Wind, Storage) MULTI-COUNTRY player, with strong focus in Spain, Italy and LatAm Tangible PIPELINE >5GW and high project CONVERSION r
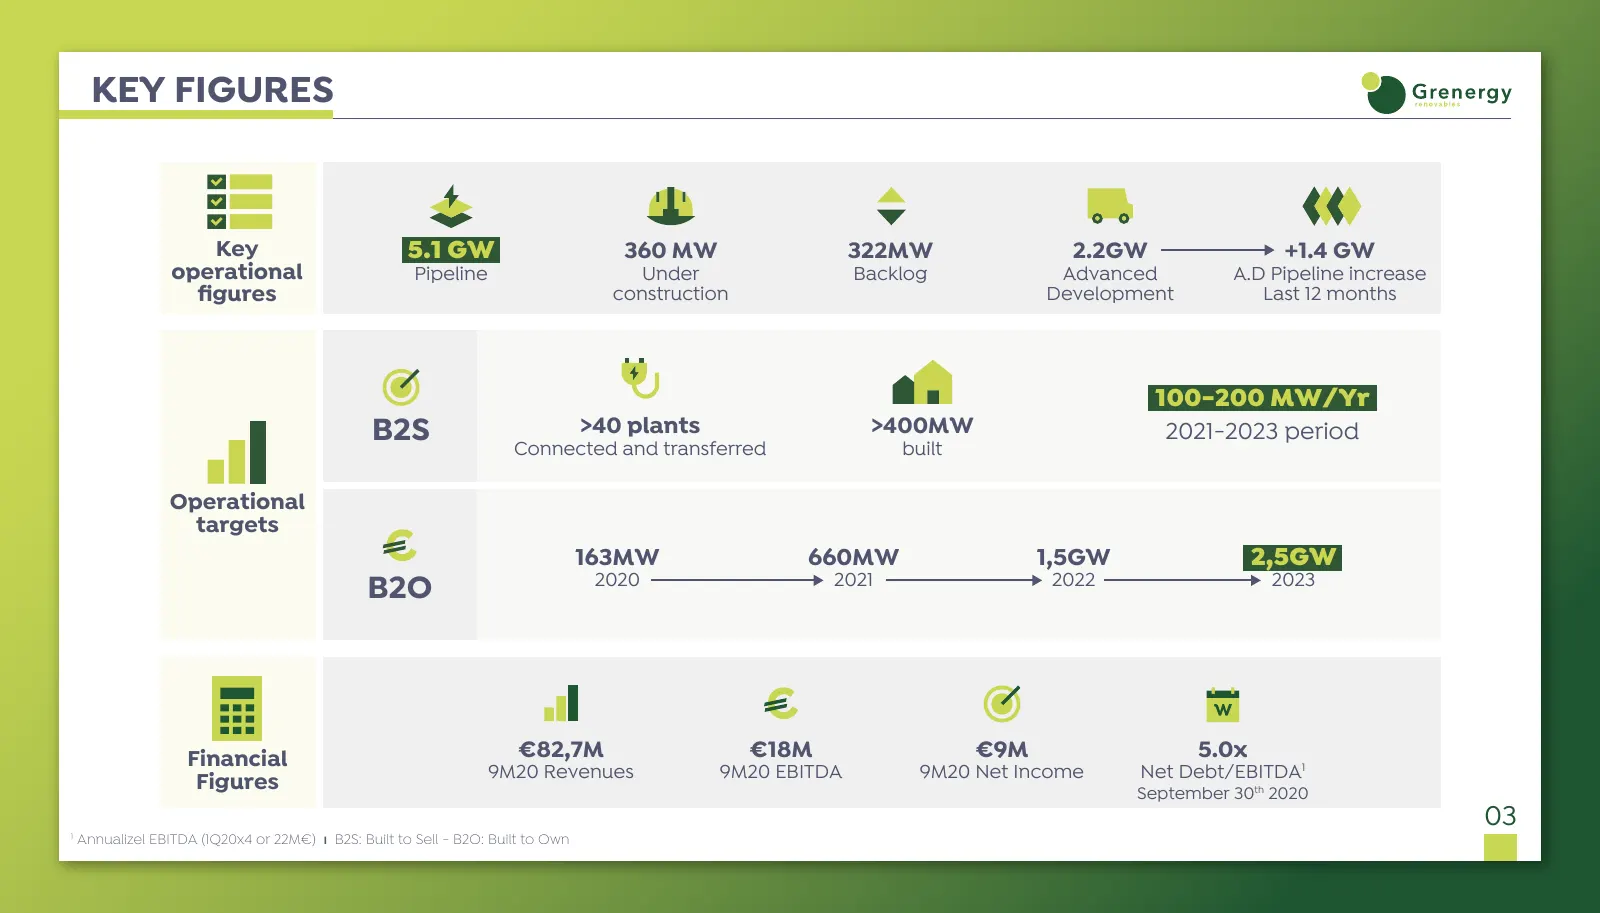
Slide 4: Key Figures
KEY FIGURES Key 5.1 GW 360 MW 322MW 2.2GW +1.4 GW operational Pipeline Under Backlog Advanced A.D Pipeline increase figures construction Development Last 12 months 100-200 MW/Yr B2S >40 plants Connected and transferred >400MW built 2021-2023 period Operational targets 163MW 660MW 1,5GW 2,5GW B2O 2020
Slide 5: Key Investment Highlights
KEY INVESTMENT HIGHLIGHTS Attractive equity story 1 RENEWABLES REVOLUTION & COVID IMPACTS 2 PROVEN TRACK RECORD OUTPACING TARGETS 3 PLATFORM WITH OUTSTANDING GROWTH POTENTIAL 4 INTEGRATED BUSINESS MODEL AND ASSET ROTATION STRATEGY 5 STRONG GOVERNANCE STRUCTURE WITH FOCUS ON ESG 04
Slide 6: 1-Renewables Revolution
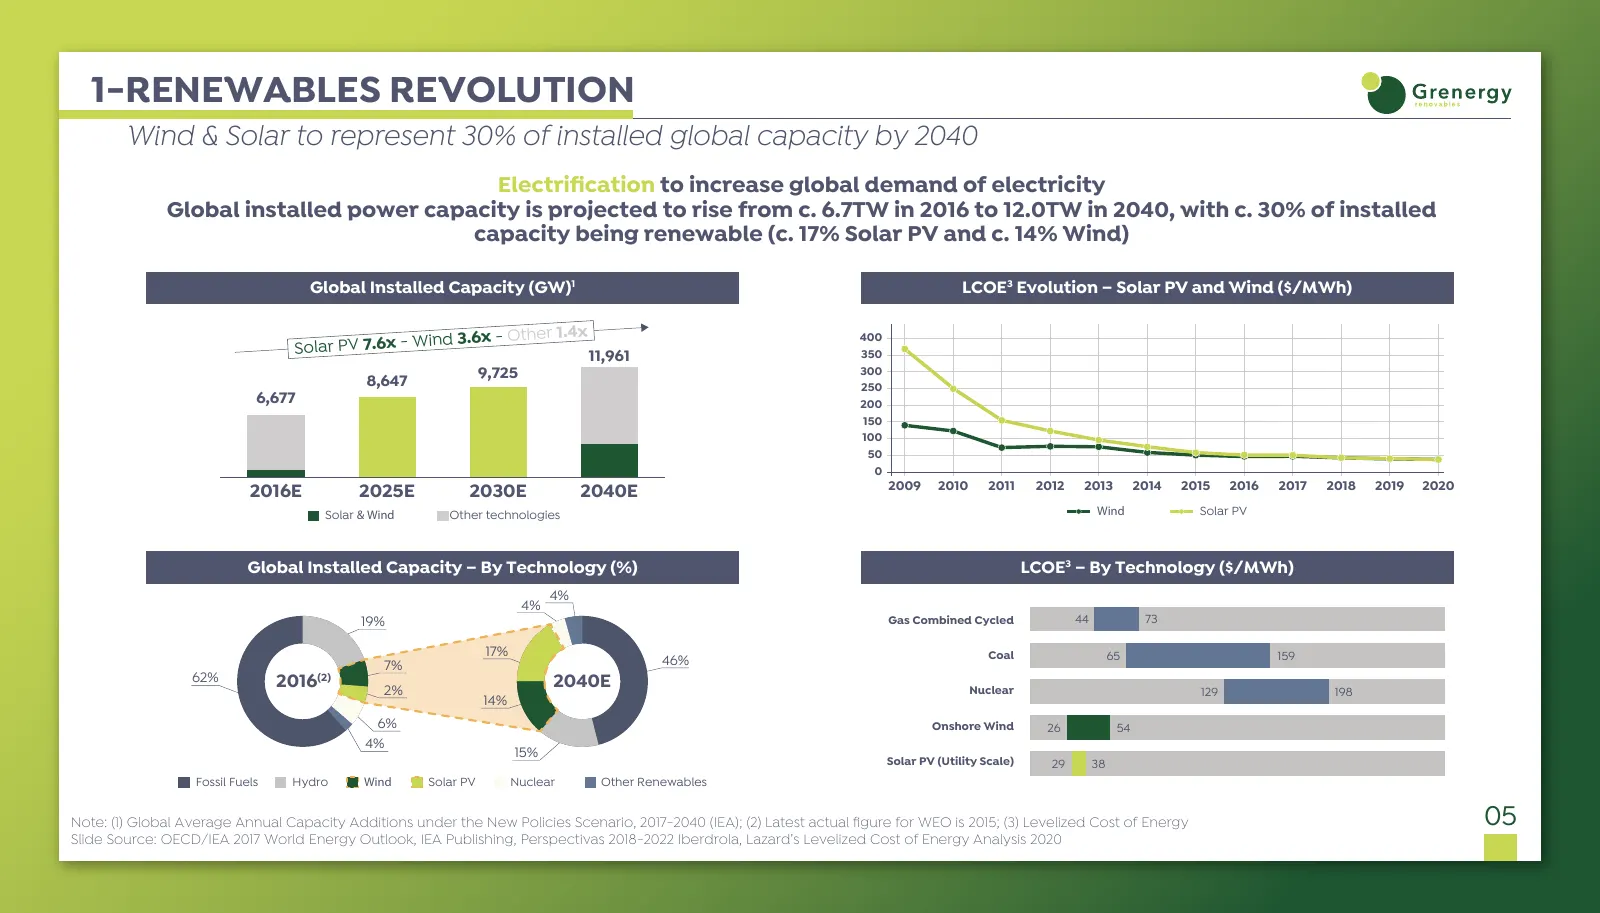
1-RENEWABLES REVOLUTION Wind & Solar to represent 30% of installed global capacity by 2040 Electrification to increase global demand of electricity Global installed power capacity is projected to rise from c. 6.7TW in 2016 to 12.0TW in 2040, with c. 30% of installed capacity being renewable (c. 17% S
Slide 7: Spain: Key Renewable Energy Market
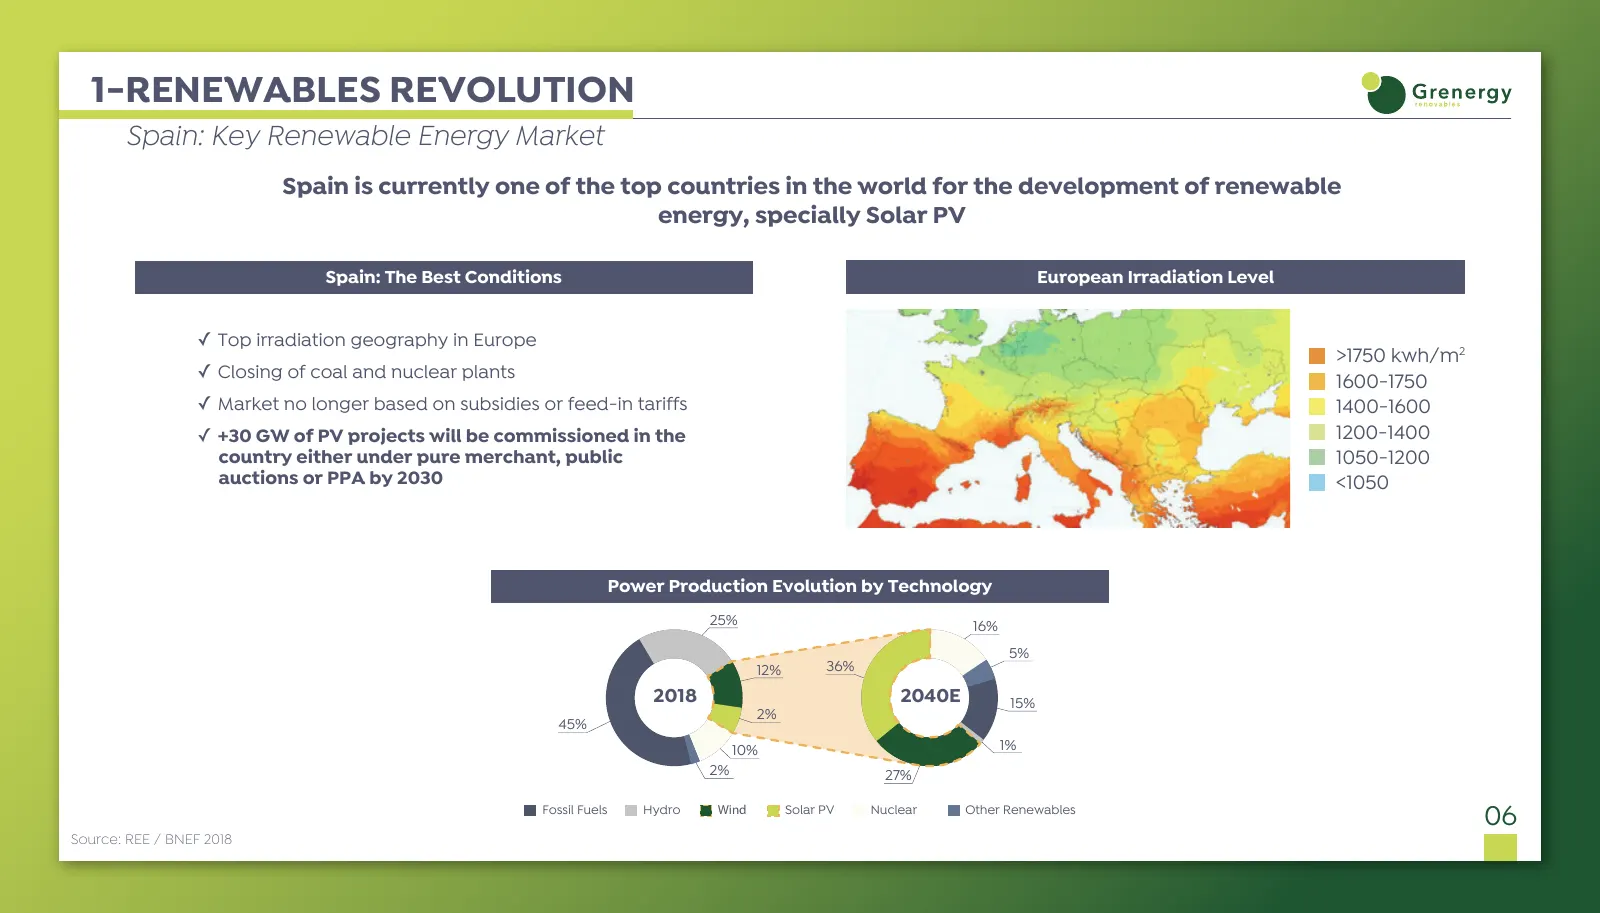
1-RENEWABLES REVOLUTION Spain: Key Renewable Energy Market Spain is currently one of the top countries in the world for the development of renewable energy, specially Solar PV Spain: The Best Conditions European Irradiation Level ✓ Top irradiation geography in Europe >1750 kwh/m2 ✓ Closing of coal a
Slide 8: Renewables' Revolution: A Sector in Motion
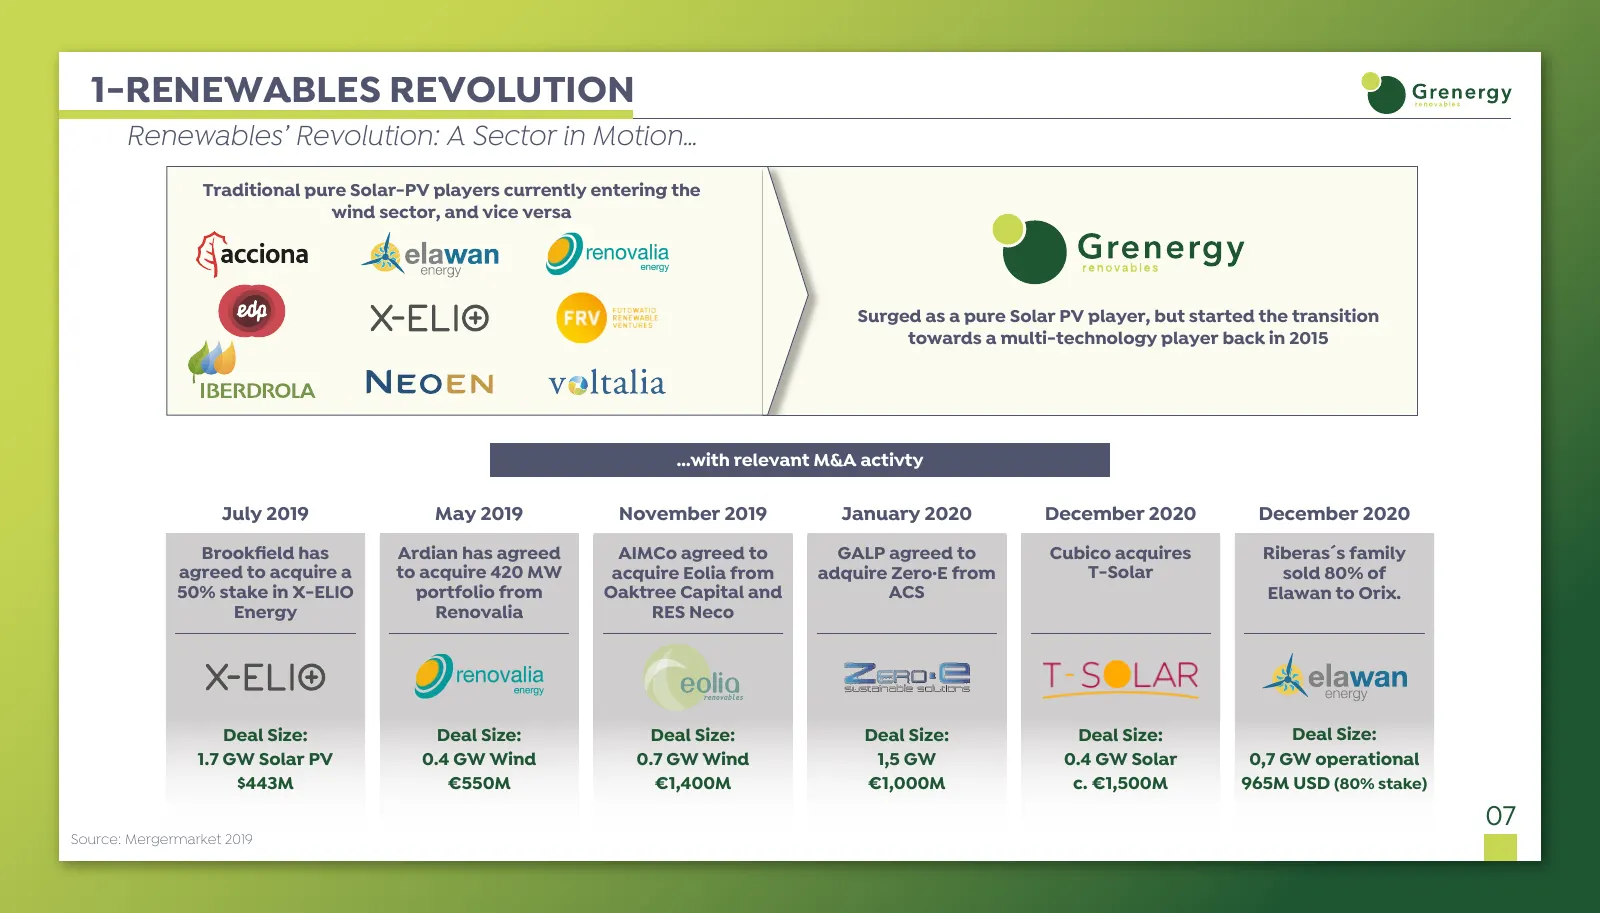
1-RENEWABLES REVOLUTION Renewables’ Revolution: A Sector in Motion… Traditional pure Solar-PV players currently entering the wind sector, and vice versa Surged as a pure Solar PV player, but started the transition towards a multi-technology player back in 2015 …with relevant M&A activty July 2019 Ma
Slide 9: Key Investment Highlights
KEY INVESTMENT HIGHLIGHTS Attractive equity story 1 RENEWABLES REVOLUTION & COVID IMPACTS 2 PROVEN TRACK RECORD OUTPACING TARGETS 3 PLATFORM WITH OUTSTANDING GROWTH POTENTIAL 4 INTEGRATED BUSINESS MODEL AND ASSET ROTATION STRATEGY 5 STRONG GOVERNANCE STRUCTURE WITH FOCUS ON ESG 08
Slide 10: Evolving into a Multitech & Multicountry IPP
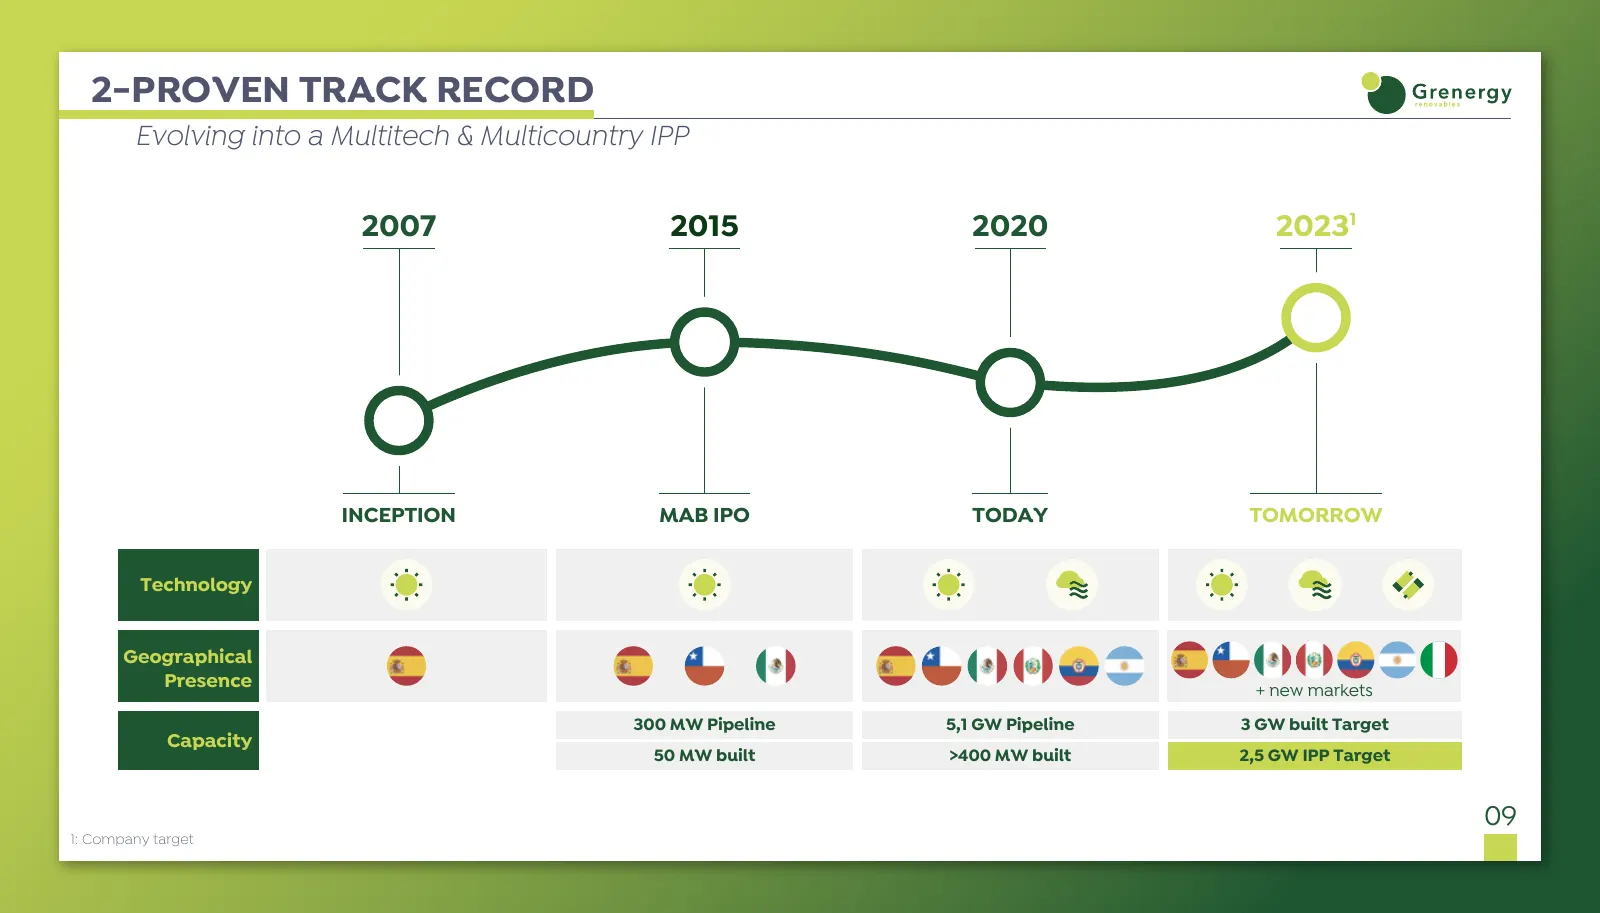
2-PROVEN TRACK RECORD Evolving into a Multitech & Multicountry IPP 2007 2015 2020 20231 INCEPTION MAB IPO TODAY TOMORROW Technology Geographical Presence + new markets 300 MW Pipeline 5,1 GW Pipeline 3 GW built Target Capacity 50 MW built >400 MW built 2,5 GW IPP Target 09 1: Company target
Slide 11: Key Investment Highlights
KEY INVESTMENT HIGHLIGHTS Attractive equity story 1 RENEWABLES REVOLUTION & COVID IMPACTS 2 PROVEN TRACK RECORD OUTPACING TARGETS 3 PLATFORM WITH OUTSTANDING GROWTH POTENTIAL 4 INTEGRATED BUSINESS MODEL AND ASSET ROTATION STRATEGY 5 STRONG GOVERNANCE STRUCTURE WITH FOCUS ON ESG 10
Slide 12: Platform with Relevant Growth Potential
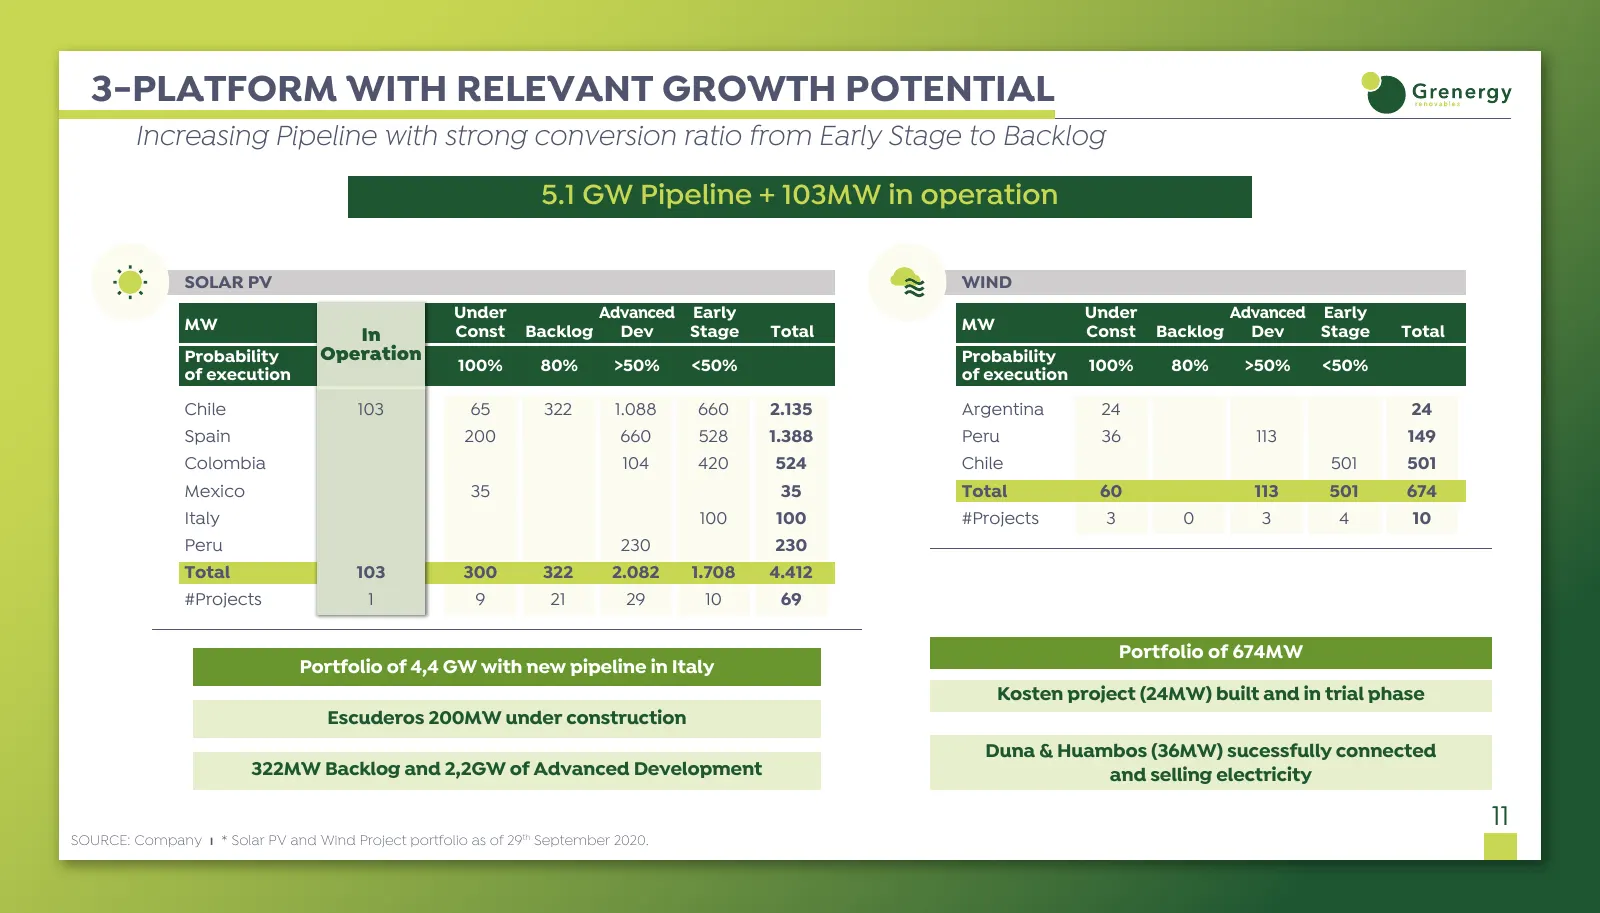
3-PLATFORM WITH RELEVANT GROWTH POTENTIAL Increasing Pipeline with strong conversion ratio from Early Stage to Backlog 5.1 GW Pipeline + 103MW in operation SOLAR PV WIND Under Advanced Early Under Advanced Early MW Const Backlog Dev Stage Total MW Const Backlog Dev Stage Total In Probability Operati
Slide 13: Project Portfolio
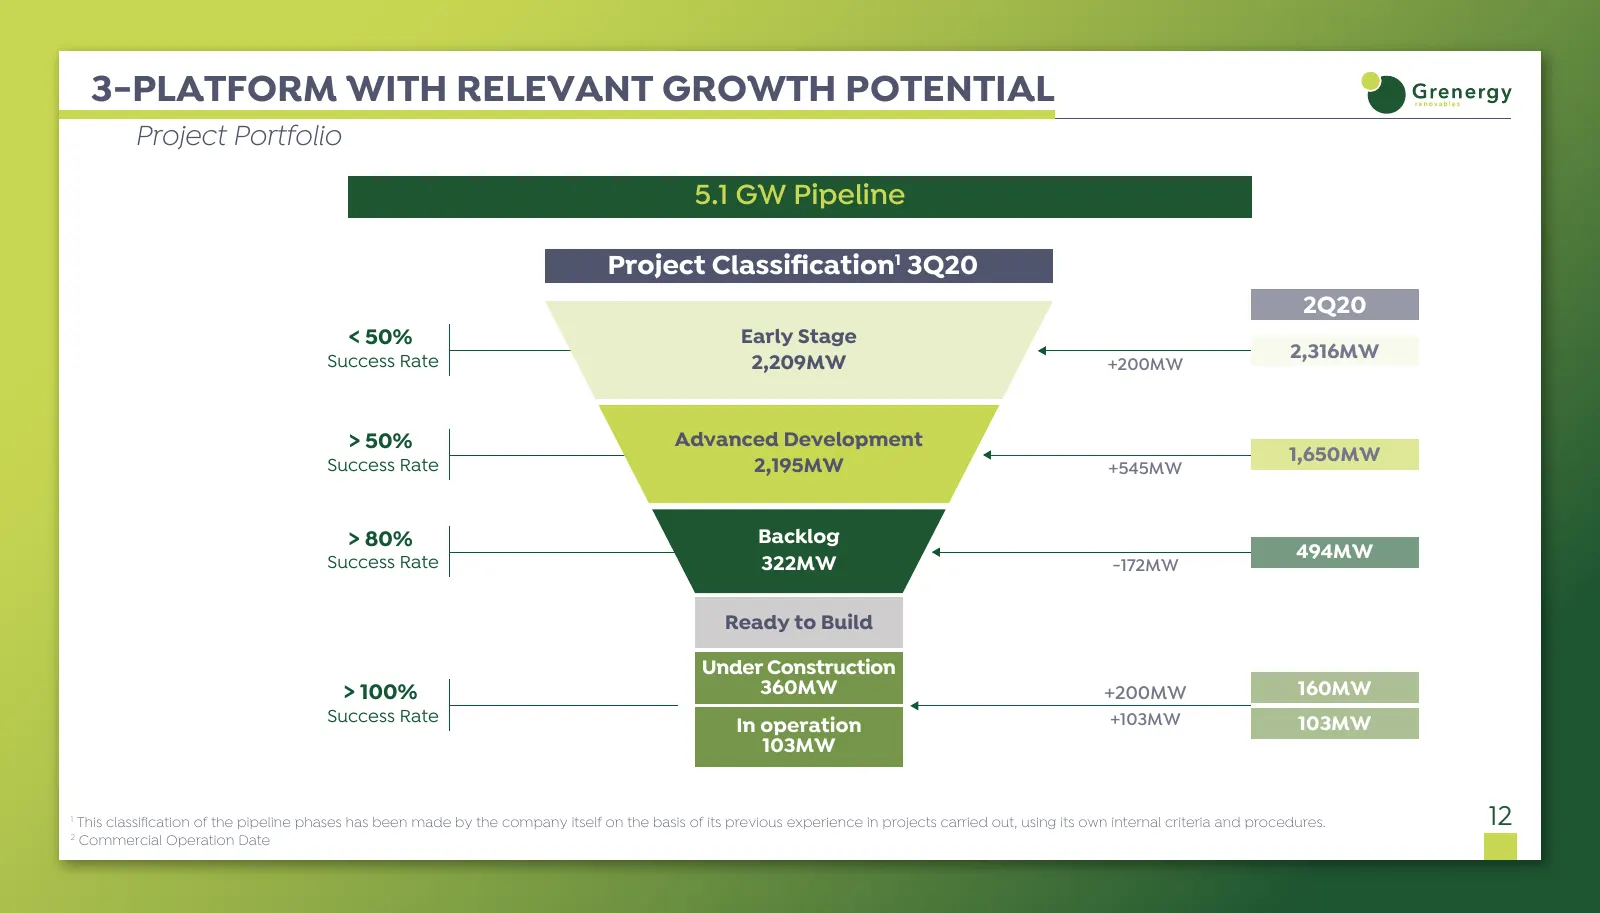
3-PLATFORM WITH RELEVANT GROWTH POTENTIAL Project Portfolio 5.1 GW Pipeline Project Classification1 3Q20 2Q20 < 50% Early Stage 2,316MW Success Rate 2,209MW +200MW > 50% Advanced Development 1,650MW Success Rate 2,195MW +545MW > 80% Backlog 494MW Success Rate 322MW -172MW Ready to Build Under Constru
Slide 14: Projects Under Construction & Backlog
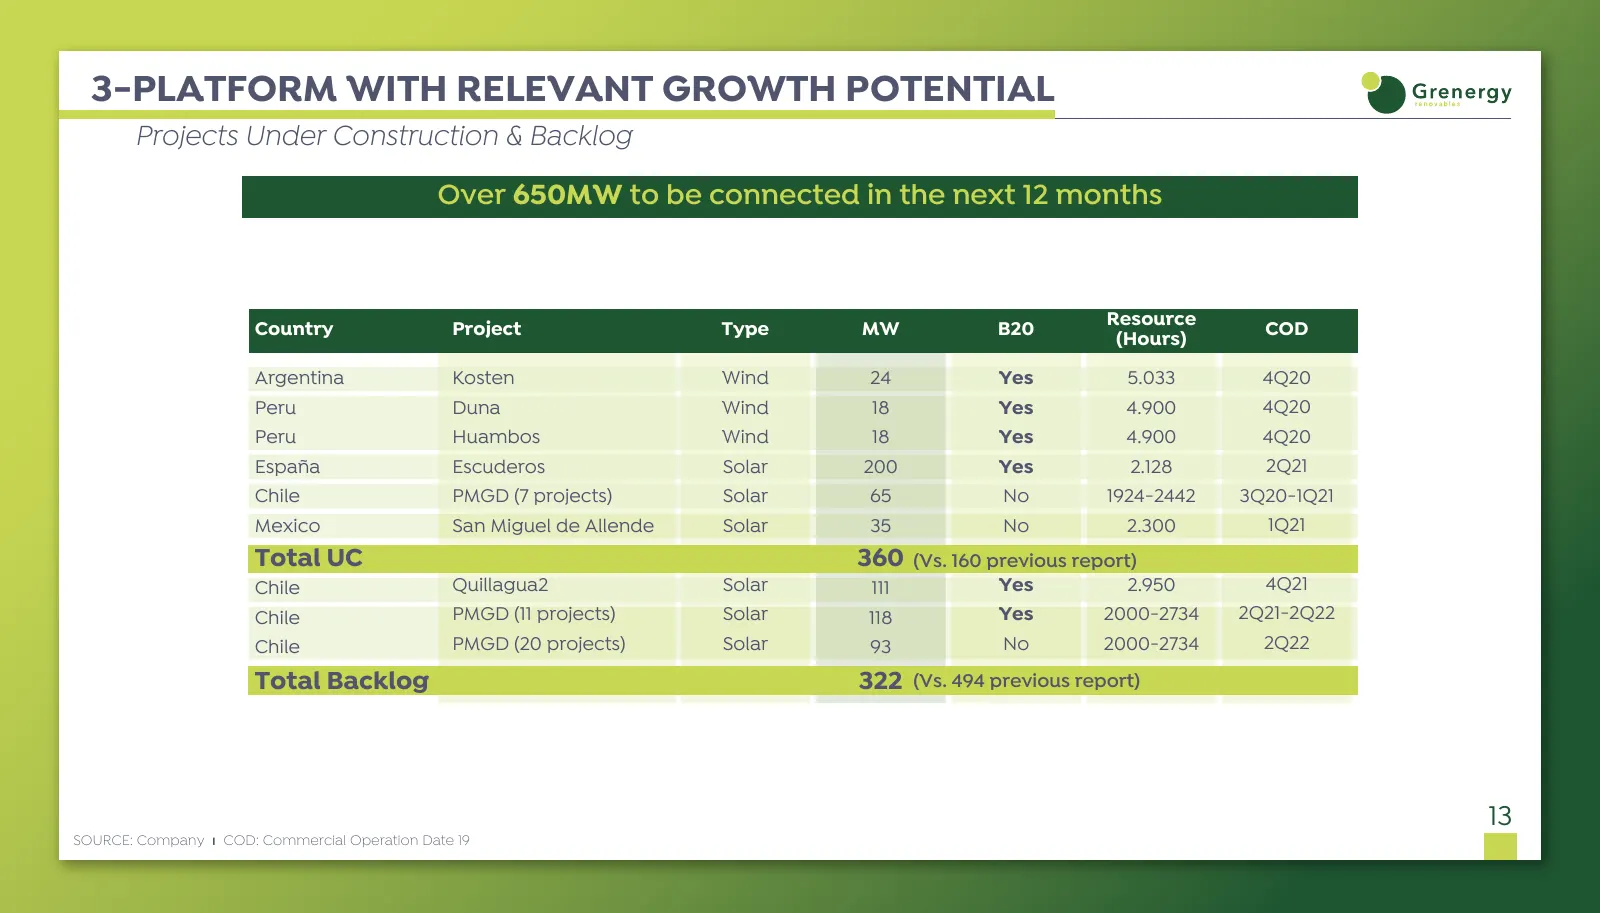
3-PLATFORM WITH RELEVANT GROWTH POTENTIAL Projects Under Construction & Backlog Over 650MW to be connected in the next 12 months Resource Country Project Type MW B20 COD (Hours) Argentina Kosten Wind 24 Yes 5.033 4Q20 Peru Duna Wind 18 Yes 4.900 4Q20 Peru Huambos Wind 18 Yes 4.900 4Q20 España Escude
Slide 15: Projects in Advanced Development
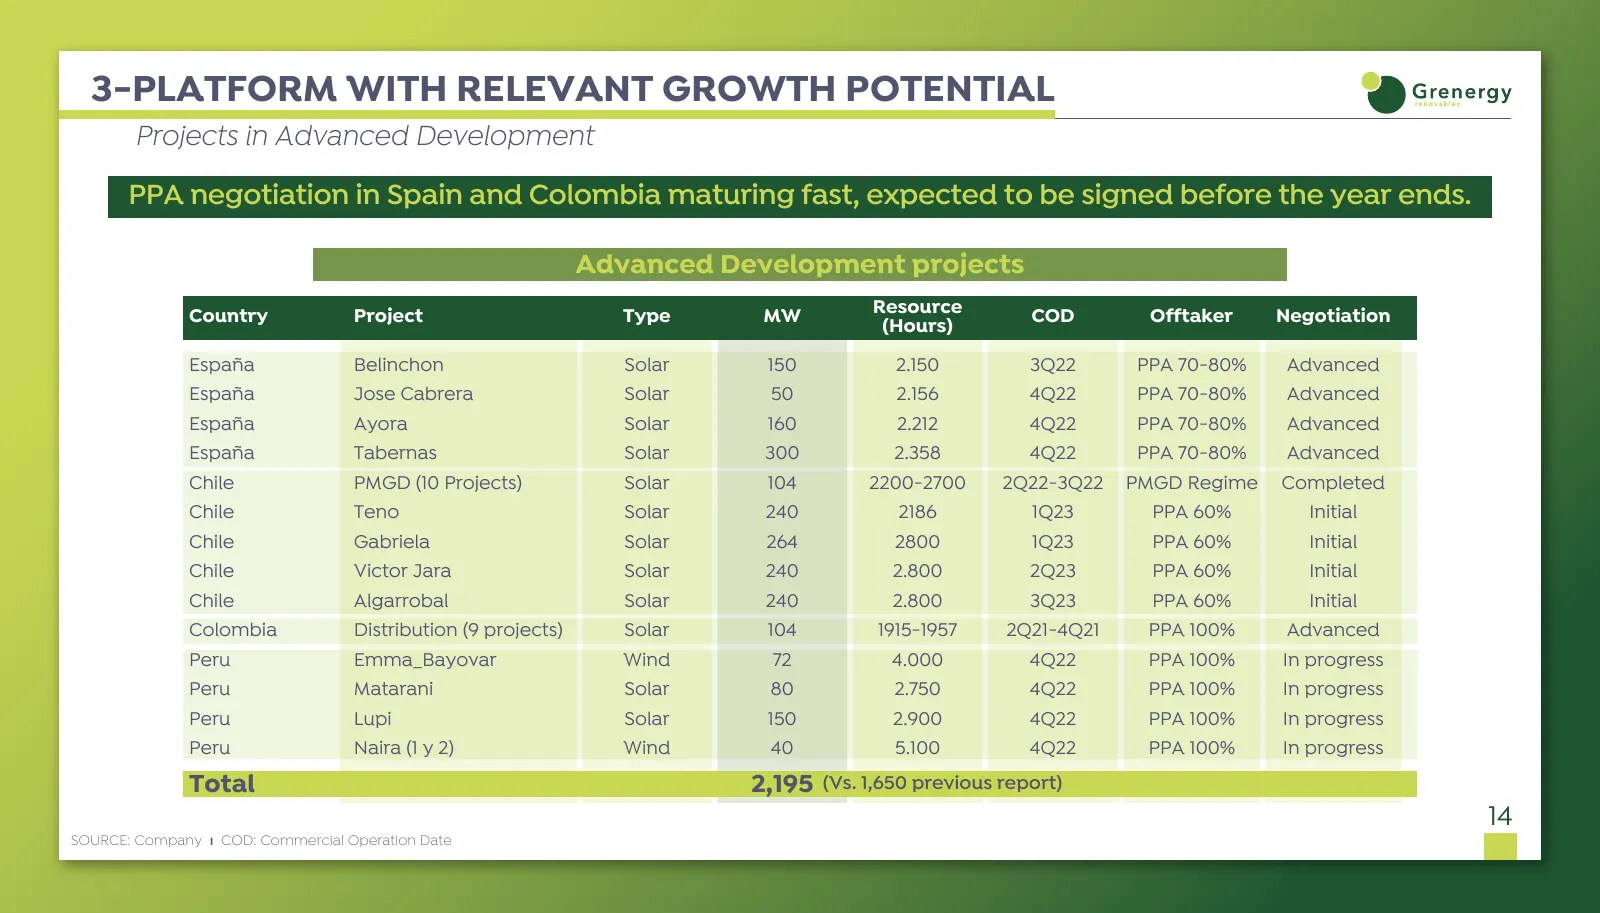
3-PLATFORM WITH RELEVANT GROWTH POTENTIAL Projects in Advanced Development PPA negotiation in Spain and Colombia maturing fast, expected to be signed before the year ends. Advanced Development projects Resource Country Project Type MW COD Offtaker Negotiation (Hours) España Belinchon Solar 150 2.150
Slide 16: Key Investment Highlights
KEY INVESTMENT HIGHLIGHTS Attractive equity story 1 RENEWABLES REVOLUTION & COVID IMPACTS 2 PROVEN TRACK RECORD OUTPACING TARGETS 3 PLATFORM WITH OUTSTANDING GROWTH POTENTIAL 4 INTEGRATED BUSINESS MODEL AND ASSET ROTATION STRATEGY 5 STRONG GOVERNANCE STRUCTURE WITH FOCUS ON ESG 15
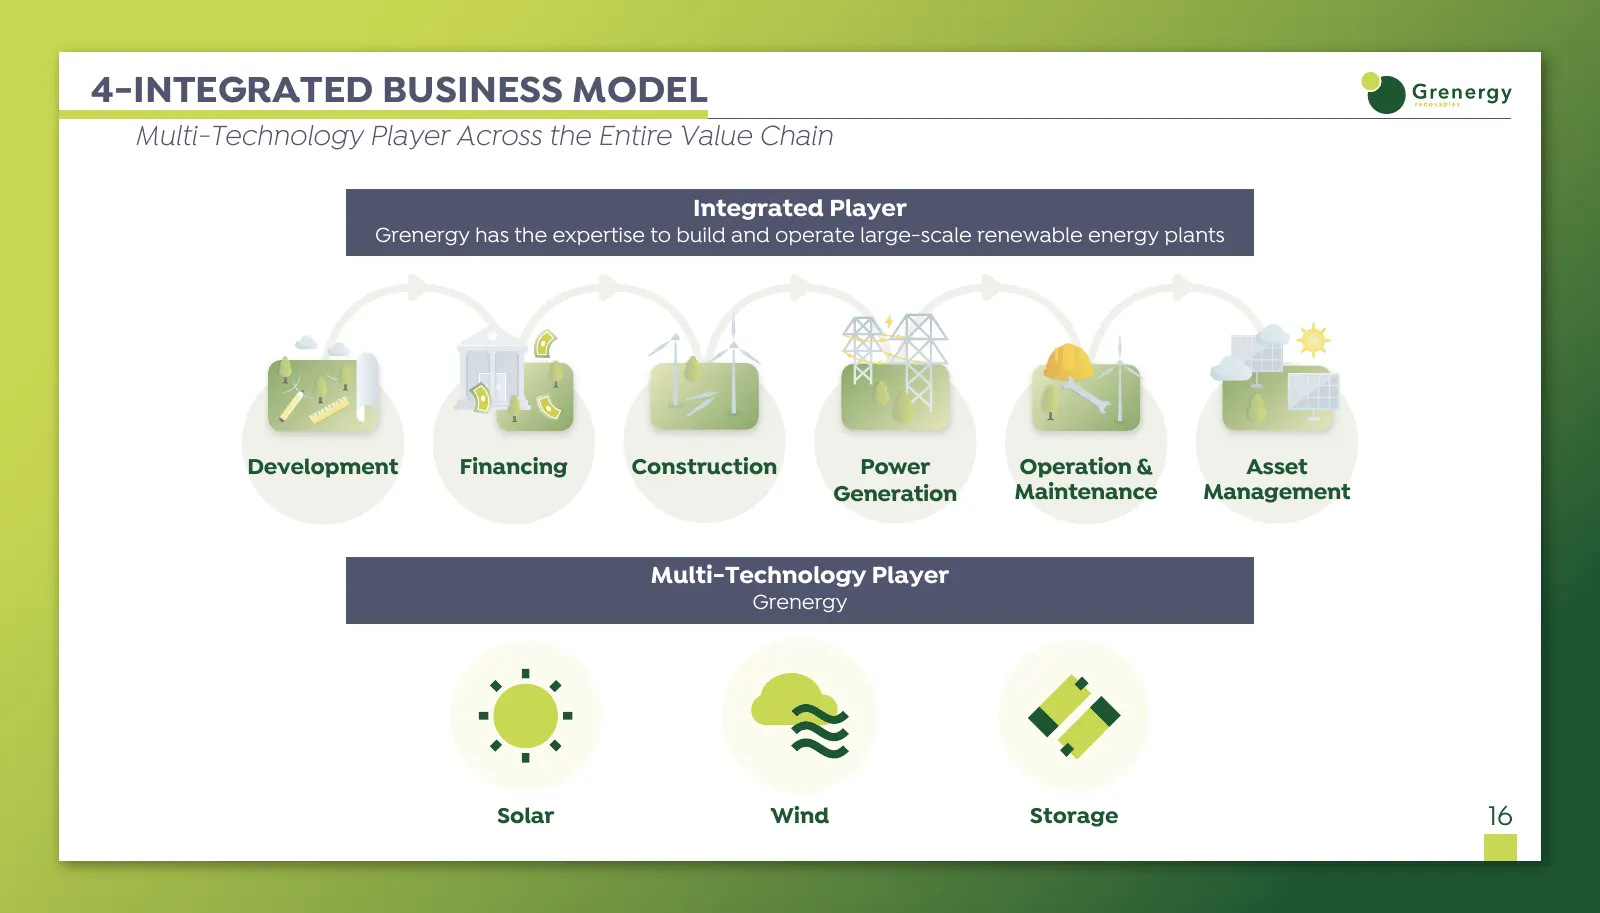
Slide 17: Multi-Technology Player Across the Entire Value Chain
4-INTEGRATED BUSINESS MODEL Multi-Technology Player Across the Entire Value Chain Integrated Player Grenergy has the expertise to build and operate large-scale renewable energy plants Development Financing Construction Power Operation & Asset Generation Maintenance Management Multi-Technology Player
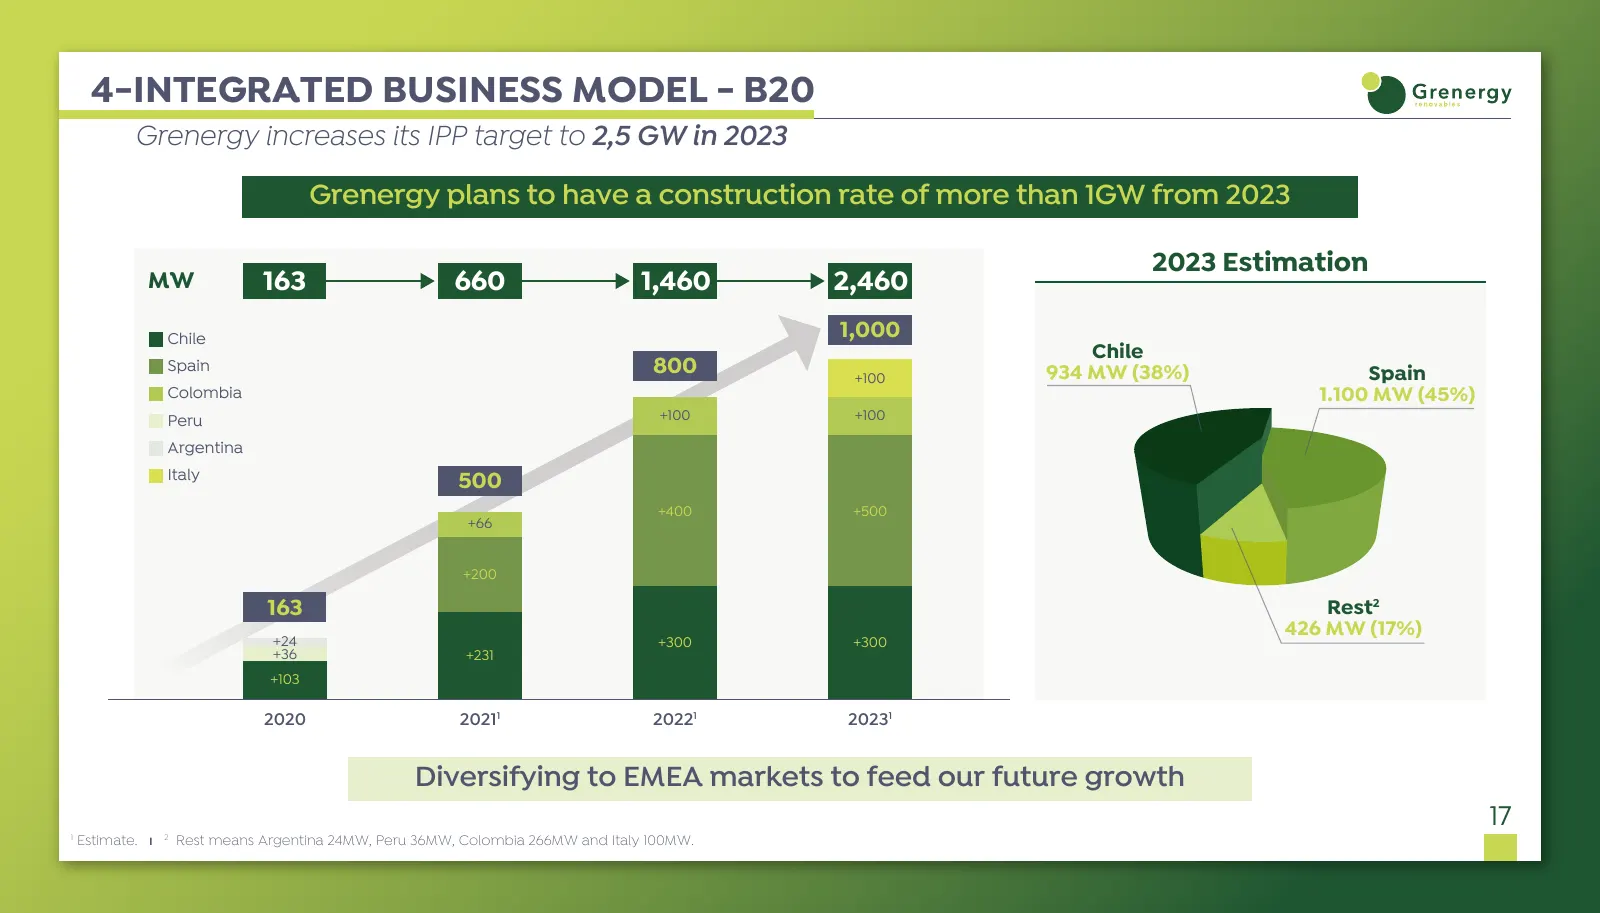
Slide 18: Grenergy increases its IPP target to 2.5 GW in 2023
4-INTEGRATED BUSINESS MODEL - B20 Grenergy increases its IPP target to 2,5 GW in 2023 Grenergy plans to have a construction rate of more than 1GW from 2023 2023 Estimation MW 163 660 1,460 2,460 Chile 1,000 Chile Spain 800 +100 934 MW (38%) Spain Colombia 1.100 MW (45%) Peru +100 +100 Argentina Ital
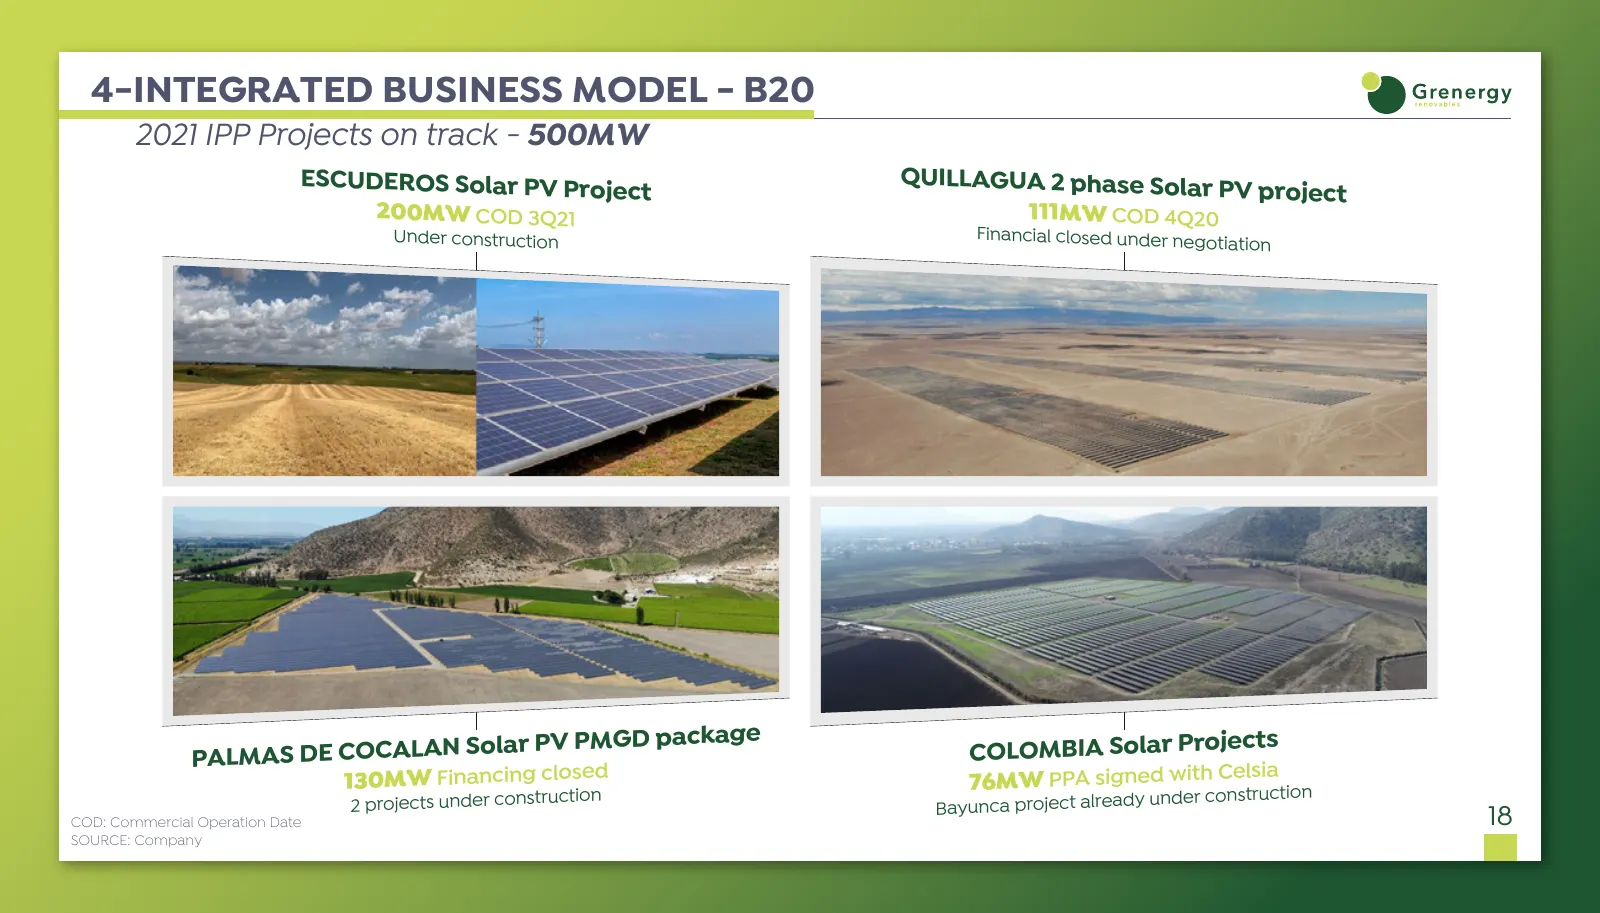
Slide 19: 2021 IPP Projects on track - 500MW
4-INTEGRATED BUSINESS MODEL - B20 2021 IPP Projects on track - 500MW ESCUDEROS Solar PV Proj QUILLAGUA 2 phase Solar ect PV project 200MW COD 3Q21 111MW COD 4Q20 Under construction Financial closed under nego tiation LMAS DE COCALAN Solar PV PMGD package COLOMBIA Solar Projec ts PA lsia 130MW Financ
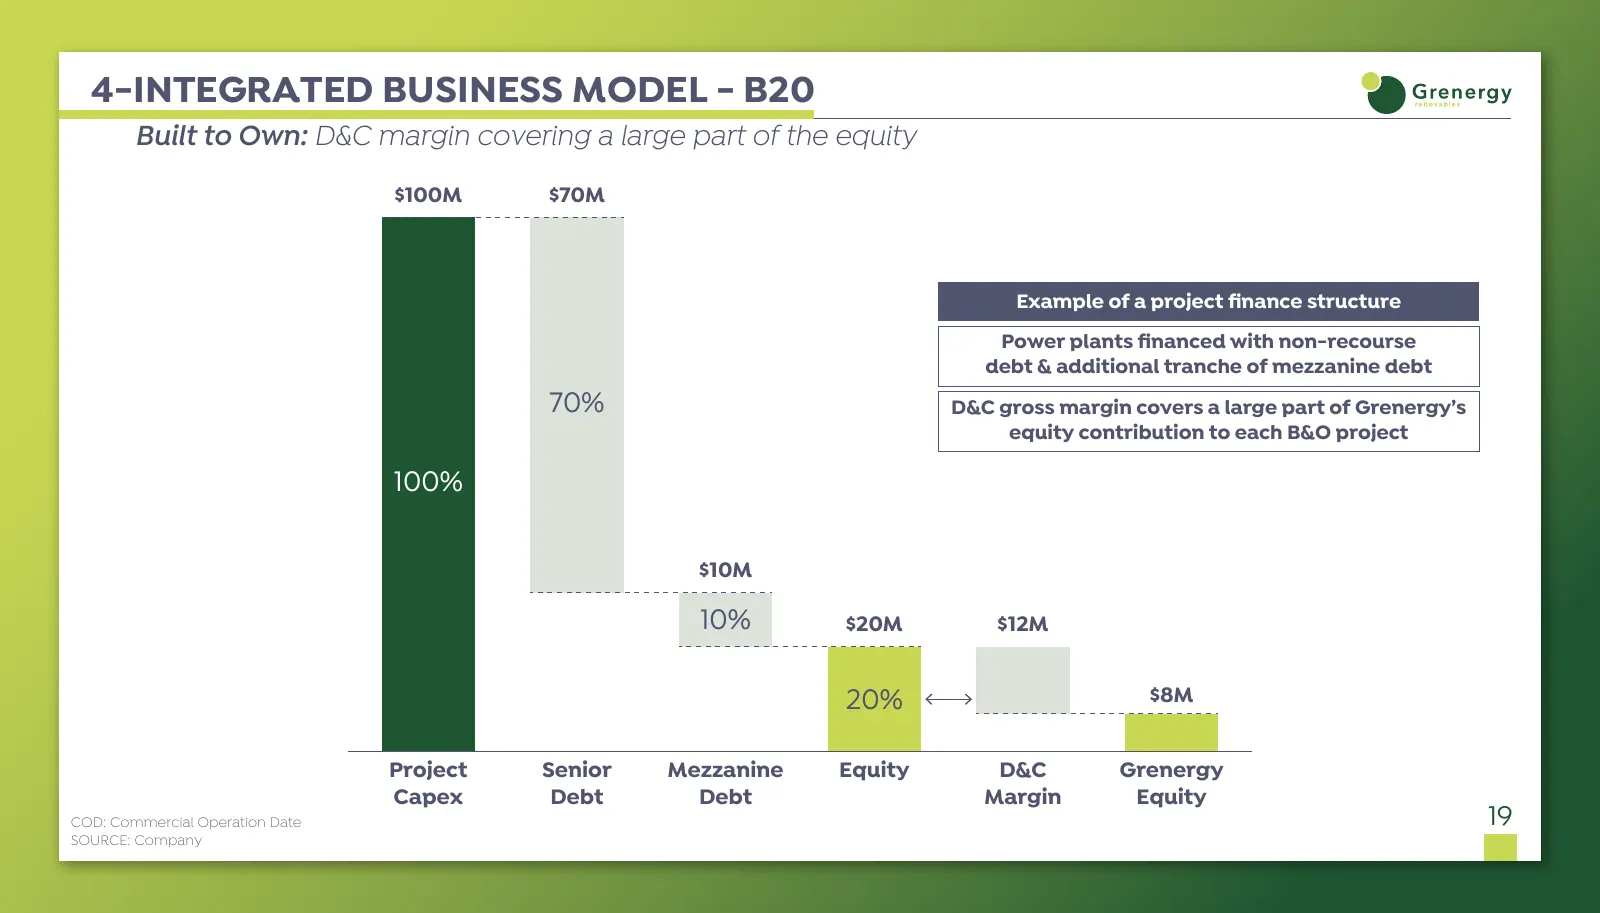
Slide 20: Built to Own: D&C margin covering a large part of the equity
4-INTEGRATED BUSINESS MODEL - B20 Built to Own: D&C margin covering a large part of the equity $100M $70M Example of a project finance structure Power plants financed with non-recourse debt & additional tranche of mezzanine debt 70% D&C gross margin covers a large part of Grenergy’s equity contributio
Slide 21: Focus: Structured finance
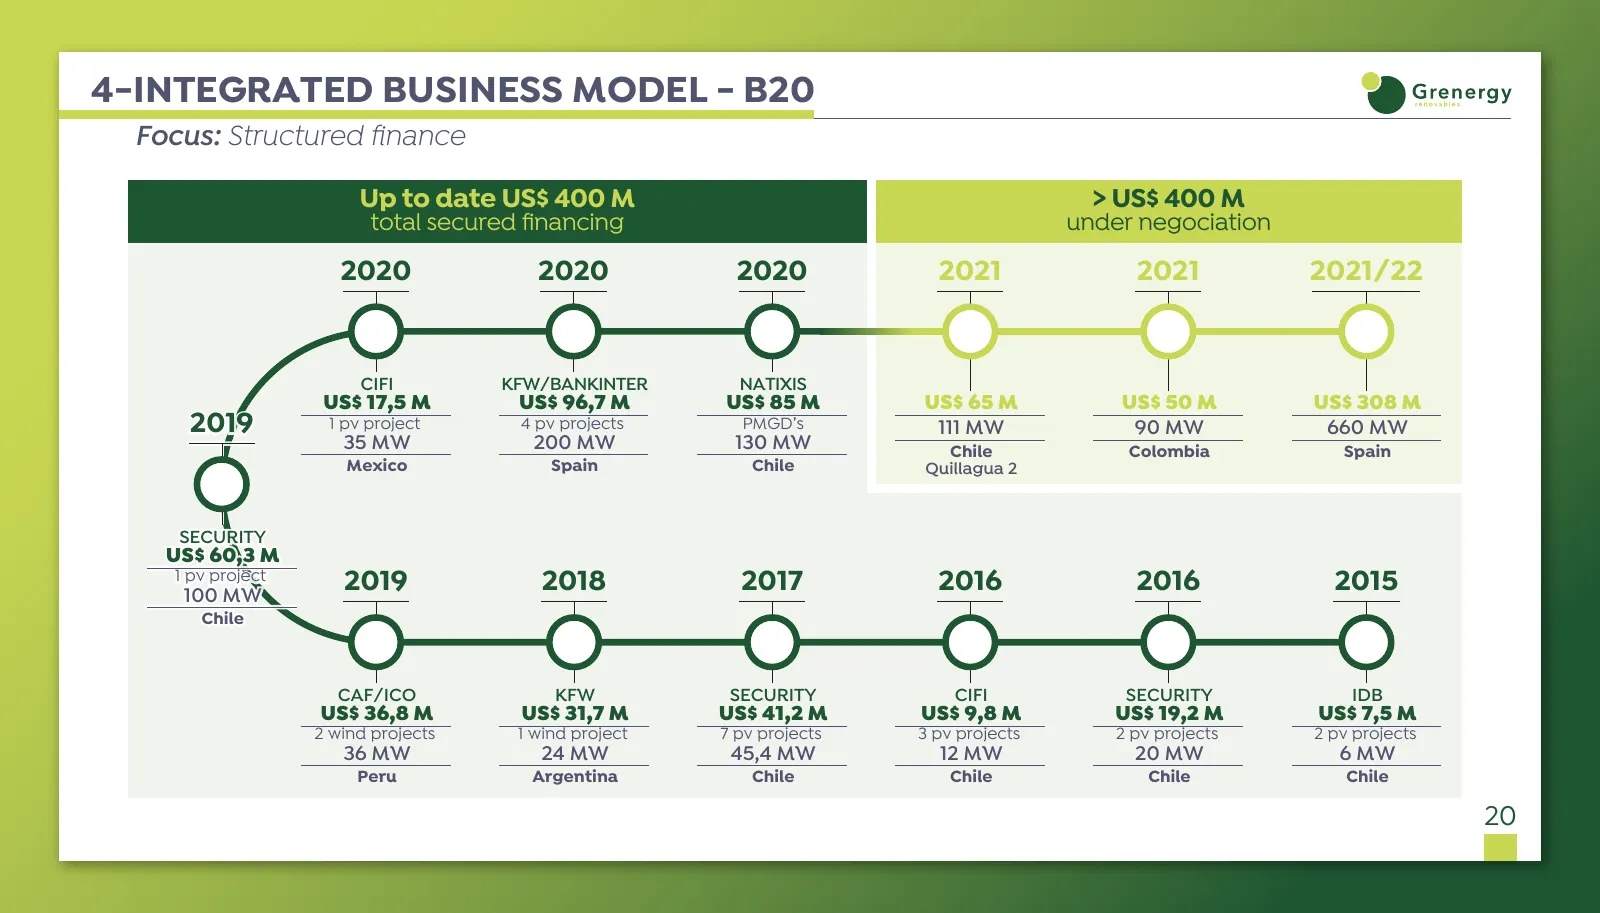
4-INTEGRATED BUSINESS MODEL - B20 Focus: Structured finance Up to date US$ 400 M > US$ 400 M total secured financing under negociation 2020 2020 2020 2021 2021 2021/22 CIFI KFW/BANKINTER NATIXIS US$ 17,5 M US$ 96,7 M US$ 85 M US$ 65 M US$ 50 M US$ 308 M 2019 1 pv project 4 pv projects PMGD’s 111 MW
Slide 22: Build to Sell (B2S) asset rotation
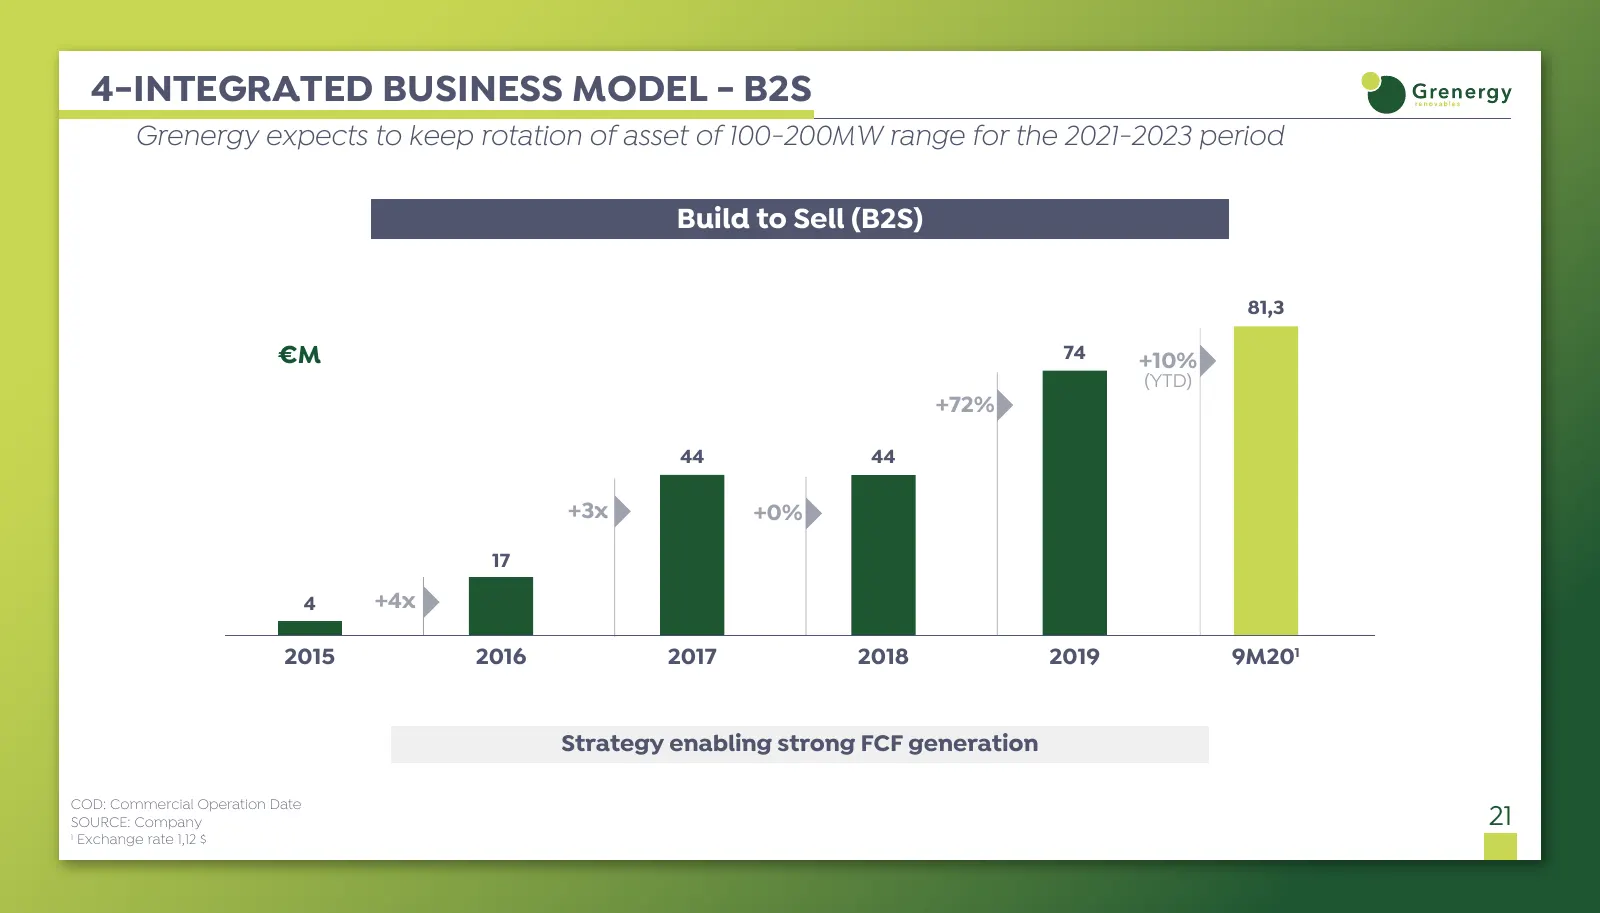
4-INTEGRATED BUSINESS MODEL - B2S Grenergy expects to keep rotation of asset of 100-200MW range for the 2021-2023 period Build to Sell (B2S) 81,3 €M 74 +10% (YTD) +72% 44 44 +3x +0% 17 4 +4x 2015 2016 2017 2018 2019 9M201 Strategy enabling strong FCF generation COD: Commercial Operation Date SOURCE:
Slide 23: Focus PMGD: a success story
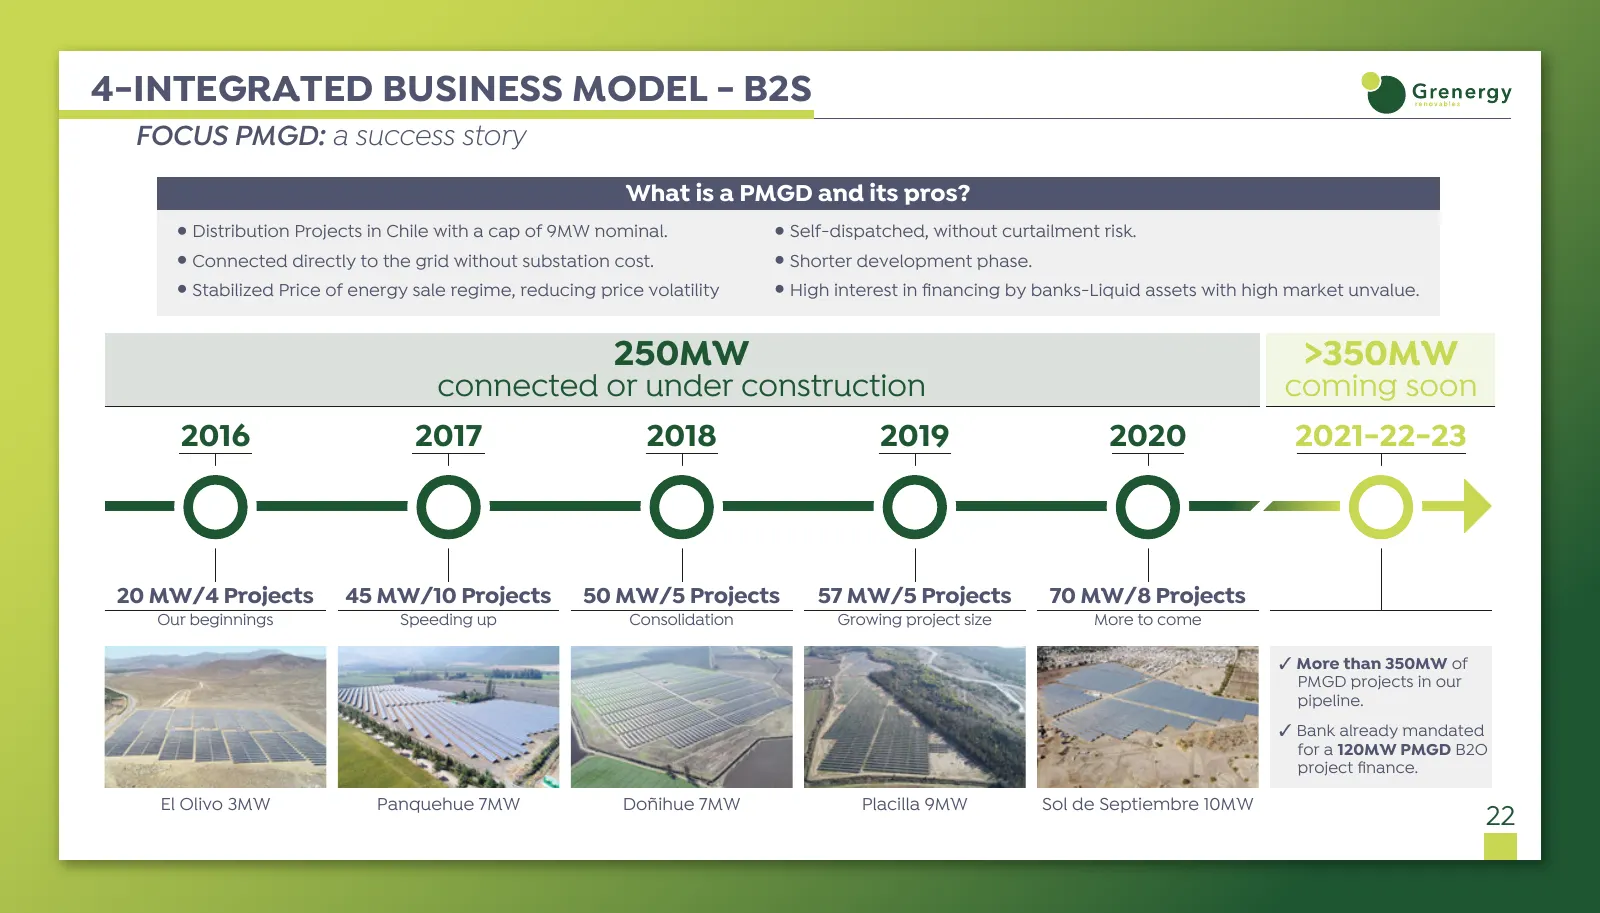
4-INTEGRATED BUSINESS MODEL - B2S FOCUS PMGD: a success story What is a PMGD and its pros? ● Distribution Projects in Chile with a cap of 9MW nominal. ● Self-dispatched, without curtailment risk. ● Connected directly to the grid without substation cost. ● Shorter development phase. ● Stabilized Pric
Slide 24: Key Investment Highlights
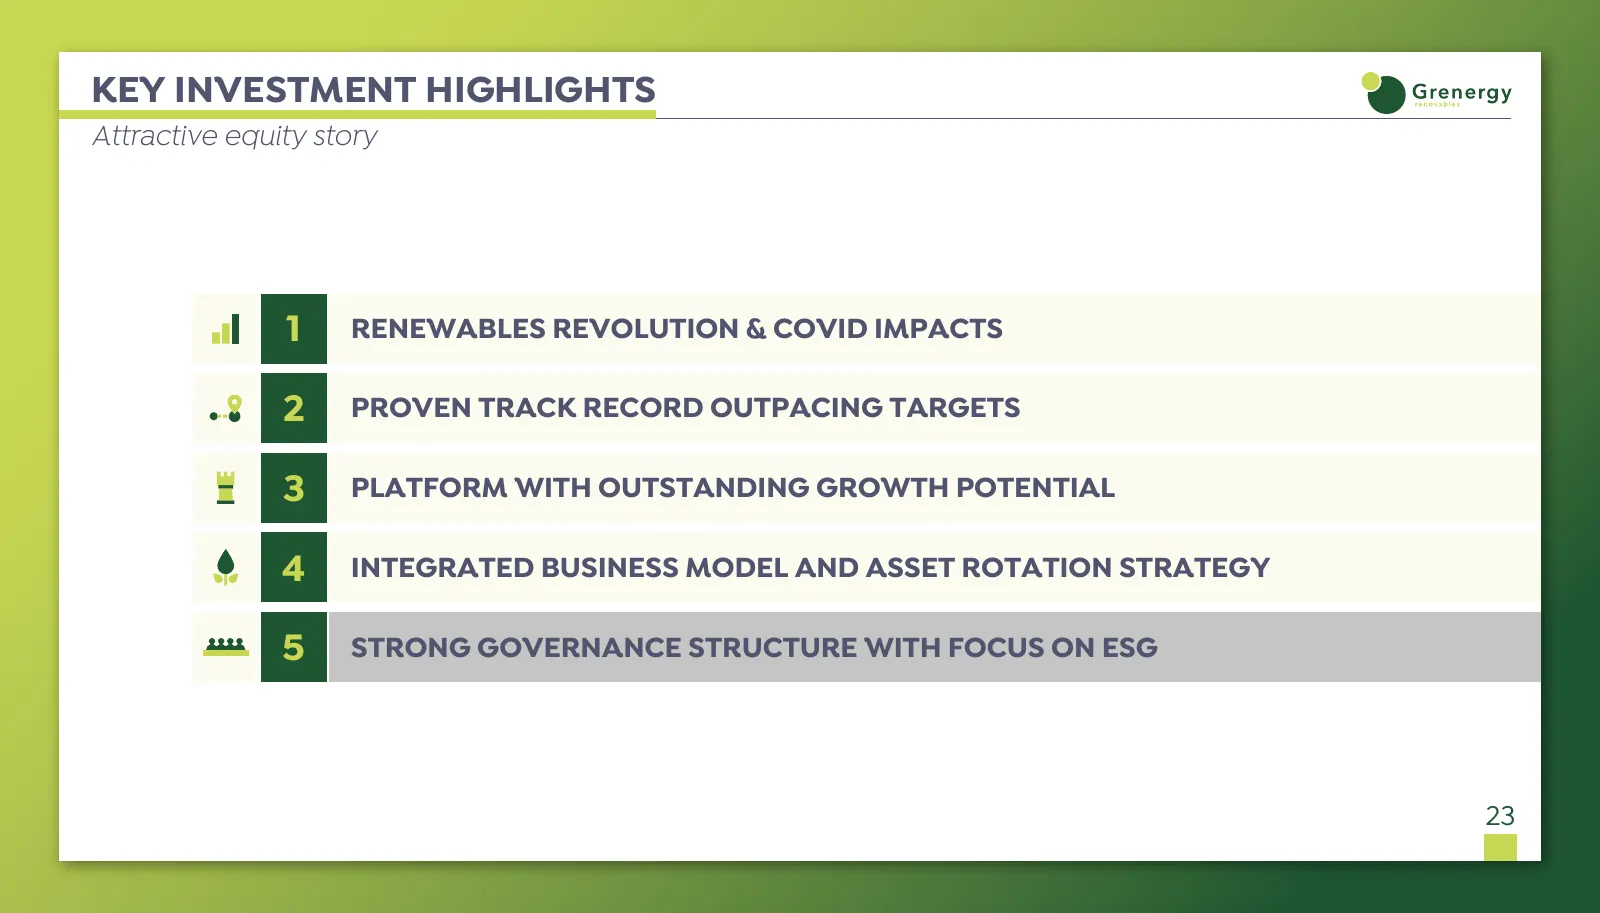
KEY INVESTMENT HIGHLIGHTS Attractive equity story 1 RENEWABLES REVOLUTION & COVID IMPACTS 2 PROVEN TRACK RECORD OUTPACING TARGETS 3 PLATFORM WITH OUTSTANDING GROWTH POTENTIAL 4 INTEGRATED BUSINESS MODEL AND ASSET ROTATION STRATEGY 5 STRONG GOVERNANCE STRUCTURE WITH FOCUS ON ESG 23
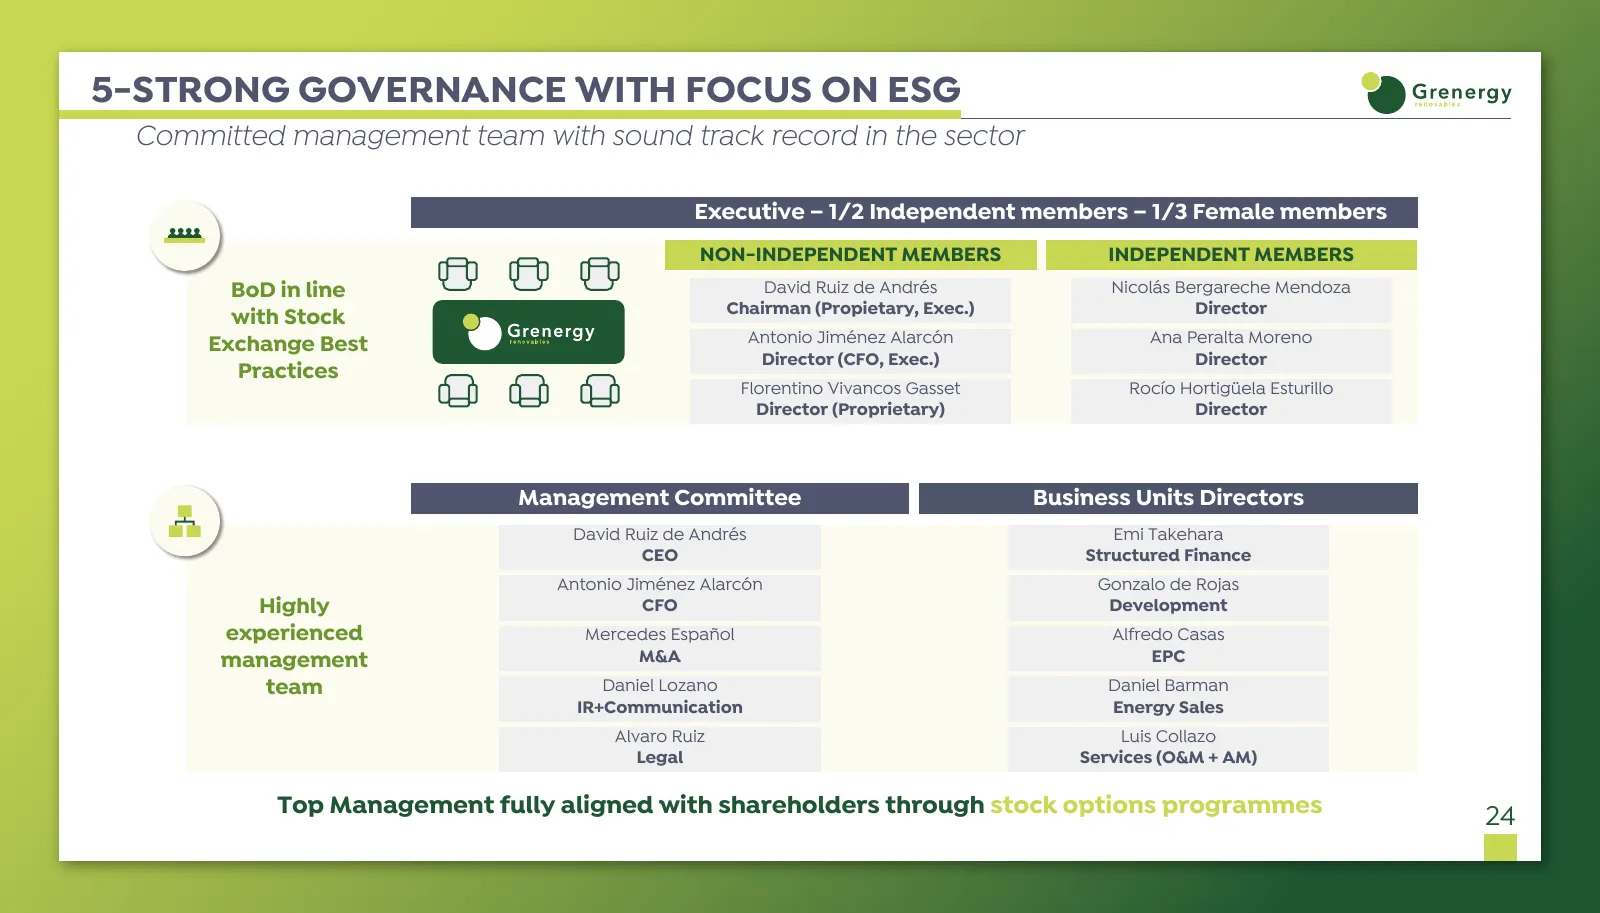
Slide 25: Committed management team with sound track record
5-STRONG GOVERNANCE WITH FOCUS ON ESG Committed management team with sound track record in the sector Executive – 1/2 Independent members – 1/3 Female members NON-INDEPENDENT MEMBERS INDEPENDENT MEMBERS BoD in line David Ruiz de Andrés Nicolás Bergareche Mendoza Chairman (Propietary, Exec.) Director
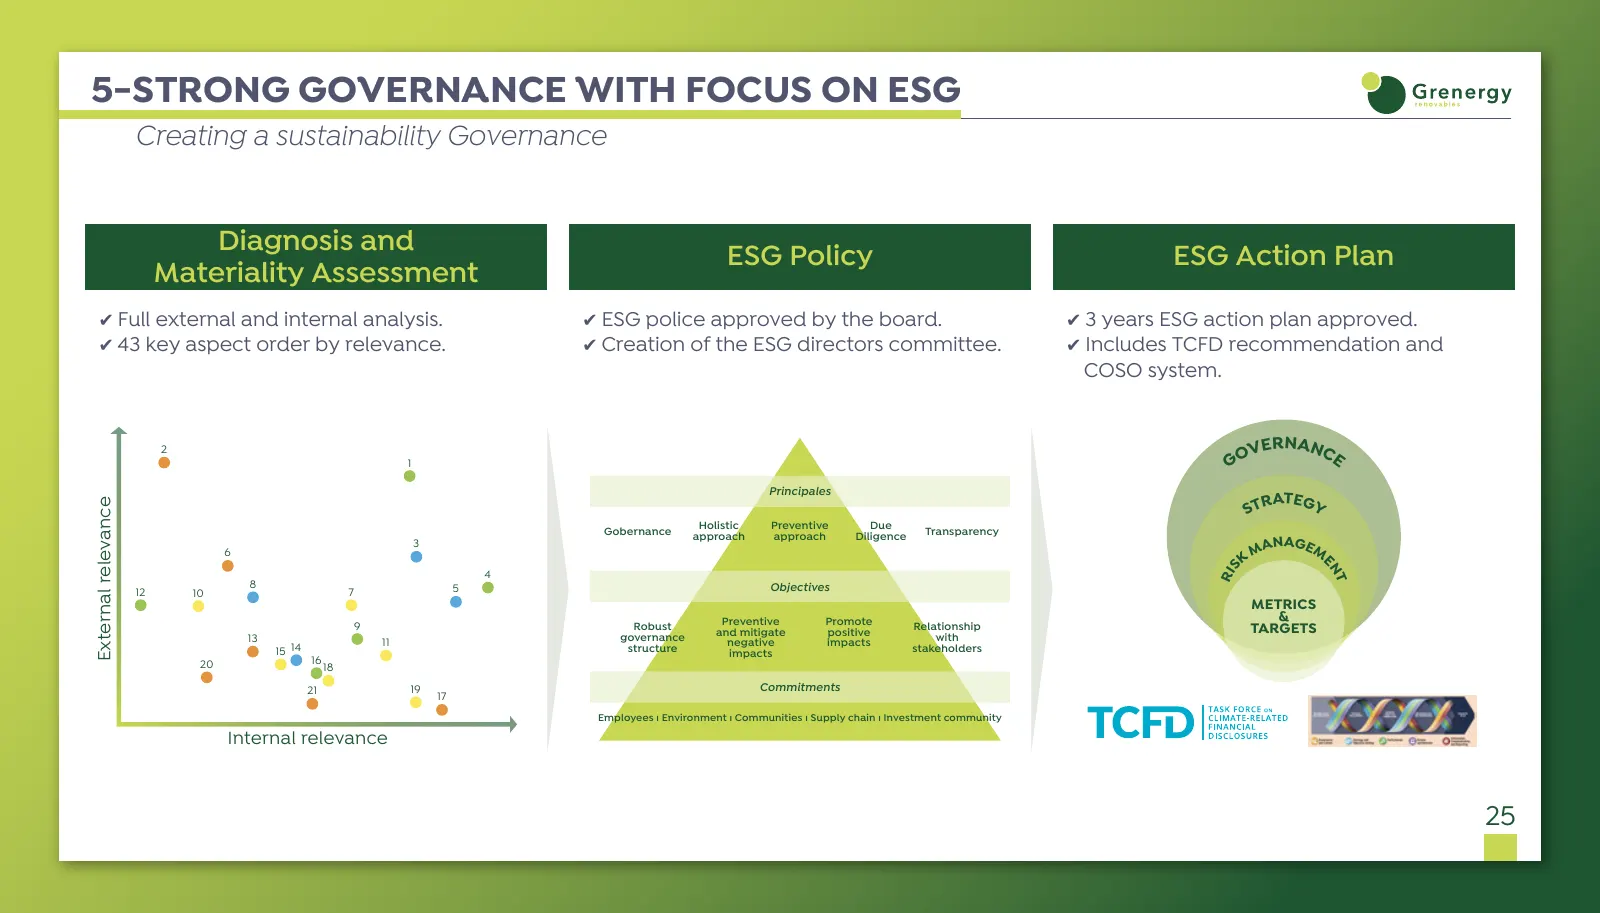
Slide 26: Creating a sustainability Governance
5-STRONG GOVERNANCE WITH FOCUS ON ESG Creating a sustainability Governance Diagnosis and ESG Policy ESG Action Plan Materiality Assessment ✔ Full external and internal analysis. ✔ ESG police approved by the board. ✔ 3 years ESG action plan approved. ✔ 43 key aspect order by relevance. ✔ Creation of
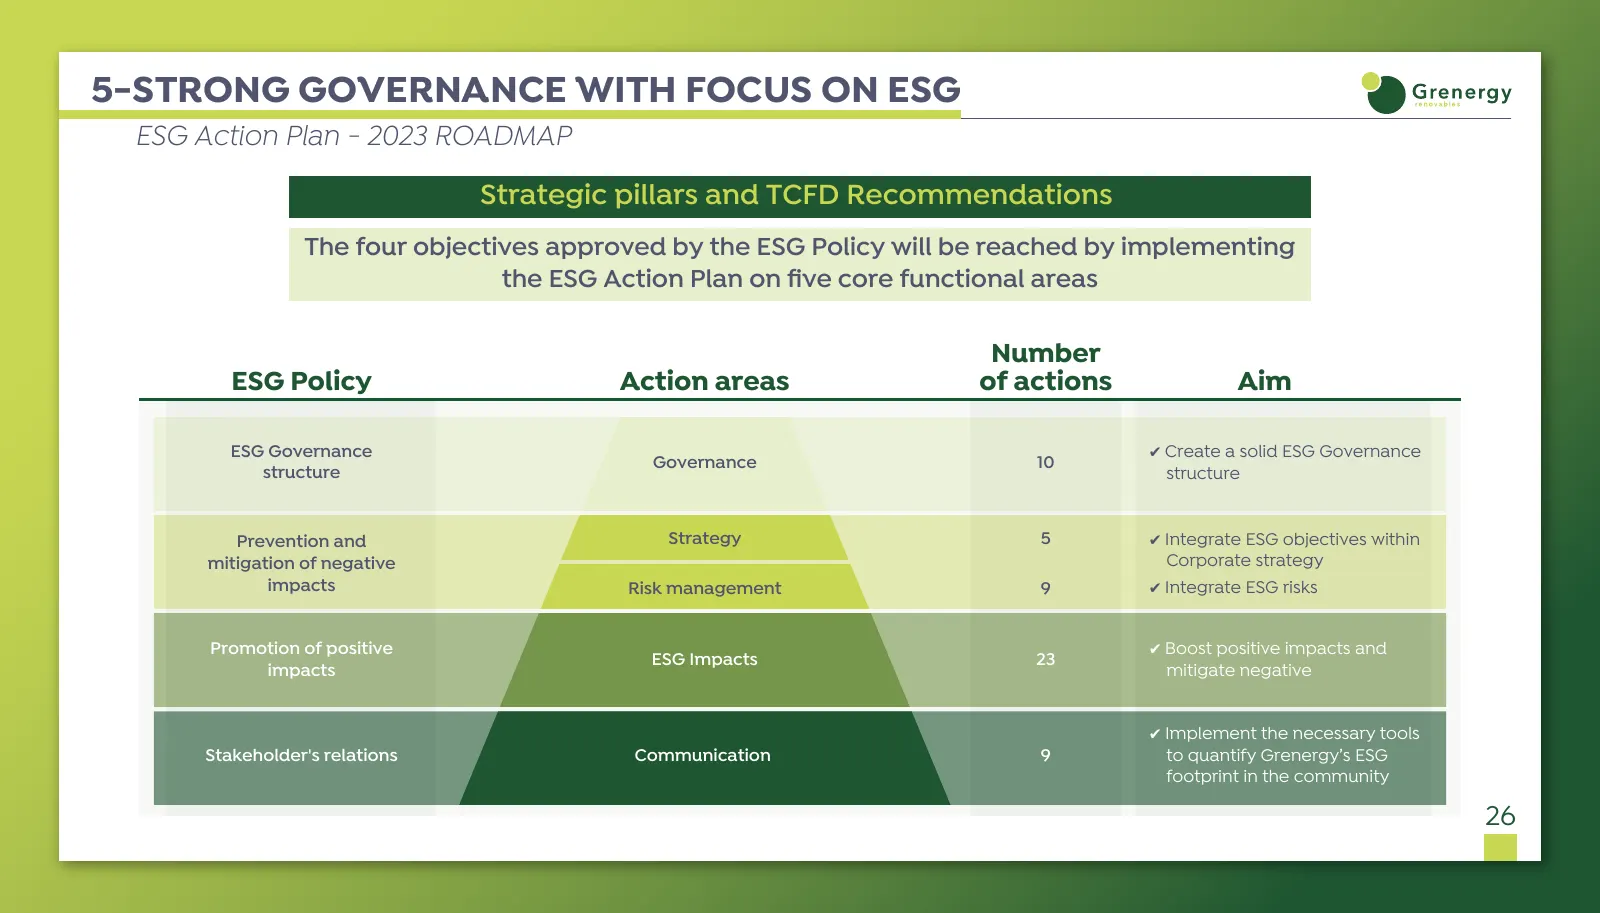
Slide 27: ESG Action Plan - 2023 Roadmap
5-STRONG GOVERNANCE WITH FOCUS ON ESG ESG Action Plan - 2023 ROADMAP Strategic pillars and TCFD Recommendations The four objectives approved by the ESG Policy will be reached by implementing the ESG Action Plan on five core functional areas Number ESG Policy Action areas of actions Aim ESG Governanc
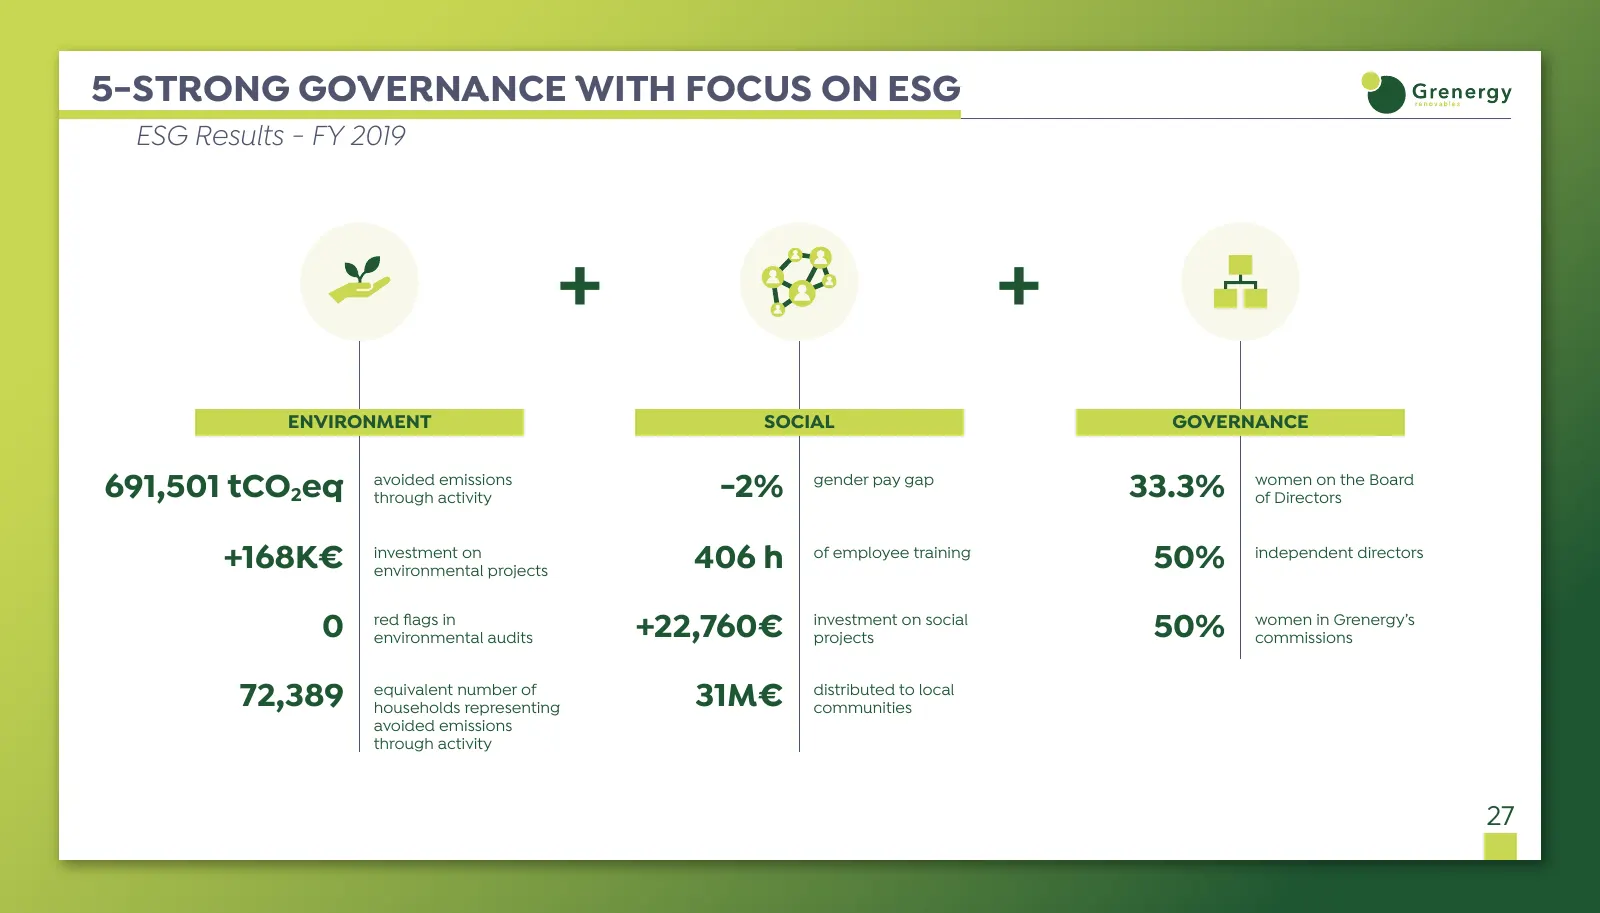
Slide 28: ESG Results - FY 2019
5-STRONG GOVERNANCE WITH FOCUS ON ESG ESG Results - FY 2019 + + ENVIRONMENT SOCIAL GOVERNANCE 691,501 tCO2eq avoided emissions through activity -2% gender pay gap 33.3% women on the Board of Directors +168K€ investment on environmental projects 406 h of employee training 50% independent directors 0
Slide 29: Translating into solid value creation for its shareholders
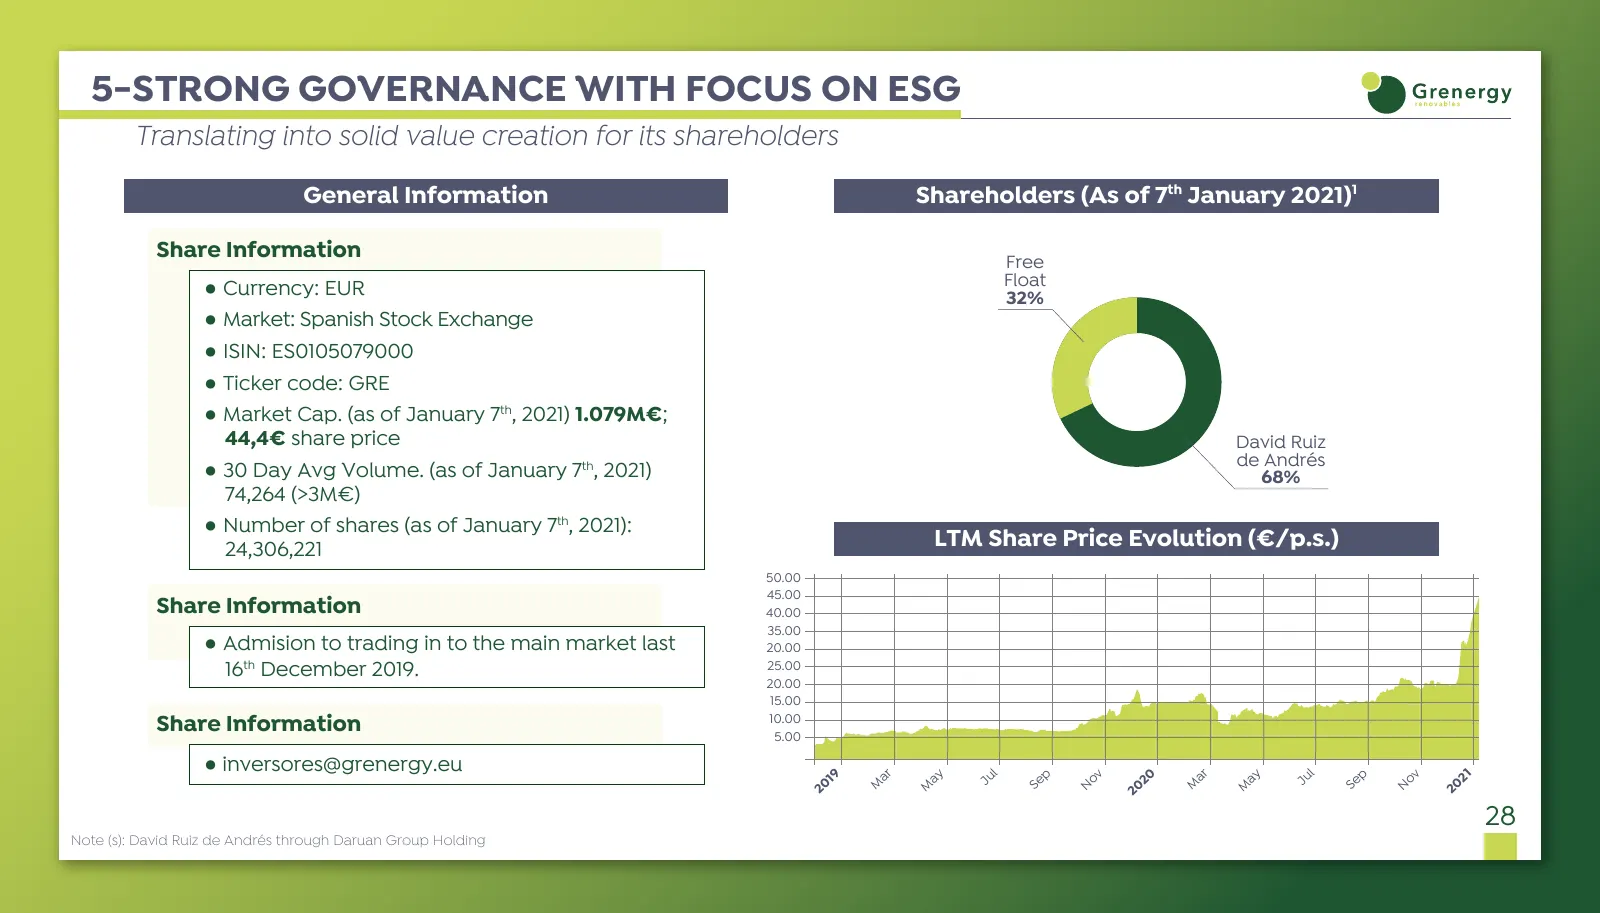
5-STRONG GOVERNANCE WITH FOCUS ON ESG Translating into solid value creation for its shareholders General Information Shareholders (As of 7th January 2021)1 Share Information Free ● Currency: EUR Float 32% ● Market: Spanish Stock Exchange ● ISIN: ES0105079000 ● Ticker code: GRE ● Market Cap. (as of J
Slide 30: Appendixes
@ Grenergy APPENDIXES
Slide 31: Project Portfolio classification
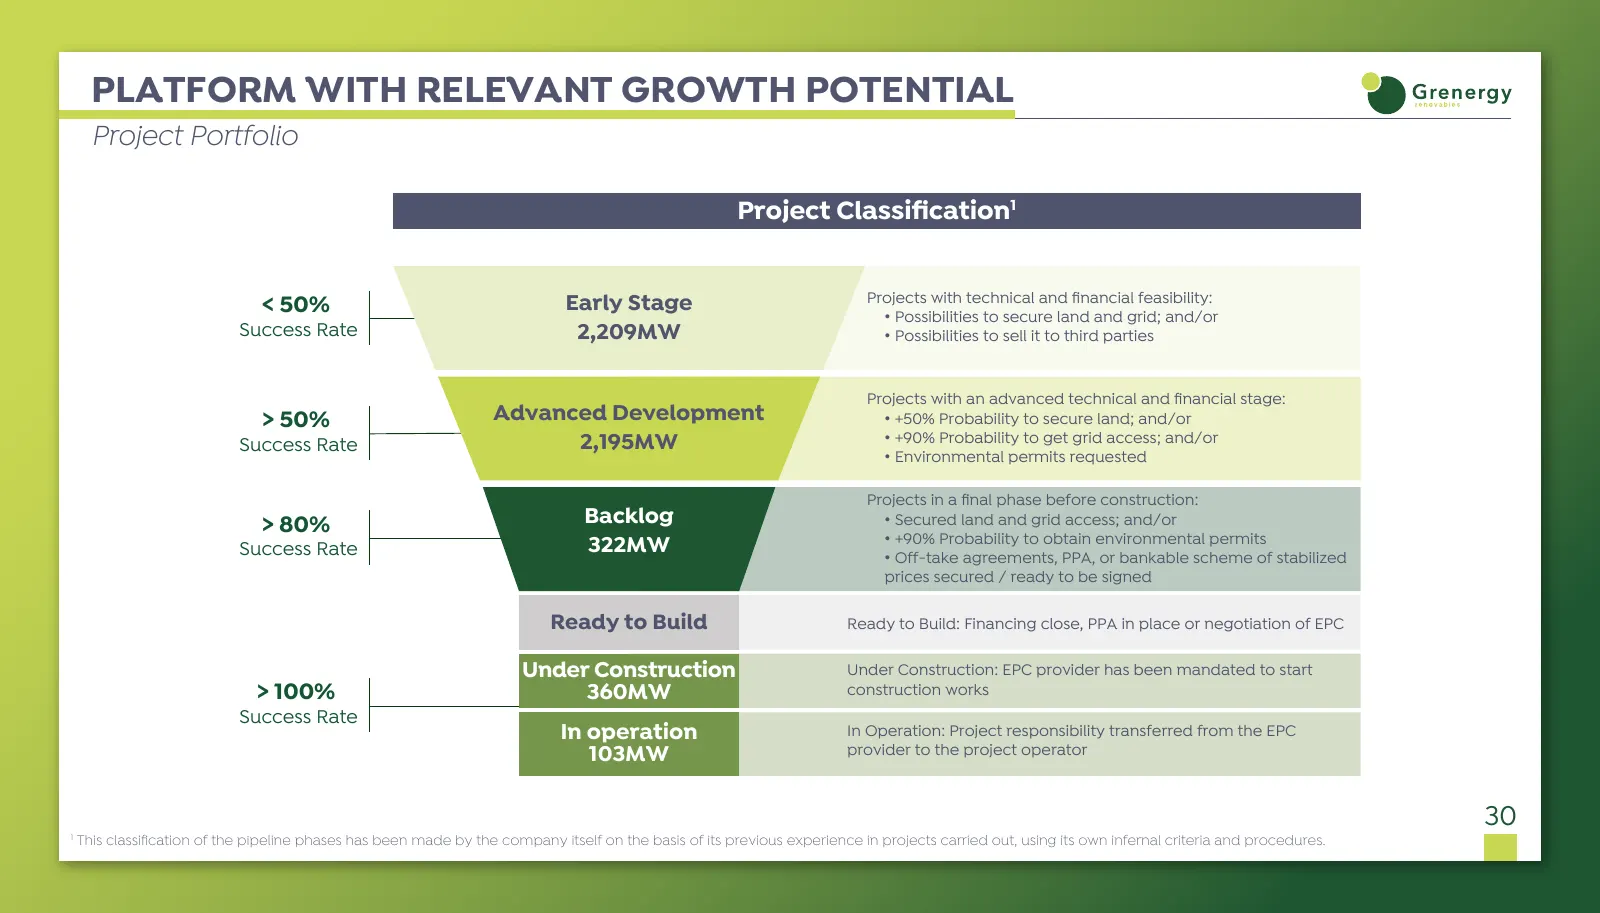
PLATFORM WITH RELEVANT GROWTH POTENTIAL Project Portfolio Project Classification1 Early Stage Projects with technical and financial feasibility: < 50% • Possibilities to secure land and grid; and/or Success Rate 2,209MW • Possibilities to sell it to third parties Projects with an advanced technical an
Slide 32: Project Overview: 360MW Under Construction
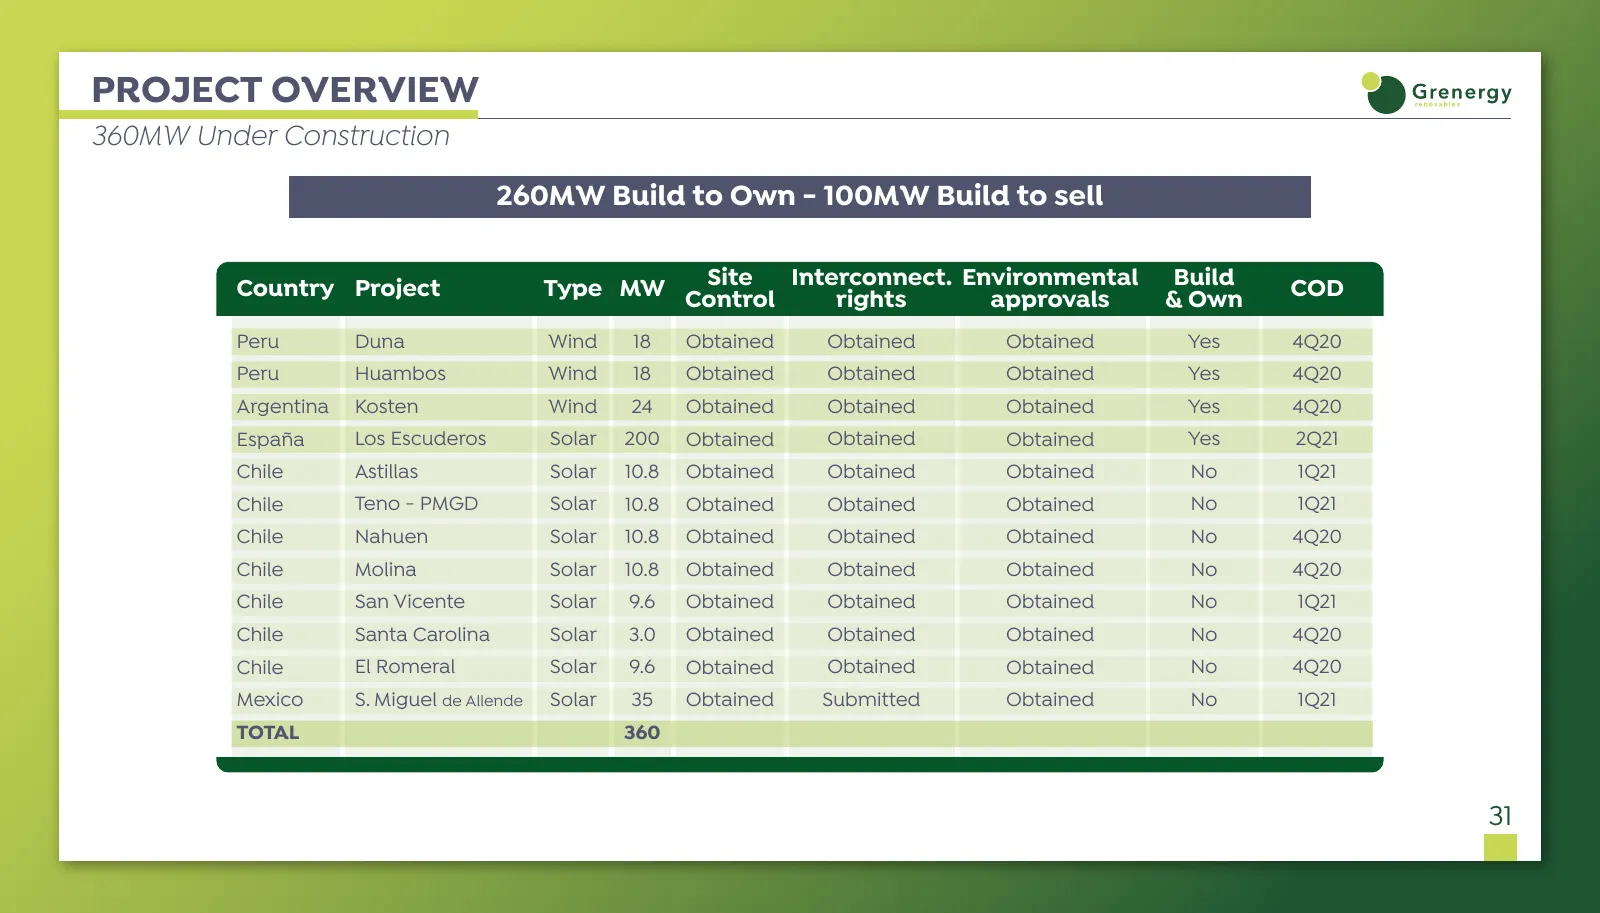
PROJECT OVERVIEW 360MW Under Construction 260MW Build to Own - 100MW Build to sell Country Project Site Type MW Control Interconnect. Environmental Build COD rights approvals & Own Peru Duna Wind 18 Obtained Obtained Obtained Yes 4Q20 Peru Huambos Wind 18 Obtained Obtained Obtained Yes 4Q20 Argentin
Slide 33: Project Overview: 322MW Backlog
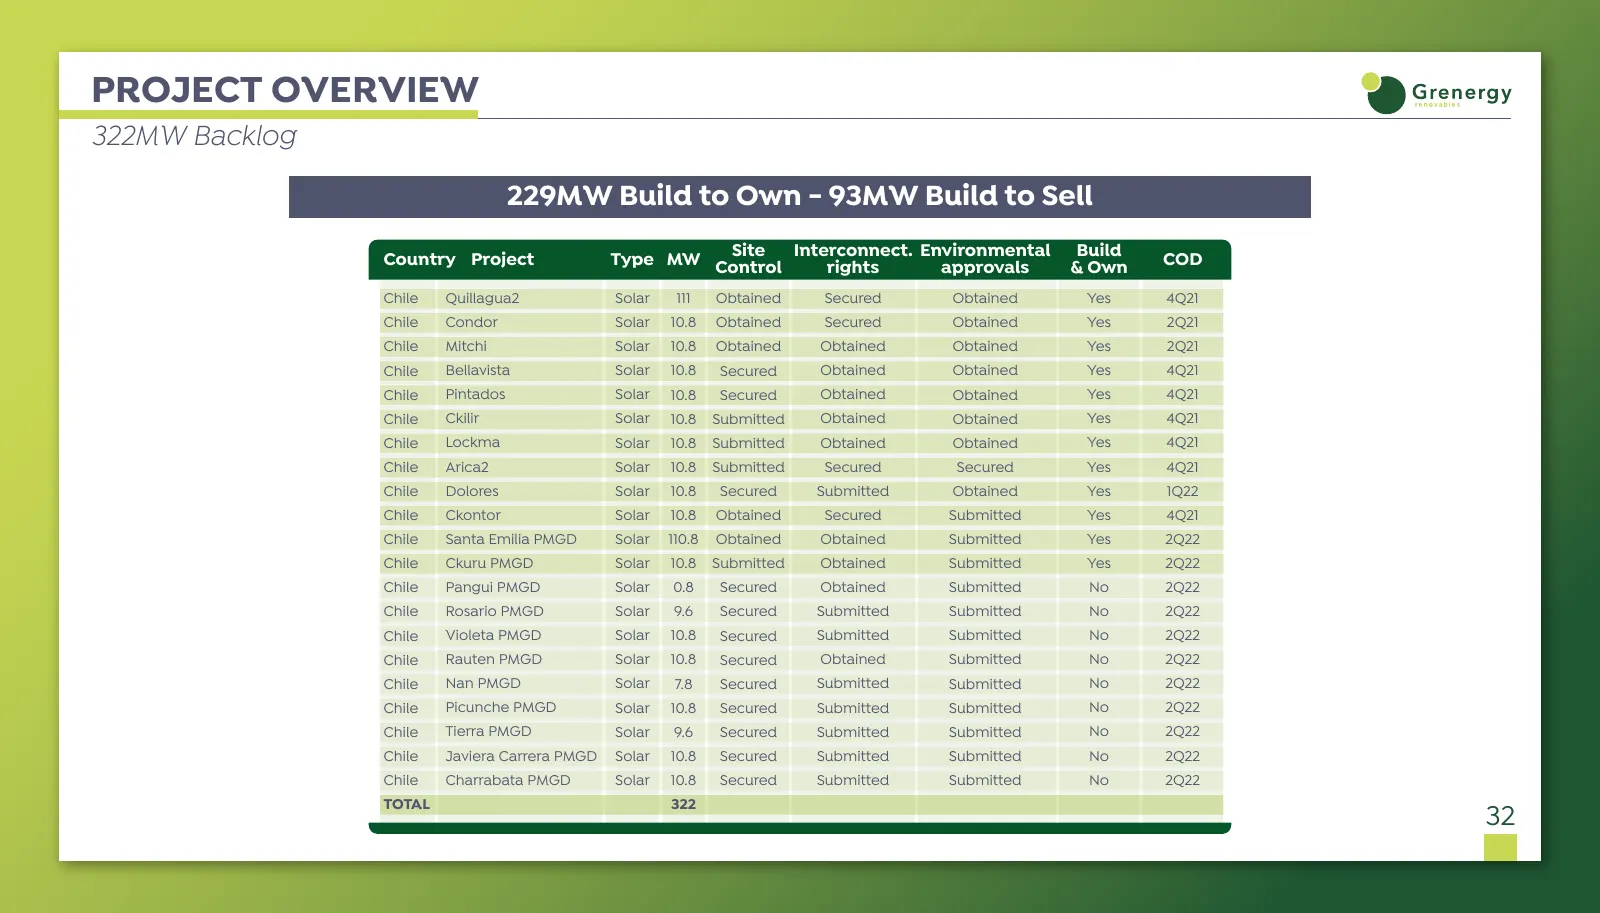
PROJECT OVERVIEW 322MW Backlog 229MW Build to Own - 93MW Build to Sell Country Project Site Type MW Control Interconnect. Environmental Build COD rights approvals & Own Chile Quillagua2 Solar 111 Obtained Secured Obtained Yes 4Q21 Chile Condor Solar 10.8 Obtained Secured Obtained Yes 2Q21 Chile Mitc
Slide 34: Project Overview: 2,195MW Advanced Development
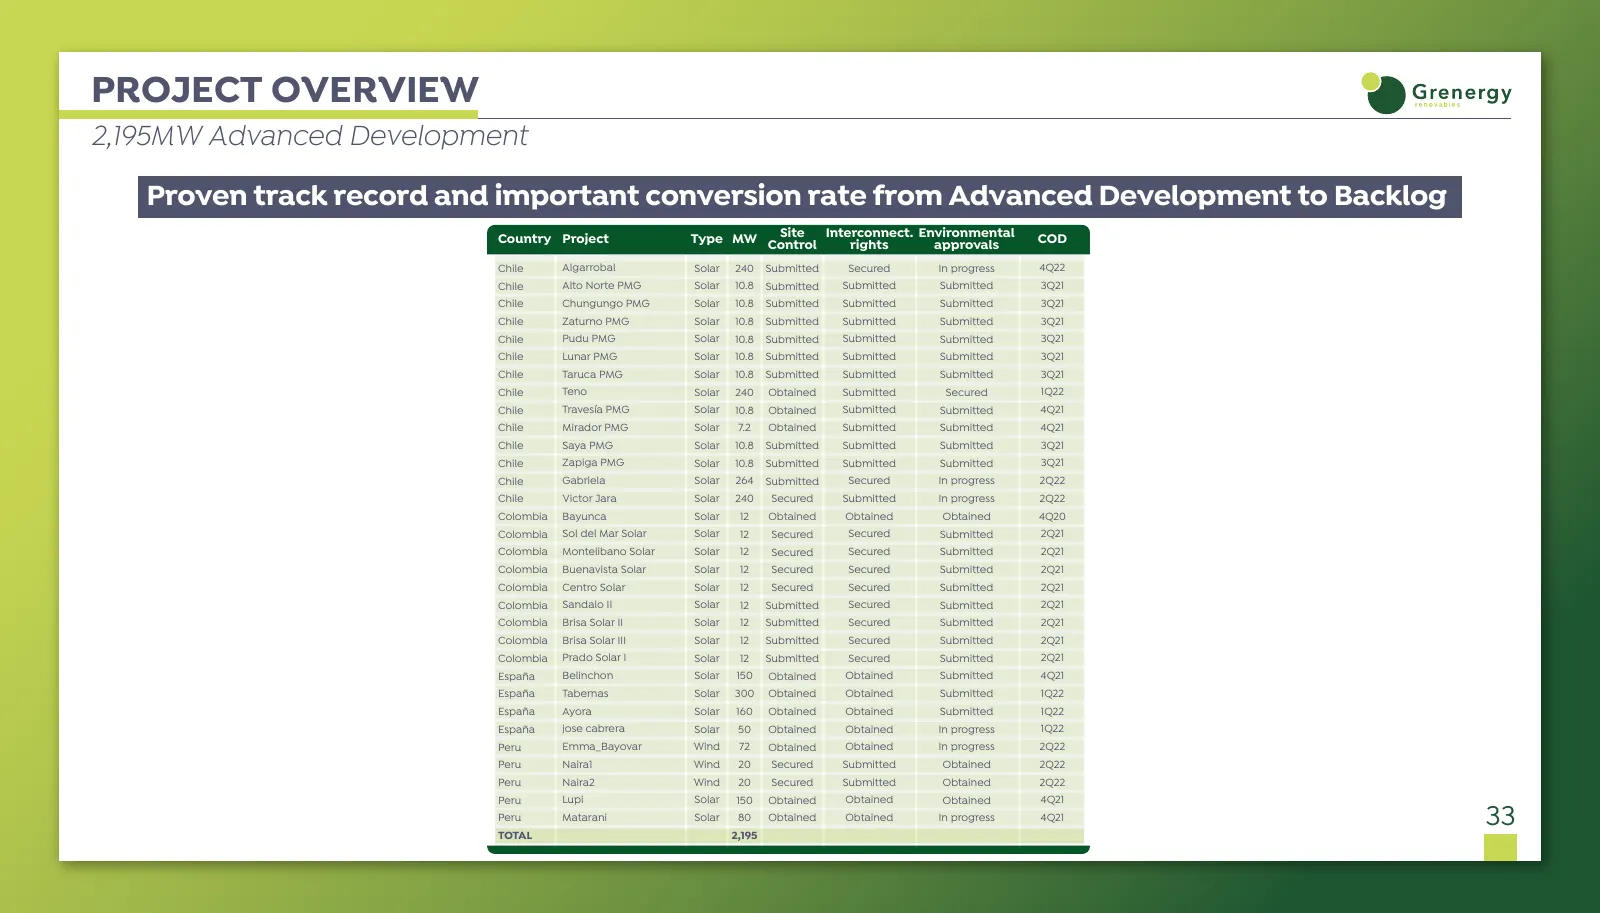
PROJECT OVERVIEW 2,195MW Advanced Development Proven track record and important conversion rate from Advanced Development to Backlog Country Project Site Type MW Control Interconnect. Environmental COD rights approvals Chile Algarrobal Solar 240 Submitted Secured In progress 4Q22 Chile Alto Norte PM
Slide 35: 9M20 Results: Profit and Losses
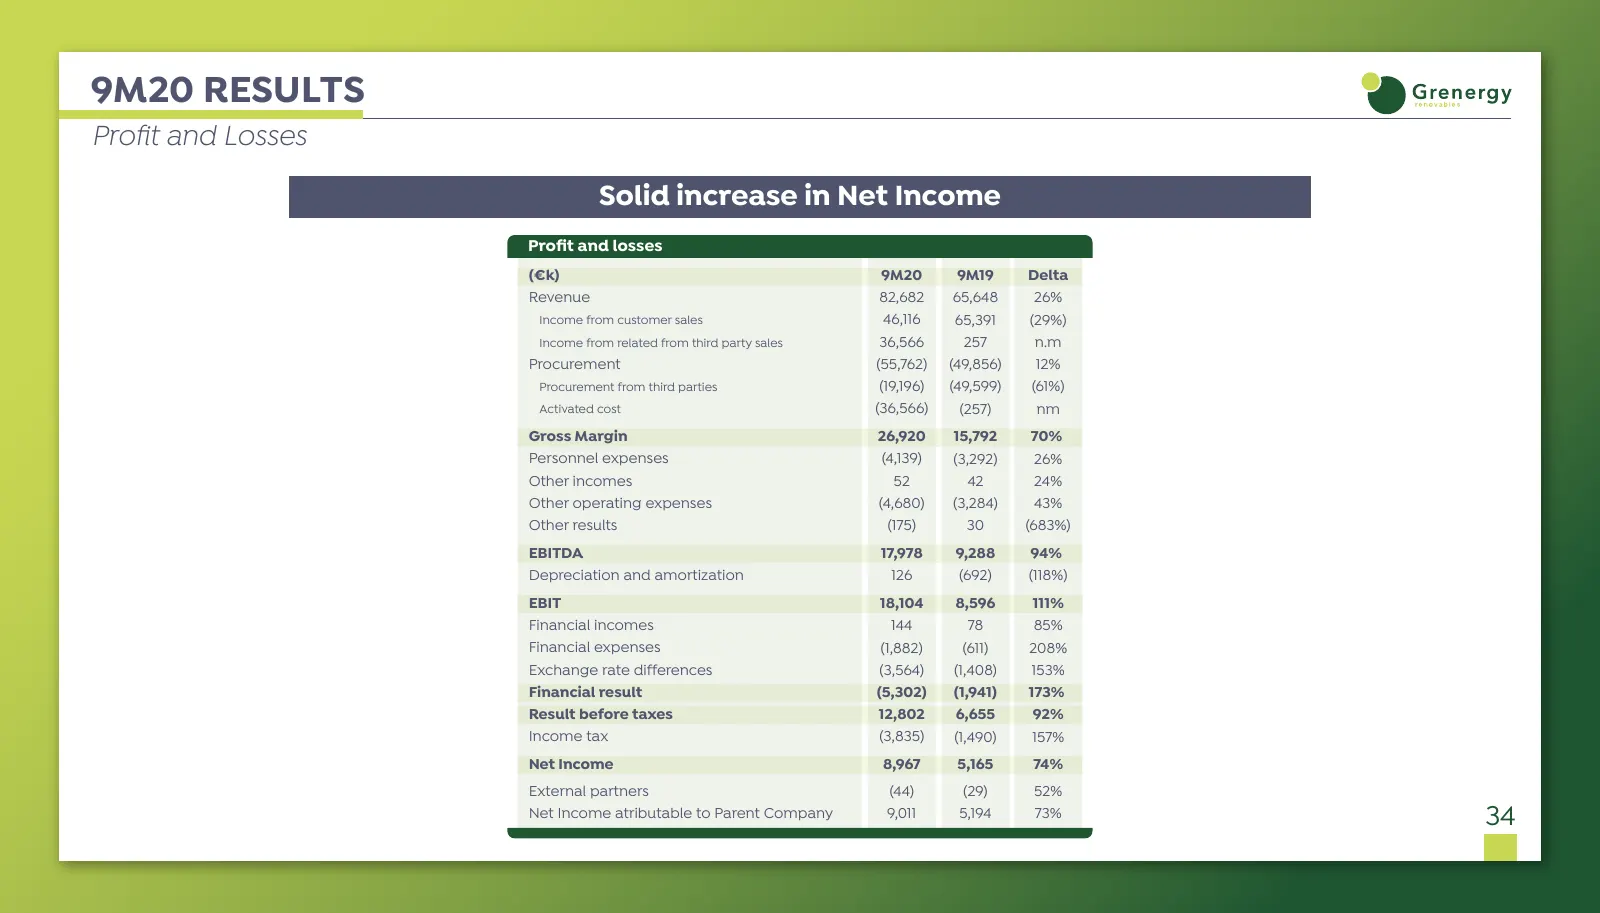
9M20 RESULTS Profit and Losses Solid increase in Net Income Profit and losses (€k) 9M20 9M19 Delta Revenue 82,682 65,648 26% Income from customer sales 46,116 65,391 (29%) Income from related from third party sales 36,566 257 n.m Procurement (55,762) (49,856) 12% Procurement from third parties (19,19
Slide 36: 9M20 Results: Balance Sheet
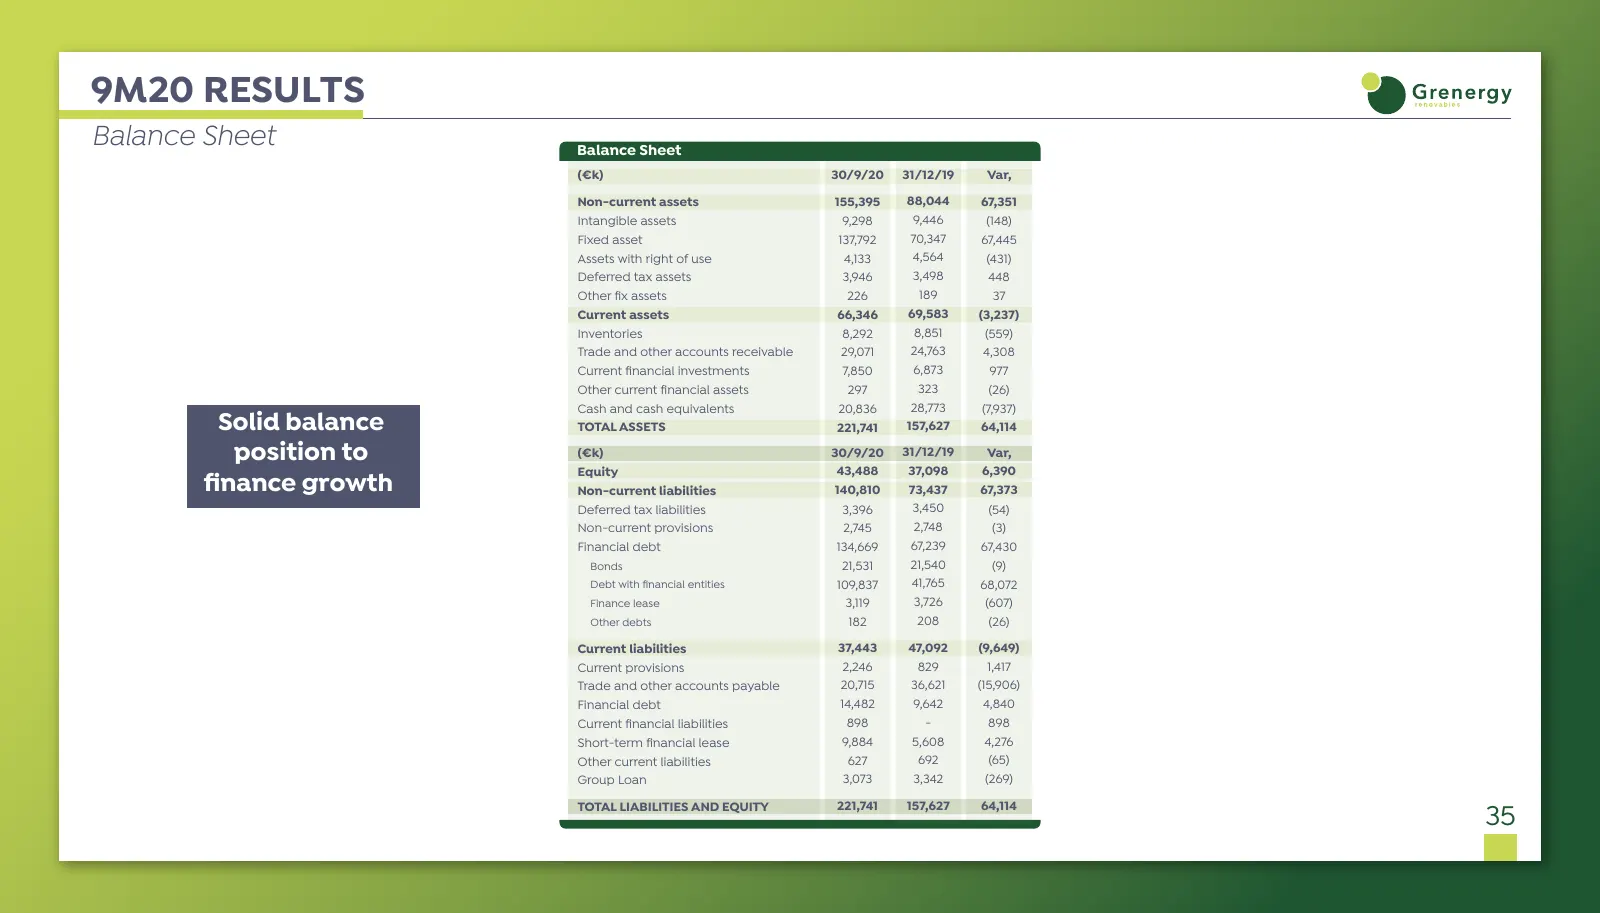
9M20 RESULTS Balance Sheet Balance Sheet (€k) 30/9/20 31/12/19 Var, Non-current assets 155,395 88,044 67,351 Intangible assets 9,298 9,446 (148) Fixed asset 137,792 70,347 67,445 Assets with right of use 4,133 4,564 (431) Deferred tax assets 3,946 3,498 448 Other fix assets 226 189 37 Current assets
Slide 37: 9M20 Results: Net Debt
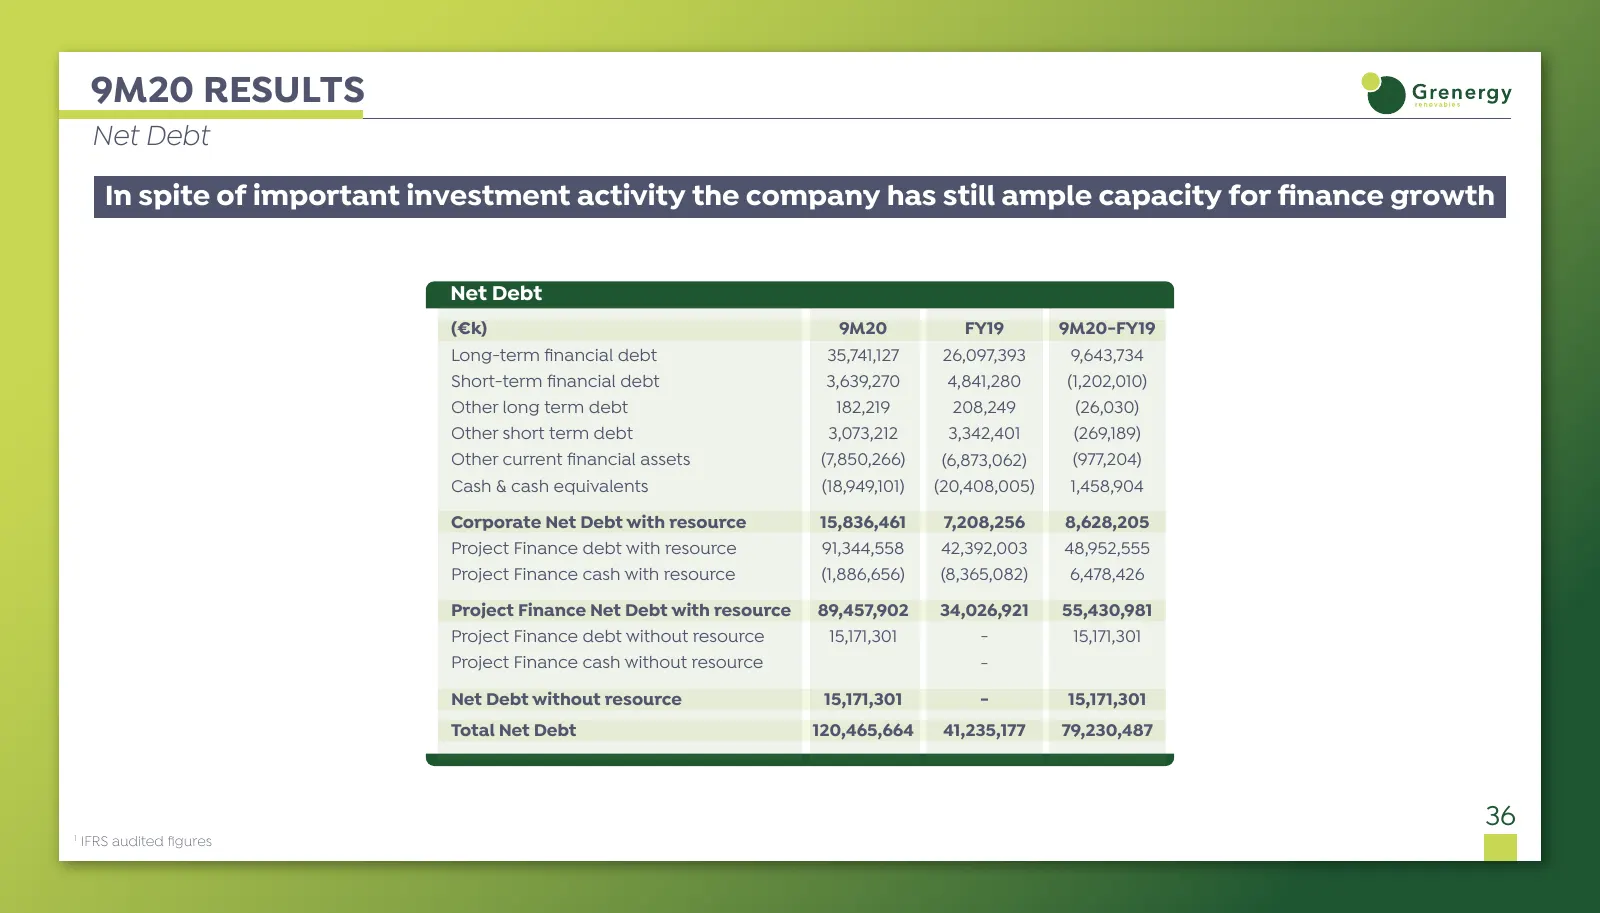
9M20 RESULTS Net Debt In spite of important investment activity the company has still ample capacity for finance growth Net Debt (€k) 9M20 FY19 9M20-FY19 Long-term financial debt 35,741,127 26,097,393 9,643,734 Short-term financial debt 3,639,270 4,841,280 (1,202,010) Other long term debt 182,219 208
Slide 38: Developers and IPP of Solar PV & Wind projects
Developers and IPP of SOLAR PV & WIND projects Chile - Spain - Peru - Colombia - Italy - Mexico - Argentina
Source: Internet Archive copy of grenergy.eu
More decks from Grenergy Renovables S.A
 H1 2026 Earnings Presentation38 slides · Sep 16, 2026
 Investor Presentation (September 2026)55 slides · September 2026
 Investor Presentation (July 2026)46 slides · July 2026
 Q1 2026 Earnings Presentation50 slides · May 27, 2026
 9M 2025 Earnings Presentation36 slides · Nov 27, 2025
 Investor Day (May 2025)50 slides · May 28, 2025