PT Bank Negara Indonesia (Persero) Tbk Class B · IDX:BBNI
PT Bank Negara Indonesia (Persero) Tbk Class B — FY2009 Earnings Presentation
48 slides from PT Bank Negara Indonesia (Persero) Tbk Class B's earnings presentation, Feb 17, 2010
Slide 1: Corporate Presentation Full Year 2009
Continuously and Sustainably Section Achieving Growth Corporate Presentation Full Year 2009 PT Bank Negara Indonesia (Persero) Tbk Disclaimer: This report has been prepared by PT Bank Negara Indonesia (Persero) Tbk (Bank BNI) independently and is circulated for the purpose of general information onl
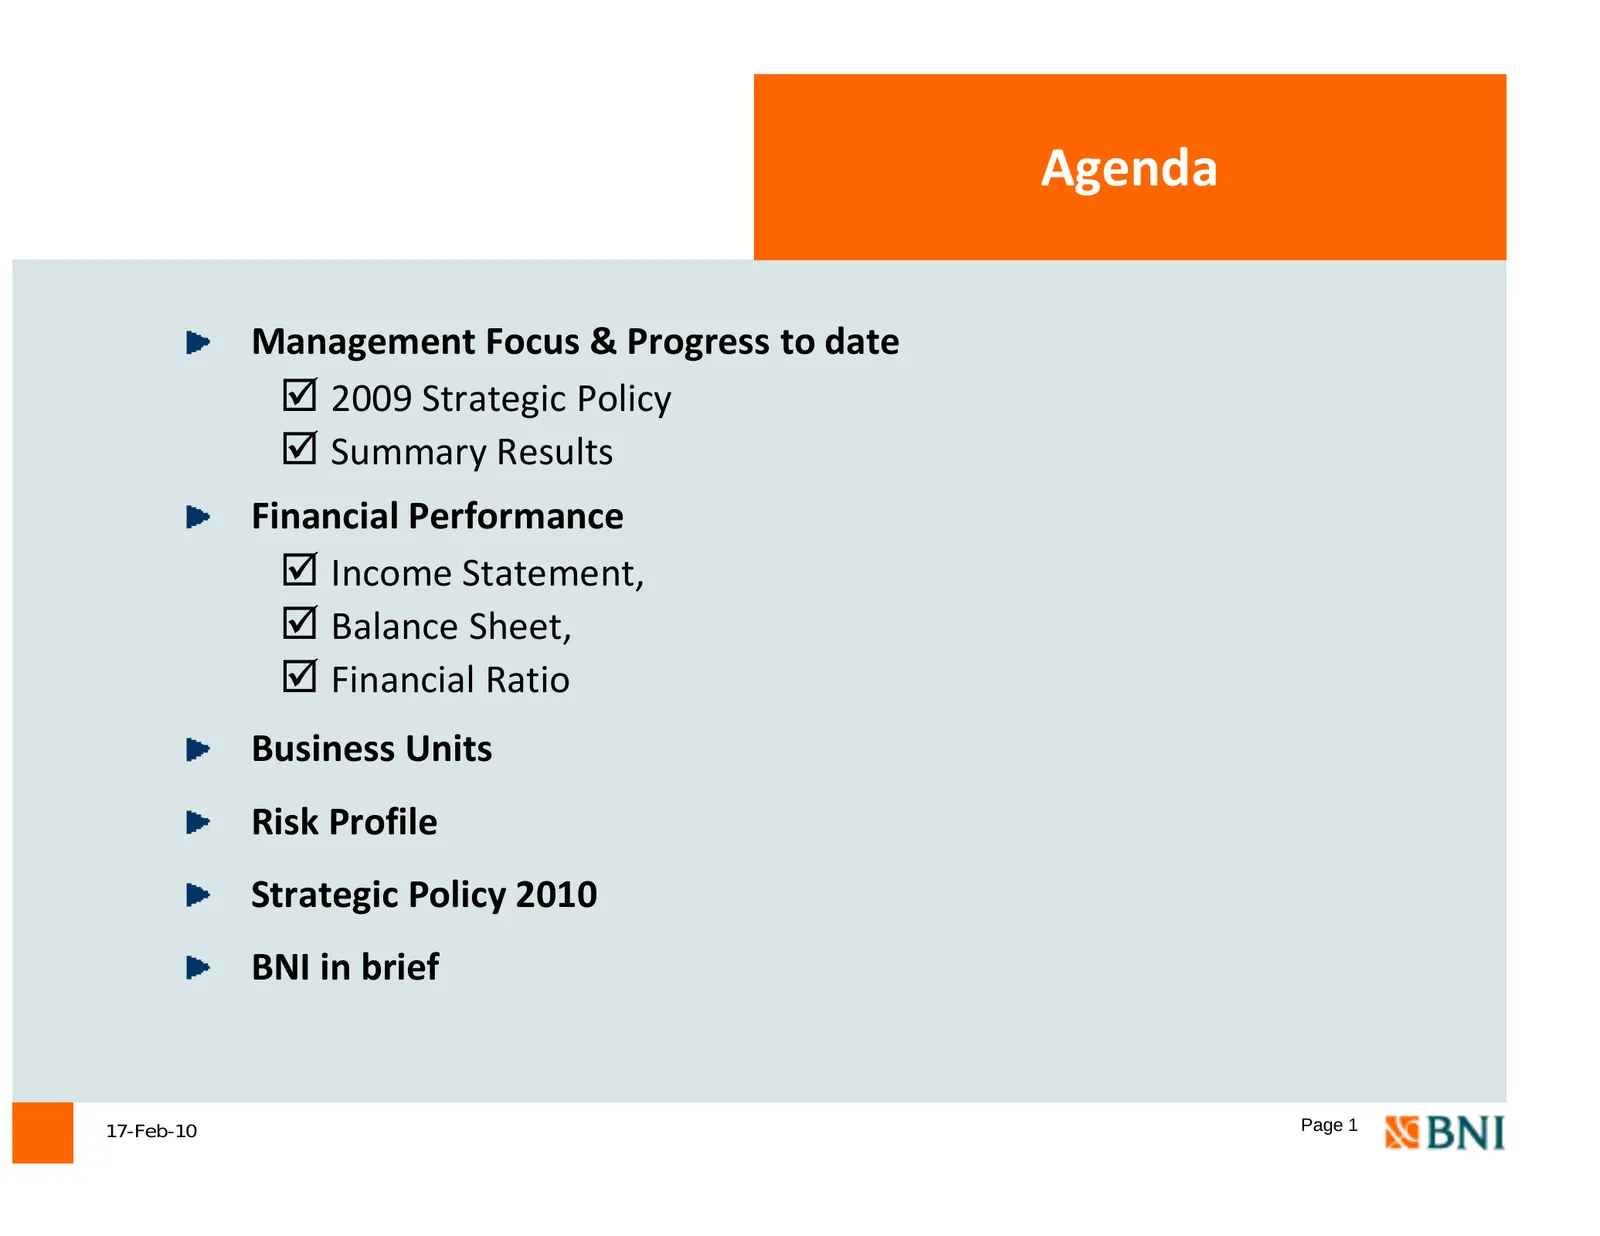
Slide 2: Agenda
Agenda Management Focus & Progress to date ; 2009 Strategic Policy l ; Summary Results Financial Performance ; Income Statement, ; Balance Sheet, ; Financial Ratio Business Units Risk Profile Strategic Policy 2010 BNI in brief 17-Feb-10 Page 1
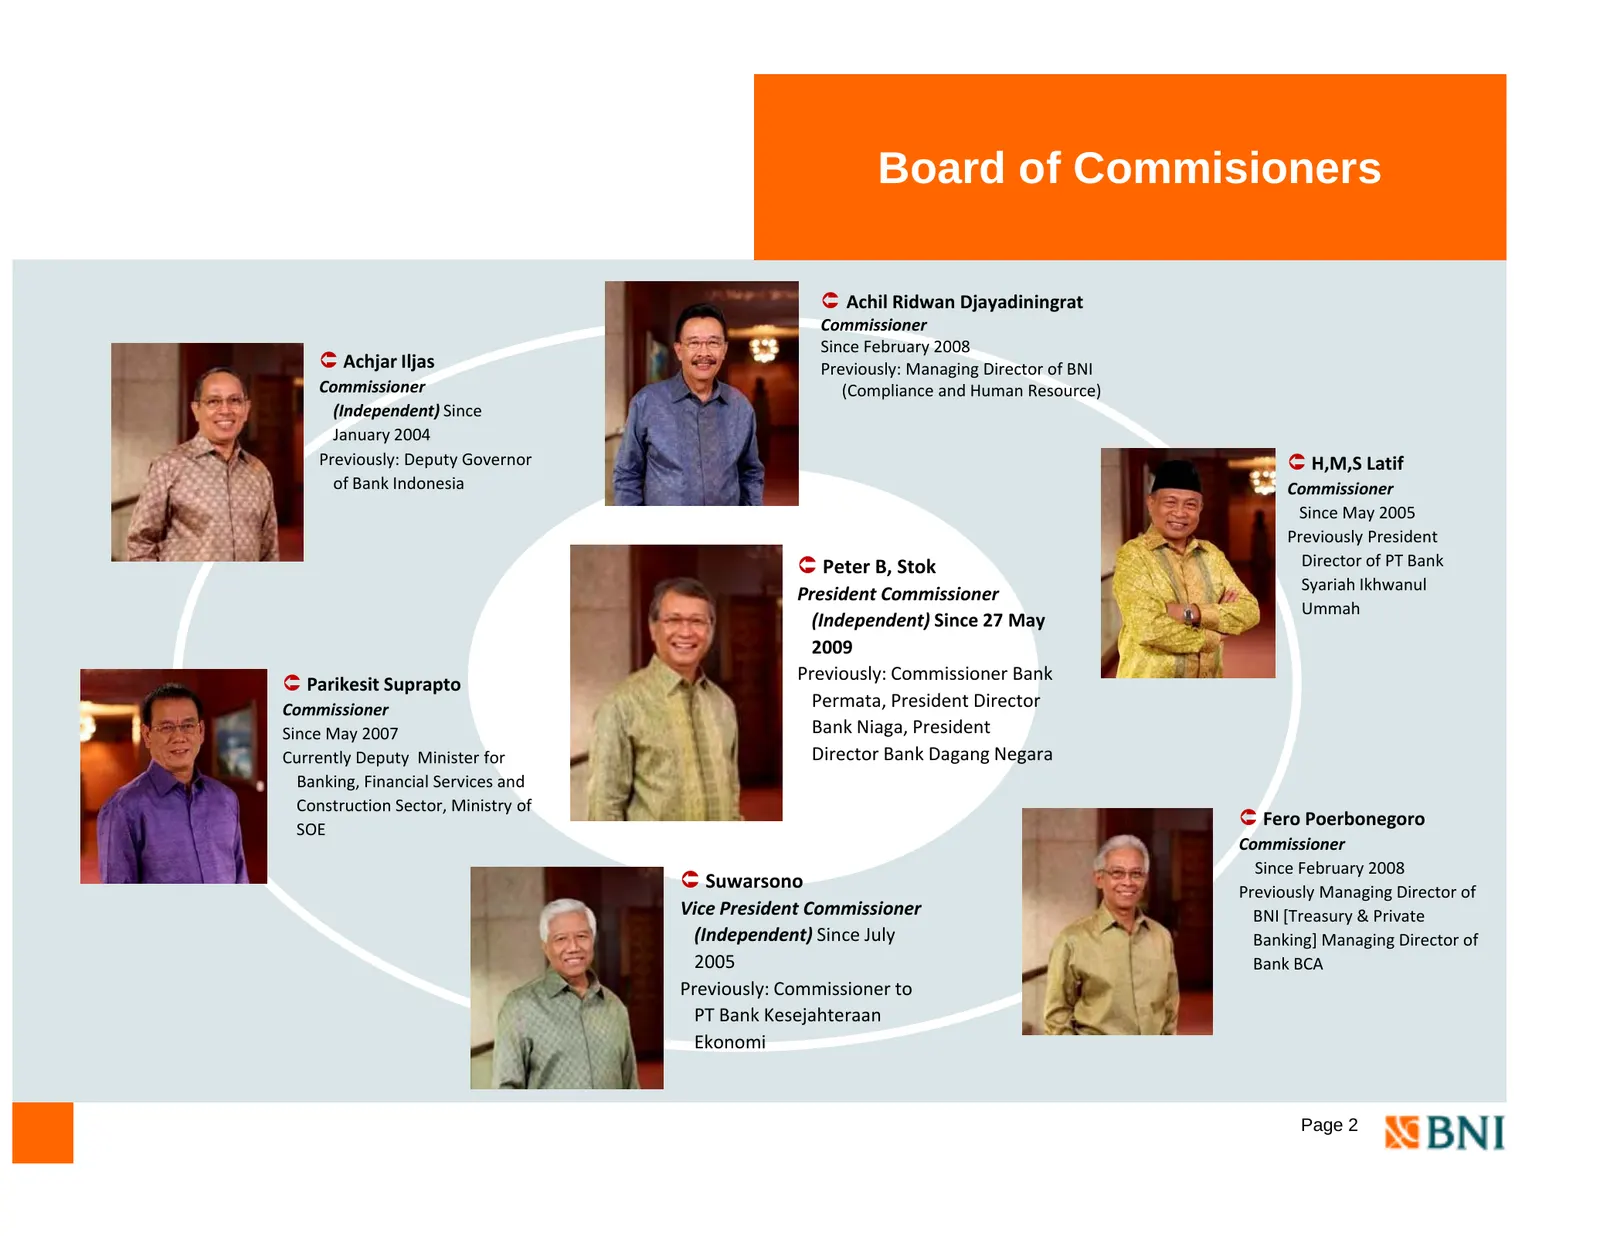
Slide 3: Board of Commissioners
Board of Commisioners Á Achil Ridwan Djayadiningrat Commissioner Since February 2008 Á Achjar Iljas Previously: Managing Director of BNI Commissioner C i i ( (Compliance l and Human Resource)) (Independent) Since January 2004 Previously: Deputy Governor Á H,M,S Latif of Bank Indonesia Commissioner S
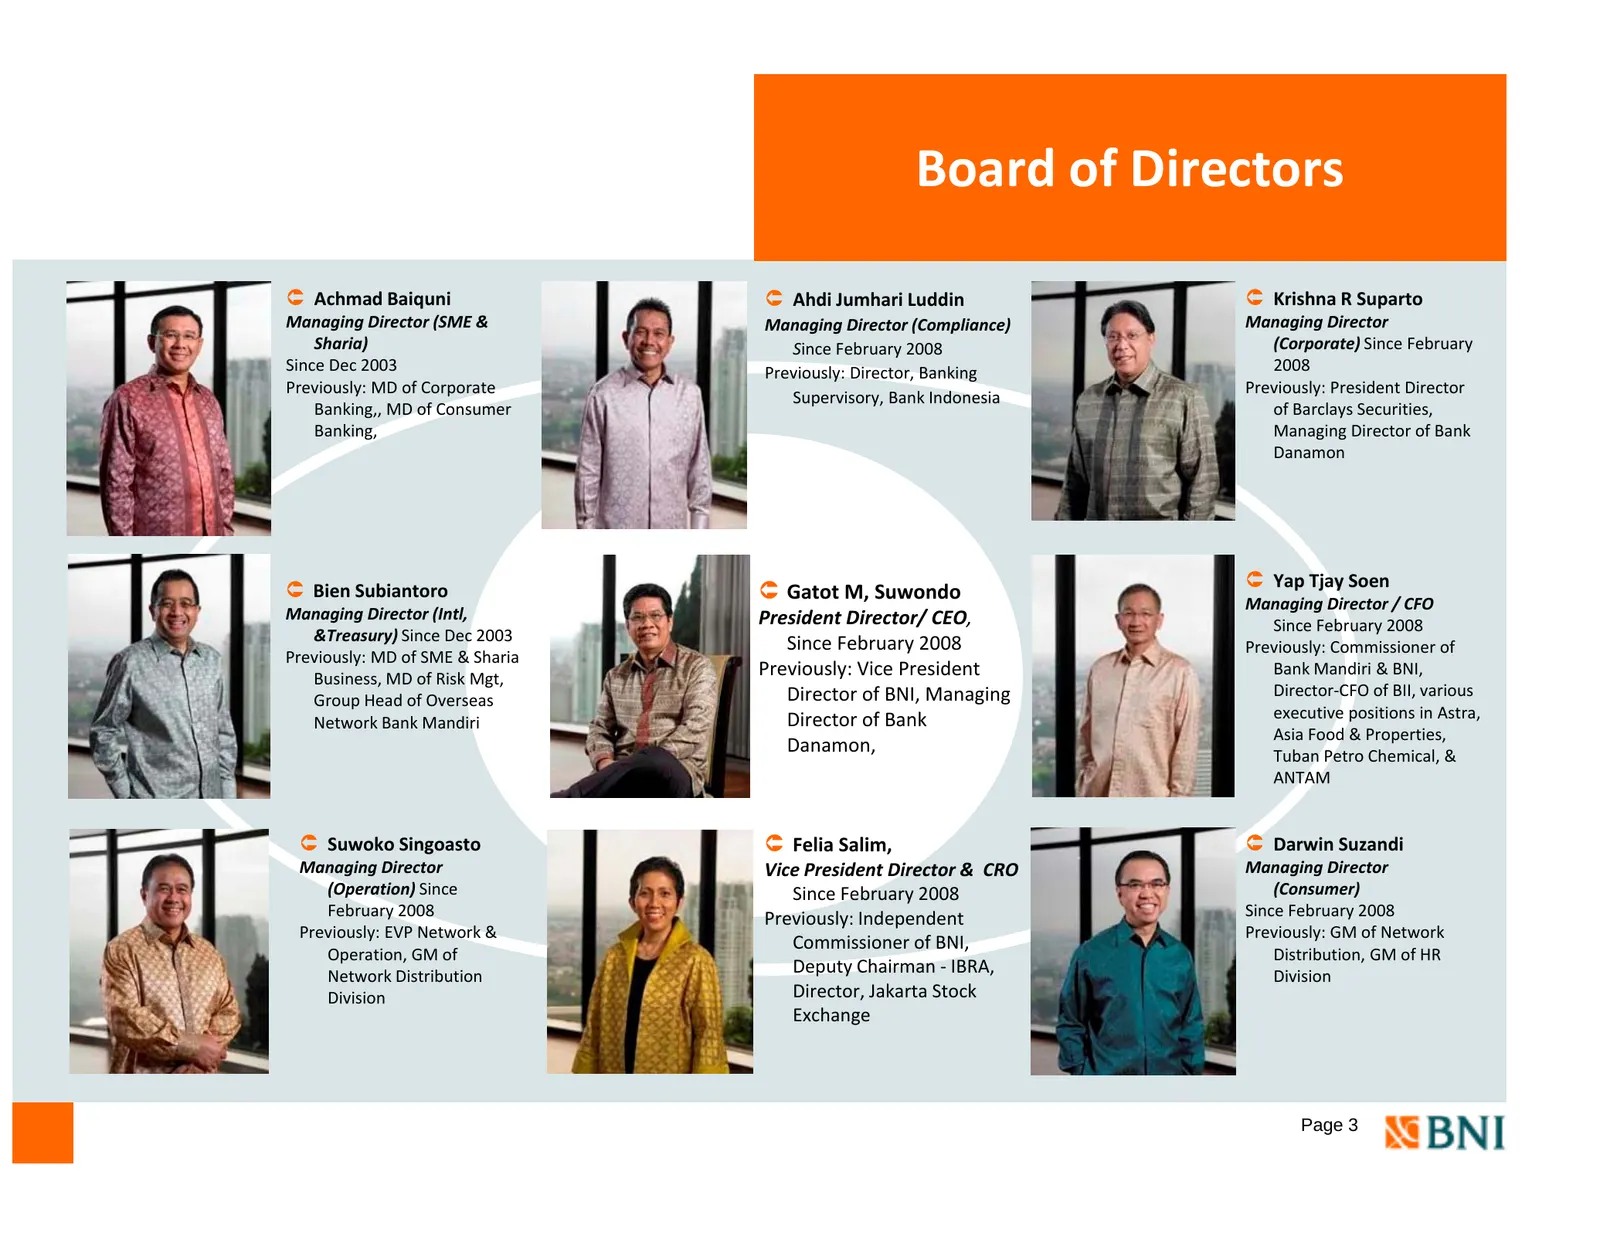
Slide 4: Board of Directors
Board of Directors Á Achmad Baiquni Á Ahdi Jumhari Luddin Á Krishna R Suparto Managing Director (SME & Managing Director (Compliance) Managing Director Sharia) Since February 2008 (Corporate) Since February Since Dec 2003 Previously: Director, Banking 2008 P i l MD off C Previously: Corporate t P i
Slide 5: BNI Shares
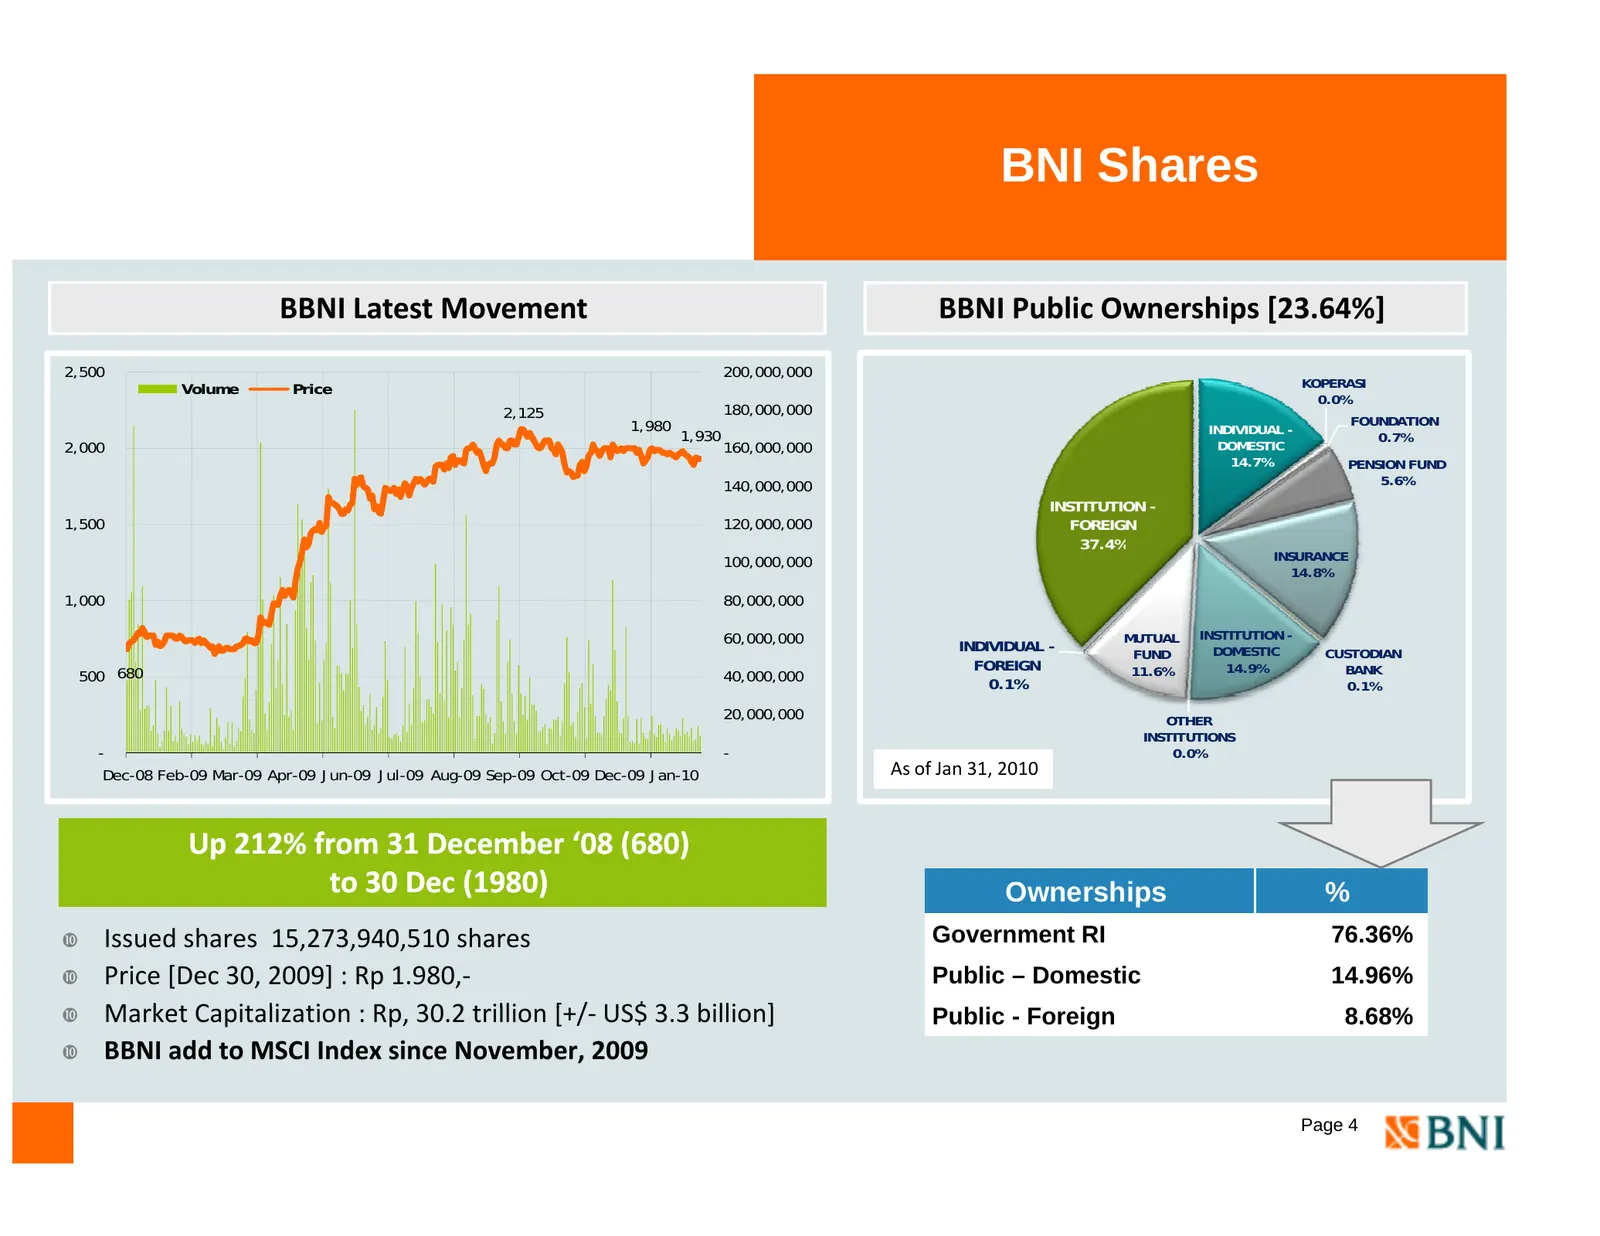
BNI Shares BBNI Latest Movement BBNI Public Ownerships [23.64%] 2,500 200,000,000 V l Volume P i Price KOPERASI 0.0% 2,125 180,000,000 1,980 FOUNDATION 1,930 INDIVIDUAL - 0.7% 2,000 160,000,000 DOMESTIC 14.7% PENSION FUND 140,000,000 5.6% INSTITUTION - 1,500 120,000,000 FOREIGN 37.4% 37 4% 100,000,0
Slide 6: Management Focus & Progress to date
Management Focus Section & Progress to date Page 5
Slide 7: 2009 Strategic Policy
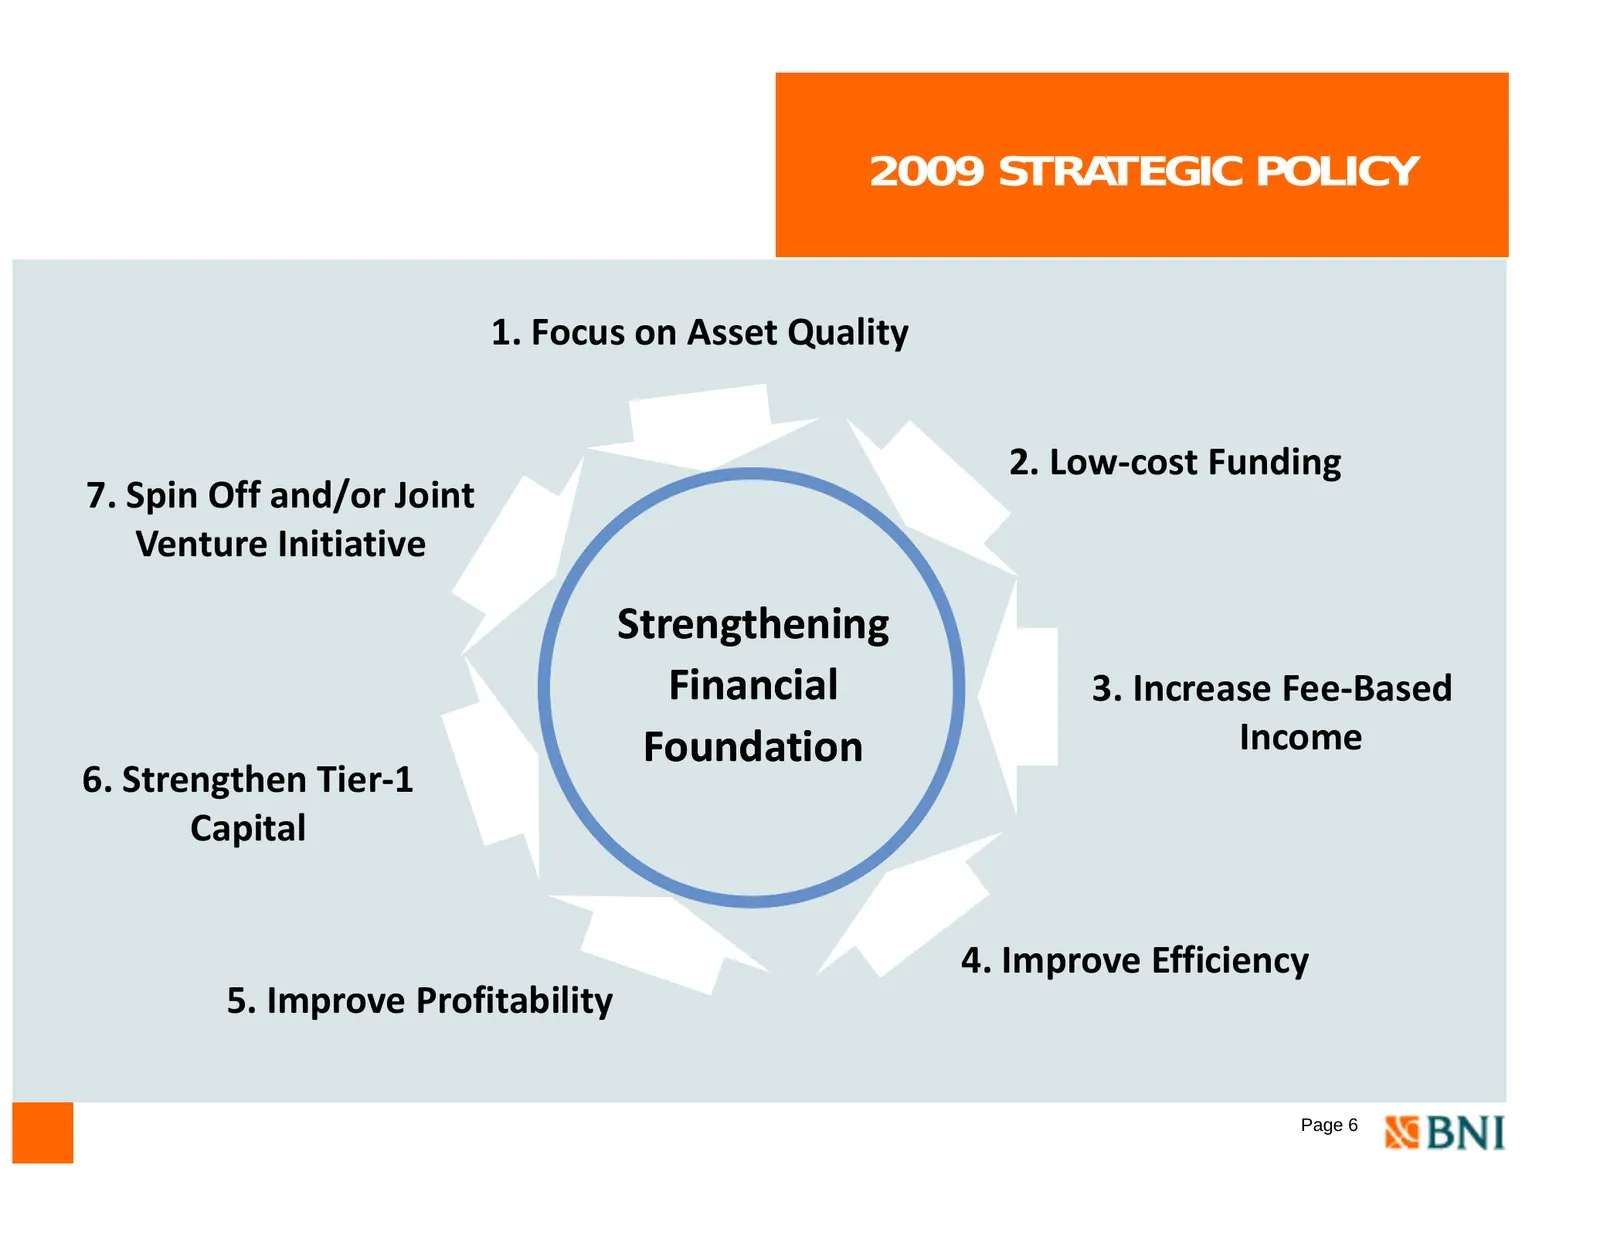
2009 STRATEGIC POLICY 1. Focus on Asset Quality 2. Low‐cost Funding 7. Spin Off and/or Joint Venture Initiative Strengthening Financial 3. Increase Fee‐Based Fee Based Foundation Income 6. Strengthen Tier‐1 Capital 4. Improve Efficiency 5. Improve Profitability Page 6
Slide 8: Summary Result FY 2009
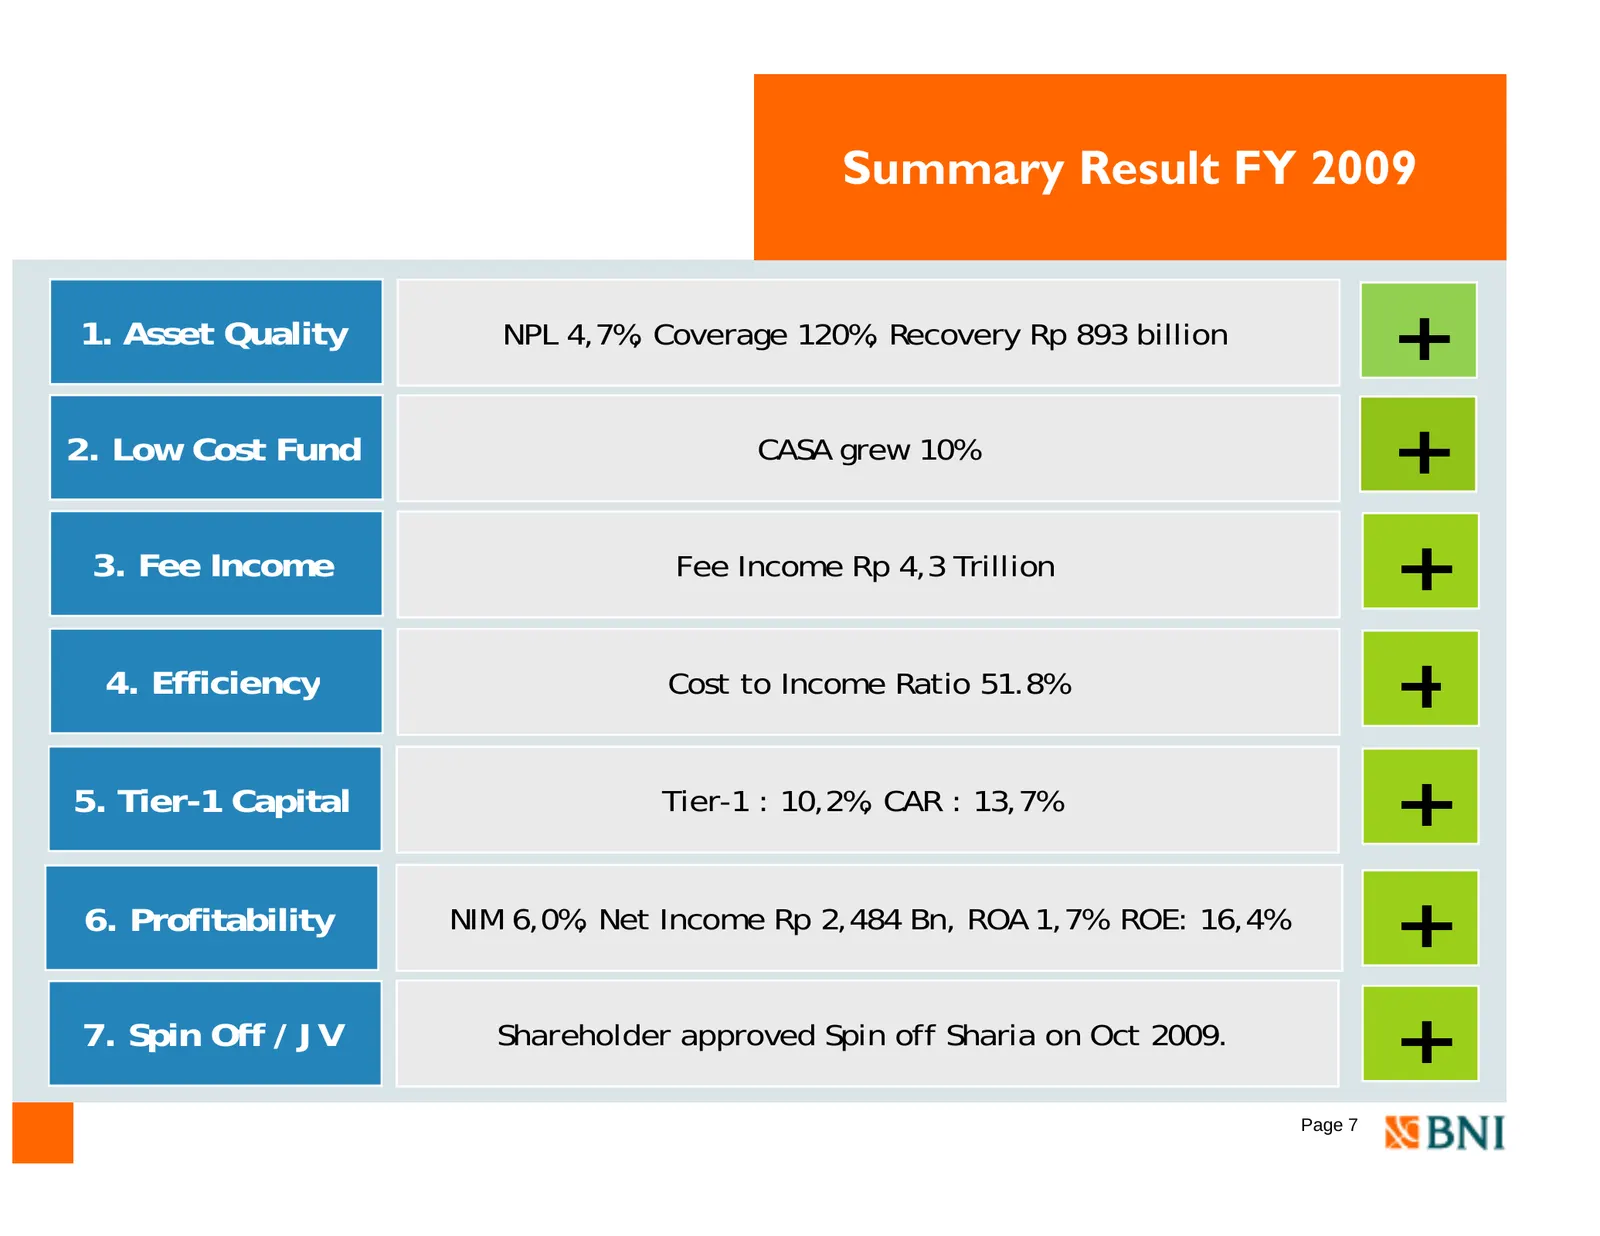
Summary Result FY 2009 1. Asset Quality NPL 4,7%, Coverage 120%, Recovery Rp 893 billion + 2. Low Cost Fund CASA grew 10% + 3. Fee Income Fee Income Rp 4,3 Trillion + 4. Efficiency y Cost to Income Ratio 51.8% + 5. Tier-1 Capital Tier-1 : 10,2%, CAR : 13,7% + 6. Profitability NIM 6,0%, Net Income Rp
Slide 9: Summary Result FY-2009 and 2010 Outlook
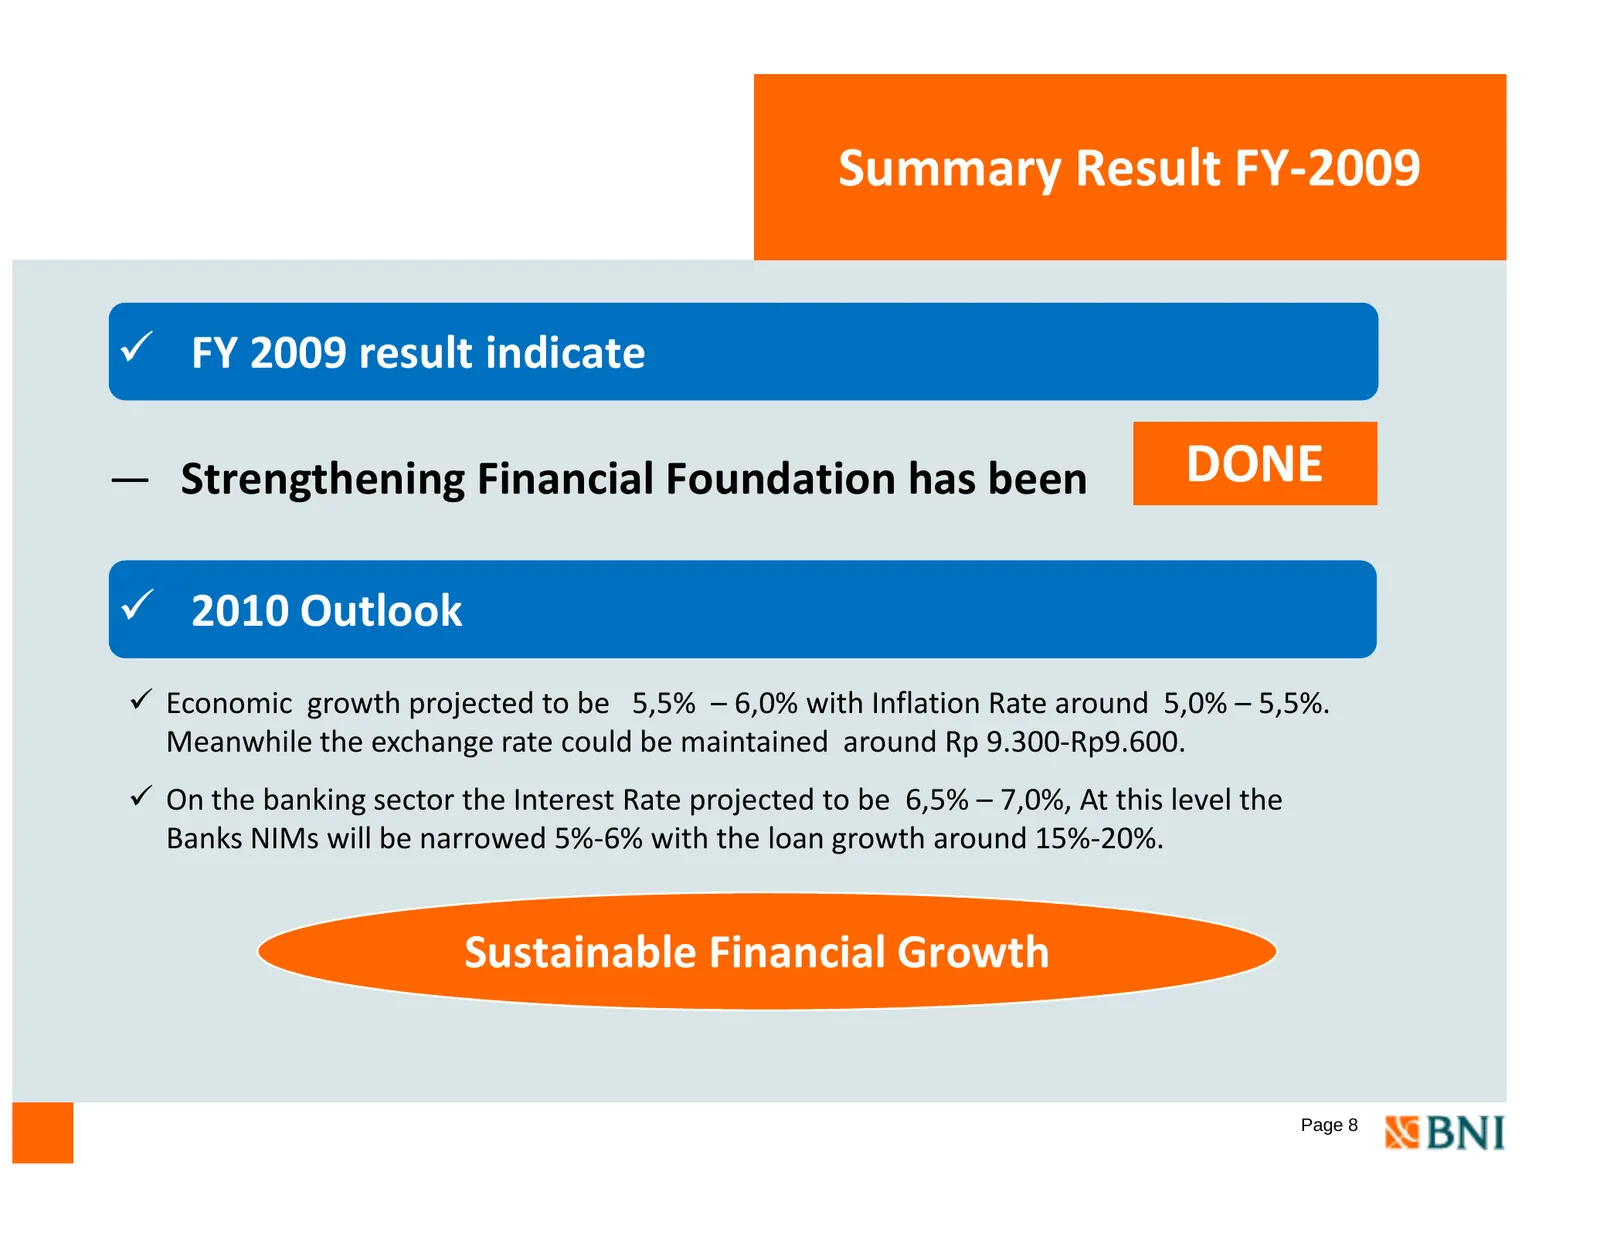
Summary Result FY‐2009 9 FY 2009 result indicate — Strengthening Financial Foundation has been DONE 9 2010 Outlook 9 Economic E i growthth projected j t d tto b be 5,5% 5 5% – 6,0% 6 0% with ith Inflation I fl ti R Rate t around d 5 5,0% 0% – 5,5%. 5 5% Meanwhile the exchange rate could be maintaine
Slide 10: Financial Performance
Financial Performance FY ‐ 2009 II. Profit & Loss II. Balance Sheet III. Financial Ratio 17-Feb-10 Page 9
Slide 11: Balance Sheet Highlight
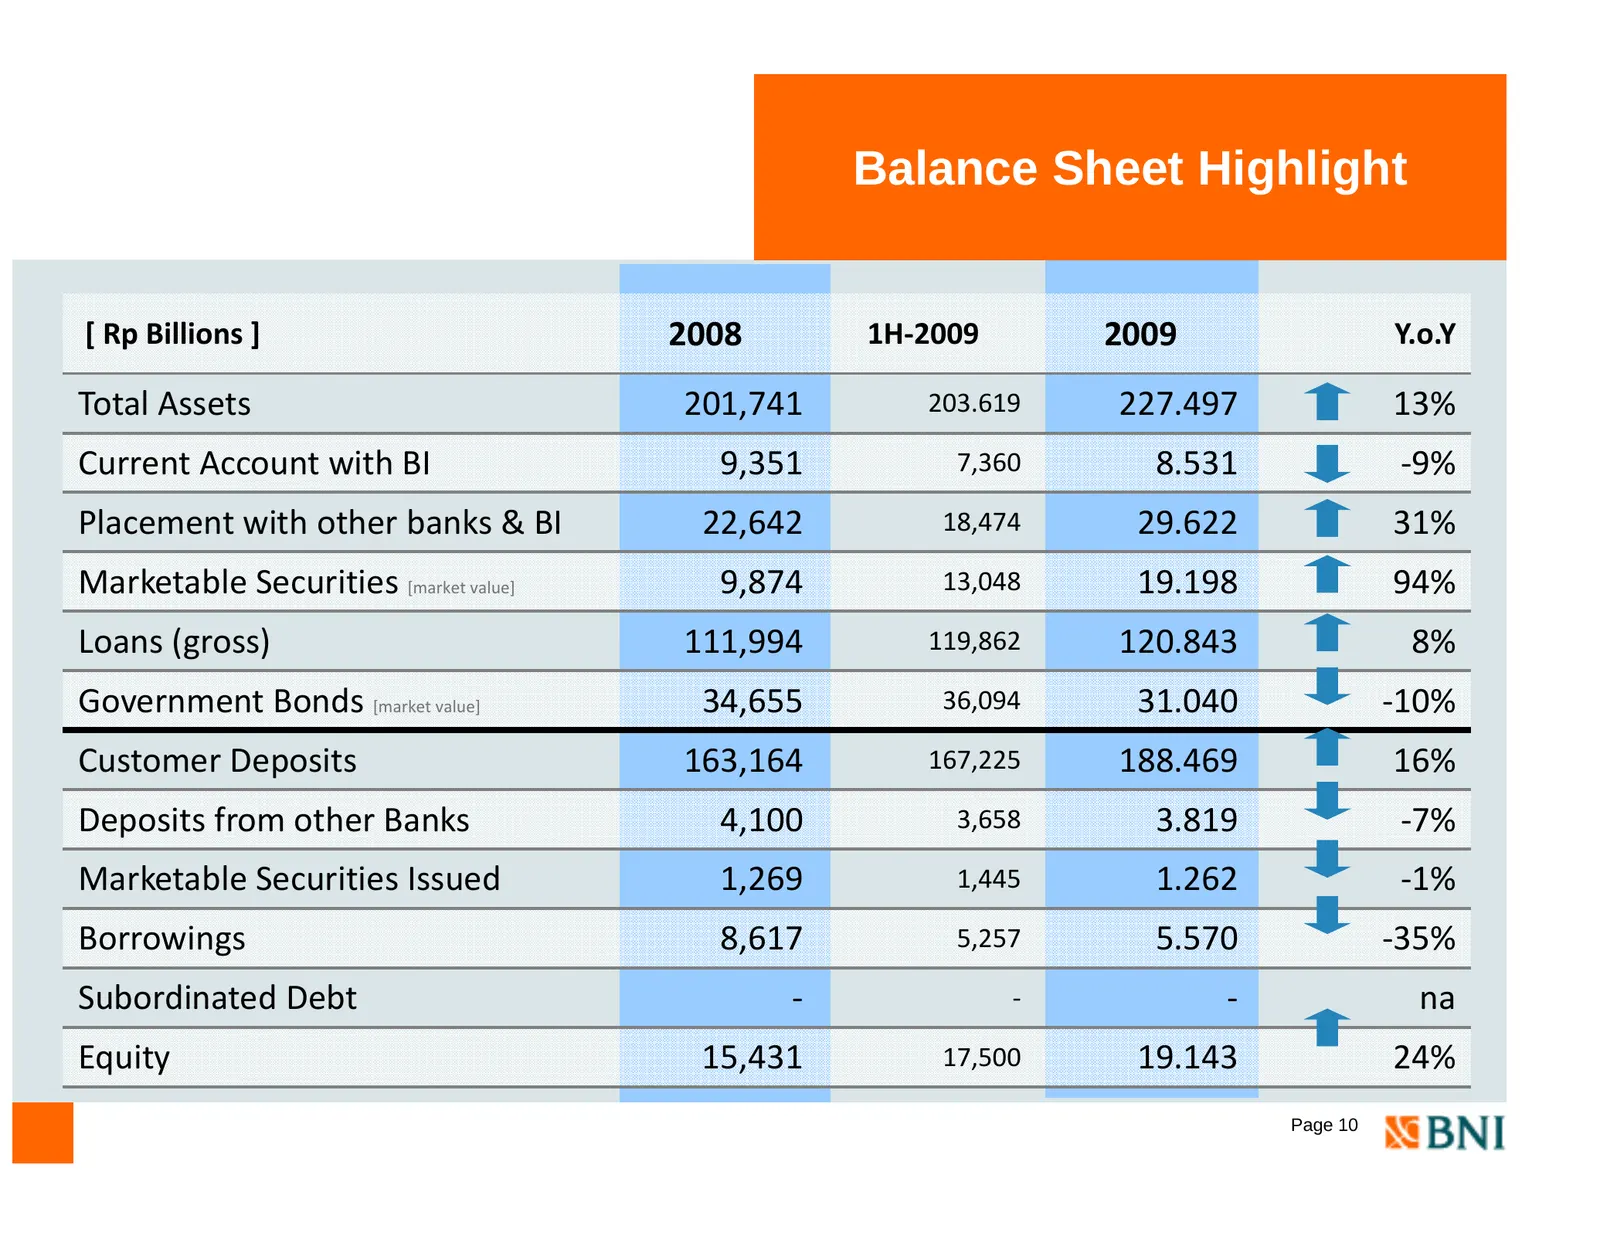
Balance Sheet Highlight [ Rp Billions ] 2008 1H‐2009 2009 Y.o.Y Total Assets 201,741 203.619 227.497 13% Current Account with BI 9,351 7,360 8.531 ‐9% Placement with other banks & BI 22,642 18,474 29.622 31% Marketable Securities [market value] 9,874 13,048 19.198 94% Loans (gross) 111,994 119,862 1
Slide 12: Loan Composition
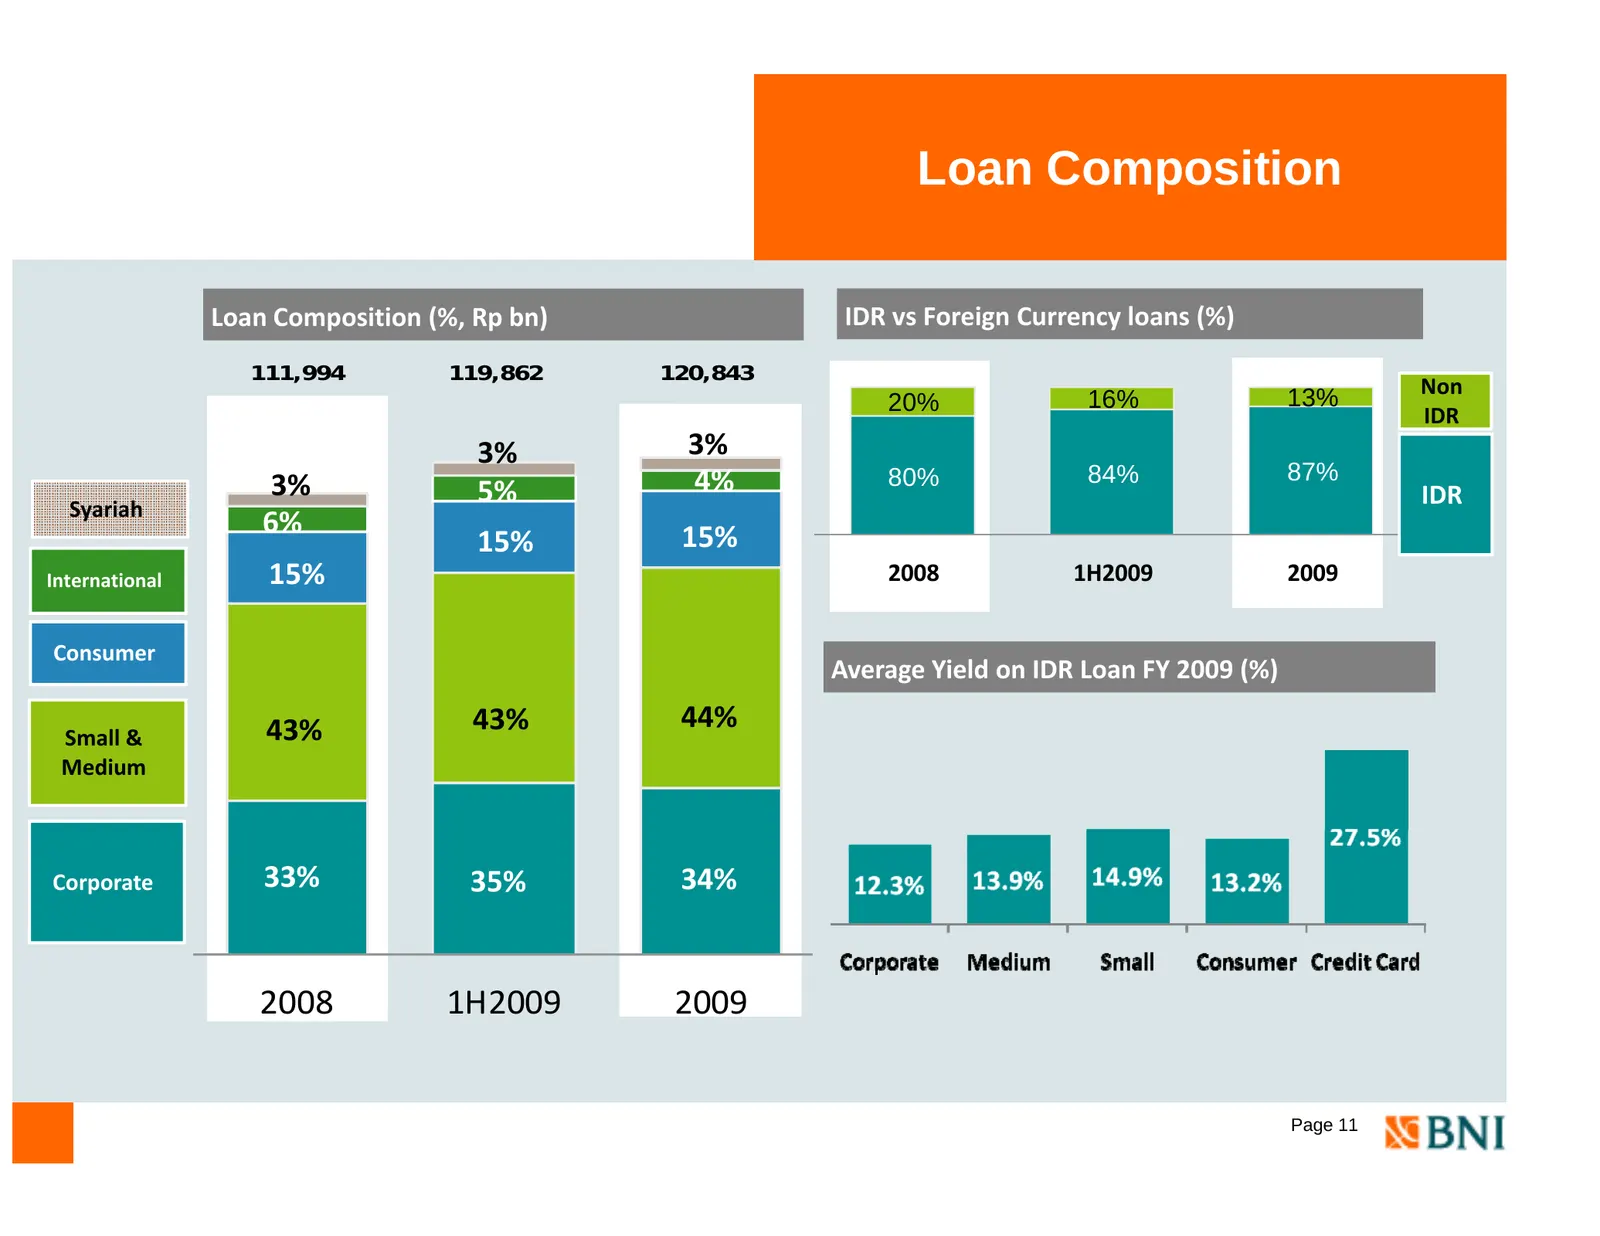
Loan Composition Loan Composition (%, Rp bn) IDR vs Foreign Currency loans (%) 111,994 , 119,862 , 120,843 , 13% Non 20% 16% IDR 3% 3% 4% 80% 84% 87% 3% 5% IDR Syariah 6% 15% 15% International 15% 2008 1H2009 2009 Consumer Average Yield on IDR Loan FY 2009 (%) 43% 43% 44% Small & Medium Corporate 33
Slide 13: Loan diversifications
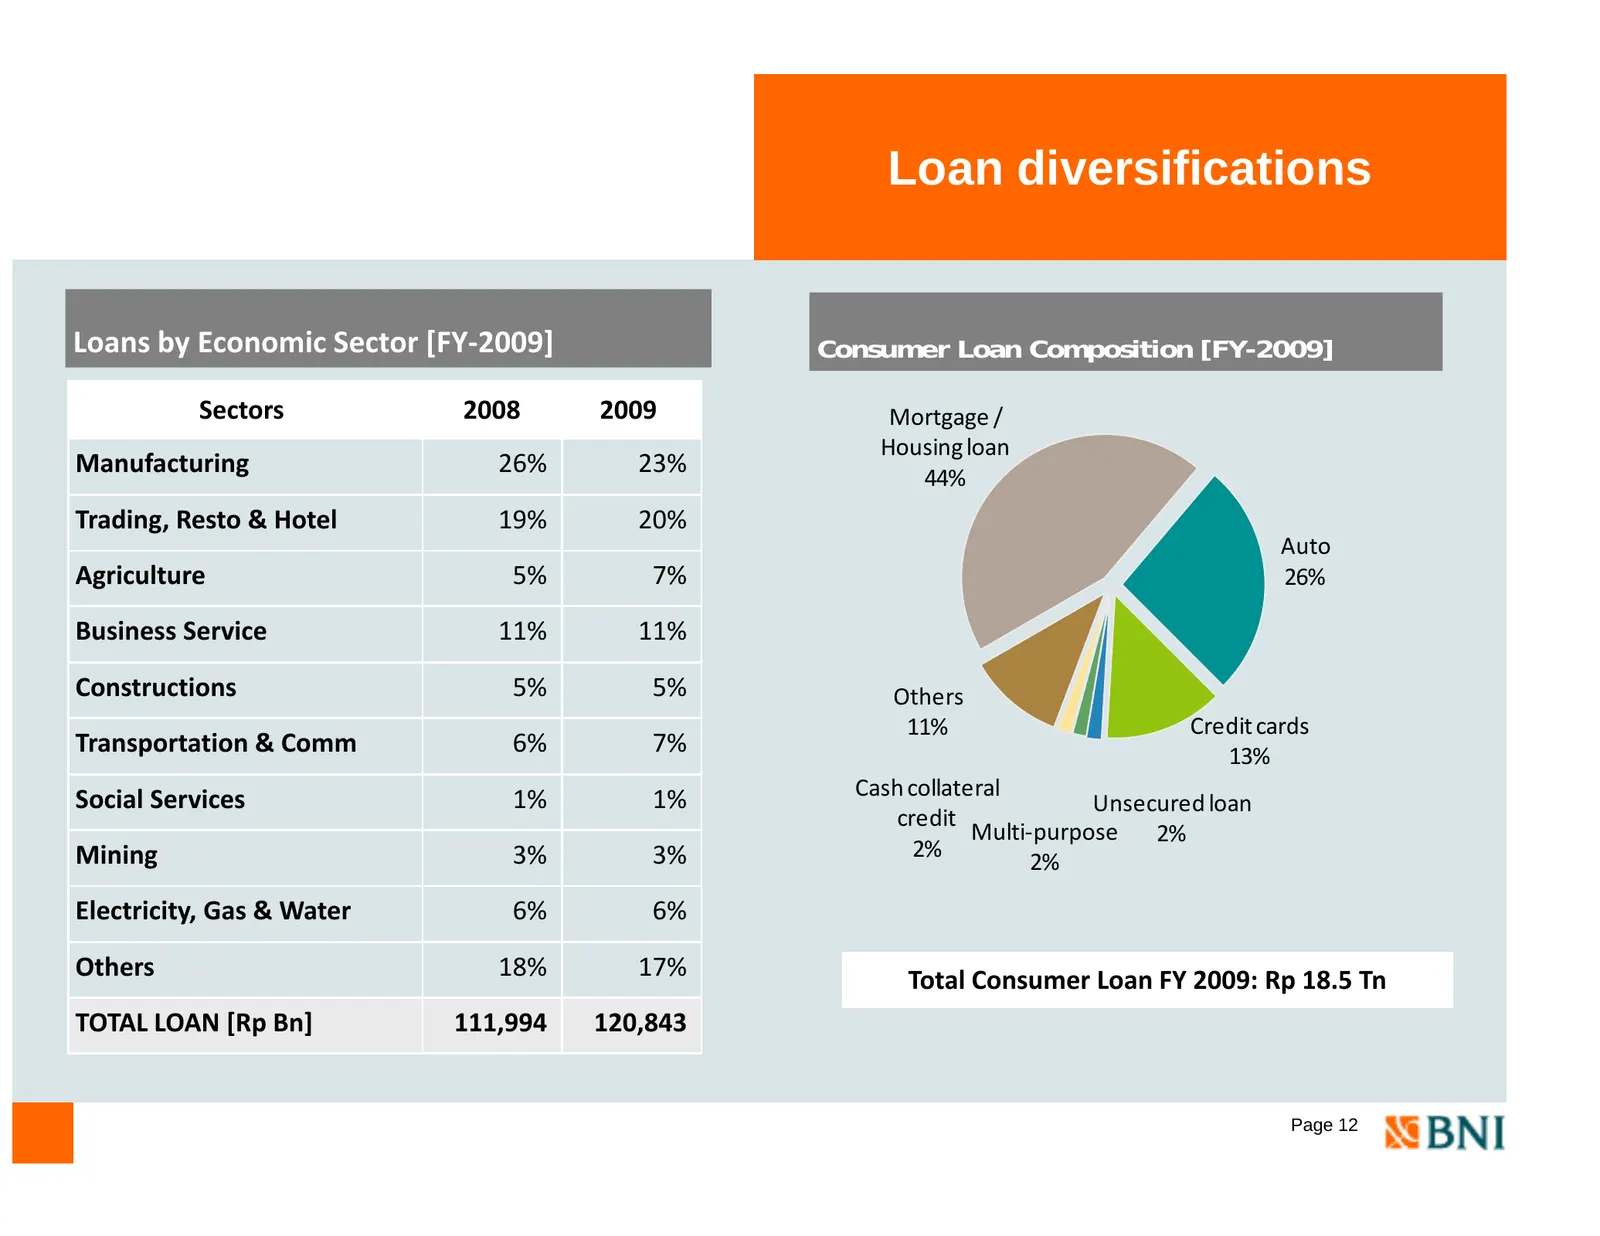
Loan diversifications Loans by Economic Sector [FY‐2009] Consumer Loan Composition [FY-2009] Sectors 2008 2009 Mortgage / Housing loan Manufacturing 26% 23% 44% Trading, Resto & Hotel 19% 20% Auto A Agriculture 5% 7% 26% Business Service 11% 11% Constructions 5% 5% Others 11% Credit cards Transporta
Slide 14: Government Bonds
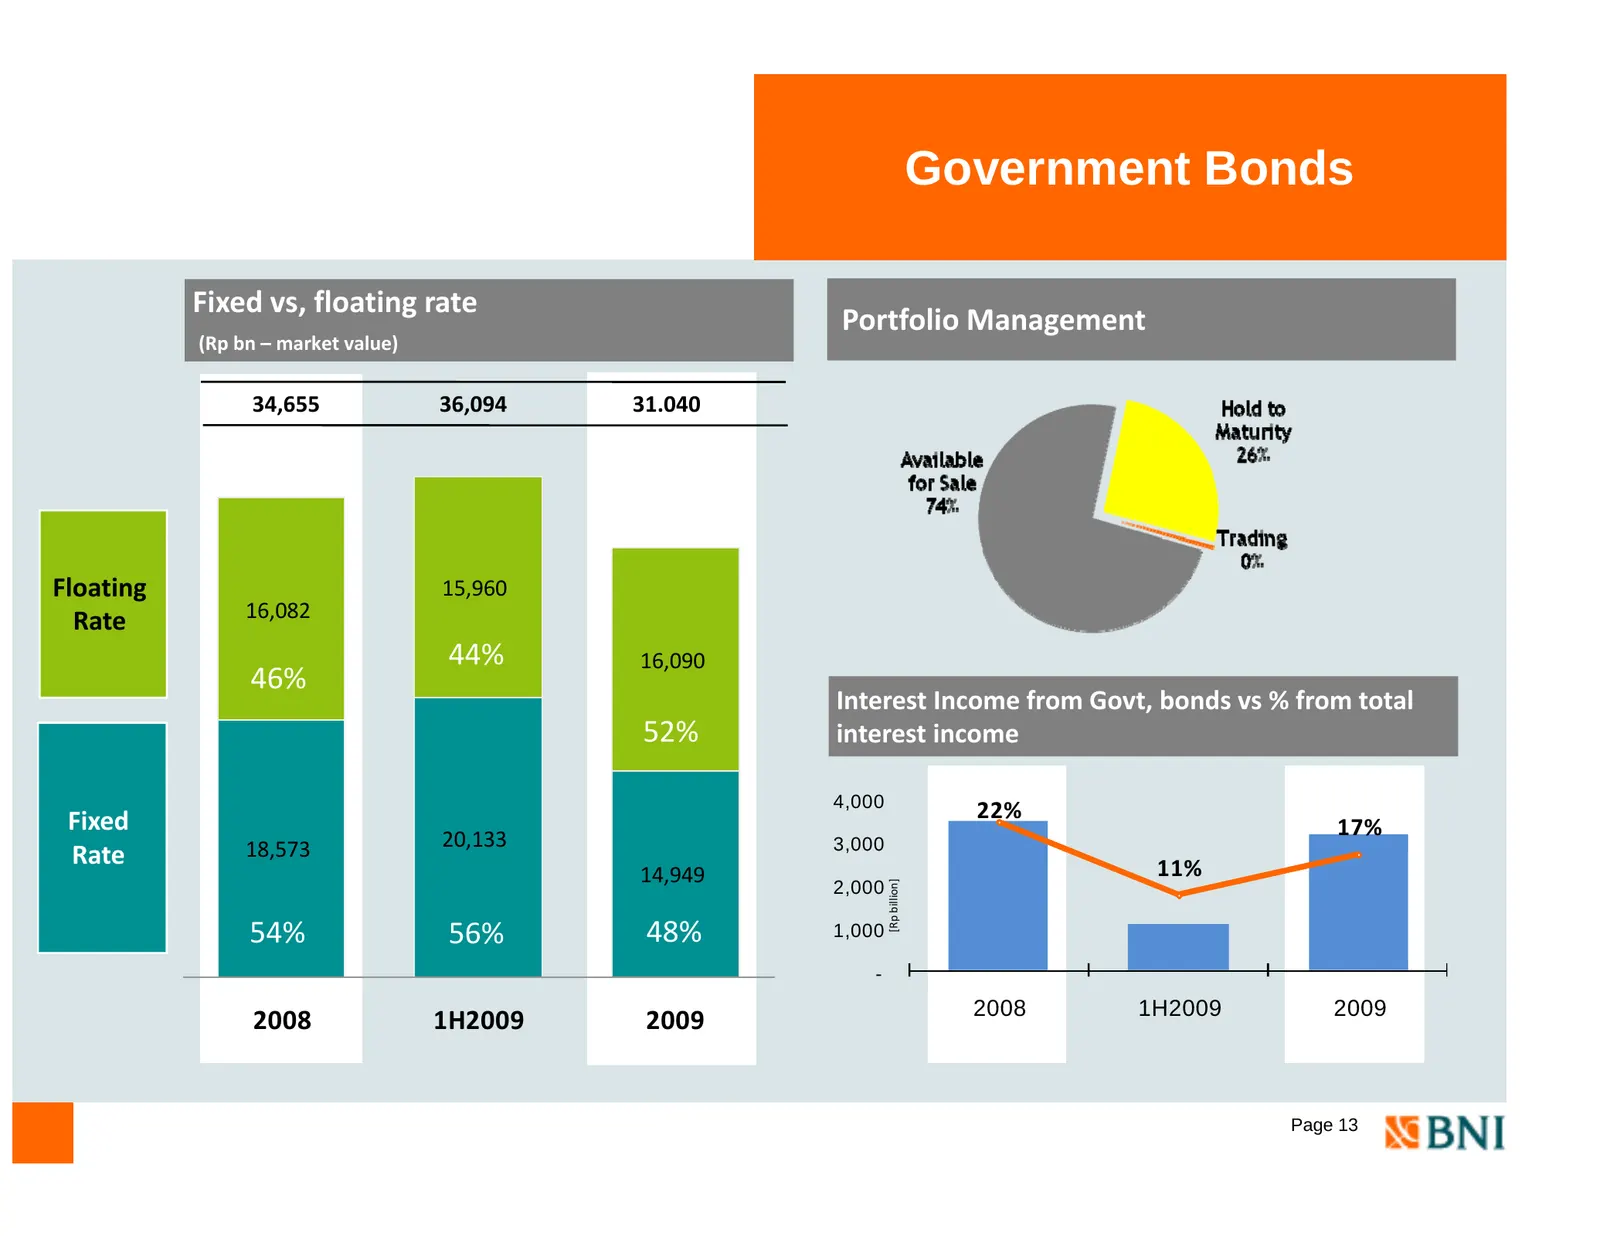
Government Bonds Fixed vs, floating rate Portfolio Management (Rp bn – market value) 34,655 36,094 31.040 Floating 15,960 16,082 Rate 44% 16,090 46% IInterest t t Income I ffrom Govt, G t bonds b d vs % from f total t t l 52% interest income 4,000 Fixed 22% 20,133 17% 18 573 18,573 3,000 Rate 11% 14
Slide 15: Customer Deposit
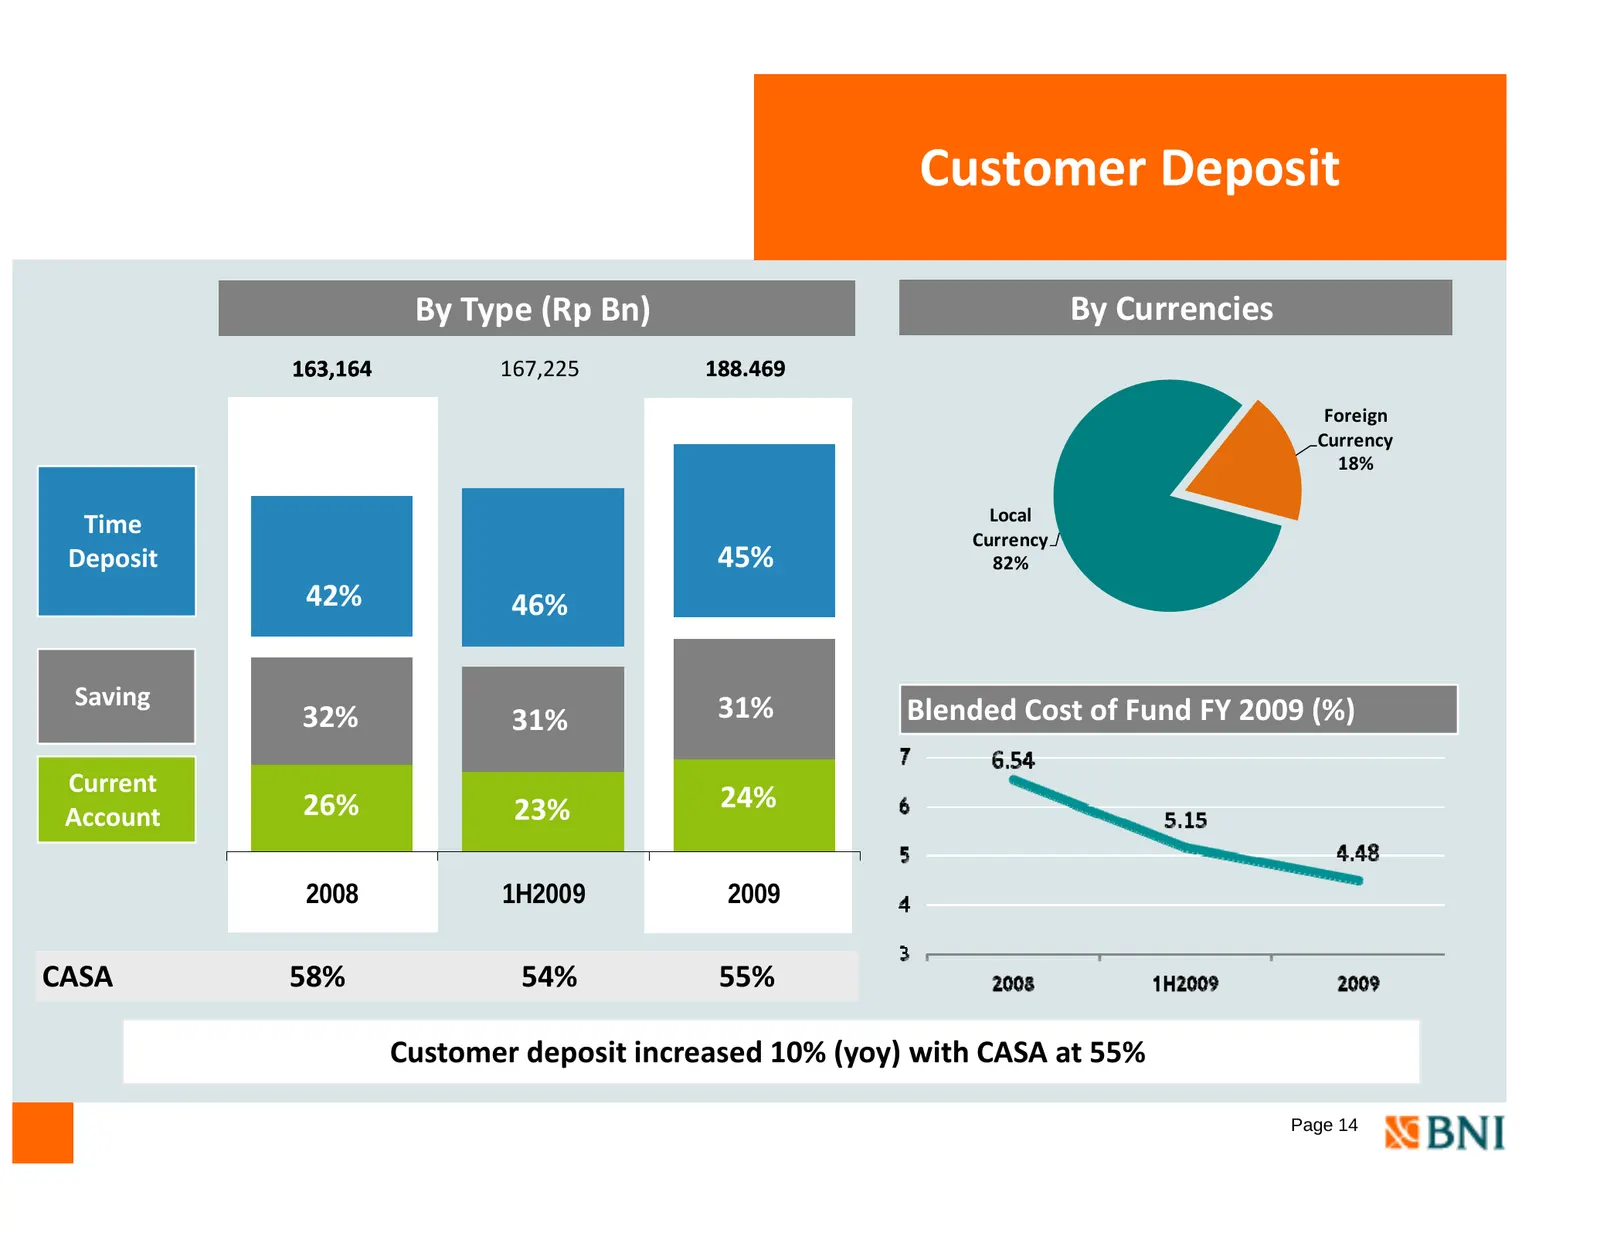
Customer Deposit By Type (Rp Bn) By Currencies 167,225 188.469 Foreign Currency 18% Local Time Currency Deposit 45% 82% 42% 46% Saving 31% 32% 31% Blended Cost of Fund FY 2009 (%) Current 26% 23% 24% Account 2008 1H2009 2009 CASA 58% 54% 55% Customer deposit increased 10% (yoy) with CASA at 55% Page
Slide 16: Profit & Loss
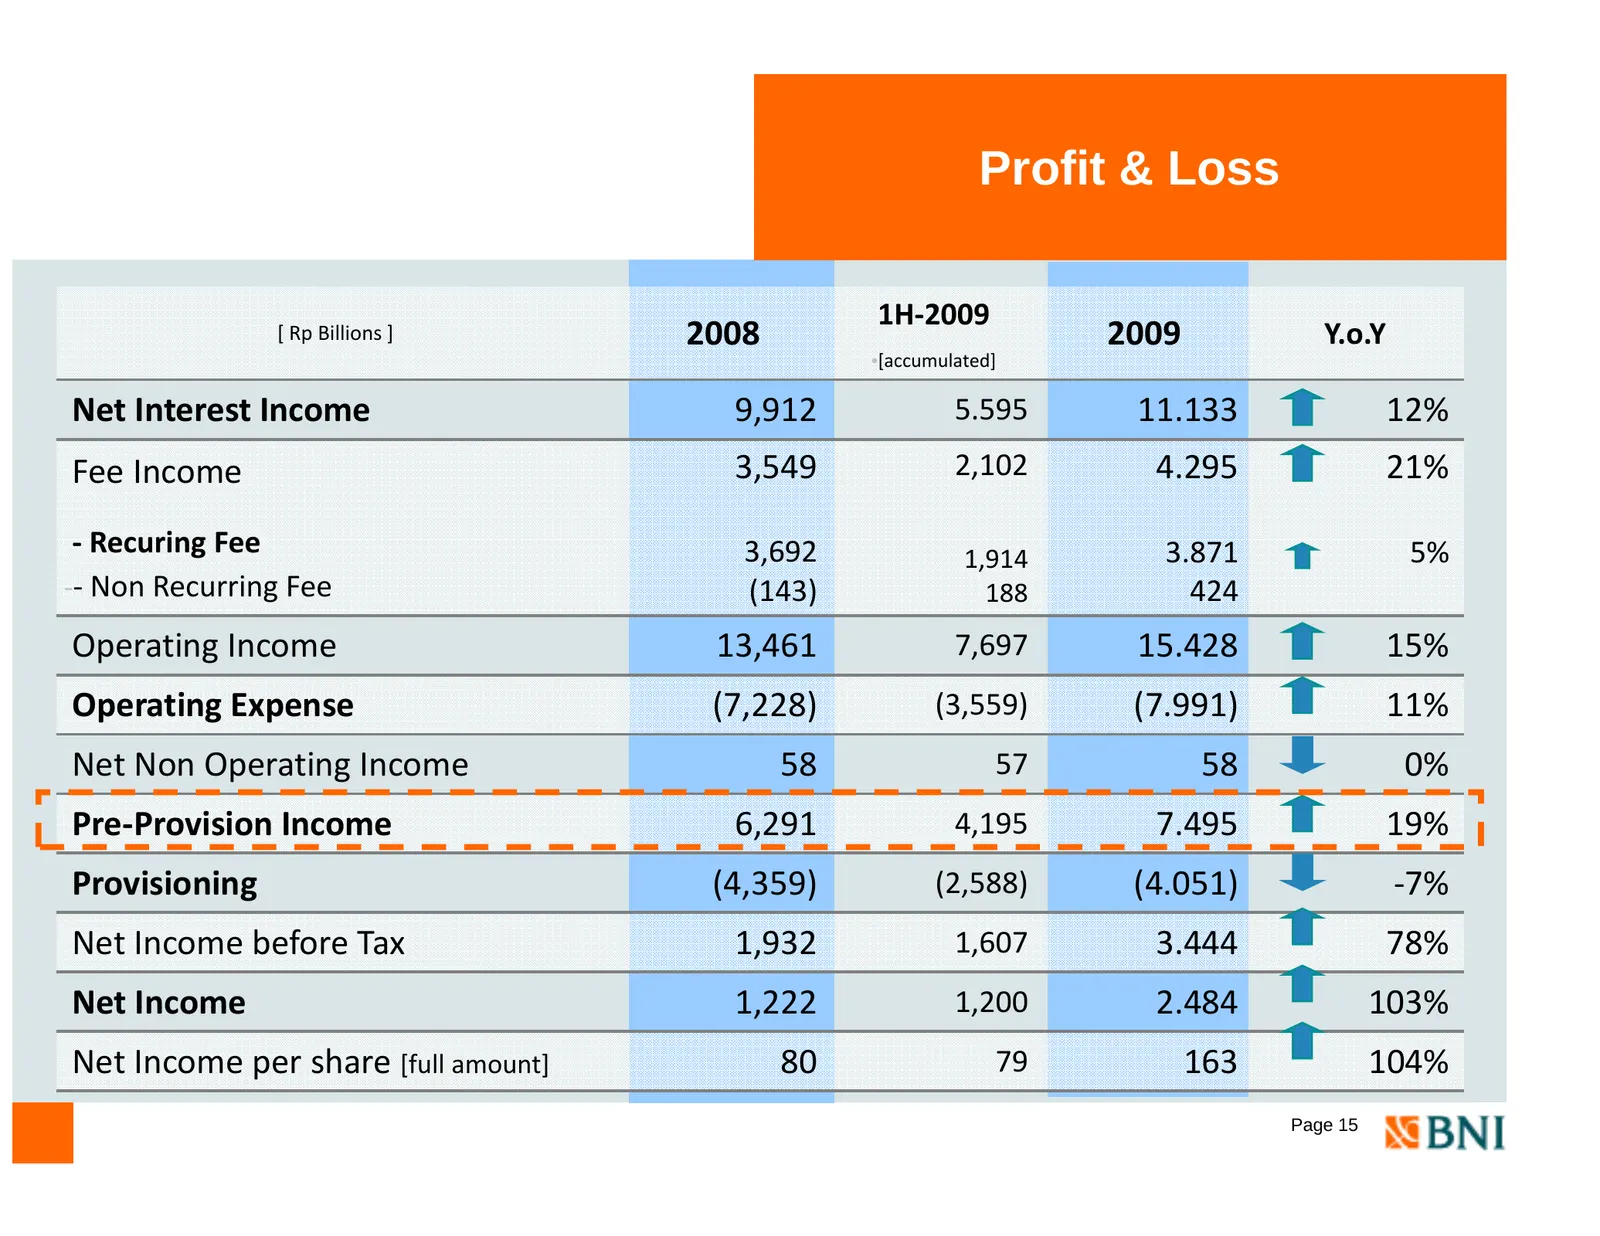
Profit & Loss 1H‐2009 [ Rp Billions ] 2008 2009 Y.o.Y •[accumulated] Net Interest Income 9,912 5.595 11.133 12% Fee Income 3,549 2,102 4.295 21% ‐ Recuring Fee 3,692 1,914 3.871 5% ‐‐ Non Recurring Fee (143) 188 424 Operating Income 13,461 7,697 15.428 15% O Operating ti EExpense (7 228) (7,228) (3
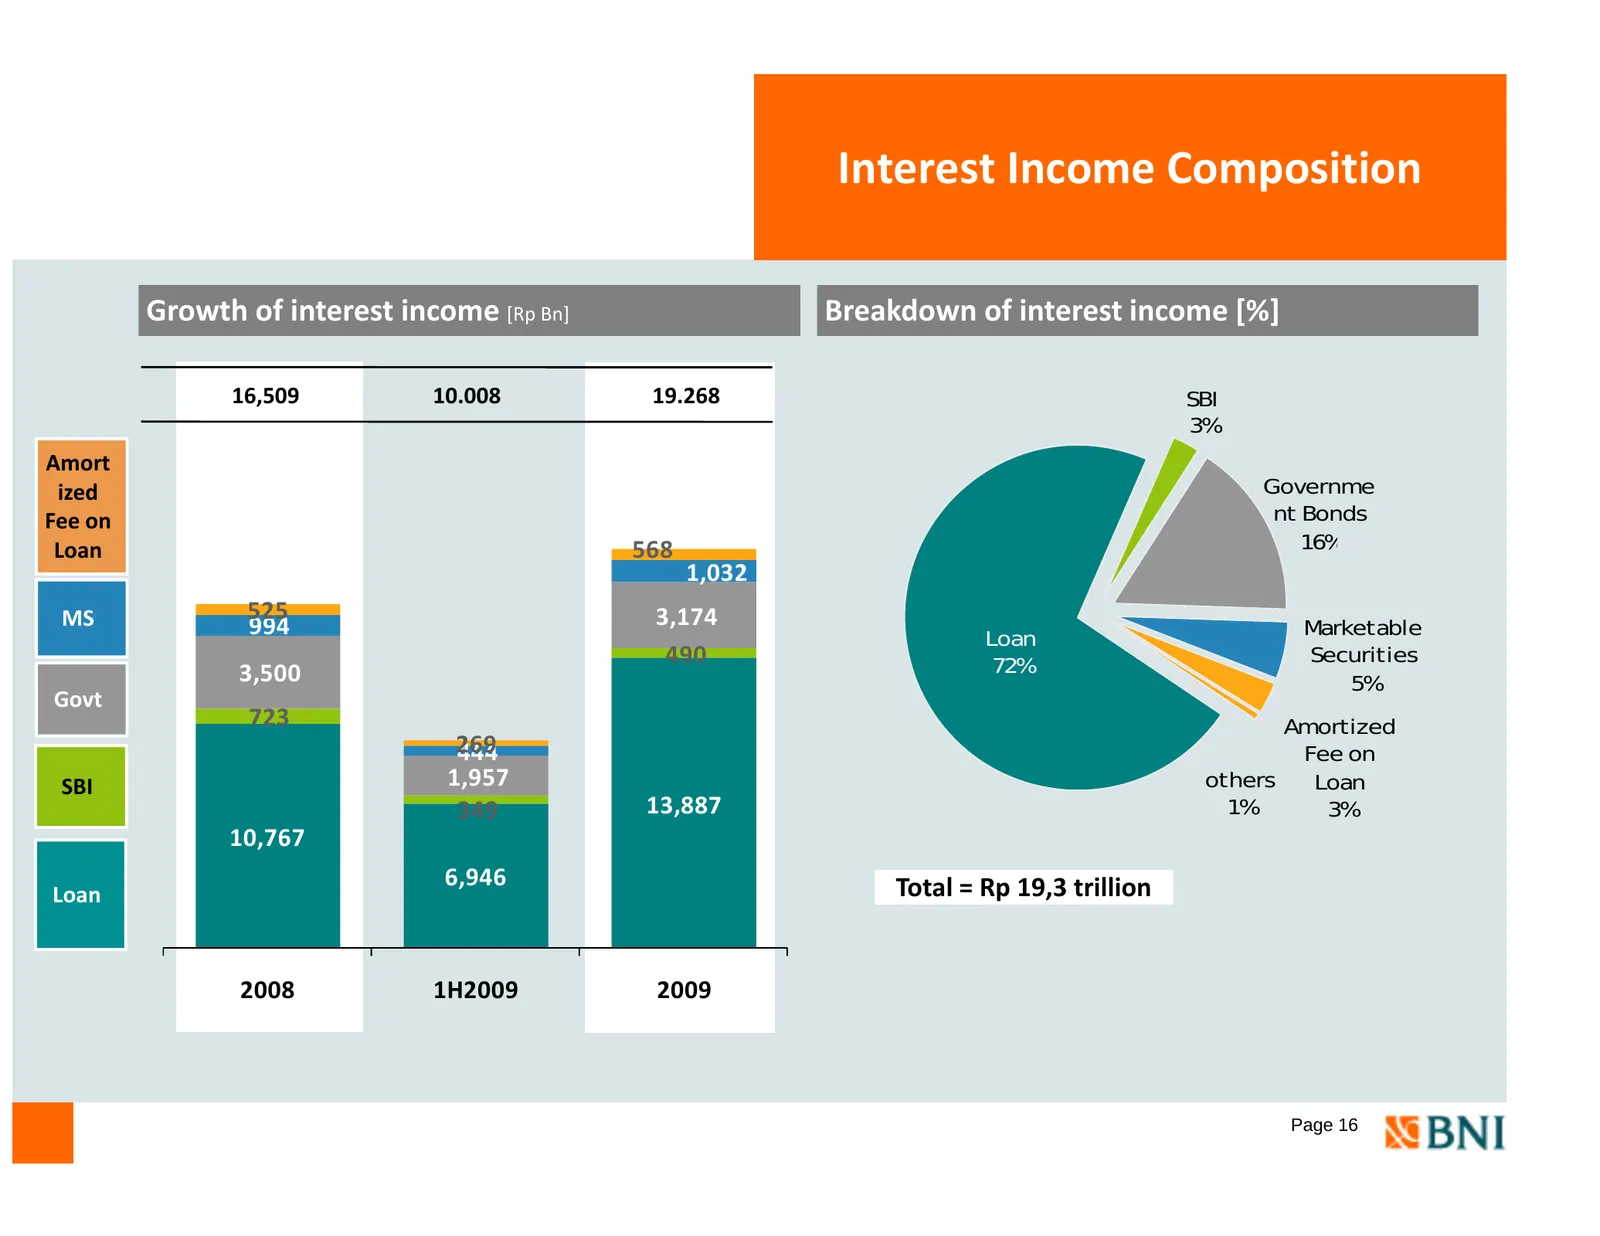
Slide 17: Interest Income Composition
Interest Income Composition Growth of interest income [Rp Bn] Breakdown of interest income [%] 16,509 10.008 19.268 SBI 3% Amort ized Governme Fee on nt Bonds Loan 568 16% 1,032 MS 525 3,174 994 Loan Marketable 490 72% Securities 3,500 5% G t Govt 723 Amortized 269 444 Fee on SBI 1,957 others Loan 3
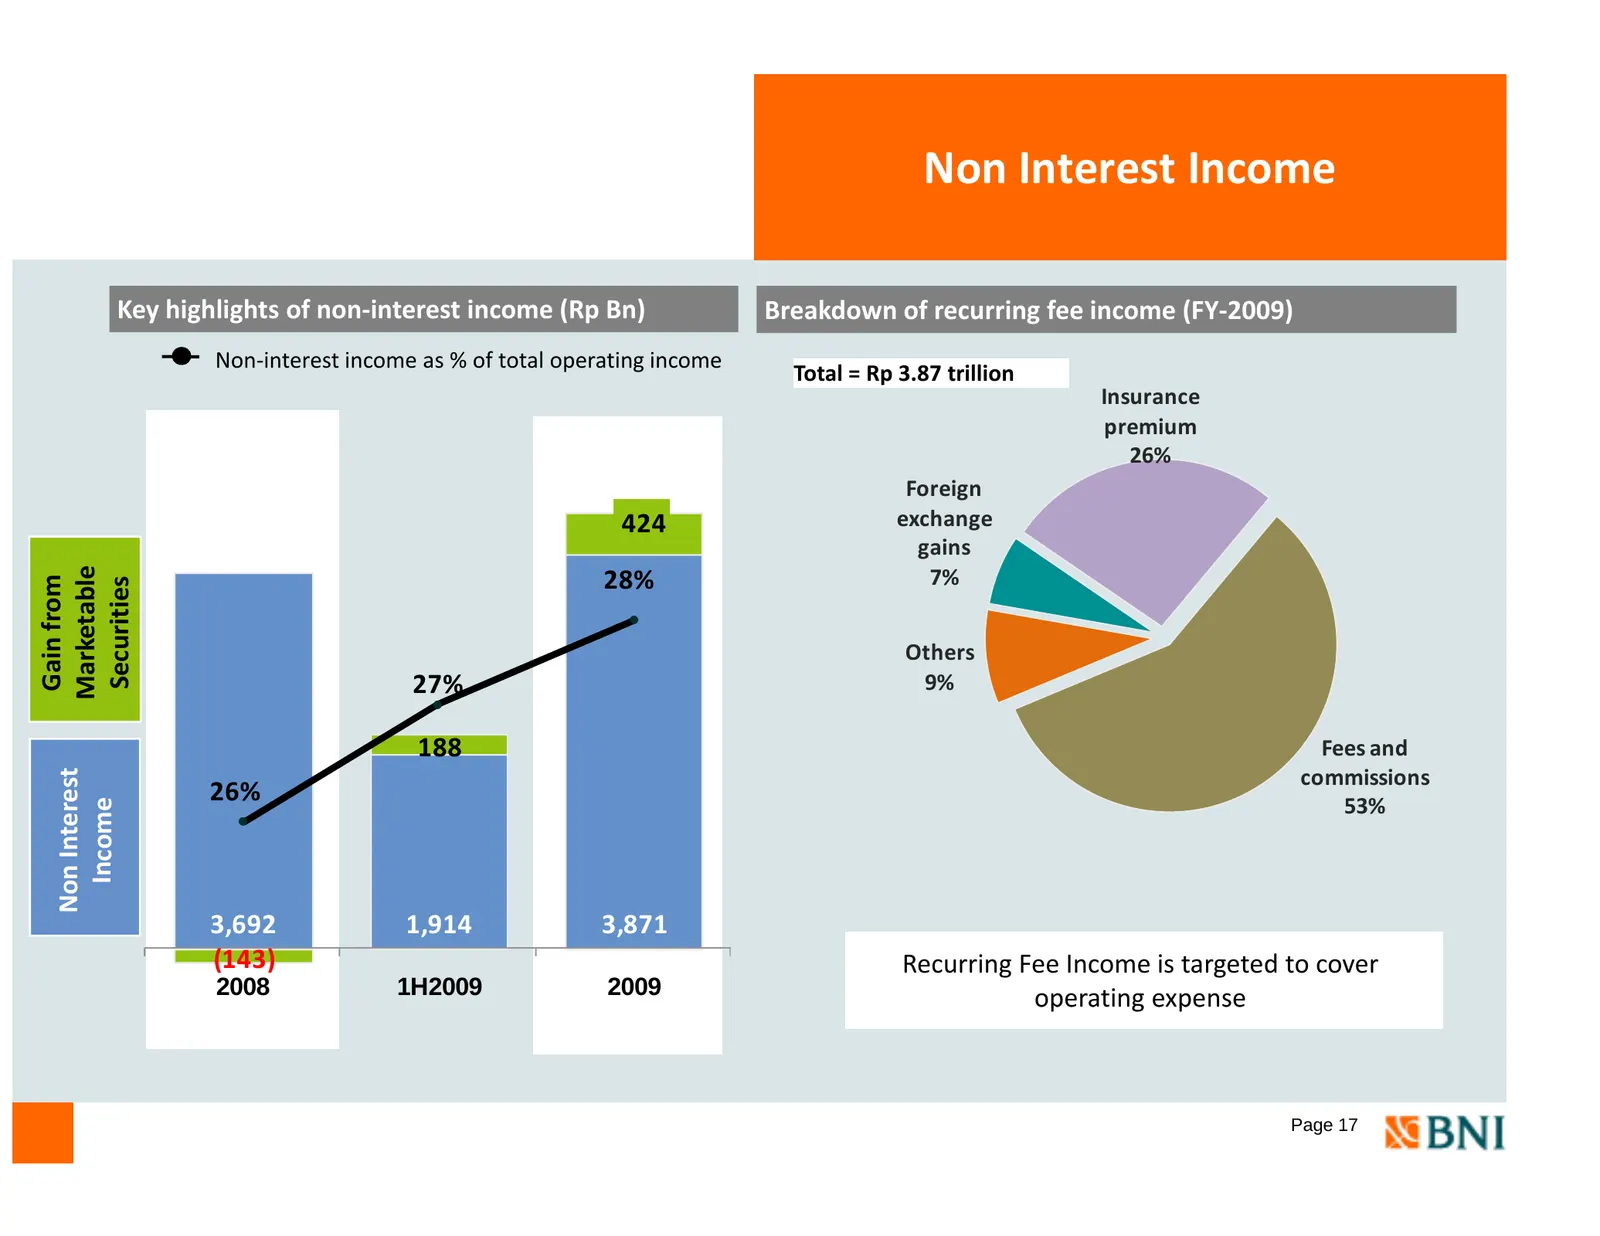
Slide 18: Non Interest Income
Non Interest Income Key highlights of non‐interest income (Rp Bn) Breakdown of recurring fee income (FY‐2009) Non‐interest income as % of total operating income Total = Rp p 3.87 trillion Insurance premium 26% Foreign 424 exchange gains i Marketable 28% 7% Gain from Securities Others 27% 9% M 188 Fe
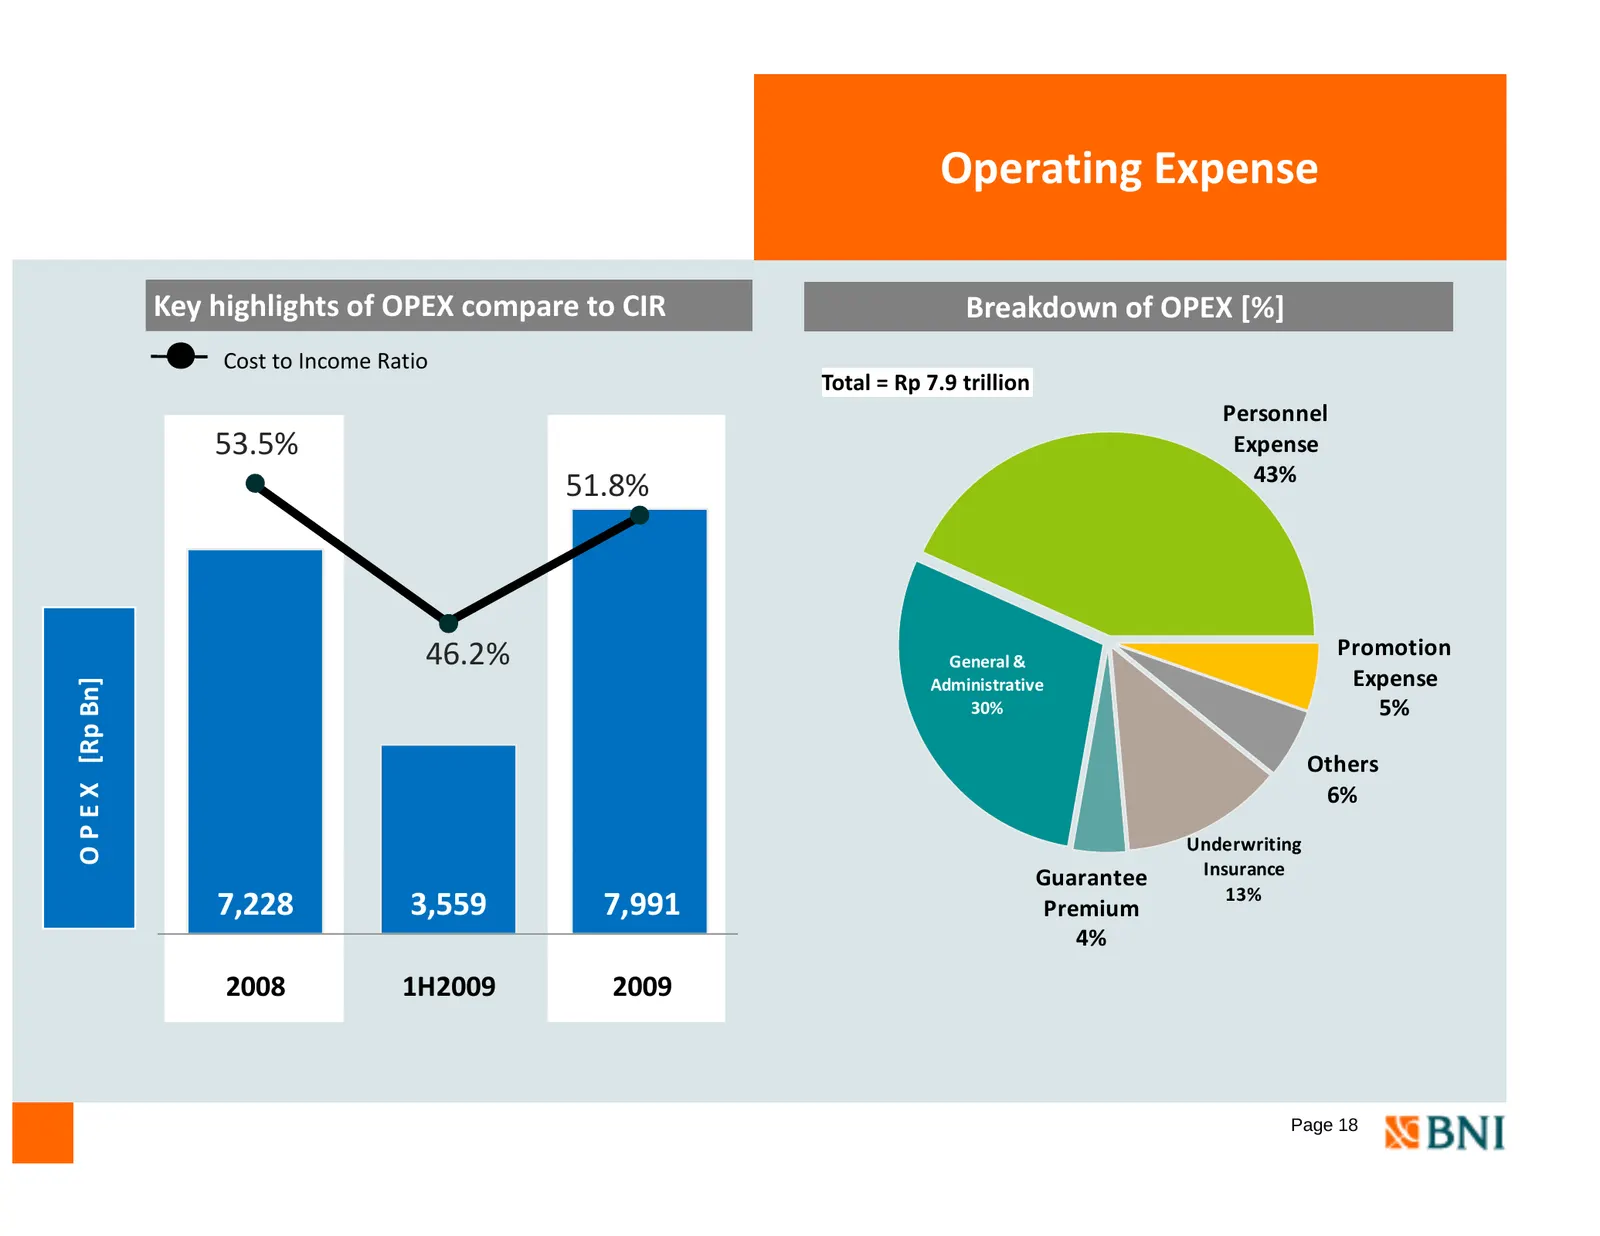
Slide 19: Operating Expense
Operating Expense Key highlights of OPEX compare to CIR Breakdown of OPEX [%] Cost to Income Ratio Total = Rp 7 7.9 9 trillion Personnel 53.5% Expense 43% 51.8% 46.2% General & Promotion Administrative Expense n] O P E X [Rp Bn 30% 5% Others 6% Underwriting U de t g Guarantee Insurance 13% 7,228 3,5
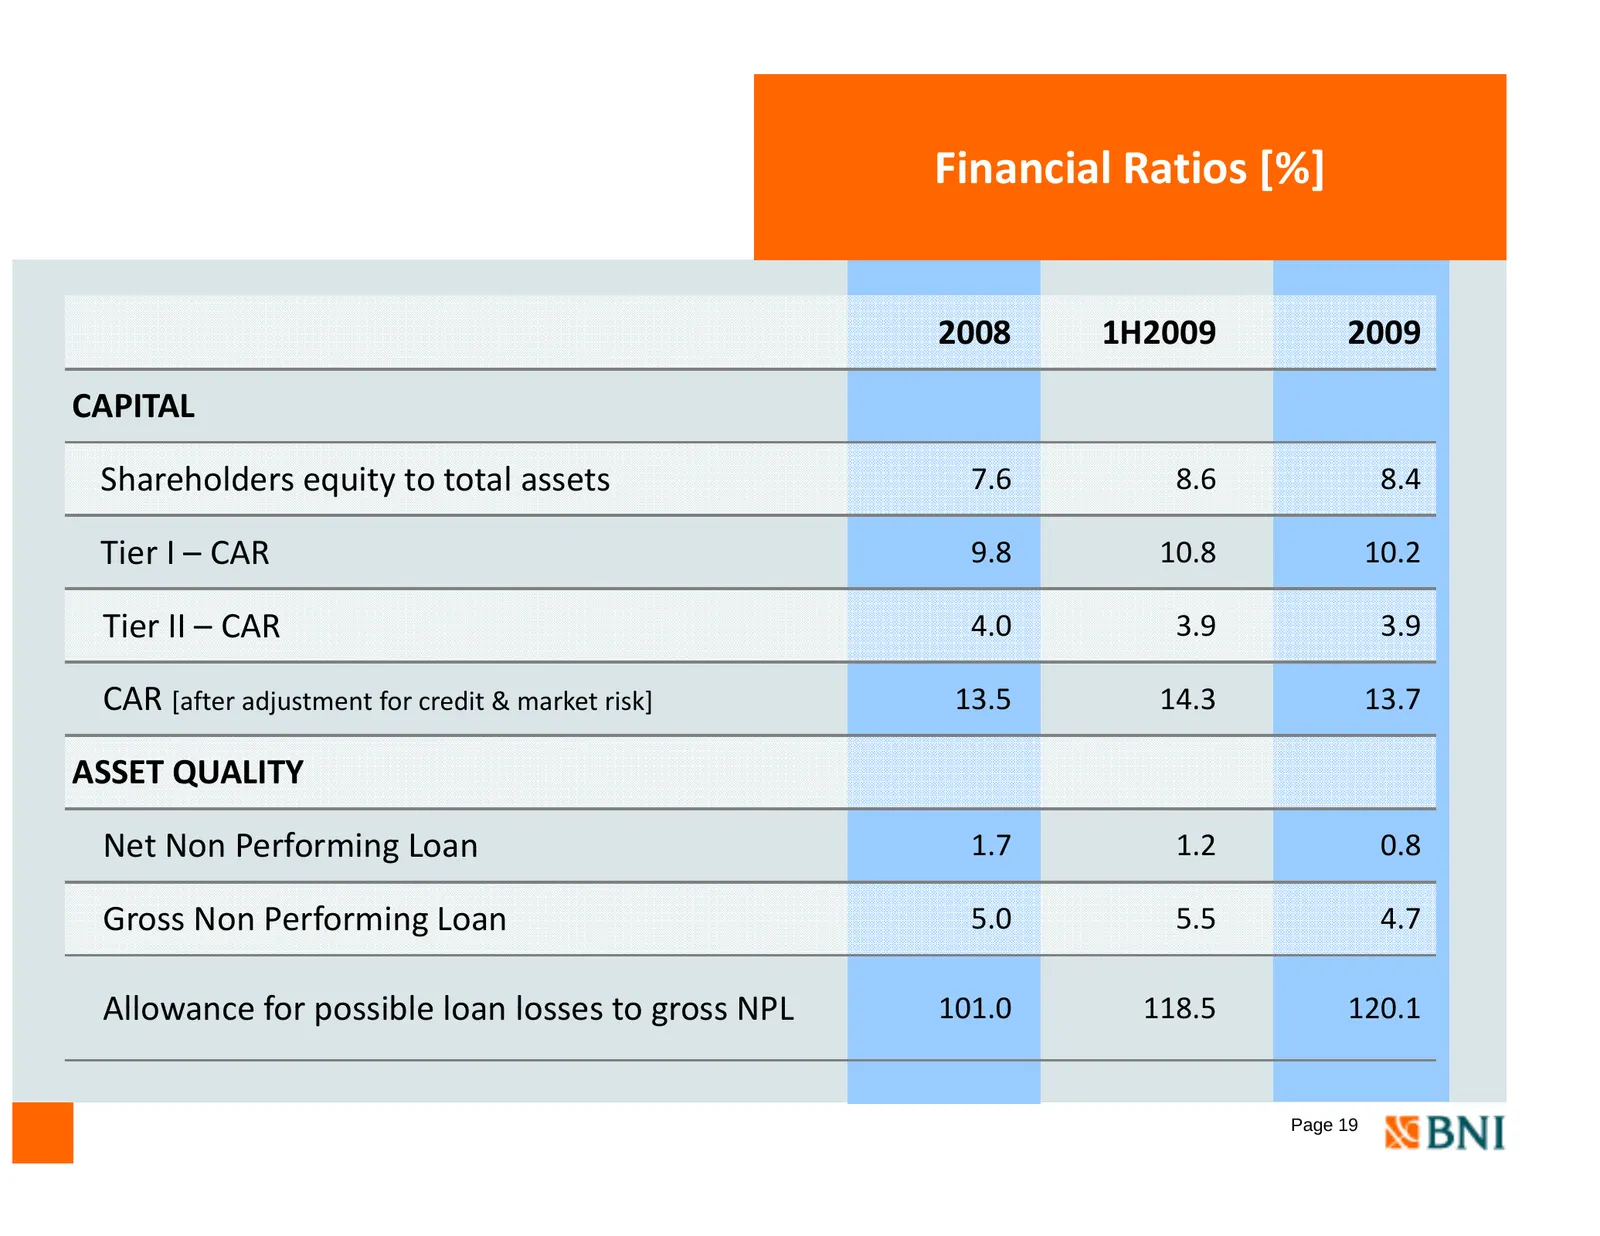
Slide 20: Financial Ratios [%]
Financial Ratios [%] 2008 1H2009 2009 CAPITAL Shareholders equity to total assets 7.6 8.6 8.4 Tier I – CAR 9.8 10.8 10.2 Tier II – CAR 4.0 3.9 3.9 CAR [after [ ft adjustment dj t t ffor credit dit & market k t risk] i k] 13 5 13.5 14 3 14.3 13 7 13.7 ASSET QUALITY Net Non Performing Loan 17 1.7 12 1
Slide 21: Financial Ratios [%]
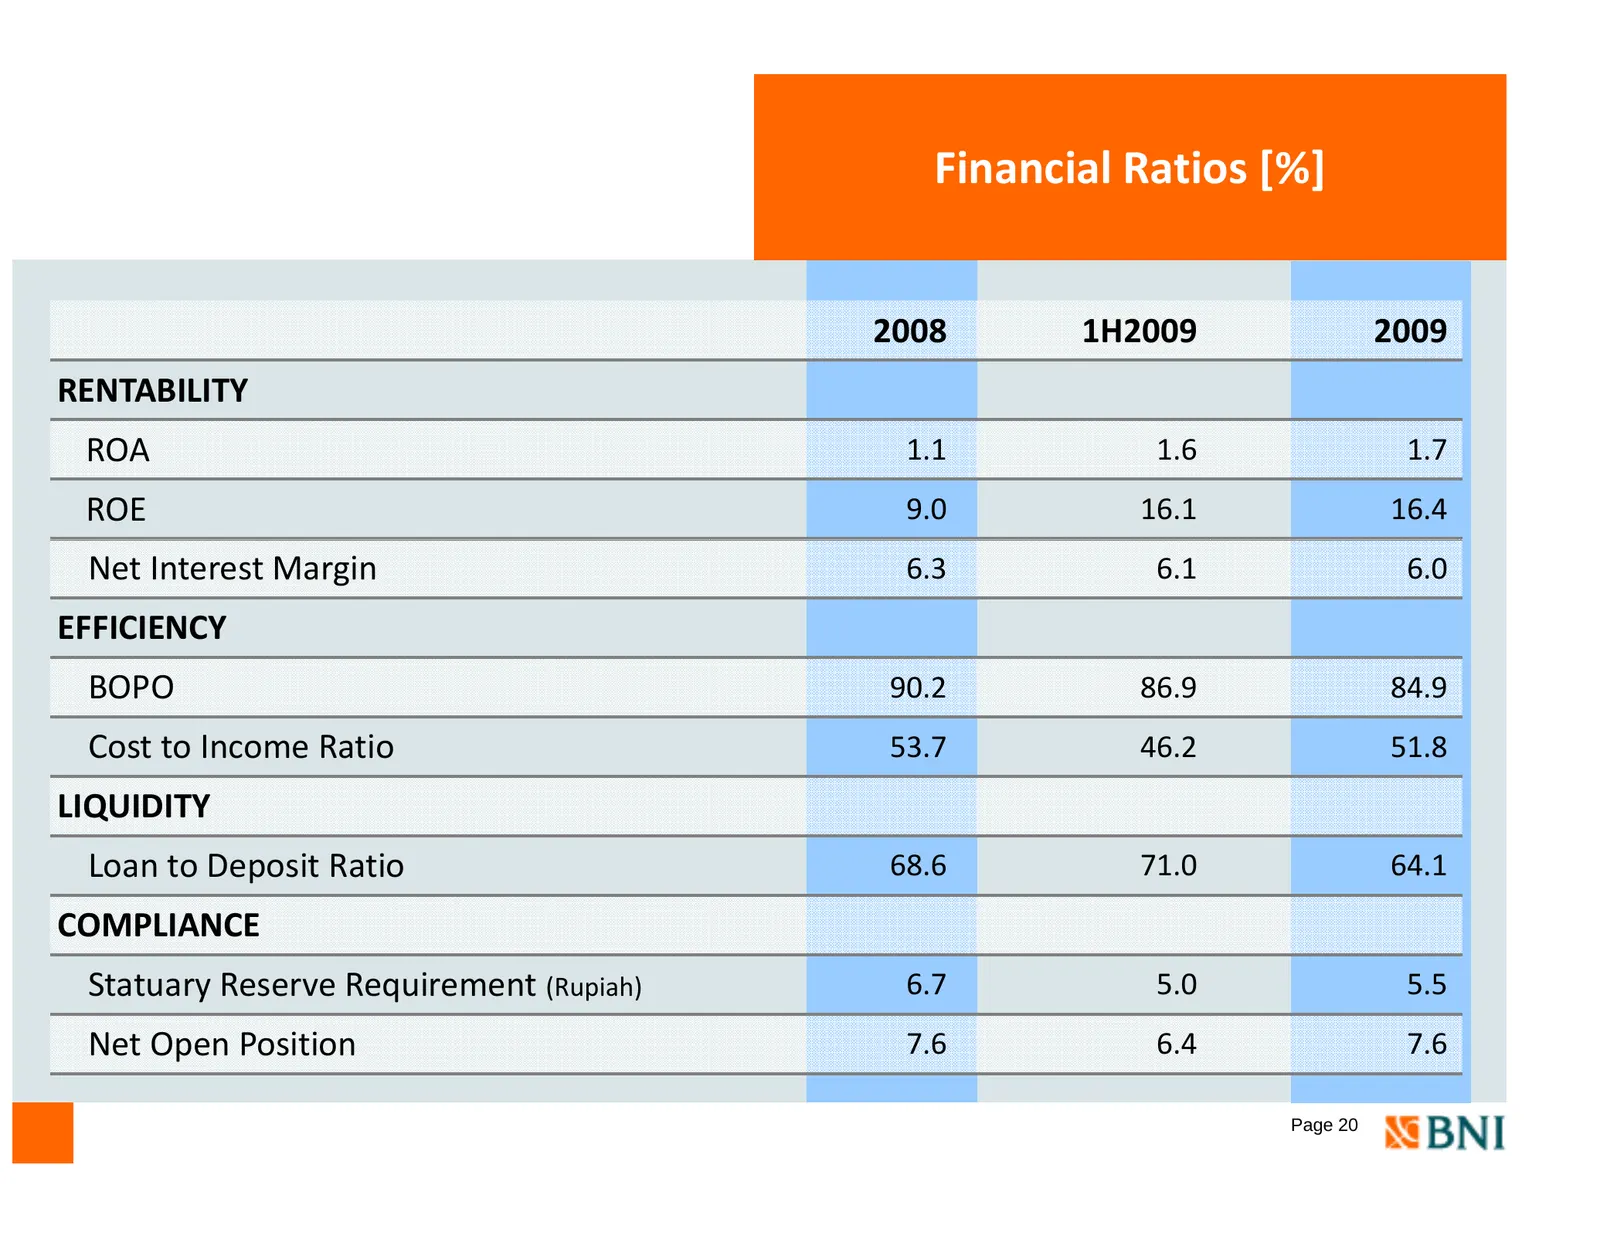
Financial Ratios [%] 2008 1H2009 2009 RENTABILITY ROA 1.1 1.6 1.7 ROE 9.0 16.1 16.4 Net Interest Margin 6.3 6.1 6.0 EFFICIENCY BOPO 90.2 86.9 84.9 Cost to Income Ratio 53.7 46.2 51.8 LIQUIDITY Loan to Deposit Ratio 68.6 71.0 64.1 COMPLIANCE Statuary Reserve Requirement (Rupiah) 6.7 5.0 5.5 Net Open
Slide 22: Income from our business units increased sustainably
…income from our business Section units increased sustainably… Page 21
Slide 23: Subsidiaries Business
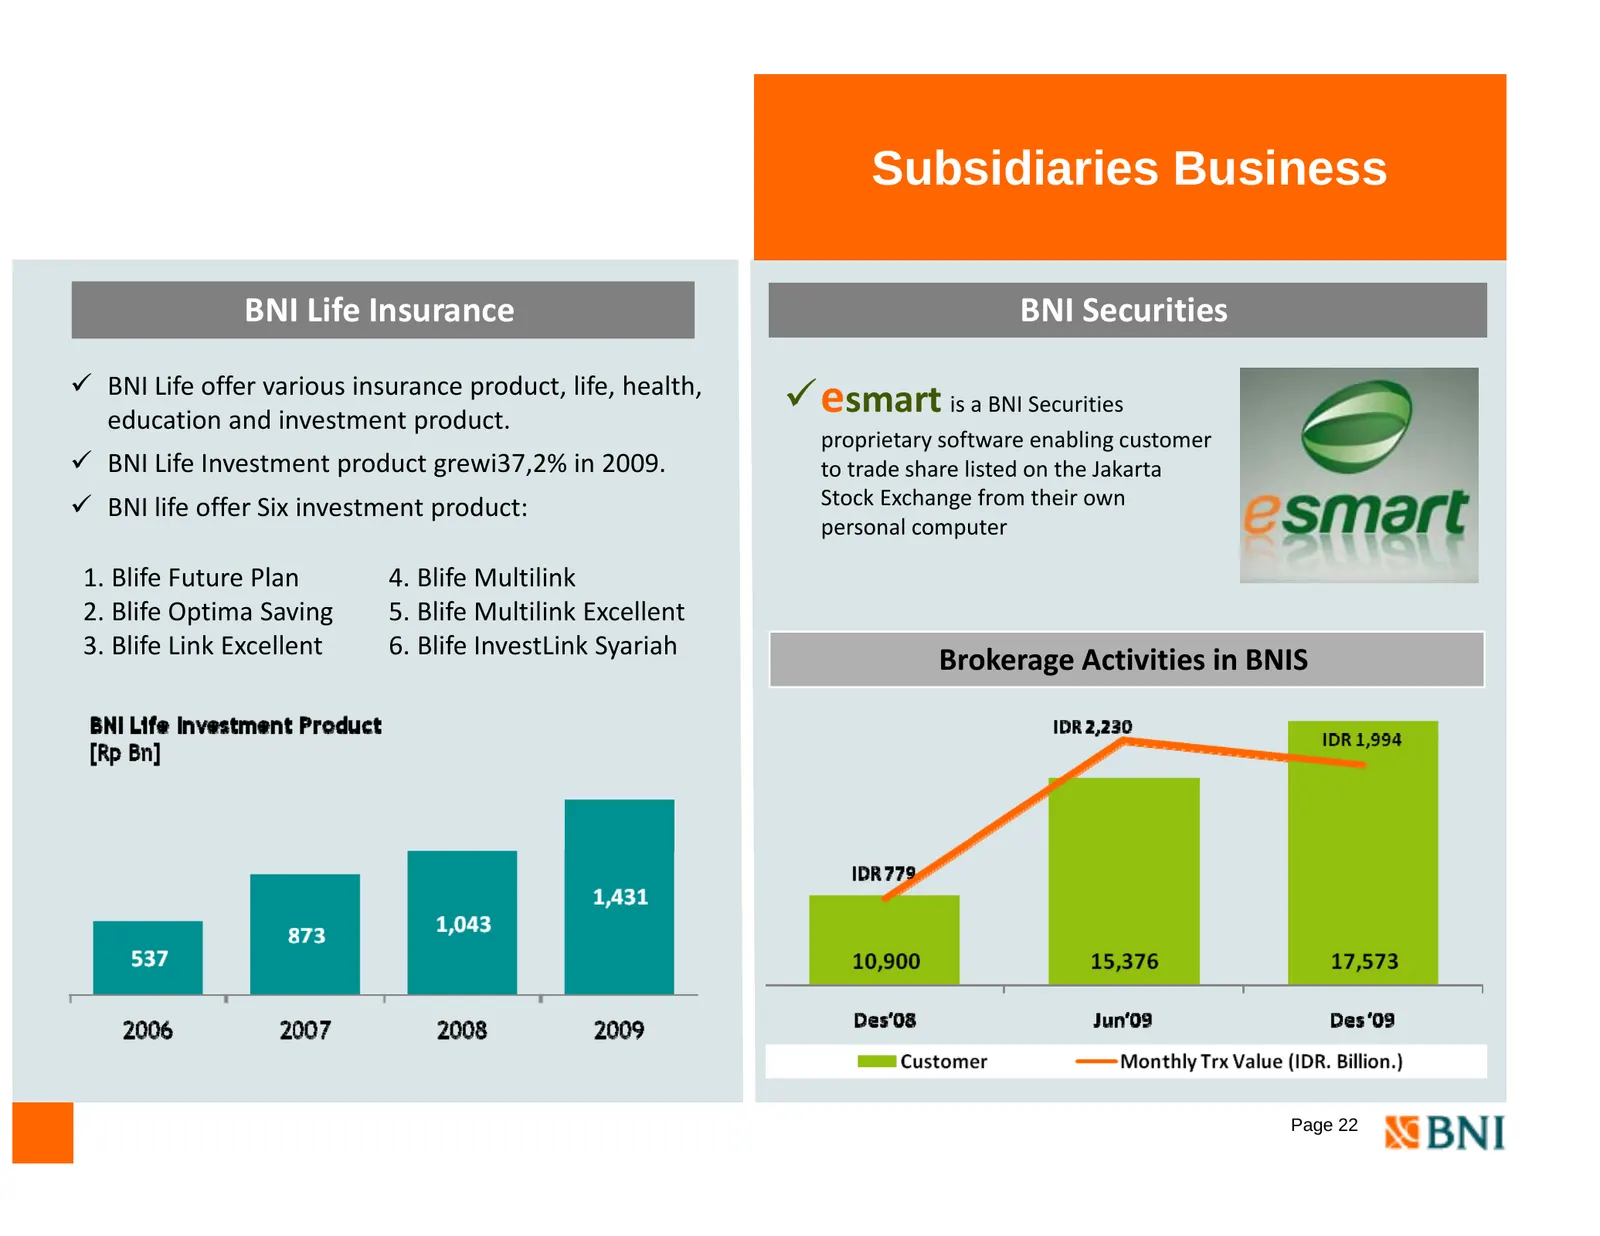
Subsidiaries Business BNI Life Insurance BNI Securities 9 BNI Life offer various insurance product, education and investment product. product life, life health, health 9 esmart is a BNI Securities proprietary software enabling customer 9 BNI Life Investment product grewi37,2% in 2009. to trade share
Slide 24: Consumer & Credit Card Business
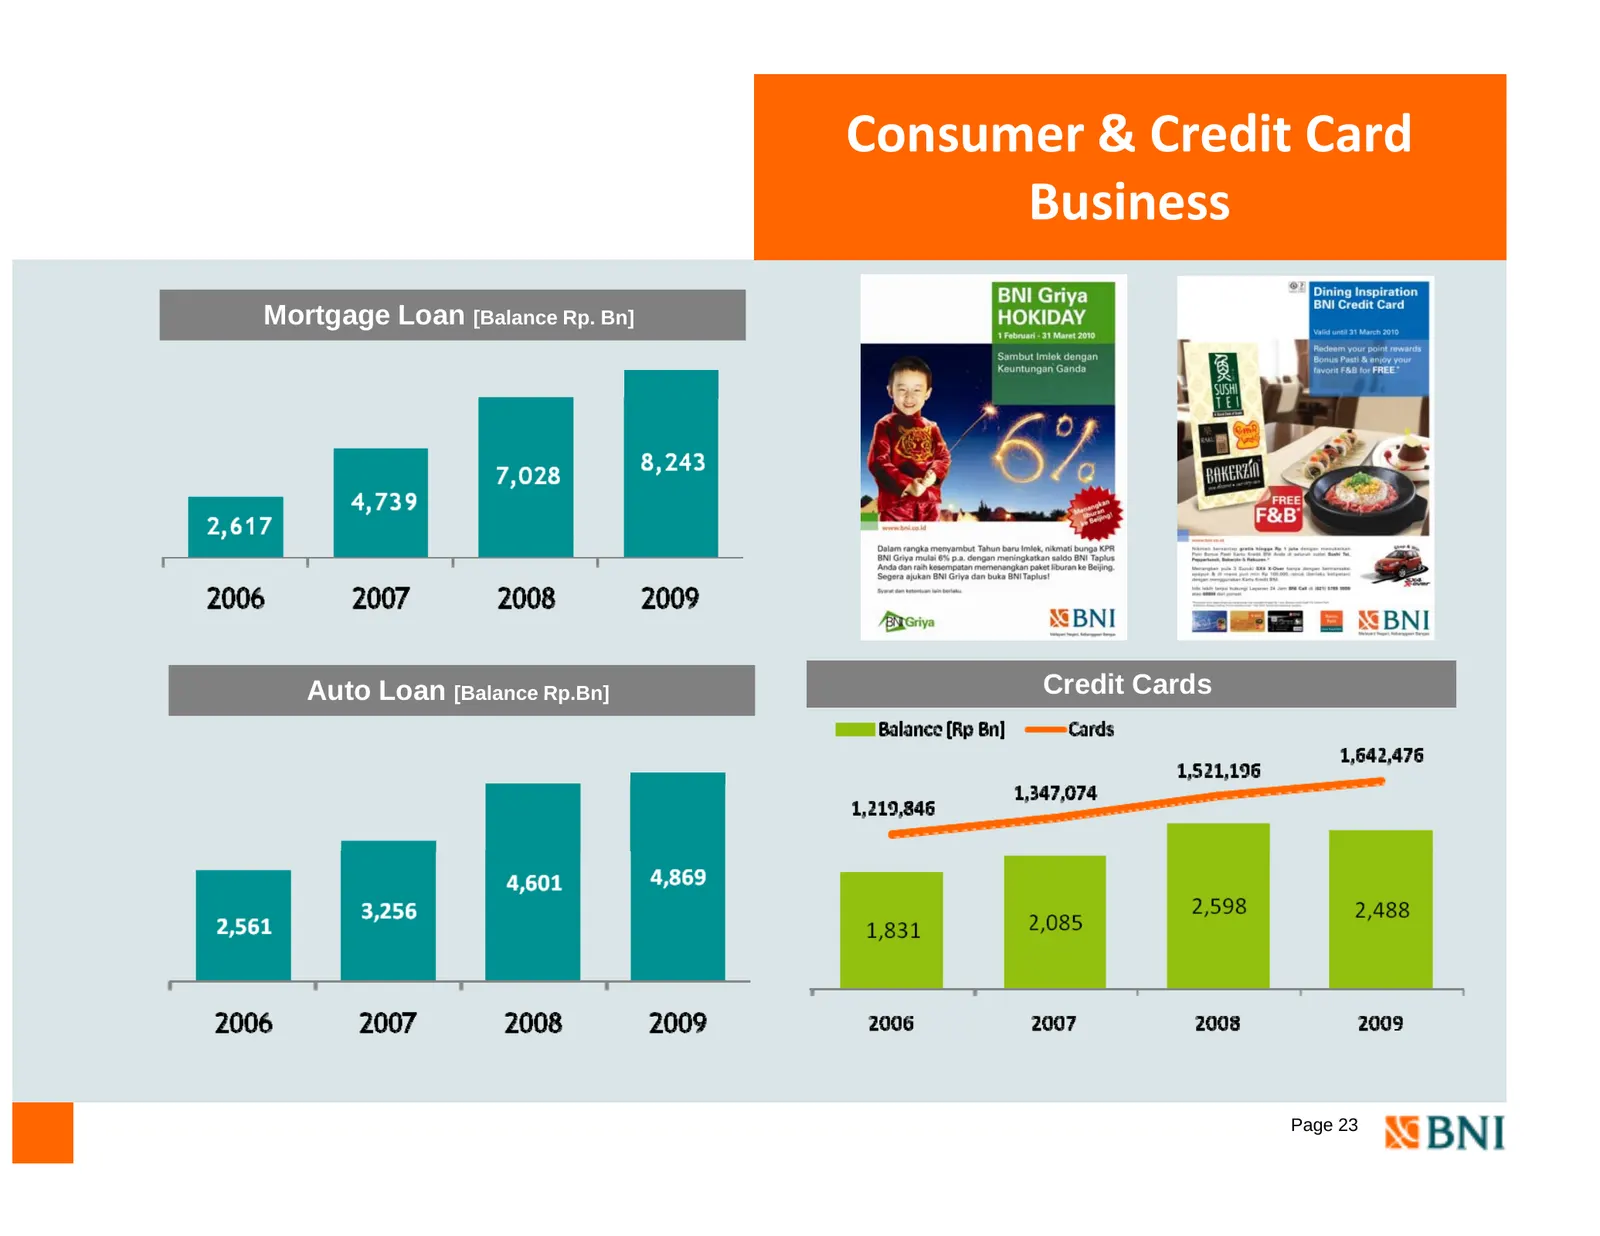
Consumer & Credit Card Business Mortgage Loan [Balance Rp. Bn] Auto Loan [Balance Rp.Bn] Rp Bn] Credit Cards Page 23
Slide 25: International Business
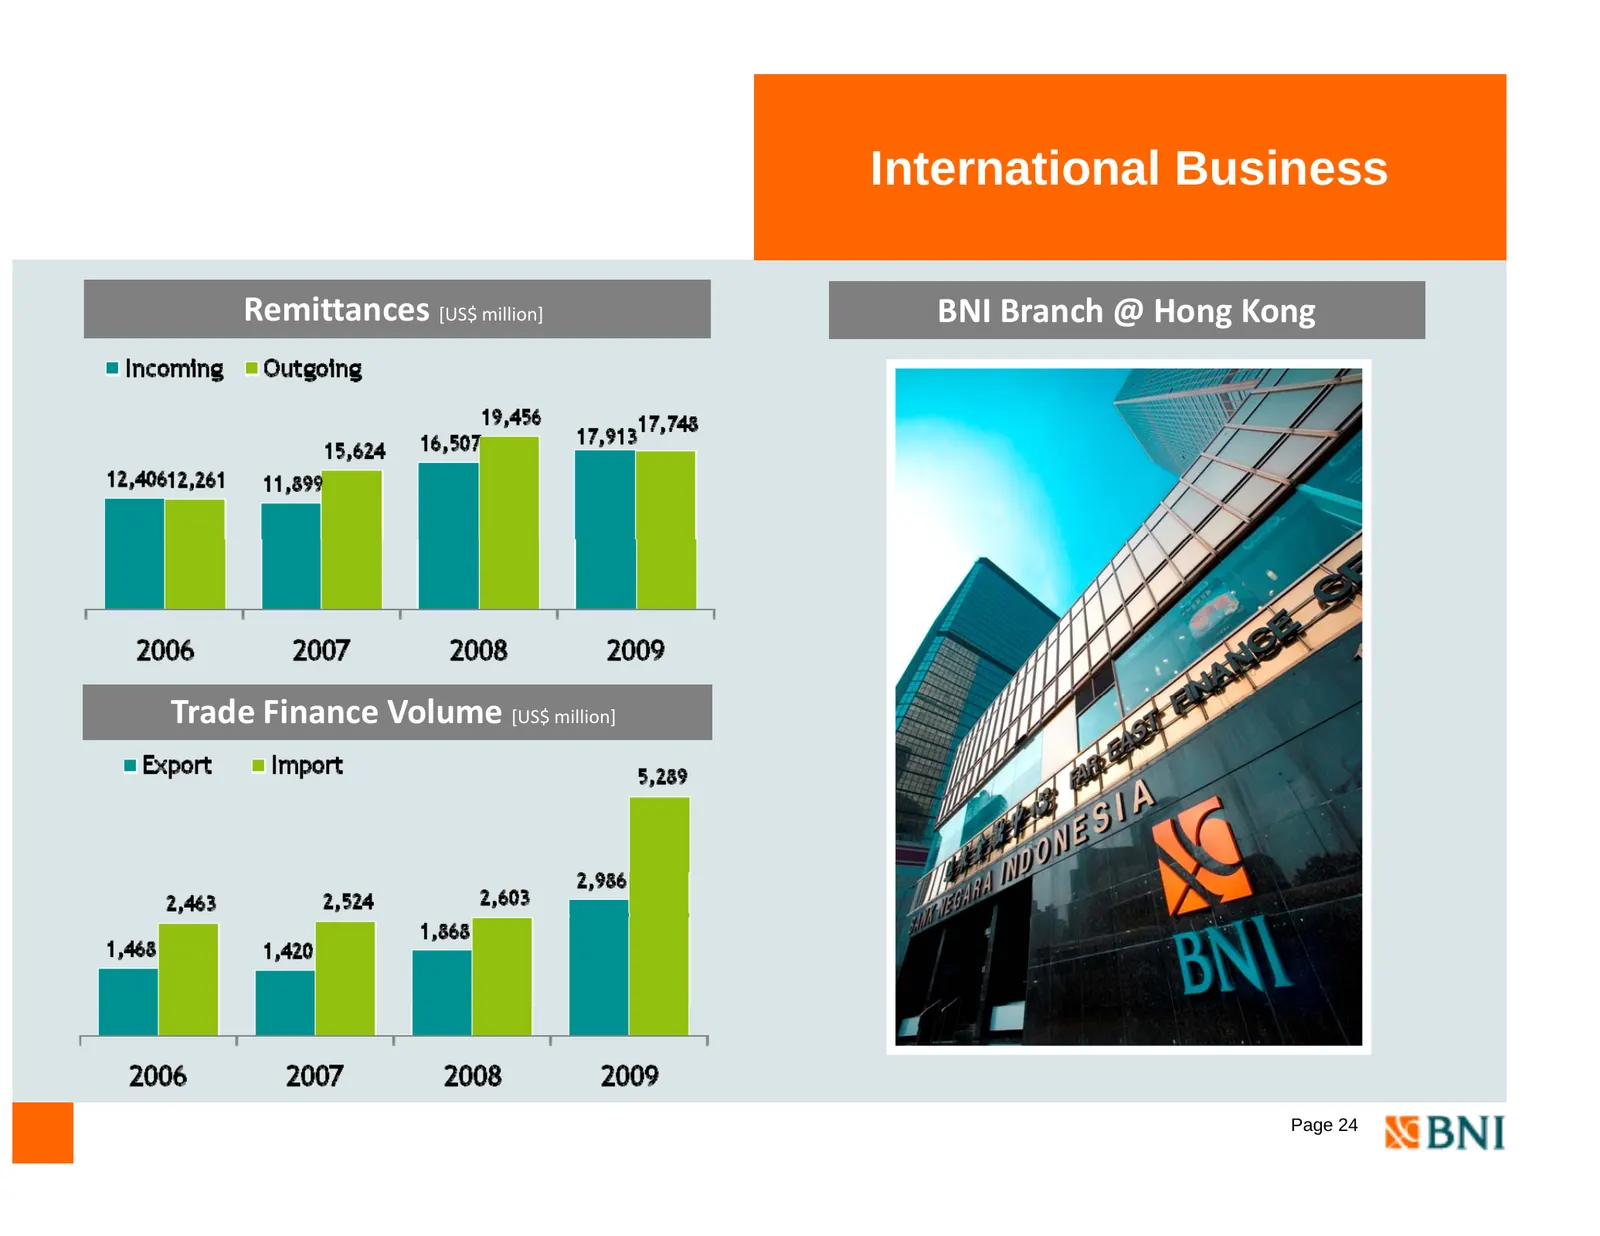
International Business Remittances [US$ million] BNI Branch @ Hong Kong Trade Finance Volume [US$ million] Page 24
Slide 26: SME Business
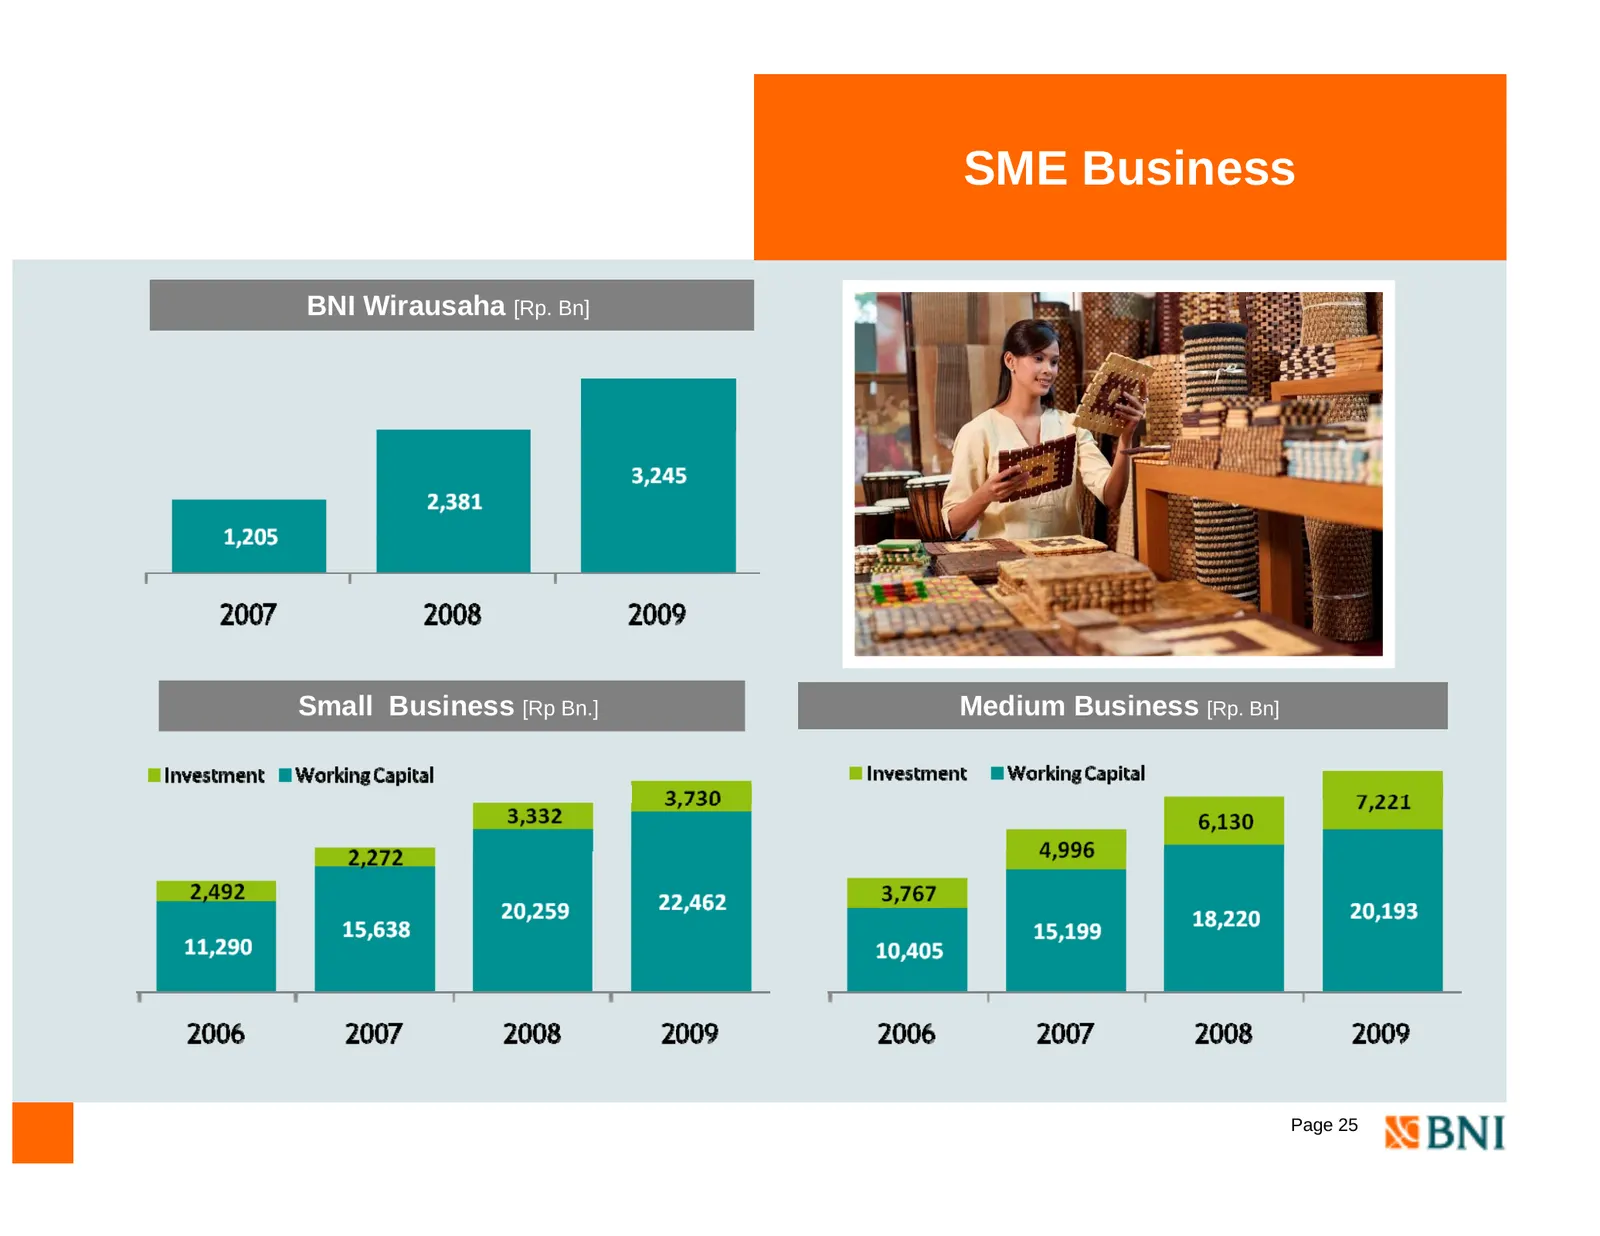
SME Business BNI Wirausaha [Rp. Bn] S Small Business [Rp Bn.] Medium Business [Rp. Bn] Page 25
Slide 27: Sharia Business
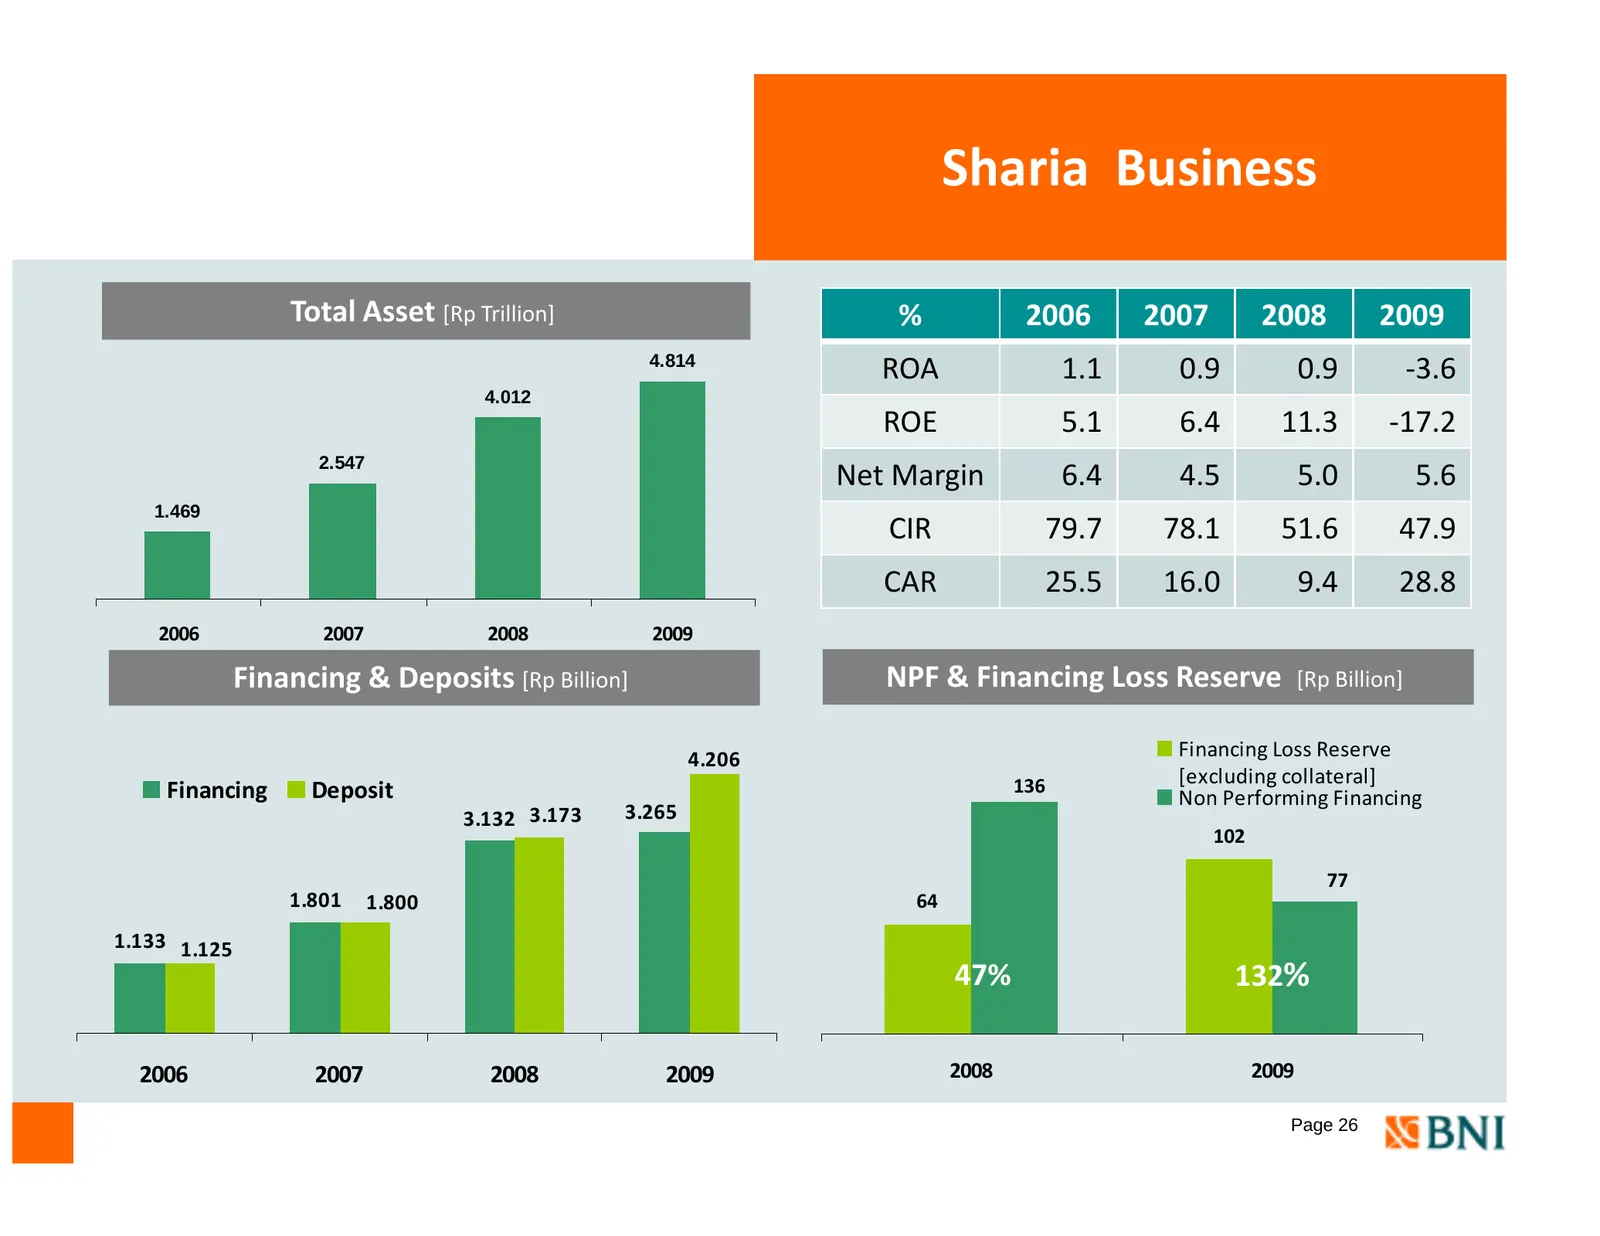
Sharia Business Total Asset [Rp Trillion] % 2006 2007 2008 2009 4.814 ROA 1.1 0.9 0.9 ‐3.6 4.012 ROE 5.1 6.4 11.3 ‐17.2 2.547 Net Margin 6.4 4.5 5.0 5.6 1.469 CIR 79.7 78.1 51.6 47.9 CAR 25.5 16.0 9.4 28.8 2006 2007 2008 2009 Financing & Deposits [Rp Billion] NPF & Financing Loss Reserve [Rp Billion
Slide 28: Dampak Bisnis atas diterapkannya PPn Murabahah
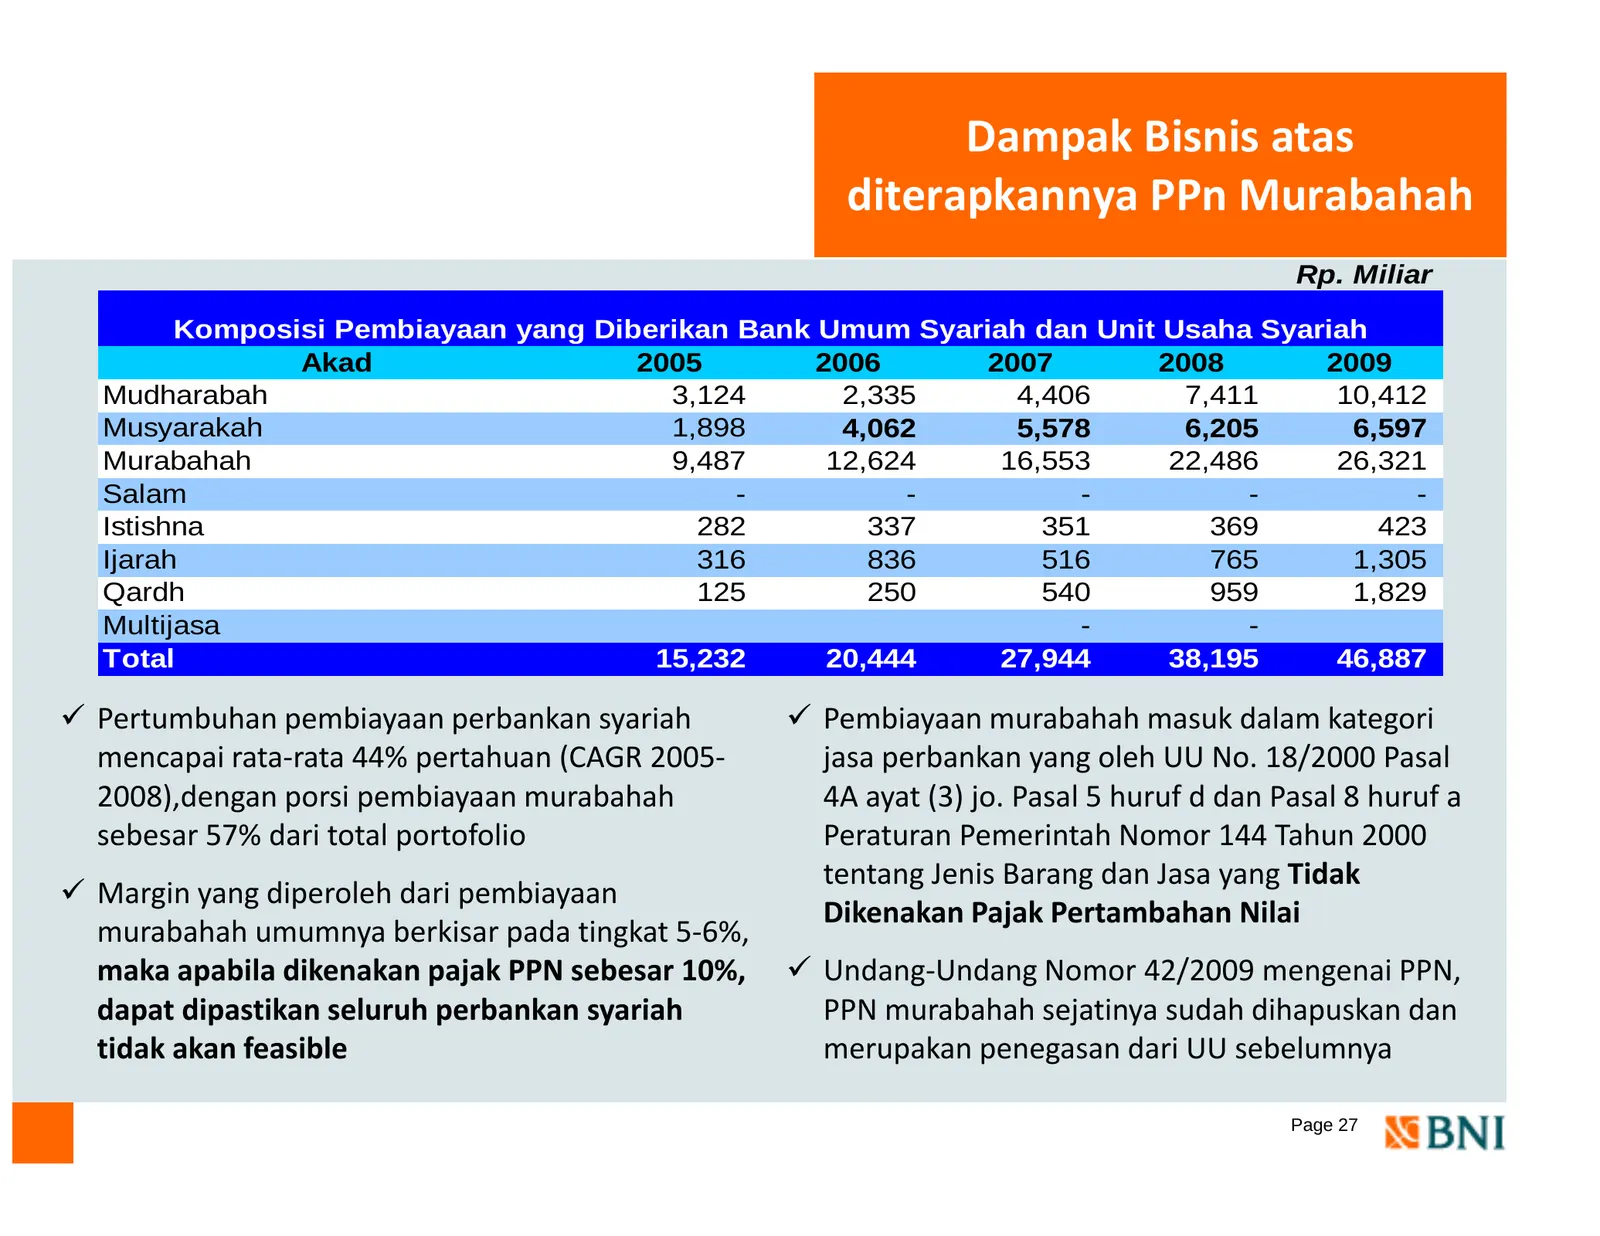
Dampak Bisnis atas diterapkannya PPn Murabahah Rp. Miliar Komposisi Pembiayaan yang Diberikan Bank Umum Syariah dan Unit Usaha Syariah Akad 2005 2006 2007 2008 2009 Mudharabah 3,124 2,335 4,406 7,411 10,412 Musyarakah 1,898 4,062 5,578 6,205 6,597 Murabahah 9,487 12,624 16,553 22,486 26,321 Salam -
Slide 29: Corporate Business
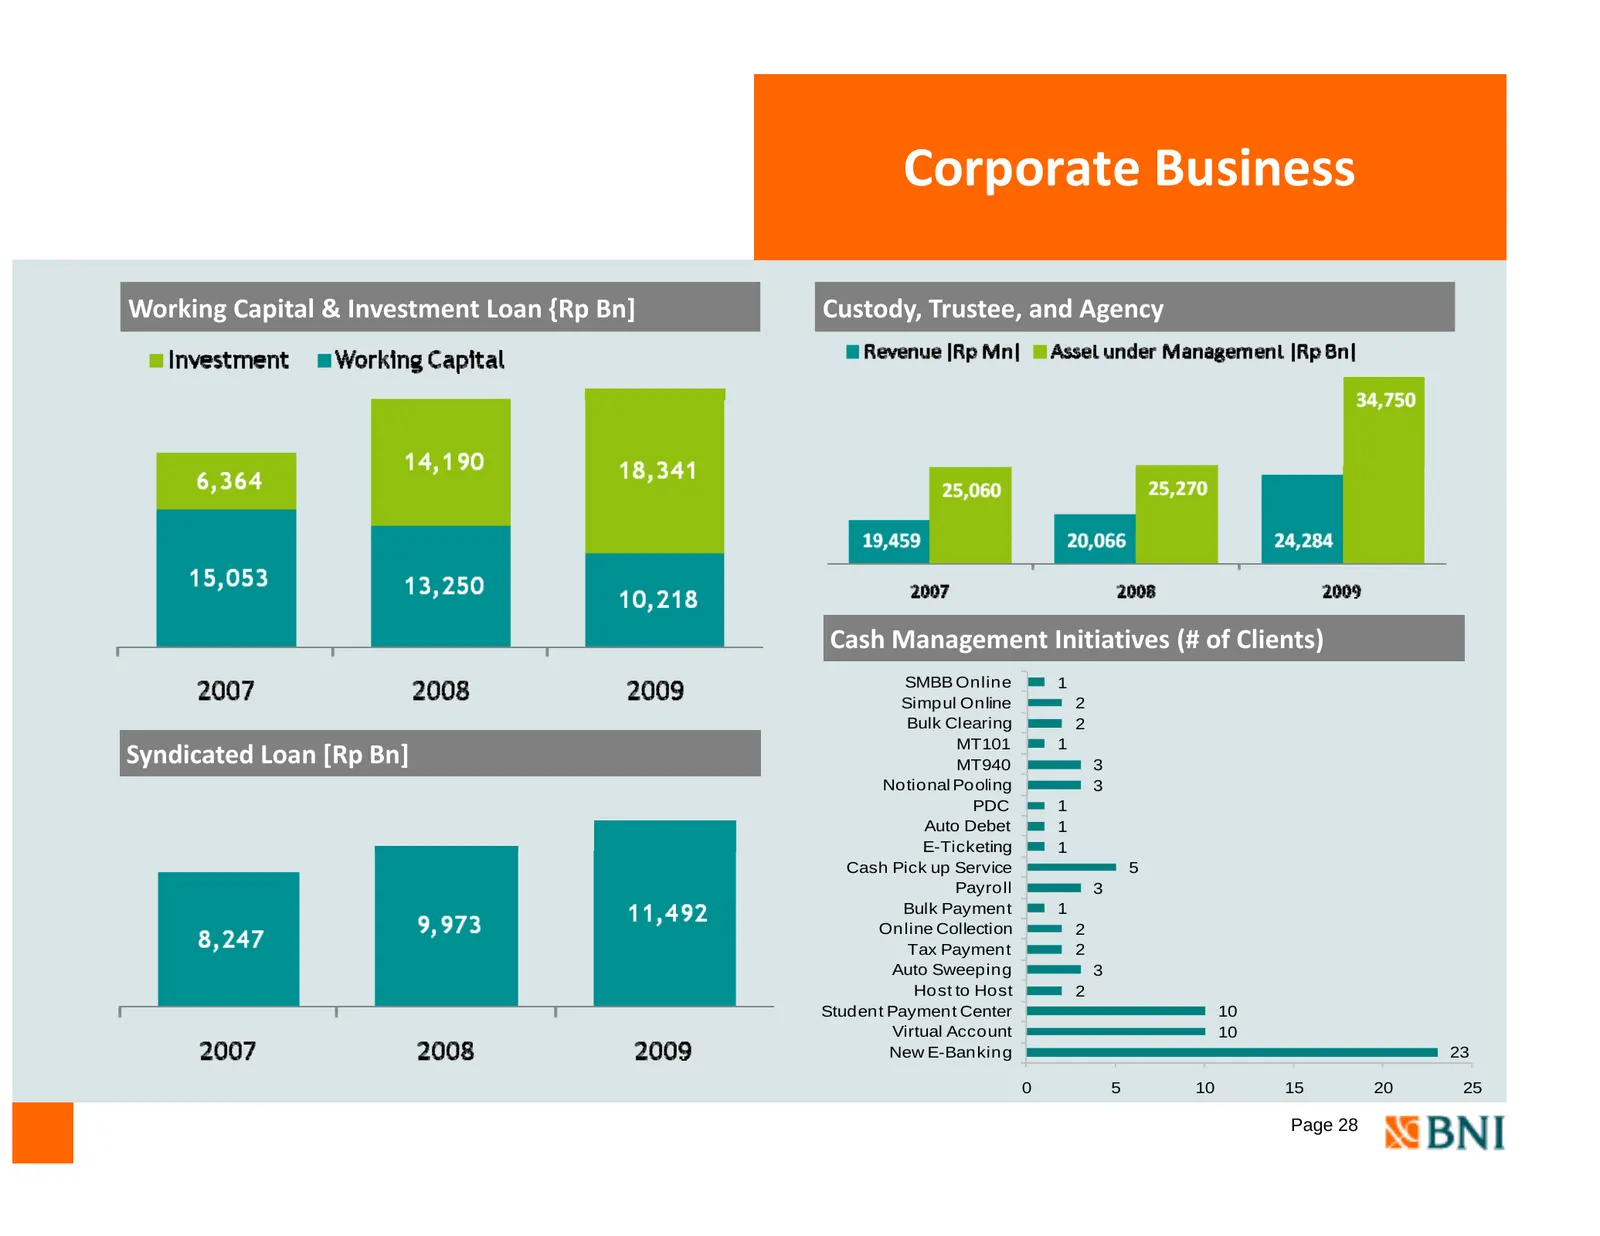
Corporate Business Working Capital & Investment Loan {Rp Bn] Custody, Trustee, and Agency Cash Management Initiatives (# of Clients) SMBB Online 1 Simpul Online 2 Bulk Clearing 2 MT101 1 Syndicated Loan [Rp Bn] MT940 3 Notional Pooling 3 PDC 1 Auto Debet 1 E-Ticketing E Ticketing 1 Cash Pick up Serv
Slide 30: Loan Quality
Section Loan Quality Page 29
Slide 31: Loan Collectibility
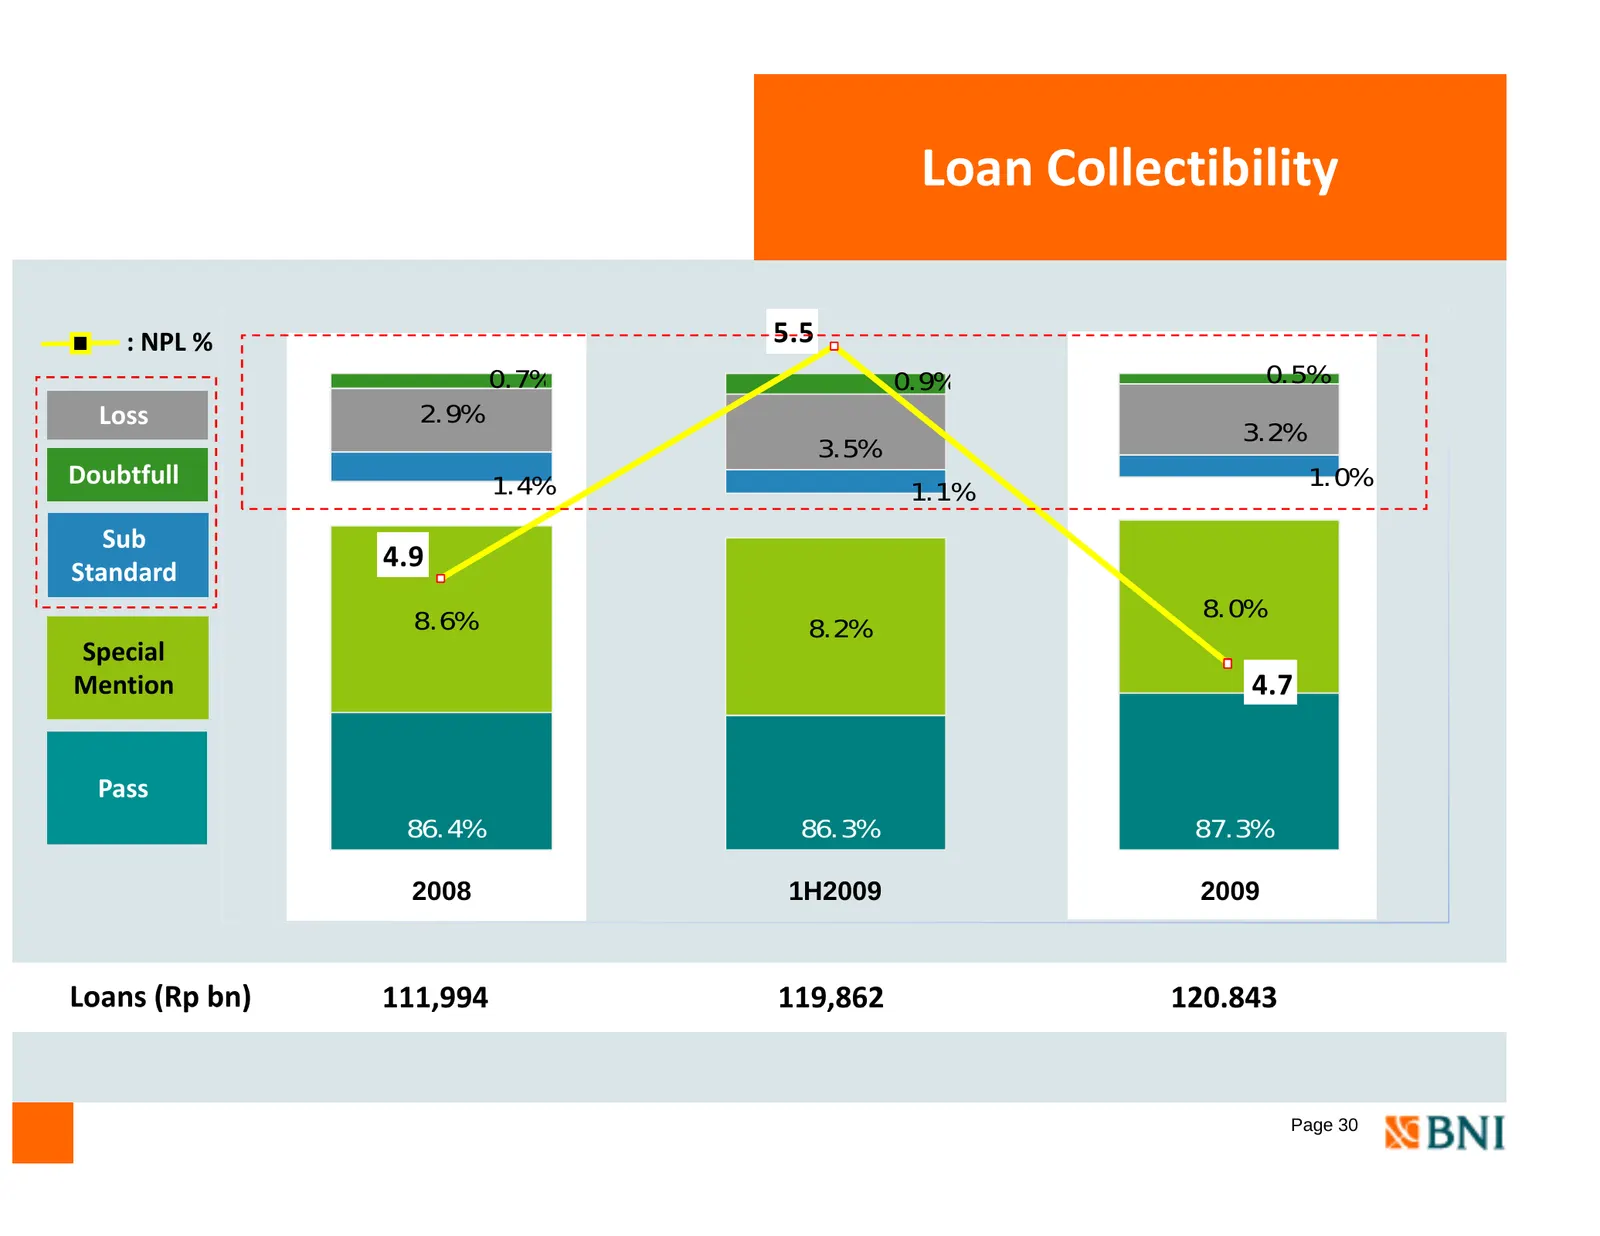
Loan Collectibility : NPL % 5.5 0 7% 0.7% 0 9% 0.9% 0.5% Loss 2.9% 3.2% 3.5% Doubtfull 1.4% 1.0% 1.1% Sub Standard 4.9 8.6% 8.0% 8.2% Special Mention 4.7 Pass 86.4% 86.3% 87.3% 2008 1H2009 2009 Loans oa s (Rp ( p bn) b ) 111,994 119,862 120.843 Page 30
Slide 32: NPL by Segment
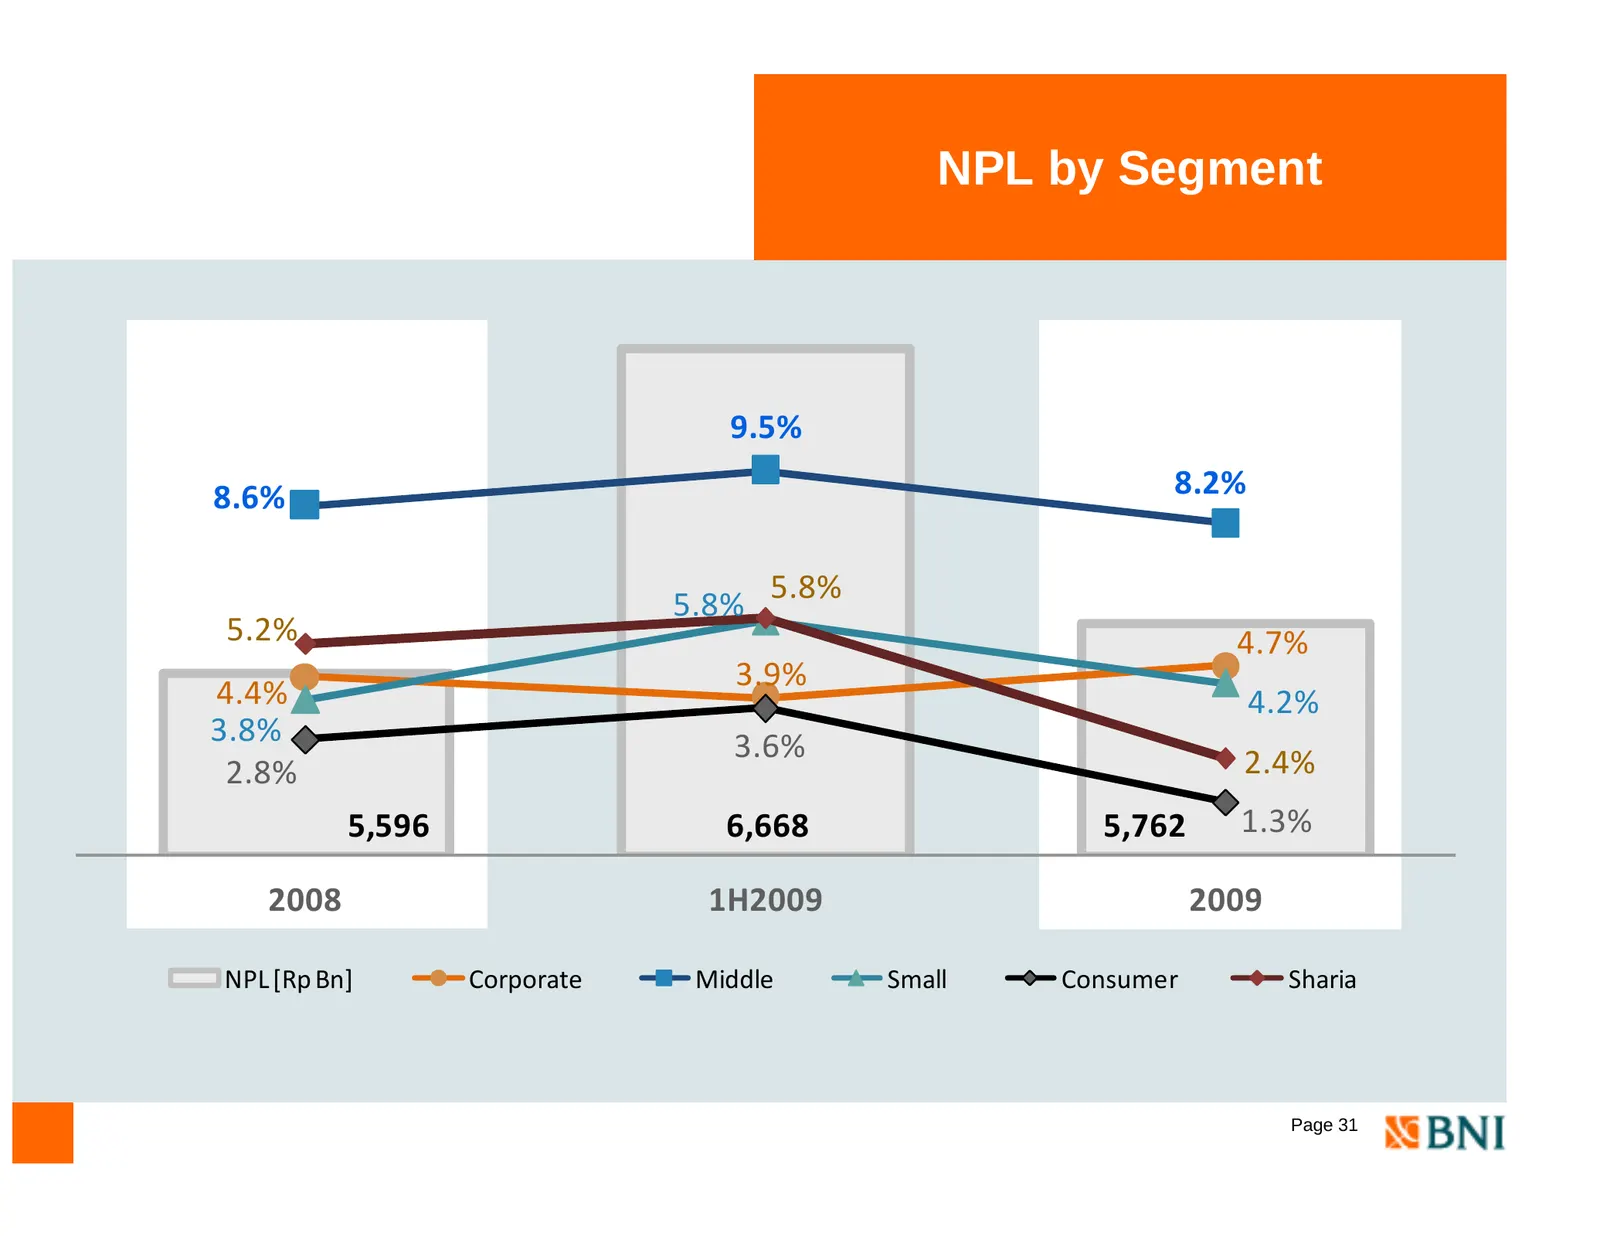
NPL by Segment 9.5% 8.6% 8.2% 5.8% 5.8% 5.2% 4.7% 3.9% 4.4% 4 4% 4 2% 4.2% 3.8% 3.6% 2.8% 2.4% 5,596 6,668 5,762 1.3% 2008 1H2009 2009 NPL [Rp Bn] Corporate Middle Small Consumer Sharia Page 31
Slide 33: Coverage
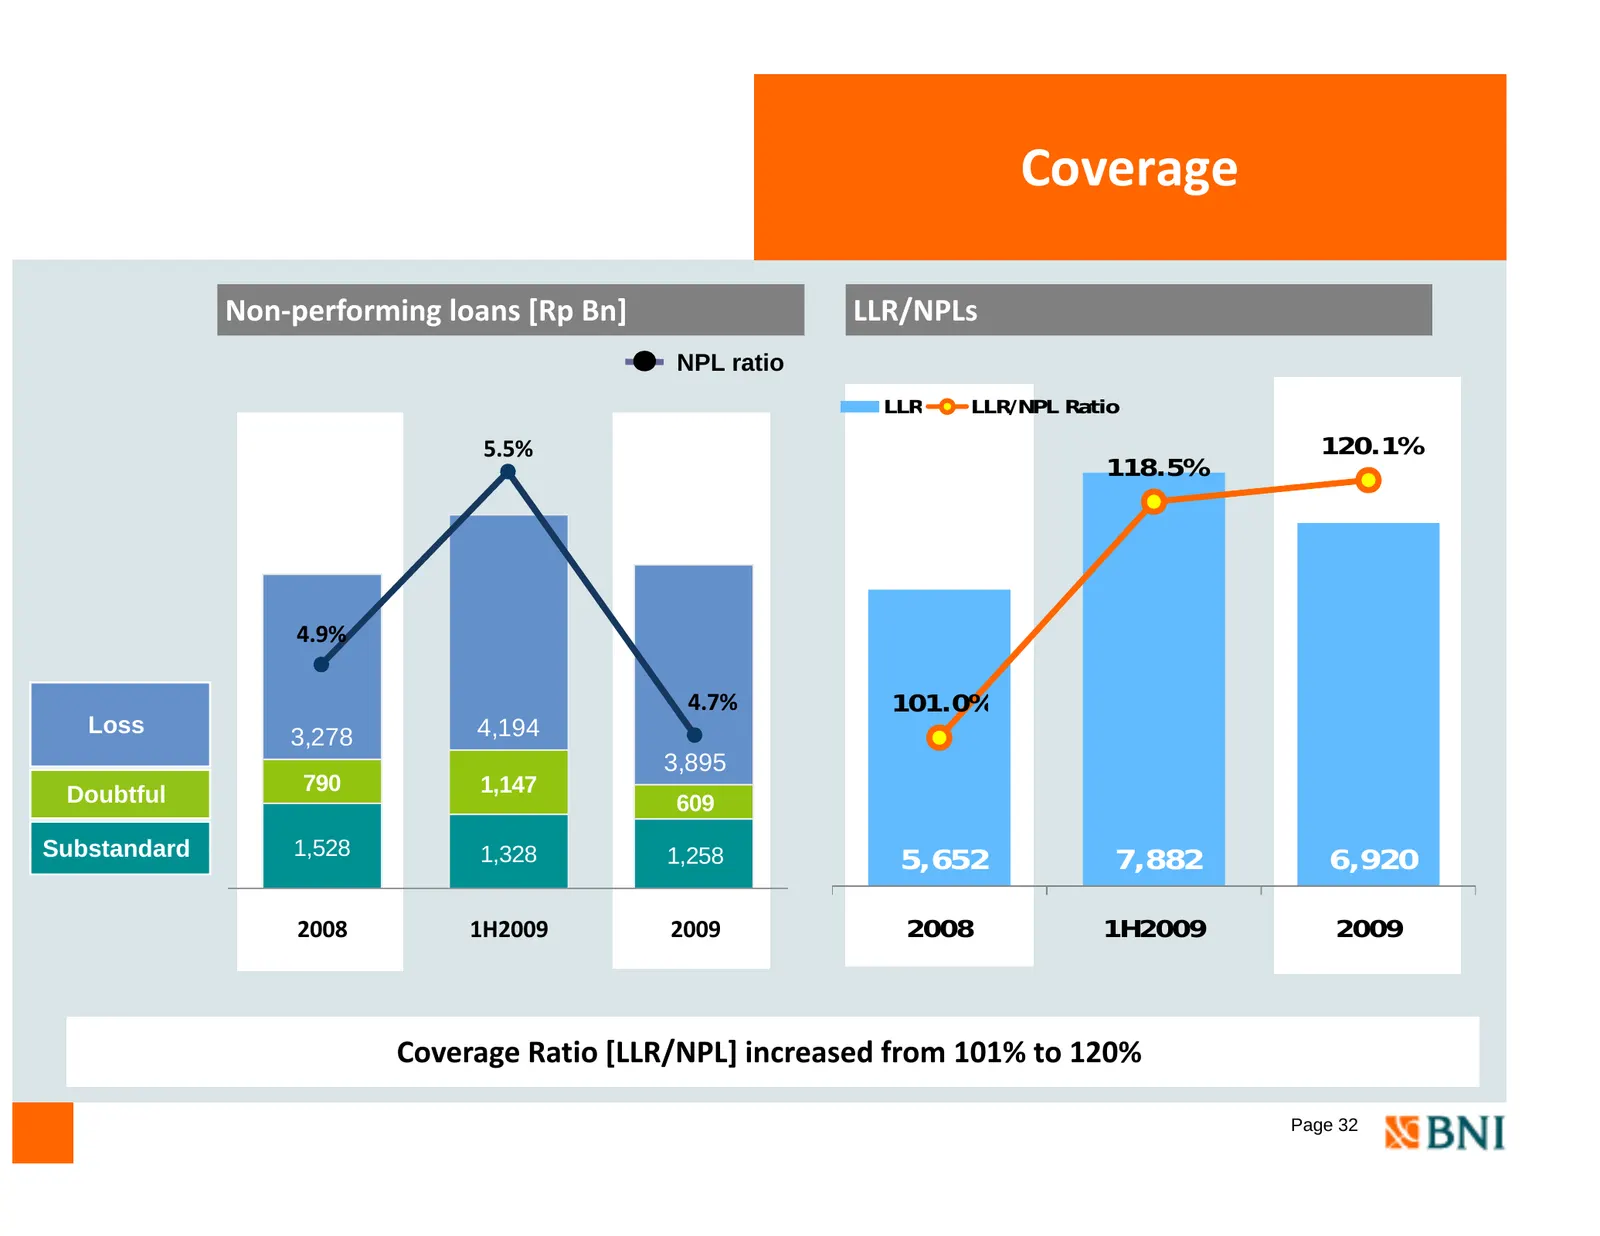
Coverage Non‐performing loans [Rp Bn] LLR/NPLs NPL ratio LLR LLR/NPL Ratio 5.5% 120.1% 118.5% 4.9% 4 7% 4.7% 101 0% 101.0% Loss 4,194 3,278 3,895 Doubtful 790 1,147 609 Substandard 1 528 1,528 1 328 1,328 1 258 1,258 5 652 5,652 7 882 7,882 6 920 6,920 2008 1H2009 2009 2008 1H2009 2009 Coverage Rati
Slide 34: Asset Recovery
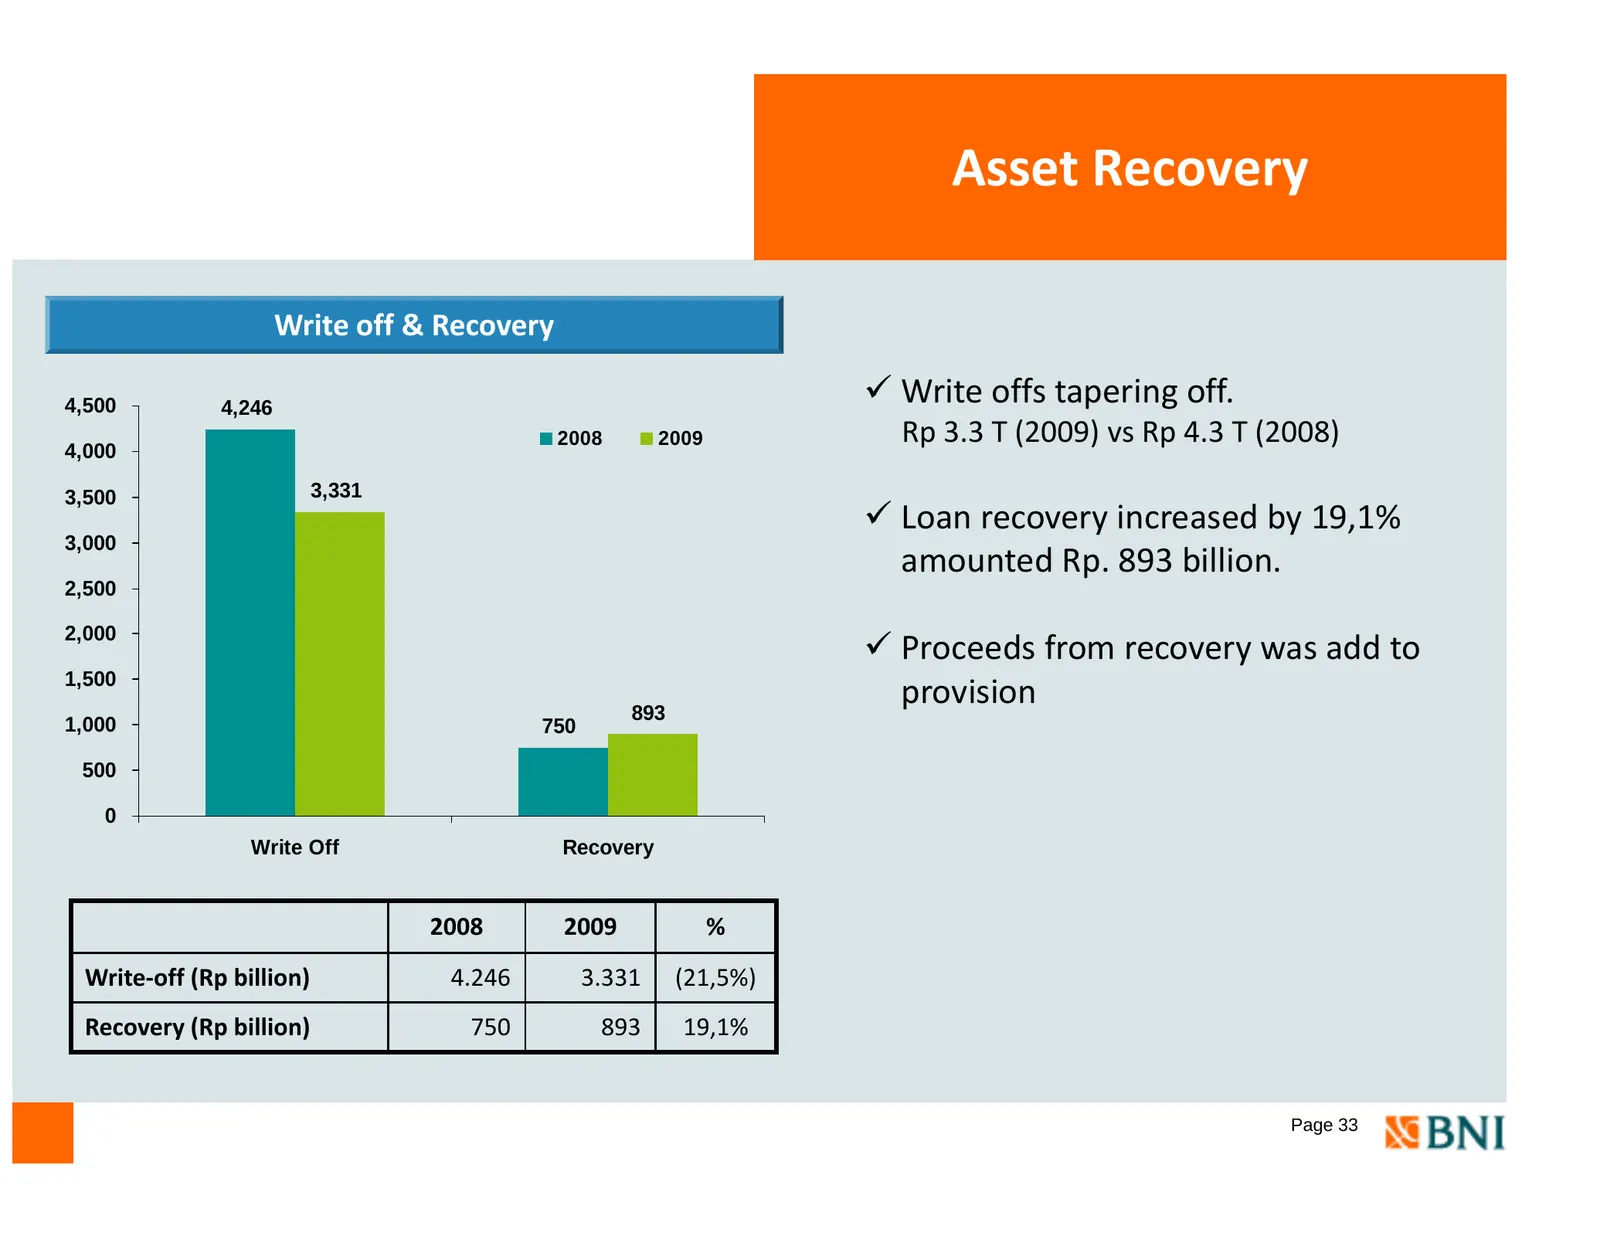
Asset Recovery Write off & Recovery 4,500 4,246 9 Write W it offs ff ttapering i off. ff 2008 2009 Rp 3.3 T (2009) vs Rp 4.3 T (2008) 4,000 3,500 3,331 9 Loan recovery increased by 19,1% 3 000 3,000 amounted Rp. 893 billion. 2,500 2,000 9 Proceeds from recovery was add to 1,500 893 provision 1,000 7
Slide 35: Risk Profile
Section Risk Profile Page 34
Slide 36: Progress on Risk Profile
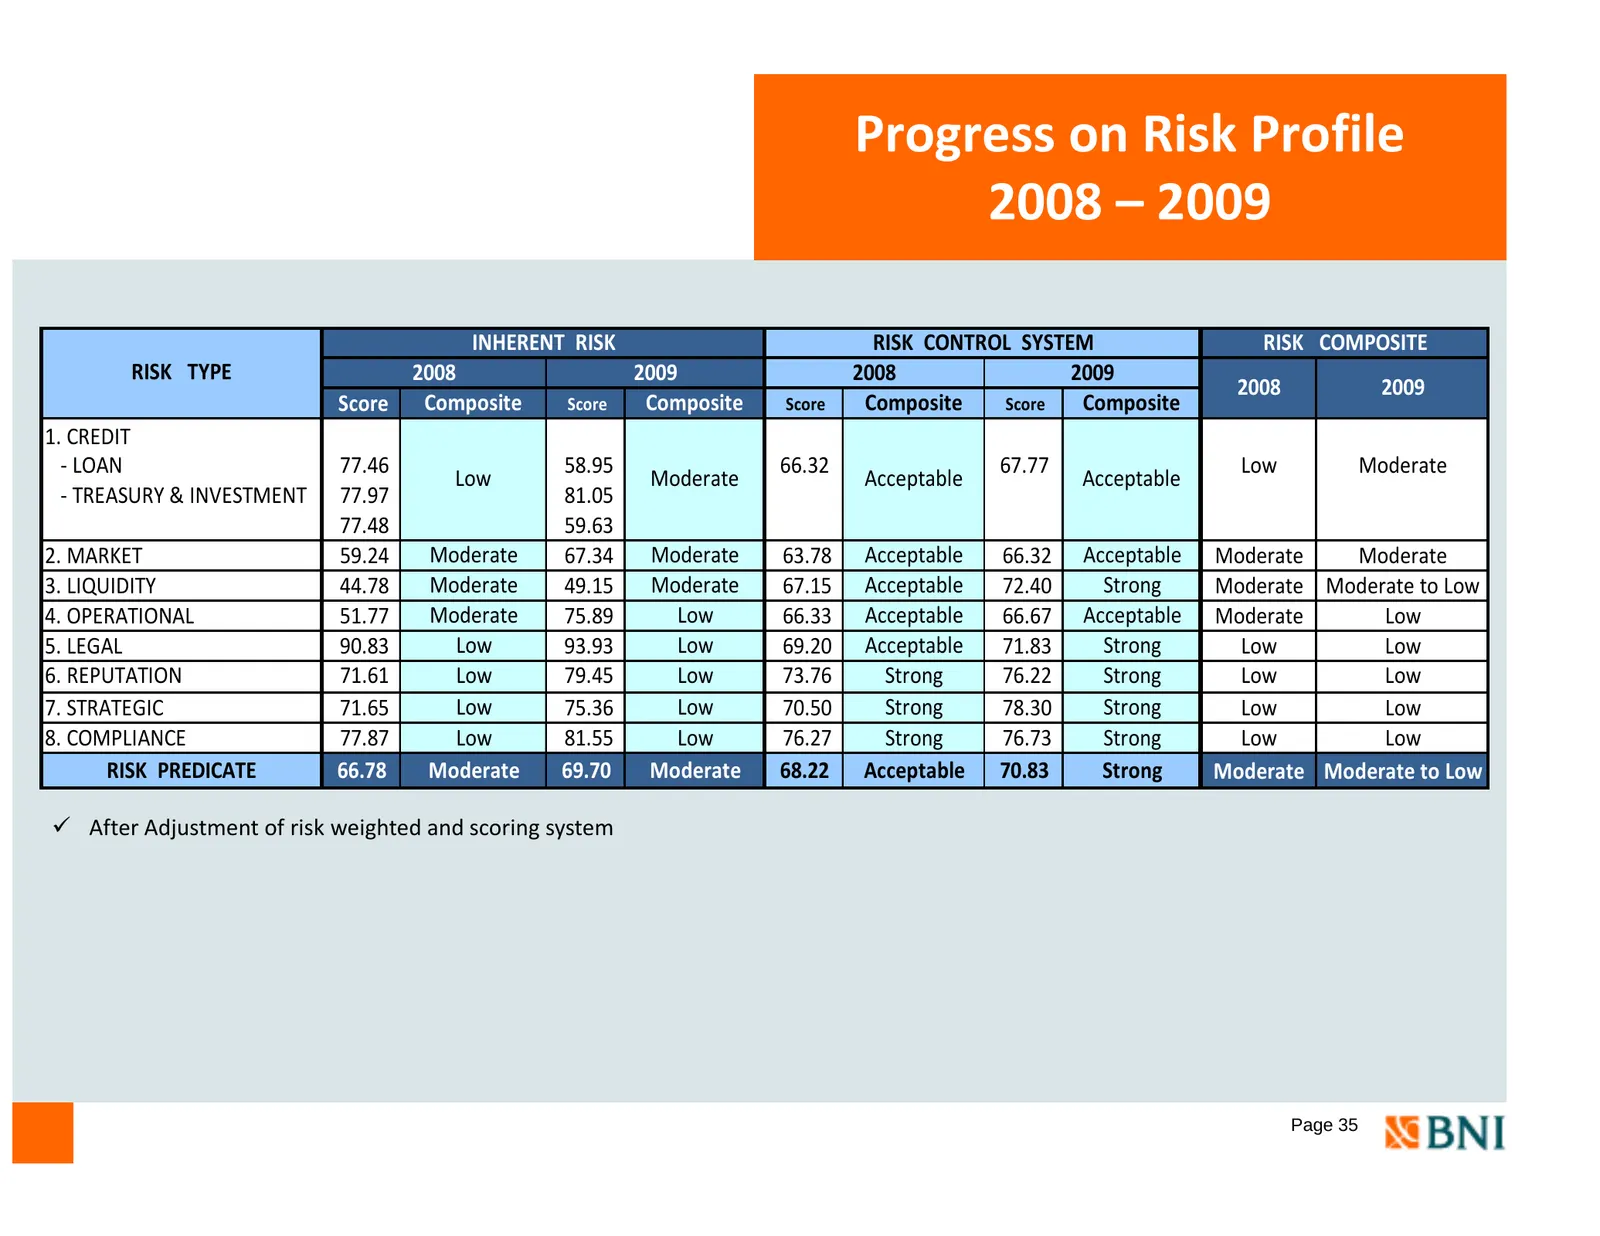
Progress on Risk Profile 2008 – 2009 INHERENT RISK RISK CONTROL SYSTEM RISK COMPOSITE RISK TYPE 2008 2009 2008 2009 2008 2009 Score Composite Score Composite Score Composite Score Composite 1. CREDIT ‐ LOAN 77.46 58.95 66.32 67.77 Low Moderate Low Moderate Acceptable Acceptable ‐ TREASURY & INVESTME
Slide 37: Strategic Policy 2010
Section Strategic Policy 2010 Page 36
Slide 38: Strategic Policy 2010
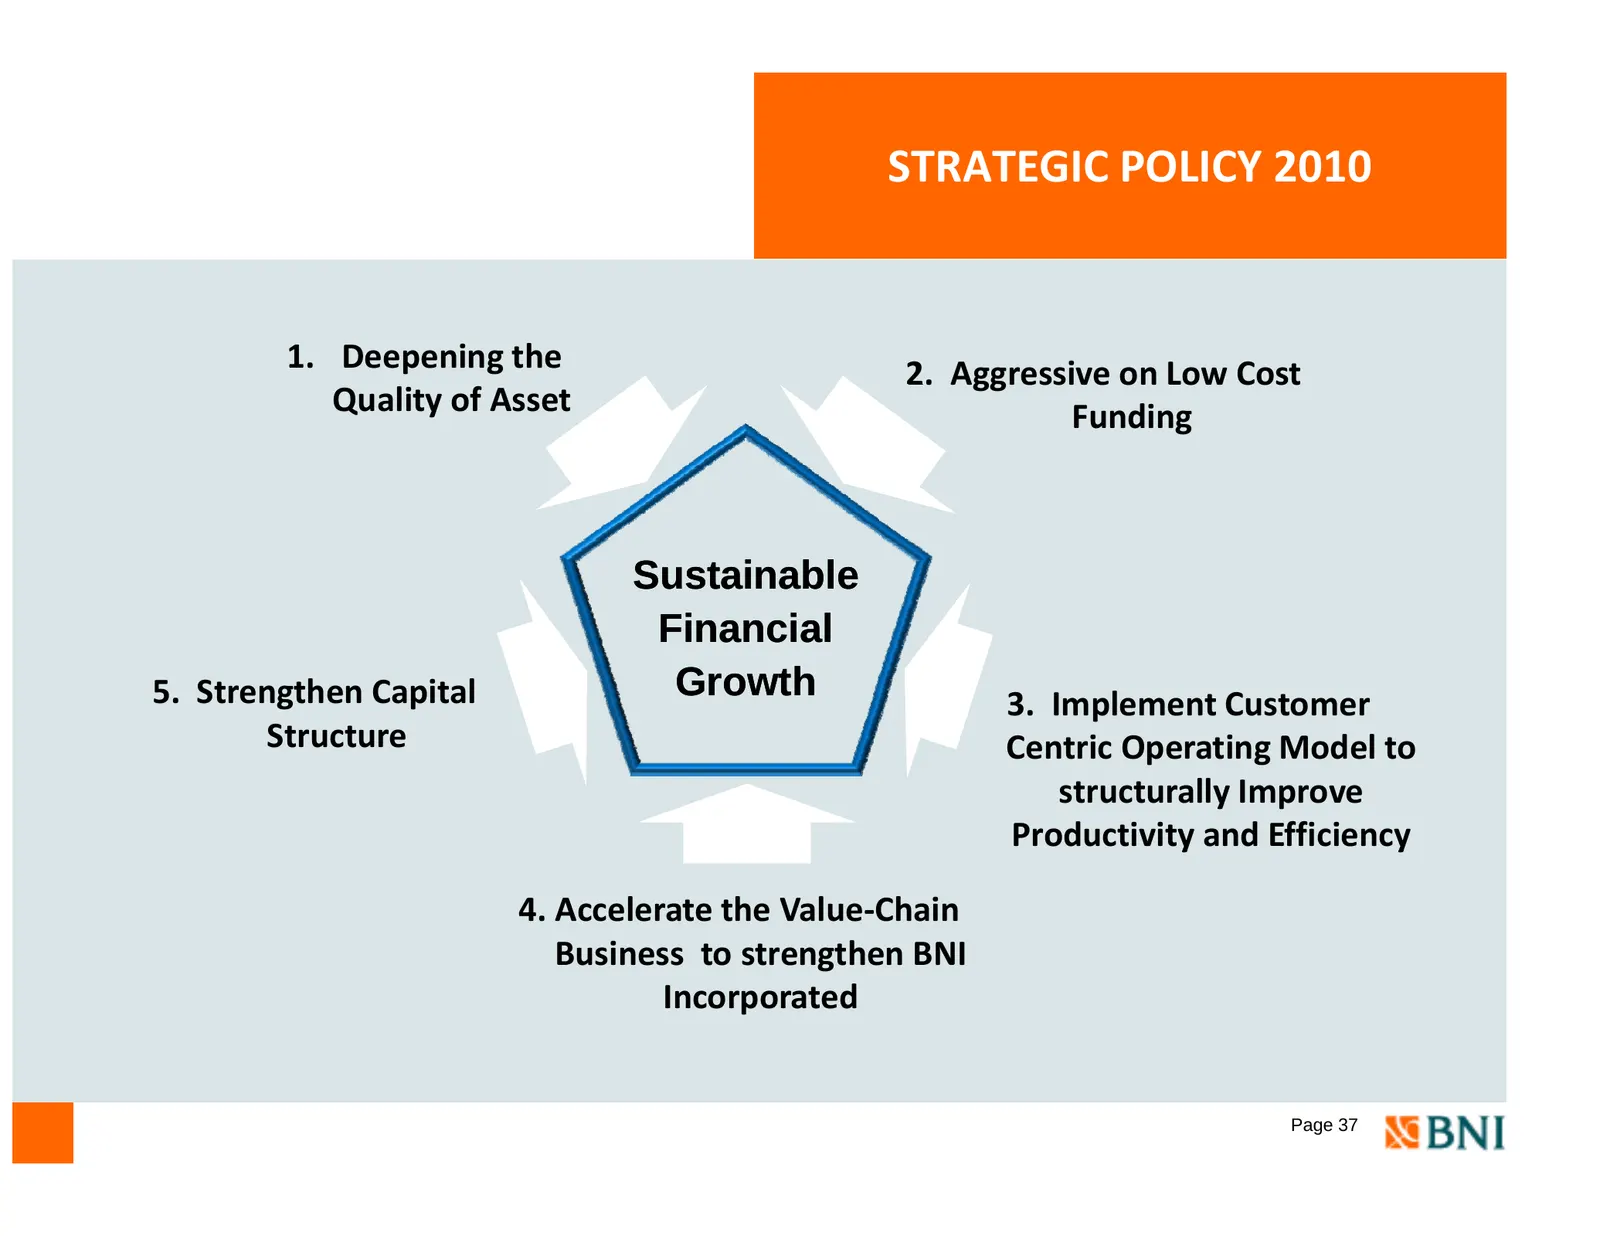
STRATEGIC POLICY 2010 1. Deepening the 2. Aggressive on Low Cost Quality of Asset Funding Sustainable Financial 5 Strengthen Capital 5. Growth G o t 3 Implement 3. I l t Customer C t Structure Centric Operating Model to structurally Improve Productivityy and Efficiencyy 4. Accelerate the Value‐Chain
Slide 39: BNI in brief
Section BNI in brief Page 38
Slide 40: BNI has a long track record in the Indonesian banking sector
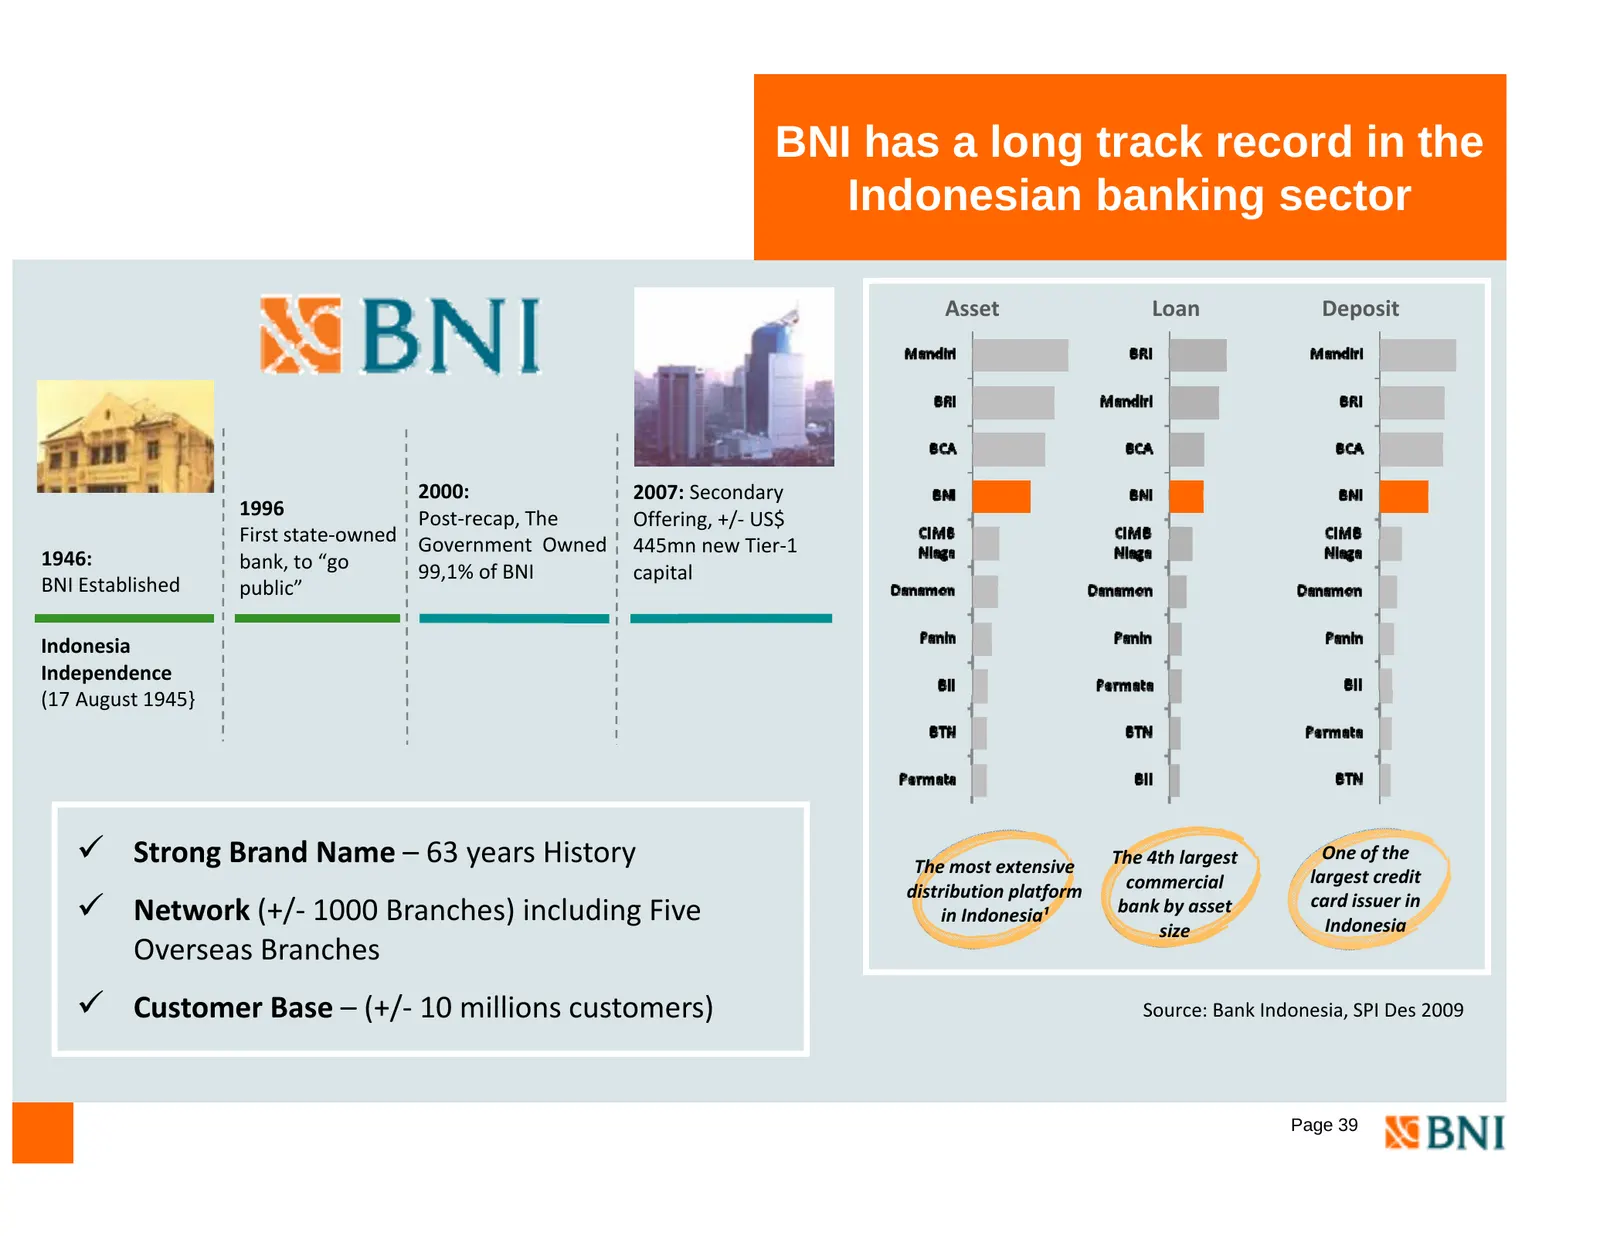
BNI has a long track record in the Indonesian banking sector Asset Loan Deposit 2000: 2007: Secondary 1996 Post‐recap, The Offering, +/‐ US$ First state‐owned state owned Government G t O Owned d 445 445mn new Tier‐1 Ti 1 1946: bank, to “go 99,1% of BNI capital BNI Established public” Indonesia Inde
Slide 41: Network & Distribution
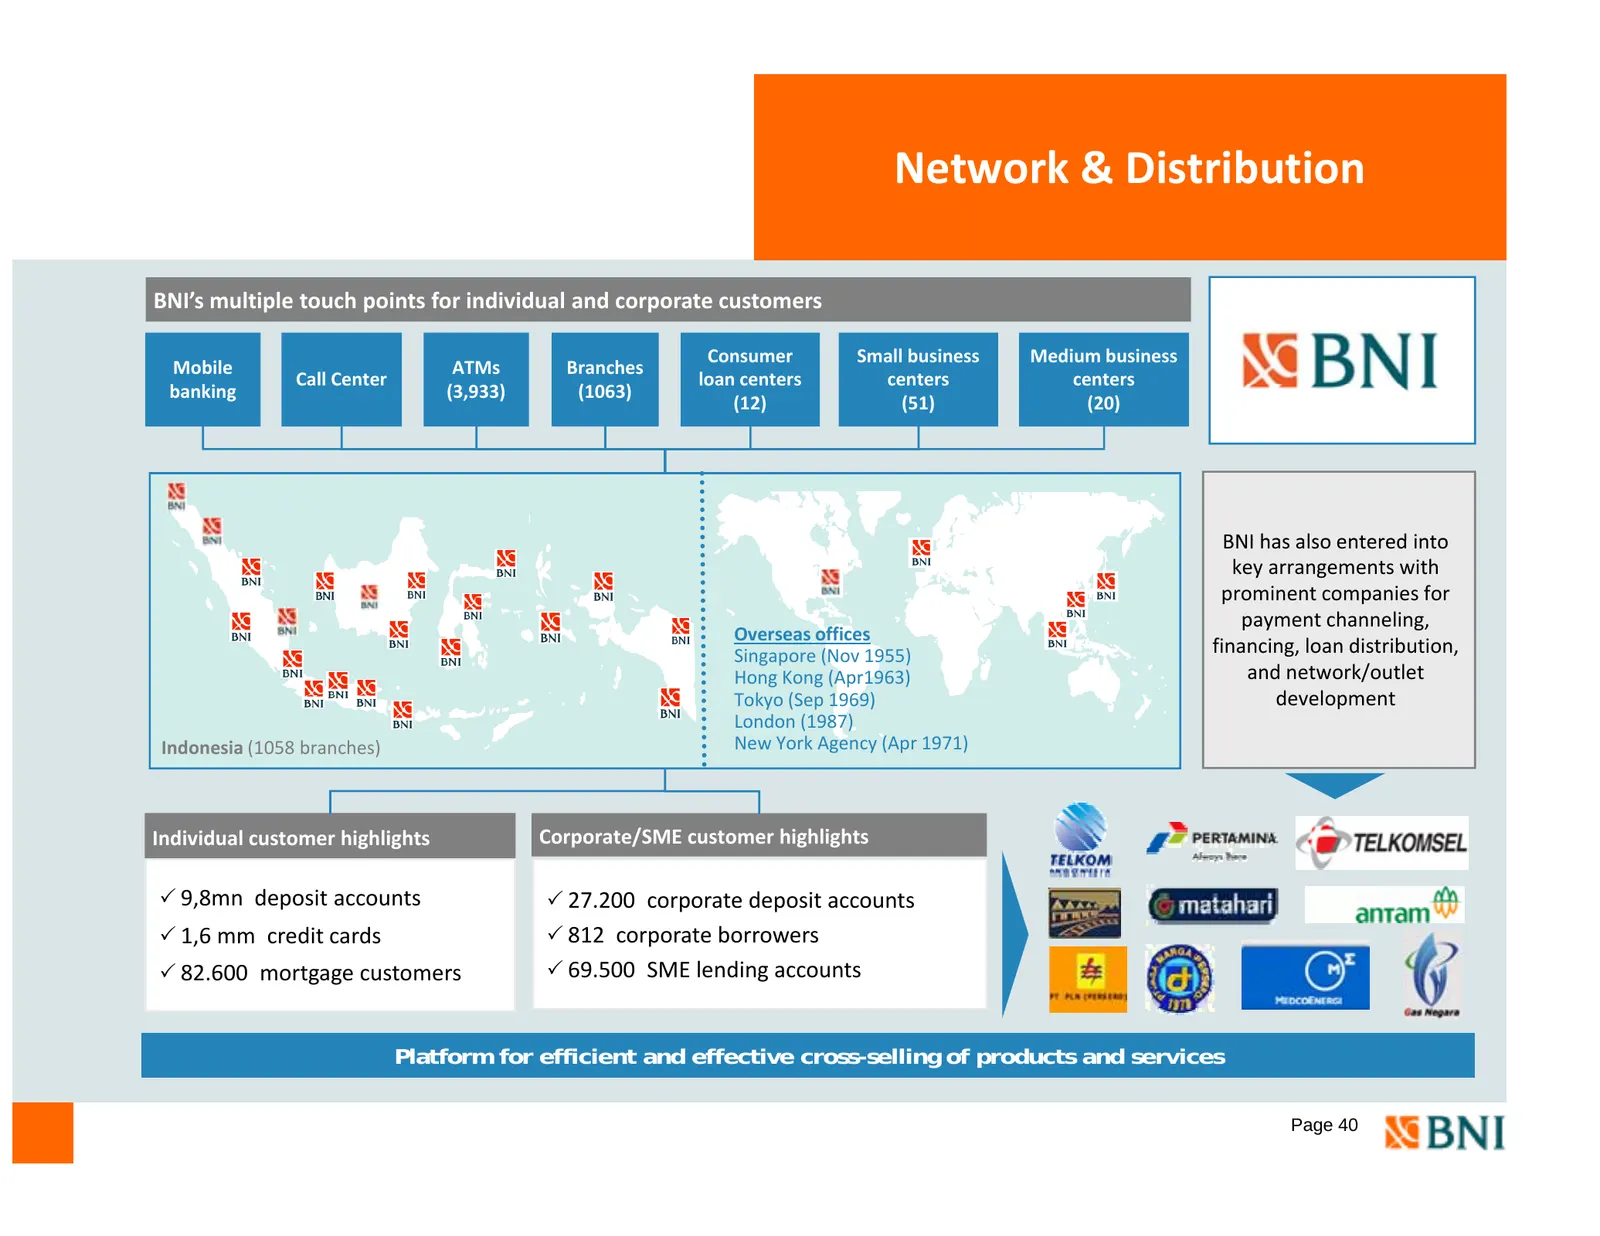
Network & Distribution BNI’s multiple touch points for individual and corporate customers Consumer Small business Medium business Mobile ATMs Branches Call Center loan centers centers centers banking ( (3,933) ) ( (1063) ) (12) (51) (20) BNI has also entered into key arrangements with prominent comp
Slide 42: Offering leading products
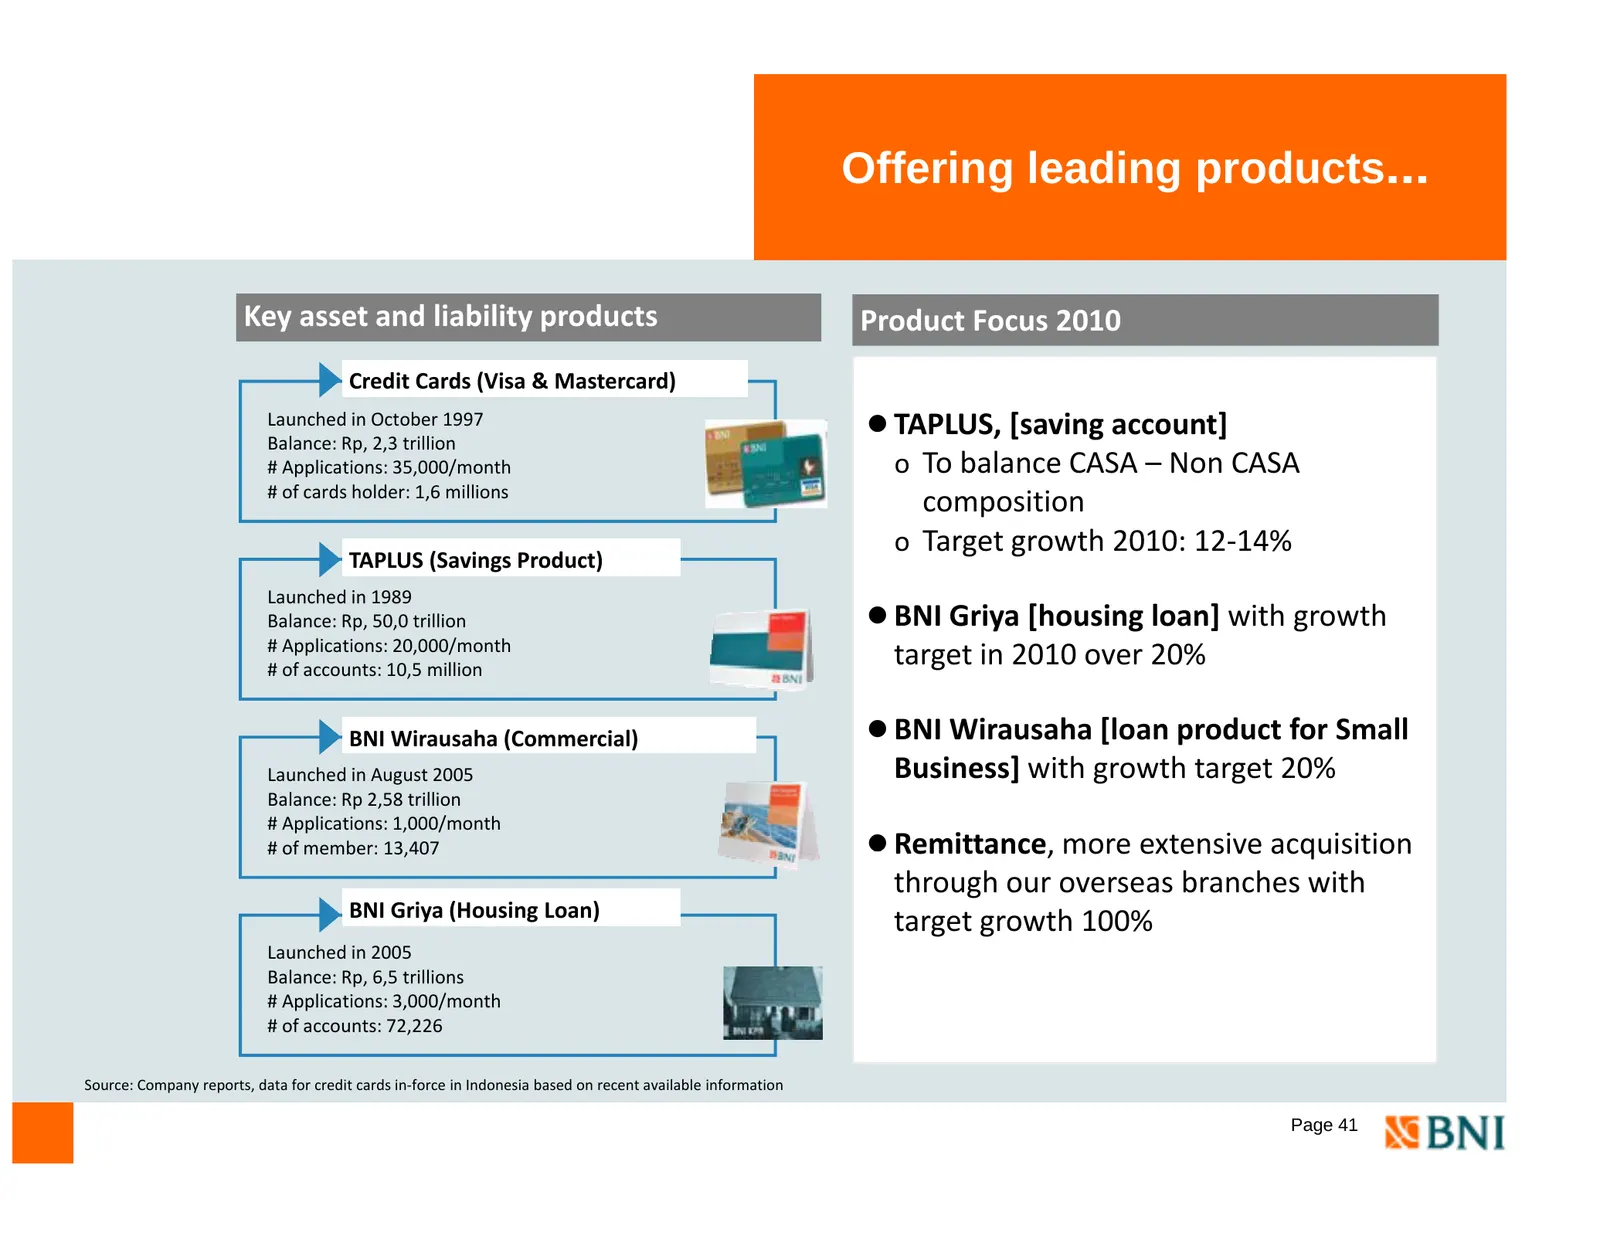
Offering leading products… Key asset and liability products Product Focus 2010 Credit Cards (Visa & Mastercard) Launched in October 1997 z TAPLUS, [saving account] Balance: Rp, 2,3 trillion # Applications: 35,000/month o To balance CASA – Non CASA # of cards holder: 1,6 millions composition o Target
Slide 43: BNI ratings
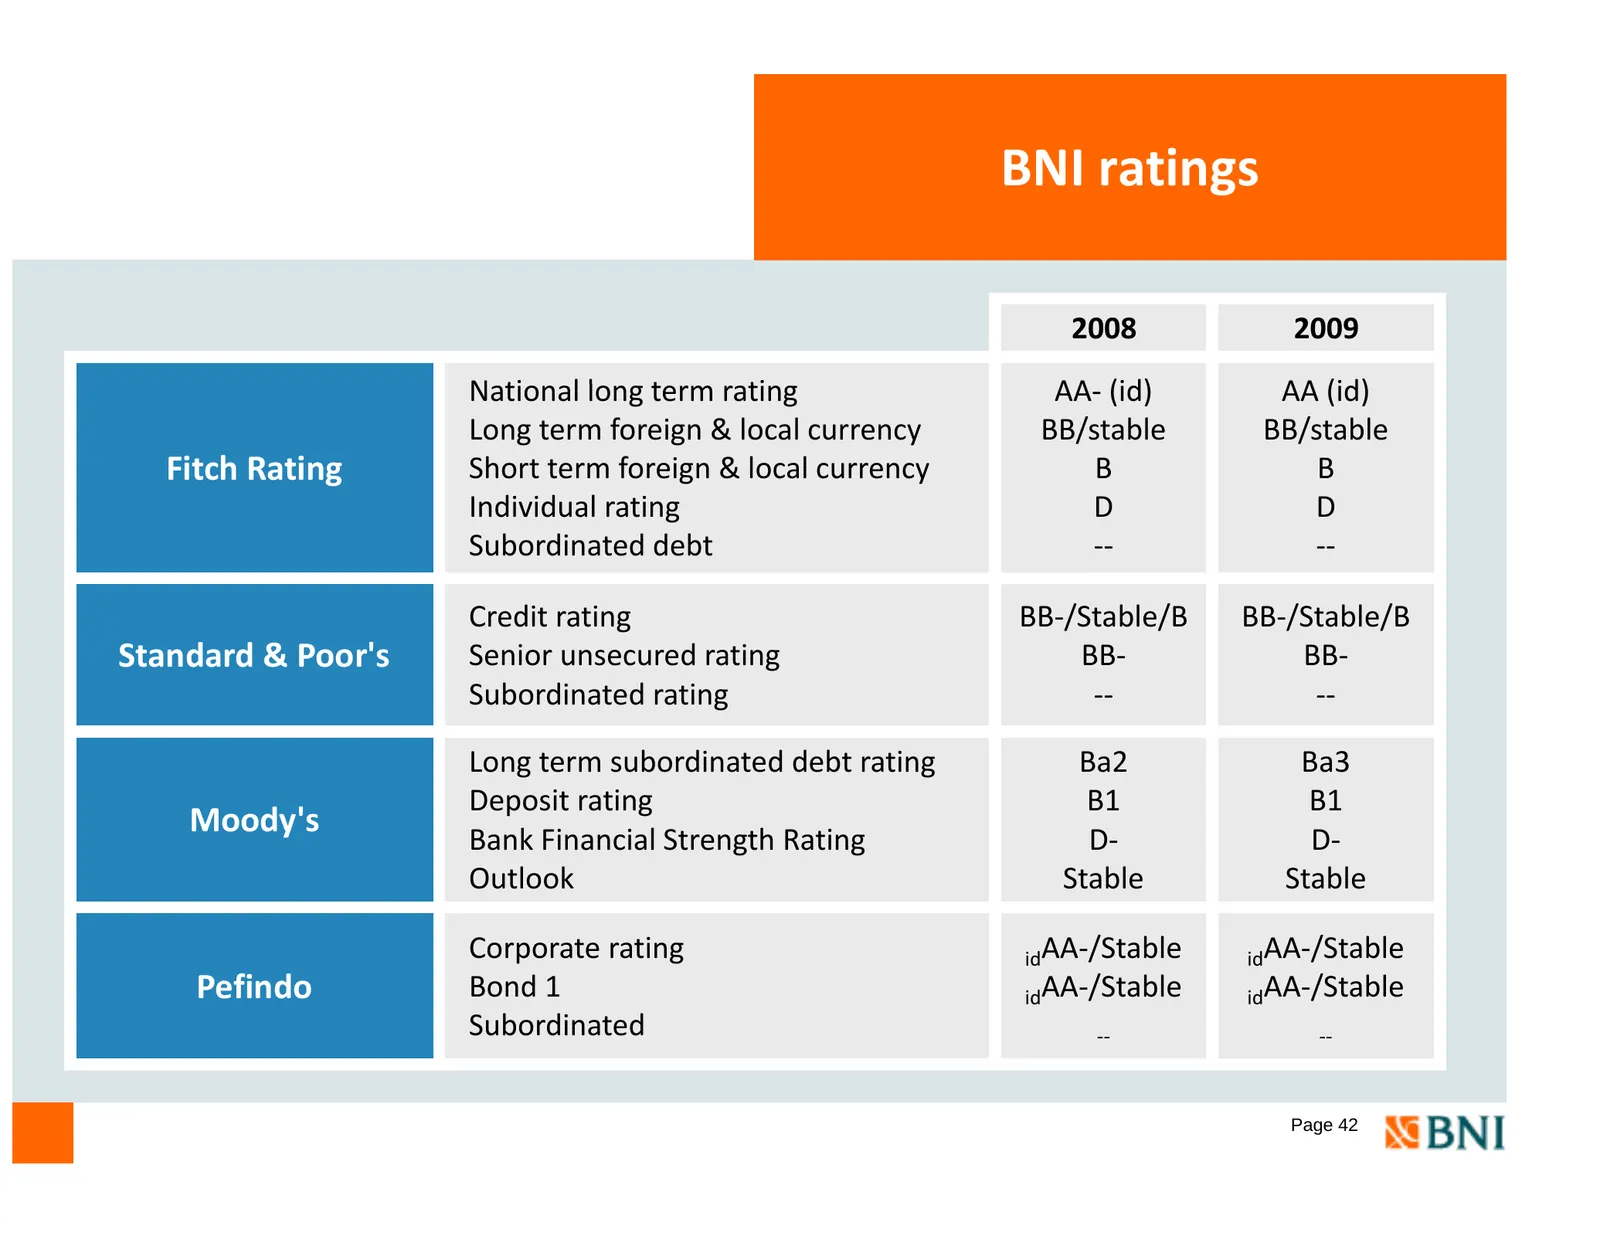
BNI ratings 2008 2009 National N ti l llong tterm rating ti AA‐ (id) AA AA (id) Long term foreign & local currency BB/stable BB/stable Fitch Rating Short term foreign & local currency B B Individual rating D D S b di t d d Subordinated debt bt ‐‐ ‐‐ Credit rating BB‐/Stable/B BB‐/Stable/B Standard &
Slide 44: Accolades: Best Corporate Governance
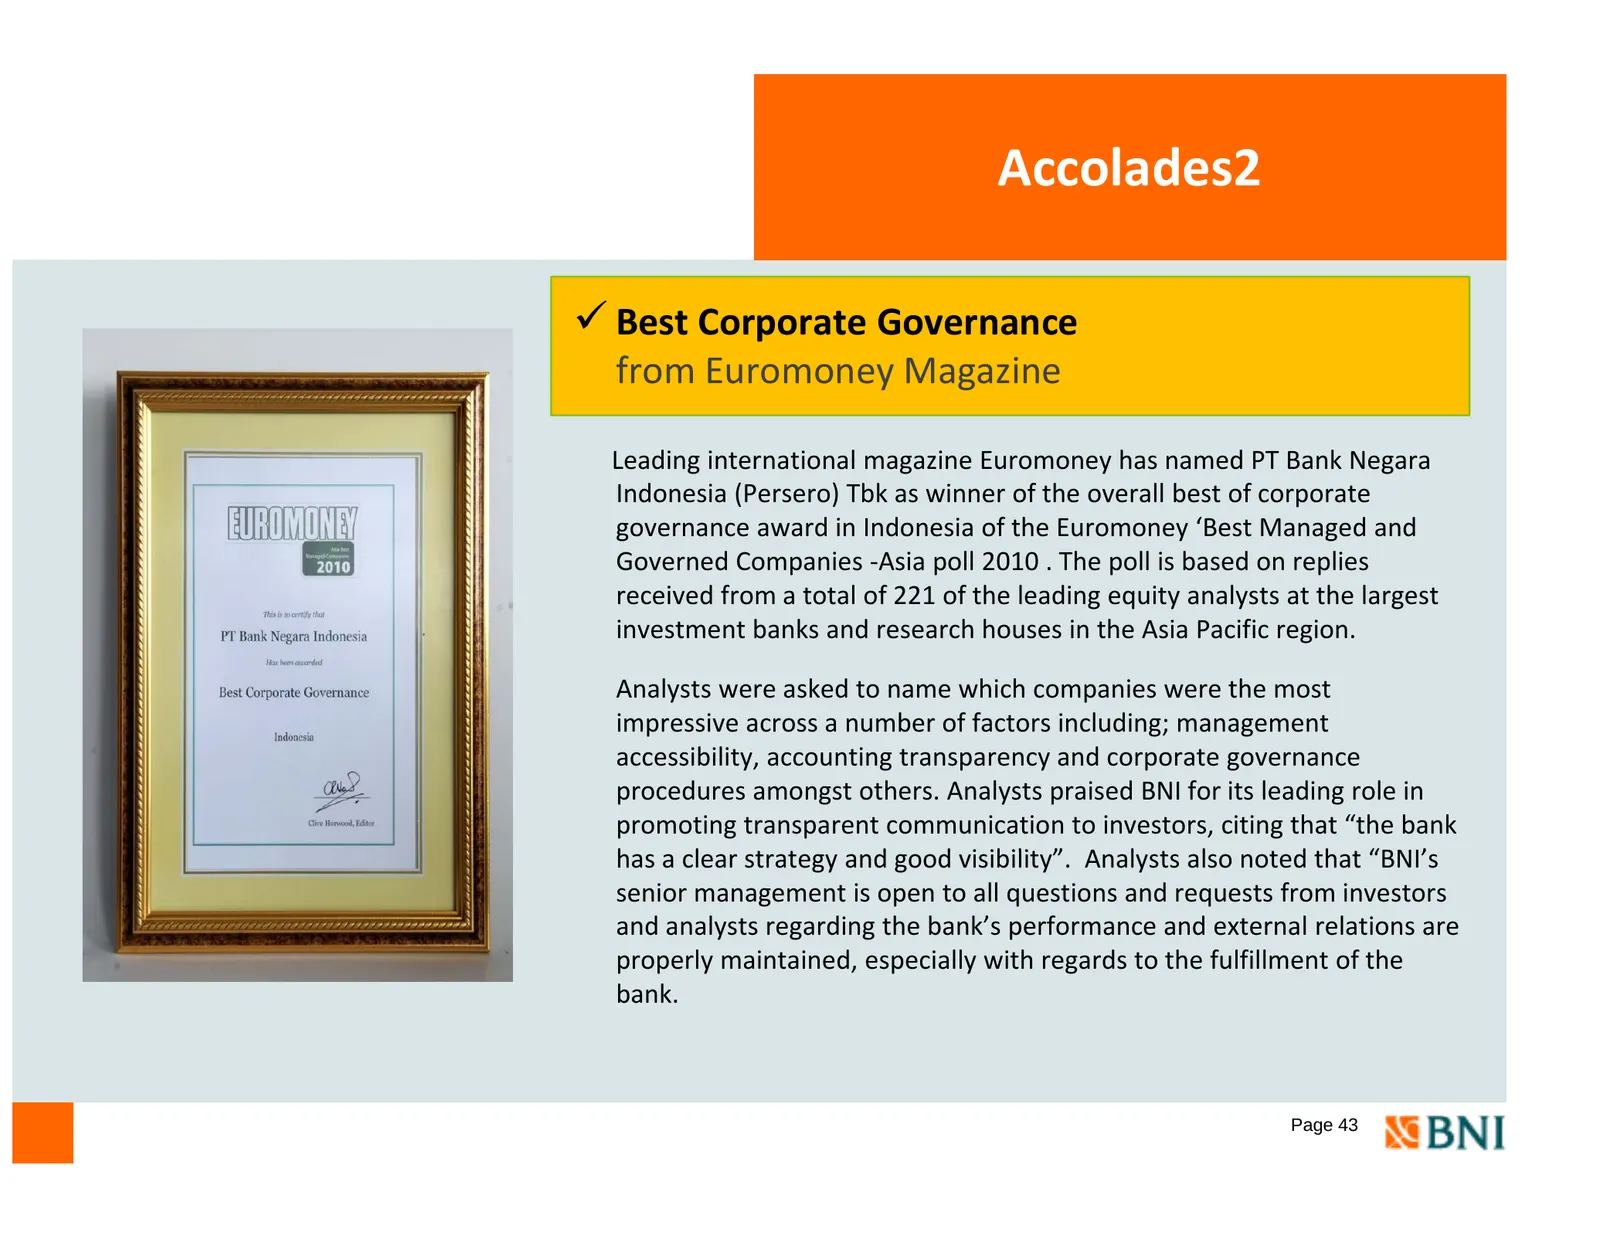
Accolades2 9 Best Corporate Governance from Euromoneyy Magazine g Leading international magazine Euromoney has named PT Bank Negara Indonesia (Persero) Tbk as winner of the overall best of corporate ggovernance award in Indonesia of the Euromoneyy ‘Best Managed g and Governed Companies ‐Asia poll 20
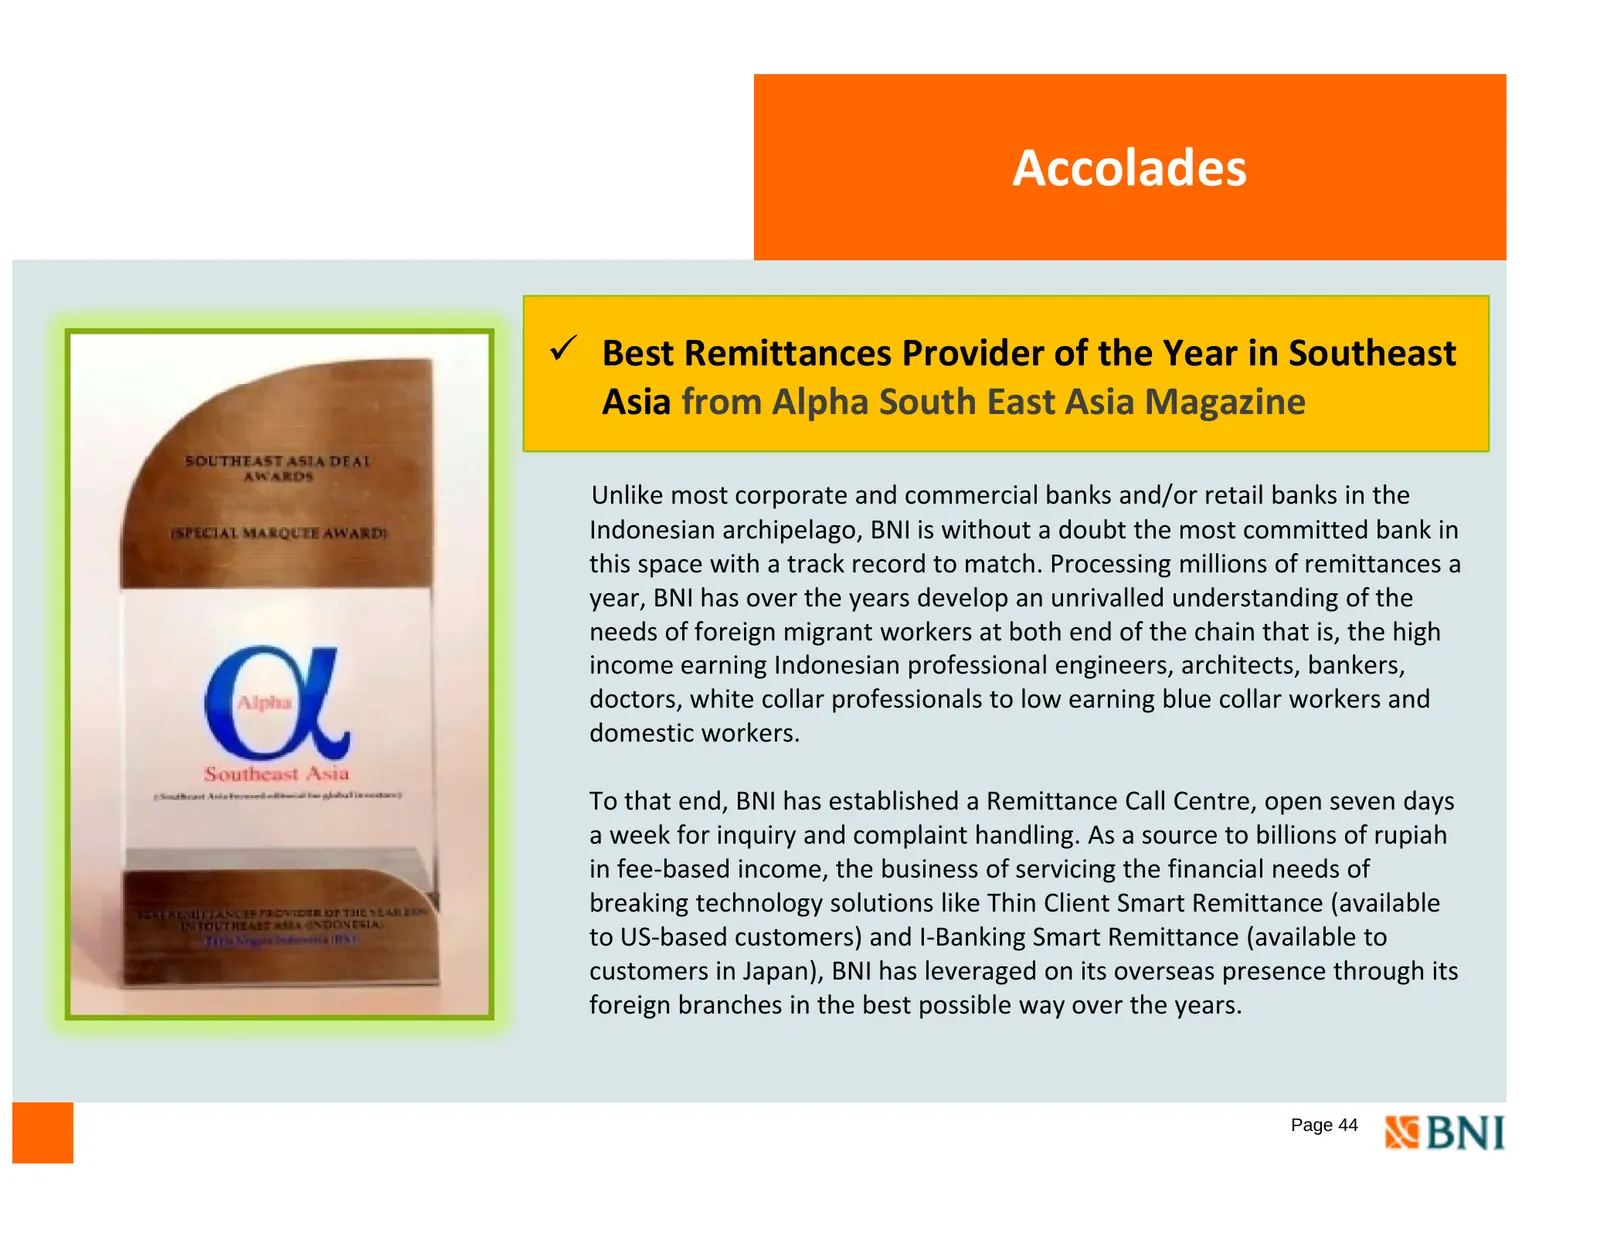
Slide 45: Accolades: Best Remittances Provider
Accolades 9 Best Remittances Provider of the Year in Southeast Asia from Alpha South East Asia Magazine Unlike most corporate and commercial banks and/or retail banks in the p g , BNI is without a doubt the most committed bank in Indonesian archipelago, this space with a track record to match. Proce

Slide 46: Accolades: Green Leadership & Community Engagement
Accolades 9 Green Leadership Award & Community Engagement Award from Asia Responsible Entrepreneurship Award BNI awarded Green Leadership Award & Community Engagement Award from Asia Responsible Entrepreneurship Award (AREA) for its achievement in doing sustainability business. Green Leadership Awar
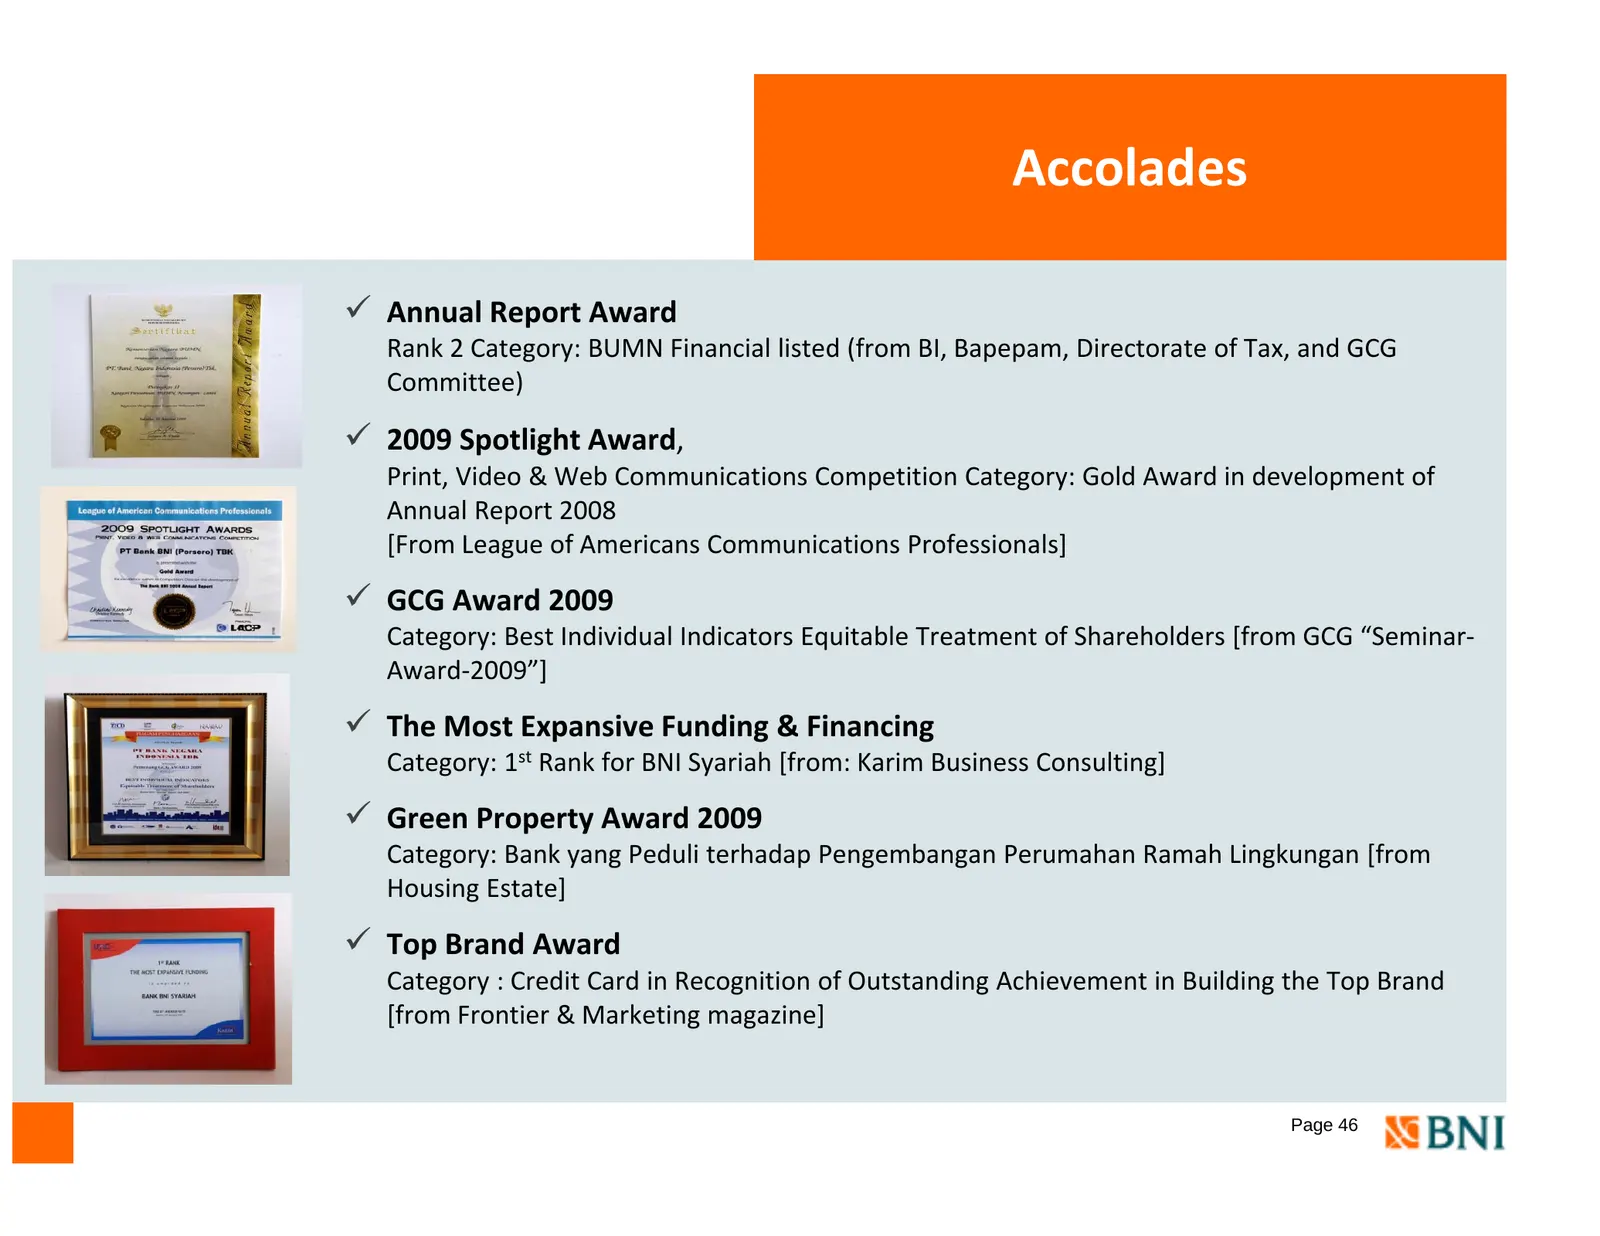
Slide 47: Accolades: Annual Report Award
Accolades 9 Annual Report Award Rank 2 Category: BUMN Financial listed (from BI, Bapepam, Directorate of Tax, and GCG Committee) 9 2009 Spotlight Award, Print, Video & Web Communications Competition Category: Gold Award in development of Annual Report 2008 [F [From League L off Americans A i Communi
Slide 48: Thank you
Thank you PT Bank Negara Indonesia (Persero) Tbk Corporate Communication Division, Investor Relations Group BNI Building, 24th Floor Jl Jend Sudirman kav, 1 Jakarta 10220 T 62‐21‐5728868 T: 62 21 5728868 F: 62‐21‐5728053 E: investor.relations@bni.co.id Page 47
Source: Internet Archive copy of bni.co.id
More decks from PT Bank Negara Indonesia (Persero) Tbk Class B
 Q1 2025 Earnings Presentation68 slides · Apr 28, 2025
 FY2024 Earnings Presentation71 slides · Jan 22, 2025
 Q1 2024 Earnings Presentation72 slides · Apr 29, 2024
 Q3 2023 Earnings Presentation74 slides · Oct 31, 2023
 Q1 2023 Earnings Presentation69 slides · May 18, 2023
 FY2022 Earnings Presentation69 slides · Jan 24, 2023