CleanSpark, Inc. · NASDAQ:CLSK
CleanSpark — Q1 2022 Earnings Presentation
28 slides from CleanSpark's earnings presentation, March 2022
Slide 1: Investor Presentation March 2022
Investor Presentation March 2022
Slide 2: Disclaimer
Disclaimer CleanSpark cautions you that statements in this presentation that are not a description of historical facts are forward-looking statements. These statements are based on CleanSpark’s current beliefs and expectations. The inclusion of forward-looking statements should not be regarded as a
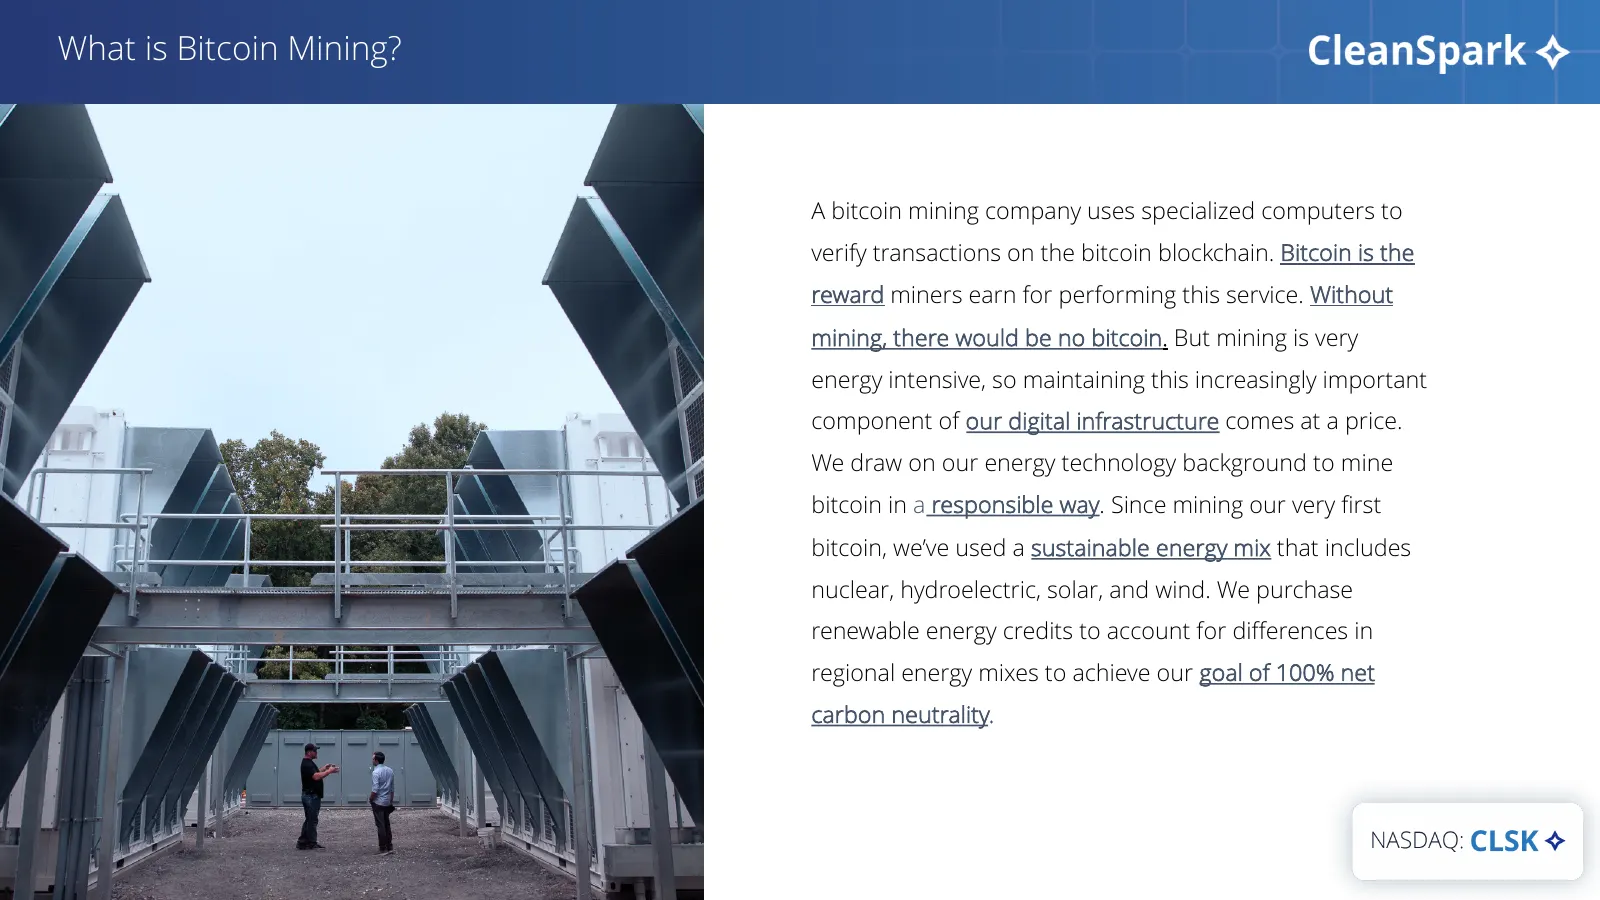
Slide 3: What is Bitcoin Mining?
What is Bitcoin Mining? A bitcoin mining company uses specialized computers to verify transactions on the bitcoin blockchain. Bitcoin is the reward miners earn for performing this service. Without mining, there would be no bitcoin. But mining is very energy intensive, so maintaining this increasingl
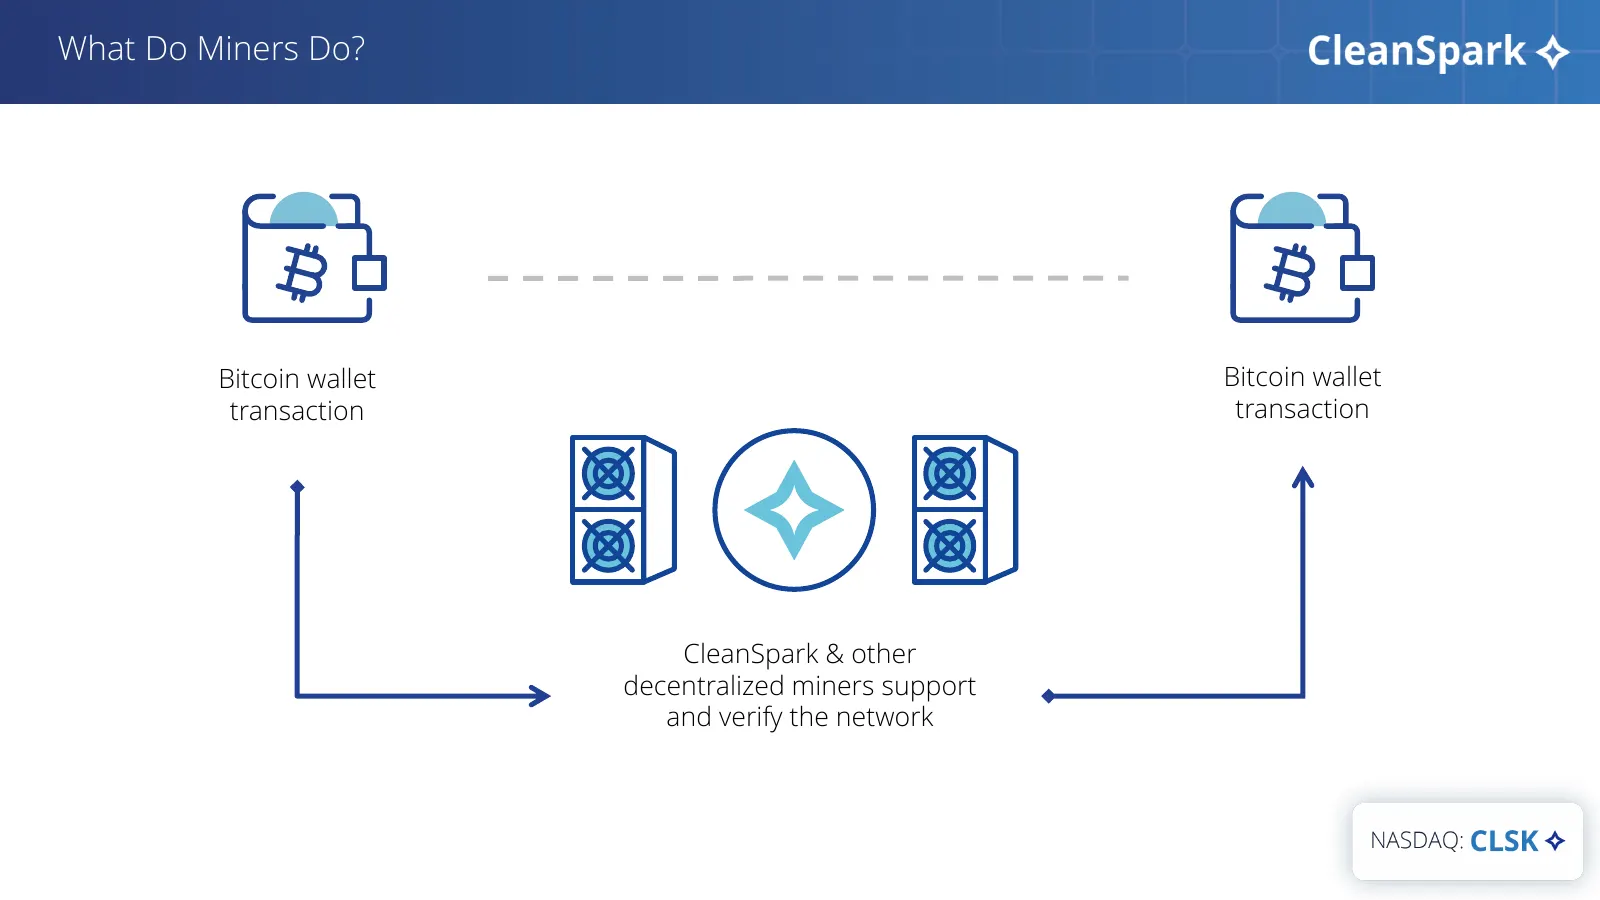
Slide 4: What Do Miners Do?
What Do Miners Do? Bitcoin wallet Bitcoin wallet transaction transaction CleanSpark & other decentralized miners support and verify the network
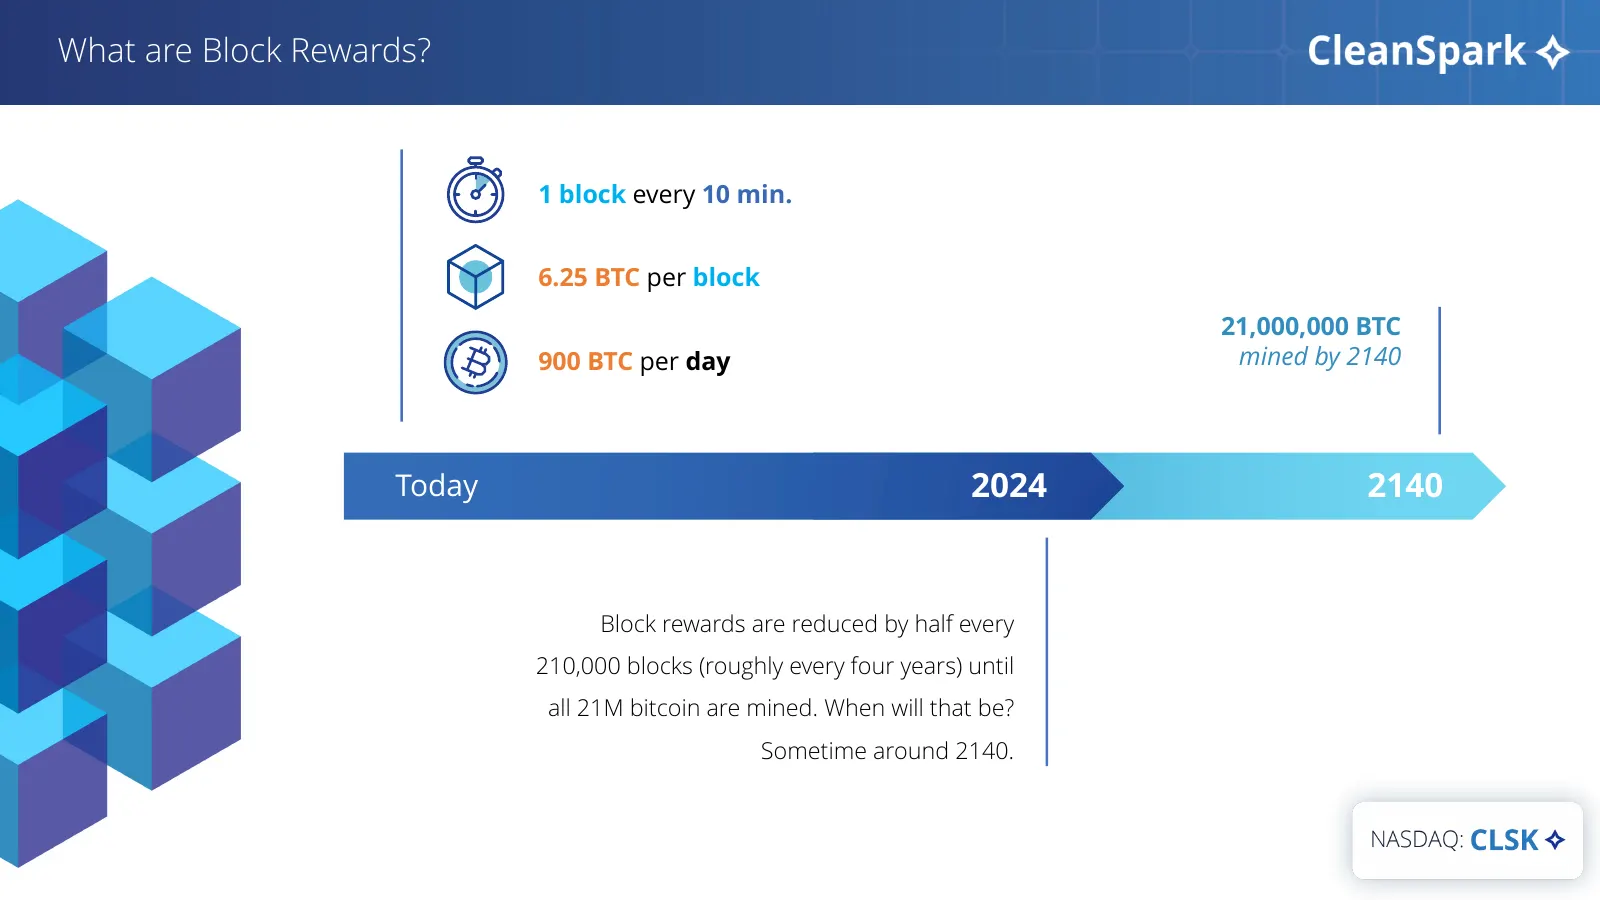
Slide 5: What are Block Rewards?
What are Block Rewards? 1 block every 10 min. 6.25 BTC per block 21,000,000 BTC 900 BTC per day mined by 2140 Today 2024 2140 Block rewards are reduced by half every 210,000 blocks (roughly every four years) until all 21M bitcoin are mined. When will that be? Sometime around 2140.
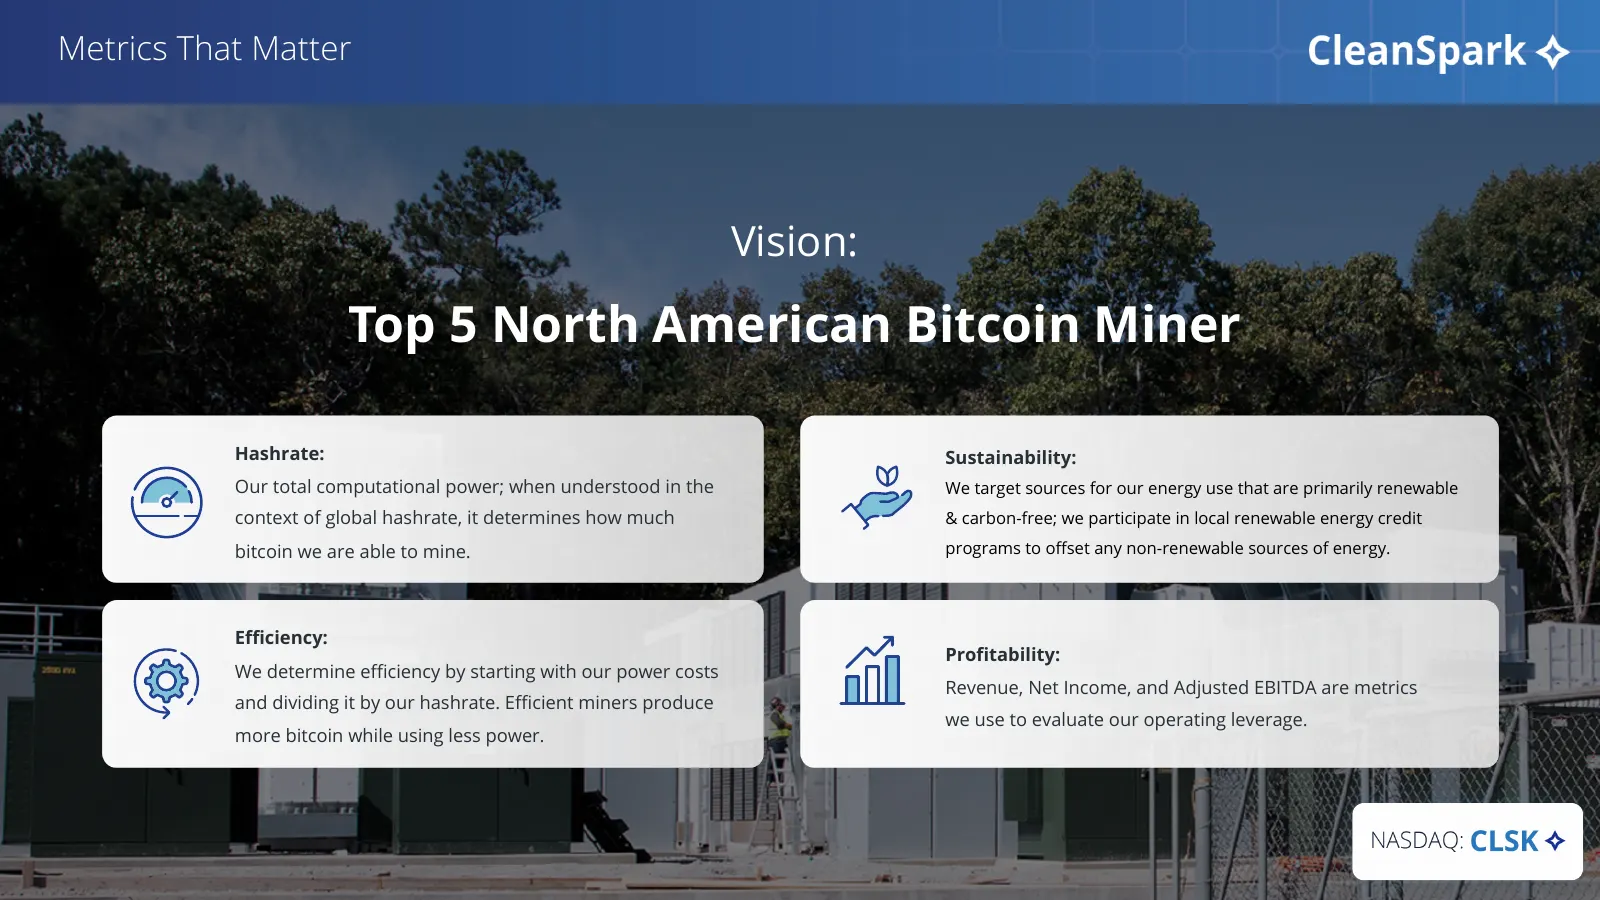
Slide 6: Top 5 North American Bitcoin Miner: Metrics That Matter
Metrics That Matter Vision: Top 5 North American Bitcoin Miner Hashrate: Sustainability: Our total computational power; when understood in the We target sources for our energy use that are primarily renewable context of global hashrate, it determines how much & carbon-free; we participate in local r
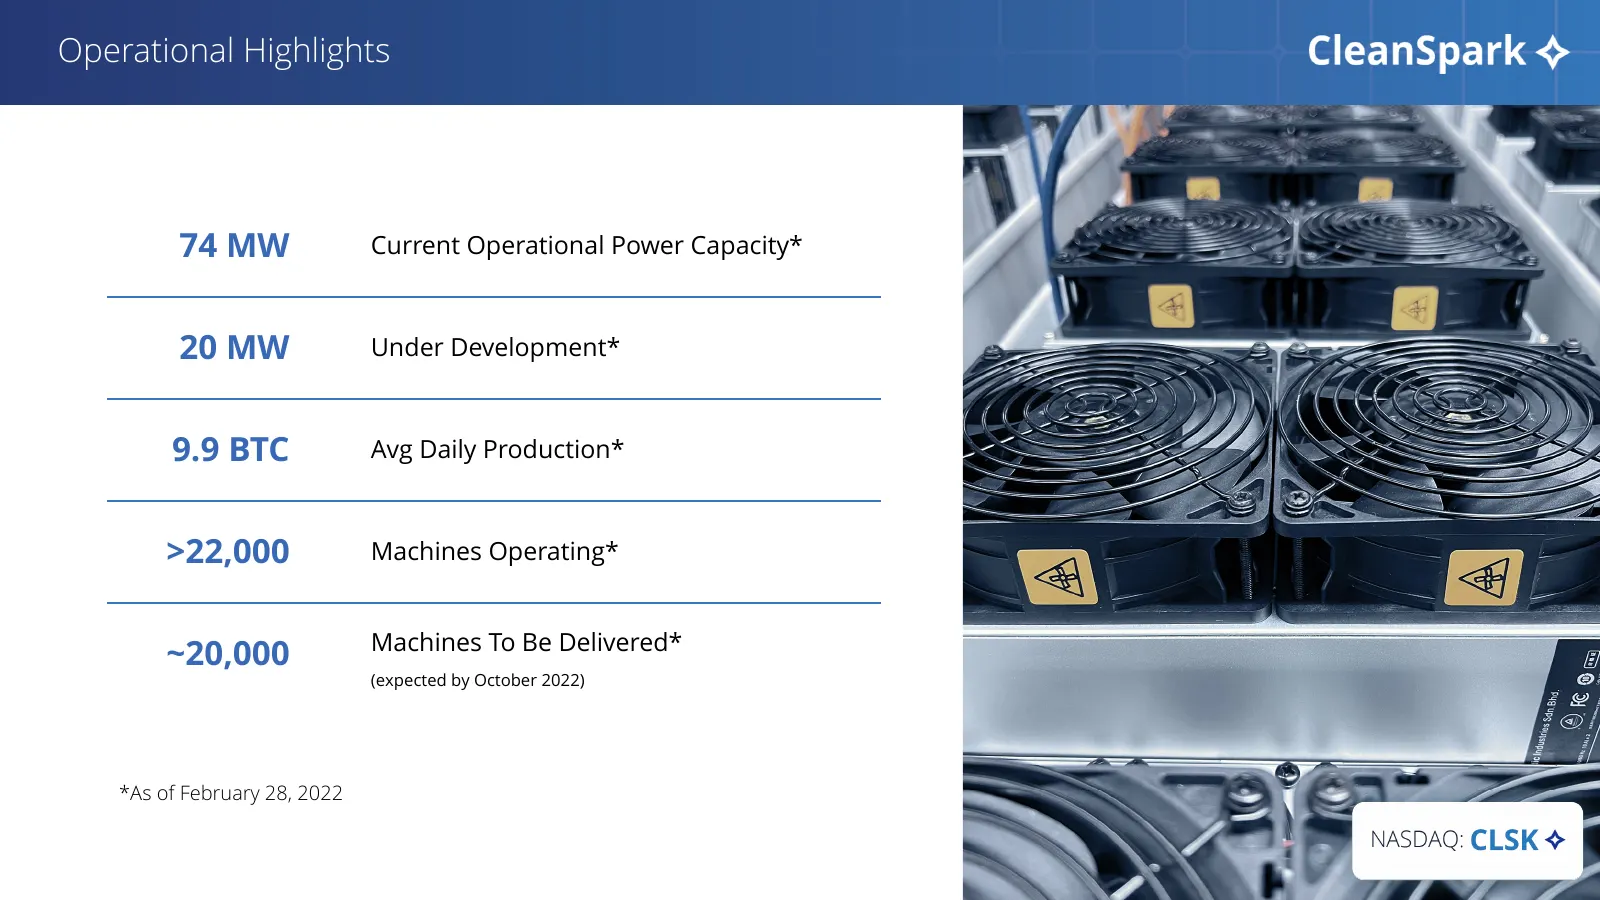
Slide 7: Operational Highlights
Revenue Operational Highlights 74 MW Current Operational Power Capacity* 20 MW Under Development* 9.9 BTC Avg Daily Production* >22,000 Machines Operating* Machines To Be Delivered* ~20,000 (expected by October 2022) *As of February 28, 2022
Slide 8: What Makes CleanSpark Different?
What Makes CleanSpark Different? Leave the world better than we found it. Build the infrastructure of the future. Value growth for the greater good.
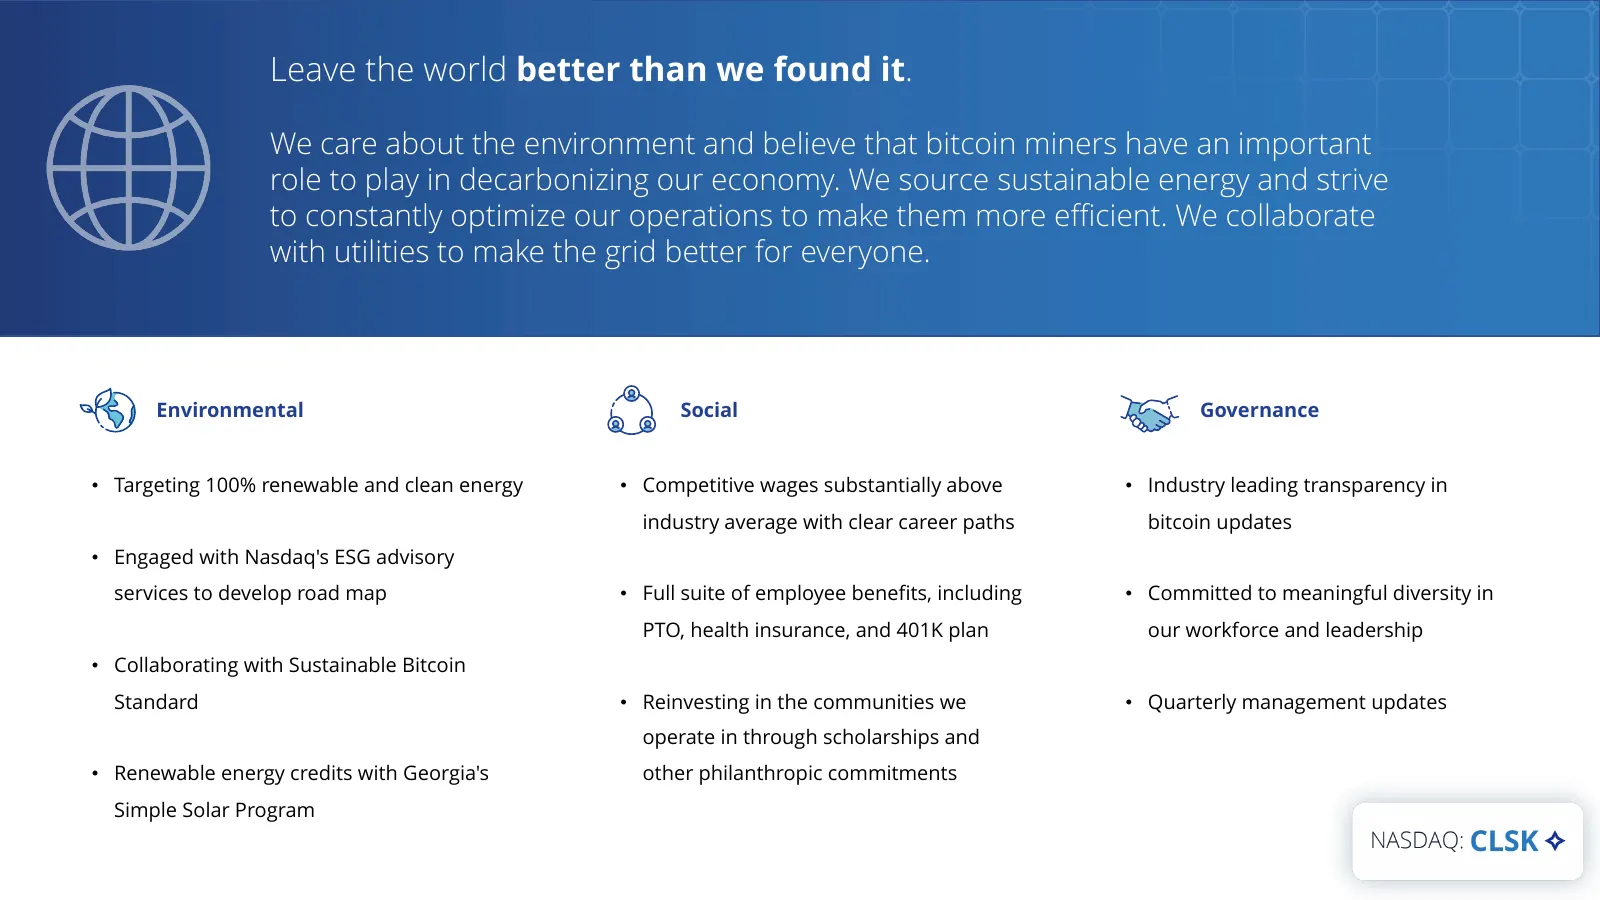
Slide 9: Leave the world better than we found it
We care about the environment and believe that bitcoin miners Leave the have an important roleworld better to play than we found in decarbonizing it. our economy. We source sustainable energy and constantly optimize our operations to make them We We more efficient. carecollaborate about the environm
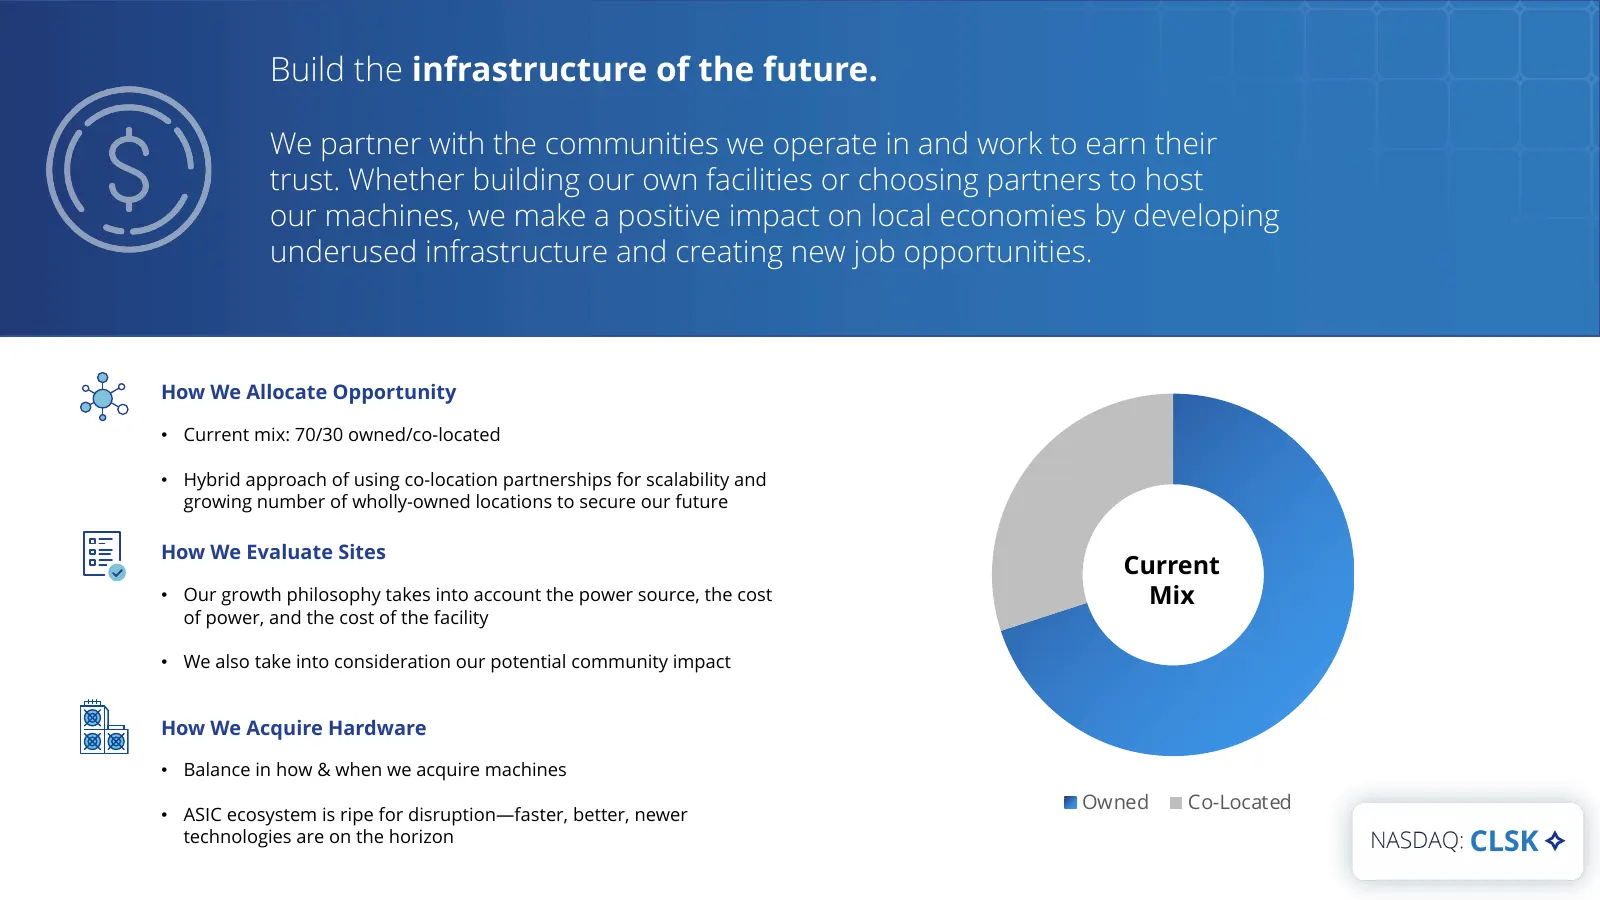
Slide 10: Build the infrastructure of the future
We care about the environment and believe that bitcoin miners Build the have an important infrastructure role of the future. to play in decarbonizing our economy. We source sustainable energy and constantly optimize our operations to make them We We more efficient. partner with the communities colla
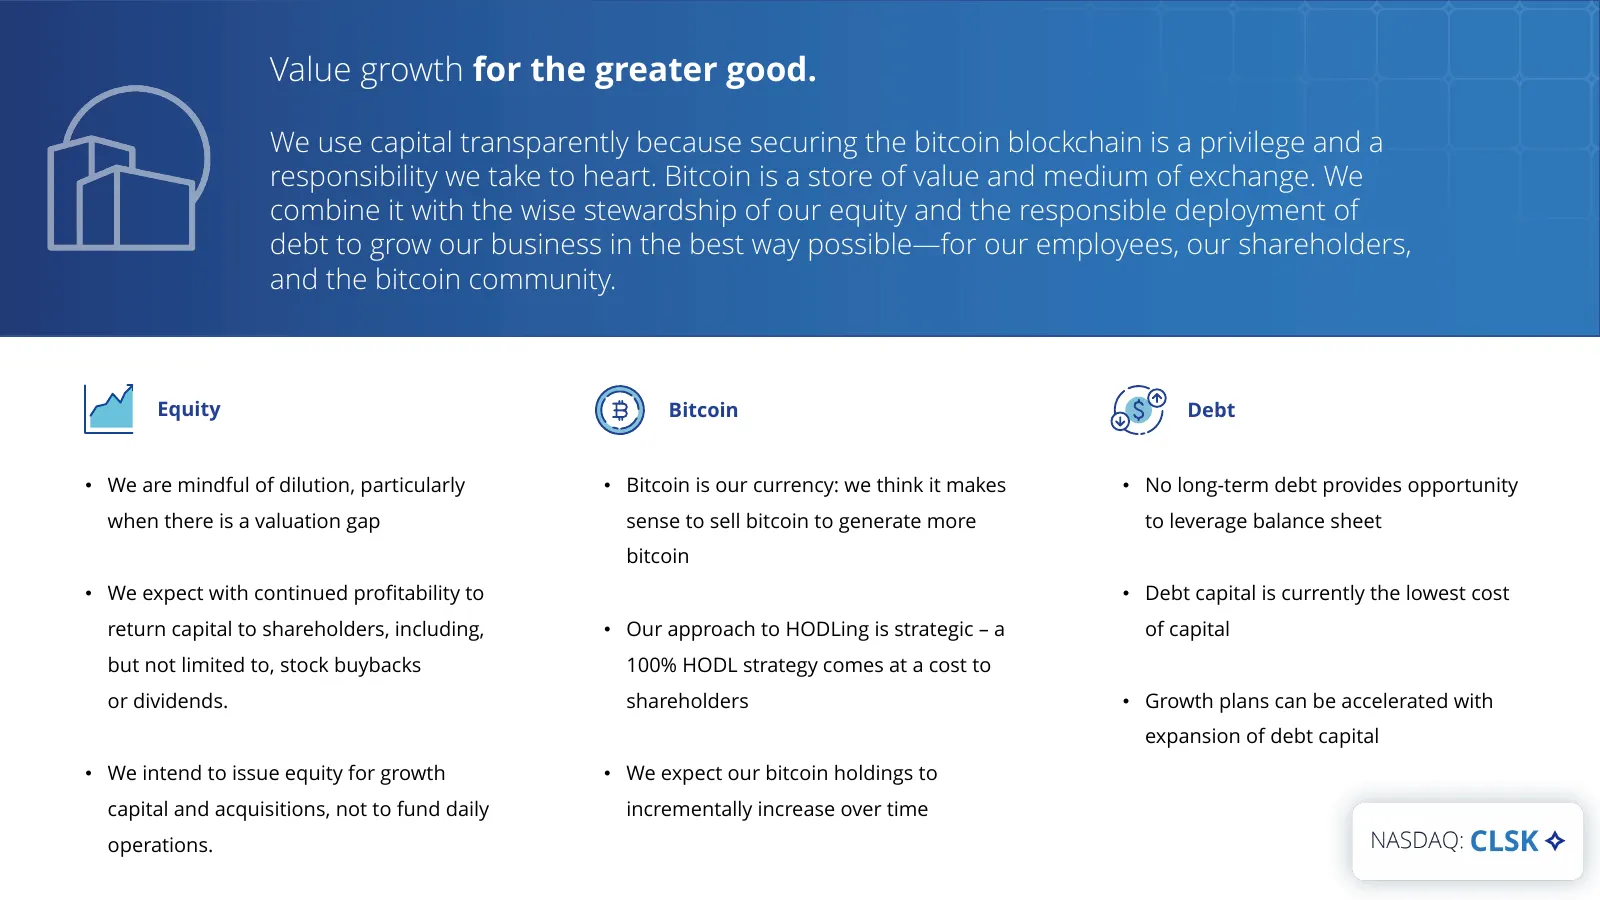
Slide 11: Value growth for the greater good
We care about the environment and believe that bitcoin miners Value growth have an important role toforplaythe greater good.our economy. We in decarbonizing source sustainable energy and constantly optimize our operations to make them We We more efficient. use capital transparently collaborate becau
Slide 12: Current and Future Performance
Current and Future Performance
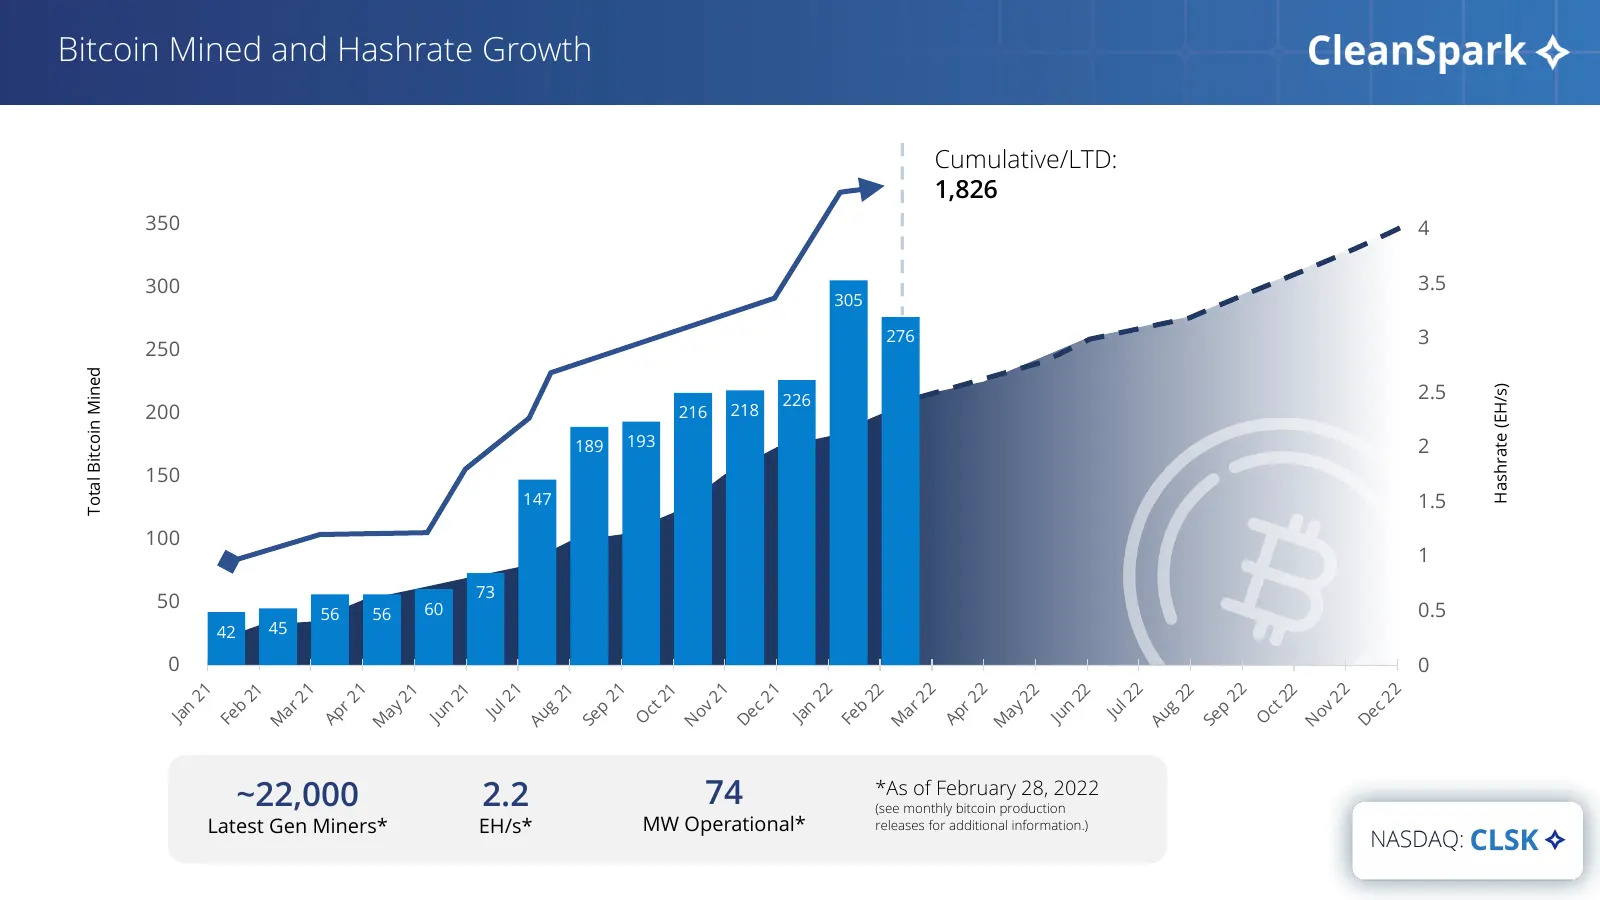
Slide 13: Bitcoin Mined and Hashrate Growth
Revenue Bitcoin Mined and Hashrate Growth Cumulative/LTD: 1,826 350 4 300 3.5 305 276 3 250 Total Bitcoin Mined 2.5 Hashrate (EH/s) 226 200 216 218 189 193 2 150 147 1.5 100 1 73 50 60 0.5 56 56 42 45 0 0 1 2 21 22 21 22 1 2 21 22 21 1 22 2 21 22 21 22 21 22 21 22 21 22 l2 l2 r2 r2 2 2 ct ct ar ar a
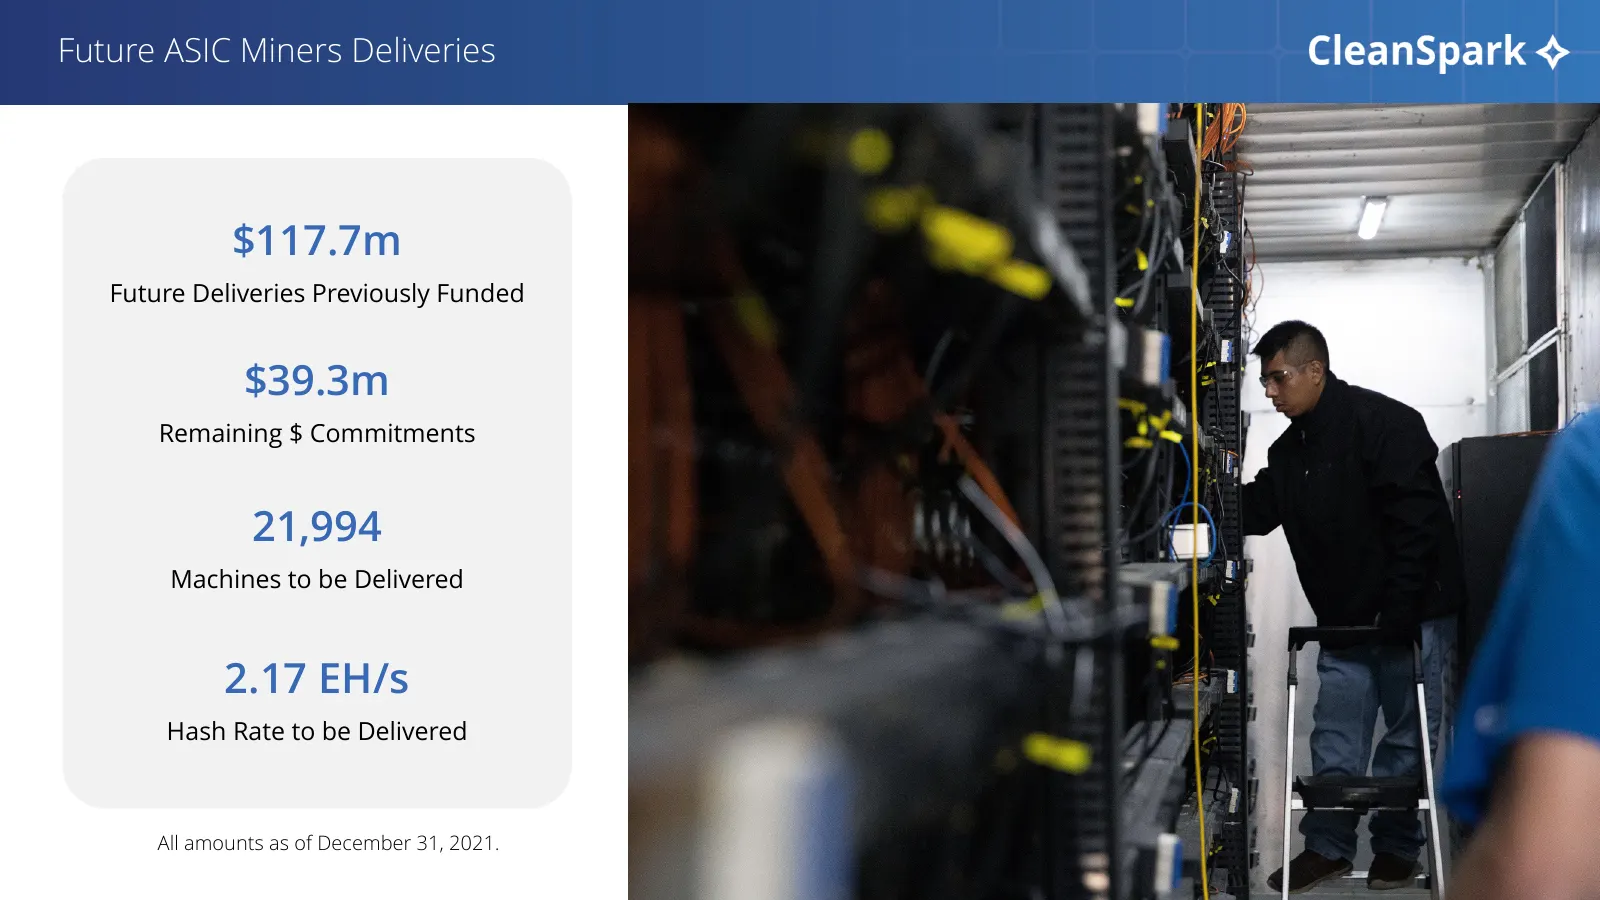
Slide 14: Future ASIC Miners Deliveries
Revenue Future ASIC Miners Deliveries $117.7m Future Deliveries Previously Funded $39.3m Remaining $ Commitments 21,994 Machines to be Delivered 2.17 EH/s Hash Rate to be Delivered All amounts as of December 31, 2021.
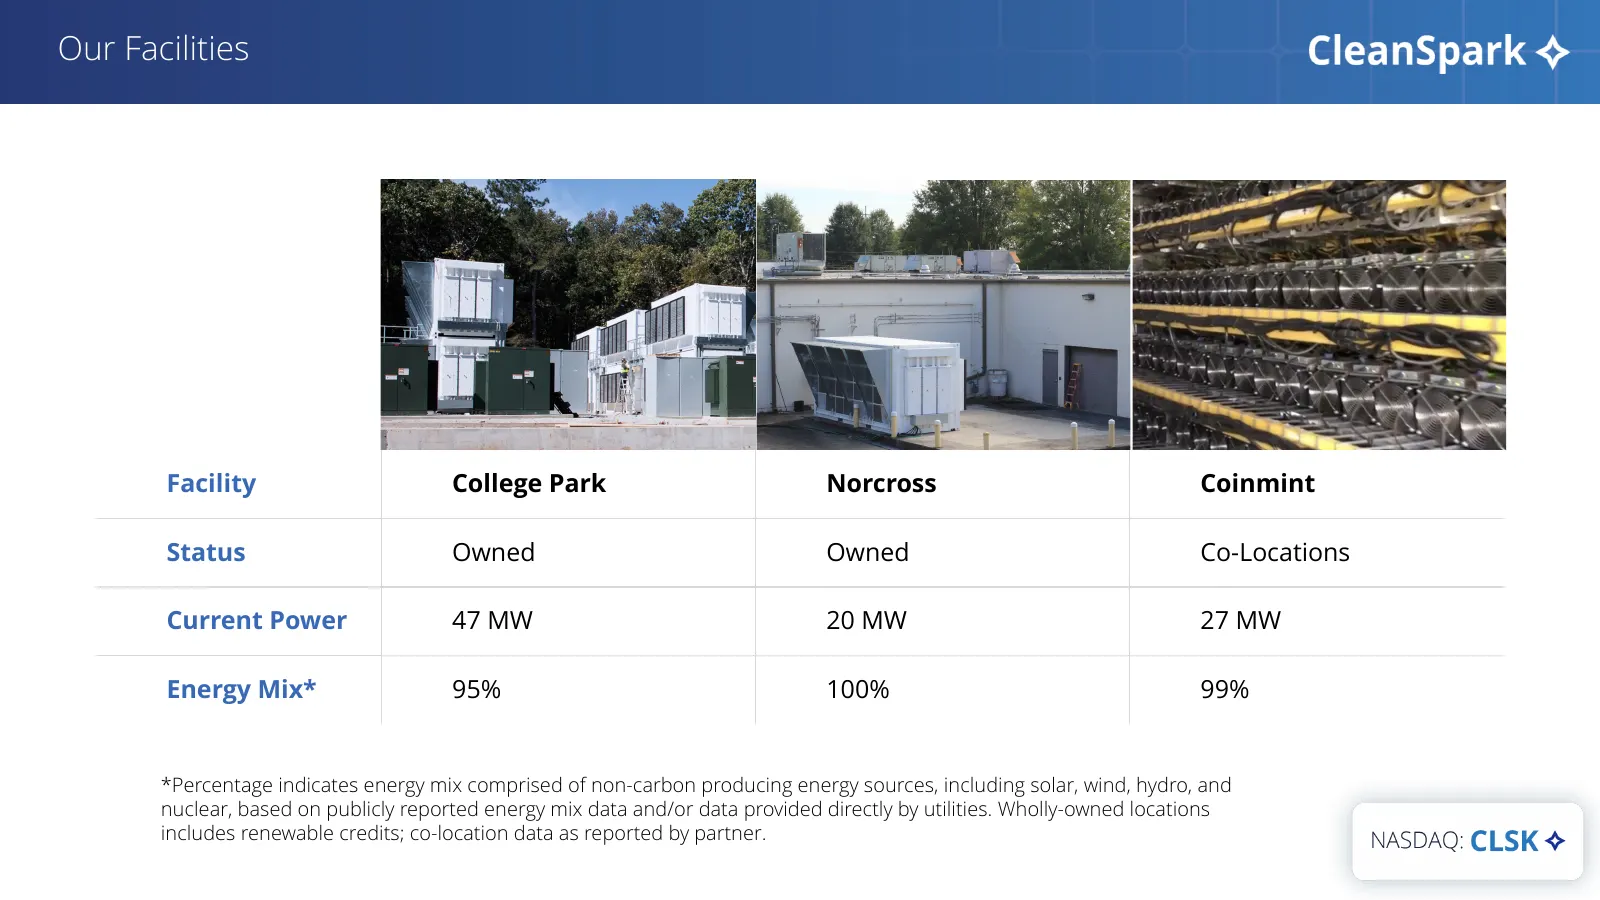
Slide 15: Our Facilities
Our Facilities Facility College Park Norcross Coinmint Status Owned Owned Co-Locations Current Power 47 MW 20 MW 27 MW Energy Mix* 95% 100% 99% *Percentage indicates energy mix comprised of non-carbon producing energy sources, including solar, wind, hydro, and nuclear, based on publicly reported ene
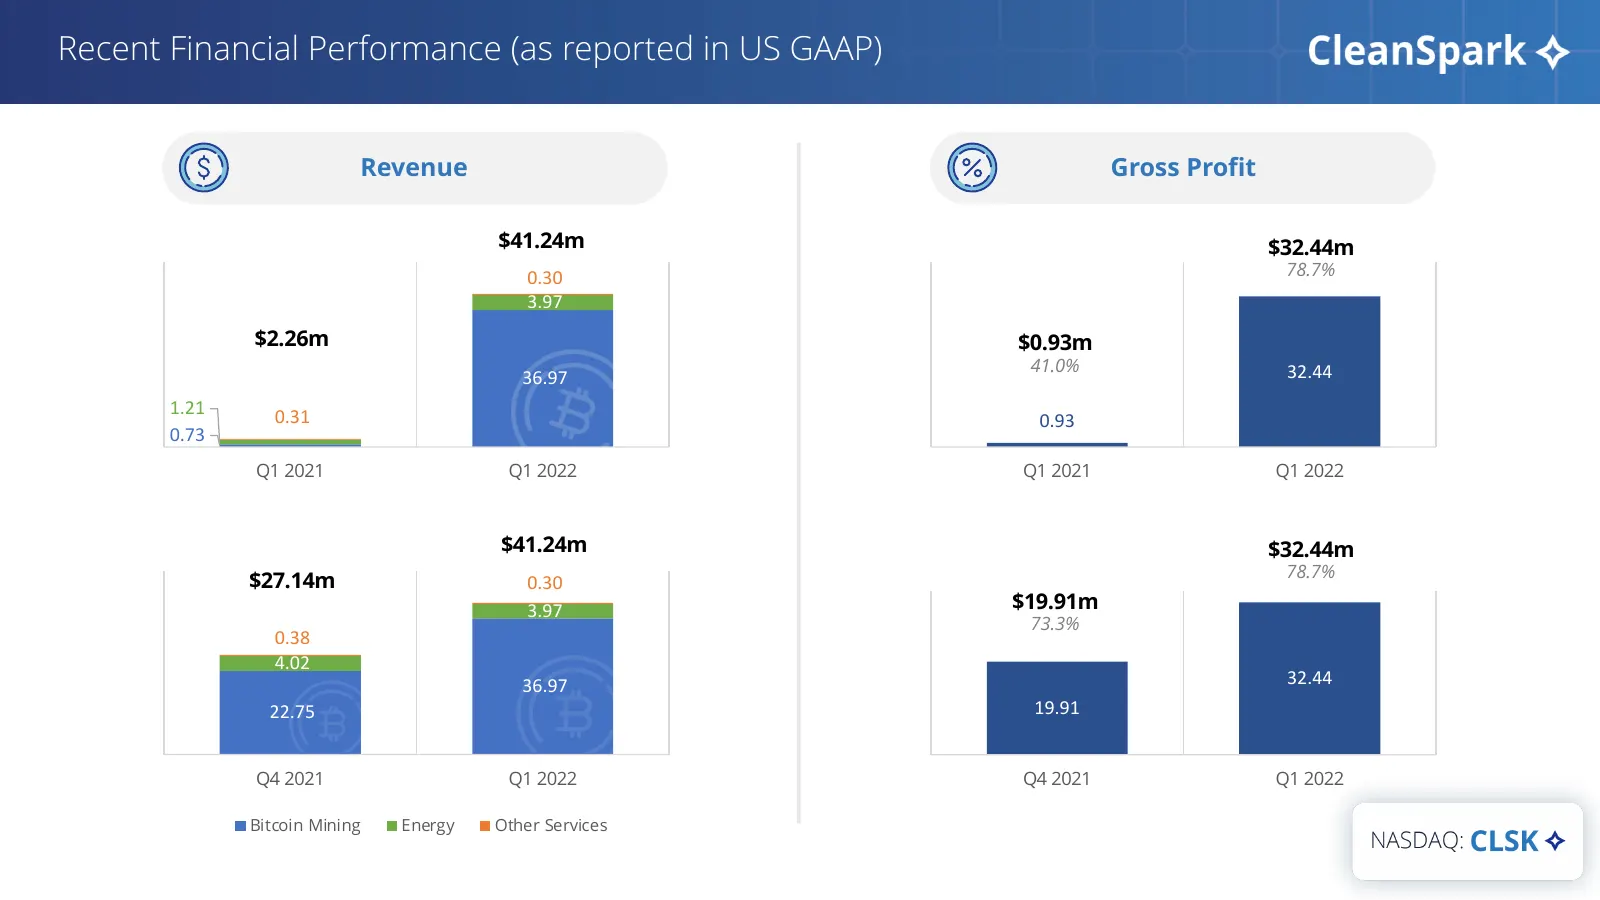
Slide 16: Recent Financial Performance (as reported in US GAAP)
Recent Financial Performance (as reported in US GAAP) Revenue Gross Profit $41.24m $32.44m 0.30 78.7% 3.97 $2.26m $0.93m 41.0% 32.44 36.97 1.21 0.31 0.93 0.73 Q1 2021 Q1 2022 Q1 2021 Q1 2022 $41.24m $32.44m 78.7% $27.14m 0.30 3.97 $19.91m 73.3% 0.38 4.02 36.97 32.44 22.75 19.91 Q4 2021 Q1 2022 Q4 20
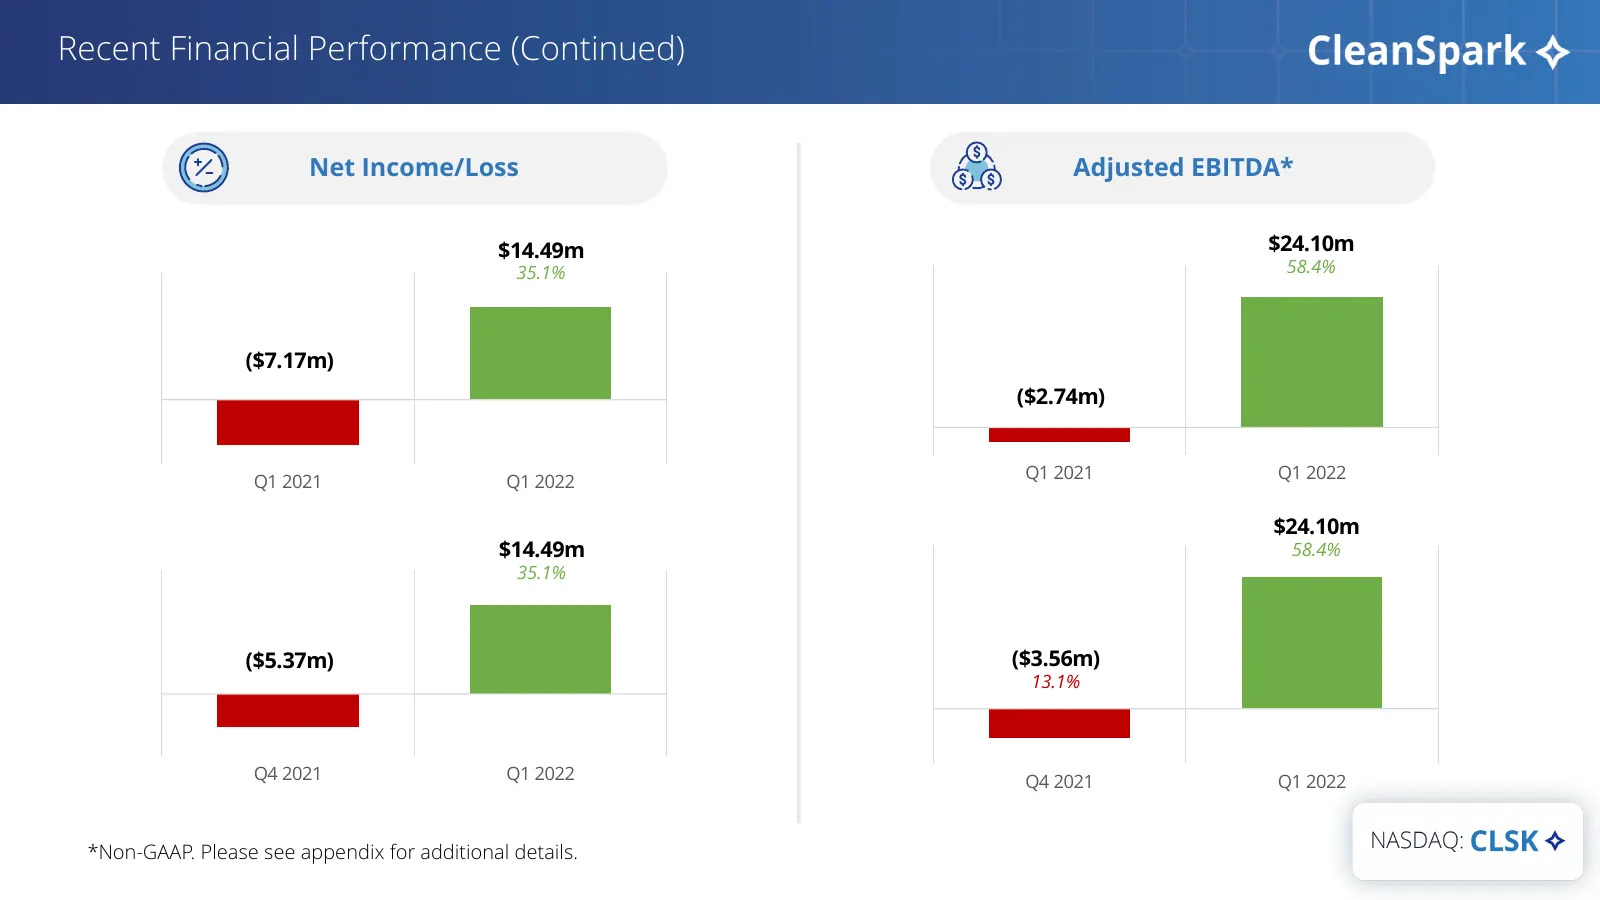
Slide 17: Recent Financial Performance (Continued)
Recent Financial Performance (Continued) Net Income/Loss Adjusted EBITDA* $14.49m $24.10m 35.1% 58.4% ($7.17m) ($2.74m) Q1 2021 Q1 2022 Q1 2021 Q1 2022 $24.10m $14.49m 58.4% 35.1% ($5.37m) ($3.56m) 13.1% Q4 2021 Q1 2022 Q4 2021 Q1 2022 NASDAQ: CLSK *Non-GAAP. Please see appendix for additional detai
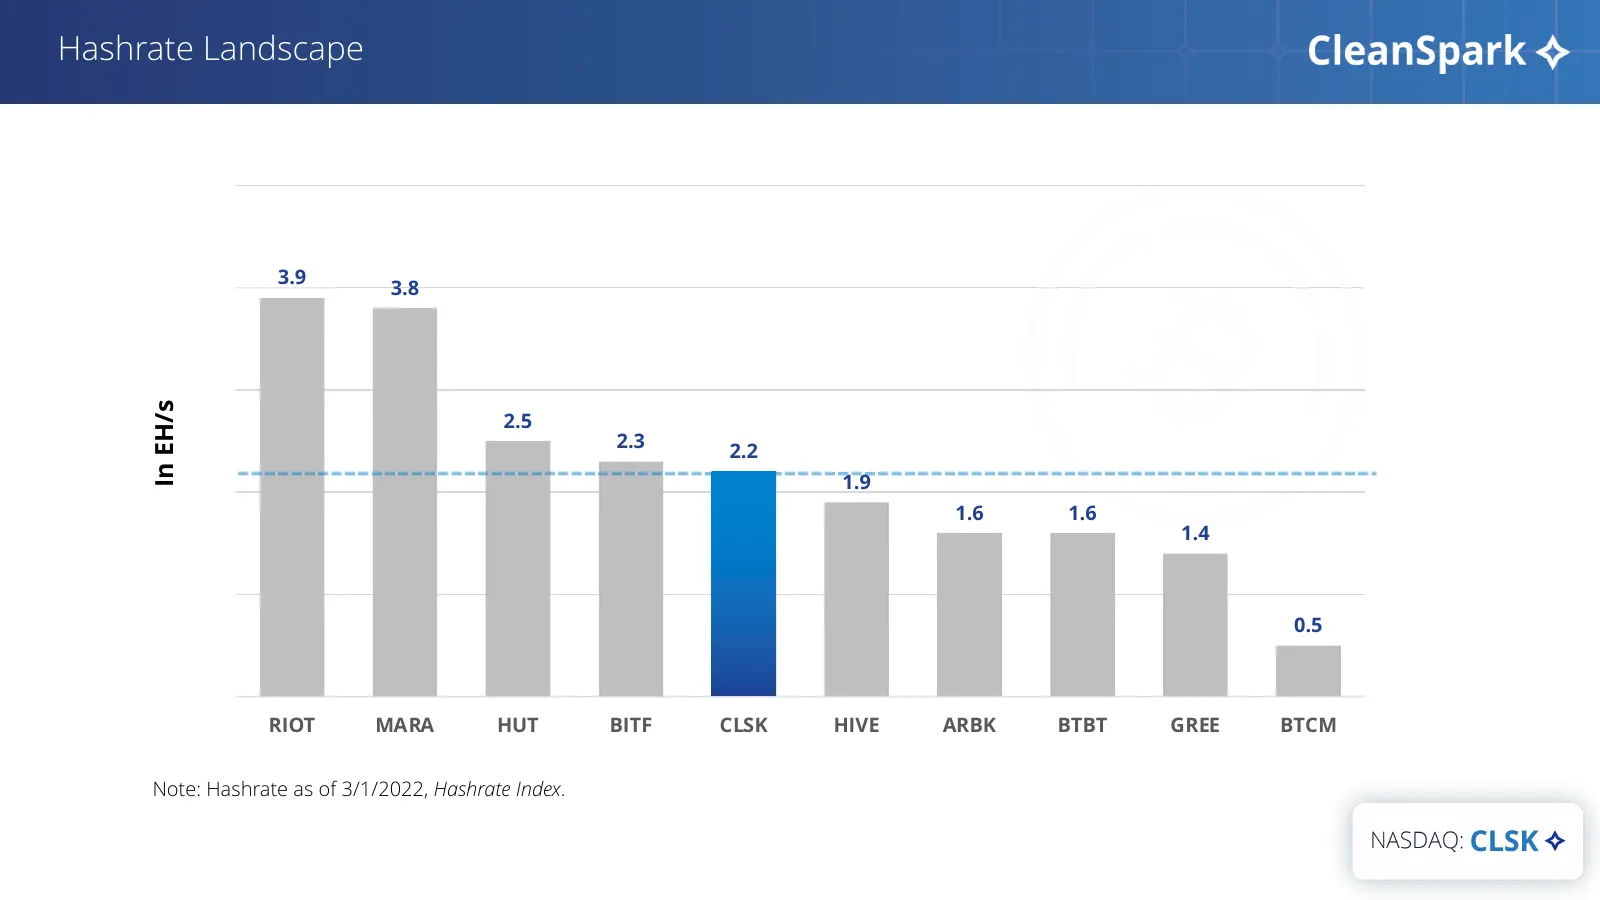
Slide 18: Hashrate Landscape
Hashrate Landscape 3.9 3.8 In EH/s 2.5 2.3 2.2 1.9 1.6 1.6 1.4 0.5 RIOT MARA HUT BITF CLSK HIVE ARBK BTBT GREE BTCM Note: Hashrate as of 3/1/2022, Hashrate Index.
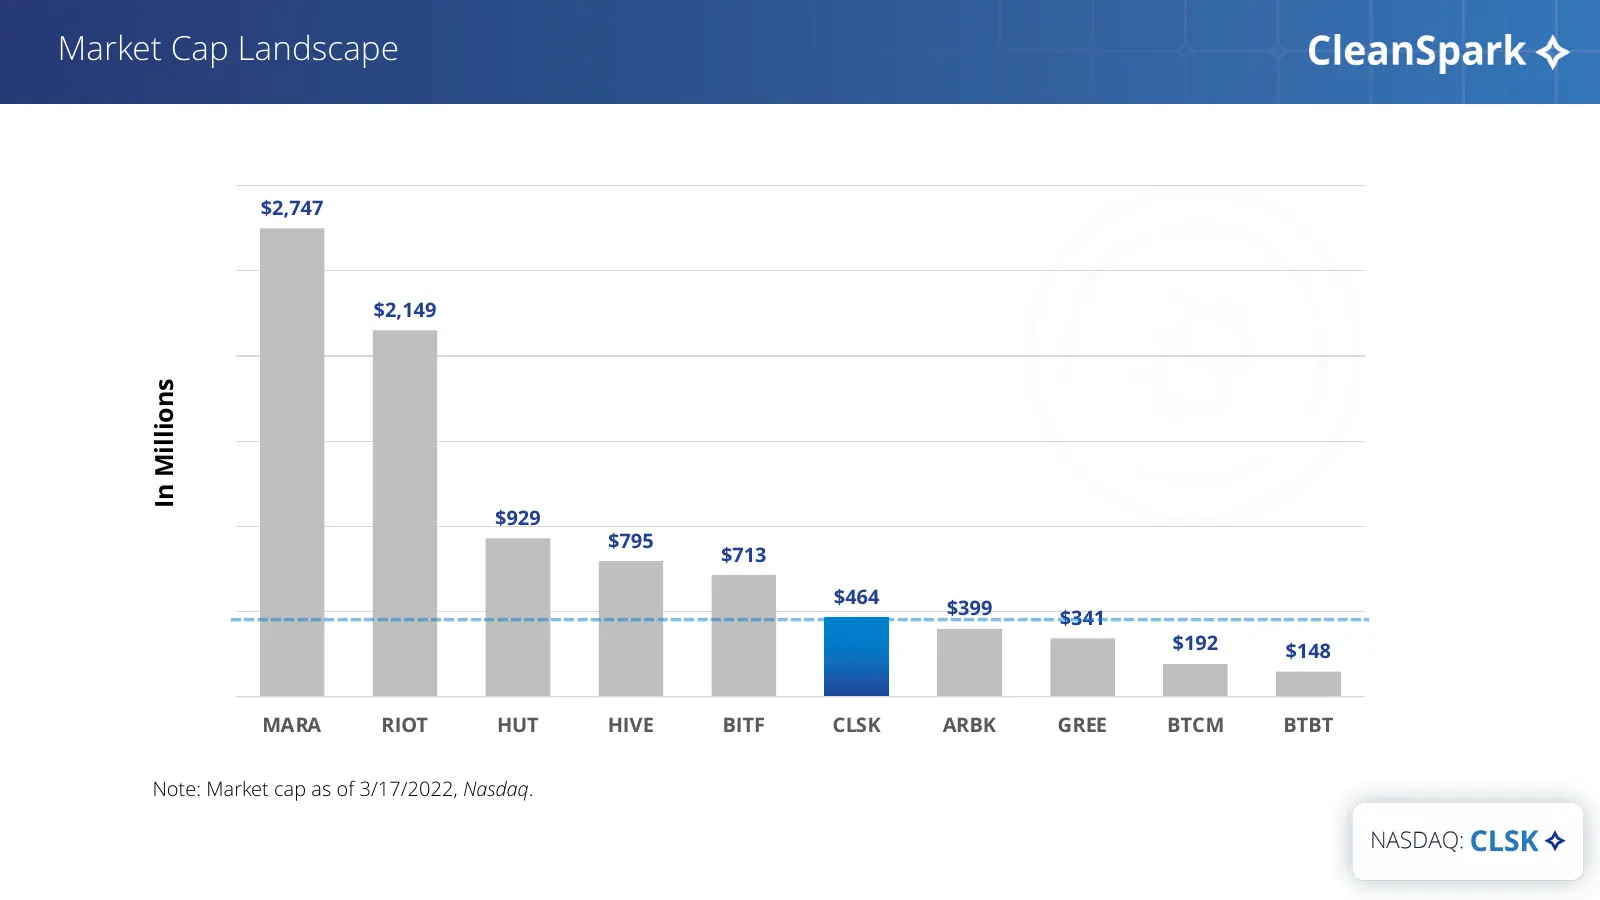
Slide 19: Market Cap Landscape
Market Cap Landscape $2,747 $2,149 In Millions $929 $795 $713 $464 $399 $341 $192 $148 MARA RIOT HUT HIVE BITF CLSK ARBK GREE BTCM BTBT Note: Market cap as of 3/17/2022, Nasdaq.
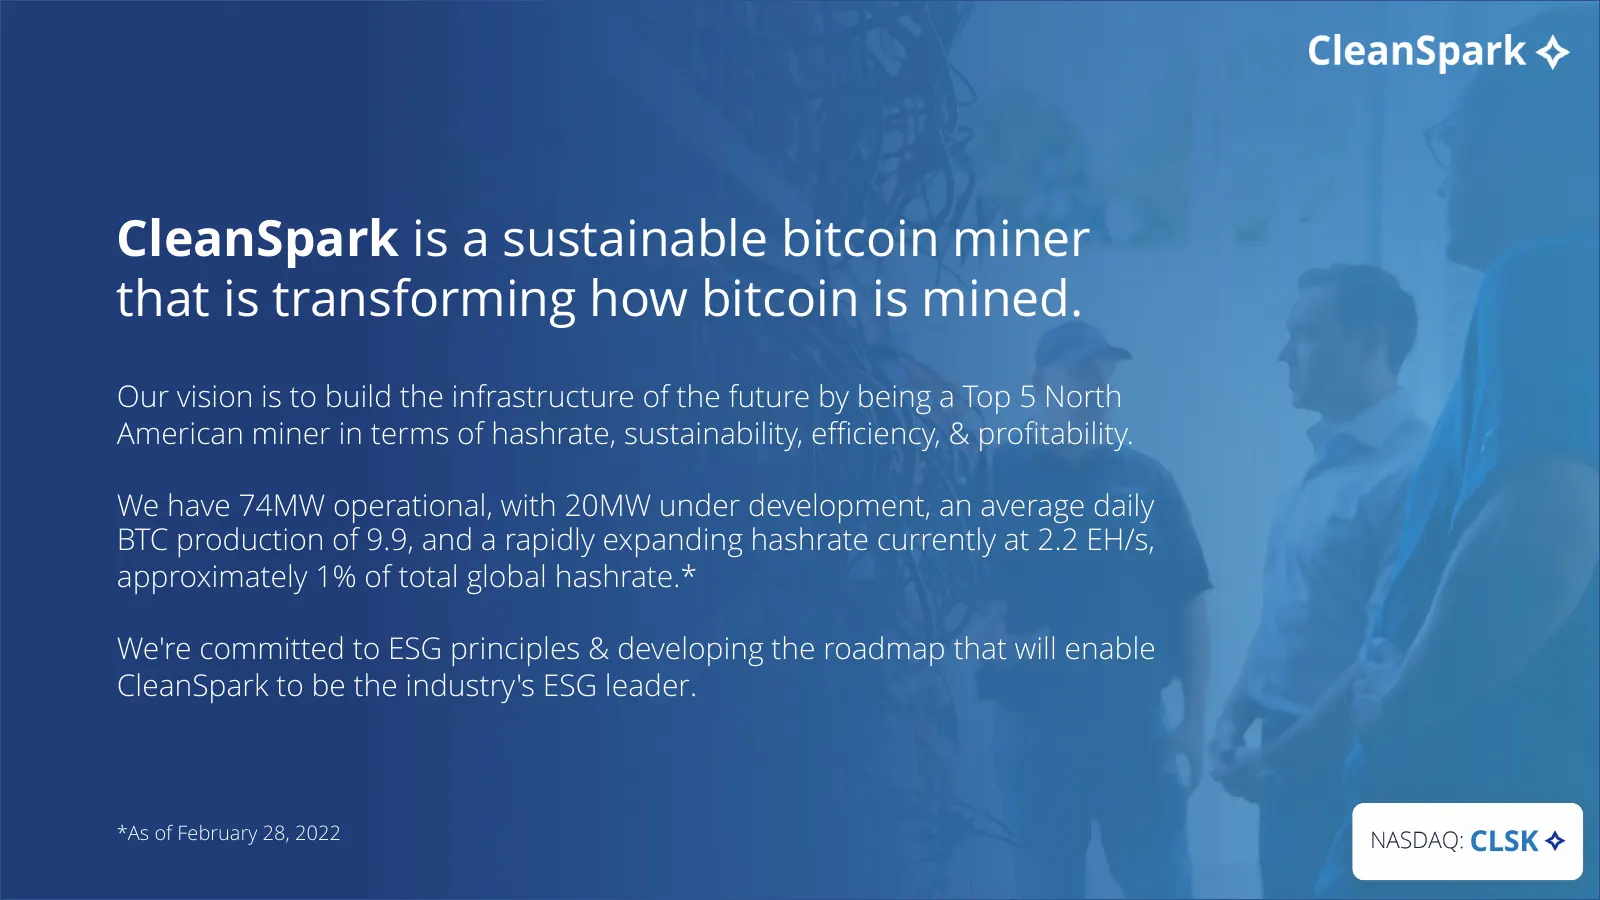
Slide 20: CleanSpark is a sustainable bitcoin miner
CleanSpark is a sustainable bitcoin miner that is transforming how bitcoin is mined. Our vision is to build the infrastructure of the future by being a Top 5 North American miner in terms of hashrate, sustainability, efficiency, & profitability. We have 74MW operational, with 20MW under development,
Slide 21: Appendix
Appendix
Slide 22: Management Team
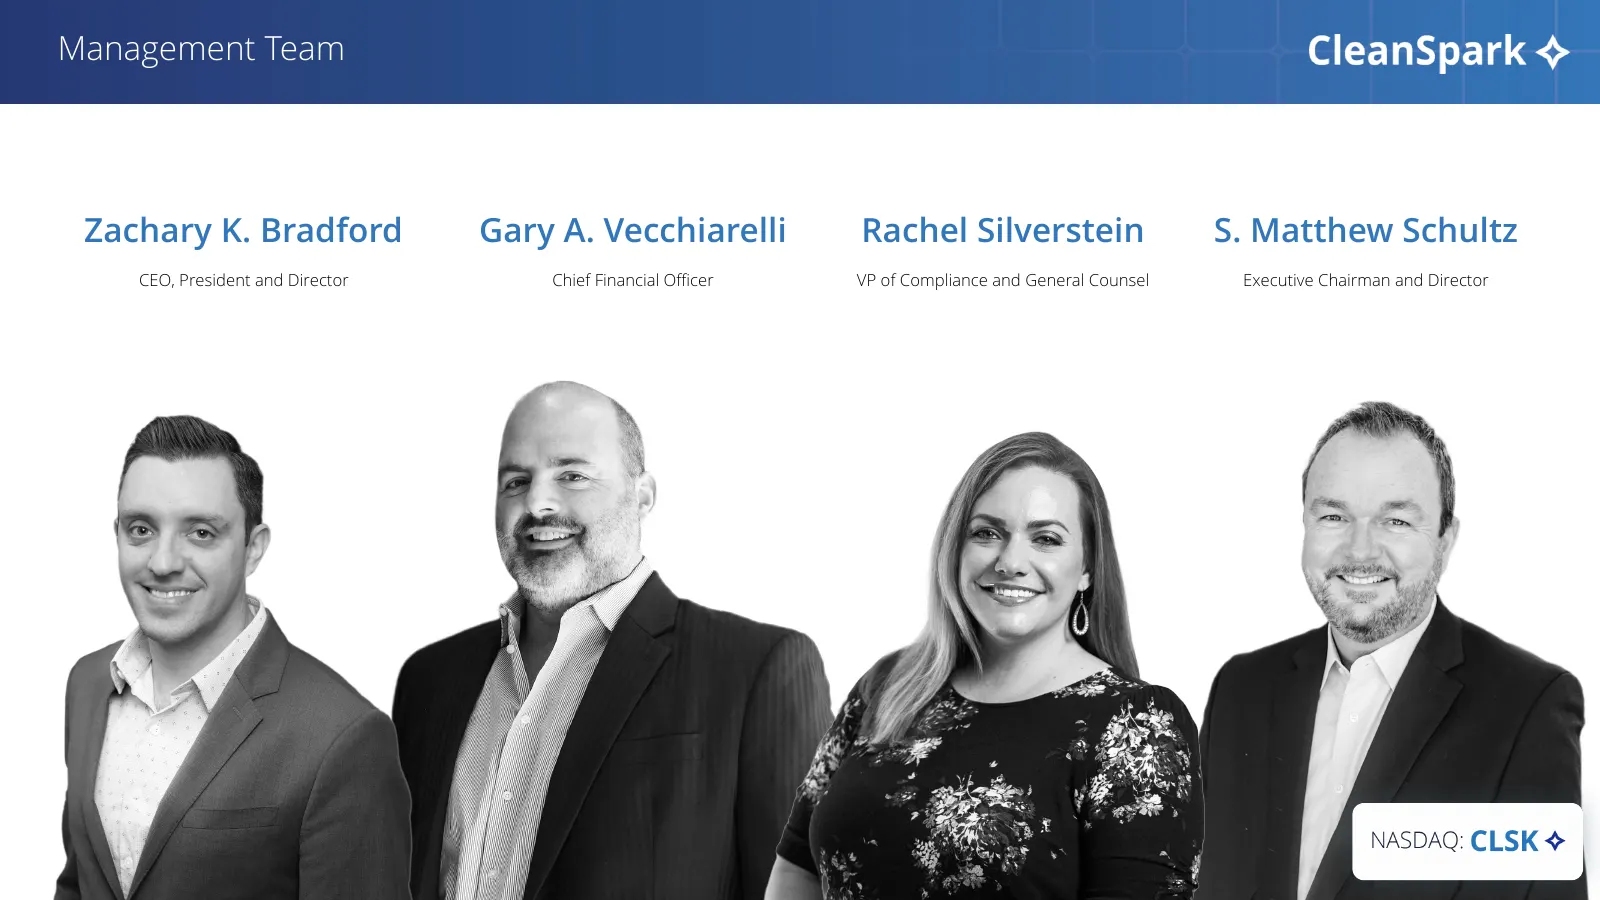
Management Team Zachary K. Bradford Gary A. Vecchiarelli Rachel Silverstein S. Matthew Schultz CEO, President and Director Chief Financial Officer VP of Compliance and General Counsel Executive Chairman and Director
Slide 23: Income Statement
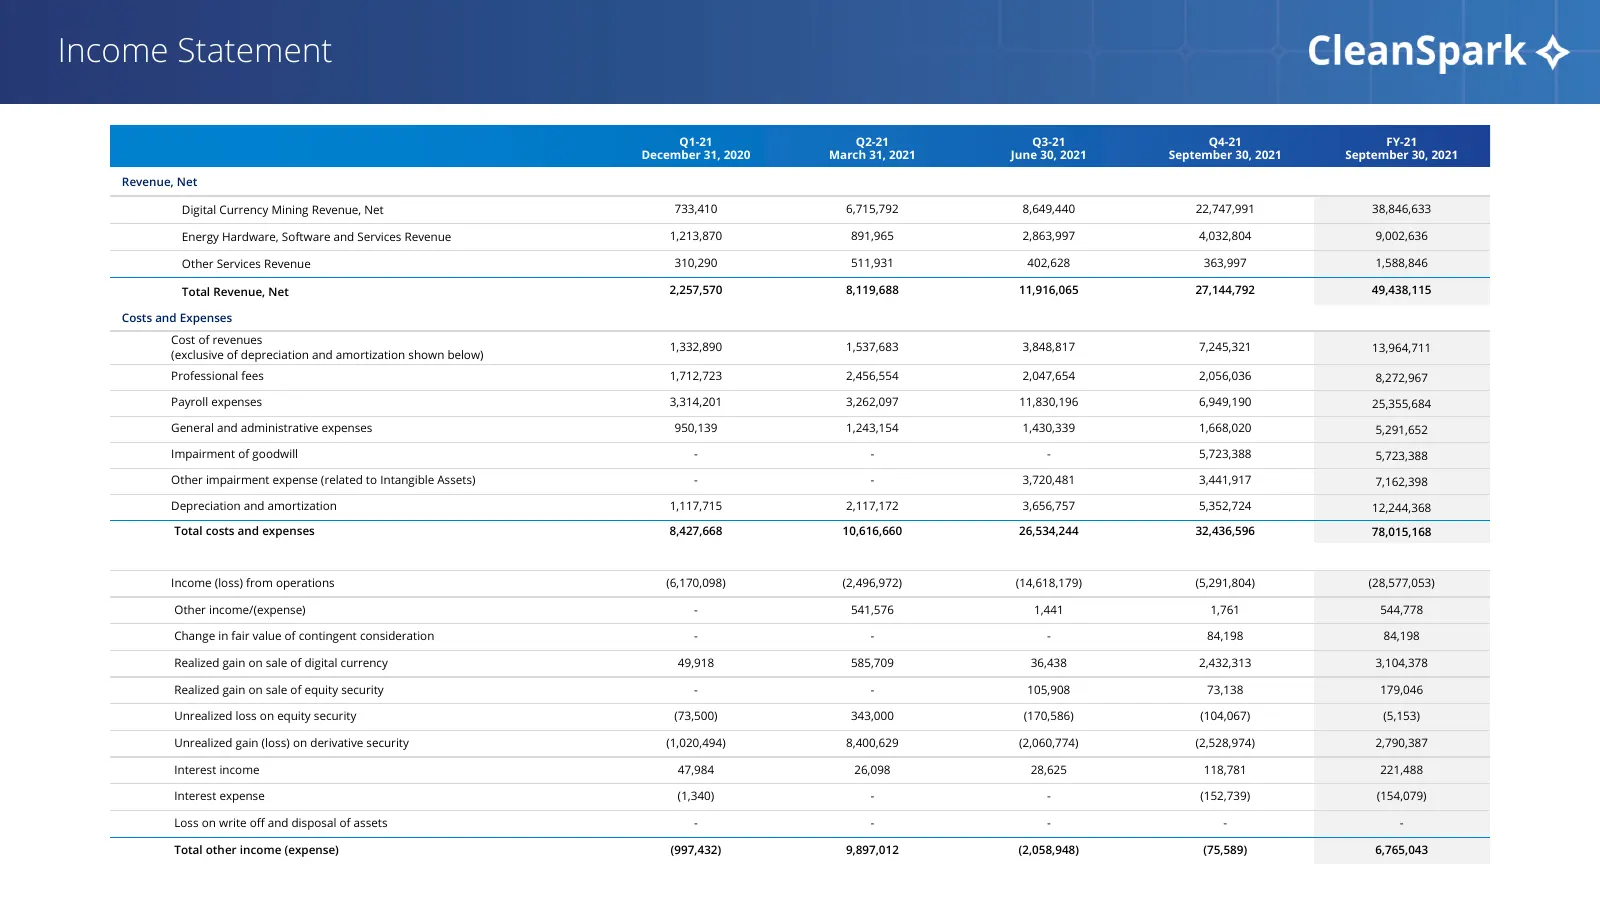
Income Statement Q1-21 Q2-21 Q3-21 Q4-21 FY-21 December 31, 2020 March 31, 2021 June 30, 2021 September 30, 2021 September 30, 2021 Revenue, Net Digital Currency Mining Revenue, Net 733,410 6,715,792 8,649,440 22,747,991 38,846,633 Energy Hardware, Software and Services Revenue 1,213,870 891,965 2,8
Slide 24: Income Statement (cont’d)
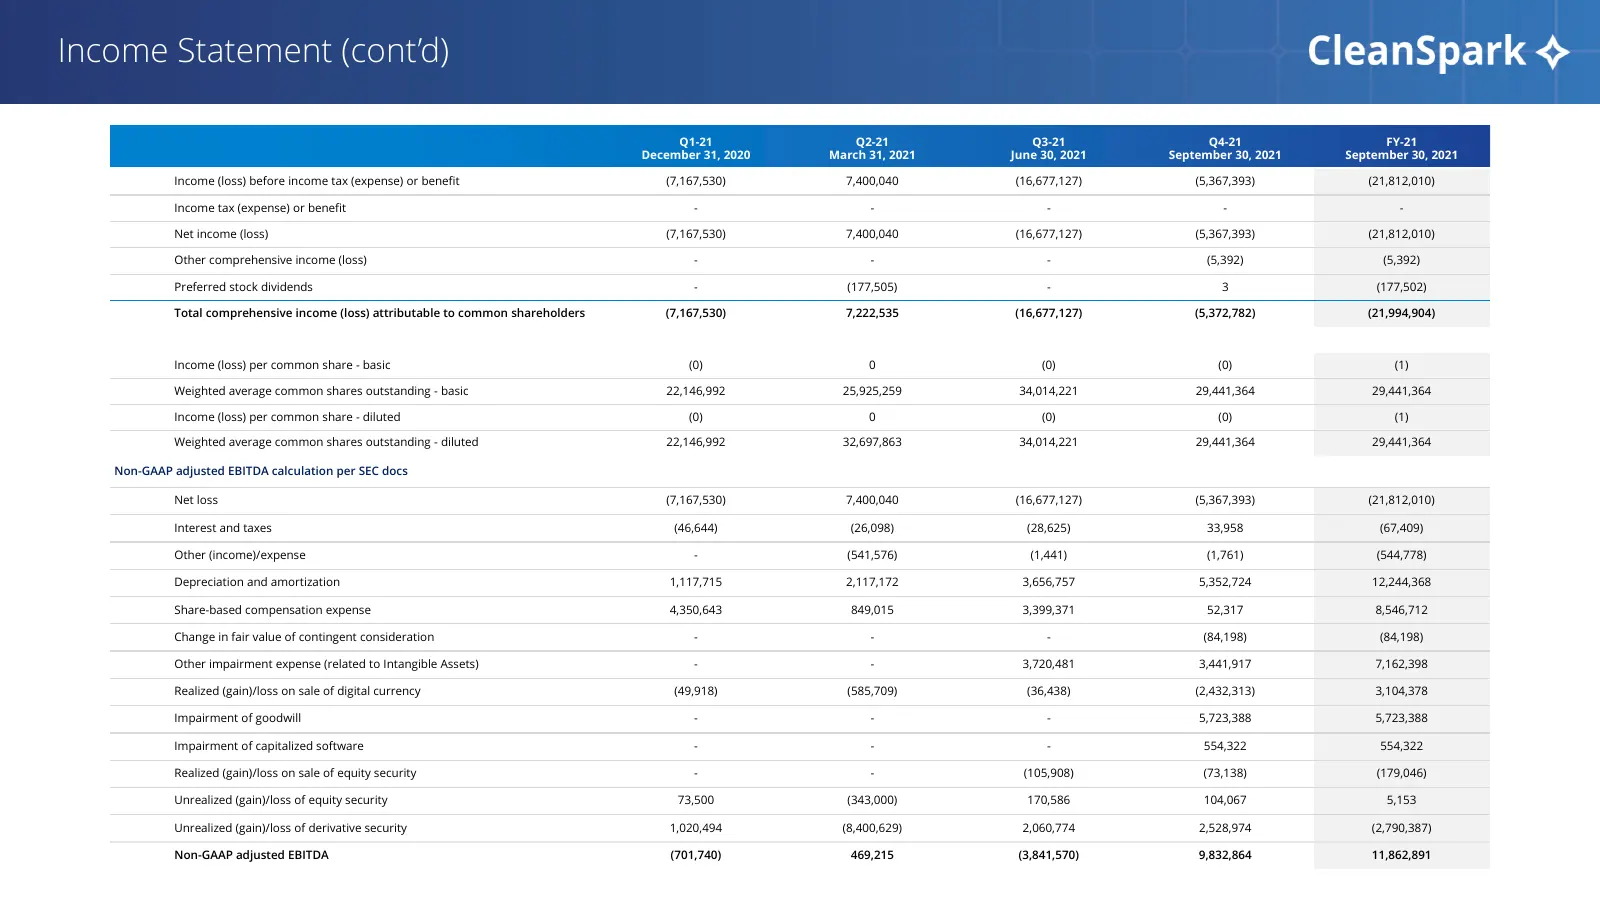
Income Statement (cont’d) Q1-21 Q2-21 Q3-21 Q4-21 FY-21 December 31, 2020 March 31, 2021 June 30, 2021 September 30, 2021 September 30, 2021 Income (loss) before income tax (expense) or benefit (7,167,530) 7,400,040 (16,677,127) (5,367,393) (21,812,010) Income tax (expense) or benefit - - - - - Net
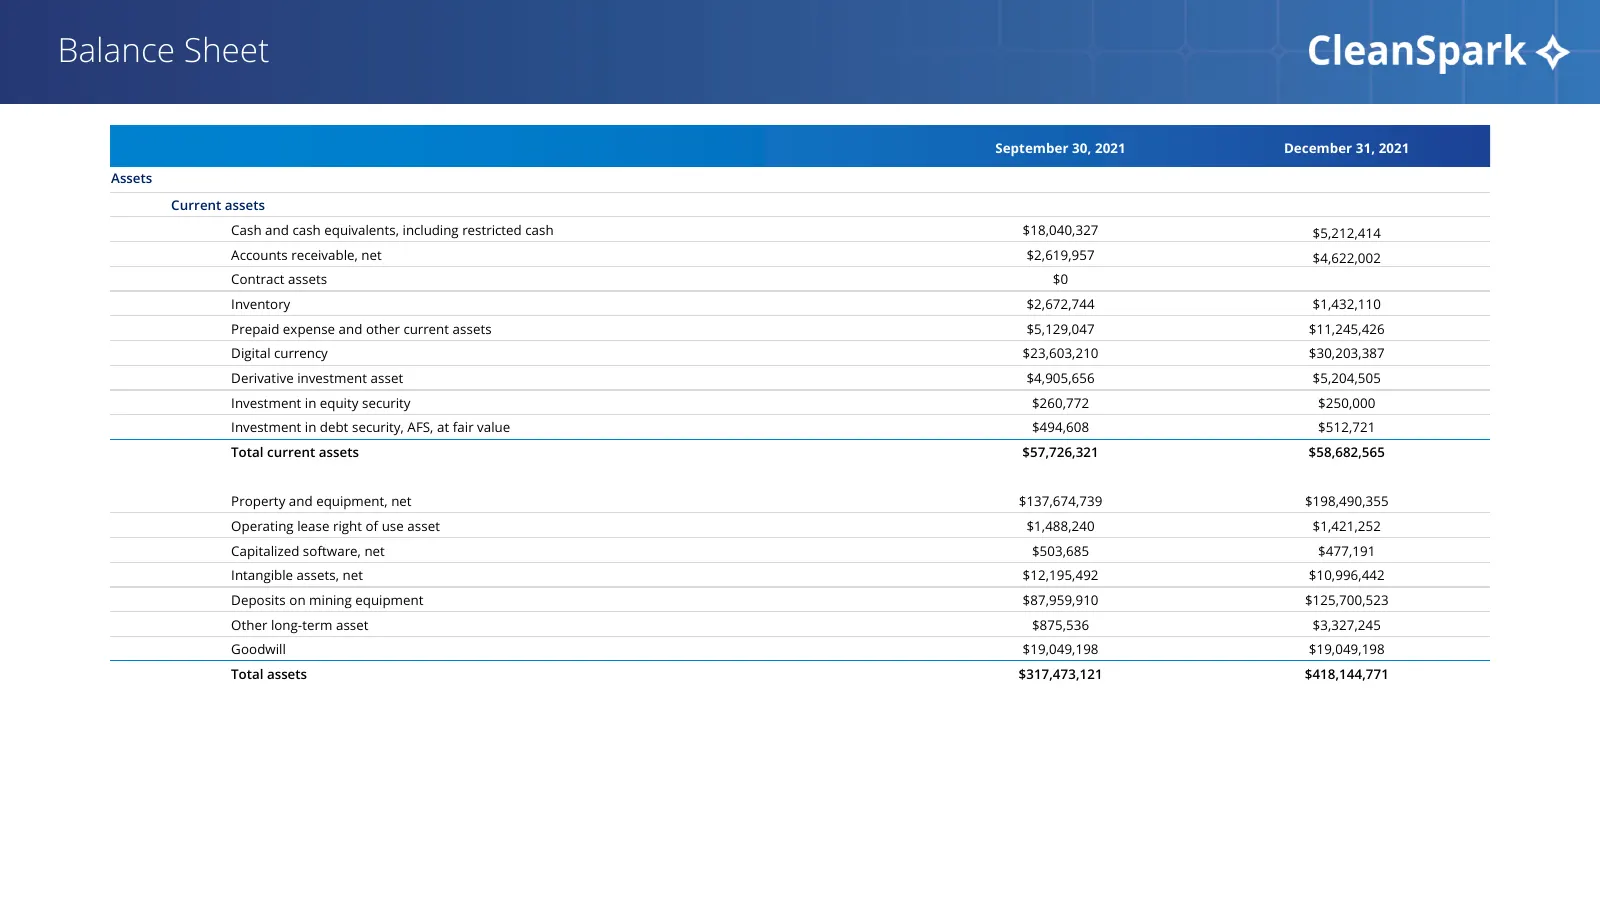
Slide 25: Balance Sheet
Balance Sheet September 30, 2021 December 31, 2021 Assets Current assets Cash and cash equivalents, including restricted cash $18,040,327 $5,212,414 Accounts receivable, net $2,619,957 $4,622,002 Contract assets $0 Inventory $2,672,744 $1,432,110 Prepaid expense and other current assets $5,129,047 $
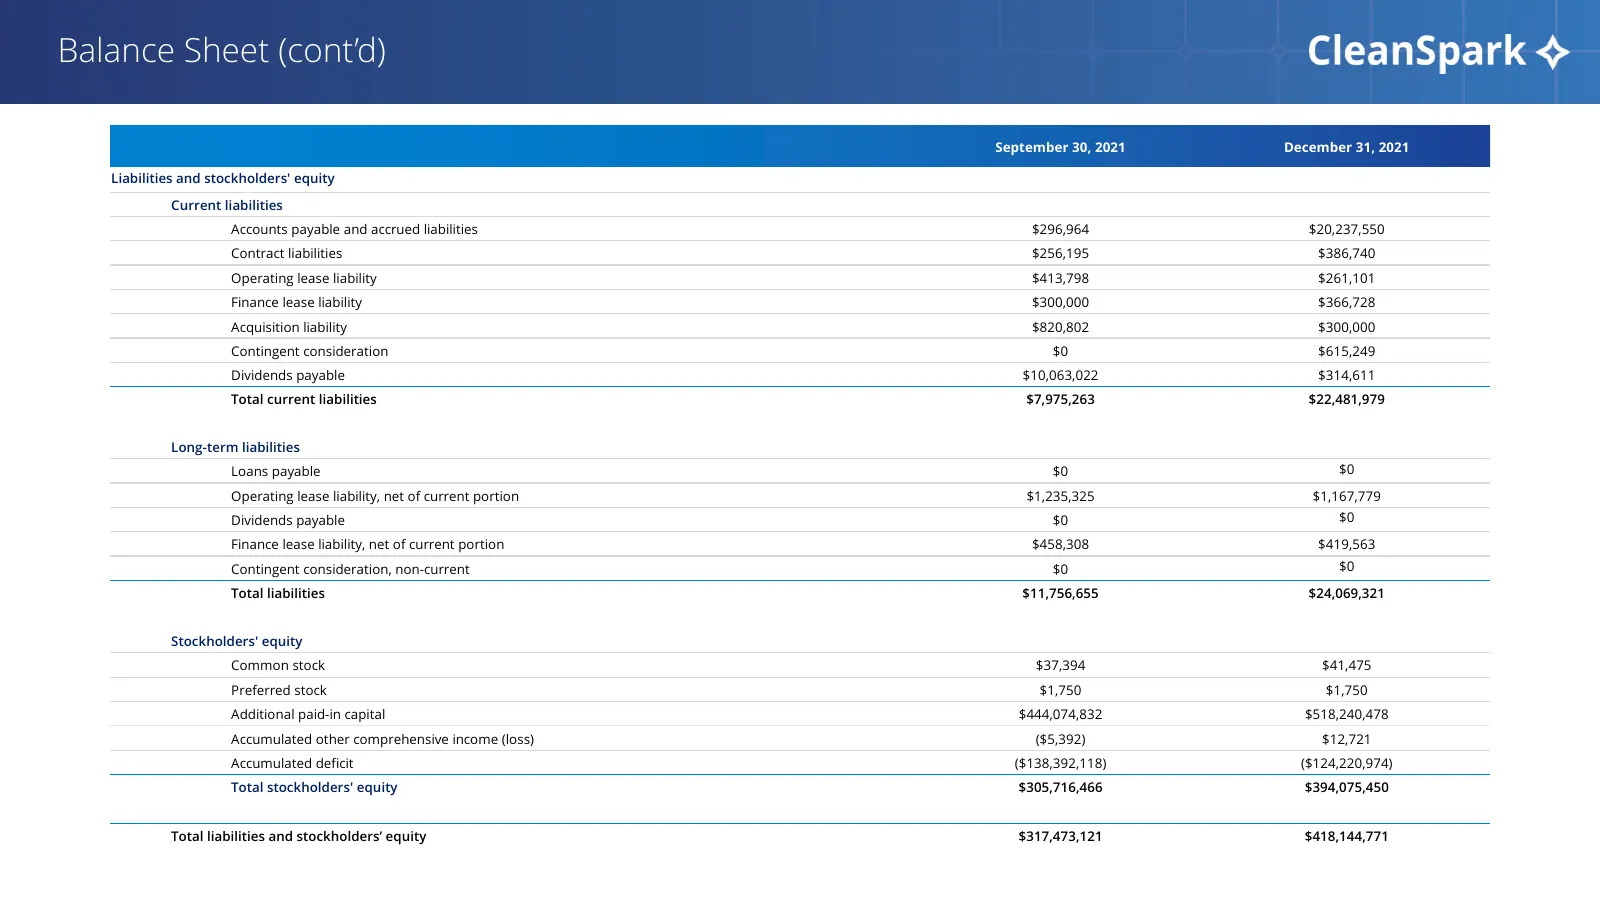
Slide 26: Balance Sheet (cont’d)
Balance Sheet (cont’d) September 30, 2021 December 31, 2021 Liabilities and stockholders' equity Current liabilities Accounts payable and accrued liabilities $296,964 $20,237,550 Contract liabilities $256,195 $386,740 Operating lease liability $413,798 $261,101 Finance lease liability $300,000 $366,
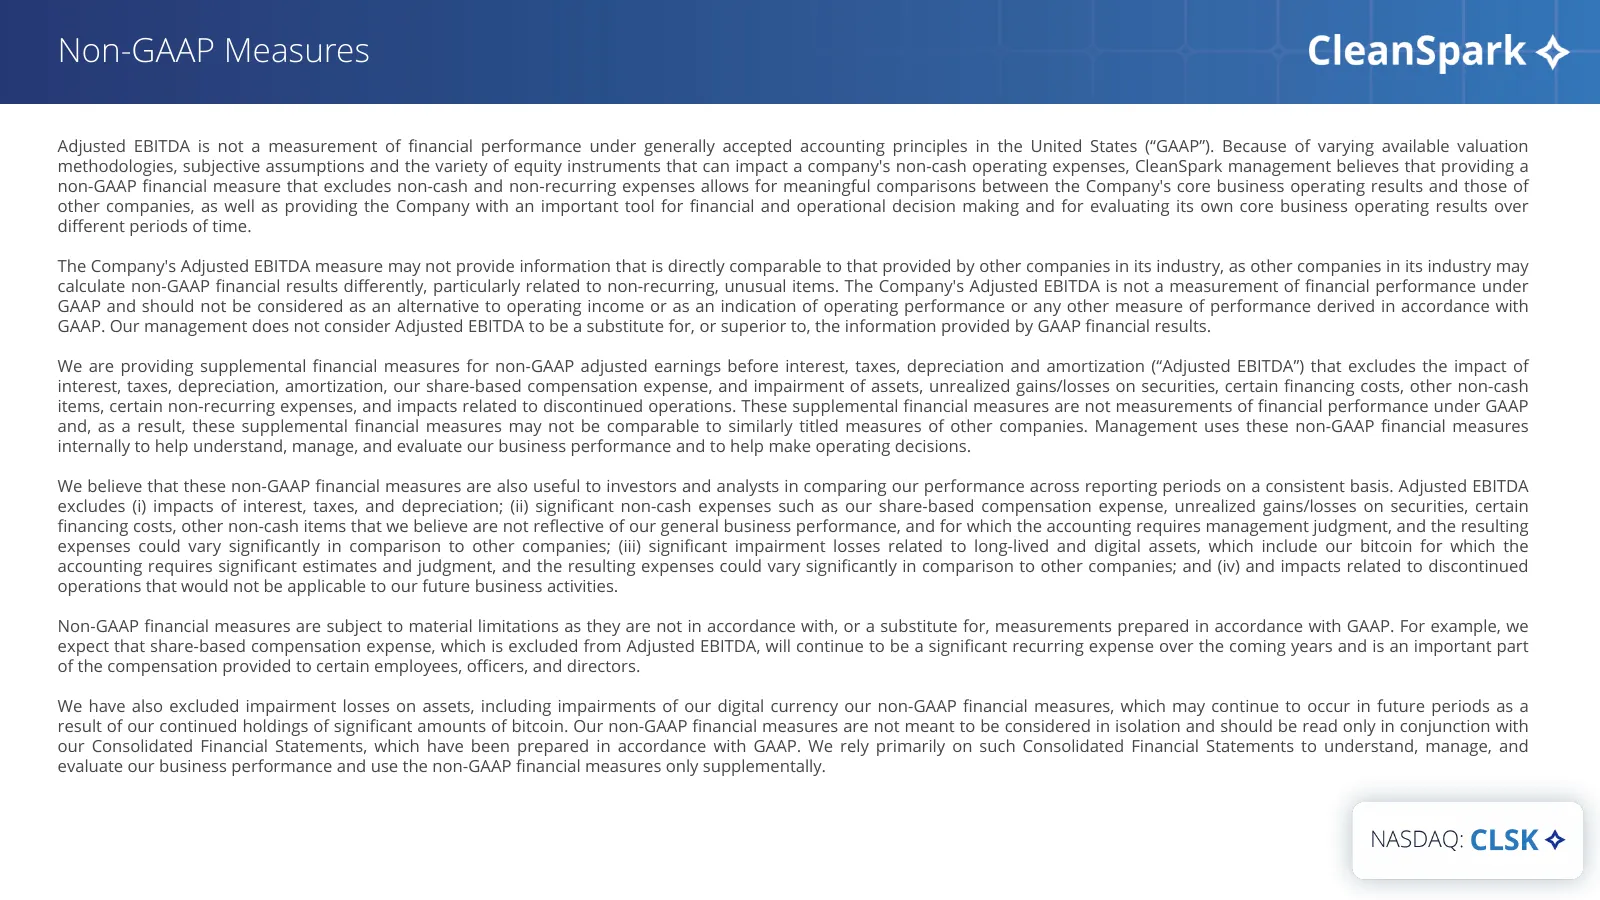
Slide 27: Non-GAAP Measures
Non-GAAP Measures Adjusted EBITDA is not a measurement of financial performance under generally accepted accounting principles in the United States (“GAAP”). Because of varying available valuation methodologies, subjective assumptions and the variety of equity instruments that can impact a company's
Slide 28: CleanSpark + for a better world.
CleanSpark + for a better world.
Source: Internet Archive copy of cleanspark.com
More decks from CleanSpark, Inc.
 Q3 2026 Earnings Presentation12 slides · Aug 6, 2026
 Q2 2026 Earnings Presentation14 slides · May 11, 2026
 Q1 2026 Earnings Presentation17 slides · Feb 5, 2026
 Q4 2025 Earnings Presentation18 slides · Nov 25, 2025
 Q1 2025 Earnings Presentation6 slides · Feb 6, 2025
 Q4 2024 Earnings Presentation6 slides · Dec 2, 2024