Fairmount Santrol Holdings Inc
Fairmount Santrol — Investor Day (May 2016)
73 slides from Fairmount Santrol's investor day presentation, May 18, 2016
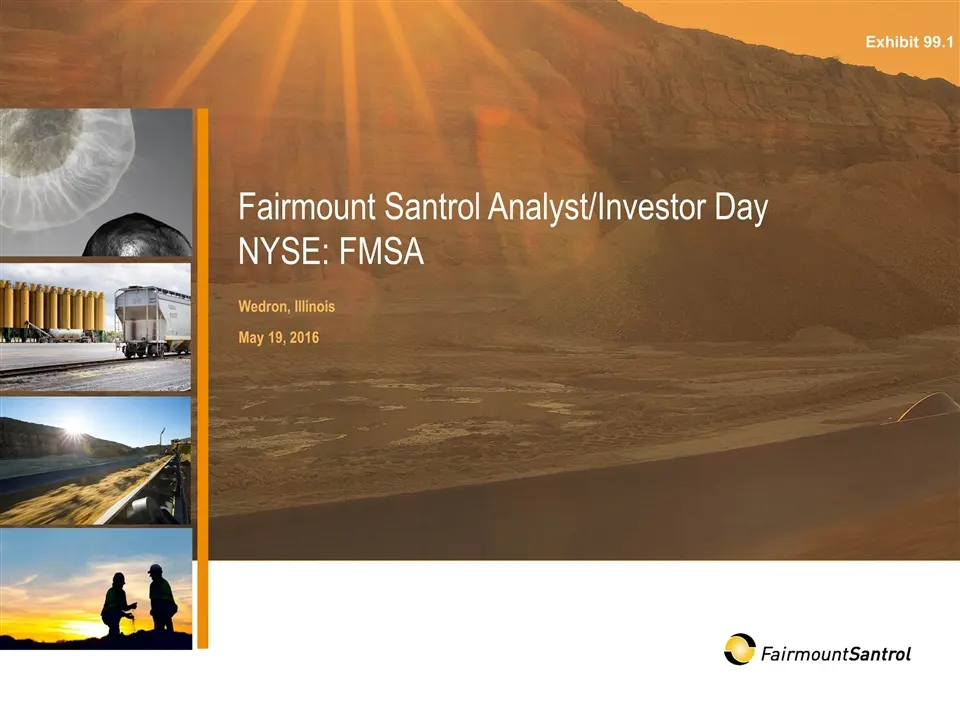
Slide 1: Fairmount Santrol Analyst/Investor Day
Fairmount Santrol Analyst/Investor Day NYSE: FMSA Wedron, Illinois May 19, 2016 Exhibit 99.1
Slide 2: Forward-Looking Statements and Non-GAAP Financial Measures
Forward-Looking Statements and Non-GAAP Financial Measures This presentation contains forward-looking statements. These statements can be identified by the use of forward-looking terminology including “will,” “may,” “believe,” “expect,” “anticipate,” “estimate,” “continue,” or other similar words. T
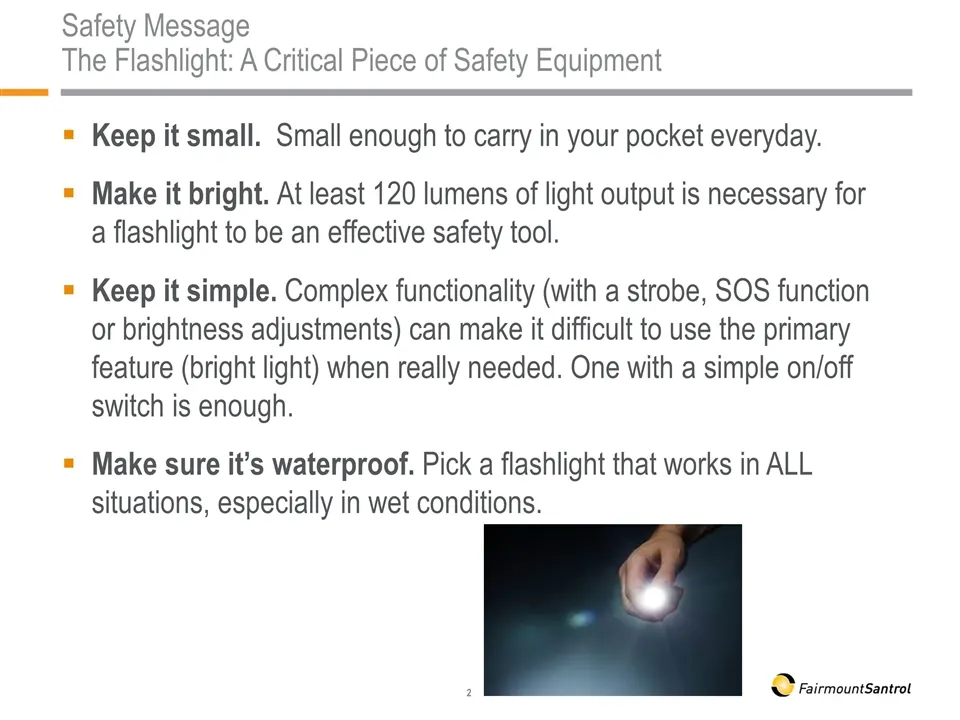
Slide 3: Safety Message: The Flashlight
Safety Message The Flashlight: A Critical Piece of Safety Equipment Keep it small. Small enough to carry in your pocket everyday. Make it bright. At least 120 lumens of light output is necessary for a flashlight to be an effective safety tool. Keep it simple. Complex functionality (with a strobe, SO
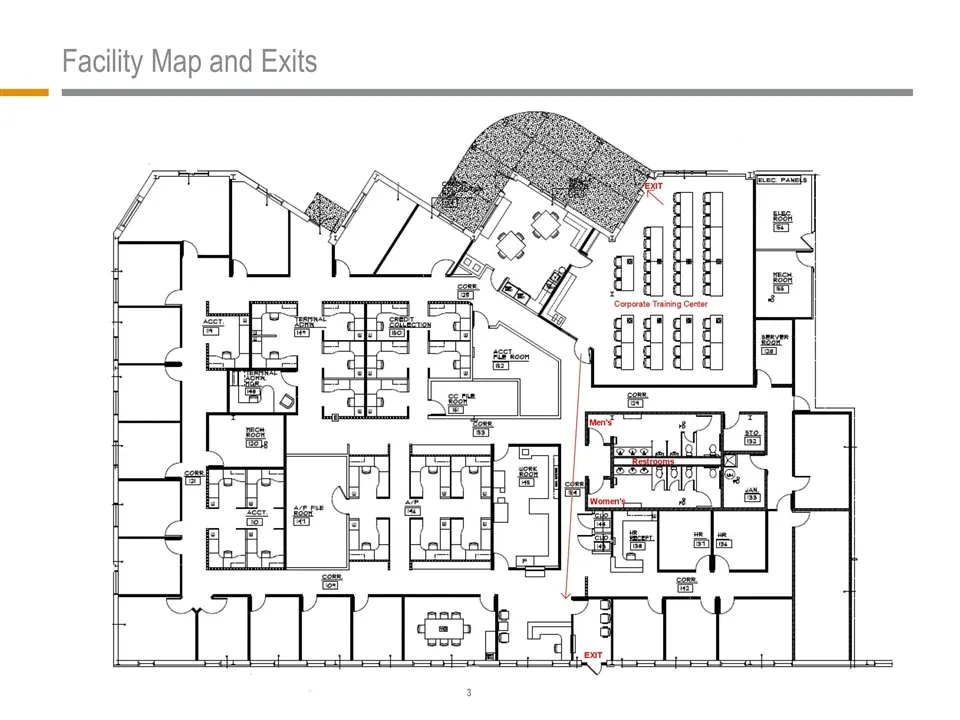
Slide 4: Facility Map and Exits
Facility Map and Exits ct ad. WI “P
Slide 5: The Fairmount Santrol Story
The Fairmount Santrol Story Jenniffer Deckard President and CEO
Slide 6: Agenda
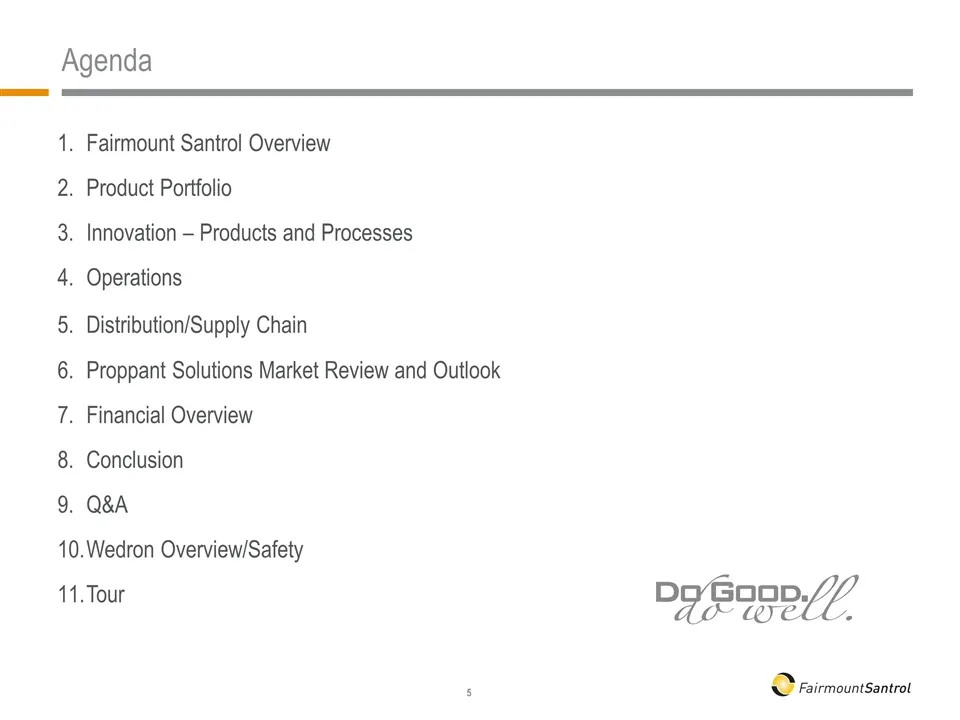
Agenda Fairmount Santrol Overview Product Portfolio Innovation – Products and Processes Operations Distribution/Supply Chain Proppant Solutions Market Review and Outlook Financial Overview Conclusion Q&A Wedron Overview/Safety Tour
Slide 7: Fairmount Santrol Management Team
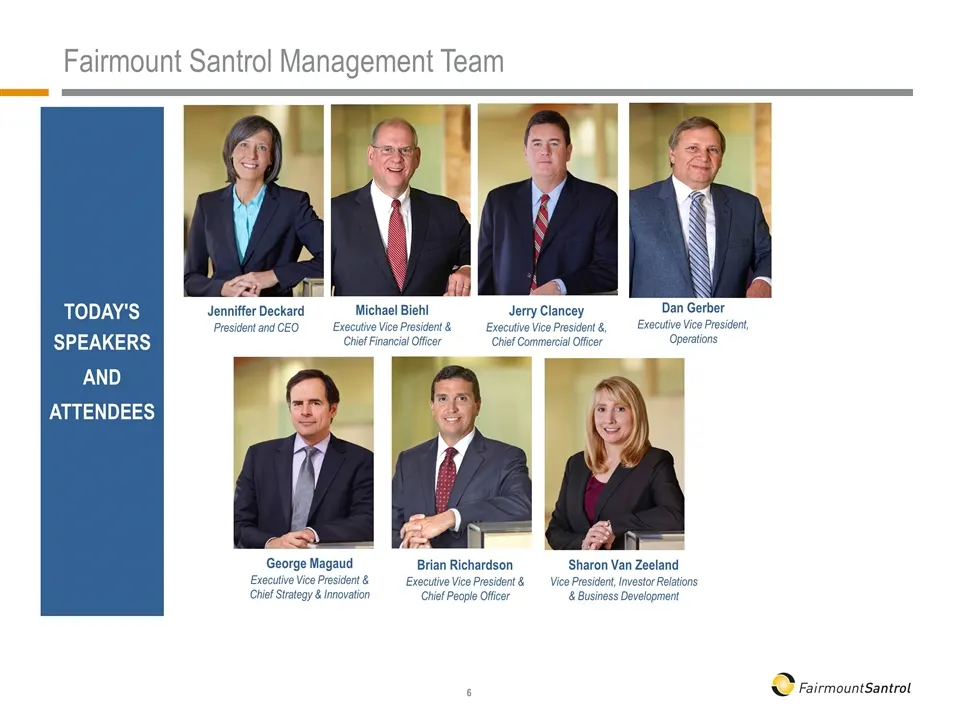
Fairmount Santrol Management Team Jenniffer Deckard President and CEO George Magaud Executive Vice President & Chief Strategy & Innovation Brian Richardson Executive Vice President & Chief People Officer Today's Speakers and Attendees Jerry Clancey Executive Vice President &, Chief Commercial Office
Slide 8: Two Complementary Business Segments
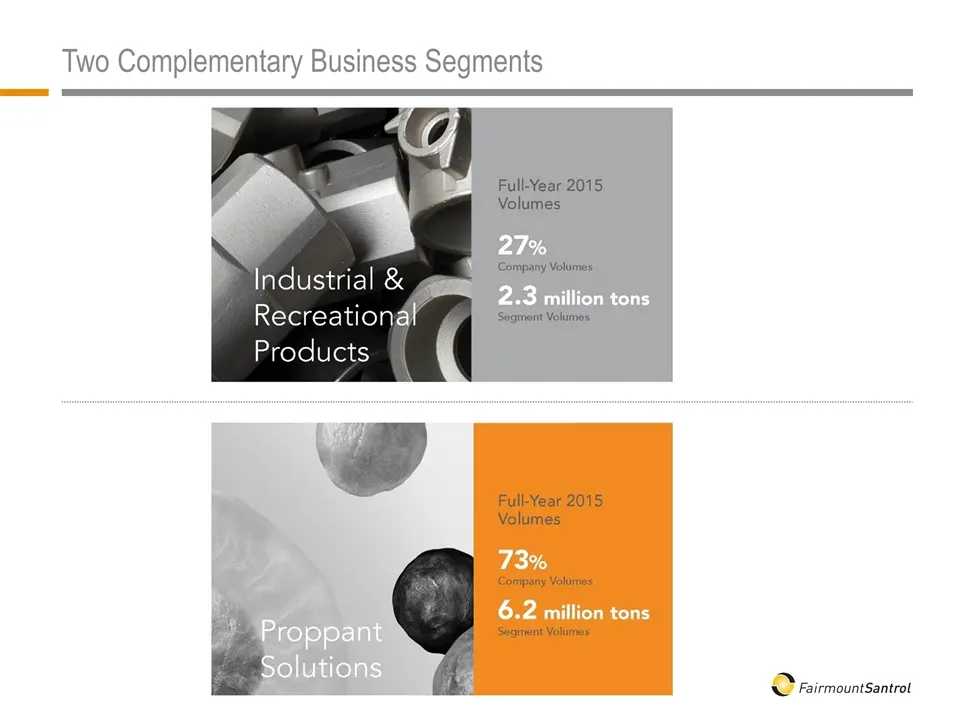
Two Complementary Business Segments
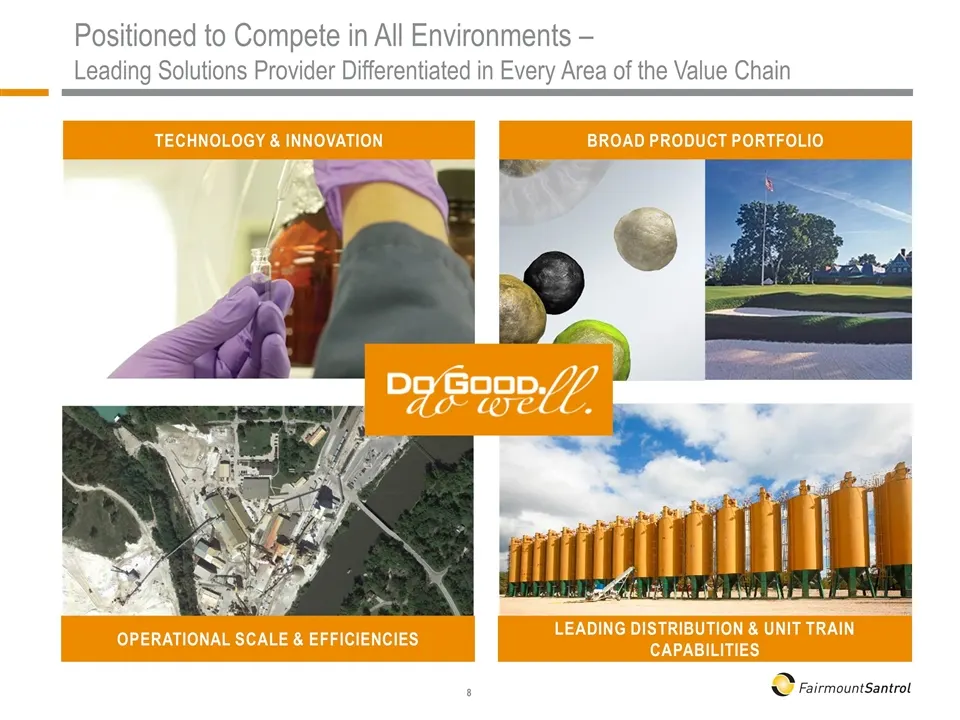
Slide 9: Positioned to Compete in All Environments
Positioned to Compete in All Environments – Leading Solutions Provider Differentiated in Every Area of the Value Chain Operational Scale & Efficiencies Leading Distribution & Unit Train Capabilities Broad Product Portfolio Technology & Innovation
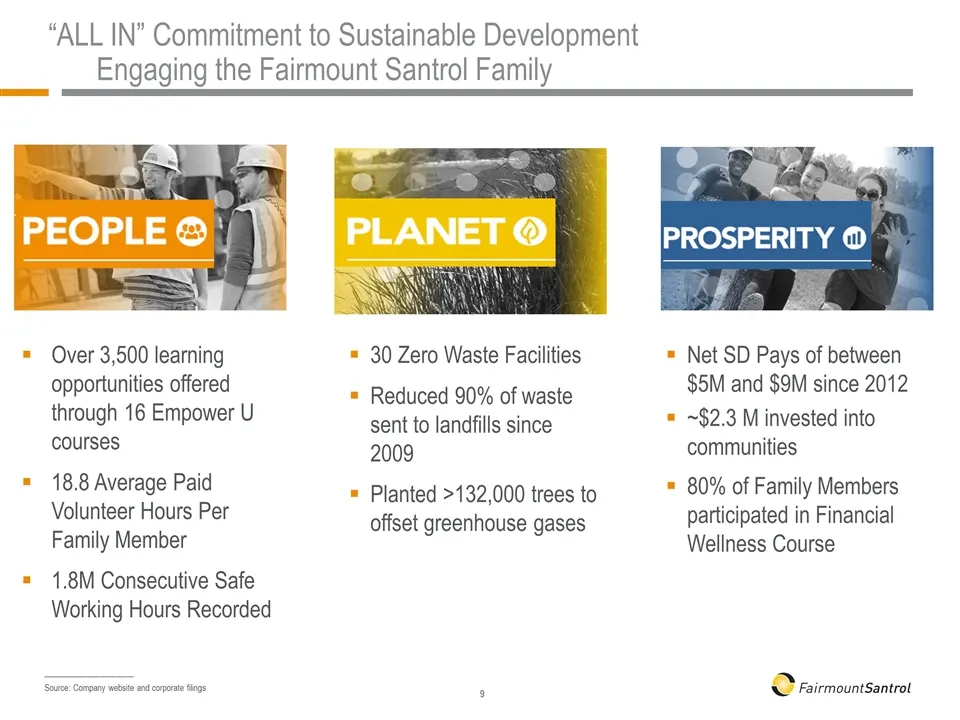
Slide 10: "ALL IN" Commitment to Sustainable Development
“ALL IN” Commitment to Sustainable Development Engaging the Fairmount Santrol Family _____________________ Source: Company website and corporate filings Over 3,500 learning opportunities offered through 16 Empower U courses 18.8 Average Paid Volunteer Hours Per Family Member 1.8M Consecutive Safe Wo
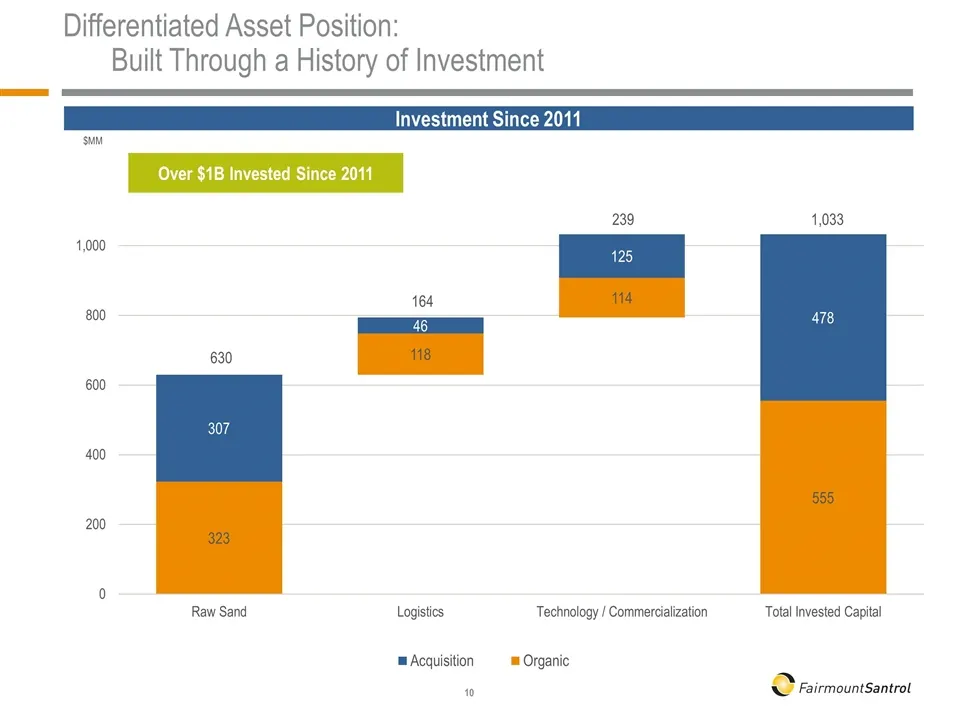
Slide 11: Differentiated Asset Position: Built Through a History of Investment
Differentiated Asset Position: Built Through a History of Investment Investment Since 2011 $MM Over $1B Invested Since 2011 630 164 239 1,033
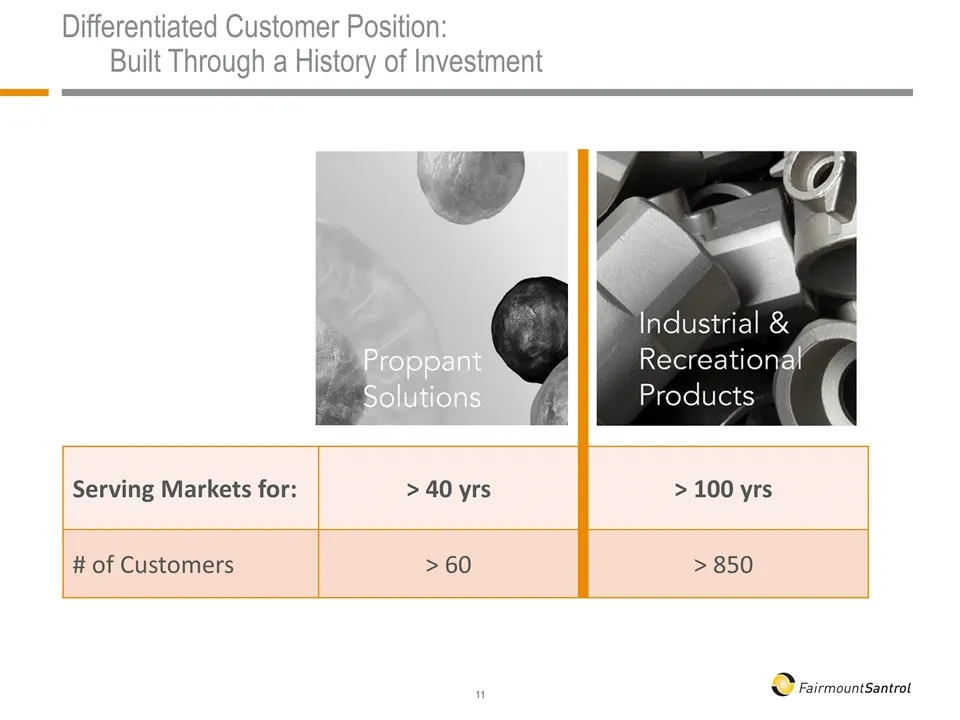
Slide 12: Differentiated Customer Position
Differentiated Customer Position: Built Through a History of Investment Serving Markets for: > 40 yrs > 100 yrs # of Customers > 60 > 850
Slide 13: Proppant Tailwinds & Our Historical Investments
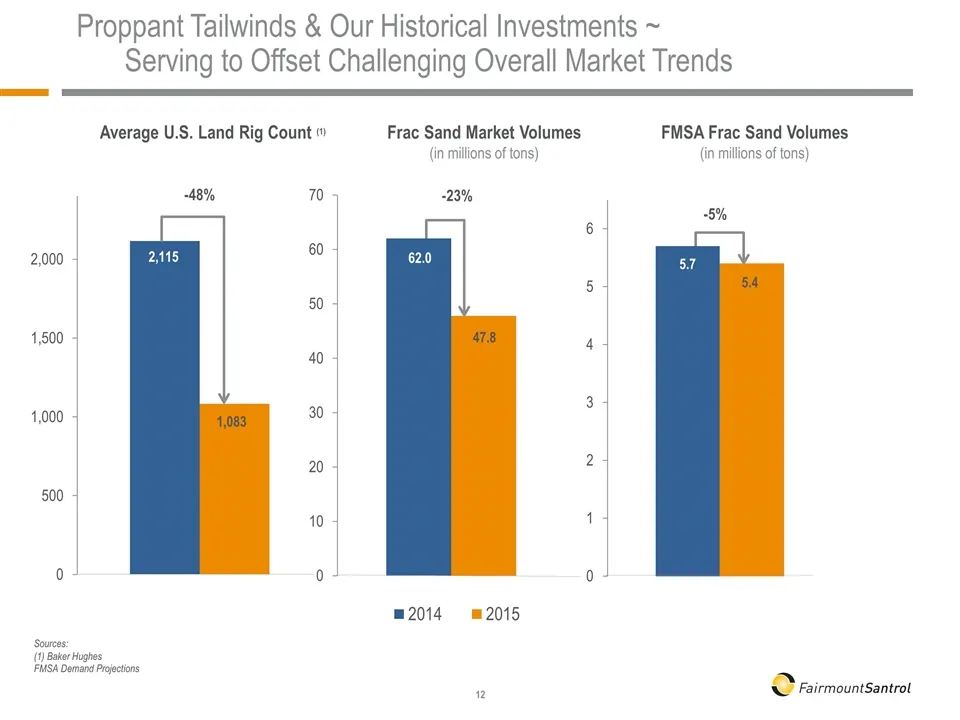
Proppant Tailwinds & Our Historical Investments ~ Serving to Offset Challenging Overall Market Trends -48% Sources: (1) Baker Hughes FMSA Demand Projections FMSA Frac Sand Volumes (in millions of tons) Average U.S. Land Rig Count (1) Frac Sand Market Volumes (in millions of tons) -23%
Slide 14: Managing Through the Down-cycle: Operations Footprint
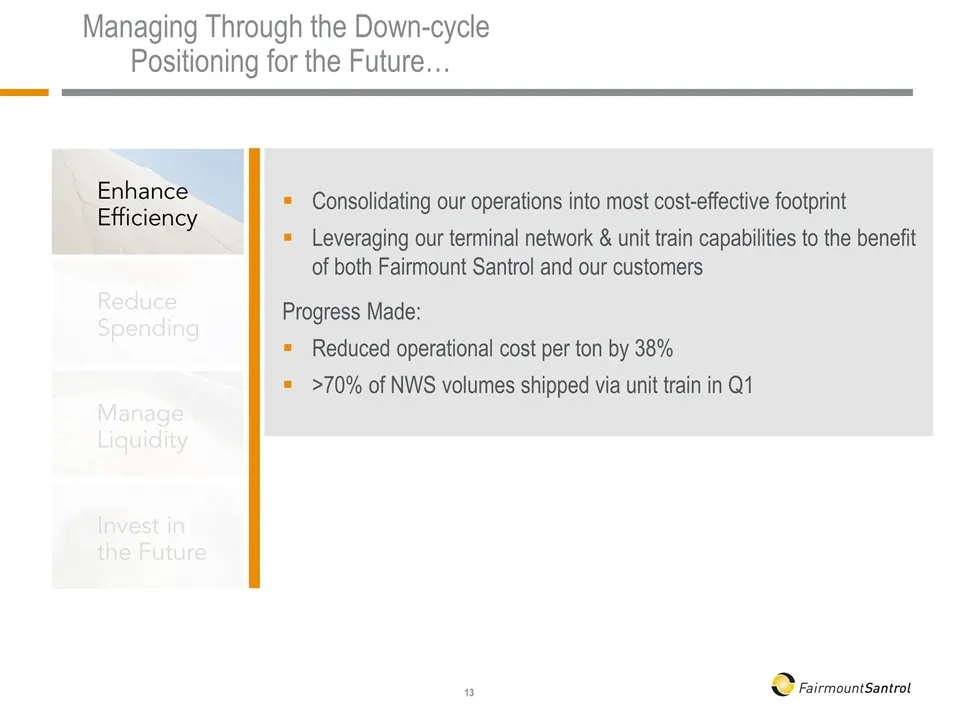
Managing Through the Down-cycle Positioning for the Future… Consolidating our operations into most cost-effective footprint Leveraging our terminal network & unit train capabilities to the benefit of both Fairmount Santrol and our customers Progress Made: Reduced operational cost per ton by 38% >70%
Slide 15: Managing Through the Down-cycle: Reducing Spend
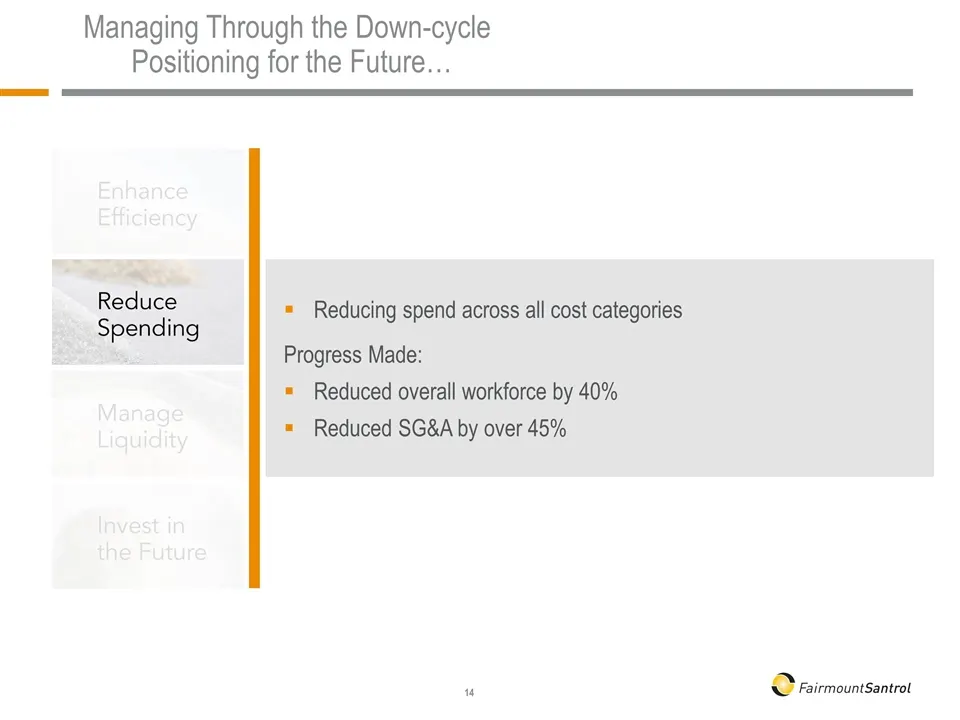
Managing Through the Down-cycle Positioning for the Future… Reducing spend across all cost categories Progress Made: Reduced overall workforce by 40% Reduced SG&A by over 45%
Slide 16: Managing Through the Down-cycle: Capex and Liquidity
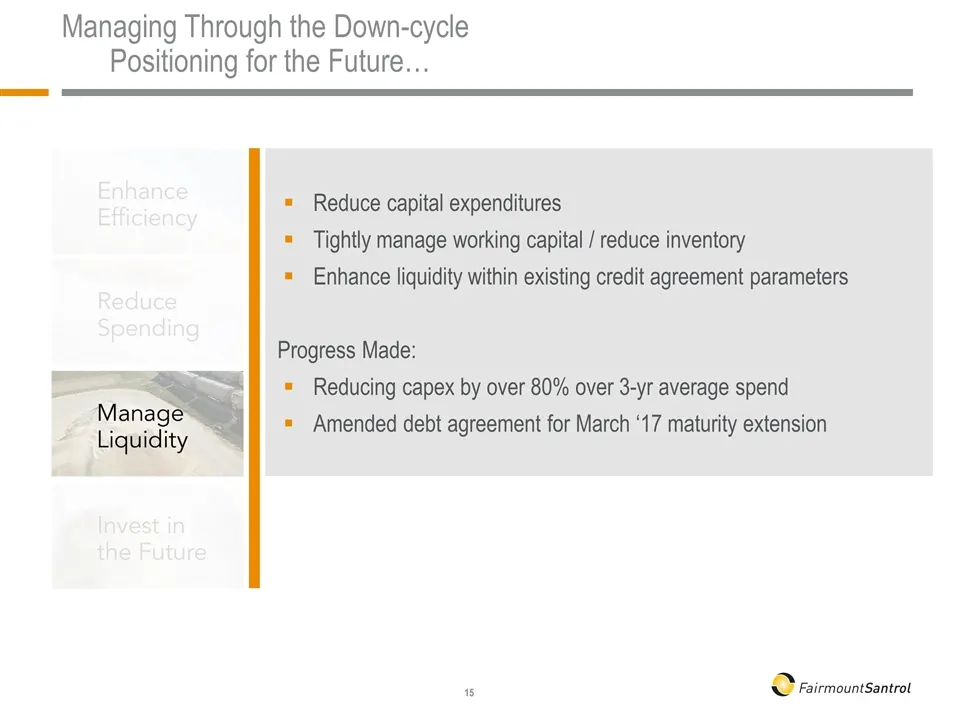
Managing Through the Down-cycle Positioning for the Future… Reduce capital expenditures Tightly manage working capital / reduce inventory Enhance liquidity within existing credit agreement parameters Progress Made: Reducing capex by over 80% over 3-yr average spend Amended debt agreement for March ‘
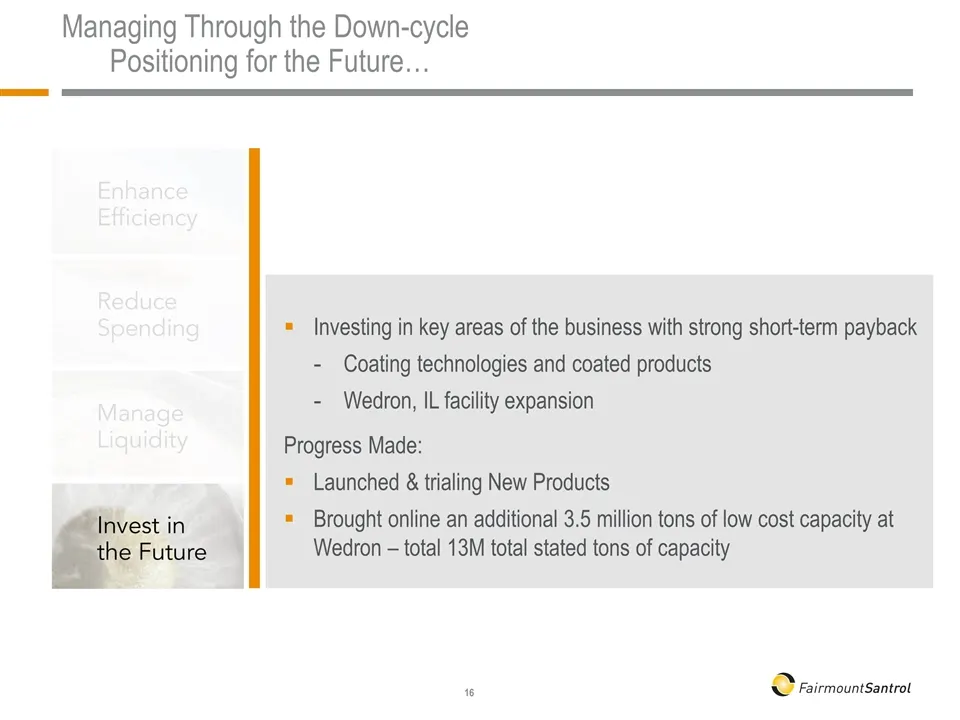
Slide 17: Managing Through the Down-cycle: Investing in Key Areas
Managing Through the Down-cycle Positioning for the Future… Investing in key areas of the business with strong short-term payback Coating technologies and coated products Wedron, IL facility expansion Progress Made: Launched & trialing New Products Brought online an additional 3.5 million tons of lo
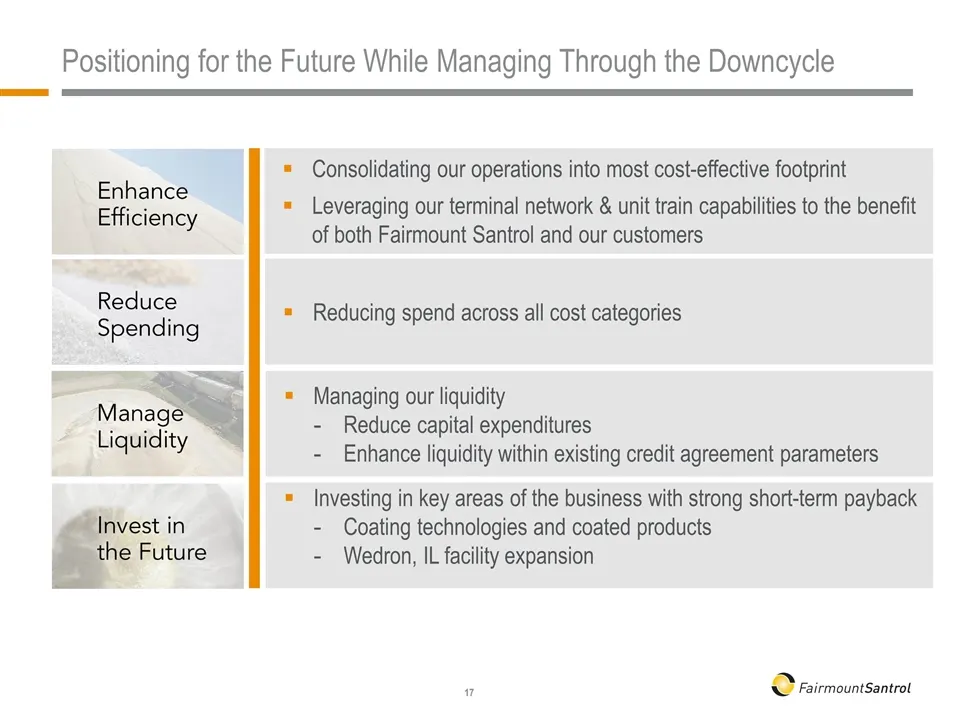
Slide 18: Positioning for the Future While Managing Through the Downcycle
Positioning for the Future While Managing Through the Downcycle Consolidating our operations into most cost-effective footprint Leveraging our terminal network & unit train capabilities to the benefit of both Fairmount Santrol and our customers Reducing spend across all cost categories Managing our
Slide 19: Looking Ahead
Looking Ahead Rig Counts Bottoming in 2nd Quarter Increased Pressure on 2nd Quarter Volumes & Pricing Consensus is building around a stronger 2016 2nd half Rig efficiencies and proppant intensity continue to provide tailwinds Fairmount is well-positioned to manage through an extended the downcycle,
Slide 20: Product Portfolio
Product Portfolio Jerry Clancey Executive Vice President & Chief Commercial Officer
Slide 21: Our I&R Product Portfolio
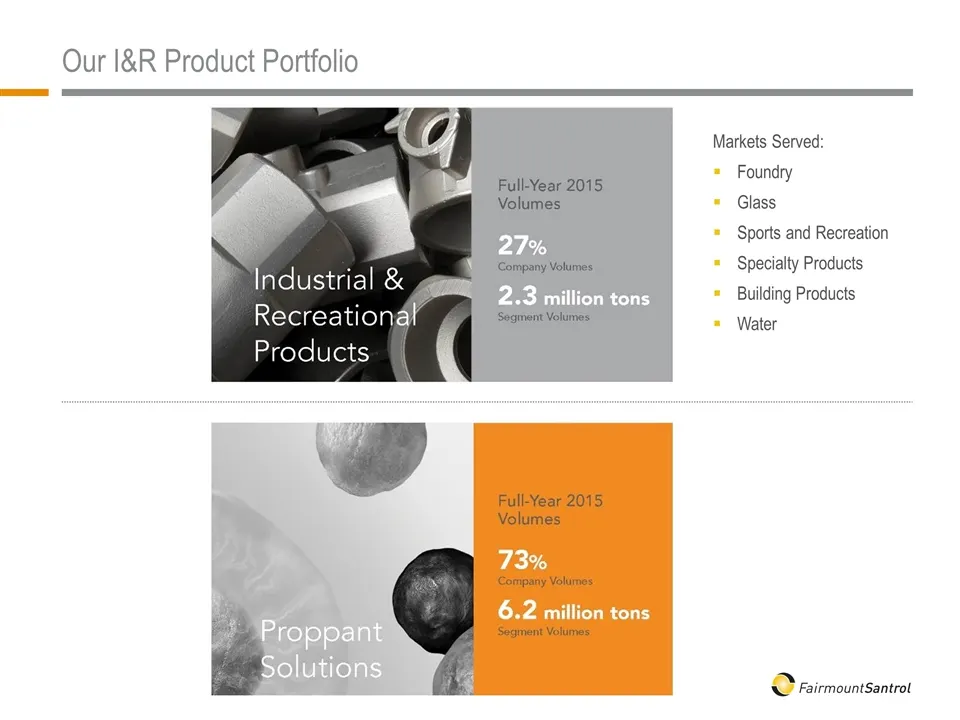
Our I&R Product Portfolio Markets Served: Foundry Glass Sports and Recreation Specialty Products Building Products Water
Slide 22: Foundry Sands and Resin Solutions
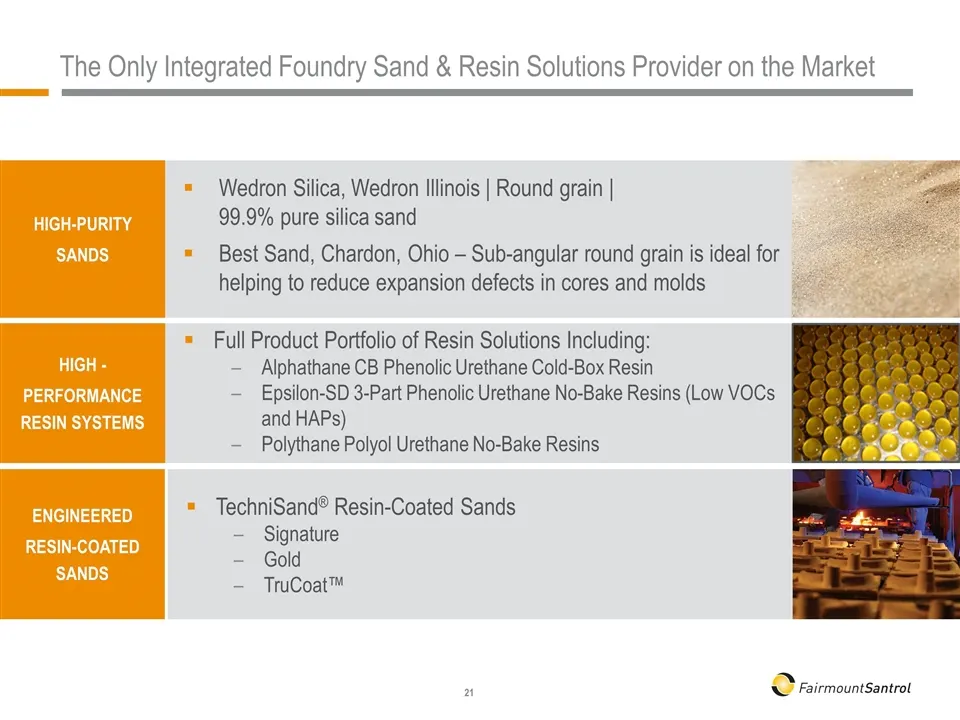
Wedron Silica, Wedron Illinois | Round grain | 99.9% pure silica sand Best Sand, Chardon, Ohio – Sub-angular round grain is ideal for helping to reduce expansion defects in cores and molds TechniSand® Resin-Coated Sands Signature Gold TruCoat™ HIGH-PURITY SANDS HIGH - PERFORMANCE RESIN SYSTEMS ENGIN
Slide 23: NEW TechniSand TruCoat
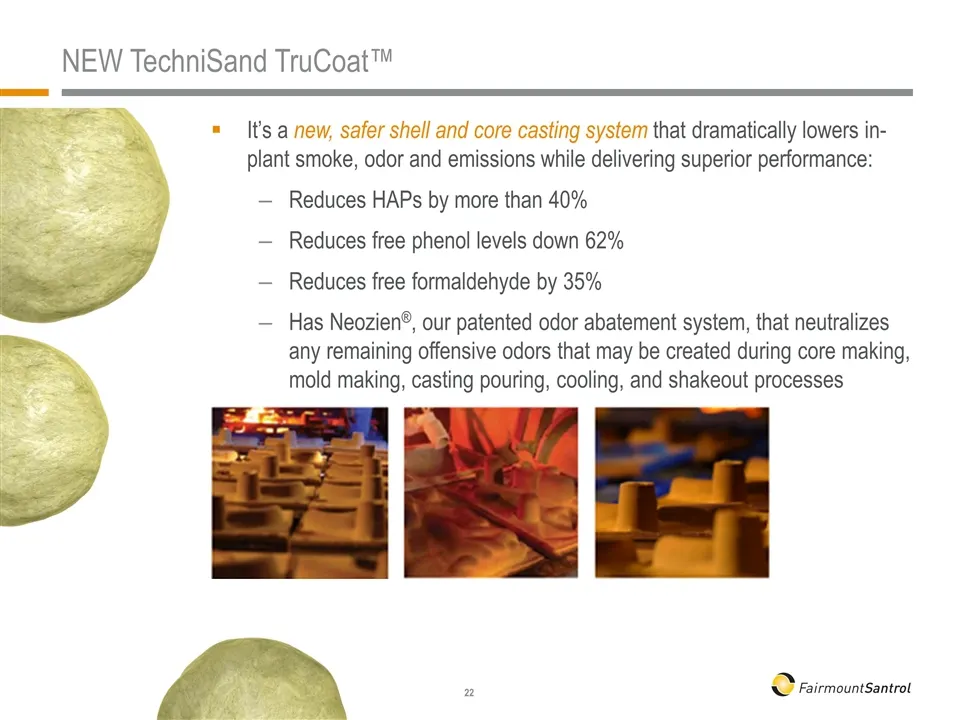
NEW TechniSand TruCoat™ It’s a new, safer shell and core casting system that dramatically lowers in-plant smoke, odor and emissions while delivering superior performance: Reduces HAPs by more than 40% Reduces free phenol levels down 62% Reduces free formaldehyde by 35% Has Neozien®, our patented odo
Slide 24: Low-Iron, High-Purity Silica Sand for Glassmaking
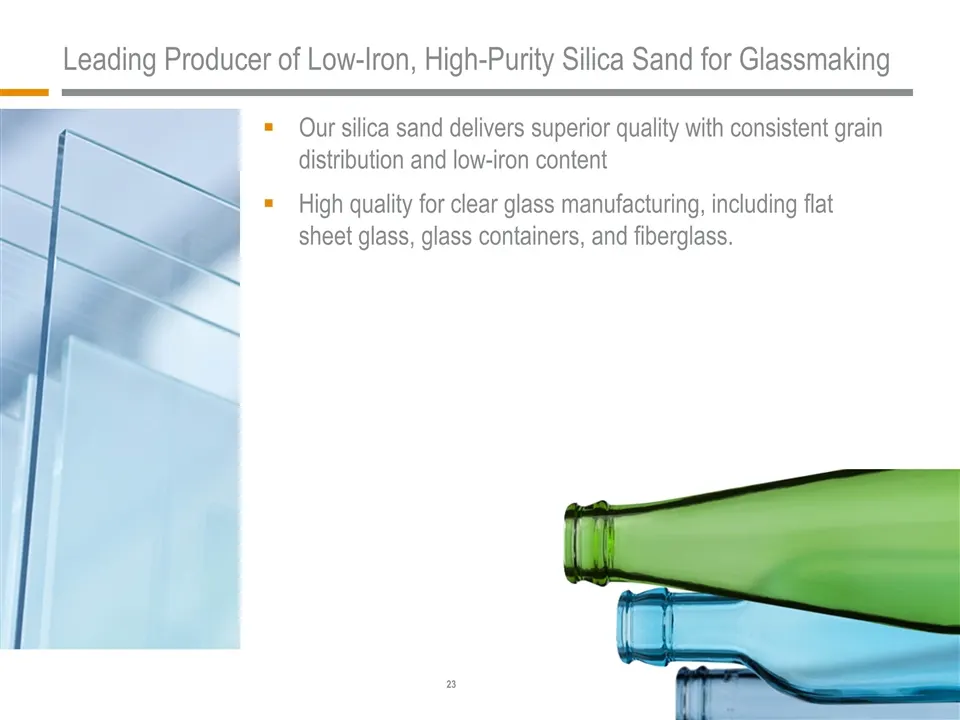
Our silica sand delivers superior quality with consistent grain distribution and low-iron content High quality for clear glass manufacturing, including flat sheet glass, glass containers, and fiberglass. Leading Producer of Low-Iron, High-Purity Silica Sand for Glassmaking
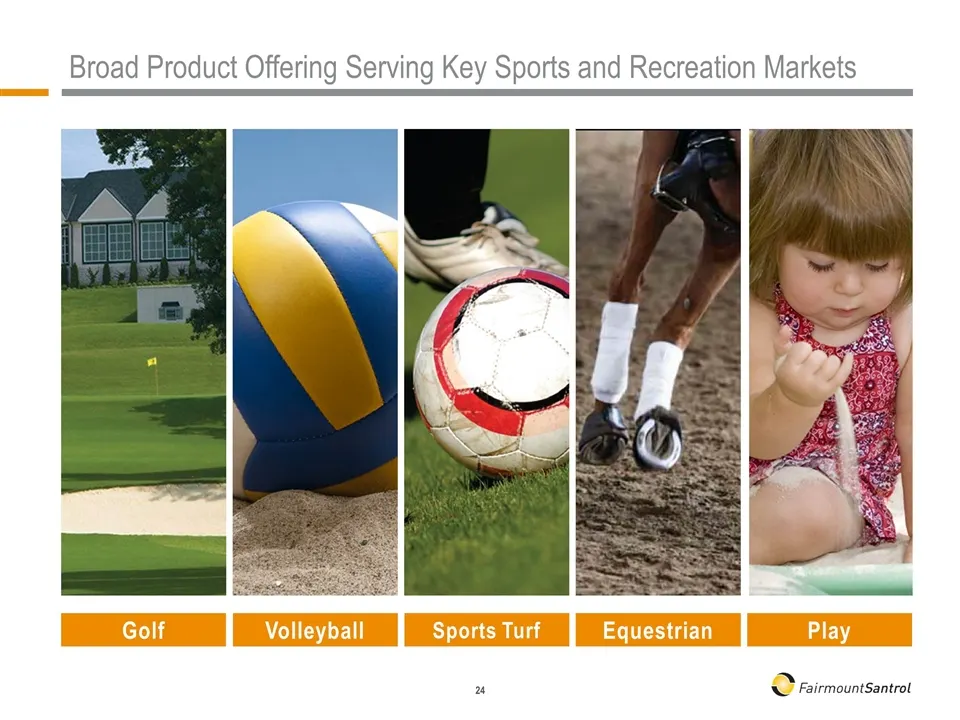
Slide 25: Sports and Recreation Markets
Broad Product Offering Serving Key Sports and Recreation Markets Golf Volleyball Sports Turf Equestrian Play
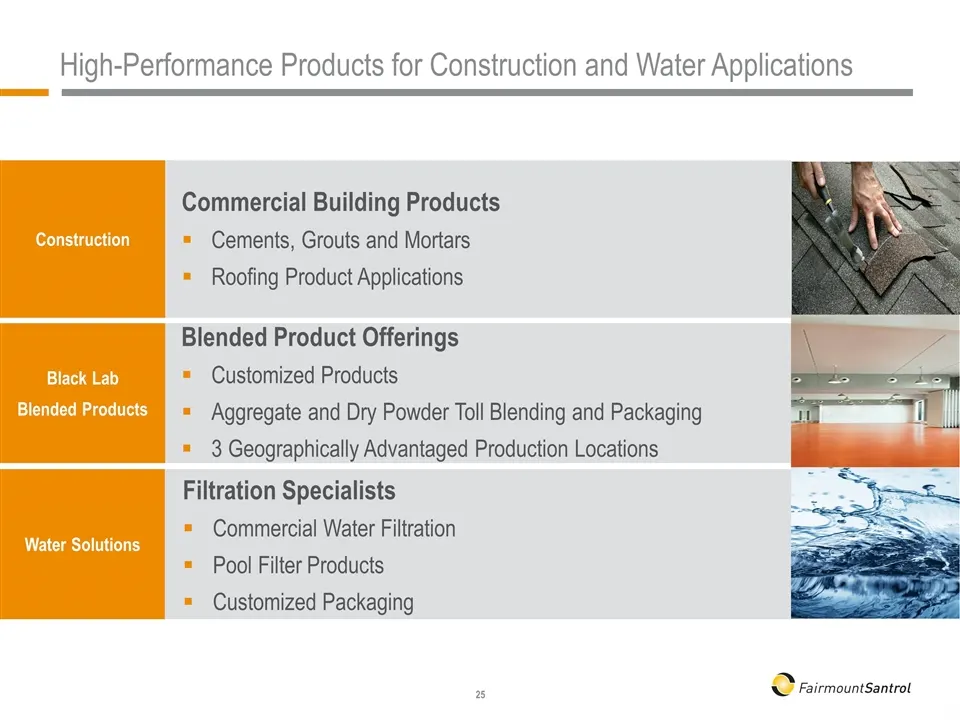
Slide 26: Commercial Building Products and Water Solutions
Commercial Building Products Cements, Grouts and Mortars Roofing Product Applications Filtration Specialists Commercial Water Filtration Pool Filter Products Customized Packaging Construction Black Lab Blended Products Water Solutions Blended Product Offerings Customized Products Aggregate and Dry P
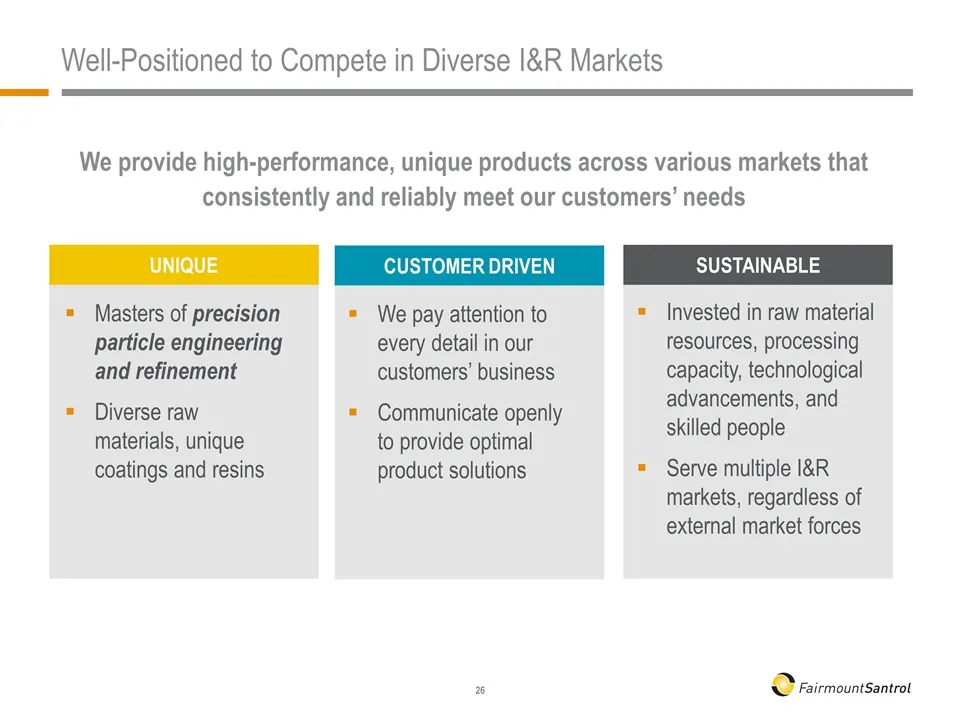
Slide 27: Well-Positioned to Compete in Diverse I&R Markets
Well-Positioned to Compete in Diverse I&R Markets Unique Customer Driven Sustainable Masters of precision particle engineering and refinement Diverse raw materials, unique coatings and resins We pay attention to every detail in our customers’ business Communicate openly to provide optimal product so
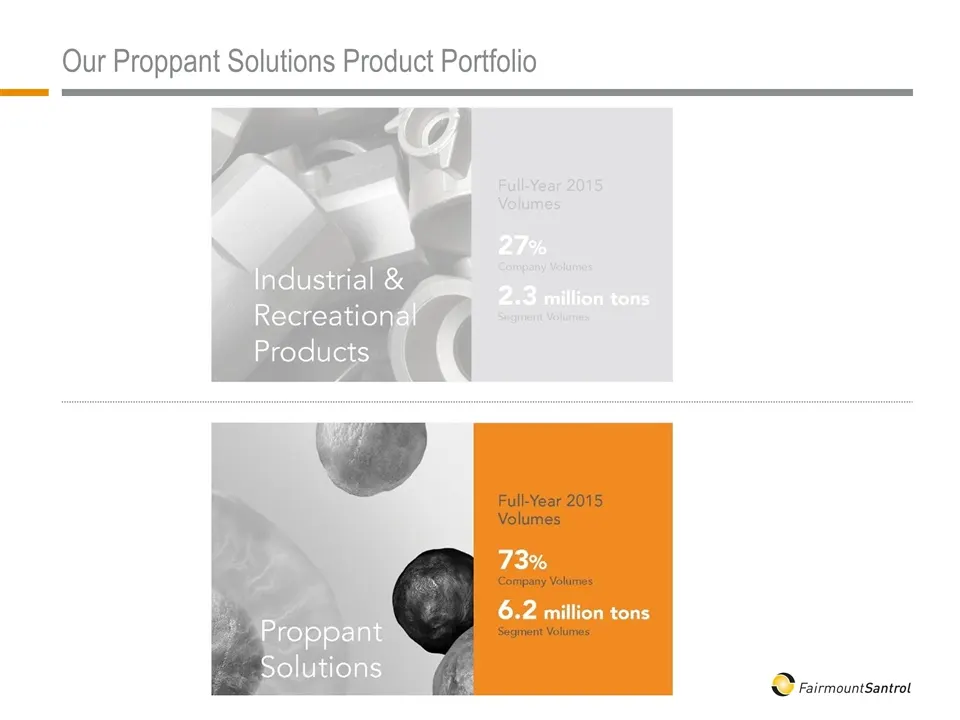
Slide 28: Our Proppant Solutions Product Portfolio
Our Proppant Solutions Product Portfolio
Slide 29: Broad Proppant Solutions Product Portfolio
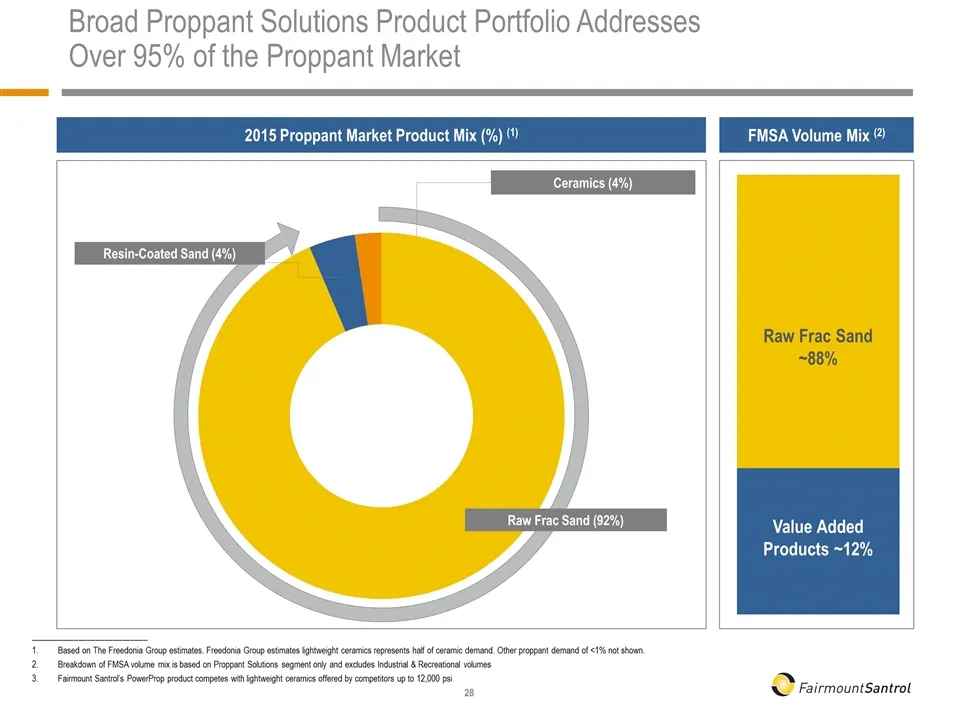
Broad Proppant Solutions Product Portfolio Addresses Over 95% of the Proppant Market 2015 Proppant Market Product Mix (%) (1) FMSA Volume Mix (2) Raw Frac Sand ~88% Value Added Products ~12% Raw Frac Sand (92%) Resin-Coated Sand (4%) Ceramics (4%) ___________________________ 1. Based on The Freedoni
Slide 30: Application Products to Address All Well Environments
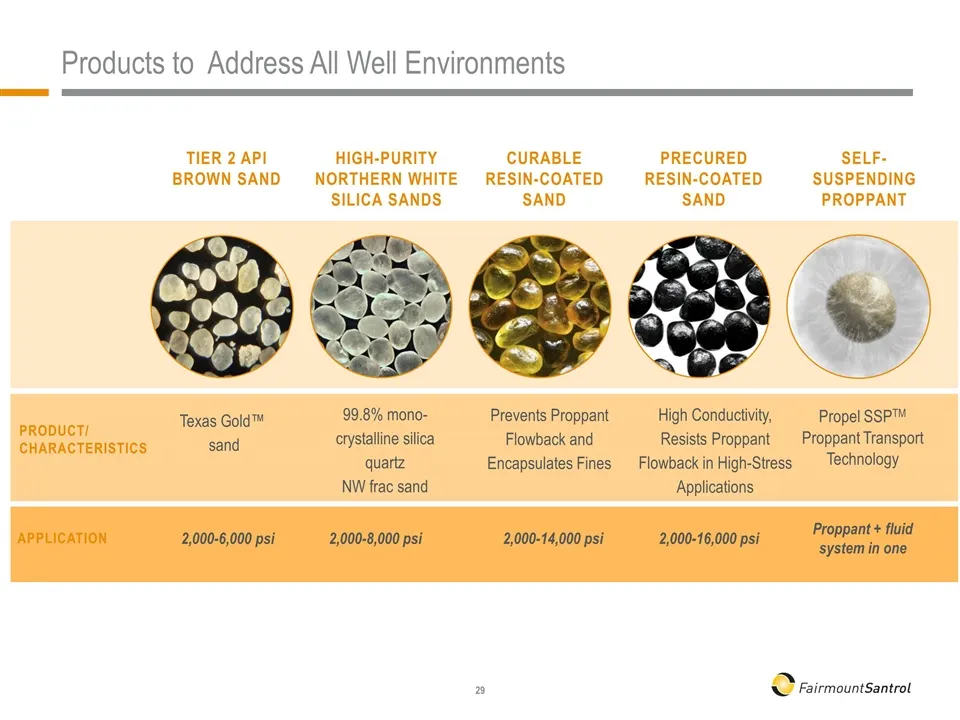
High-Purity Northern White Silica Sands Texas Gold™ sand Precured Resin-Coated Sand High Conductivity, Resists Proppant Flowback in High-Stress Applications Curable Resin-Coated Sand Prevents Proppant Flowback and Encapsulates Fines Self-Suspending Proppant Propel SSPTM Proppant Transport Technology
Slide 31: Innovation – Products and Processes
Innovation – Products and Processes George Magaud Executive Vice President & Chief Strategy & Innovation Officer
Slide 32: Technology and Innovation Capabilities
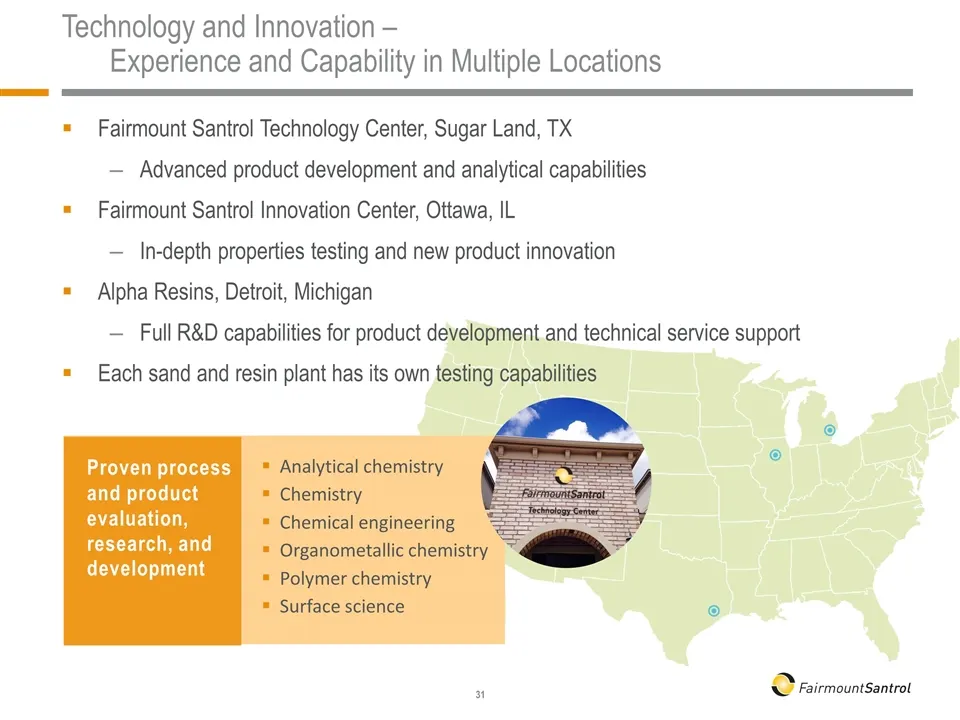
Technology and Innovation – Experience and Capability in Multiple Locations Fairmount Santrol Technology Center, Sugar Land, TX Advanced product development and analytical capabilities Fairmount Santrol Innovation Center, Ottawa, IL In-depth properties testing and new product innovation Alpha Resins
Slide 33: Propel SSP – Patented Proppant Transport Solution
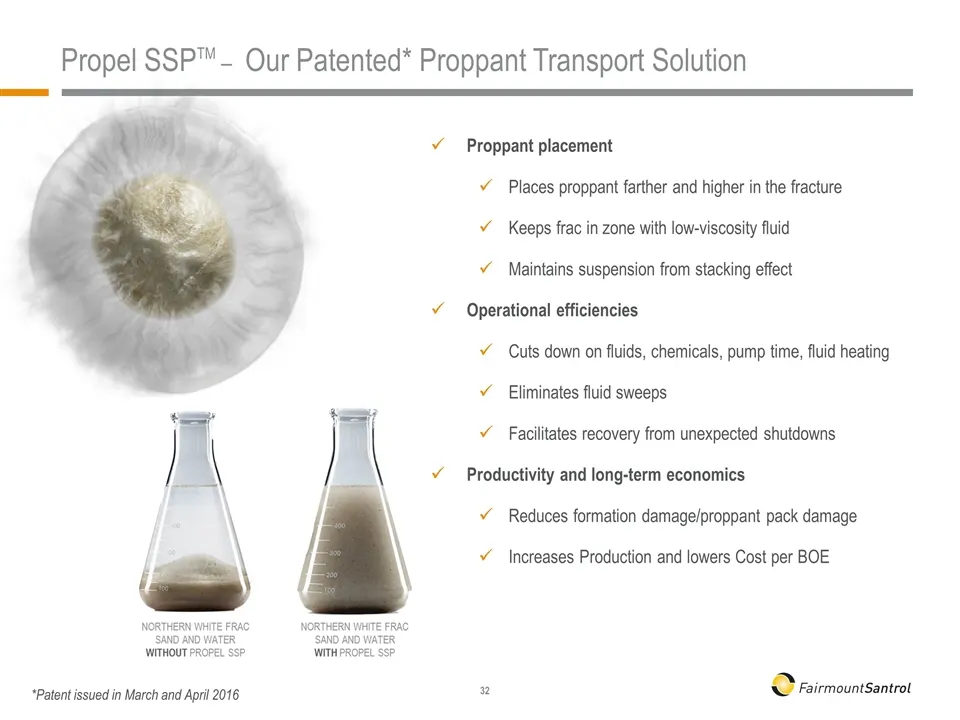
Propel SSPTM – Our Patented* Proppant Transport Solution Proppant placement Places proppant farther and higher in the fracture Keeps frac in zone with low-viscosity fluid Maintains suspension from stacking effect Operational efficiencies Cuts down on fluids, chemicals, pump time, fluid heating Elimi
Slide 34: Better Proppant Distribution
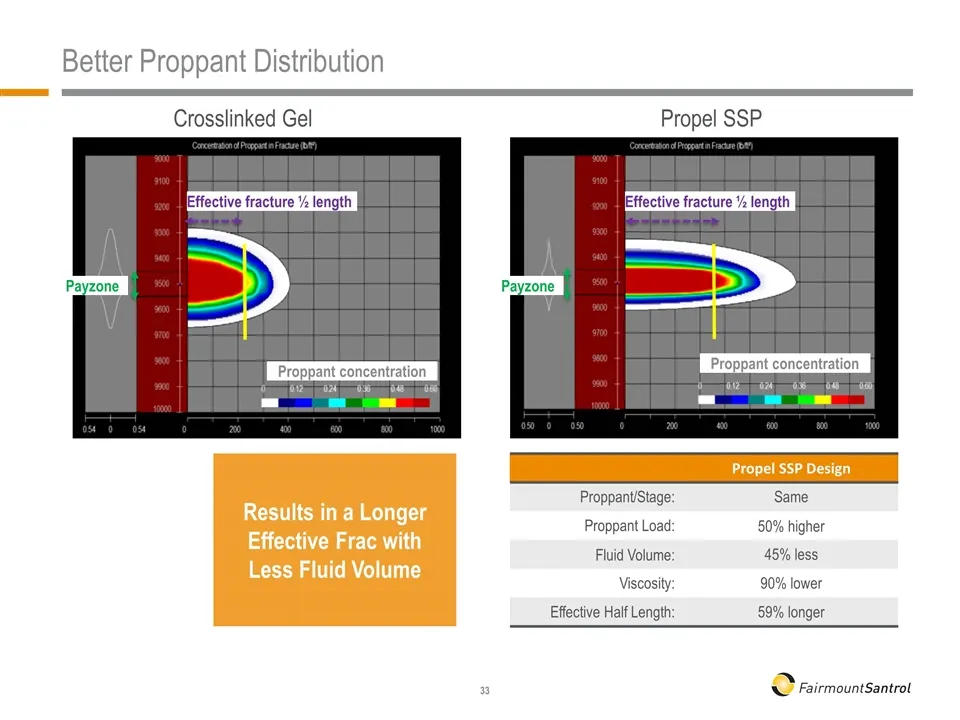
Better Proppant Distribution Propel SSP Crosslinked Gel Propel SSP Design Proppant/Stage: Same Proppant Load: 50% higher Fluid Volume: 45% less Viscosity: 90% lower Effective Half Length: 59% longer Effective fracture ½ length Payzone Payzone Effective fracture ½ length Proppant concentration Proppa
Slide 35: First Self-Suspending Proppant: Proven Performance Across Basins
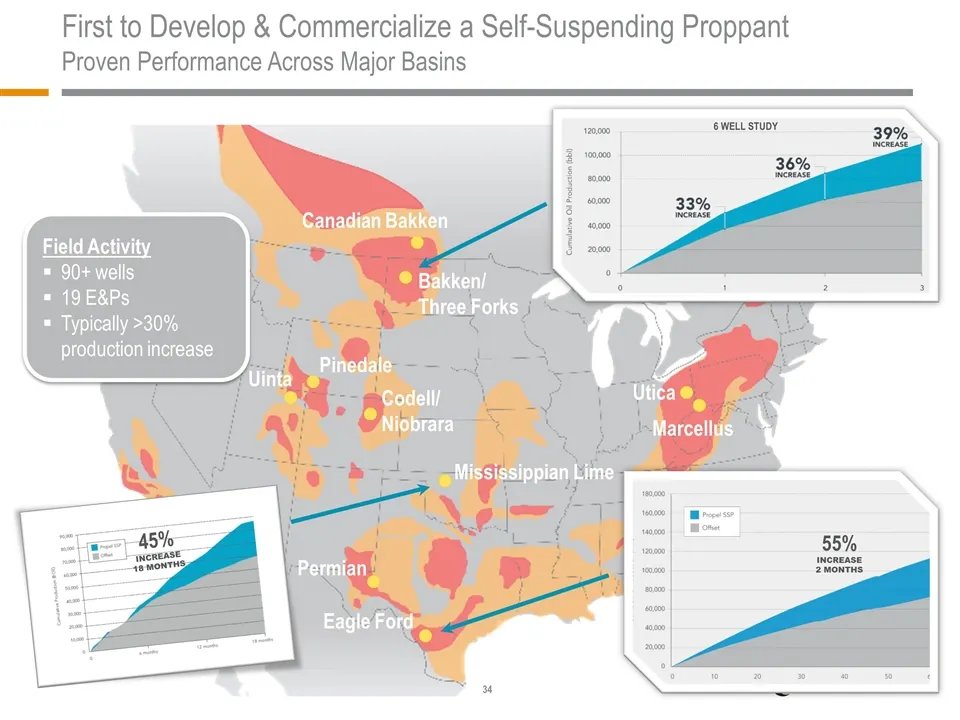
First to Develop & Commercialize a Self-Suspending Proppant Proven Performance Across Major Basins Field Activity 90+ wells 19 E&Ps Typically >30% production increase Bakken/ Three Forks Canadian Bakken Codell/ Niobrara Mississippian Lime Utica Marcellus Eagle Ford Uinta Permian 55% INCREASE 2 MONTH
Slide 36: Process Innovation
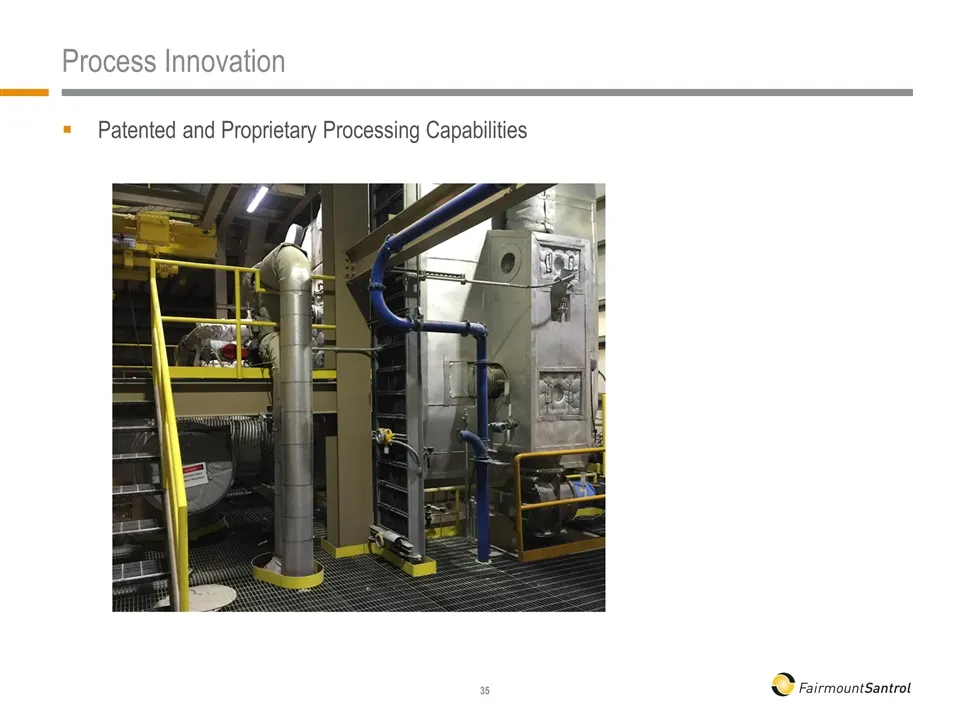
Process Innovation Patented and Proprietary Processing Capabilities
Slide 37: Operations
Operations Dan Gerber Executive Vice President, Operations
Slide 38: Broad Operational Scale and Efficiency
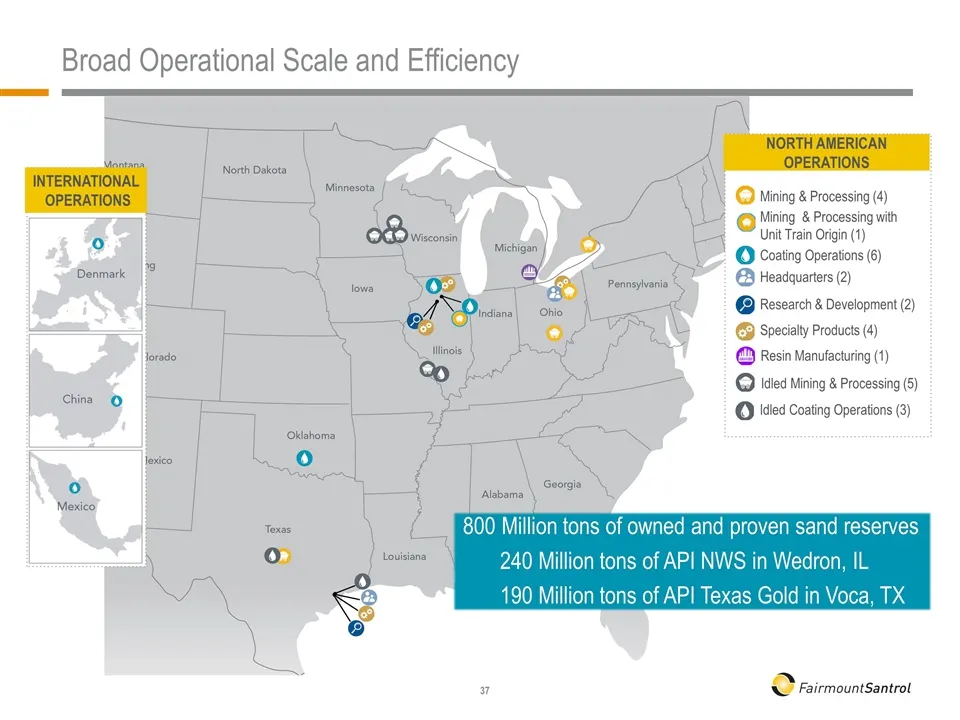
Coating Operations (6) Mining & Processing (4) NORTH AMERICAN OPERATIONS Mining & Processing with Unit Train Origin (1) Headquarters (2) INTERNATIONAL OPERATIONS Research & Development (2) Specialty Products (4) Resin Manufacturing (1) Idled Mining & Processing (5) Idled Coating Operations (3) Broad
Slide 39: Wedron, IL Facility Expansion
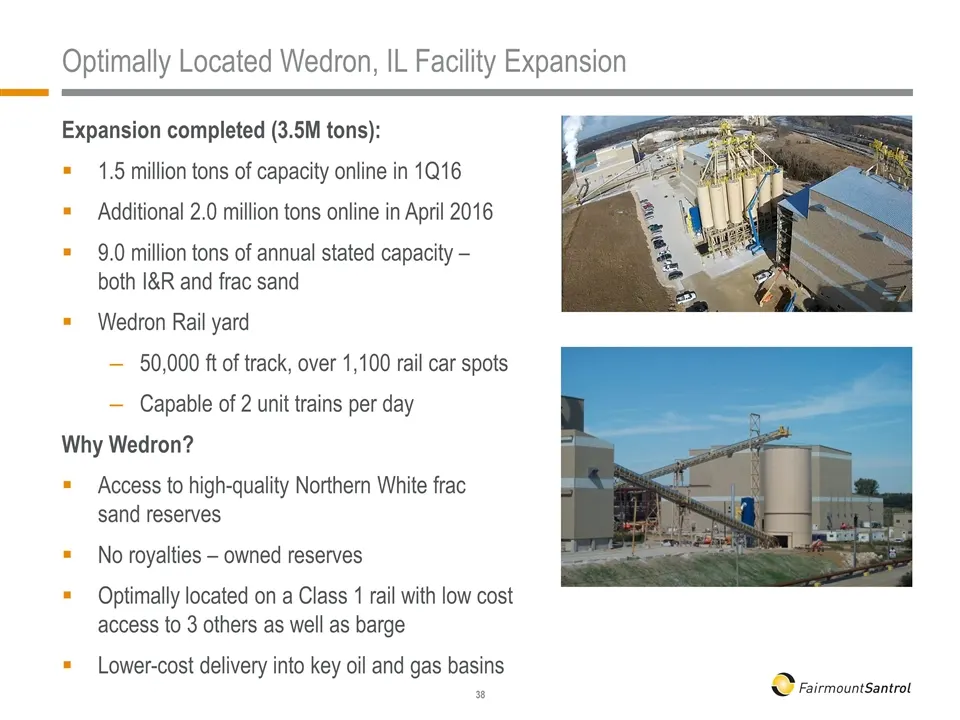
Optimally Located Wedron, IL Facility Expansion Expansion completed (3.5M tons): 1.5 million tons of capacity online in 1Q16 Additional 2.0 million tons online in April 2016 9.0 million tons of annual stated capacity – both I&R and frac sand Wedron Rail yard 50,000 ft of track, over 1,100 rail car s
Slide 40: High-Quality API Voca Sand Operation
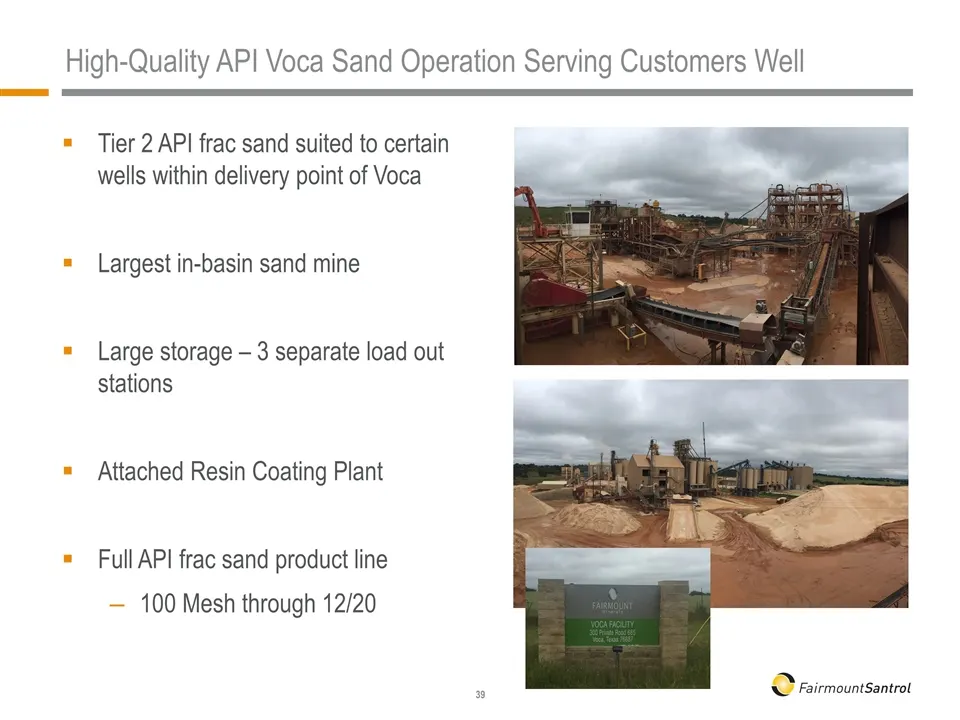
High-Quality API Voca Sand Operation Serving Customers Well Tier 2 API frac sand suited to certain wells within delivery point of Voca Largest in-basin sand mine Large storage – 3 separate load out stations Attached Resin Coating Plant Full API frac sand product line 100 Mesh through 12/20
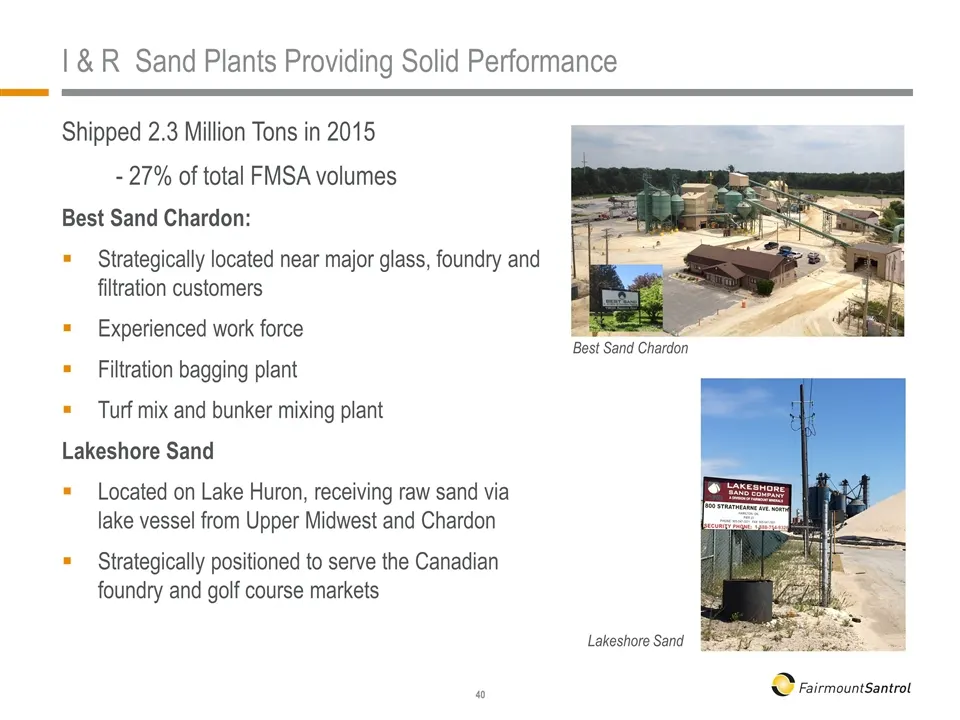
Slide 41: I&R Sand Plants
I & R Sand Plants Providing Solid Performance Shipped 2.3 Million Tons in 2015 - 27% of total FMSA volumes Best Sand Chardon: Strategically located near major glass, foundry and filtration customers Experienced work force Filtration bagging plant Turf mix and bunker mixing plant Lakeshore Sand Locat
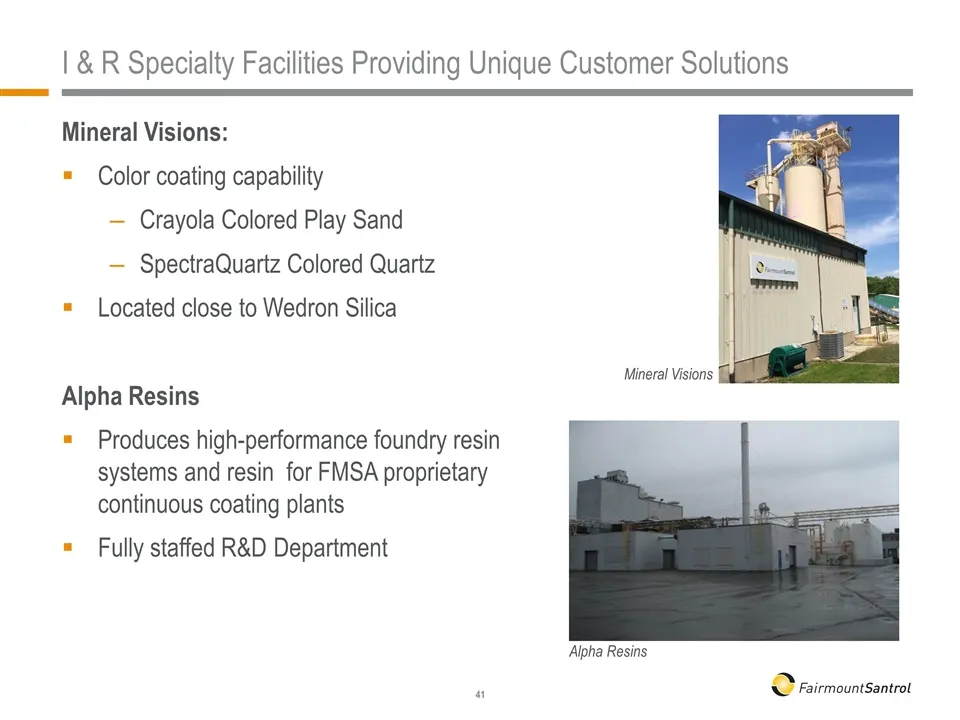
Slide 42: I&R Specialty Facilities
I & R Specialty Facilities Providing Unique Customer Solutions Mineral Visions: Color coating capability Crayola Colored Play Sand SpectraQuartz Colored Quartz Located close to Wedron Silica Alpha Resins Produces high-performance foundry resin systems and resin for FMSA proprietary continuous coatin
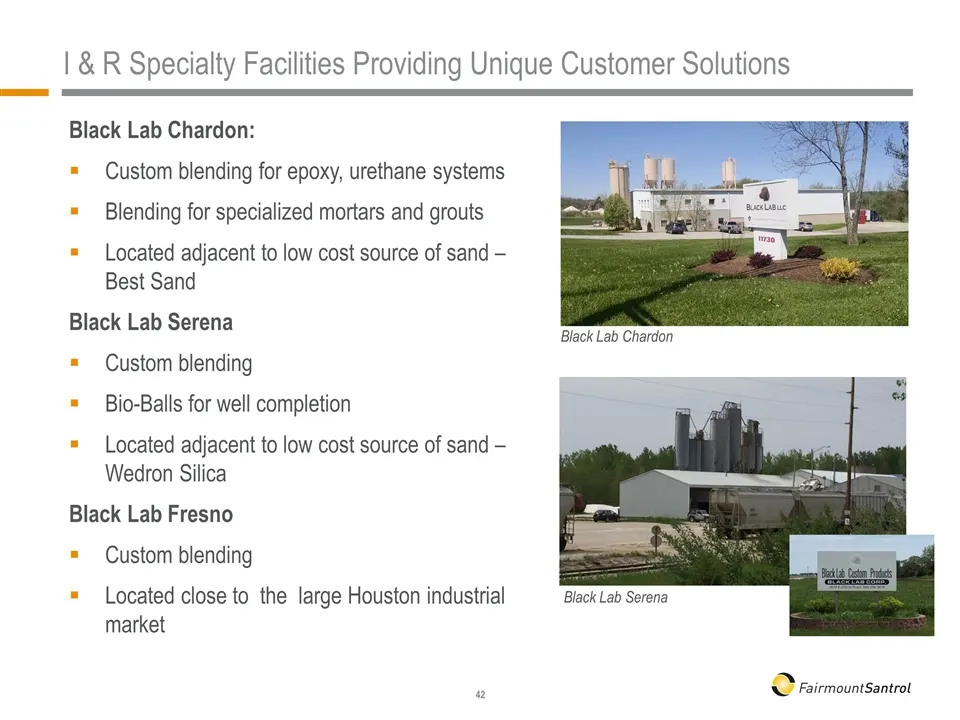
Slide 43: Black Lab Specialty Facilities
Black Lab Chardon: Custom blending for epoxy, urethane systems Blending for specialized mortars and grouts Located adjacent to low cost source of sand – Best Sand Black Lab Serena Custom blending Bio-Balls for well completion Located adjacent to low cost source of sand – Wedron Silica Black Lab Fres
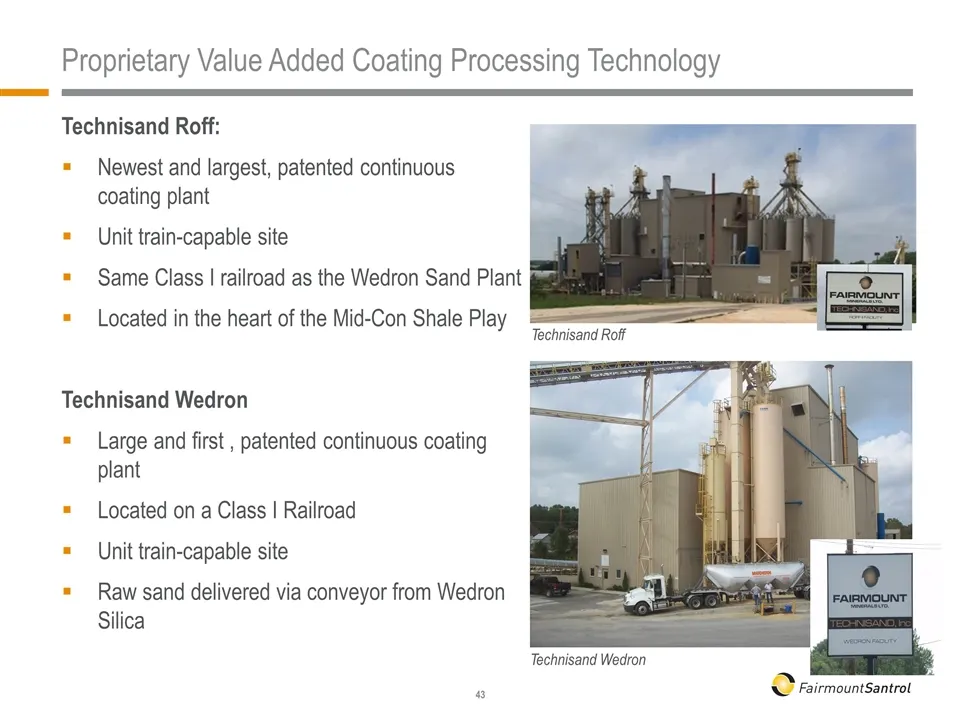
Slide 44: Proprietary Value Added Coating Processing Technology
Proprietary Value Added Coating Processing Technology Technisand Roff: Newest and largest, patented continuous coating plant Unit train-capable site Same Class I railroad as the Wedron Sand Plant Located in the heart of the Mid-Con Shale Play Technisand Wedron Large and first , patented continuous c
Slide 45: Consolidating Operations Into a More Cost-Effective Footprint
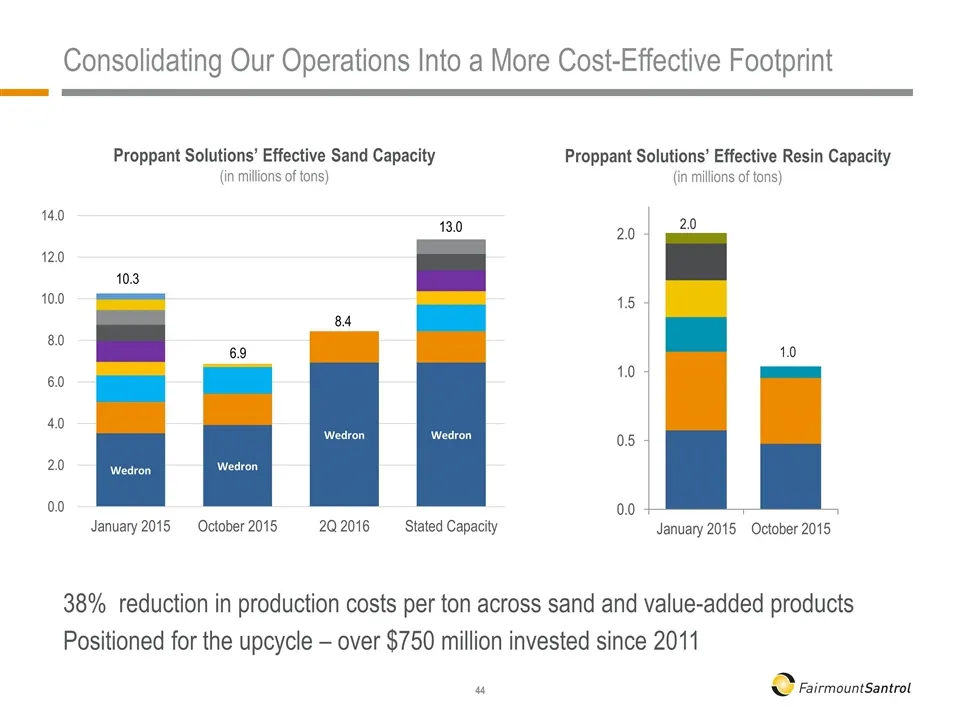
Consolidating Our Operations Into a More Cost-Effective Footprint 38% reduction in production costs per ton across sand and value-added products Positioned for the upcycle – over $750 million invested since 2011 Proppant Solutions’ Effective Sand Capacity (in millions of tons) Proppant Solutions’ Ef
Slide 46: Distribution/Supply Chain
Distribution/Supply Chain Jerry Clancey Executive Vice President & Chief Commercial Officer
Slide 47: Key Distribution Assets
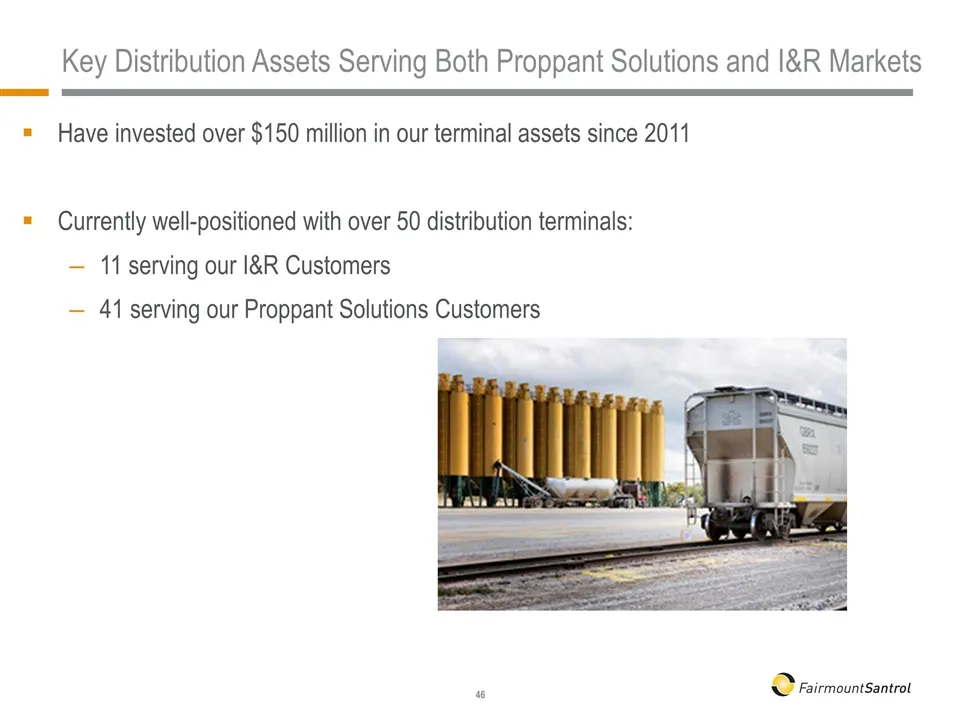
Key Distribution Assets Serving Both Proppant Solutions and I&R Markets Have invested over $150 million in our terminal assets since 2011 Currently well-positioned with over 50 distribution terminals: 11 serving our I&R Customers 41 serving our Proppant Solutions Customers
Slide 48: Broad Unit Train Capabilities – Origins, Destinations
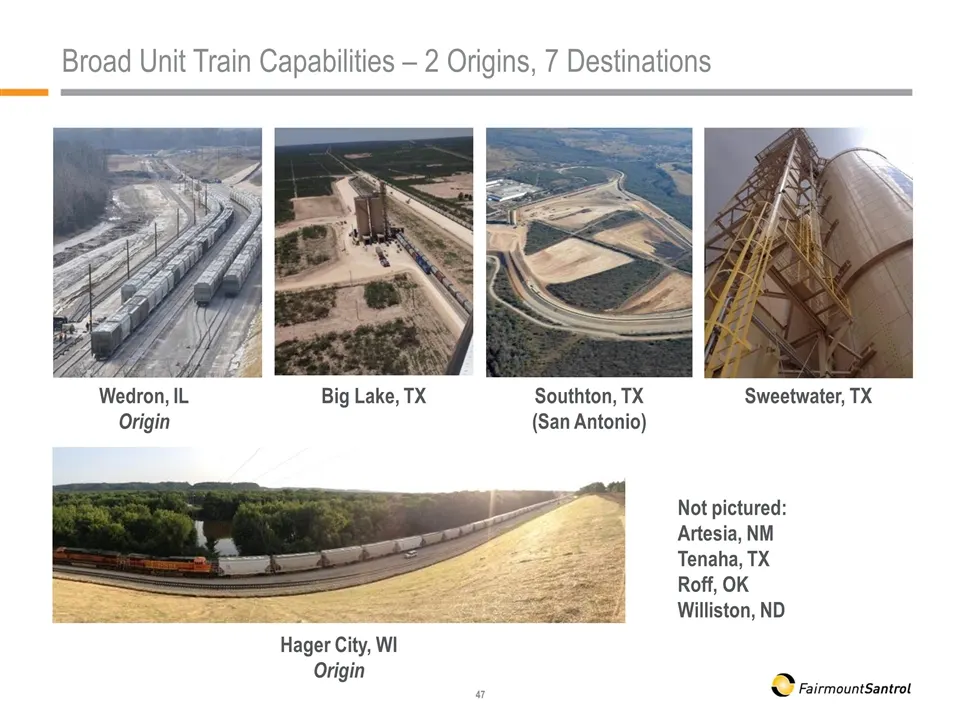
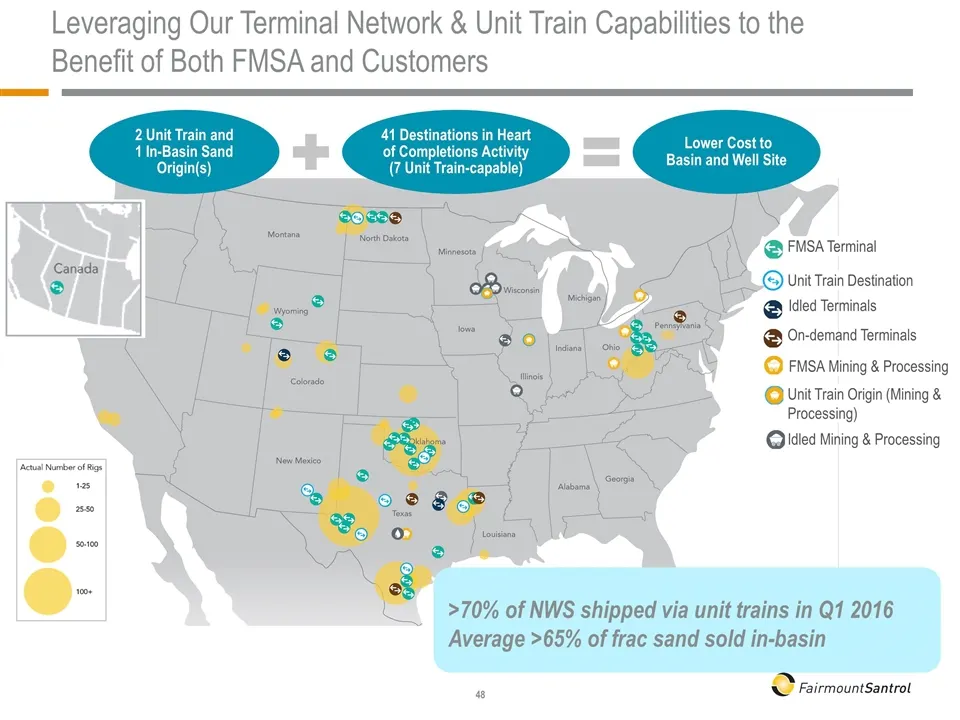
Broad Unit Train Capabilities – 2 Origins, 7 Destinations Sweetwater, TX Big Lake, TX Hager City, WI Origin Wedron, IL Origin Southton, TX (San Antonio) Not pictured: Artesia, NM Tenaha, TX Roff, OK Williston, ND
Slide 49: Leveraging Terminal Network & Unit Train Capabilities
FMSA Terminal FMSA Mining & Processing Unit Train Destination Unit Train Origin (Mining & Processing) Leveraging Our Terminal Network & Unit Train Capabilities to the Benefit of Both FMSA and Customers Idled Terminals Idled Mining & Processing On-demand Terminals >70% of NWS shipped via unit trains
Slide 50: Progress in Rail Car Fleet Overhang
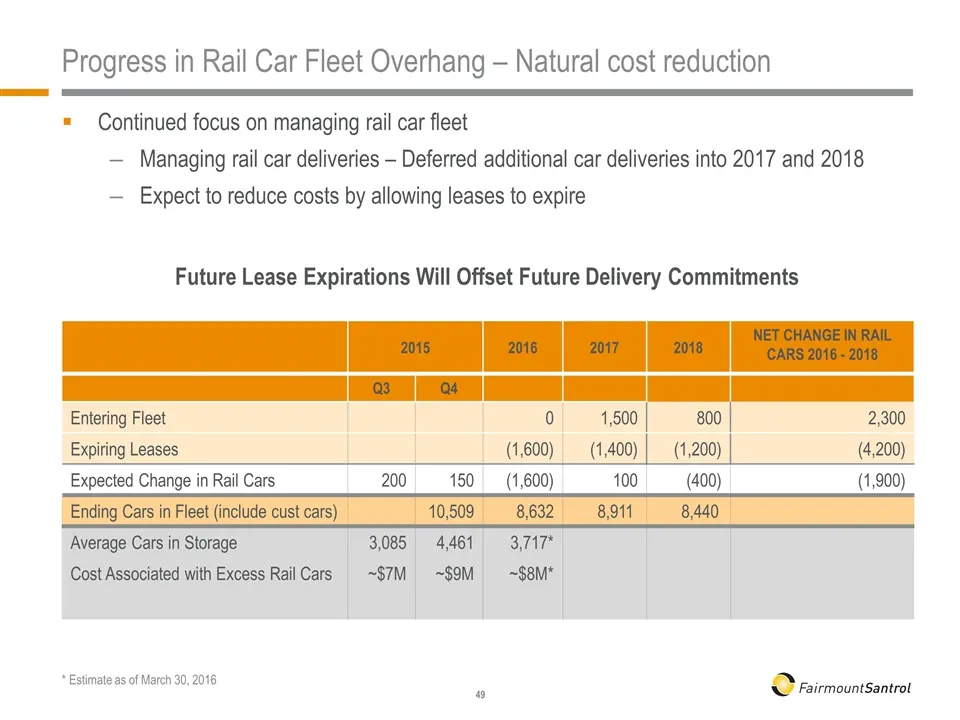
Progress in Rail Car Fleet Overhang – Natural cost reduction Continued focus on managing rail car fleet Managing rail car deliveries – Deferred additional car deliveries into 2017 and 2018 Expect to reduce costs by allowing leases to expire Future Lease Expirations Will Offset Future Delivery Commit
Slide 51: Proppant Solutions Market Review and Outlook
Proppant Solutions Market Review and Outlook George Magaud Executive Vice President & Chief Strategy & Innovation Officer
Slide 52: Proppant Tailwinds & Our Historical Investments
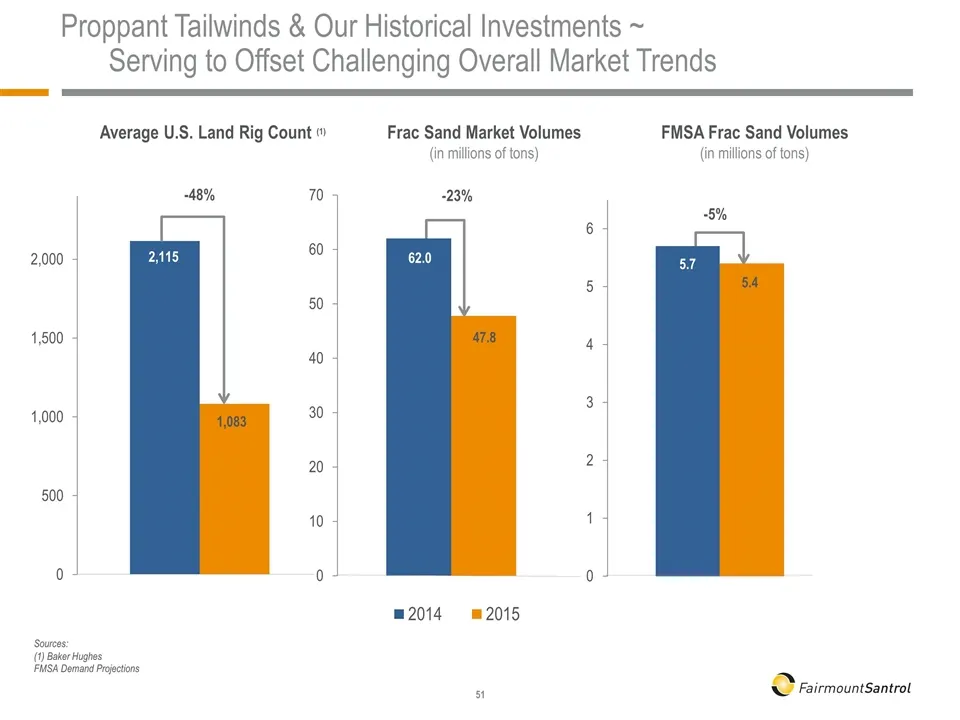
Proppant Tailwinds & Our Historical Investments ~ Serving to Offset Challenging Overall Market Trends -48% Sources: (1) Baker Hughes FMSA Demand Projections FMSA Frac Sand Volumes (in millions of tons) Average U.S. Land Rig Count (1) Frac Sand Market Volumes (in millions of tons) -23%
Slide 53: E&Ps Making Tradeoffs Between Short-Term Cost and Well Economics
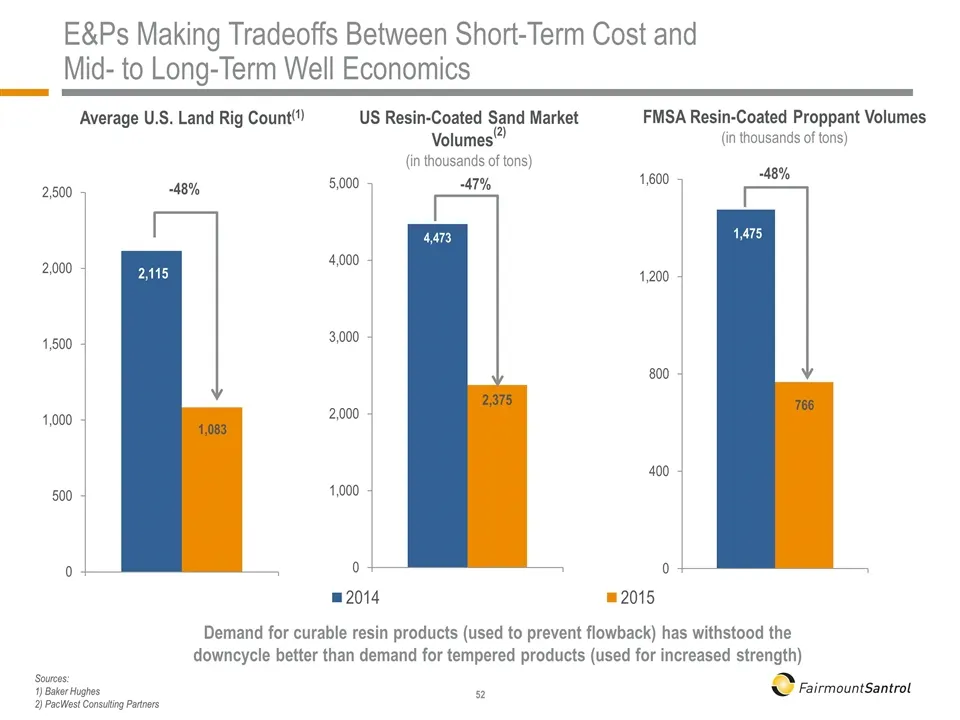
E&Ps Making Tradeoffs Between Short-Term Cost and Mid- to Long-Term Well Economics US Resin-Coated Sand Market Volumes(2) (in thousands of tons) Average U.S. Land Rig Count(1) -48% -48% FMSA Resin-Coated Proppant Volumes (in thousands of tons) -47% Sources: 1) Baker Hughes 2) PacWest Consulting Part
Slide 54: US Land Rig Count Forecast
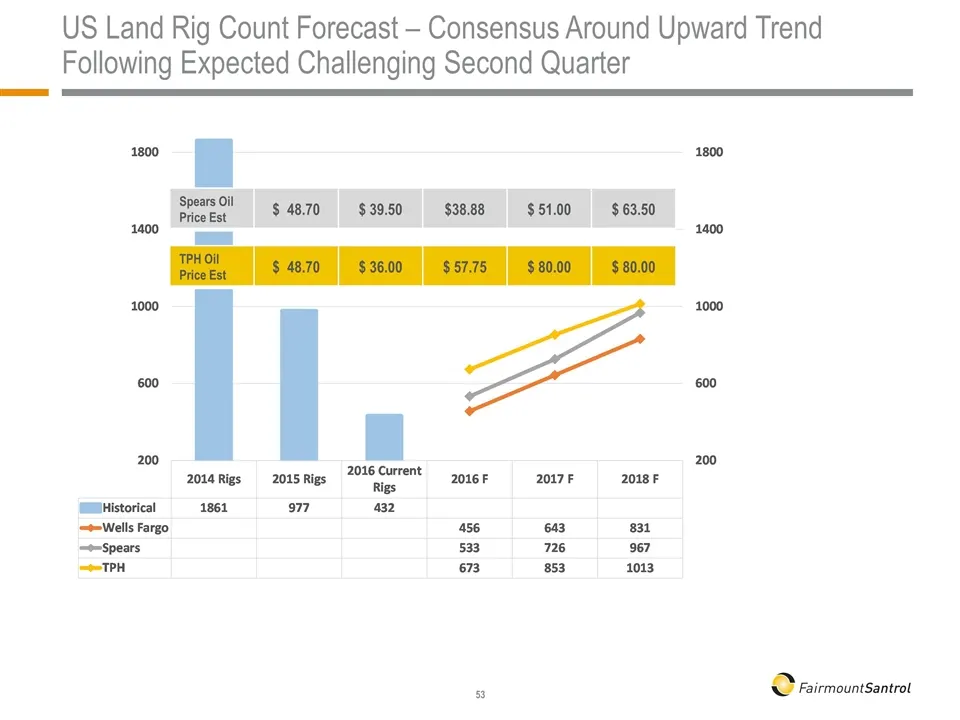
US Land Rig Count Forecast – Consensus Around Upward Trend Following Expected Challenging Second Quarter Spears Oil Price Est $ 48.70 $ 39.50 $38.88 $ 51.00 $ 63.50 TPH Oil Price Est $ 48.70 $ 36.00 $ 57.75 $ 80.00 $ 80.00
Slide 55: Continued Tailwinds: Proppant Intensity and DUCs
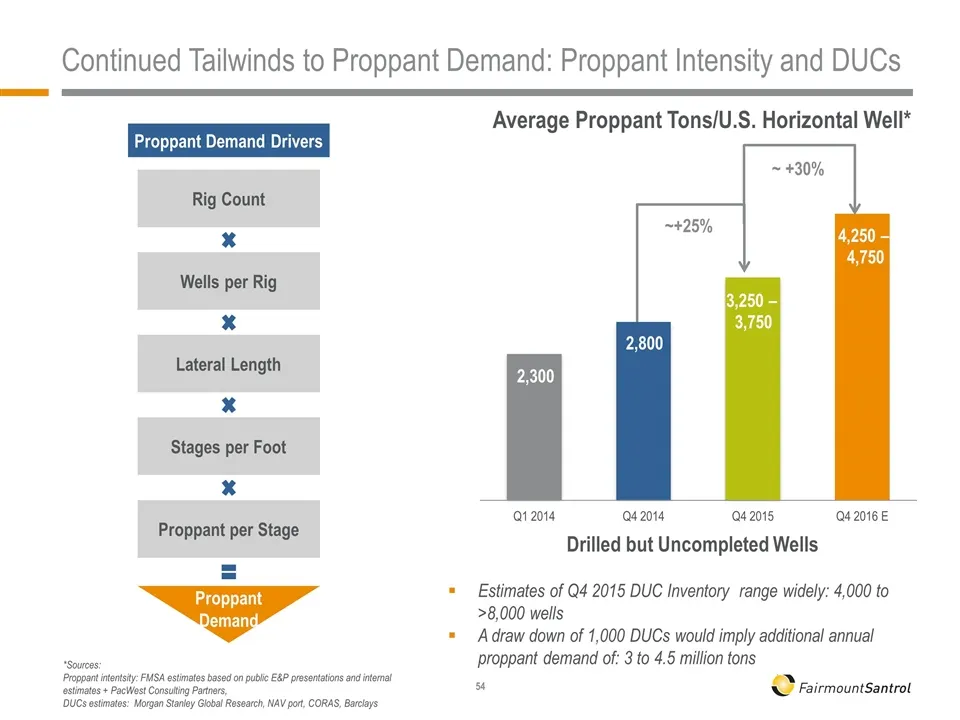
Continued Tailwinds to Proppant Demand: Proppant Intensity and DUCs *Sources: Proppant intentsity: FMSA estimates based on public E&P presentations and internal estimates + PacWest Consulting Partners, DUCs estimates: Morgan Stanley Global Research, NAV port, CORAS, Barclays ~ +30% Average Proppant
Slide 56: 2016 Outlook for Proppant Market
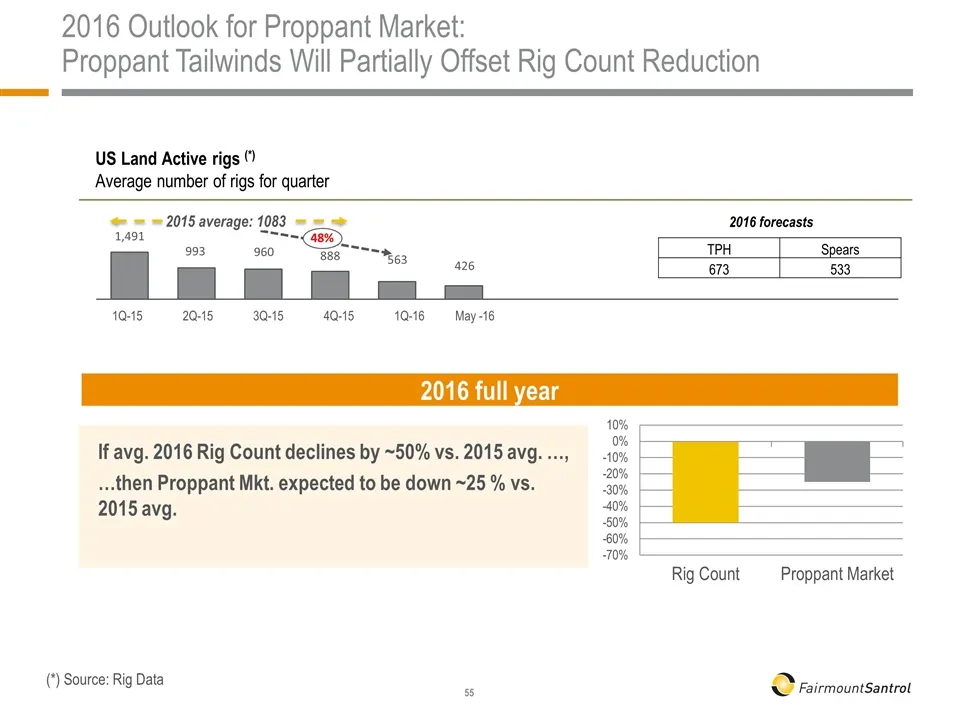
2016 Outlook for Proppant Market: Proppant Tailwinds Will Partially Offset Rig Count Reduction US Land Active rigs (*) Average number of rigs for quarter 2016 forecasts 48% 4Q-15 1Q-16 3Q-15 1Q-15 2Q-15 TPH Spears 673 533 (*) Source: Rig Data 2015 average: 1083 If avg. 2016 Rig Count declines by ~50
Slide 57: Financial Update
Financial Update Michael Biehl Executive Vice President & Chief Financial Officer
Slide 58: Solid Performance in Turbulent Market
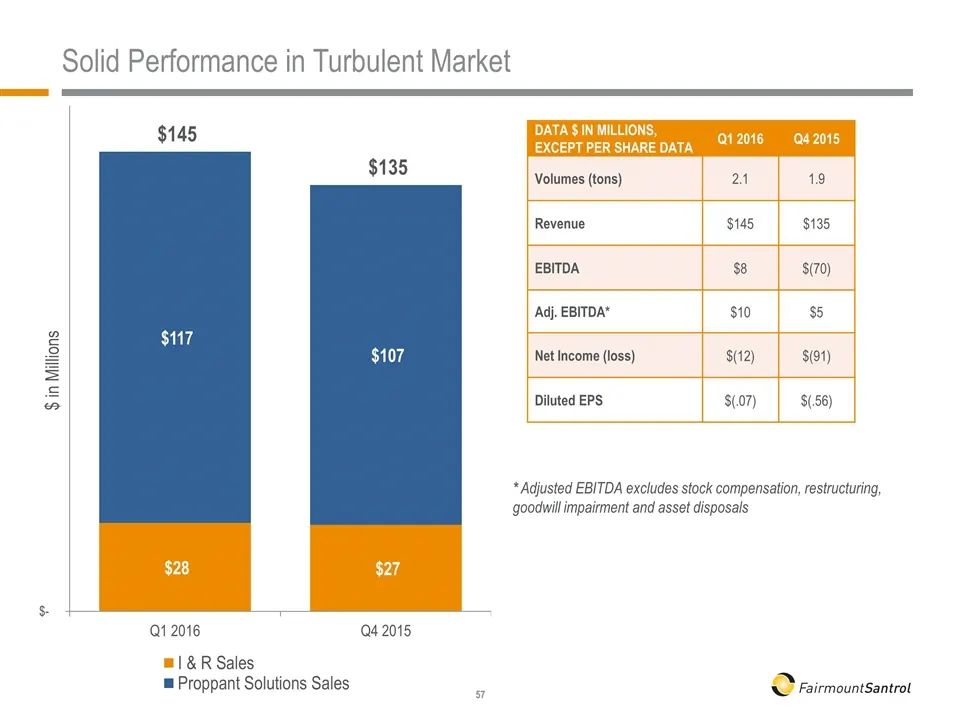
Solid Performance in Turbulent Market DATA $ IN MILLIONS, EXCEPT PER SHARE DATA Q1 2016 Q4 2015 Volumes (tons) 2.1 1.9 Revenue $145 $135 EBITDA $8 $(70) Adj. EBITDA* $10 $5 Net Income (loss) $(12) $(91) Diluted EPS $(.07) $(.56) * Adjusted EBITDA excludes stock compensation, restructuring, goodwill
Slide 59: Effectively Managing Our Cost Structure
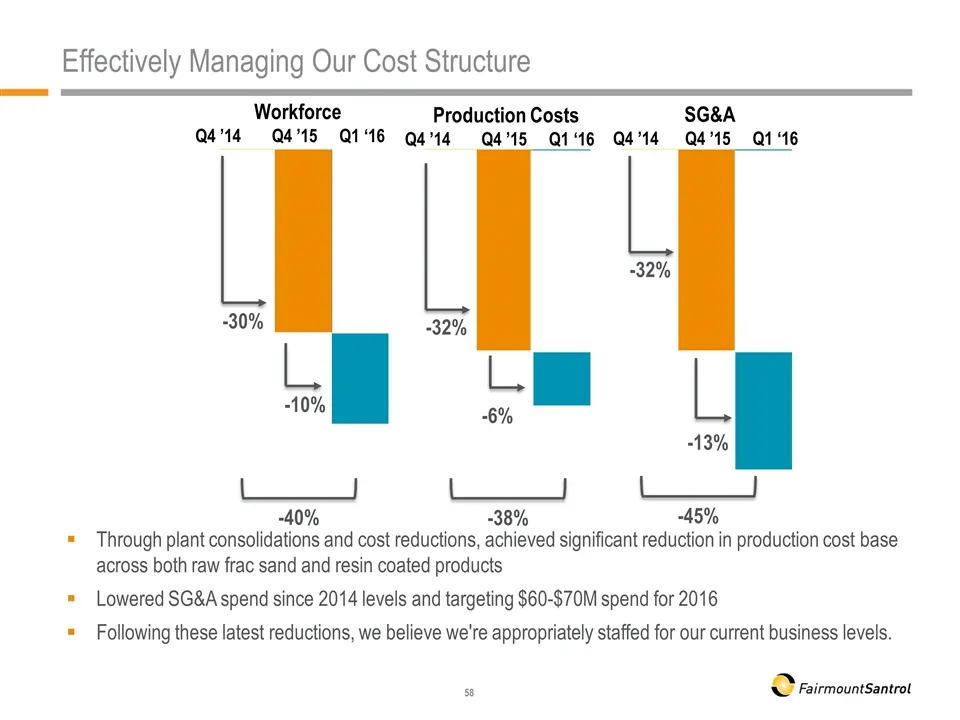
Effectively Managing Our Cost Structure Through plant consolidations and cost reductions, achieved significant reduction in production cost base across both raw frac sand and resin coated products Lowered SG&A spend since 2014 levels and targeting $60-$70M spend for 2016 Following these latest reduc
Slide 60: Gained Liquidity and Flexibility with B1 Extension
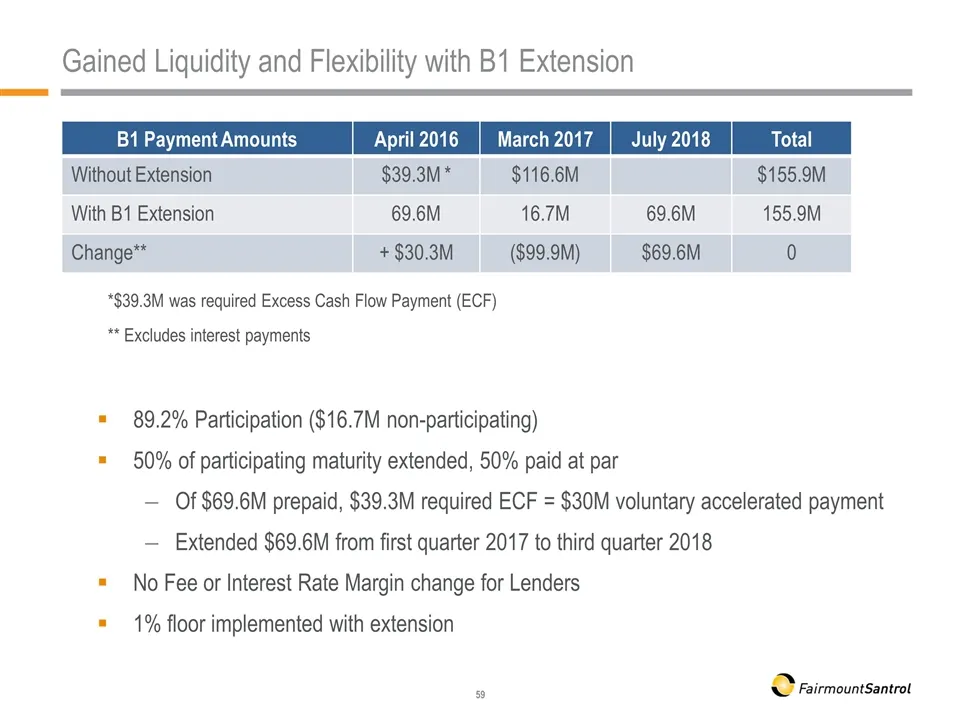
Gained Liquidity and Flexibility with B1 Extension 89.2% Participation ($16.7M non-participating) 50% of participating maturity extended, 50% paid at par Of $69.6M prepaid, $39.3M required ECF = $30M voluntary accelerated payment Extended $69.6M from first quarter 2017 to third quarter 2018 No Fee o
Slide 61: Revised Debt Payments Provide Near-Term Relief
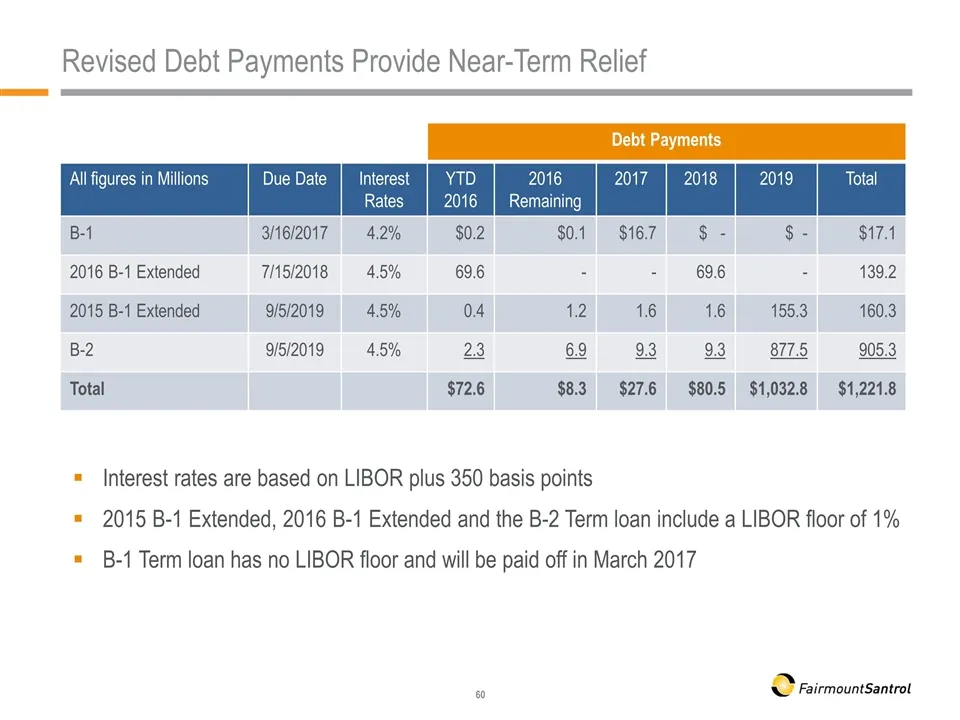
Revised Debt Payments Provide Near-Term Relief Interest rates are based on LIBOR plus 350 basis points 2015 B-1 Extended, 2016 B-1 Extended and the B-2 Term loan include a LIBOR floor of 1% B-1 Term loan has no LIBOR floor and will be paid off in March 2017 Debt Payments All figures in Millions Due
Slide 62: Continued Focus on Improving Liquidity
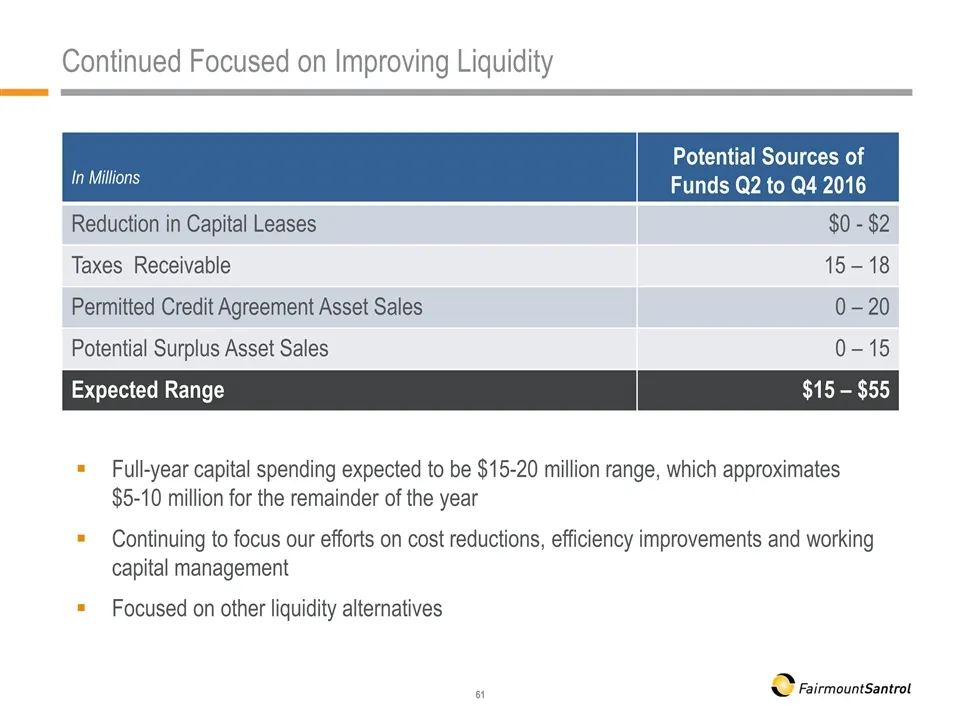
Continued Focused on Improving Liquidity Full-year capital spending expected to be $15-20 million range, which approximates $5-10 million for the remainder of the year Continuing to focus our efforts on cost reductions, efficiency improvements and working capital management Focused on other liquidit
Slide 63: Conclusion
Conclusion Jenniffer Deckard President & CEO
Slide 64: Positioned to Compete in All Market Cycles
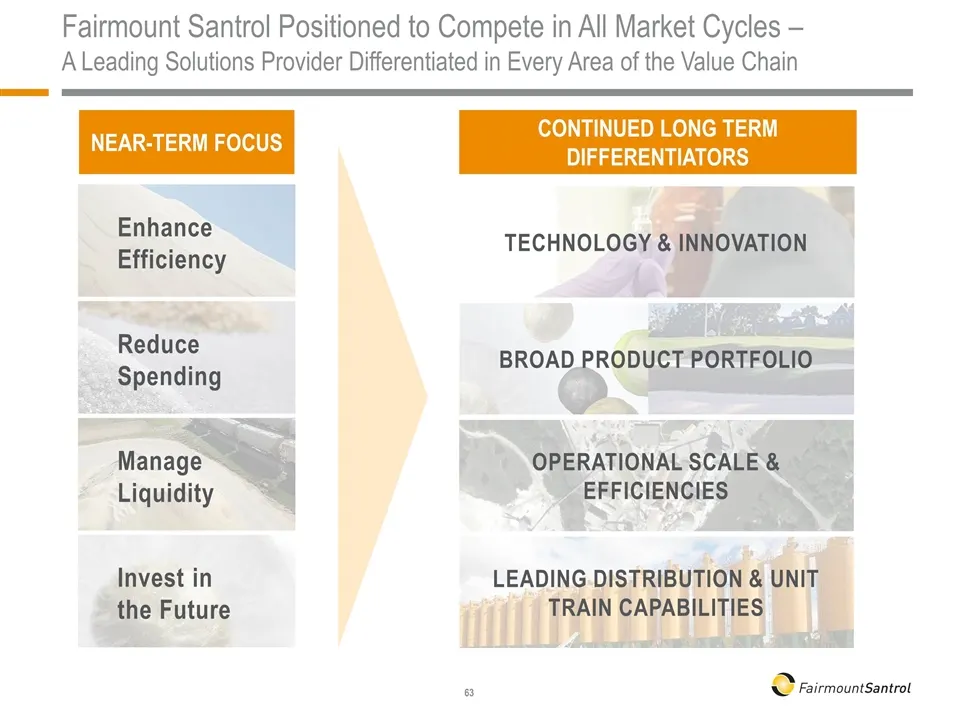
Enhance Efficiency Reduce Spending Manage Liquidity Invest in the Future Fairmount Santrol Positioned to Compete in All Market Cycles – A Leading Solutions Provider Differentiated in Every Area of the Value Chain NEAR-TERM FOCUS CONTINUED LONG TERM DIFFERENTIATORS Technology & Innovation Broad Produ
Slide 65: Q&A
Q&A DesooD yy 8 FairmountSantrol
Slide 66: Wedron Overview/Safety
Wedron Overview/Safety Dan Gerber Executive Vice President, Operations
Slide 67: FMSA Safety Highlights and Milestone
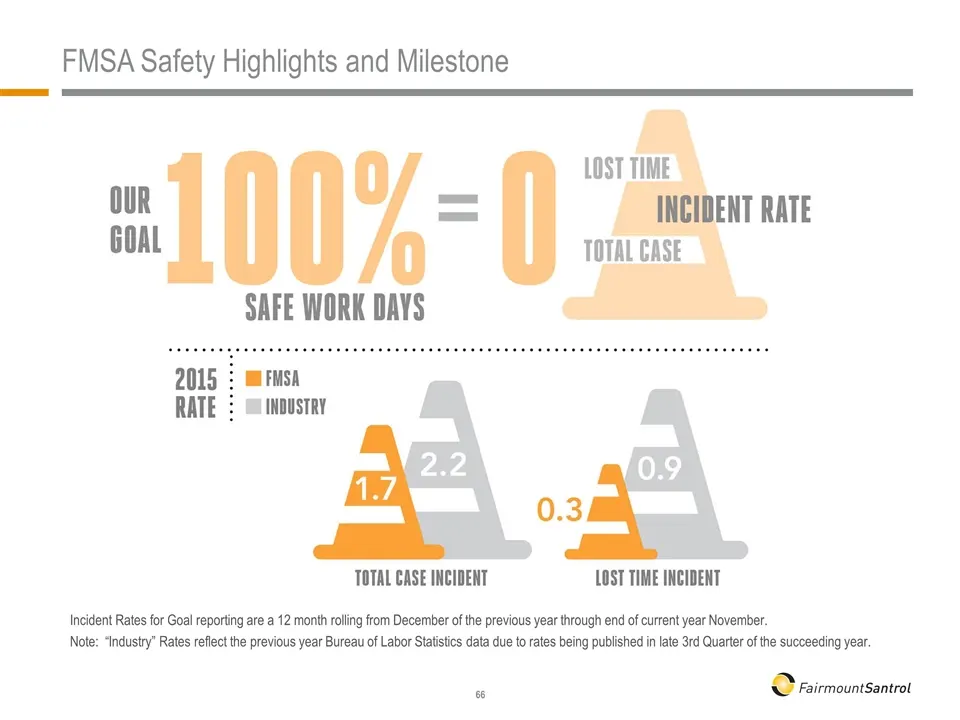
FMSA Safety Highlights and Milestone Incident Rates for Goal reporting are a 12 month rolling from December of the previous year through end of current year November. Note: “Industry” Rates reflect the previous year Bureau of Labor Statistics data due to rates being published in late 3rd Quarter of
Slide 68: All In for Safety – At Work and At Home
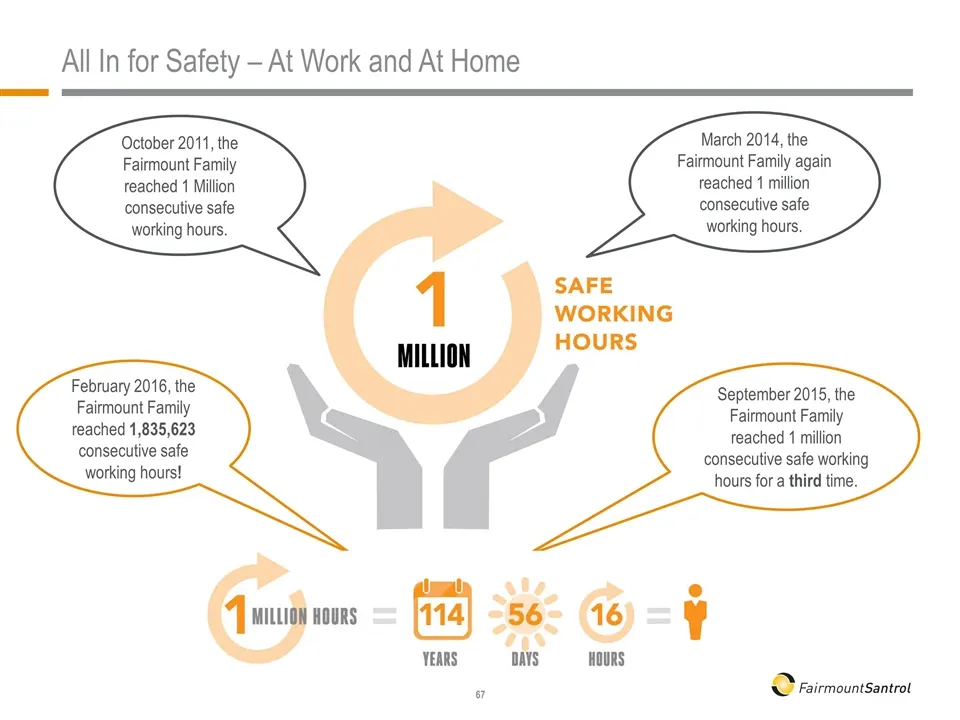
All In for Safety – At Work and At Home October 2011, the Fairmount Family reached 1 Million consecutive safe working hours. September 2015, the Fairmount Family reached 1 million consecutive safe working hours for a third time. March 2014, the Fairmount Family again reached 1 million consecutive sa
Slide 69: Wedron Overview
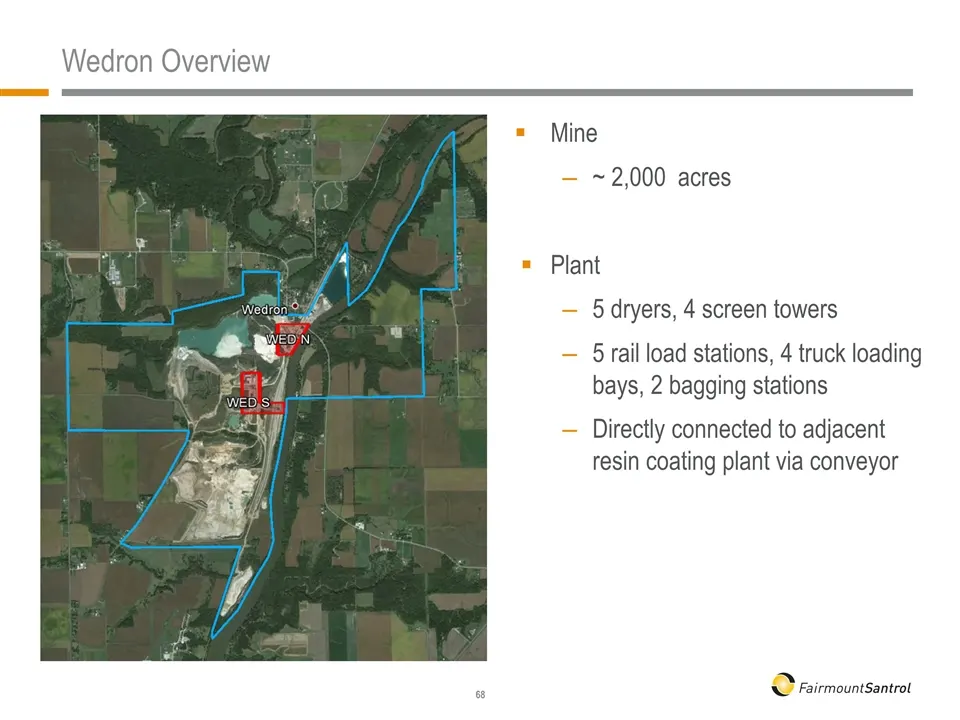
Wedron Overview Mine ~ 2,000 acres Plant 5 dryers, 4 screen towers 5 rail load stations, 4 truck loading bays, 2 bagging stations Directly connected to adjacent resin coating plant via conveyor
Slide 70: Safety Training
Safety Training Wedron Silica currently has 1,960 Consecutive Safe Working Days Wedron Silica currently has 1.2 Million Consecutive Safe Working Hours Link to “Hazard Training” video
Slide 71: Thank You and Tour
Thank You and Tour www.FairmountSantrol.com
Slide 72: Appendix
Appendix 8 FairmountSantrol
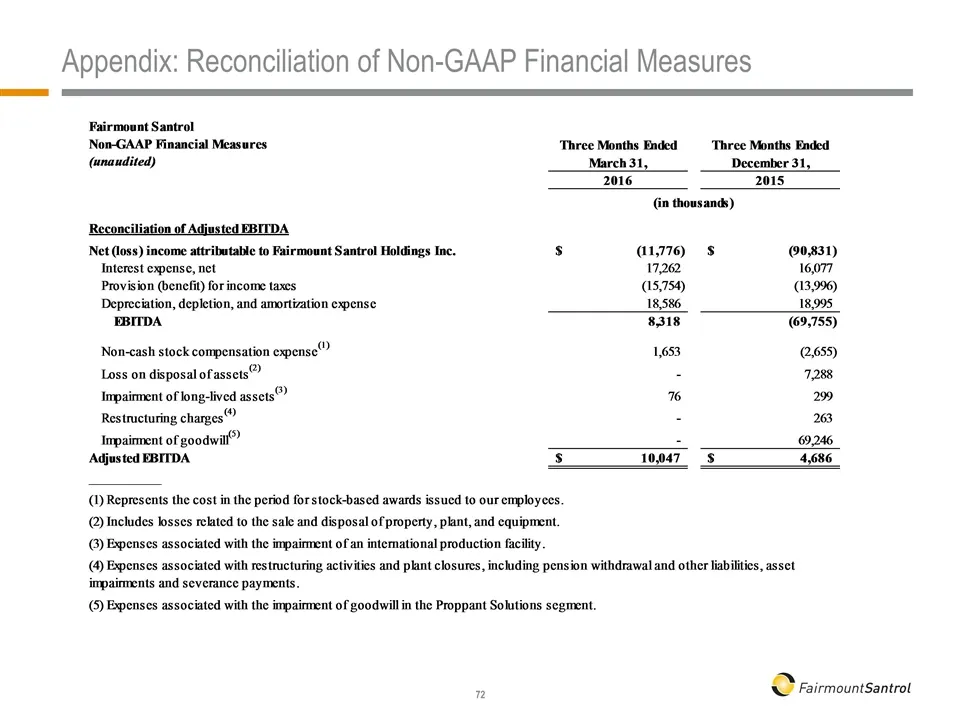
Slide 73: Appendix: Reconciliation of Non-GAAP Financial Measures
Appendix: Reconciliation of Non-GAAP Financial Measures
Source: SEC EDGAR · 8-K filed May 18, 2016
More decks from Fairmount Santrol Holdings Inc
 Merger or Acquisition (May 2018)44 slides · May 15, 2018
 Merger or Acquisition (May 2018)44 slides · May 9, 2018
 Debt Investor Presentation (May 2018)62 slides · May 8, 2018
 Merger or Acquisition (March 2018)31 slides · Mar 26, 2018
 Merger or Acquisition (January 2018)42 slides · Jan 3, 2018
 Merger or Acquisition (December 2017)26 slides · Dec 12, 2017