Raute Oyj Class A · OMXHEX:RAUTE
Raute Oyj Class A — Q3 2006 Earnings Presentation
28 slides from Raute Oyj Class A's earnings presentation, Oct 25, 2006
Slide 1: Interim report 1 January - 30 September 2006
Interim report 1 January - 30 September 2006 25 October 2006 Tapani Kiiski, President and CEO www.raute.com
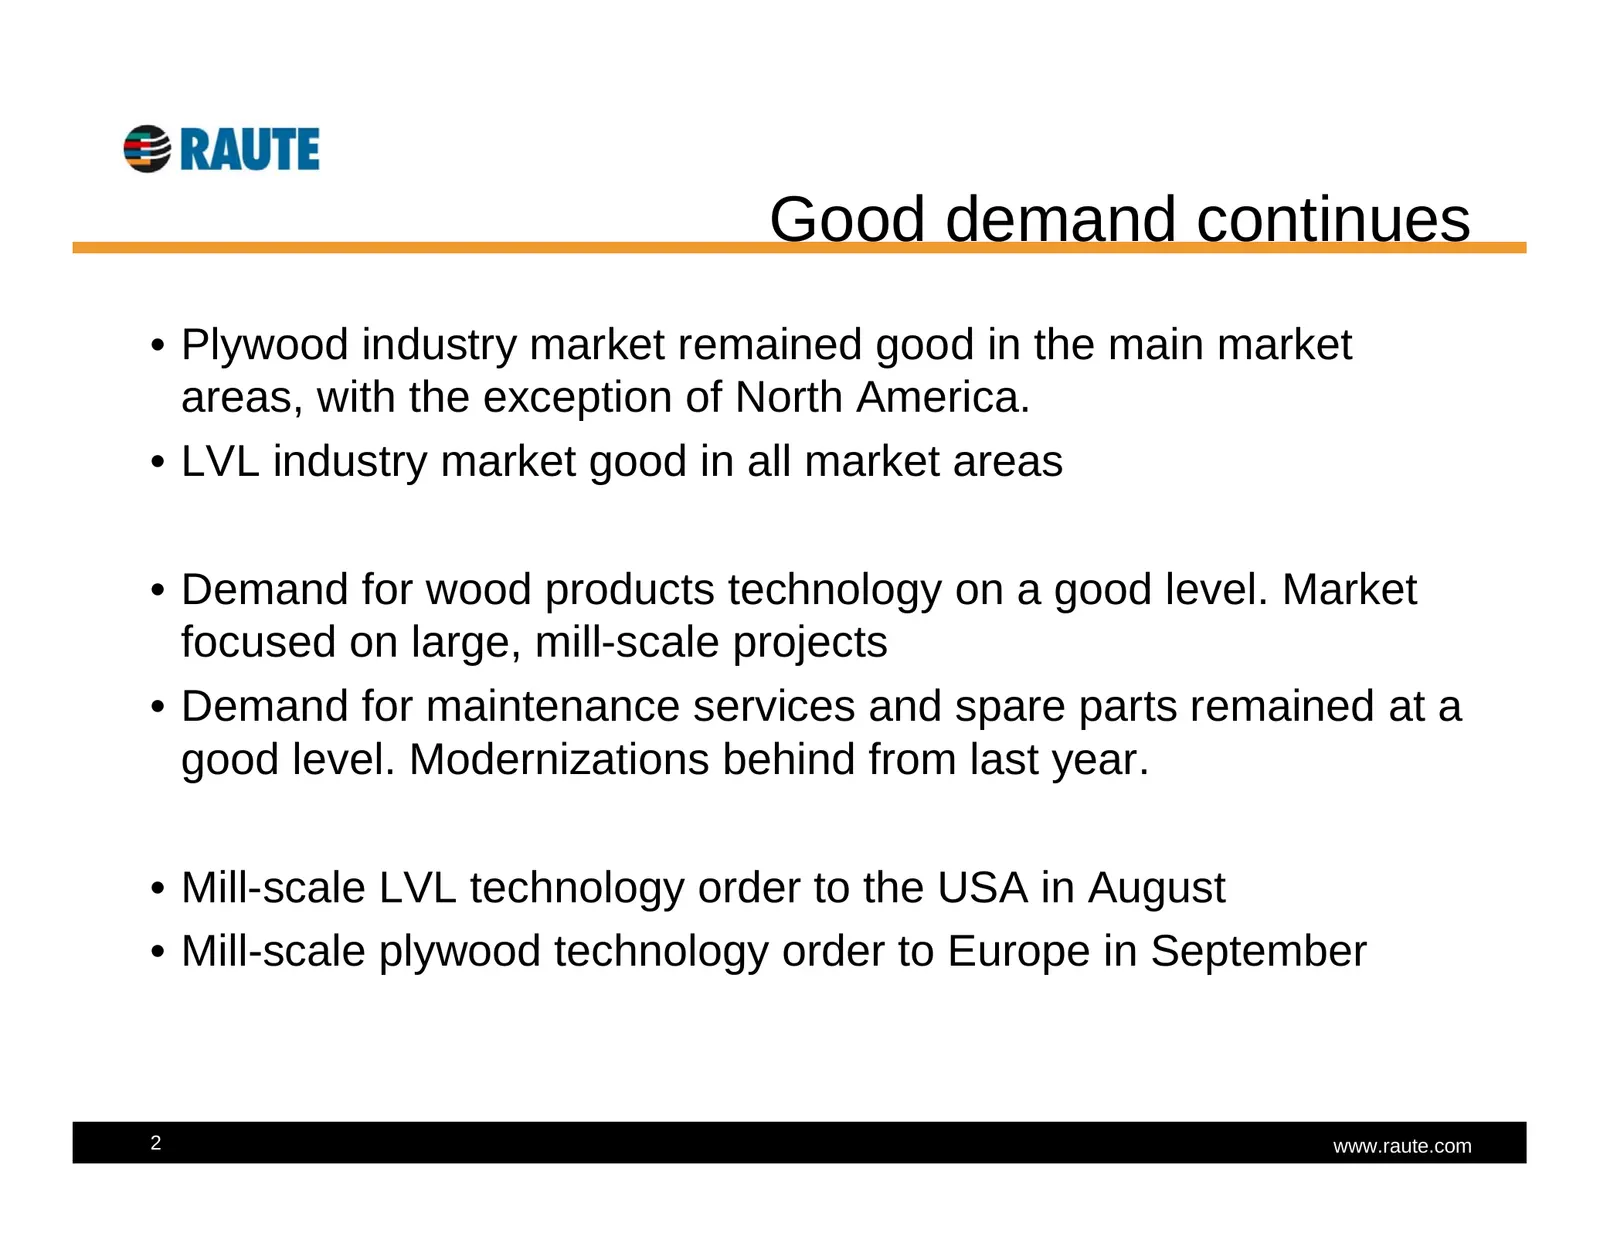
Slide 2: Good demand continues
Good demand continues • Plywood industry market remained good in the main market areas, with the exception of North America. • LVL industry market good in all market areas • Demand for wood products technology on a good level. Market focused on large, mill-scale projects • Demand for maintenance ser
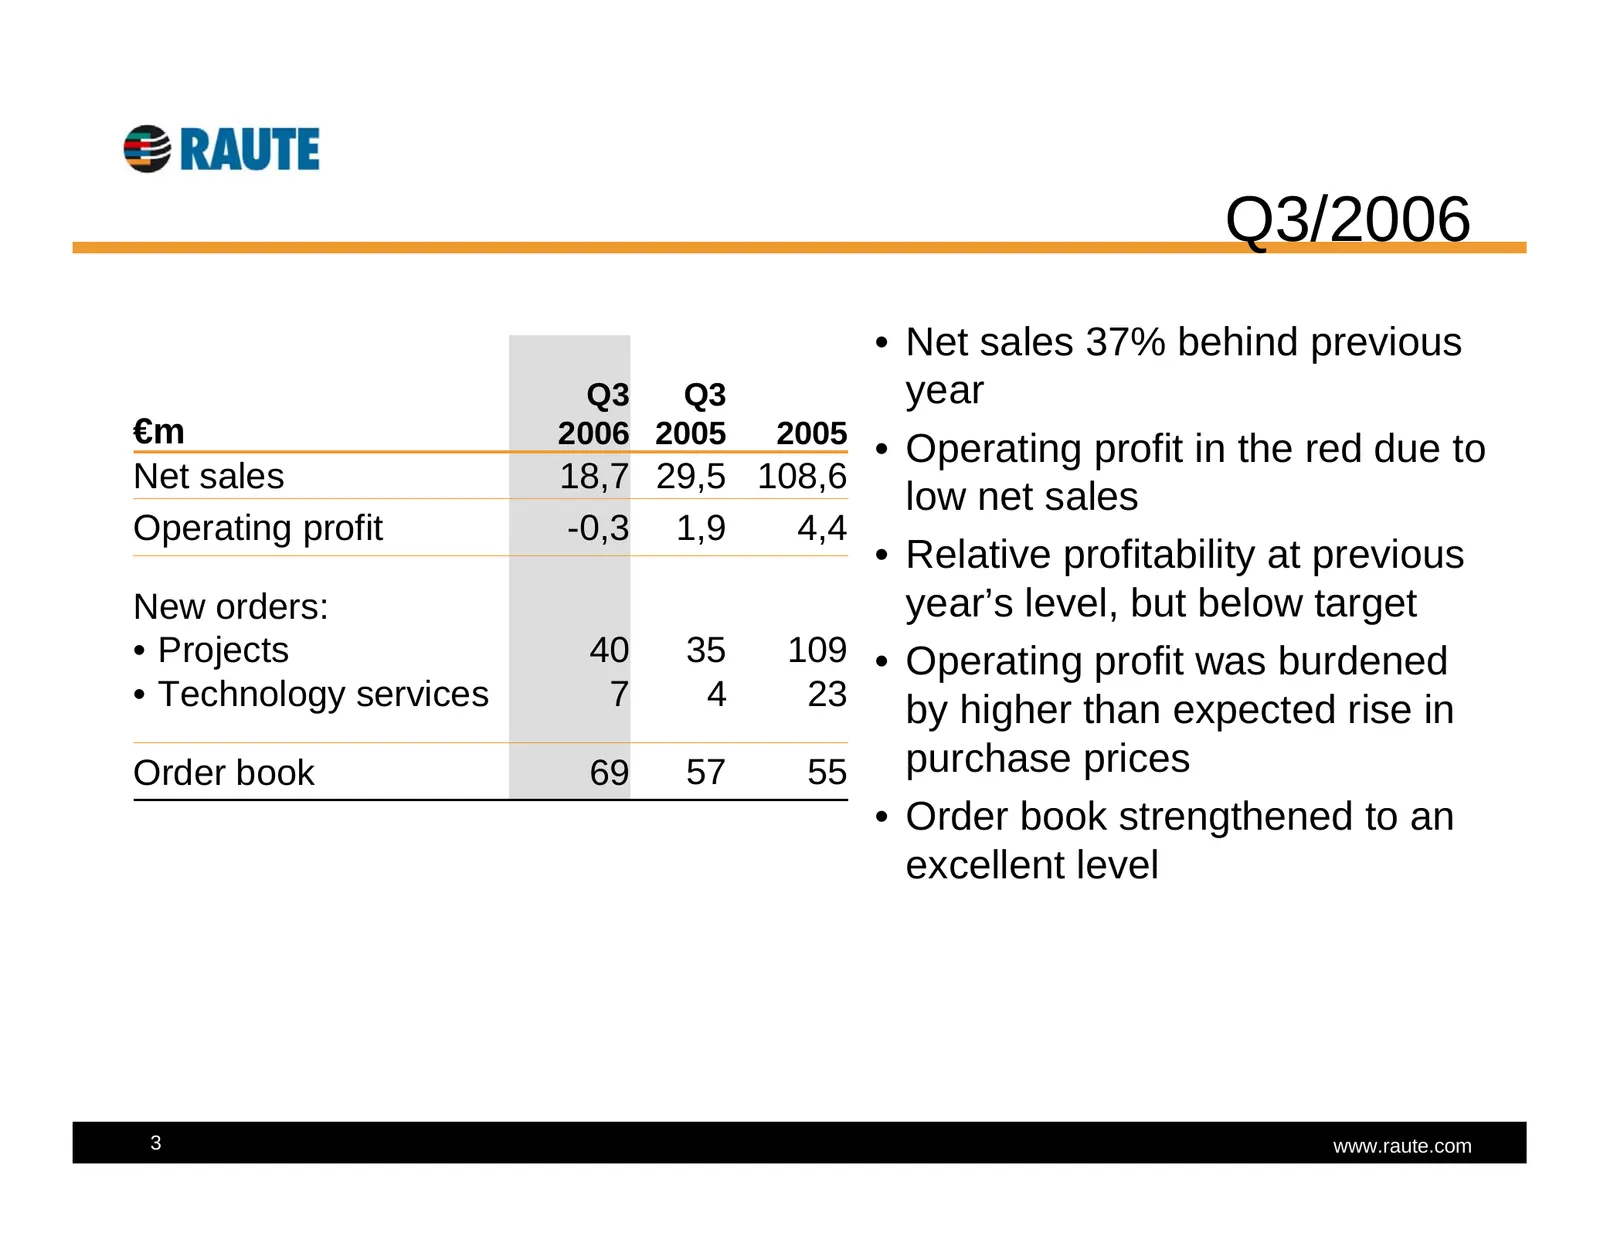
Slide 3: Q3/2006
Q3/2006 • Net sales 37% behind previous Q3 Q3 year €m 2006 2005 2005 • Operating profit in the red due to Net sales 18,7 29,5 108,6 low net sales Operating profit -0,3 1,9 4,4 • Relative profitability at previous New orders: year’s level, but below target • Projects 40 35 109 • Operating profit was
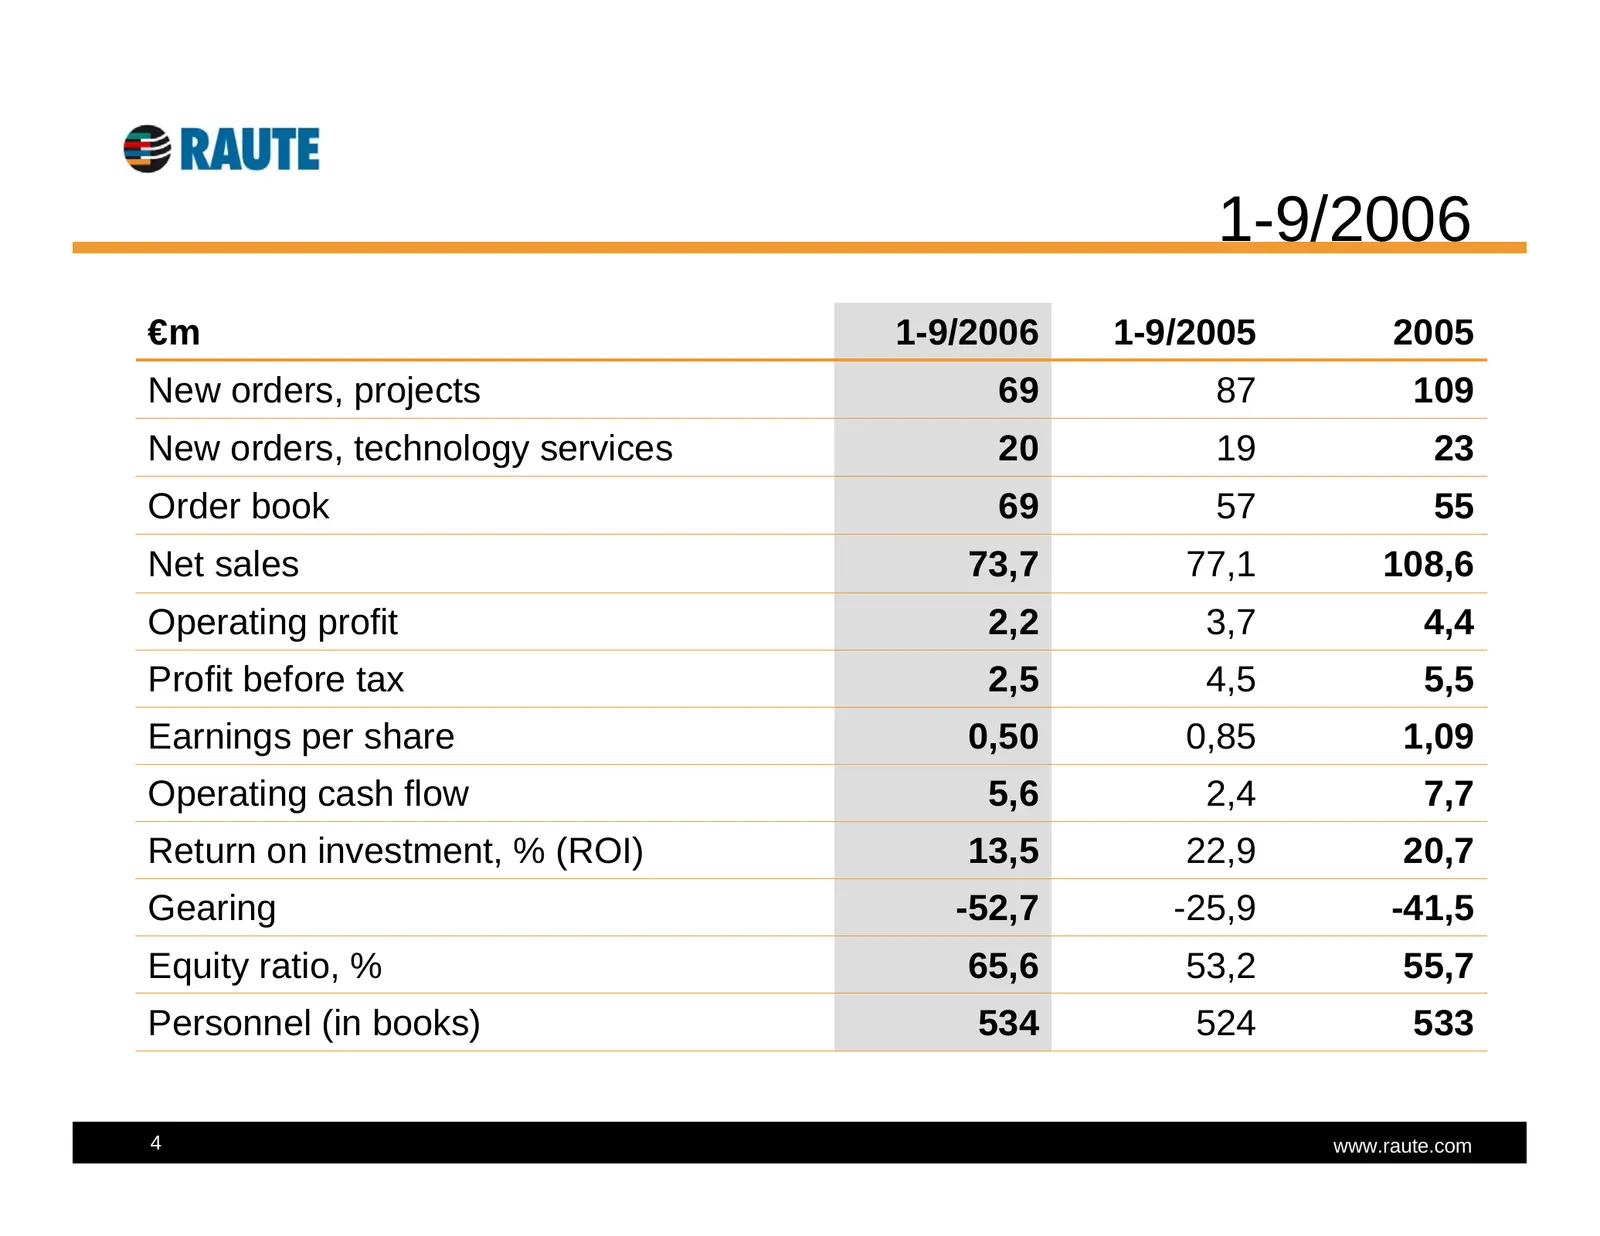
Slide 4: 1-9/2006 key figures
1-9/2006 €m 1-9/2006 1-9/2005 2005 New orders, projects 69 87 109 New orders, technology services 20 19 23 Order book 69 57 55 Net sales 73,7 77,1 108,6 Operating profit 2,2 3,7 4,4 Profit before tax 2,5 4,5 5,5 Earnings per share 0,50 0,85 1,09 Operating cash flow 5,6 2,4 7,7 Return on investment,
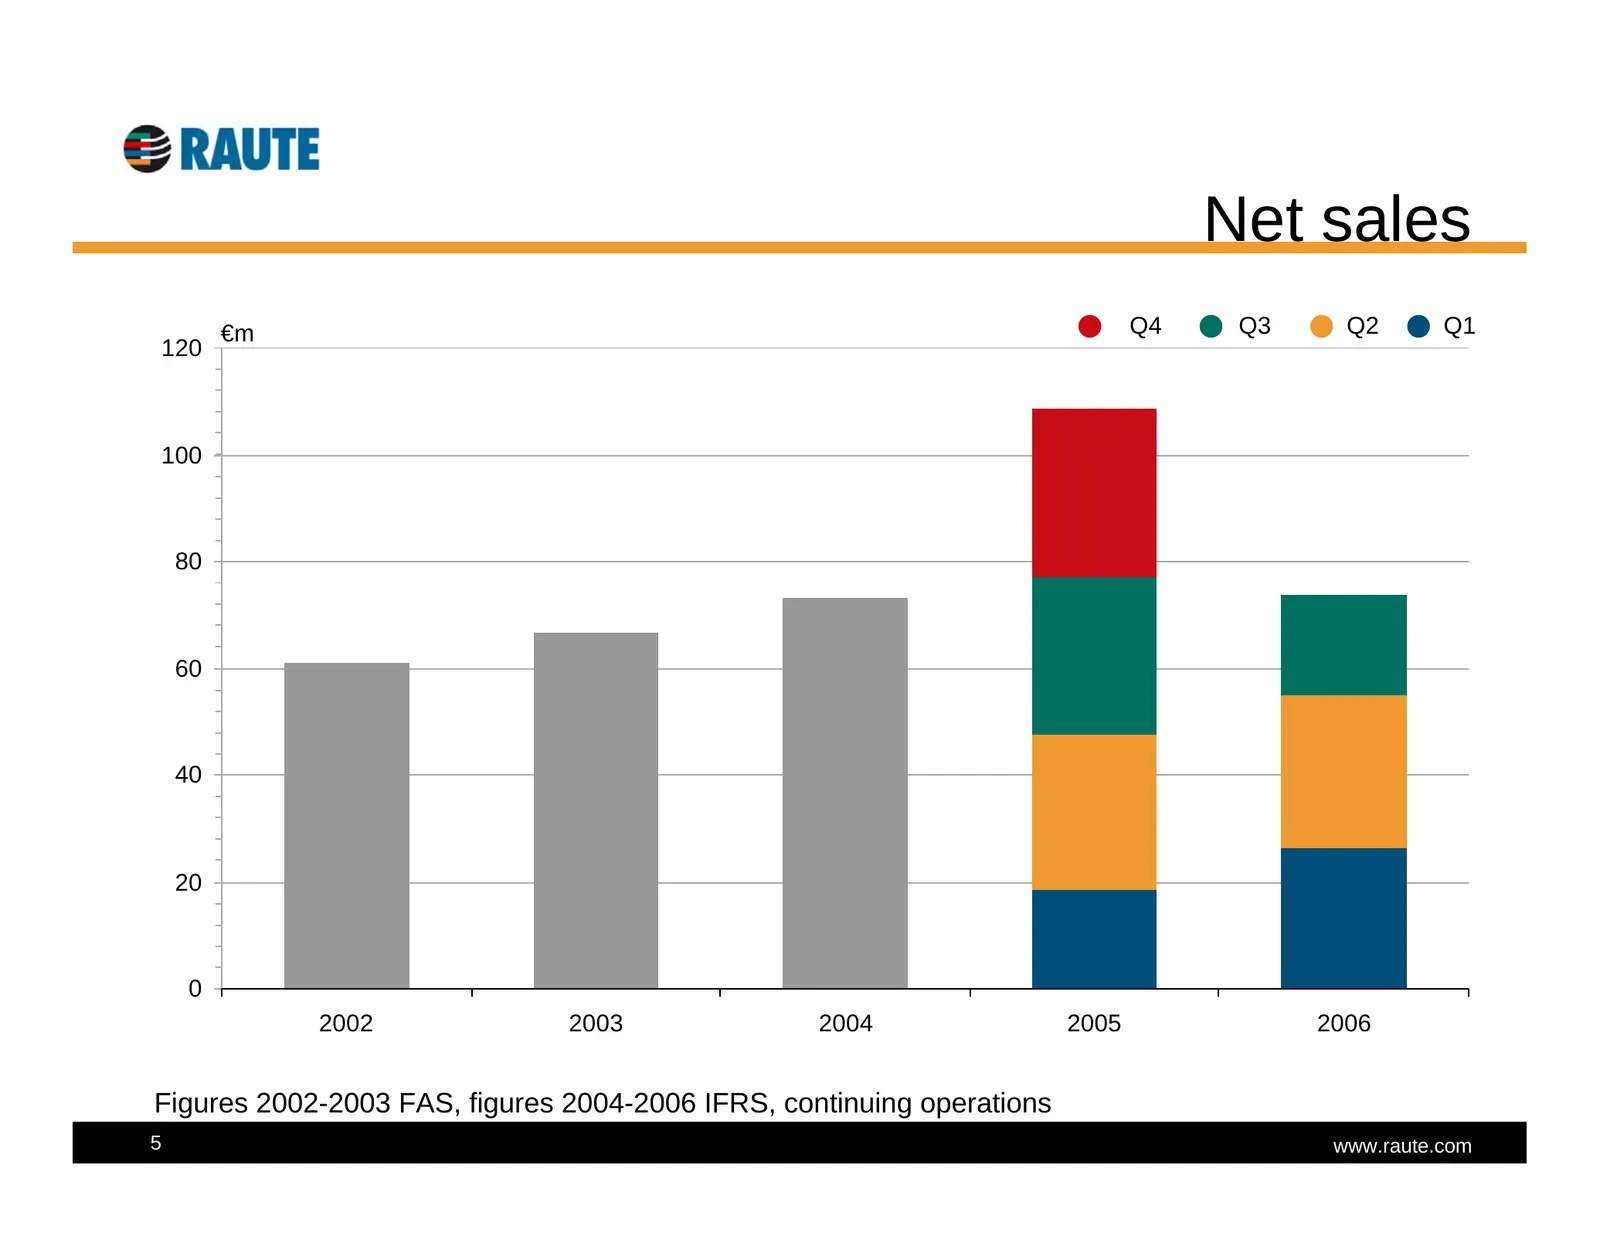
Slide 5: Net sales
Net sales €m Q4 Q3 Q2 Q1 120 100 80 60 40 20 0 2002 2003 2004 2005 2006 Figures 2002-2003 FAS, figures 2004-2006 IFRS, continuing operations 5 www.raute.com
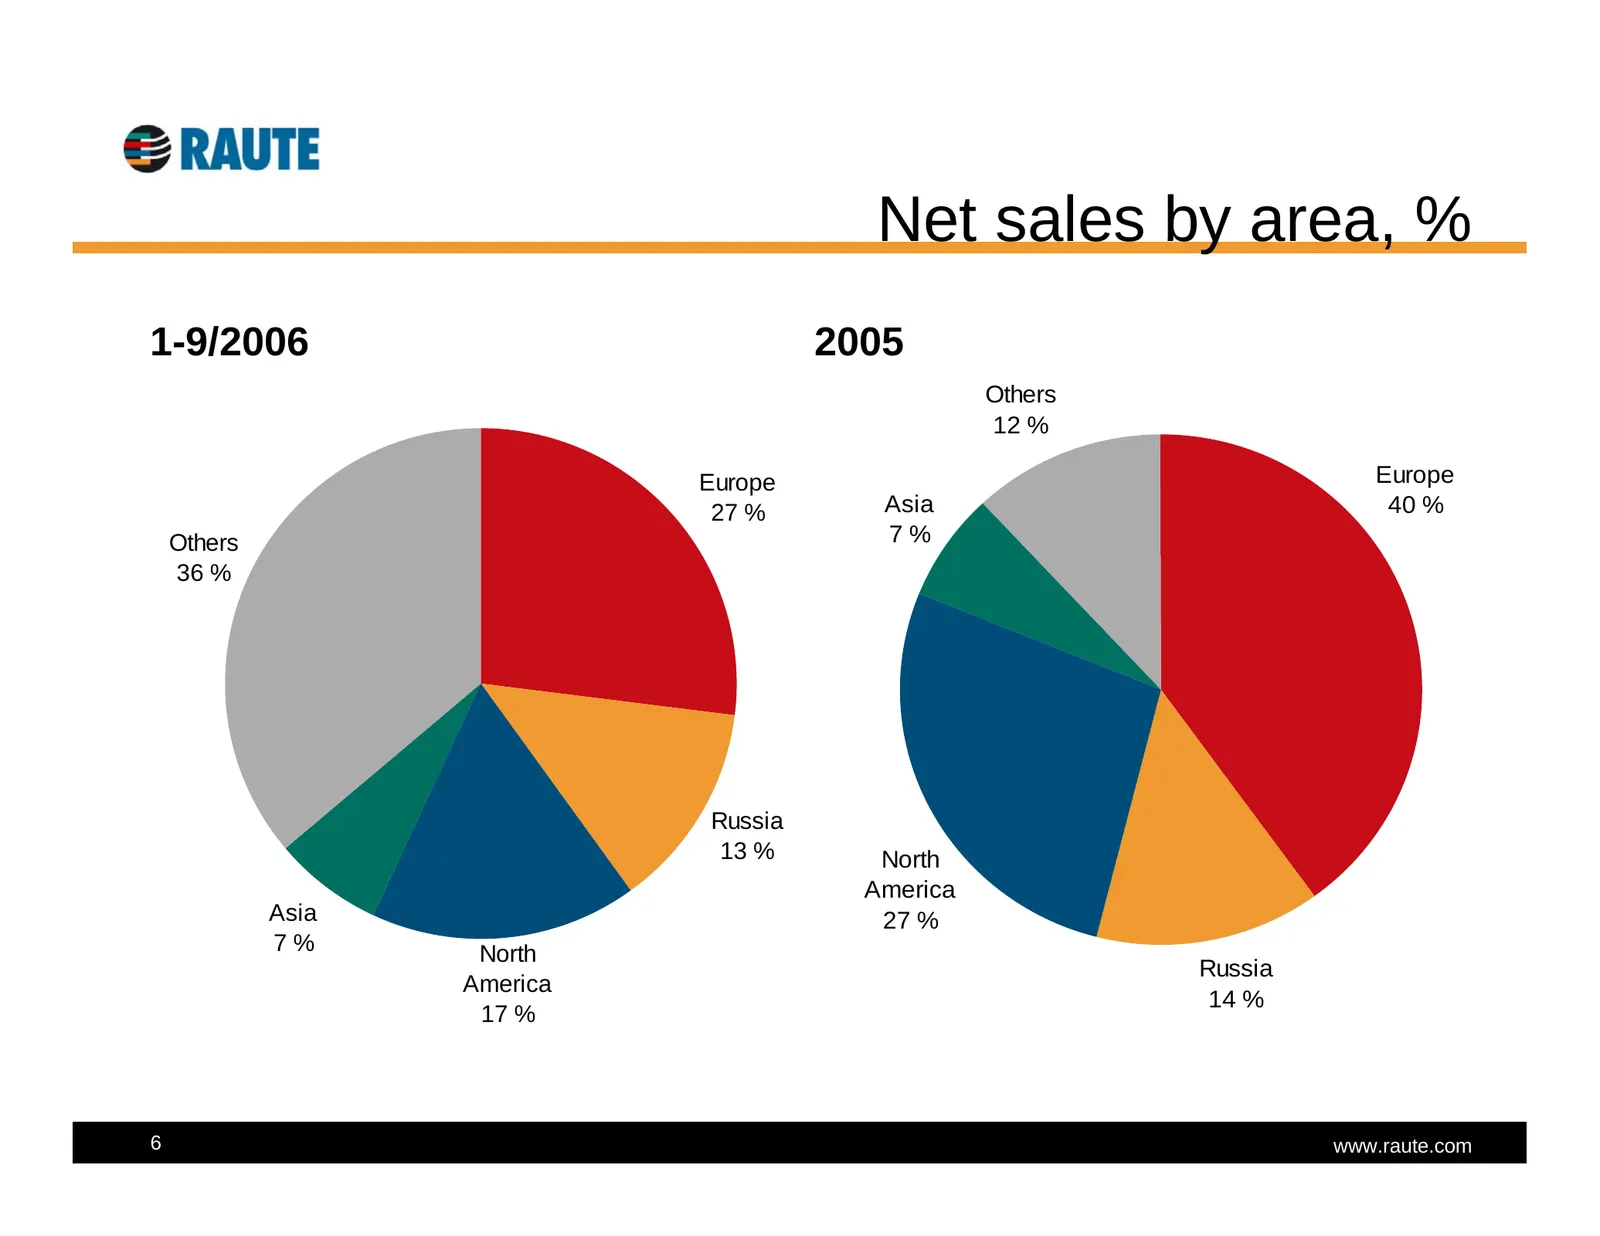
Slide 6: Net sales by area, %
Net sales by area, % 1-9/2006 2005 Others 12 % Europe Europe 27 % Asia 40 % Others 7% 36 % Russia 13 % North America Asia 27 % 7% North Russia America 14 % 17 % 6 www.raute.com
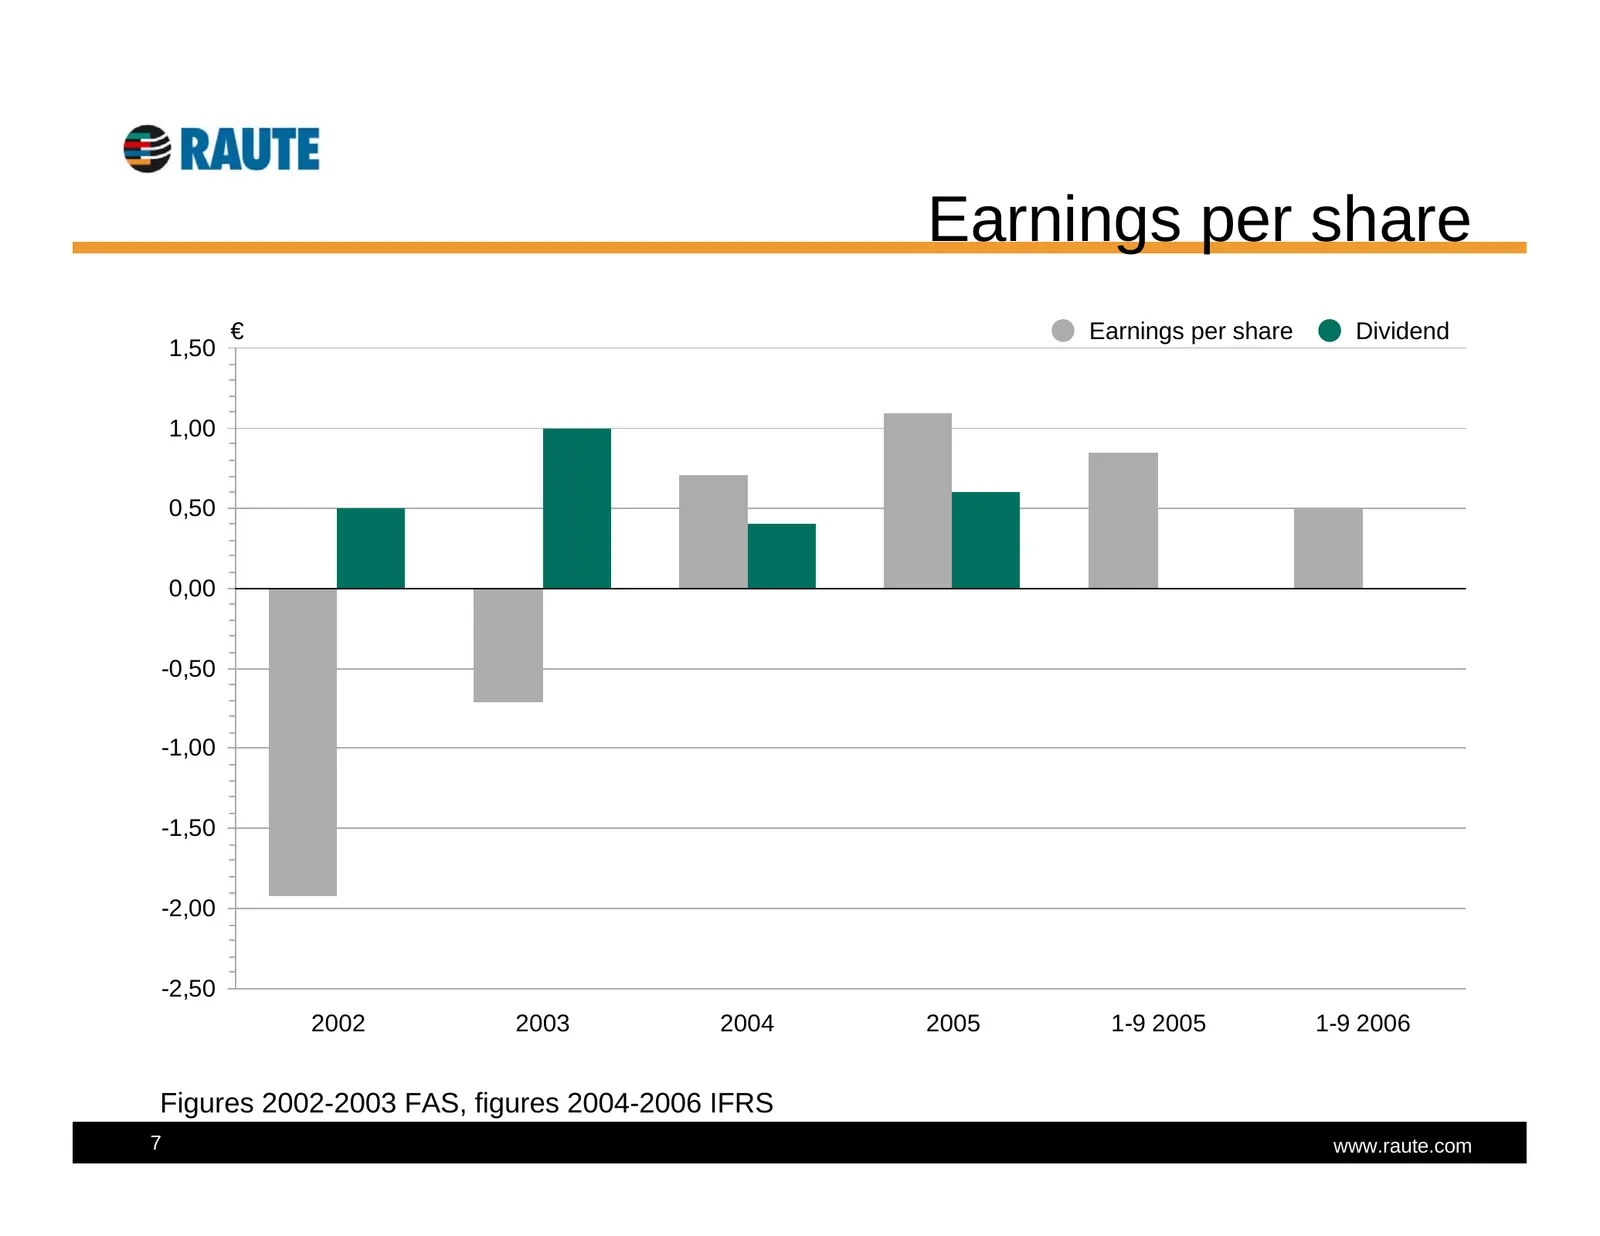
Slide 7: Earnings per share
Earnings per share € Earnings per share Dividend 1,50 1,00 0,50 0,00 -0,50 -1,00 -1,50 -2,00 -2,50 2002 2003 2004 2005 1-9 2005 1-9 2006 Figures 2002-2003 FAS, figures 2004-2006 IFRS 7 www.raute.com
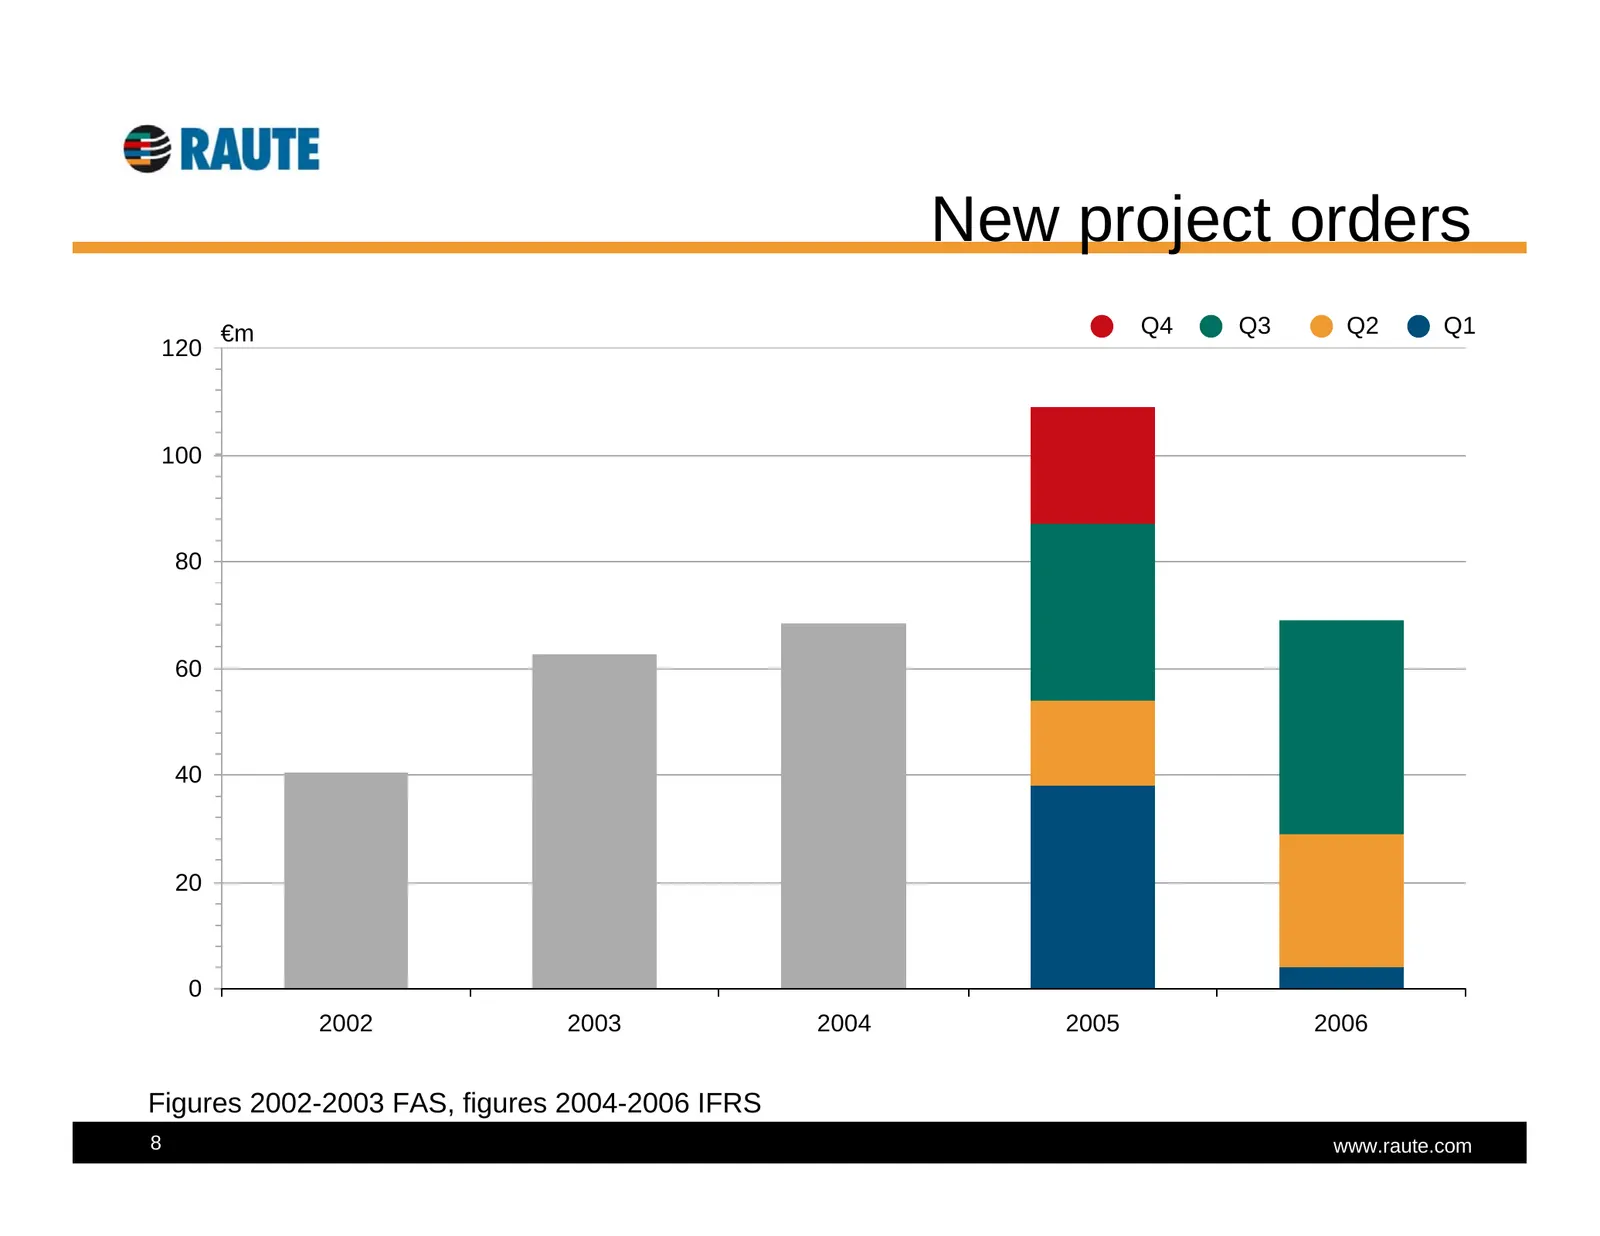
Slide 8: New project orders
New project orders €m Q4 Q3 Q2 Q1 120 100 80 60 40 20 0 2002 2003 2004 2005 2006 Figures 2002-2003 FAS, figures 2004-2006 IFRS 8 www.raute.com
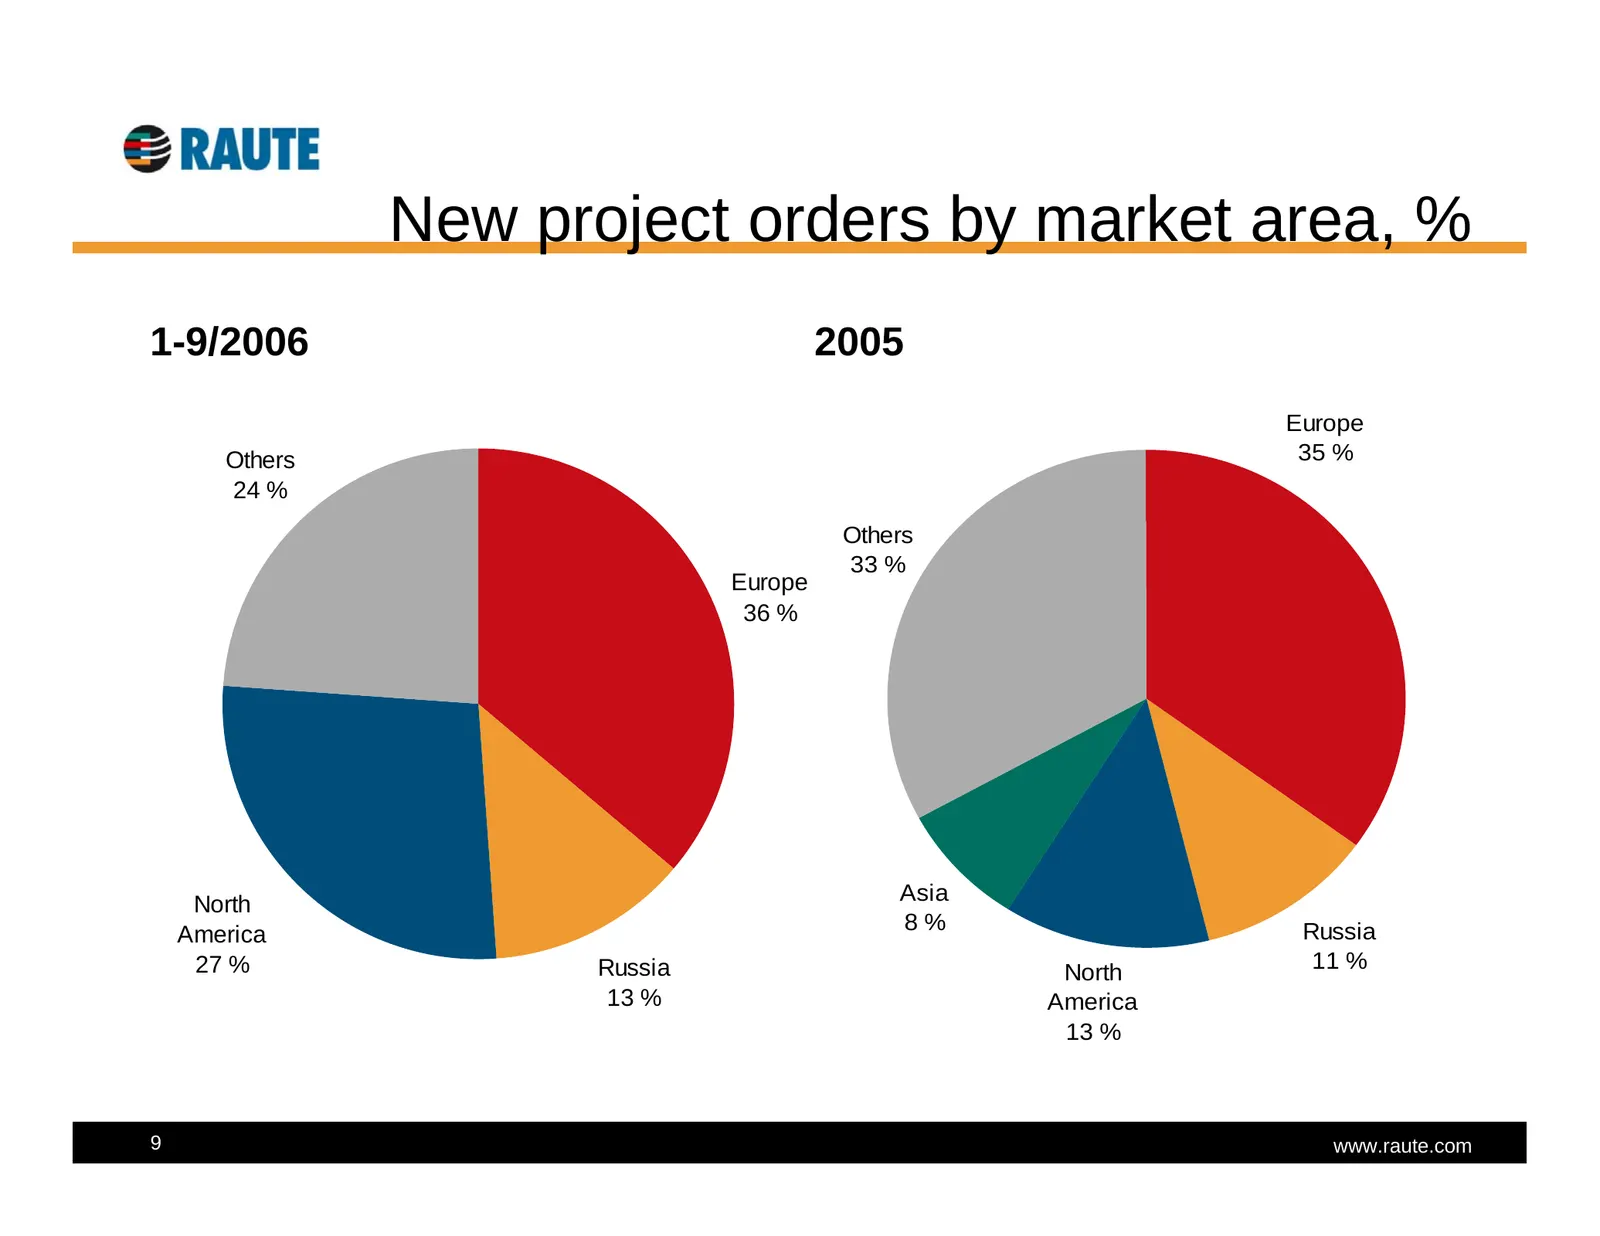
Slide 9: New project orders by market area, %
New project orders by market area, % 1-9/2006 2005 Europe Others 35 % 24 % Others 33 % Europe 36 % North Asia 8% Russia America 27 % Russia North 11 % 13 % America 13 % 9 www.raute.com
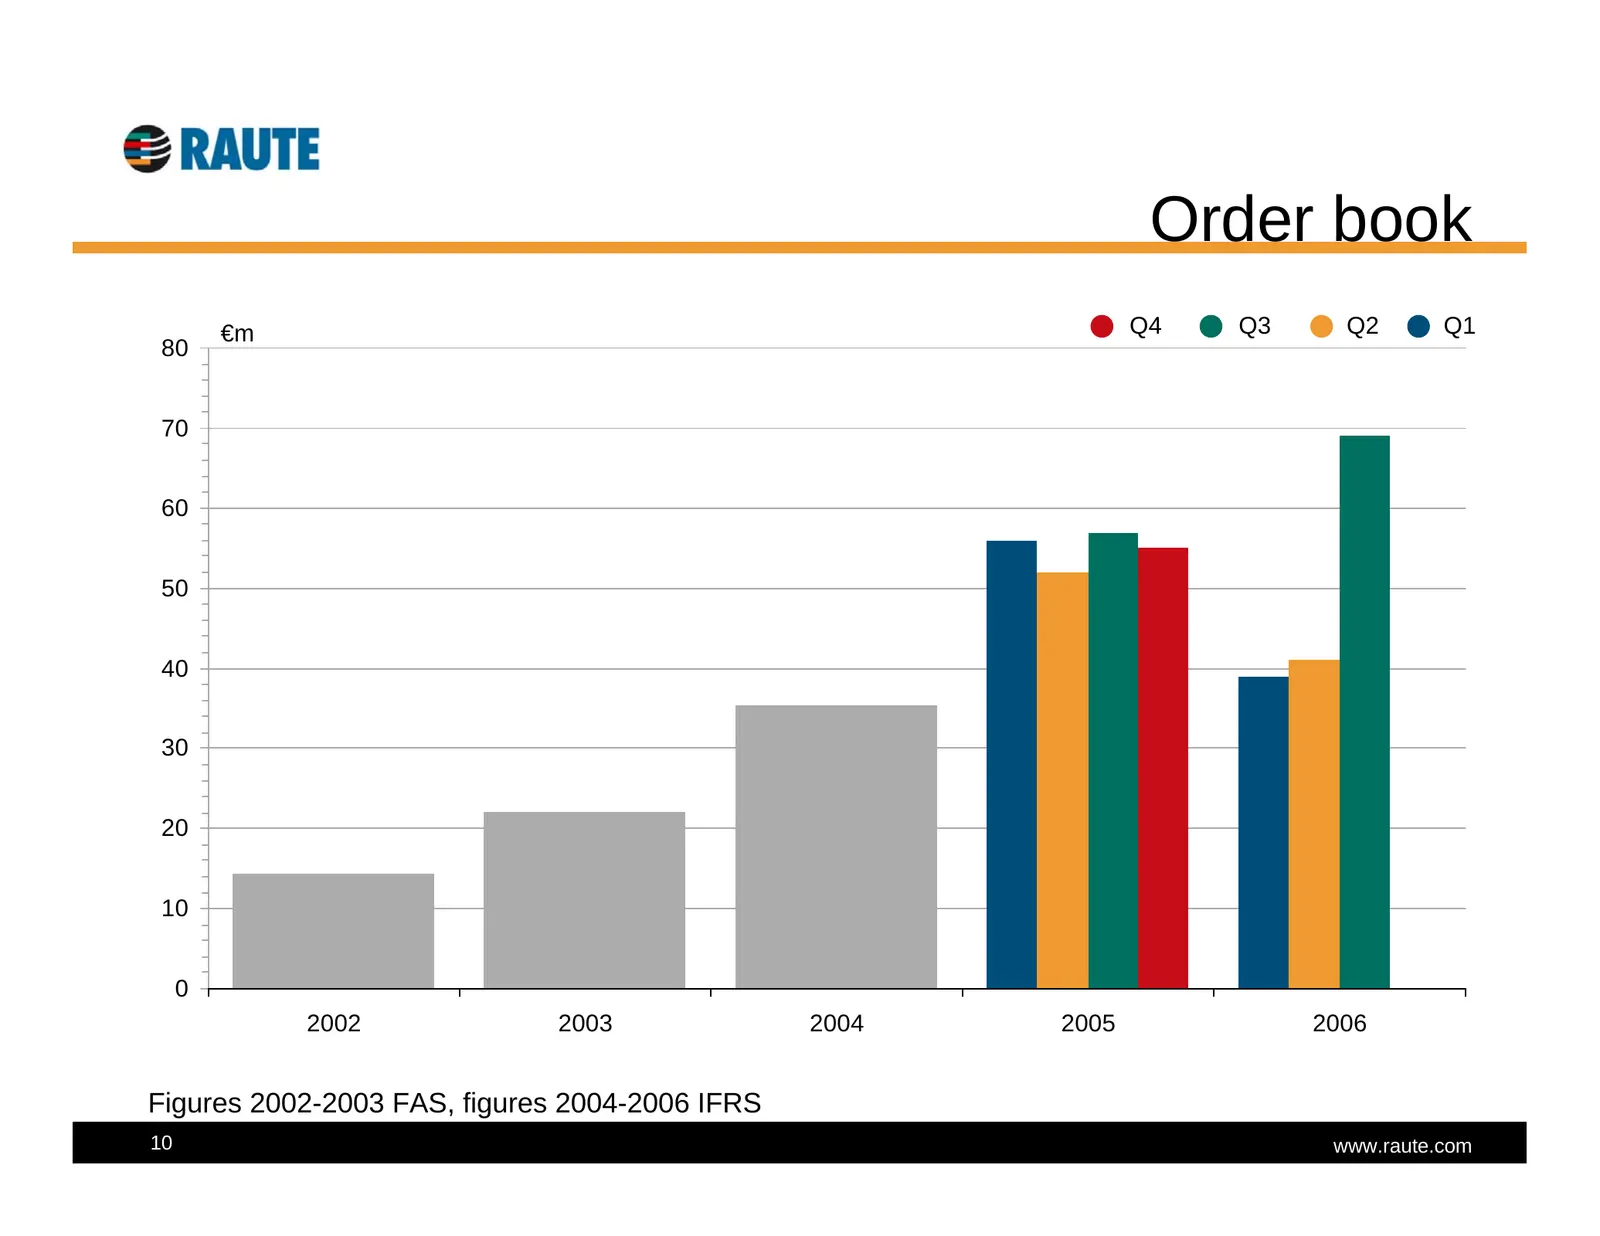
Slide 10: Order book
Order book €m Q4 Q3 Q2 Q1 80 70 60 50 40 30 20 10 0 2002 2003 2004 2005 2006 Figures 2002-2003 FAS, figures 2004-2006 IFRS 10 www.raute.com
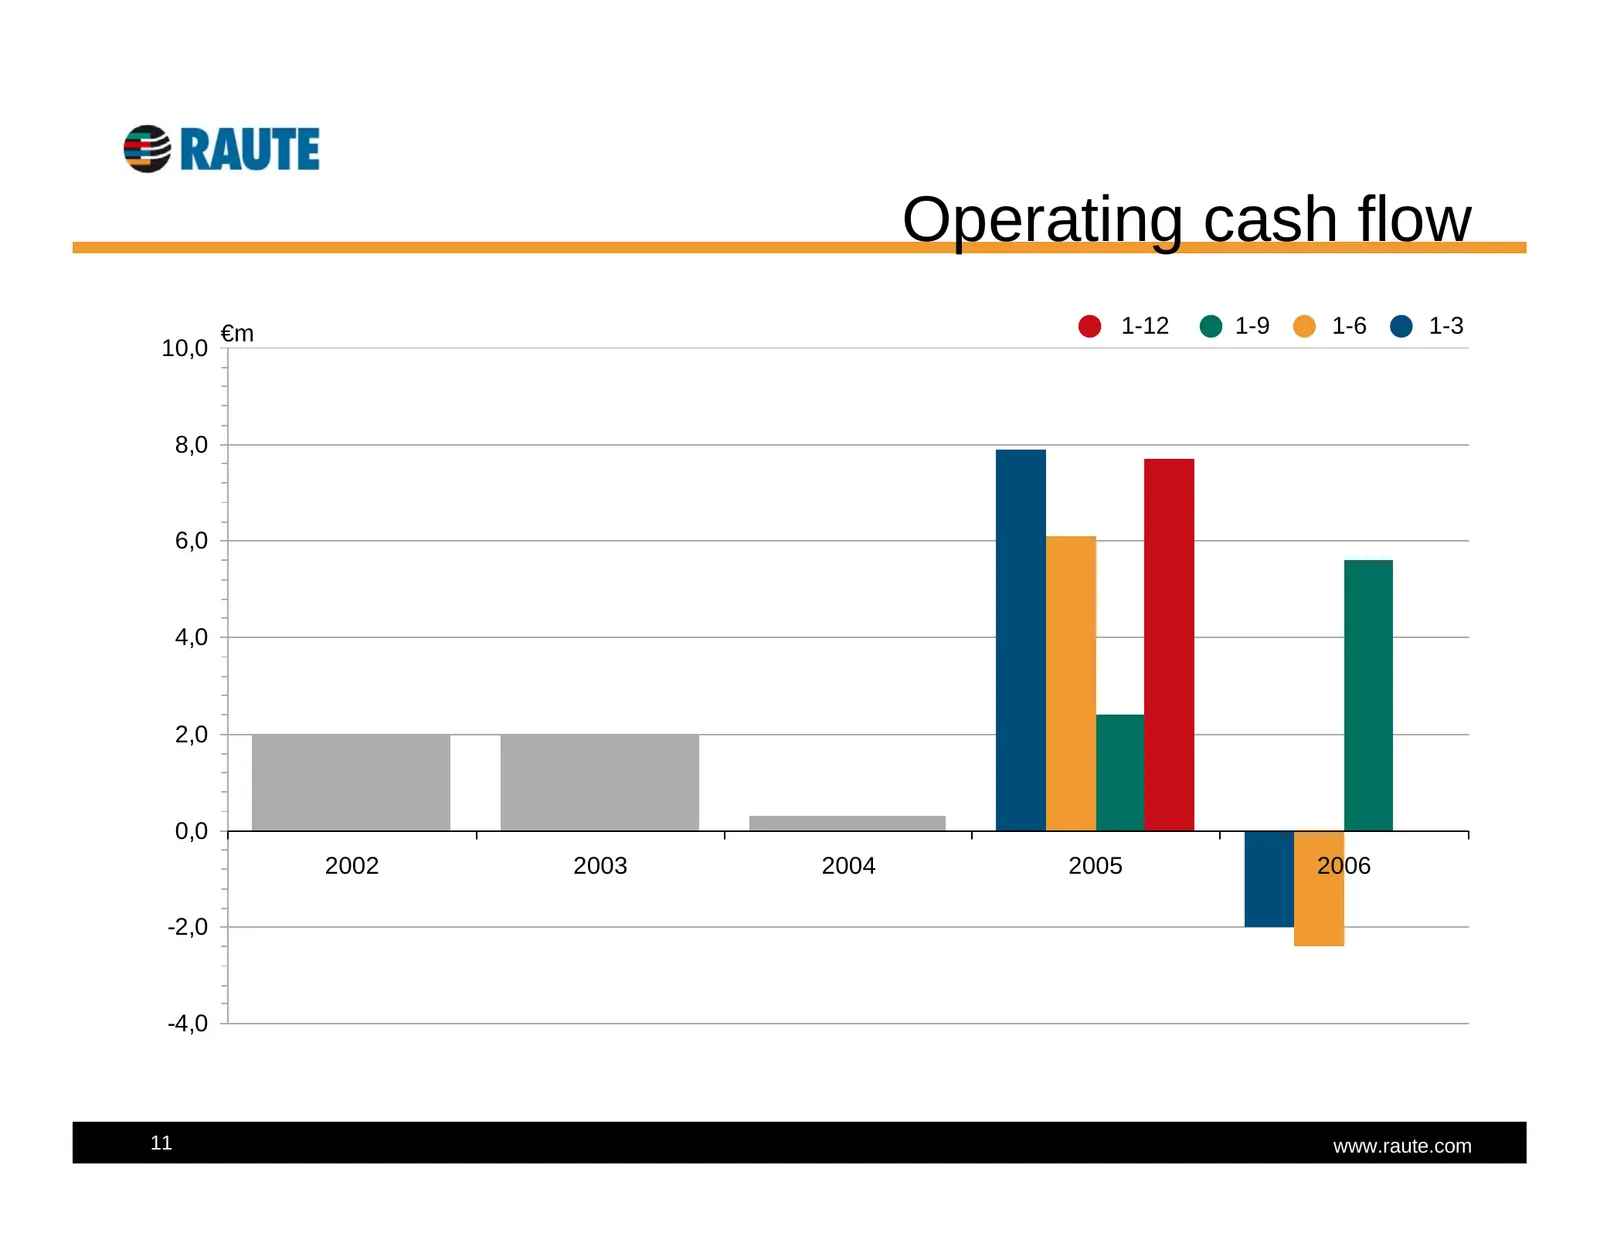
Slide 11: Operating cash flow
Operating cash flow €m 1-12 1-9 1-6 1-3 10,0 8,0 6,0 4,0 2,0 0,0 2002 2003 2004 2005 2006 -2,0 -4,0 11 www.raute.com
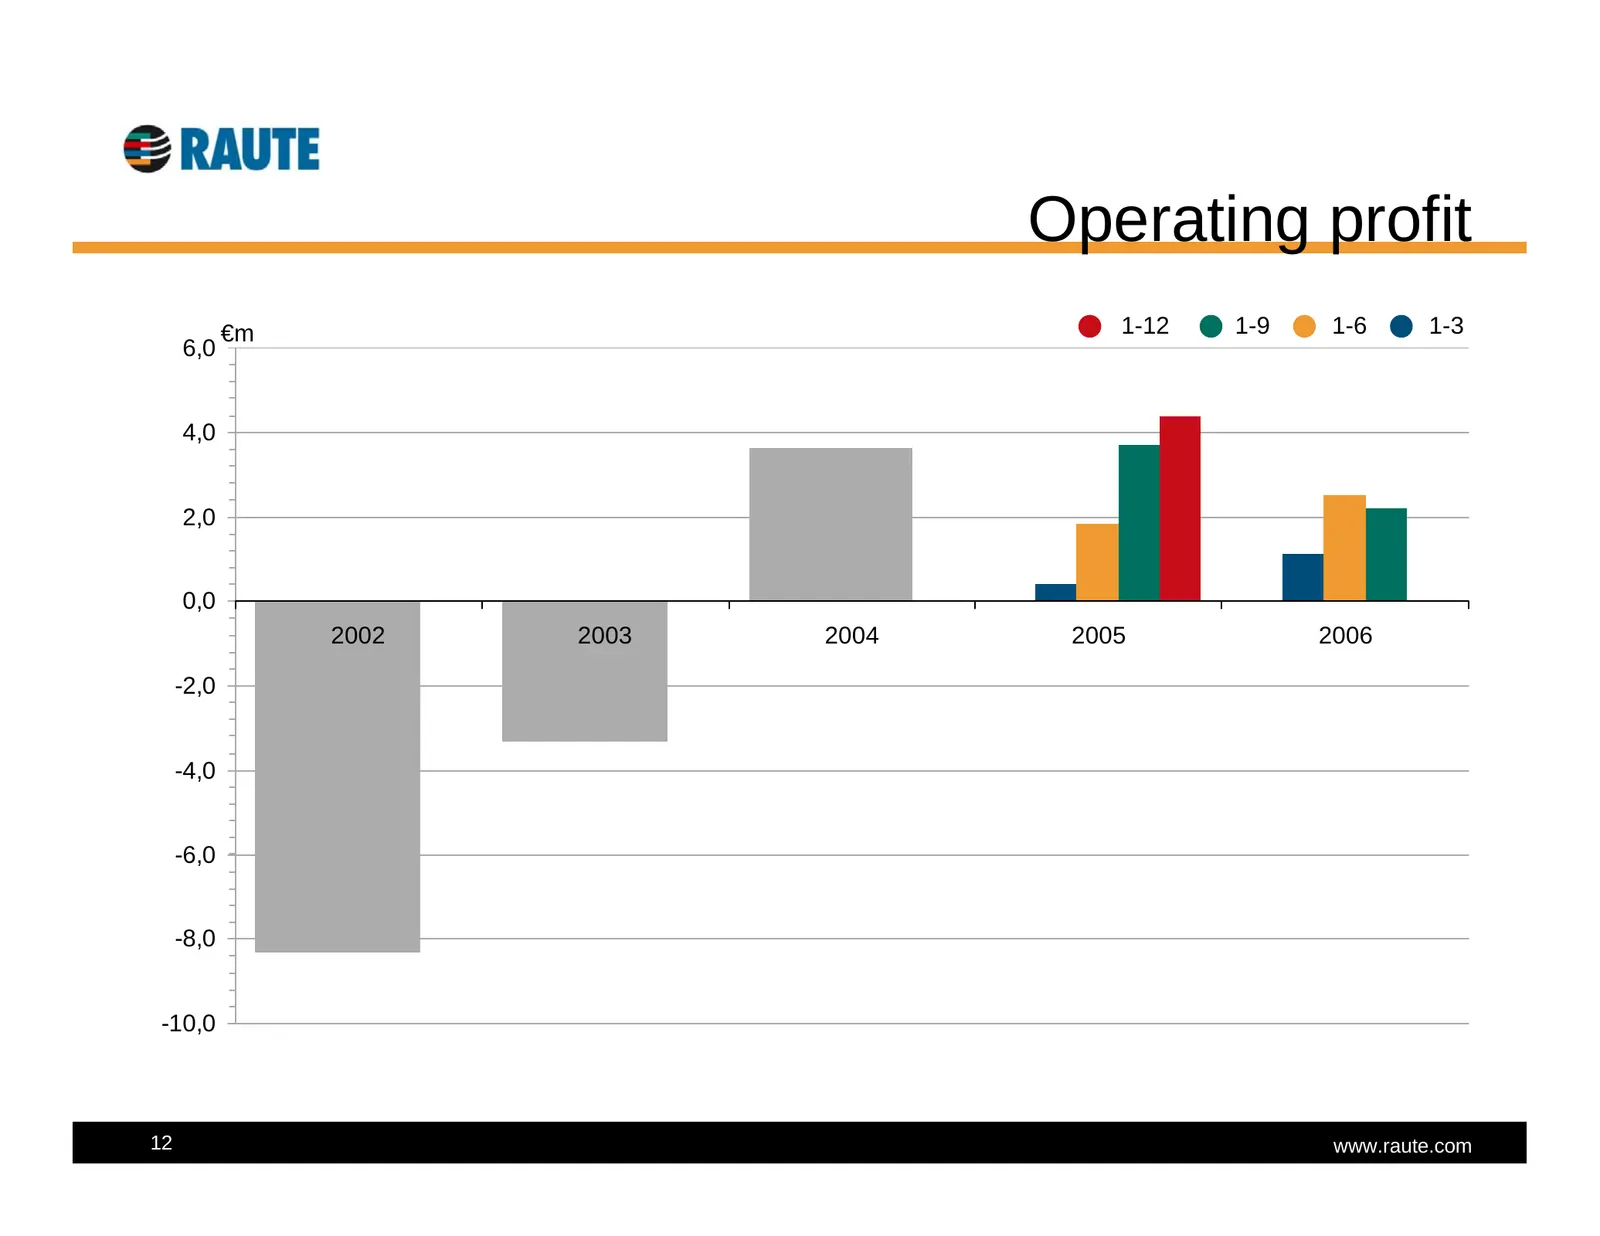
Slide 12: Operating profit
Operating profit €m 1-12 1-9 1-6 1-3 6,0 4,0 2,0 0,0 2002 2003 2004 2005 2006 -2,0 -4,0 -6,0 -8,0 -10,0 12 www.raute.com
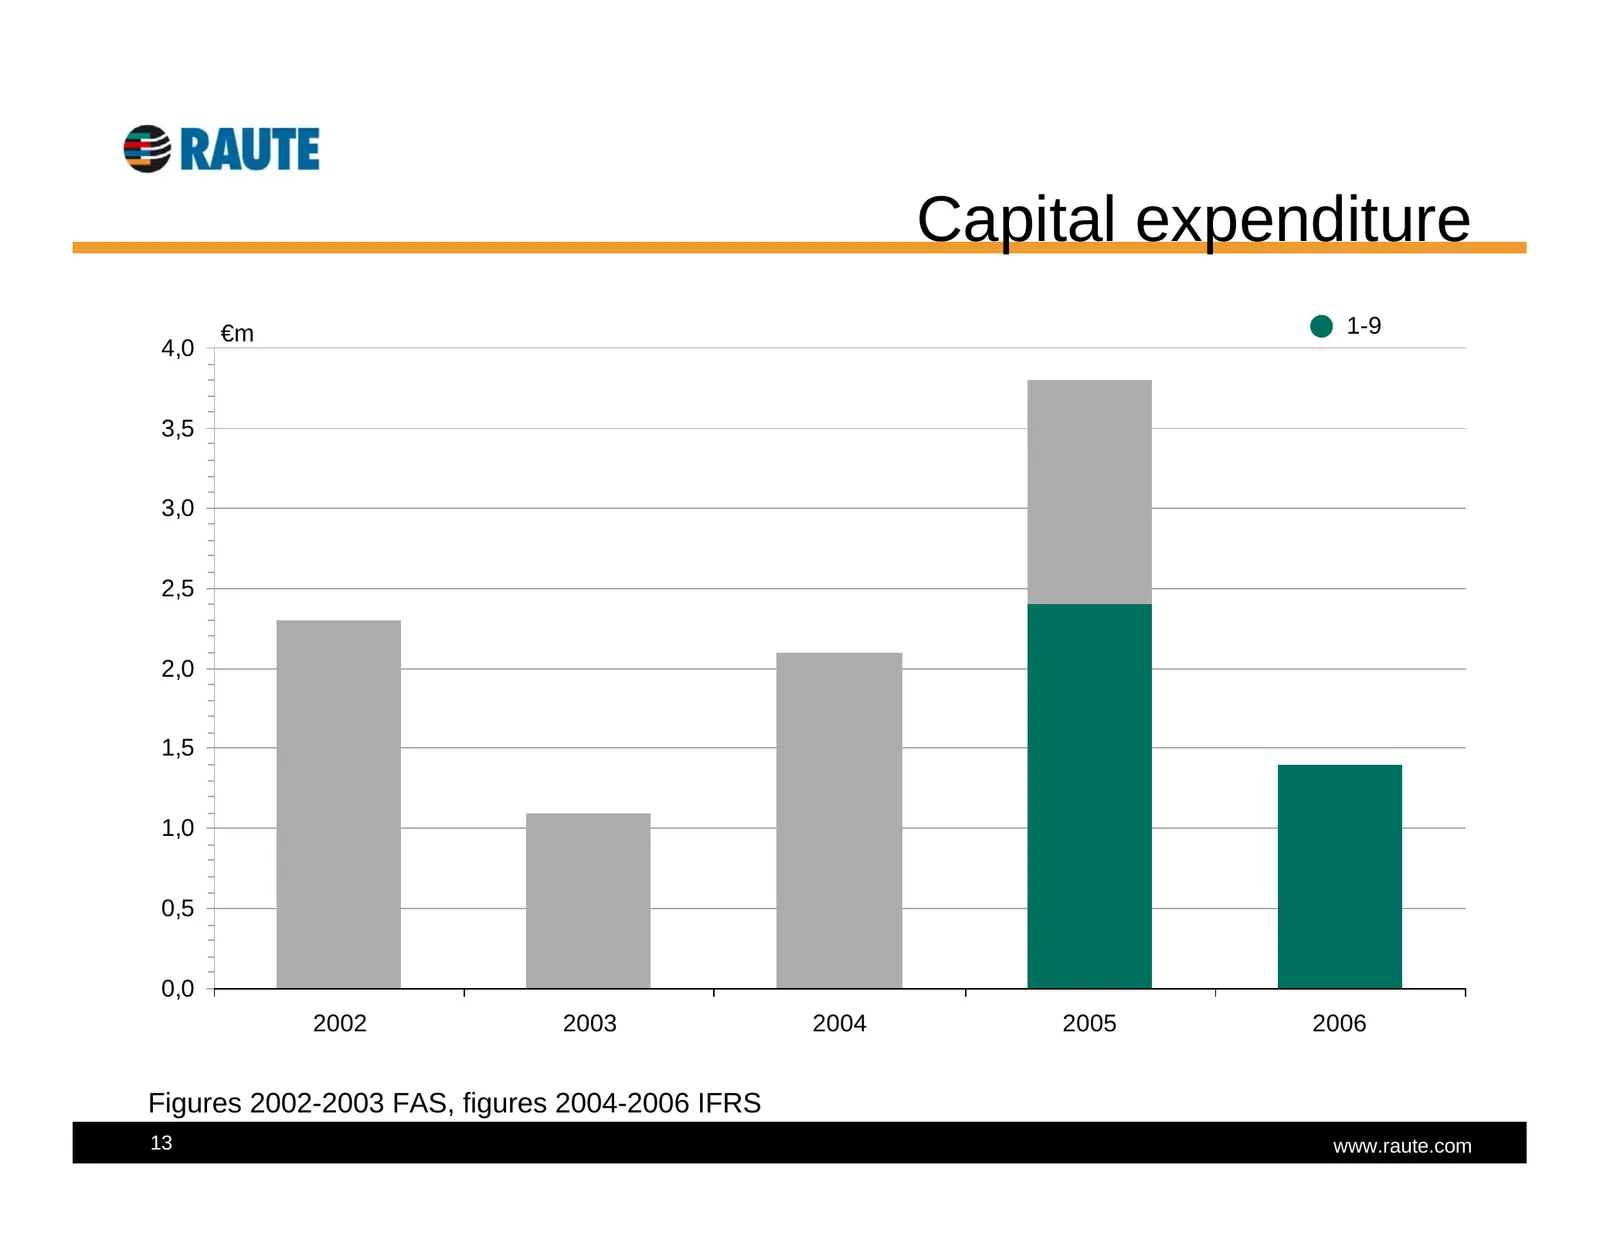
Slide 13: Capital expenditure
Capital expenditure €m 1-9 4,0 3,5 3,0 2,5 2,0 1,5 1,0 0,5 0,0 2002 2003 2004 2005 2006 Figures 2002-2003 FAS, figures 2004-2006 IFRS 13 www.raute.com
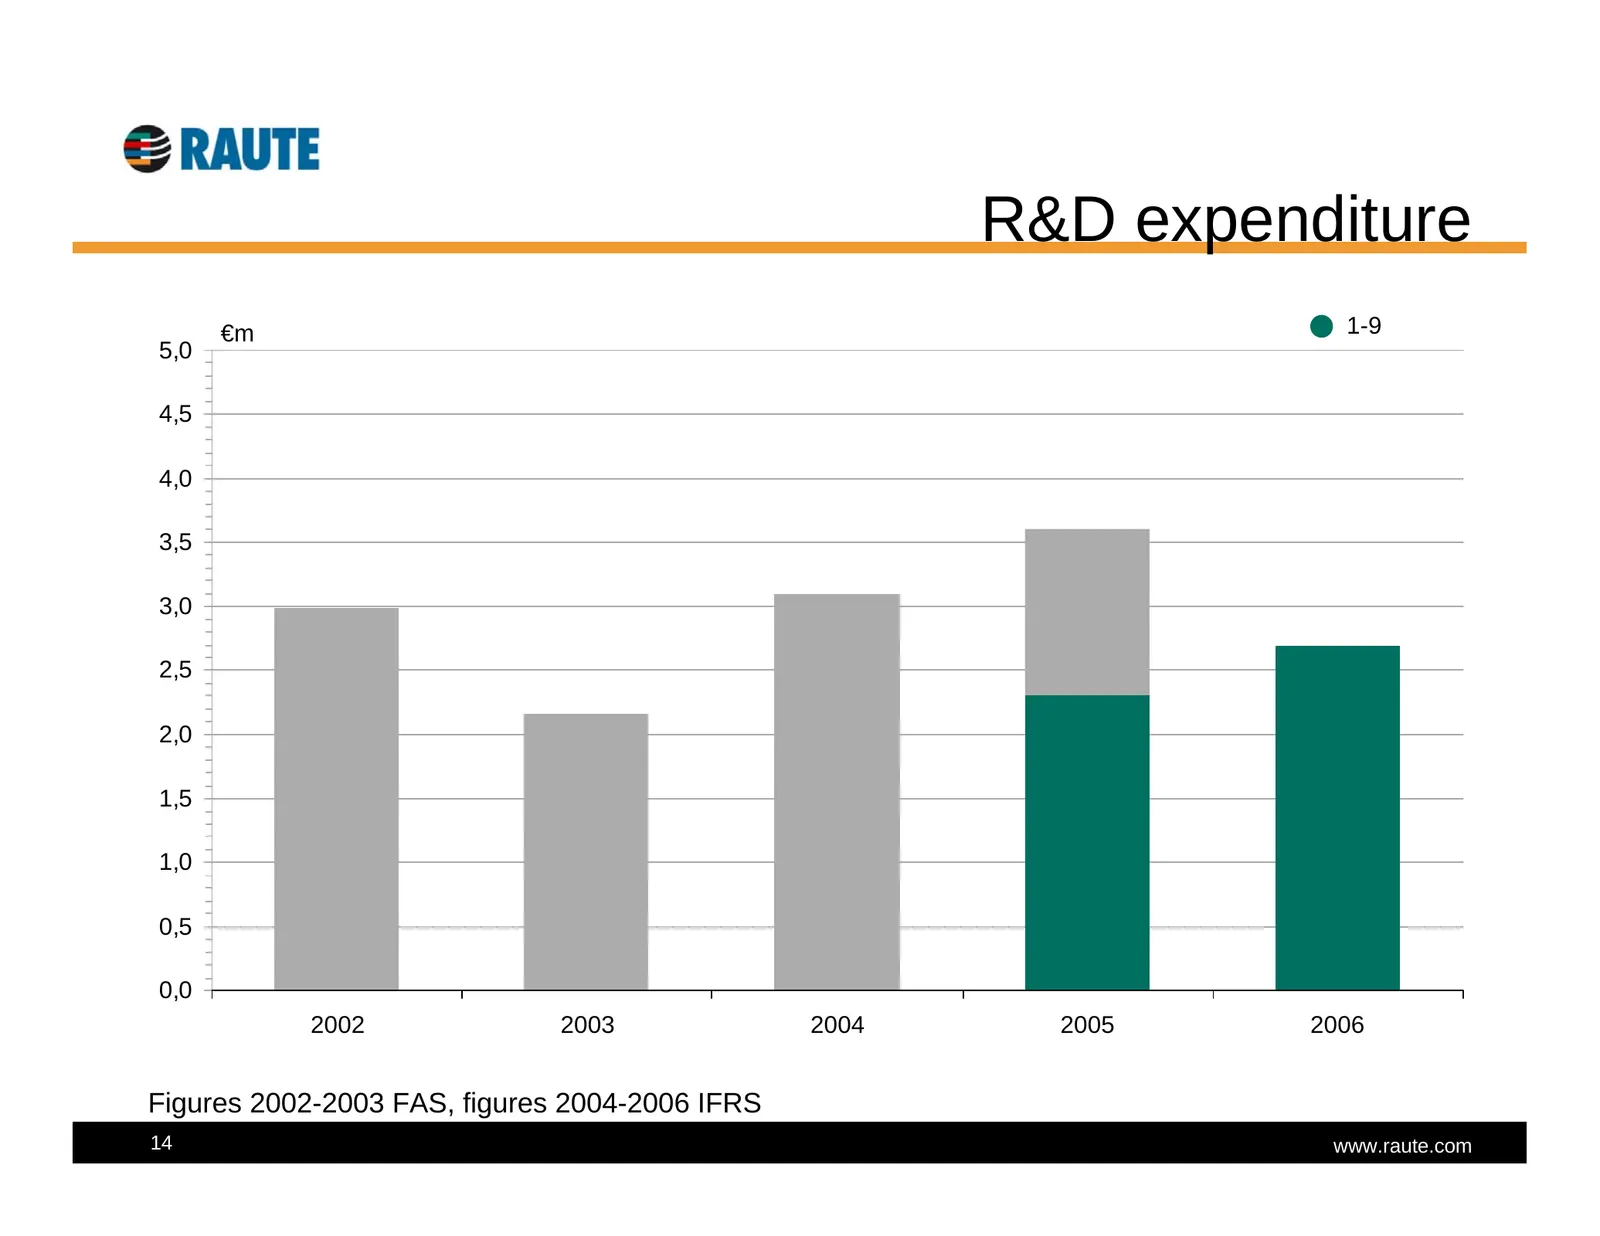
Slide 14: R&D expenditure
R&D expenditure €m 1-9 5,0 4,5 4,0 3,5 3,0 2,5 2,0 1,5 1,0 0,5 0,0 2002 2003 2004 2005 2006 Figures 2002-2003 FAS, figures 2004-2006 IFRS 14 www.raute.com
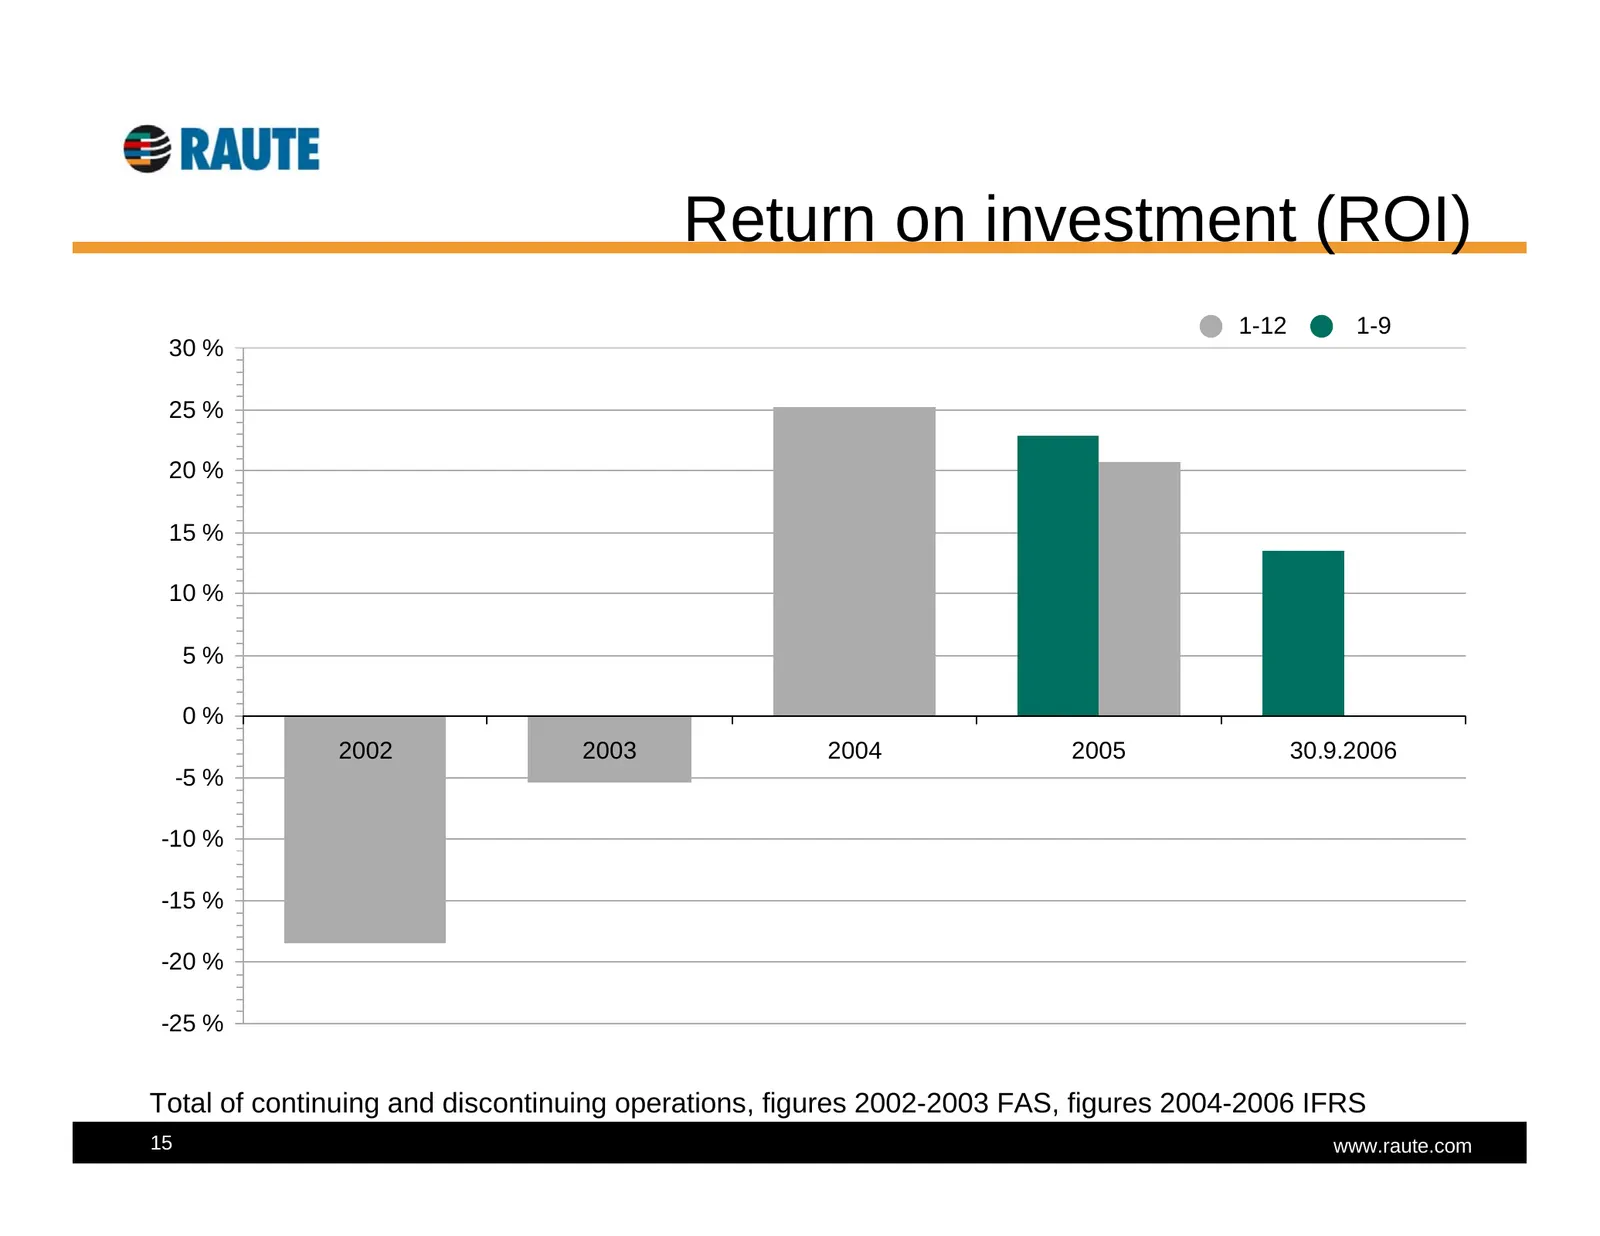
Slide 15: Return on investment (ROI)
Return on investment (ROI) 1-12 1-9 30 % 25 % 20 % 15 % 10 % 5% 0% 2002 2003 2004 2005 30.9.2006 -5 % -10 % -15 % -20 % -25 % Total of continuing and discontinuing operations, figures 2002-2003 FAS, figures 2004-2006 IFRS 15 www.raute.com
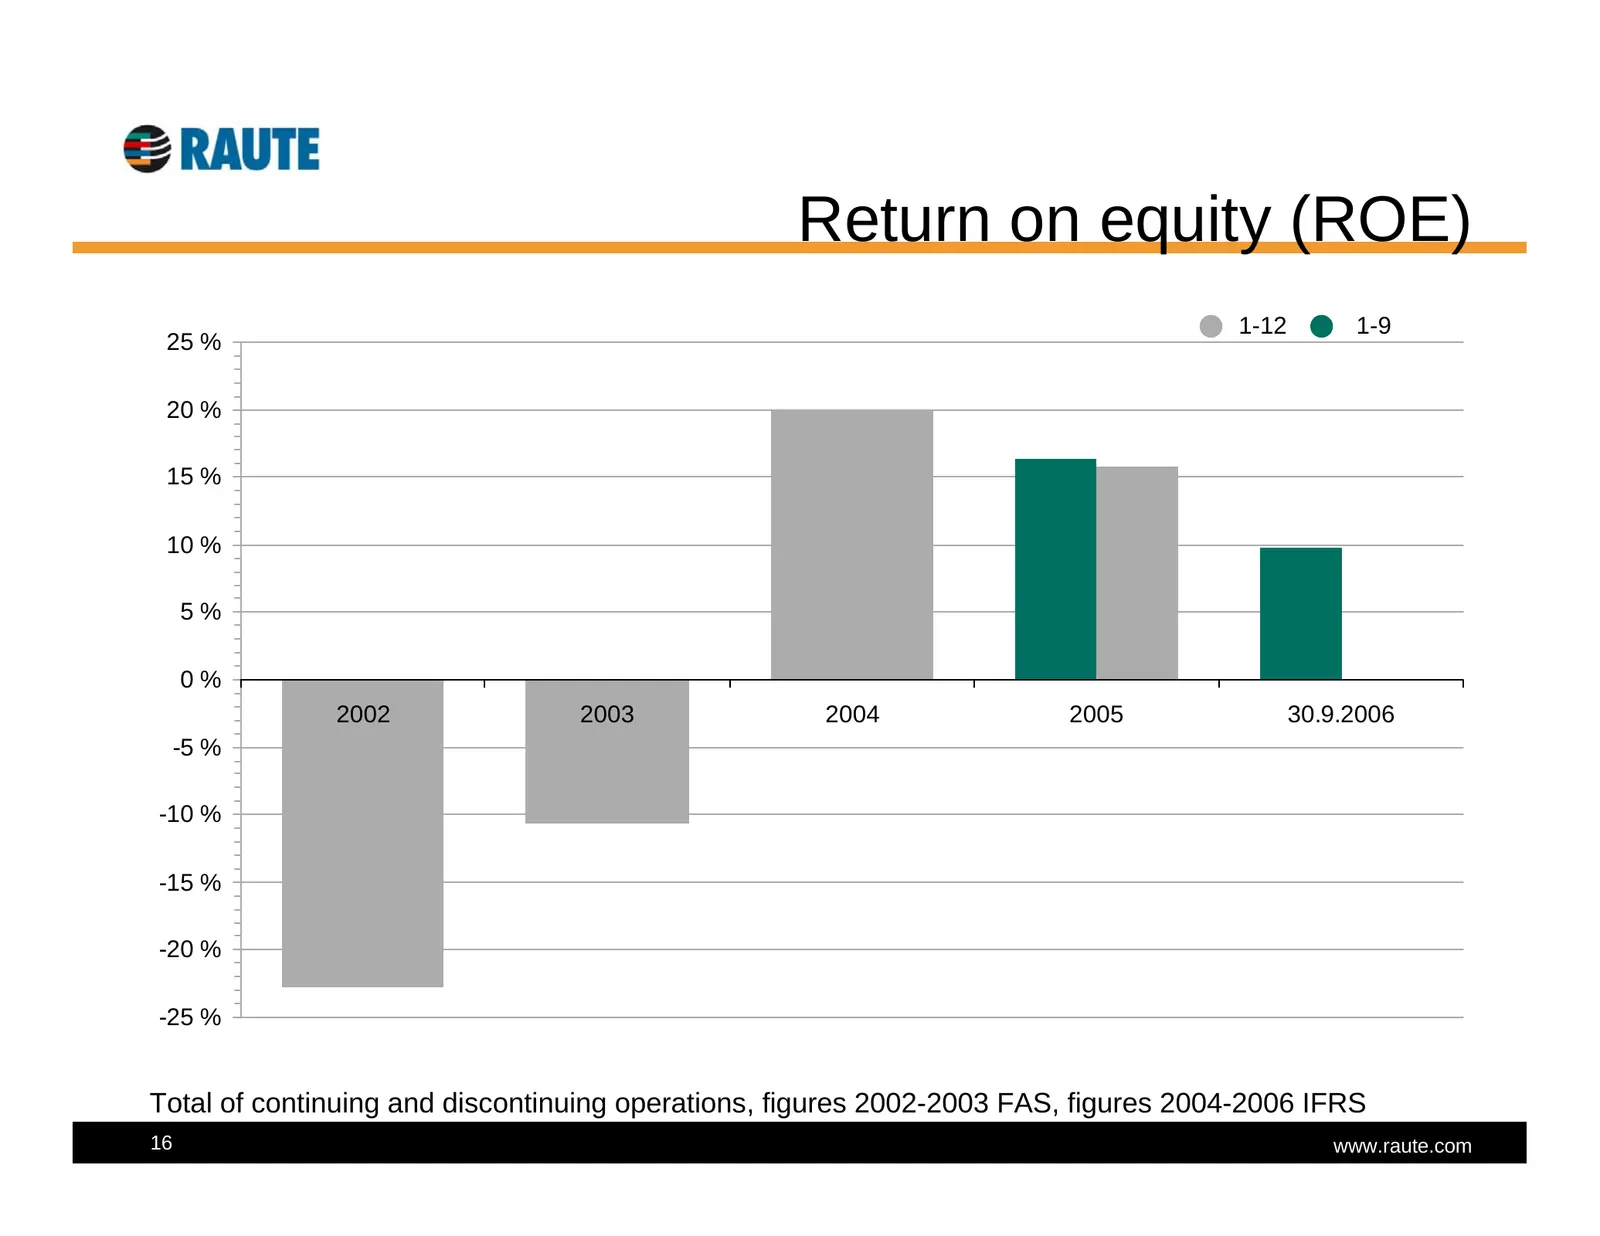
Slide 16: Return on equity (ROE)
Return on equity (ROE) 1-12 1-9 25 % 20 % 15 % 10 % 5% 0% 2002 2003 2004 2005 30.9.2006 -5 % -10 % -15 % -20 % -25 % Total of continuing and discontinuing operations, figures 2002-2003 FAS, figures 2004-2006 IFRS 16 www.raute.com
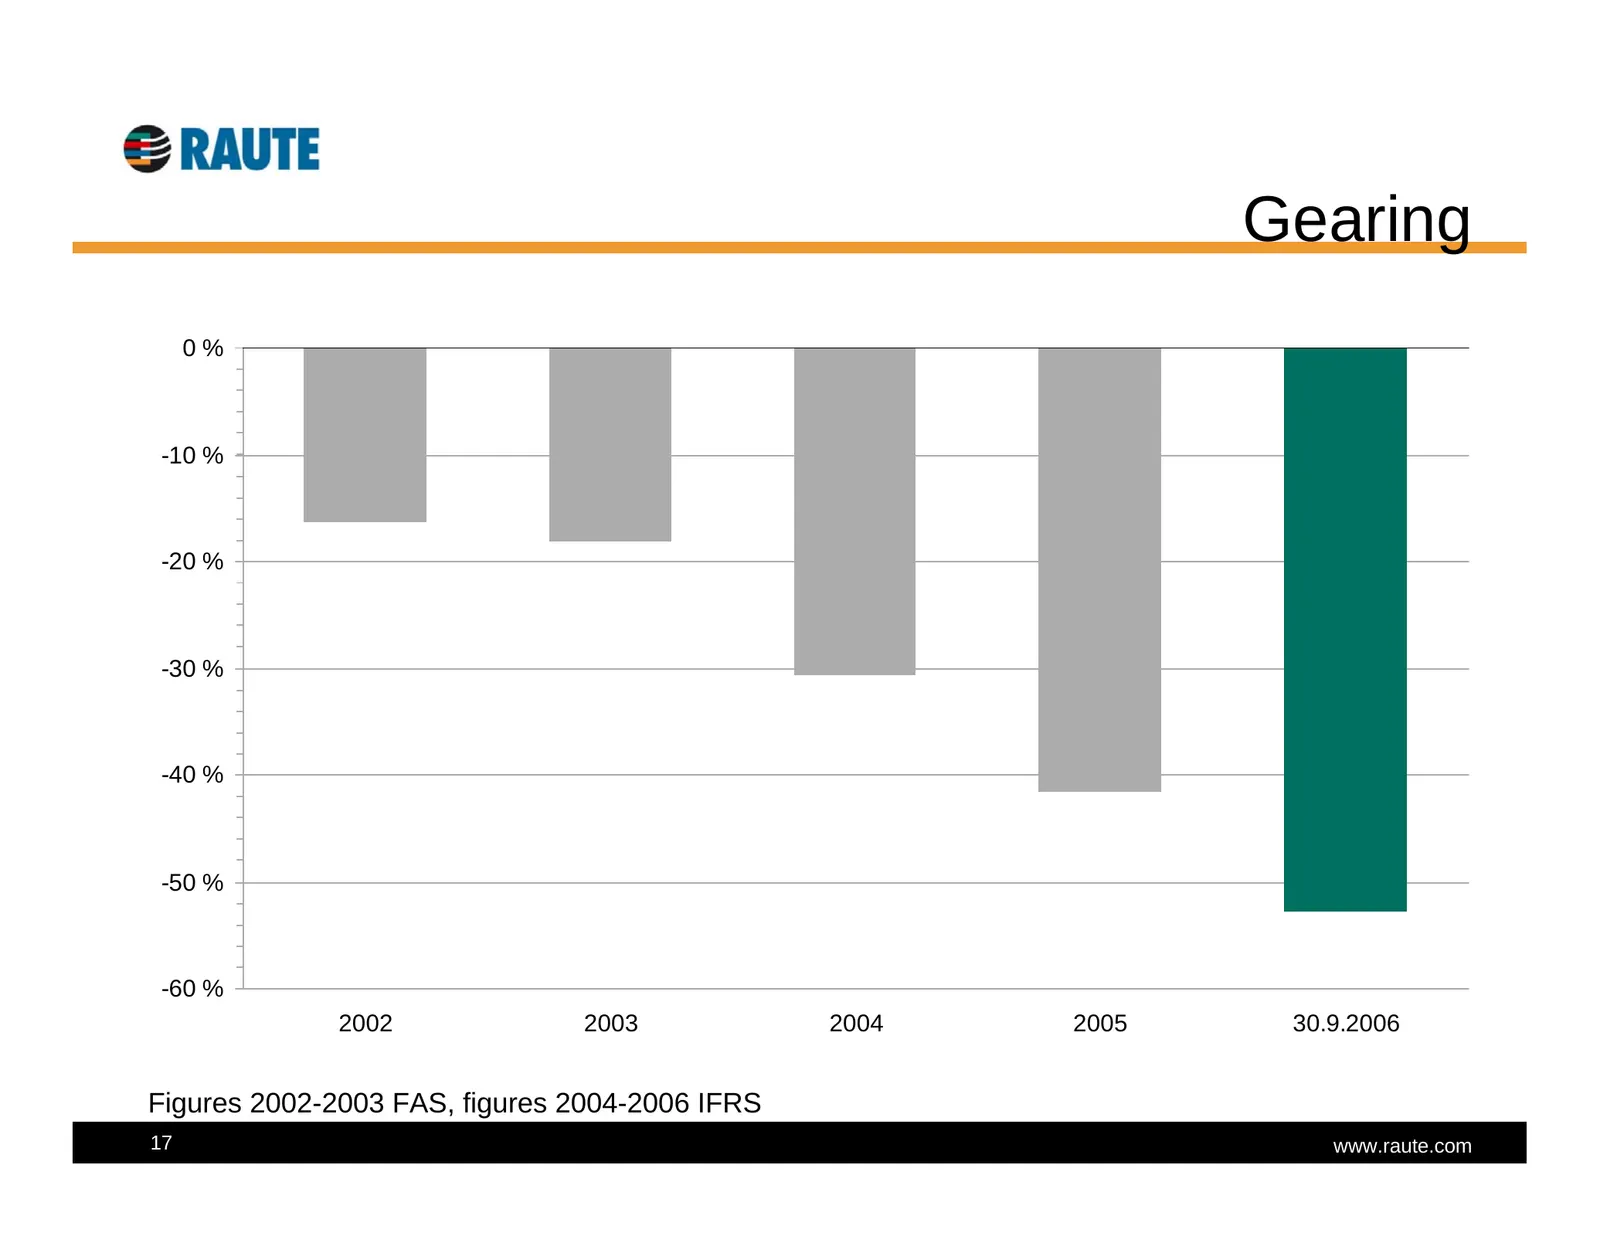
Slide 17: Gearing
Gearing 0% -10 % -20 % -30 % -40 % -50 % -60 % 2002 2003 2004 2005 30.9.2006 Figures 2002-2003 FAS, figures 2004-2006 IFRS 17 www.raute.com
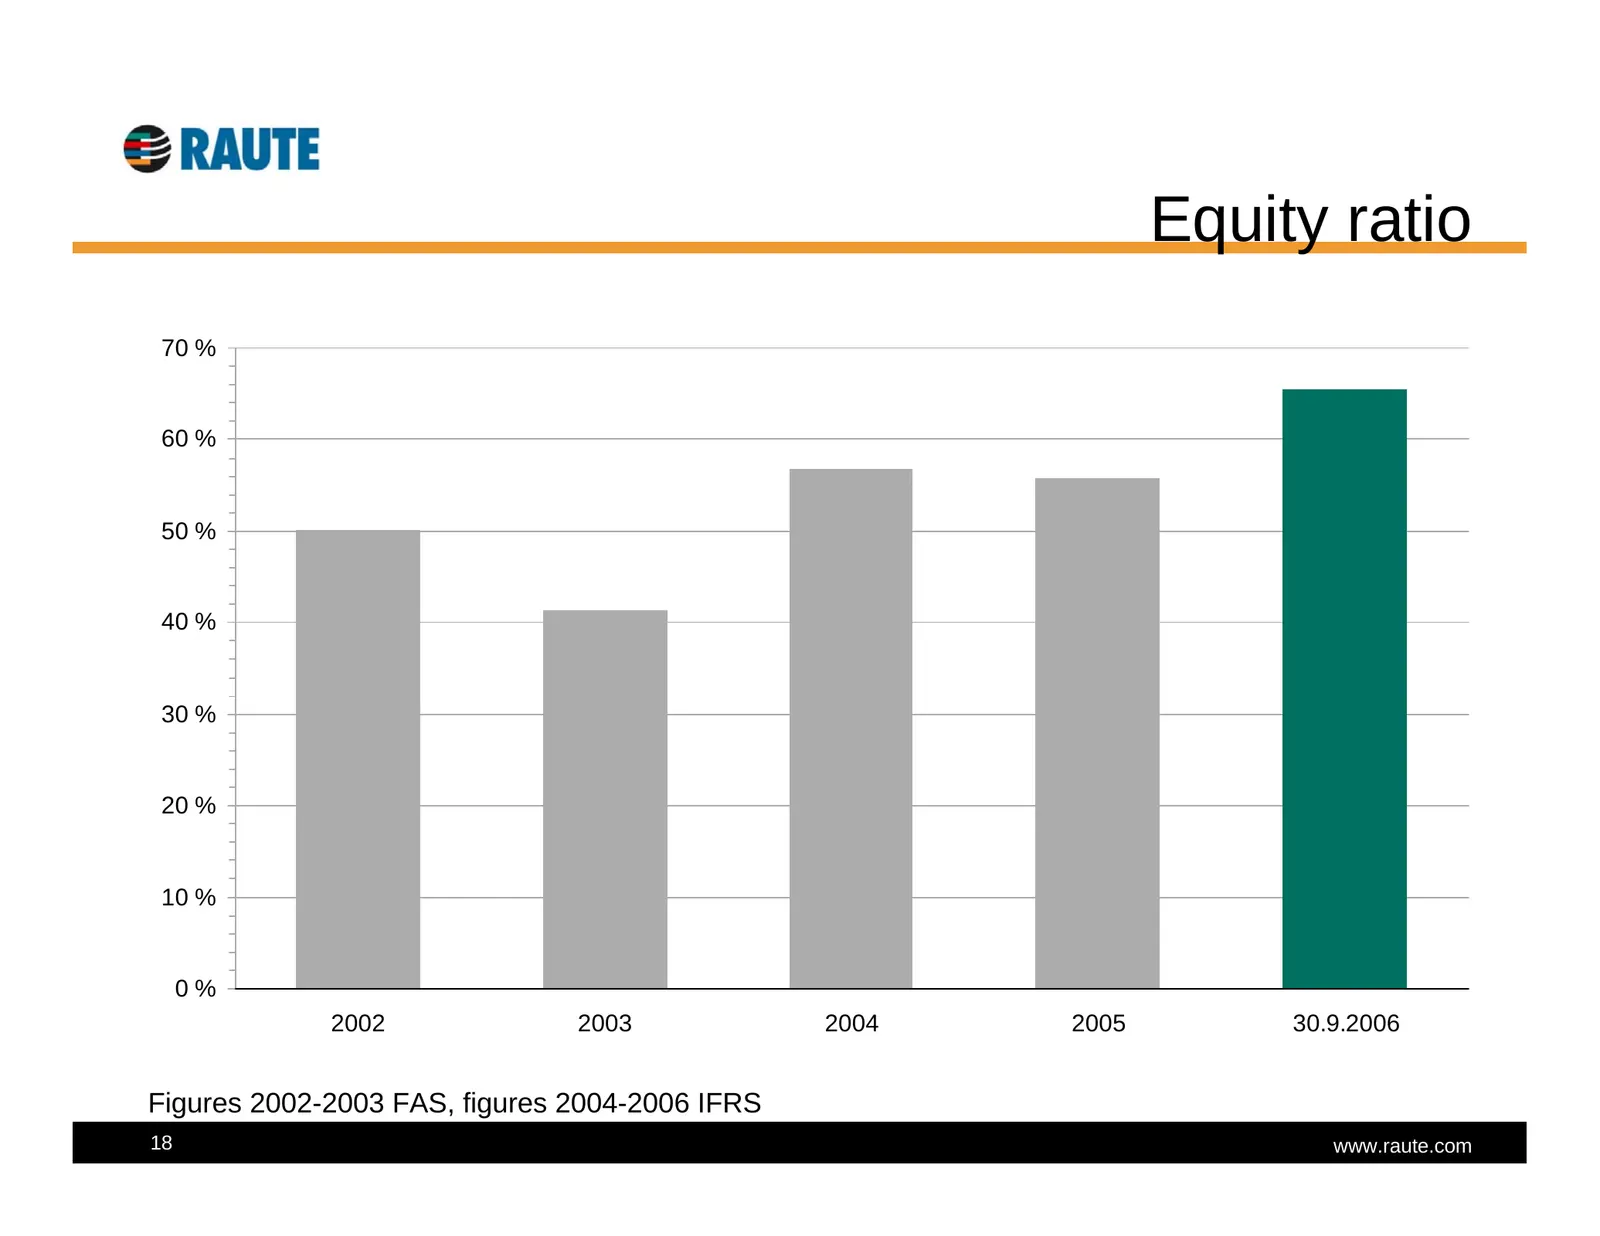
Slide 18: Equity ratio
Equity ratio 70 % 60 % 50 % 40 % 30 % 20 % 10 % 0% 2002 2003 2004 2005 30.9.2006 Figures 2002-2003 FAS, figures 2004-2006 IFRS 18 www.raute.com
Slide 19: Year-end market outlook good
Year-end market outlook good • Most markets for wood products remain good in the near future • Investment demand continues on a good level: – Demand focused on large, mill-scale projects – Brisk demand in Russia – Slack investment demand continues in plywood industry in North America • Demand for te
Slide 20: Outlook for 2006
Outlook for 2006 • Demand and order book at a good level • Focus of demand in large projects, which strengthens Raute’s competitive position. • Development of Technology services continues. Growth behind last year due to lack of large modernization projects • R&D continues strong • Net sales in 2006
Slide 21: Q3 Theme: Mill-scale deliveries as a strength
Q3 Theme Mill-scale deliveries as a strength www.raute.com
Slide 22: Mill-scale deliveries
Mill-scale deliveries* • A mill-scale delivery includes most of the Facts: main production lines and their • Raute has made 60 automation: mill-scale deliveries for – Implementation of a demanding greenfield the veneer, plywood and LVL industries project with necessary infrastructure – Adding a new,
Slide 23: Example lay-out for softwood plywood mill
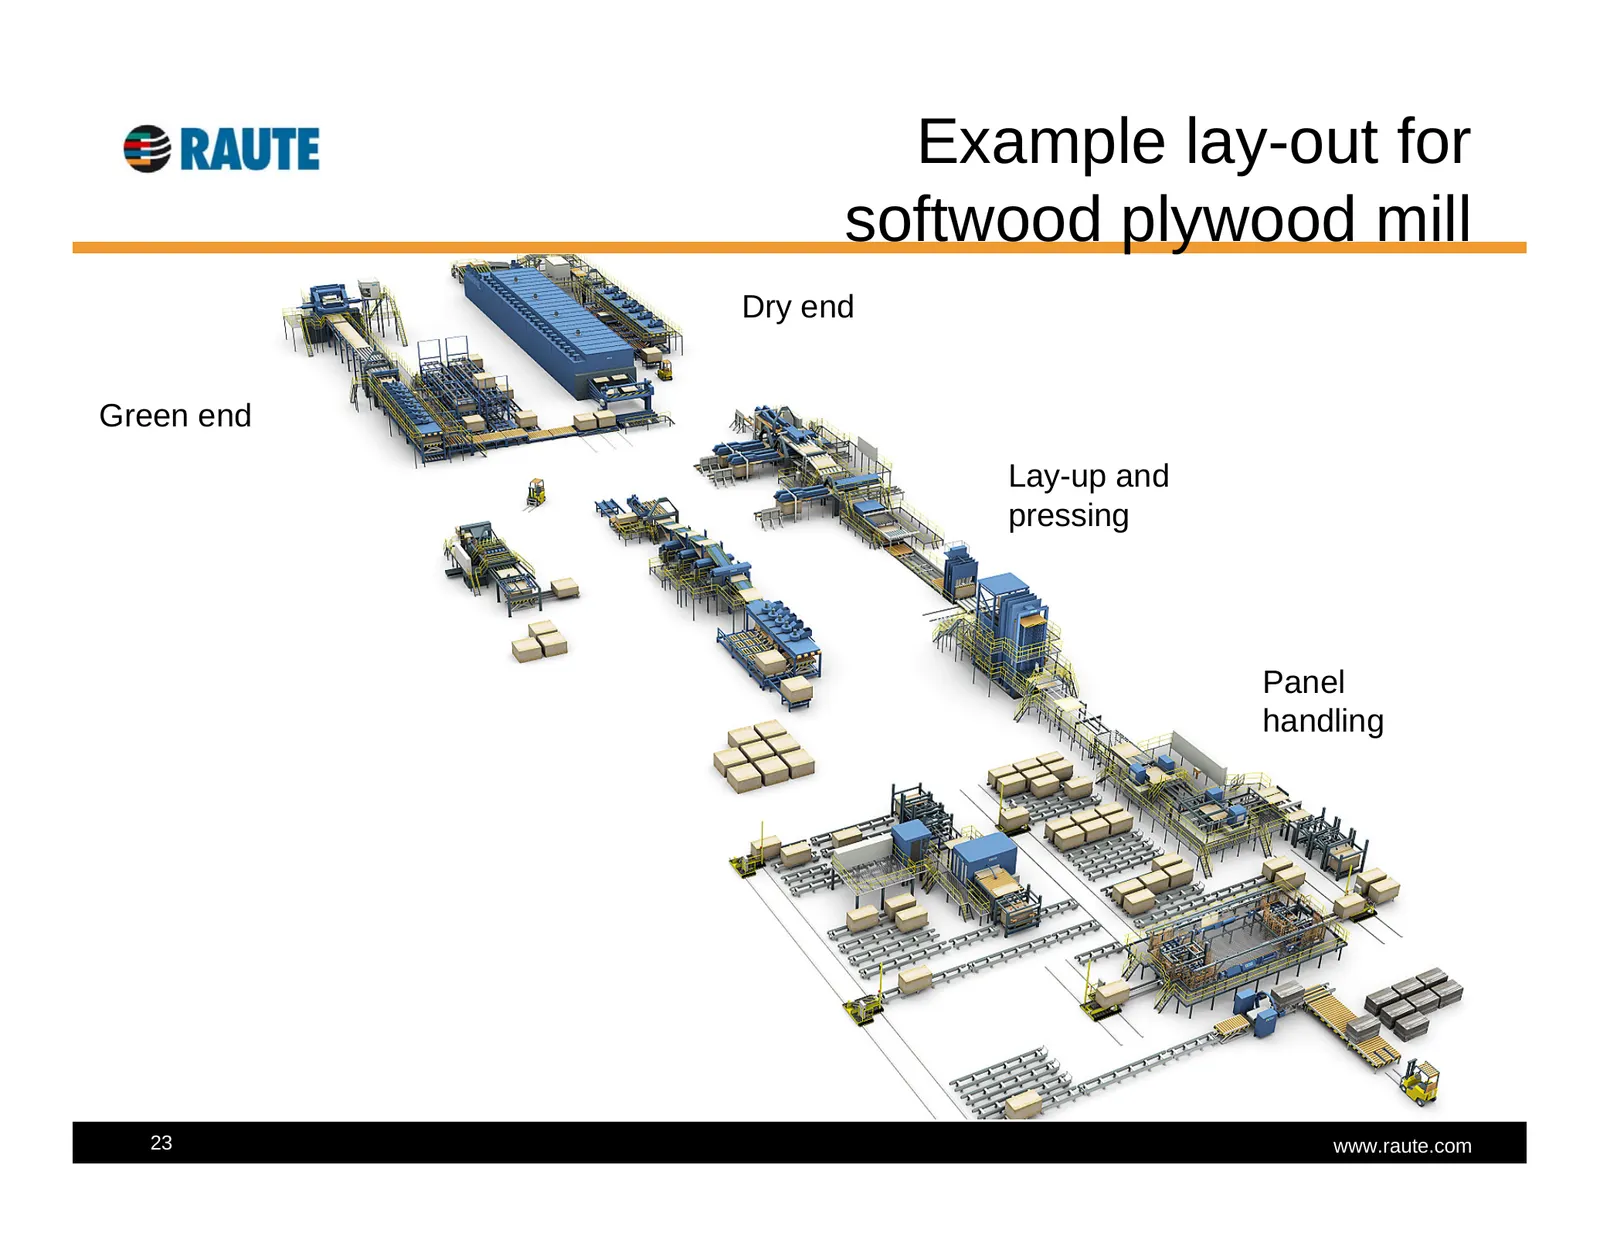
Example lay-out for softwood plywood mill Dry end Green end Lay-up and pressing Panel handling 23 www.raute.com
Slide 24: Global production capacity
Global production capacity • The global production capacity for plywood and LVL (installed machinery) totals about 70 million m³, 40 million m³ of which is applicable for Raute’s products. • This capacity is made up of the aggregate production of about 500 plants of significant size (average annual
Slide 25: Single-source supplies
Single-source supplies • Raute is the only machine supplier in the world capable of delivering mill-scale entities with incorporated operations management and management information systems. • Alternatively, the entire process can be compiled of sub-process deliveries from different suppliers. • Rau
Slide 26: Customer's objectives
Customer’s objectives • The customer’s objective is an efficient overall process: – One single partner guarantees smooth connections between sub- processes, allows the development of the process as an entity, and a mill-wide management information system => fully integrated production process – Simi
Slide 27: Advantages of a single source supply
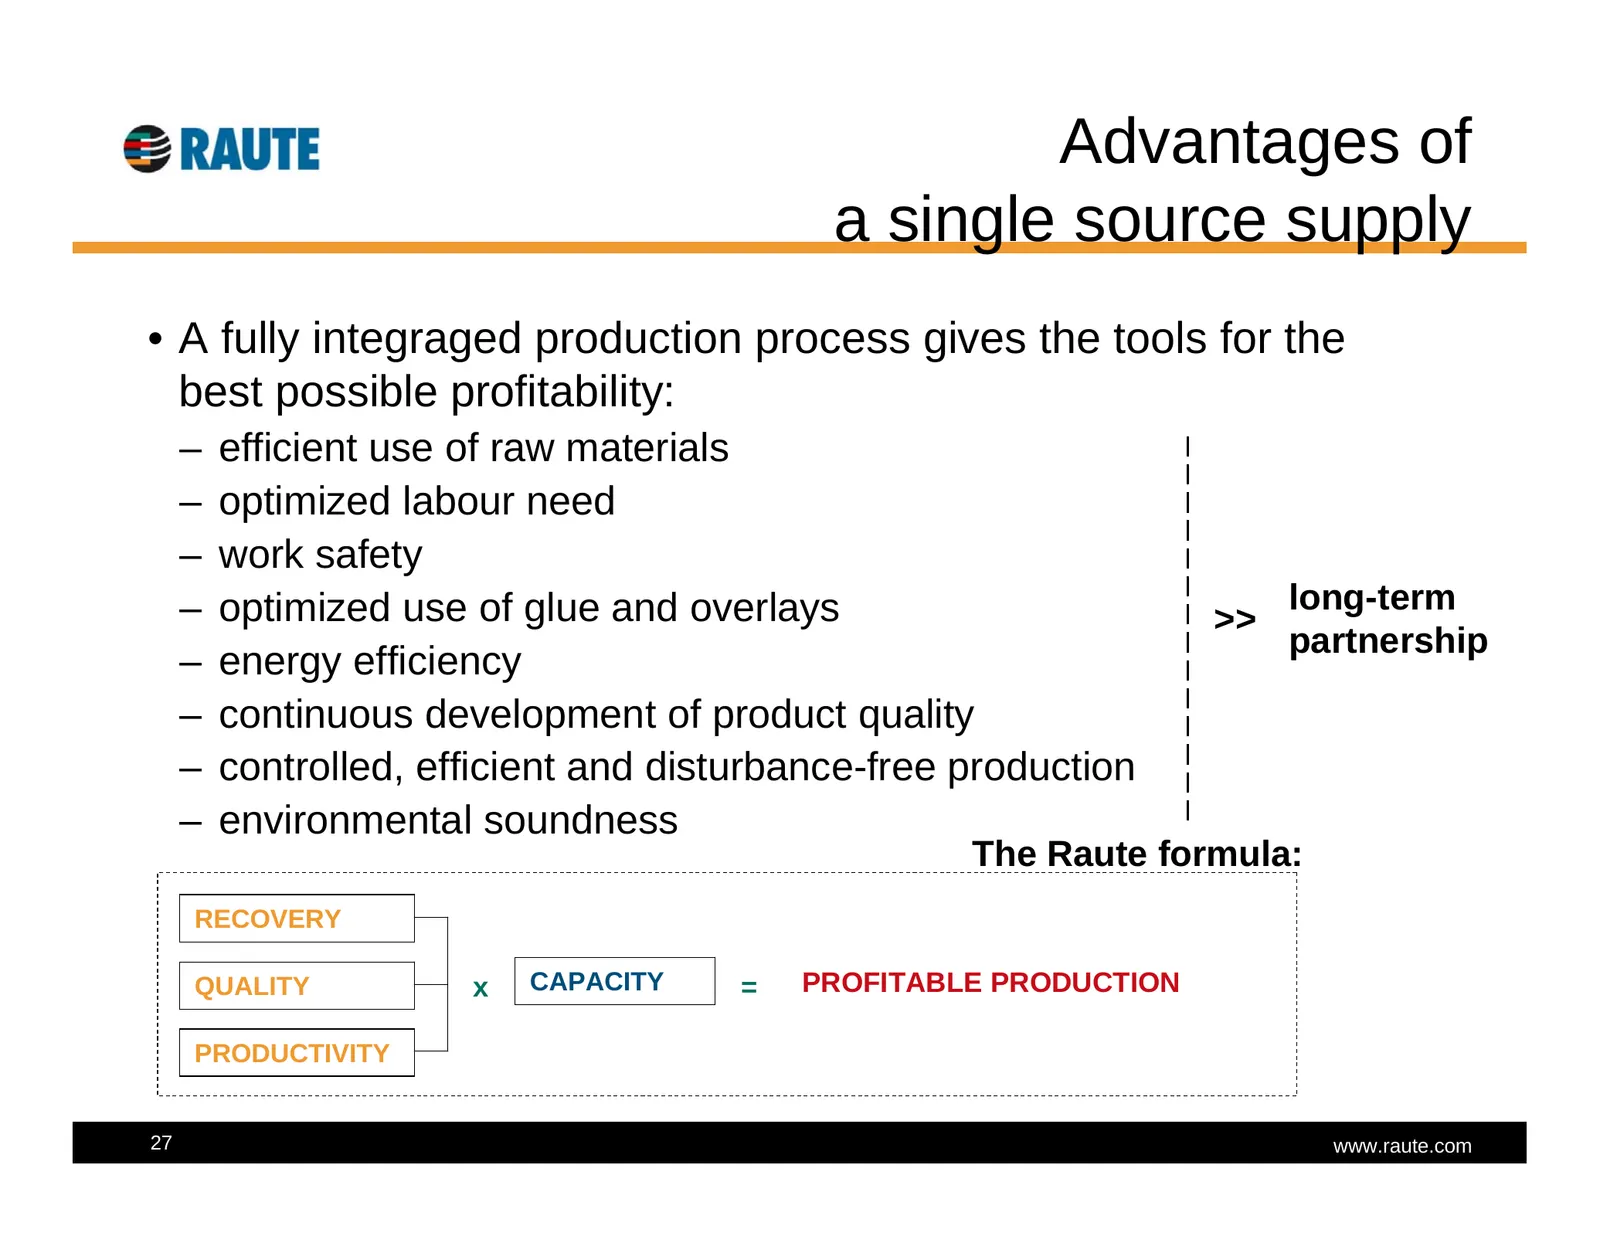
Advantages of a single source supply • A fully integraged production process gives the tools for the best possible profitability: – efficient use of raw materials – optimized labour need – work safety – optimized use of glue and overlays long-term >> partnership – energy efficiency – continuous deve
Slide 28: Contact information
Contact information Tapani Kiiski President and CEO +358 400 814 148 tapani.kiiski@raute.com Arja Hakala CFO +358 400 710 387 arja.hakala@raute.com www.raute.com
Source: Internet Archive copy of raute.com
More decks from Raute Oyj Class A
 H1 2026 Earnings Presentation29 slides · Aug 12, 2026
 Q1 2026 Earnings Presentation29 slides · May 7, 2026
 FY2025 Earnings Presentation30 slides · Feb 12, 2026
 Q3 2025 Earnings Presentation29 slides · Oct 30, 2025
 H1 2025 Earnings Presentation29 slides · Aug 12, 2025
 Q1 2025 Earnings Presentation29 slides · May 7, 2025