Nuveen Investments — Investor Presentation (November 2006)
20 slides from Nuveen Investments's investor presentation, Nov 15, 2006
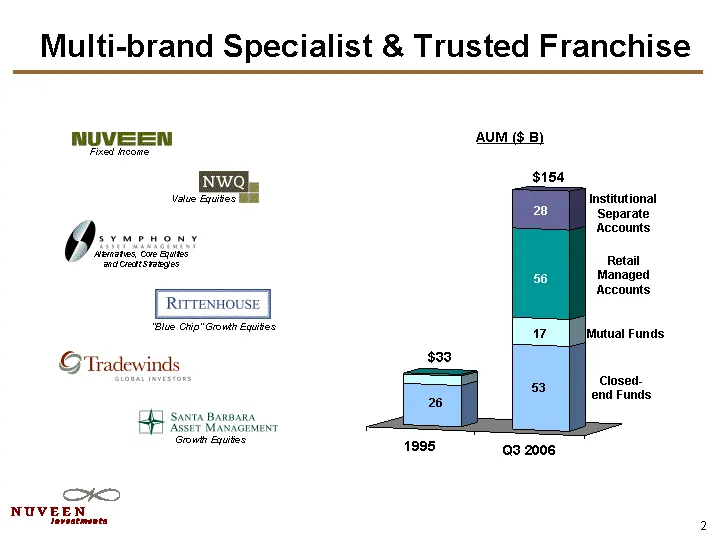
Slide 1: Multi-brand Specialist & Trusted Franchise
1995 Q3 2006 26 53 6 17 1 56 28 Institutional Separate Accounts Retail Managed Accounts Mutual Funds Closed- end Funds 26 $33 28 56 17 53 $154 Multi-brand Specialist & Trusted Franchise AUM ($ B) Fixed Income Value Equities Value Equities "Blue Chip" Growth Equities Alternatives, Core Equities and C
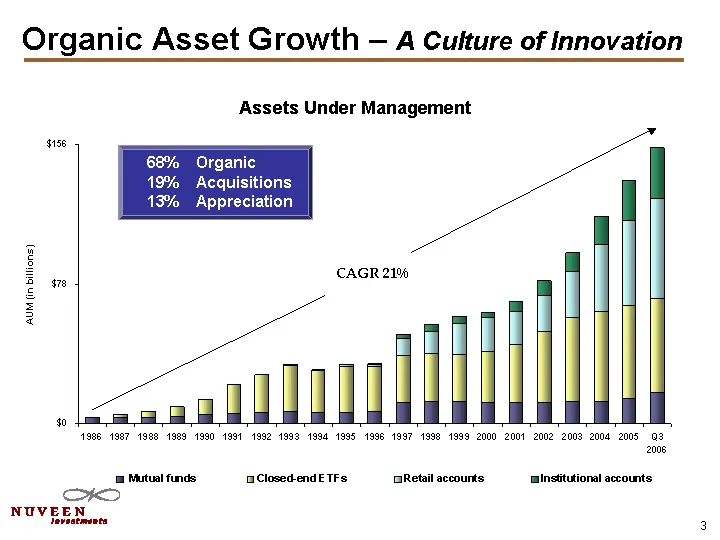
Slide 2: Organic Asset Growth - A Culture of Innovation
Organic Asset Growth - A Culture of Innovation 1986 1987 1988 1989 1990 1991 1992 1993 1994 1995 1996 1997 1998 1999 2000 2001 2002 2003 2004 2005 Q3 2006 Mutual funds 3.83 3.54 3.78 4.18 4.8 5.71 6.4 6.92 5.97 6.57 6.93 11.86 12.71 12.04 11.96 11.81 11.849 12.3 12.7 14 17.4 Closed-end ETFs - 1.79 3
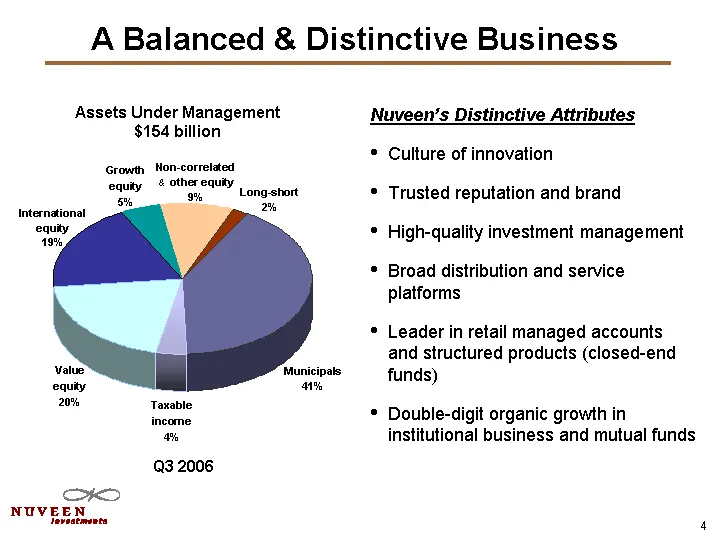
Slide 3: A Balanced & Distinctive Business
Municipals Taxable income Value equity International Growth equity Non-correlated Long-short 1Q 2004 41 4 20 19 5 9 2 Assets Under Management $154 billion Municipals 41% Long-short 2% Non-correlated & other equity 9% Taxable income 4% Value equity 20% International equity 19% Growth equity 5% A Bala
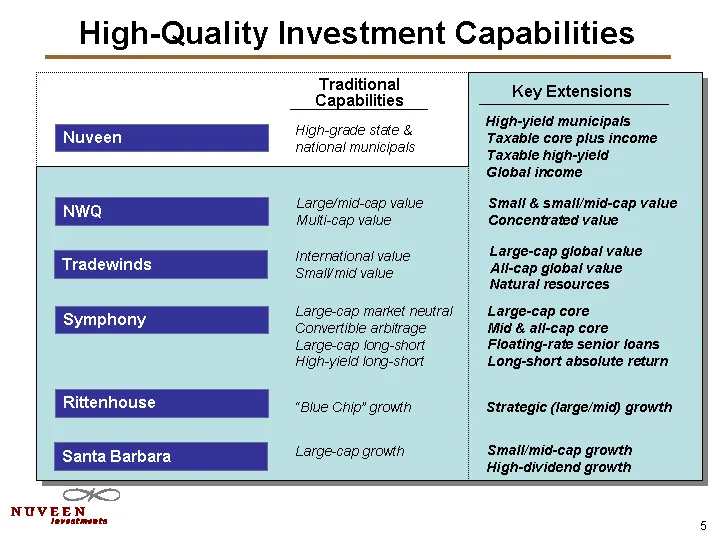
Slide 4: High-Quality Investment Capabilities
High-Quality Investment Capabilities Key Extensions Traditional Capabilities NWQ Rittenhouse Symphony Large/mid-cap value Multi-cap value Large-cap market neutral Convertible arbitrage Large-cap long-short High-yield long-short "Blue Chip" growth High-grade state & national municipals Nuveen Santa B
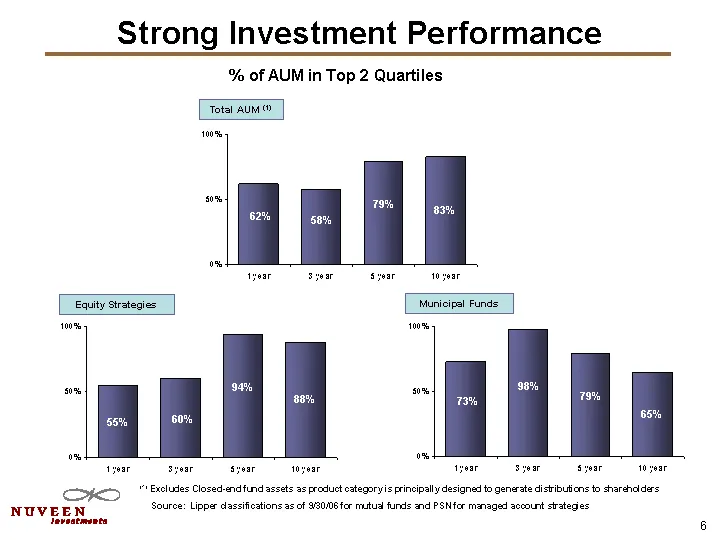
Slide 5: Strong Investment Performance
1 year 3 year 5 year 10 year Equity Mutual Funds 0.55 0.6 0.94 0.88 Equity Strategies Strong Investment Performance Total AUM (1) % of AUM in Top 2 Quartiles (1) Excludes Closed-end fund assets as product category is principally designed to generate distributions to shareholders 1 year 3 year 5 year
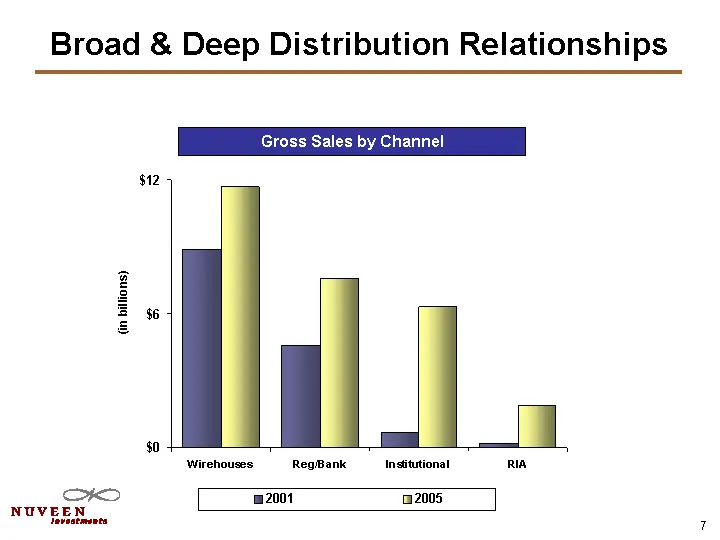
Slide 6: Broad & Deep Distribution Relationships
Broad & Deep Distribution Relationships Wirehouses Reg/Bank Institutional RIA 2001 8.9 4.6 0.7 0.2 2005 11.7 7.6 6.3 1.9 Gross Sales by Channel (in billions)
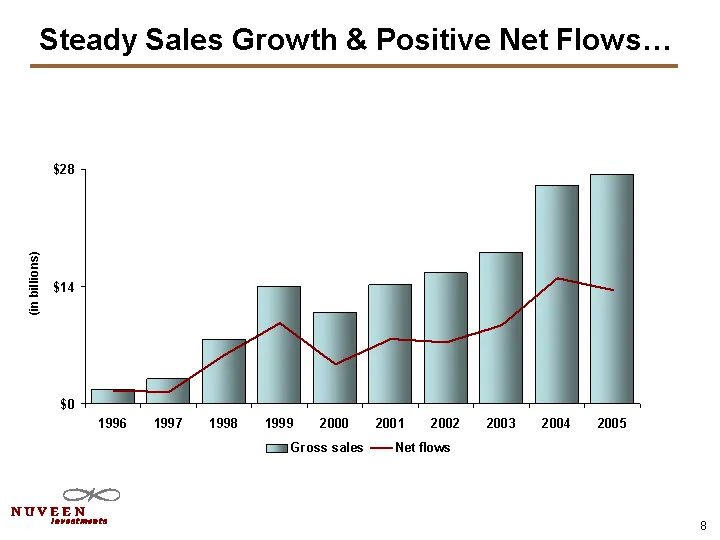
Slide 7: Steady Sales Growth & Positive Net Flows
Steady Sales Growth & Positive Net Flows... 1996 1997 1998 1999 2000 2001 2002 2003 2004 2005 Gross sales 1.74 3.026 7.755 14.066 10.85 14.2 15.6 18.1 26 27.4 Net flows 1.6 1.427 5.8 9.6 4.7 7.7 7.3 9.4 15 13.6 (in billions)
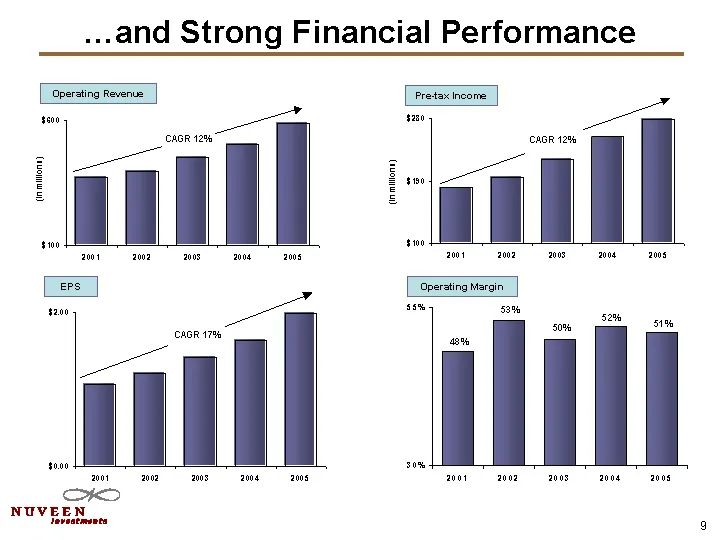
Slide 8: ...and Strong Financial Performance
2001 2002 2003 2004 2005 Pre-tax income 1.07 1.21 1.41 1.63 1.99 ....and Strong Financial Performance (in millions) 2001 2002 2003 2004 2005 Pre-tax income 180 195 221 253 279 CAGR 12% 2001 2002 2003 2004 2005 Nuveen 0.48 0.53 0.5 0.52 0.51 CAGR 17% 2001 2002 2003 2004 2005 Pre-tax income 371 396 45
Slide 9: Industry-leading Margins
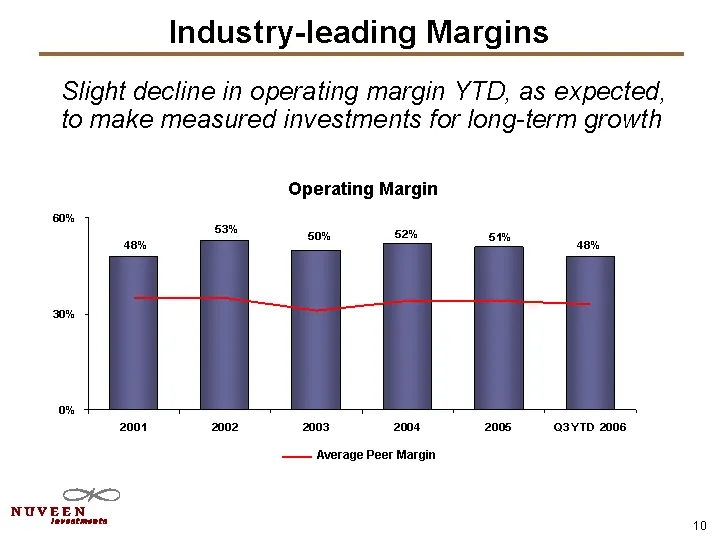
Industry-leading Margins 2001 2002 2003 2004 2005 Q3 YTD 2006 Nuveen 0.48 0.53 0.5 0.52 0.51 0.48 Average Peer Margin 0.35 0.35 0.31 0.34 0.34 0.33 Operating Margin Average Peer Margin Slight decline in operating margin YTD, as expected, to make measured investments for long-term growth
Slide 10: Next 5-10 Years: Strategic Growth Initiatives
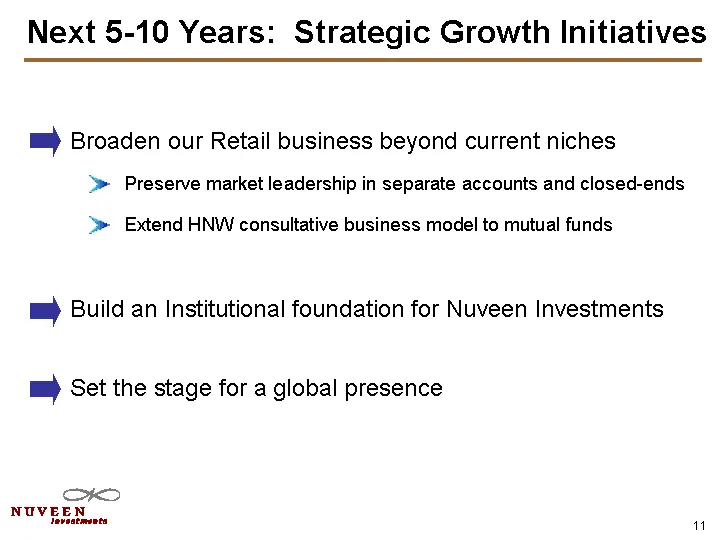
Next 5-10 Years: Strategic Growth Initiatives Broaden our Retail business beyond current niches Preserve market leadership in separate accounts and closed-ends Extend HNW consultative business model to mutual funds Build an Institutional foundation for Nuveen Investments Set the stage for a global p
Slide 11: Future Growth: Broaden Retail Business
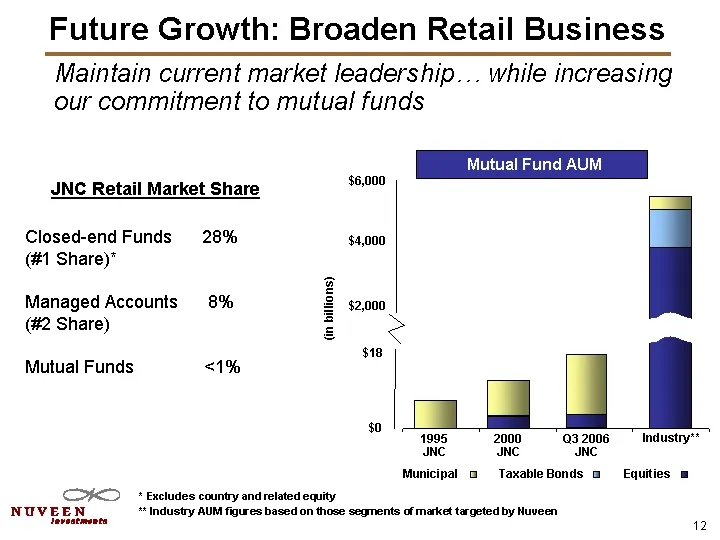
Future Growth: Broaden Retail Business Maintain current market leadership... while increasing our commitment to mutual funds JNC Retail Market Share Closed-end Funds 28% (#1 Share)* Managed Accounts 8% (#2 Share) Mutual Funds <1% * Excludes country and related equity ** Industry AUM figures based on
Slide 12: Future Growth: Mutual Fund Commitment
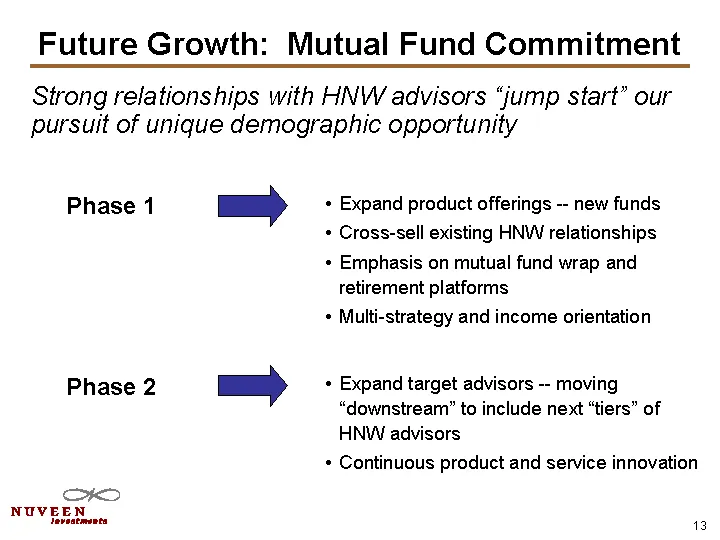
Future Growth: Mutual Fund Commitment Expand product offerings -- new funds Cross-sell existing HNW relationships Emphasis on mutual fund wrap and retirement platforms Multi-strategy and income orientation Strong relationships with HNW advisors "jump start" our pursuit of unique demographic opportun
Slide 13: Future Growth: Mutual Fund Commitment
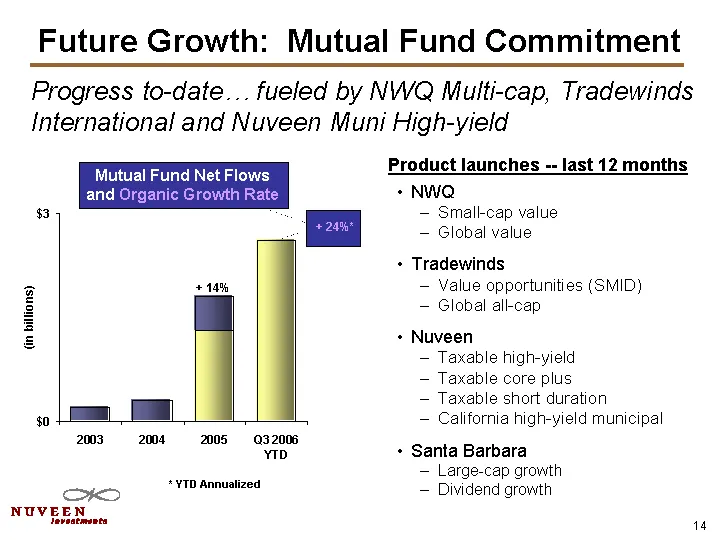
NWQ Small-cap value Global value Tradewinds Value opportunities (SMID) Global all-cap Nuveen Taxable high-yield Taxable core plus Taxable short duration California high-yield municipal Santa Barbara Large-cap growth Dividend growth Future Growth: Mutual Fund Commitment Mutual Fund Net Flows and Orga
Slide 14: Future Growth: Build Institutional Foundation
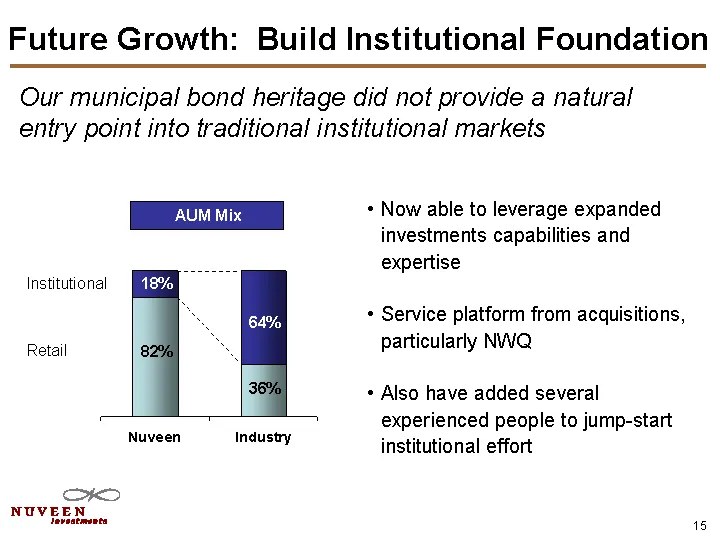
Future Growth: Build Institutional Foundation Our municipal bond heritage did not provide a natural entry point into traditional institutional markets Nuveen Industry Institutional 82 36 Retail 18 64 Institutional Retail 18% 64% 82% 36% Now able to leverage expanded investments capabilities and expe
Slide 15: Future Growth: Build Institutional Foundation
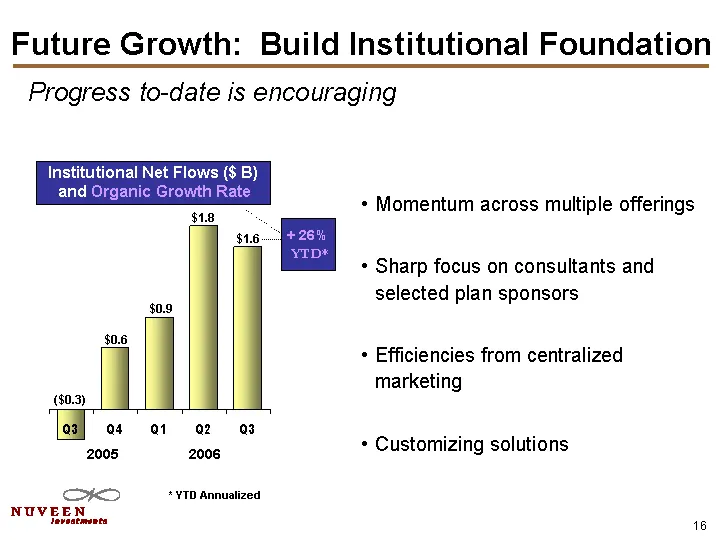
Future Growth: Build Institutional Foundation Institutional Net Flows ($ B) and Organic Growth Rate Momentum across multiple offerings Sharp focus on consultants and selected plan sponsors Efficiencies from centralized marketing Customizing solutions Q3 Q4 Q1 Q2 Q3 Institutional -0.3 0.6 0.9 1.8 1.6
Slide 16: Future Growth: Set Stage for Global
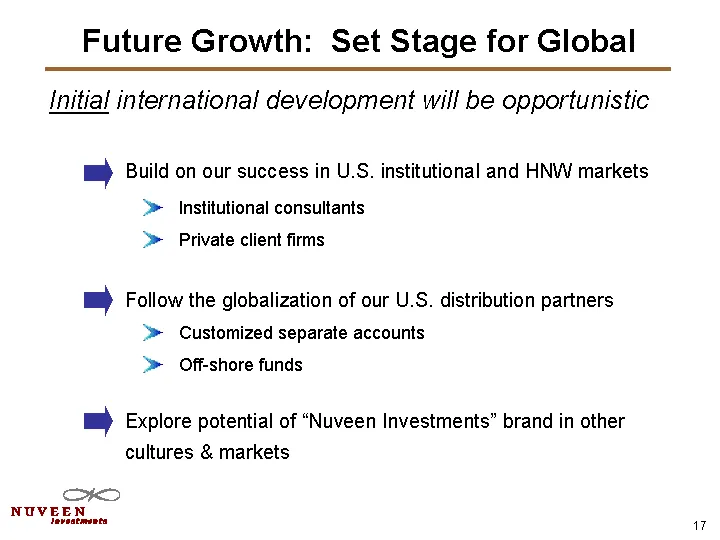
Future Growth: Set Stage for Global Build on our success in U.S. institutional and HNW markets Institutional consultants Private client firms Follow the globalization of our U.S. distribution partners Customized separate accounts Off-shore funds Explore potential of "Nuveen Investments" brand in oth
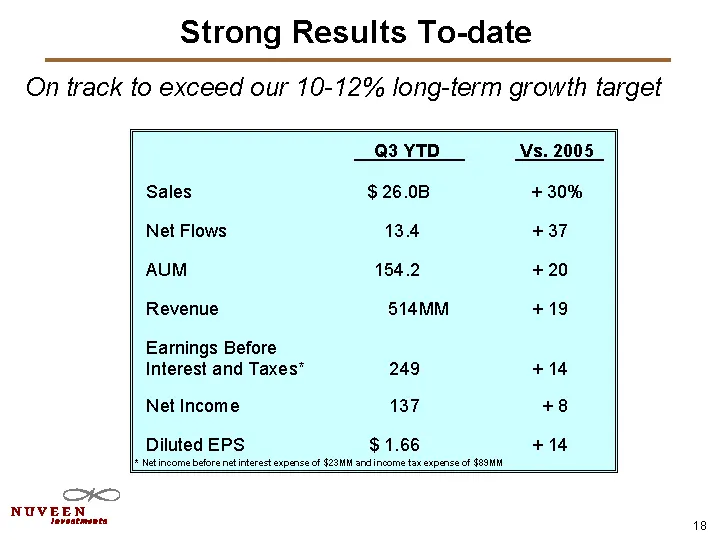
Slide 17: Strong Results To-date
Strong Results To-date * Net income before net interest expense of $23MM and income tax expense of $89MM On track to exceed our 10-12% long-term growth target
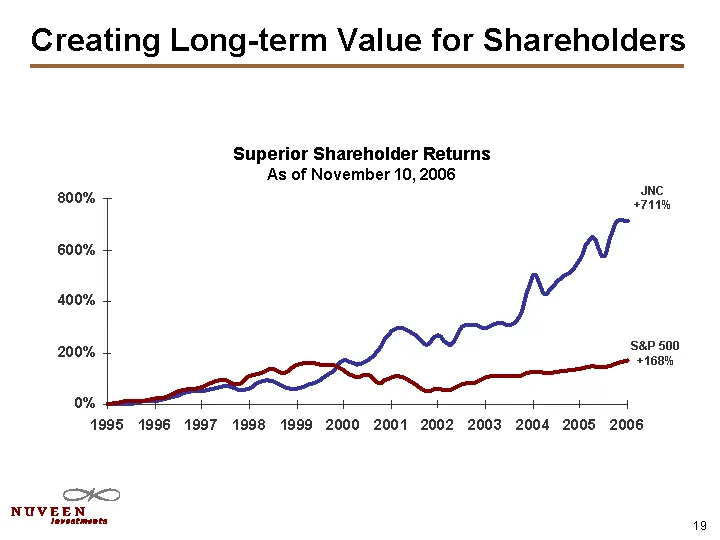
Slide 18: Creating Long-term Value for Shareholders
Creating Long-term Value for Shareholders 12/31/1995 3/31/1996 6/30/1996 9/30/1996 12/31/1996 3/31/1997 6/30/1997 9/30/1997 12/31/1997 3/31/1998 6/30/1998 9/30/1998 12/31/1998 3/31/1999 6/30/1999 9/30/1999 12/31/1999 3/31/2000 6/30/2000 9/30/2000 12/31/2000 3/31/2001 6/30/2001 9/30/2001 12/31/2001 3
Slide 19: Forward-Looking Statements
Forward-Looking Statements This presentation contains certain statements, estimates and forecasts with respect to future performance and events. These statements, estimates and forecasts are "forward-looking statements". Forward-looking statements are based on various underlying assumptions and expe

Slide 20: Nuveen Investments
NUVEEN Investments
Source: SEC EDGAR · 8-K filed Nov 15, 2006
More decks from Nuveen Investments Inc
 Debt Investor Presentation (December 2010)24 slides · Dec 13, 2010
 Deutsche Bank Leveraged Finance Conference 201024 slides · Oct 7, 2010
 Merger or Acquisition (July 2010)7 slides · Jul 29, 2010
 Deutsche Bank Leveraged Finance Conference 200924 slides · Oct 1, 2009
 Merger or Acquisition (August 2007)8 slides · Aug 29, 2007