Capita plc · LSE:CPI
Capita — H1 2014 Earnings Presentation
43 slides from Capita's earnings presentation, Jul 23, 2014
Slide 1: Results for the 6 months to 30 June 2014
Results for the 6 months to 30 June 2014 Half year results presentation 23 July 2014
Slide 2: Agenda
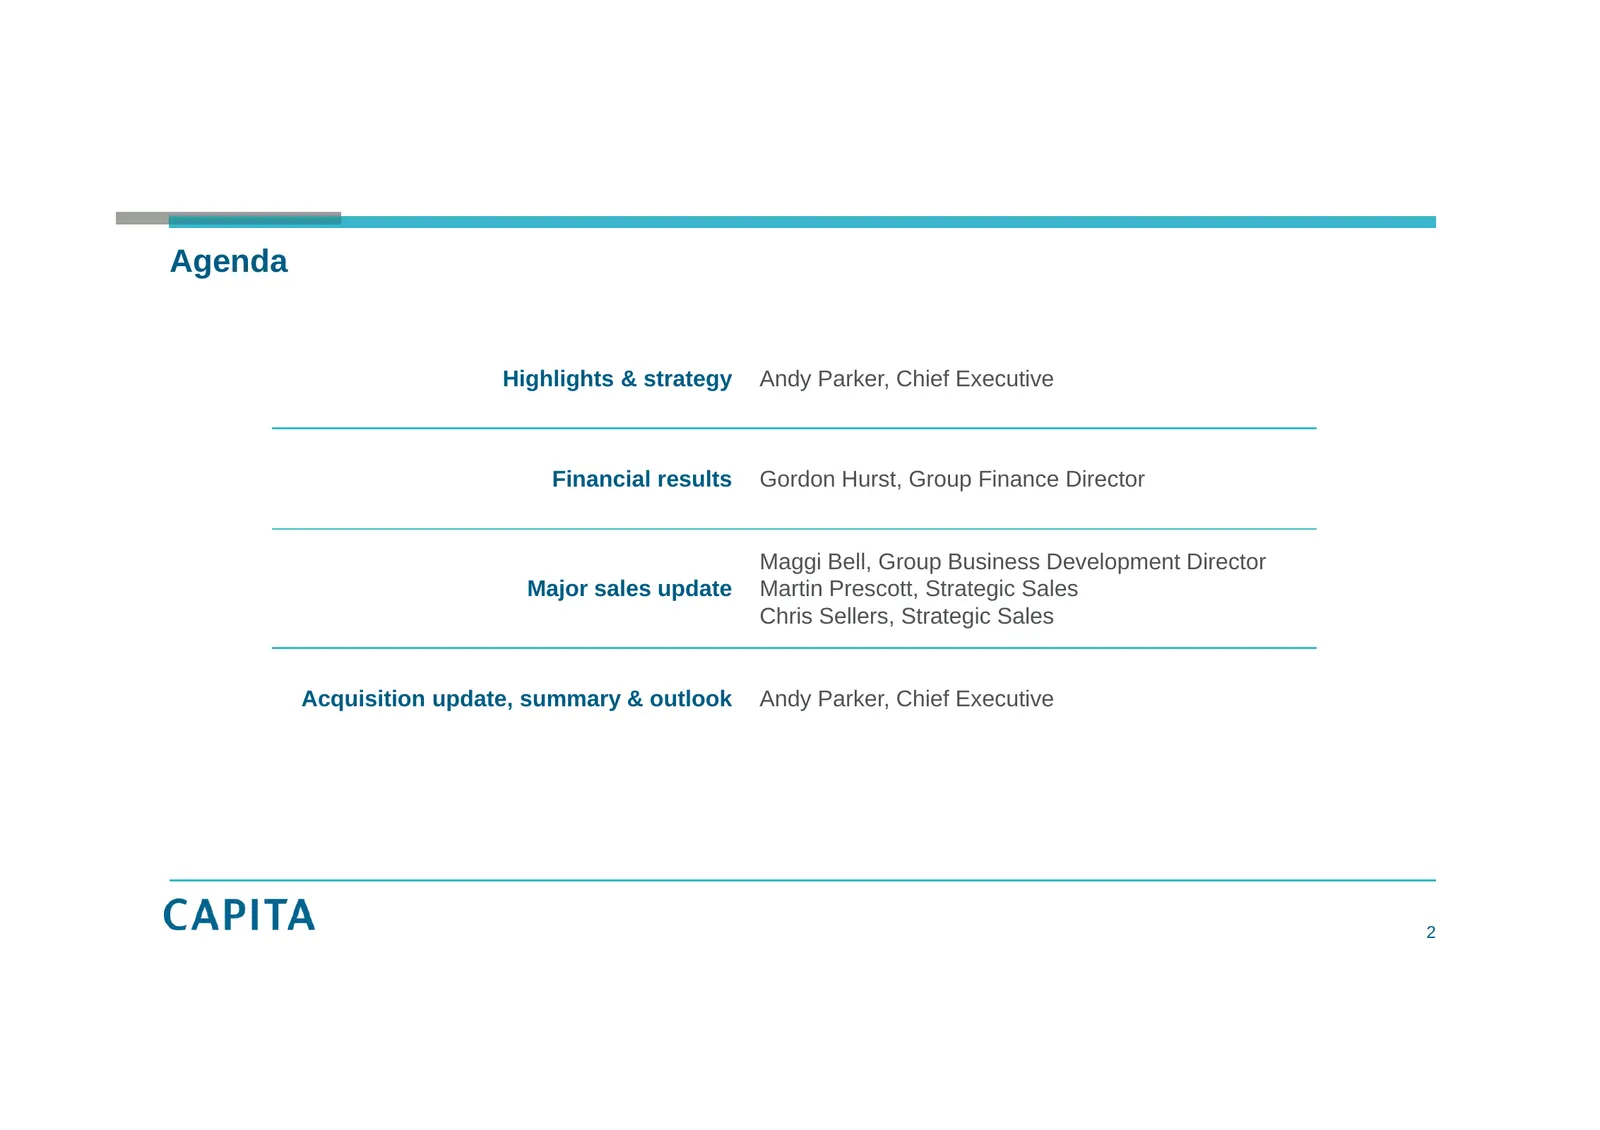
Agenda Highlights & strategy Andy Parker, Chief Executive Financial results Gordon Hurst, Group Finance Director Maggi Bell, Group Business Development Director Major sales update Martin Prescott, Strategic Sales Chris Sellers, Strategic Sales Acquisition update, summary & outlook Andy Parker, Chief
Slide 3: Highlights & strategy
Highlights & strategy Andy Parker Chief Executive 3
Slide 4: Good financial and sales performance
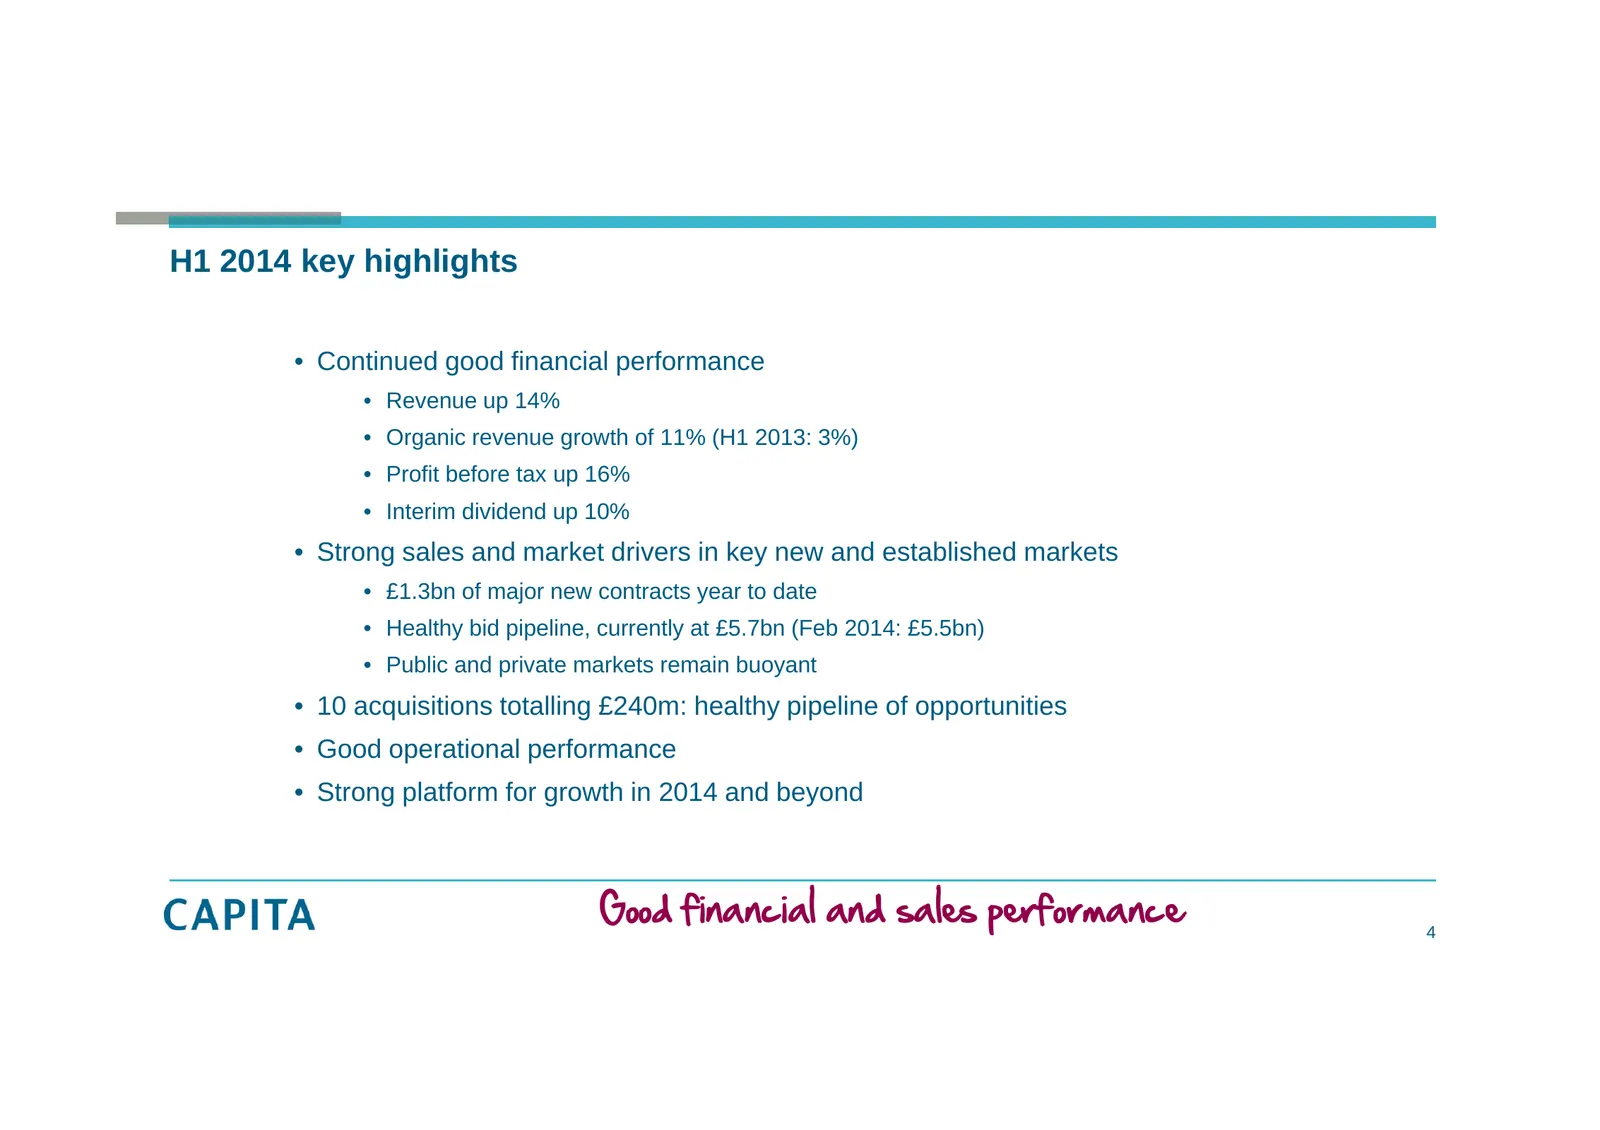
H1 2014 key highlights • Continued good financial performance • Revenue up 14% • Organic revenue growth of 11% (H1 2013: 3%) • Profit before tax up 16% • Interim dividend up 10% • Strong sales and market drivers in key new and established markets • £1.3bn of major new contracts year to date • Health
Slide 5: Creating value for all our stakeholders
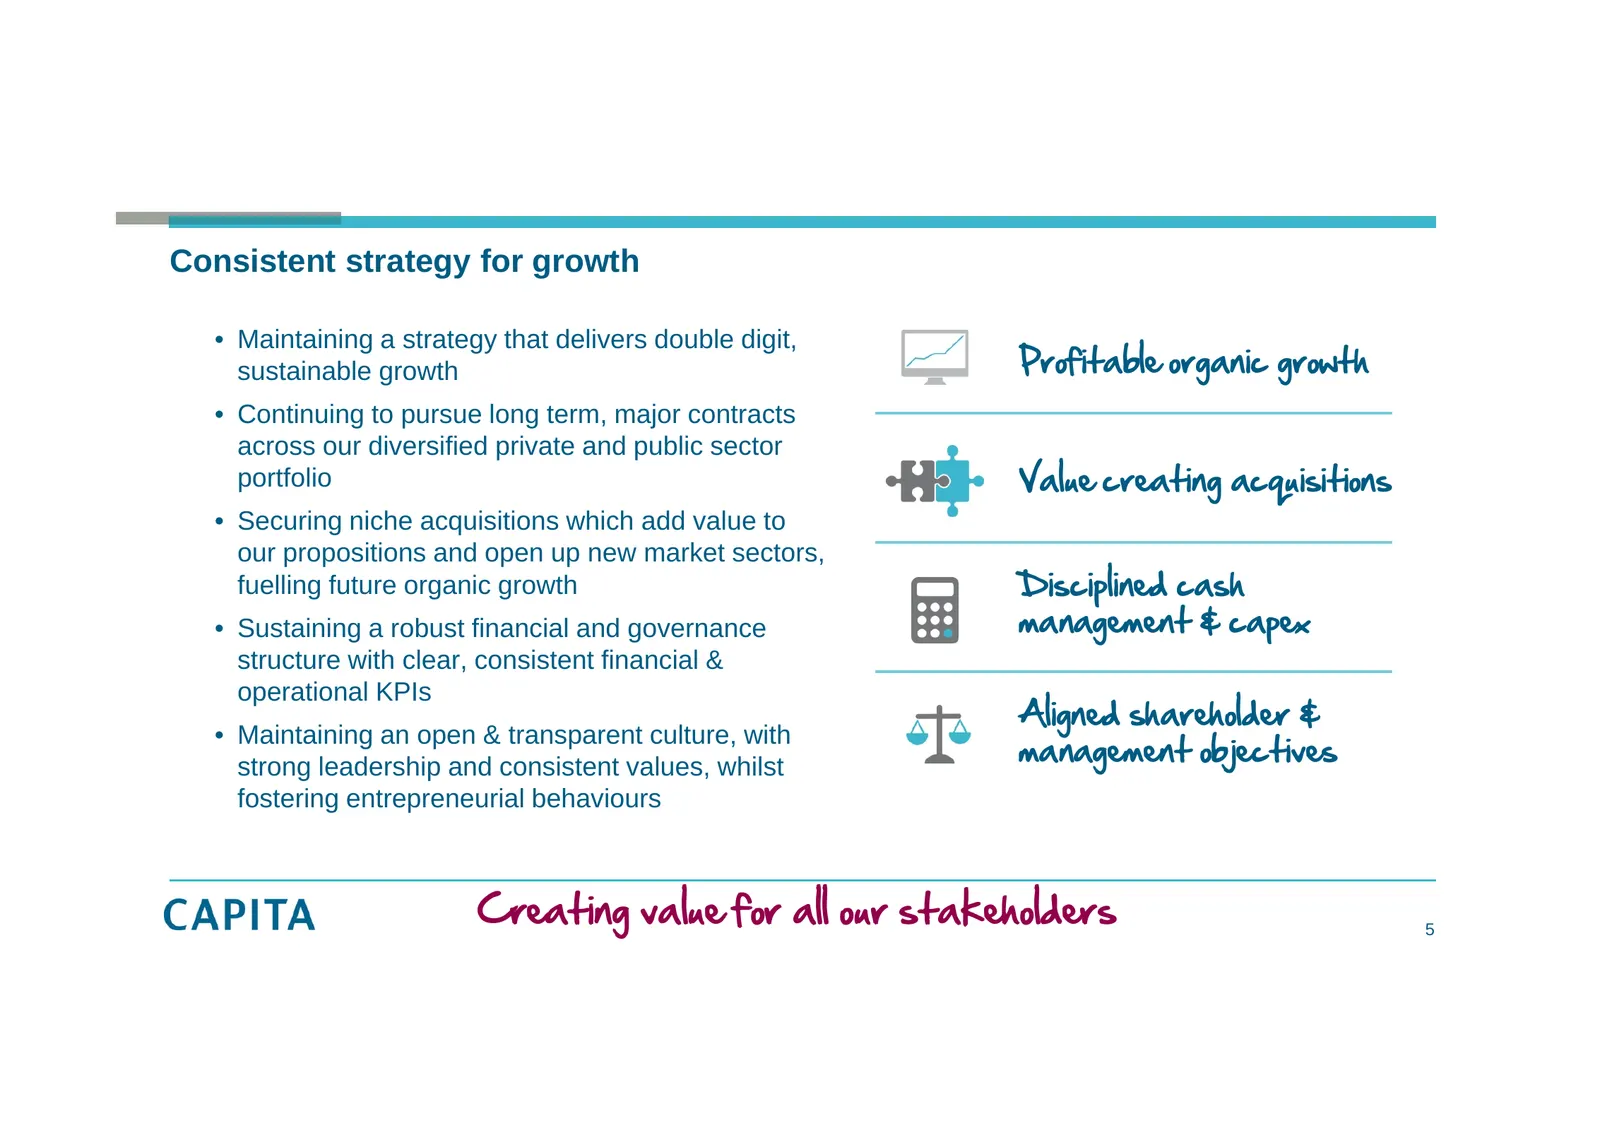
Consistent strategy for growth • Maintaining a strategy that delivers double digit, sustainable growth Profitable organic growth • Continuing to pursue long term, major contracts across our diversified private and public sector portfolio Value creating acquisitions • Securing niche acquisitions whic
Slide 6: Financial Results
Financial Results Gordon Hurst Group Finance Director 6
Slide 7: Continued revenue growth
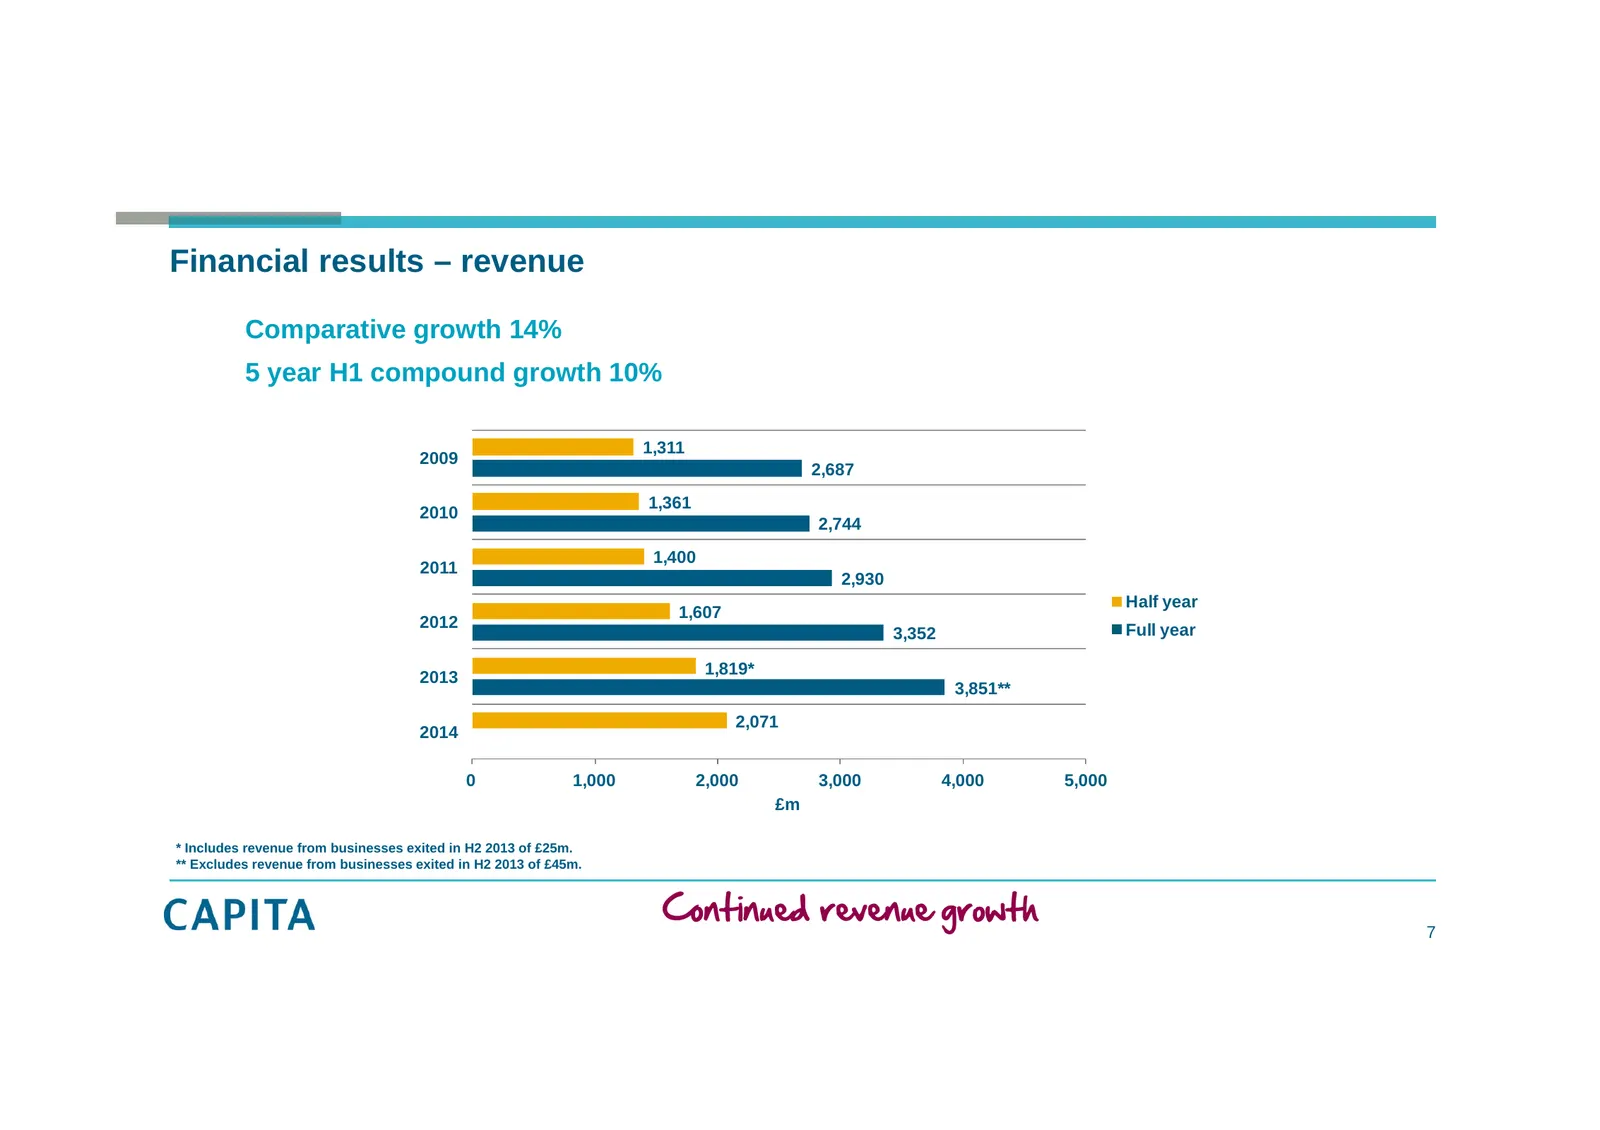
Financial results – revenue Comparative growth 14% 5 year H1 compound growth 10% 1,311 2009 2,687 1,361 2010 2,744 1,400 2011 2,930 Half year 1,607 2012 Full year 3,352 1,819* 2013 3,851** 2,071 2014 0 1,000 2,000 3,000 4,000 5,000 £m * Includes revenue from businesses exited in H2 2013 of £25m. **
Slide 8: Continuing strong organic growth
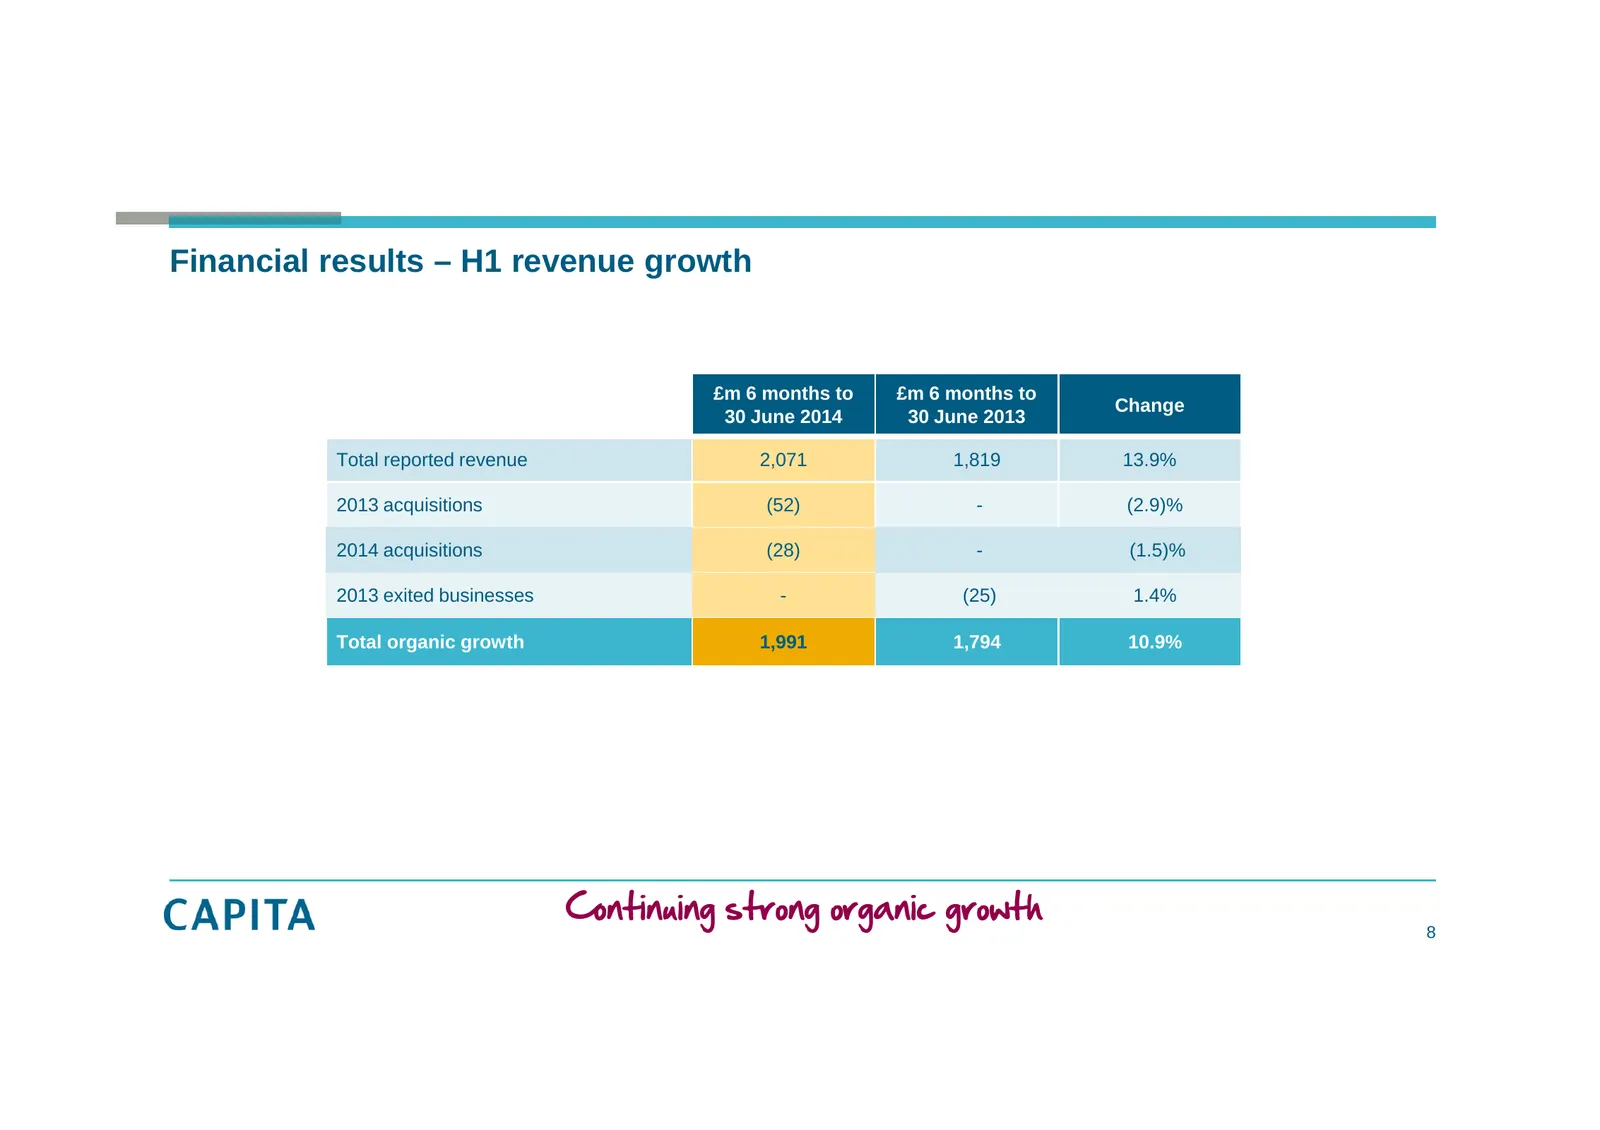
Financial results – H1 revenue growth £m 6 months to £m 6 months to Change 30 June 2014 30 June 2013 Total reported revenue 2,071 1,819 13.9% 2013 acquisitions (52) - (2.9)% 2014 acquisitions (28) - (1.5)% 2013 exited businesses - (25) 1.4% Total organic growth 1,991 1,794 10.9% Continuing strong or
Slide 9: Diverse market spread
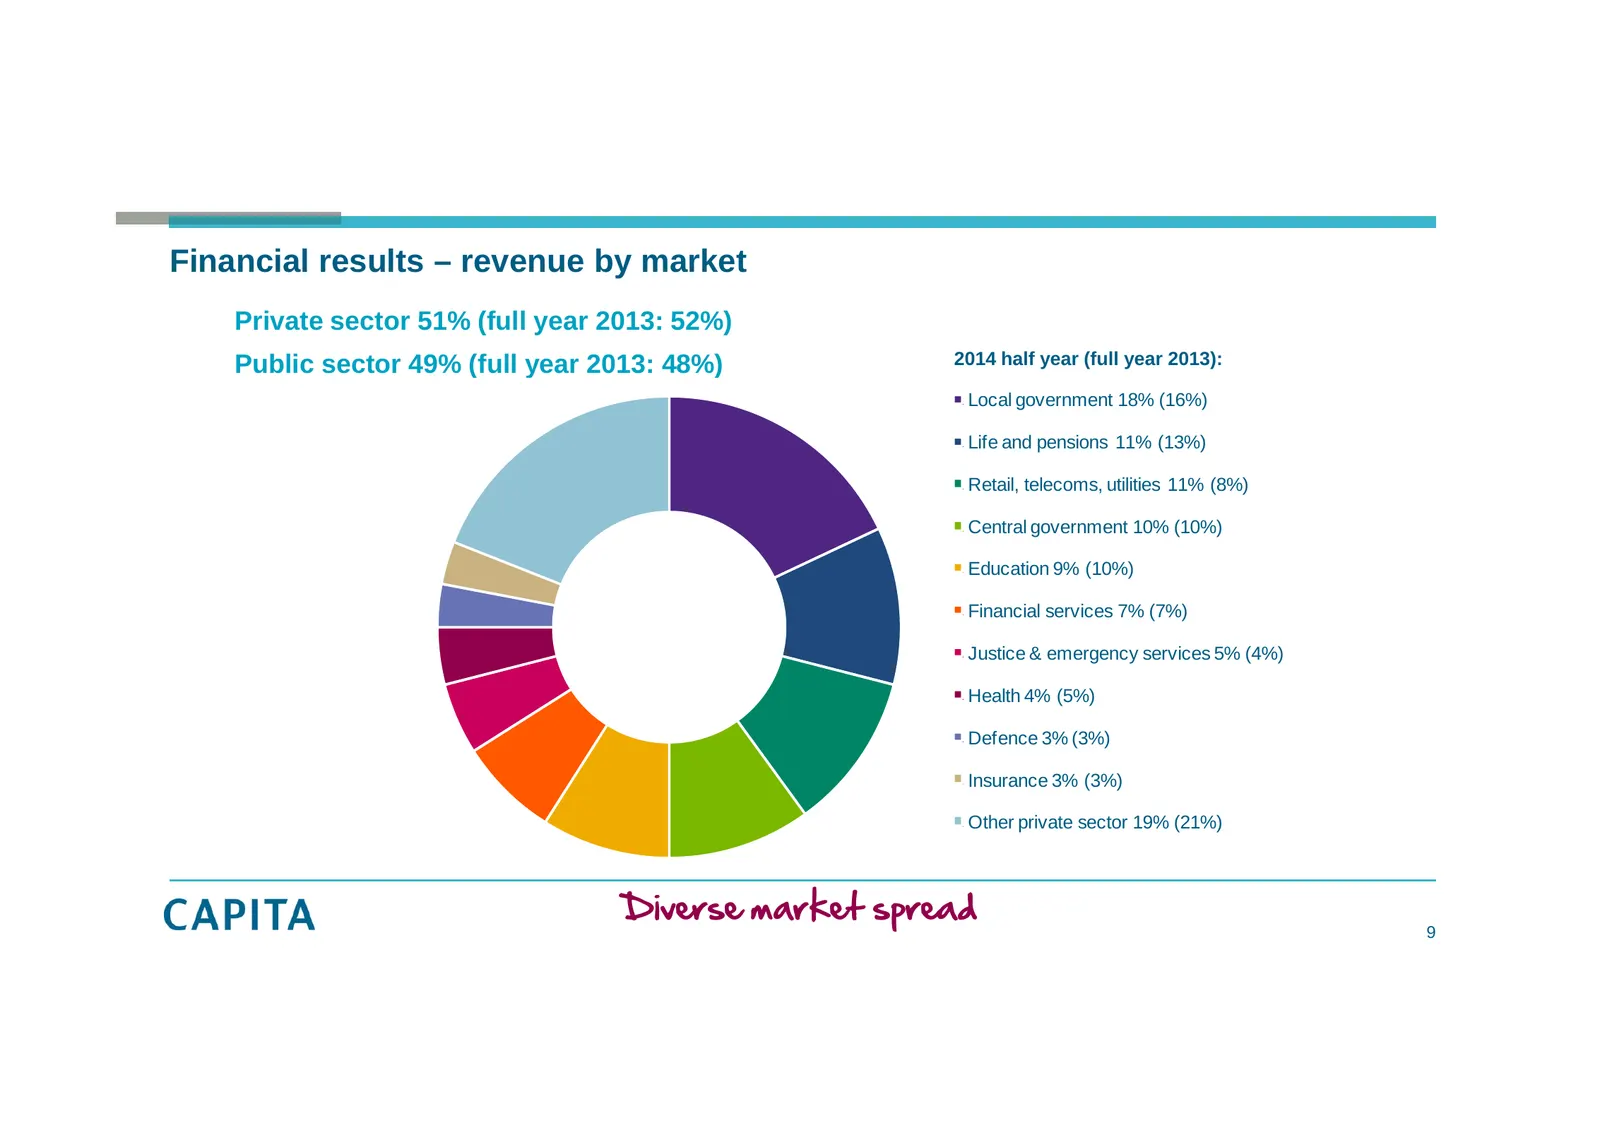
Financial results – revenue by market Private sector 51% (full year 2013: 52%) Public sector 49% (full year 2013: 48%) 2014 half year (full year 2013): Local government 18% (16%) Life and pensions 11% (13%) Retail, telecoms, utilities 11% (8%) Central government 10% (10%) Education 9% (10%) Financia
Slide 10: Strong profit growth
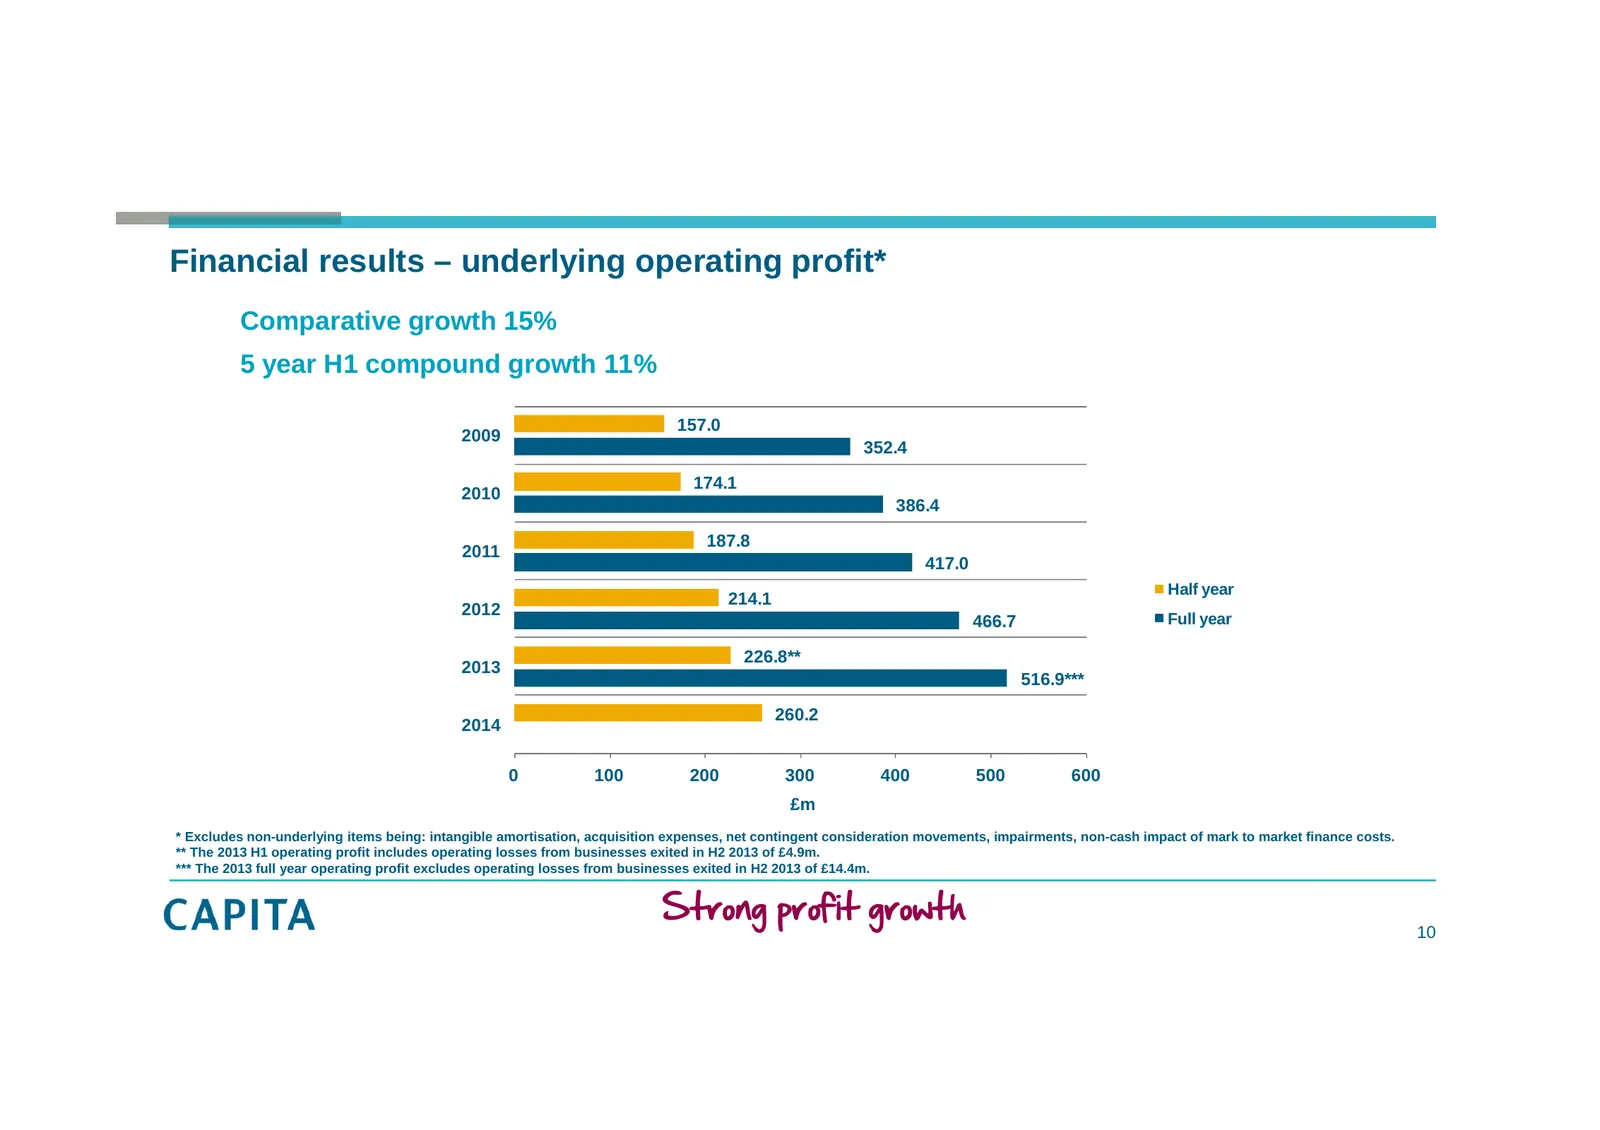
Financial results – underlying operating profit* Comparative growth 15% 5 year H1 compound growth 11% 157.0 2009 352.4 174.1 2010 386.4 187.8 2011 417.0 Half year 214.1 2012 466.7 Full year 226.8** 2013 516.9*** 260.2 2014 0 100 200 300 400 500 600 £m * Excludes non-underlying items being: intangibl
Slide 11: Continued increasing profitability
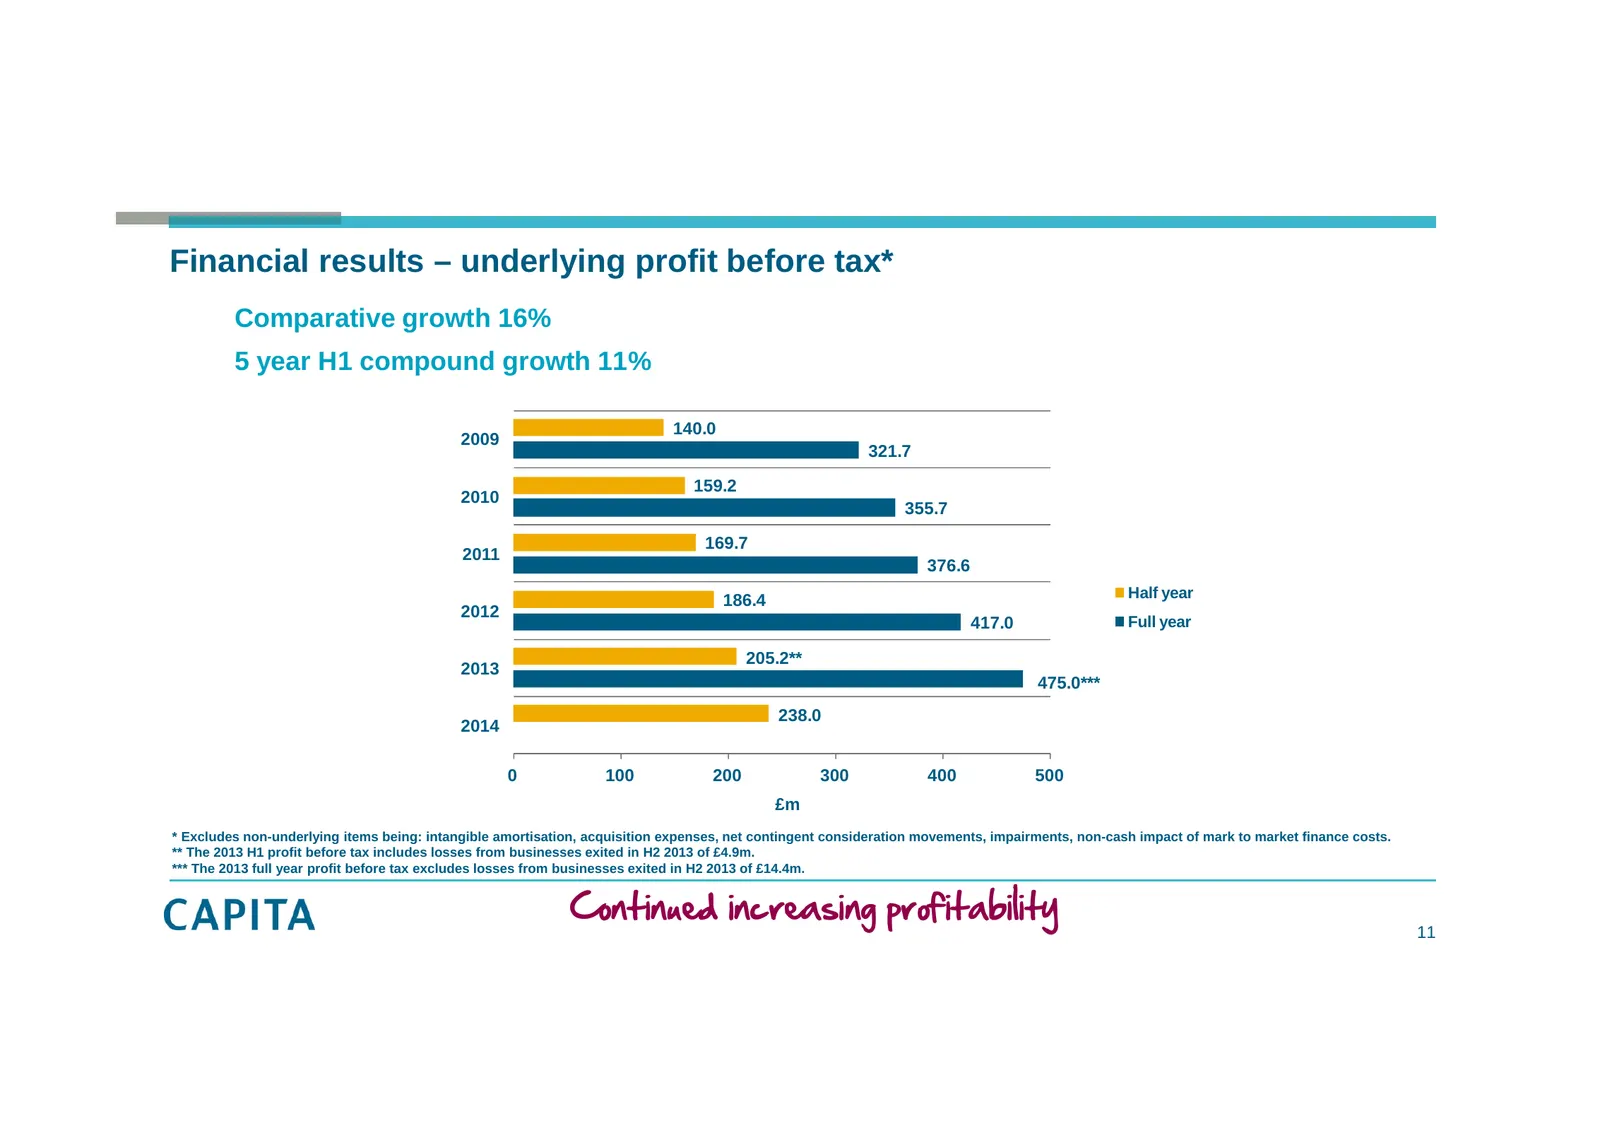
Financial results – underlying profit before tax* Comparative growth 16% 5 year H1 compound growth 11% 140.0 2009 321.7 159.2 2010 355.7 169.7 2011 376.6 Half year 186.4 2012 417.0 Full year 205.2** 2013 475.0*** 238.0 2014 0 100 200 300 400 500 £m * Excludes non-underlying items being: intangible a
Slide 12: Underlying H1 operating margin
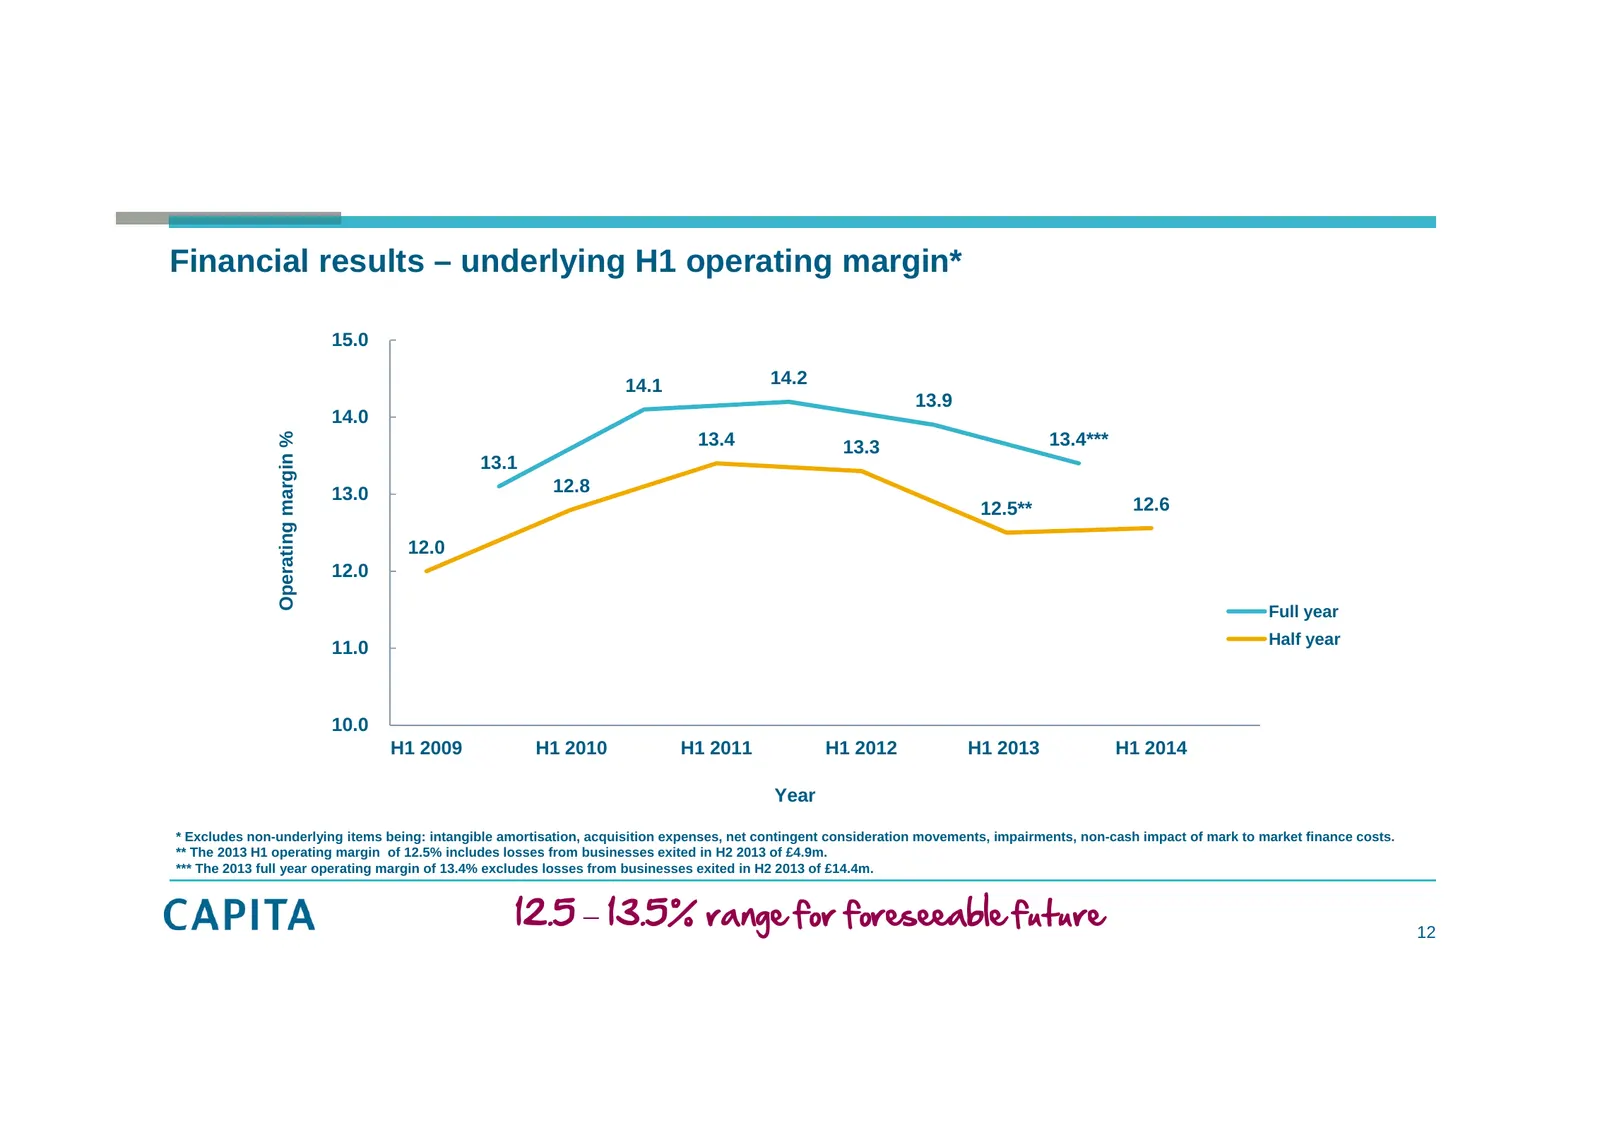
Financial results – underlying H1 operating margin* 15.0 14.1 14.2 13.9 14.0 Operating margin % 13.4 13.3 13.4*** 13.1 13.0 12.8 12.5** 12.6 12.0 12.0 Full year Half year 11.0 10.0 H1 2009 H1 2010 H1 2011 H1 2012 H1 2013 H1 2014 Year * Excludes non-underlying items being: intangible amortisation, ac
Slide 13: Continued growth in earnings
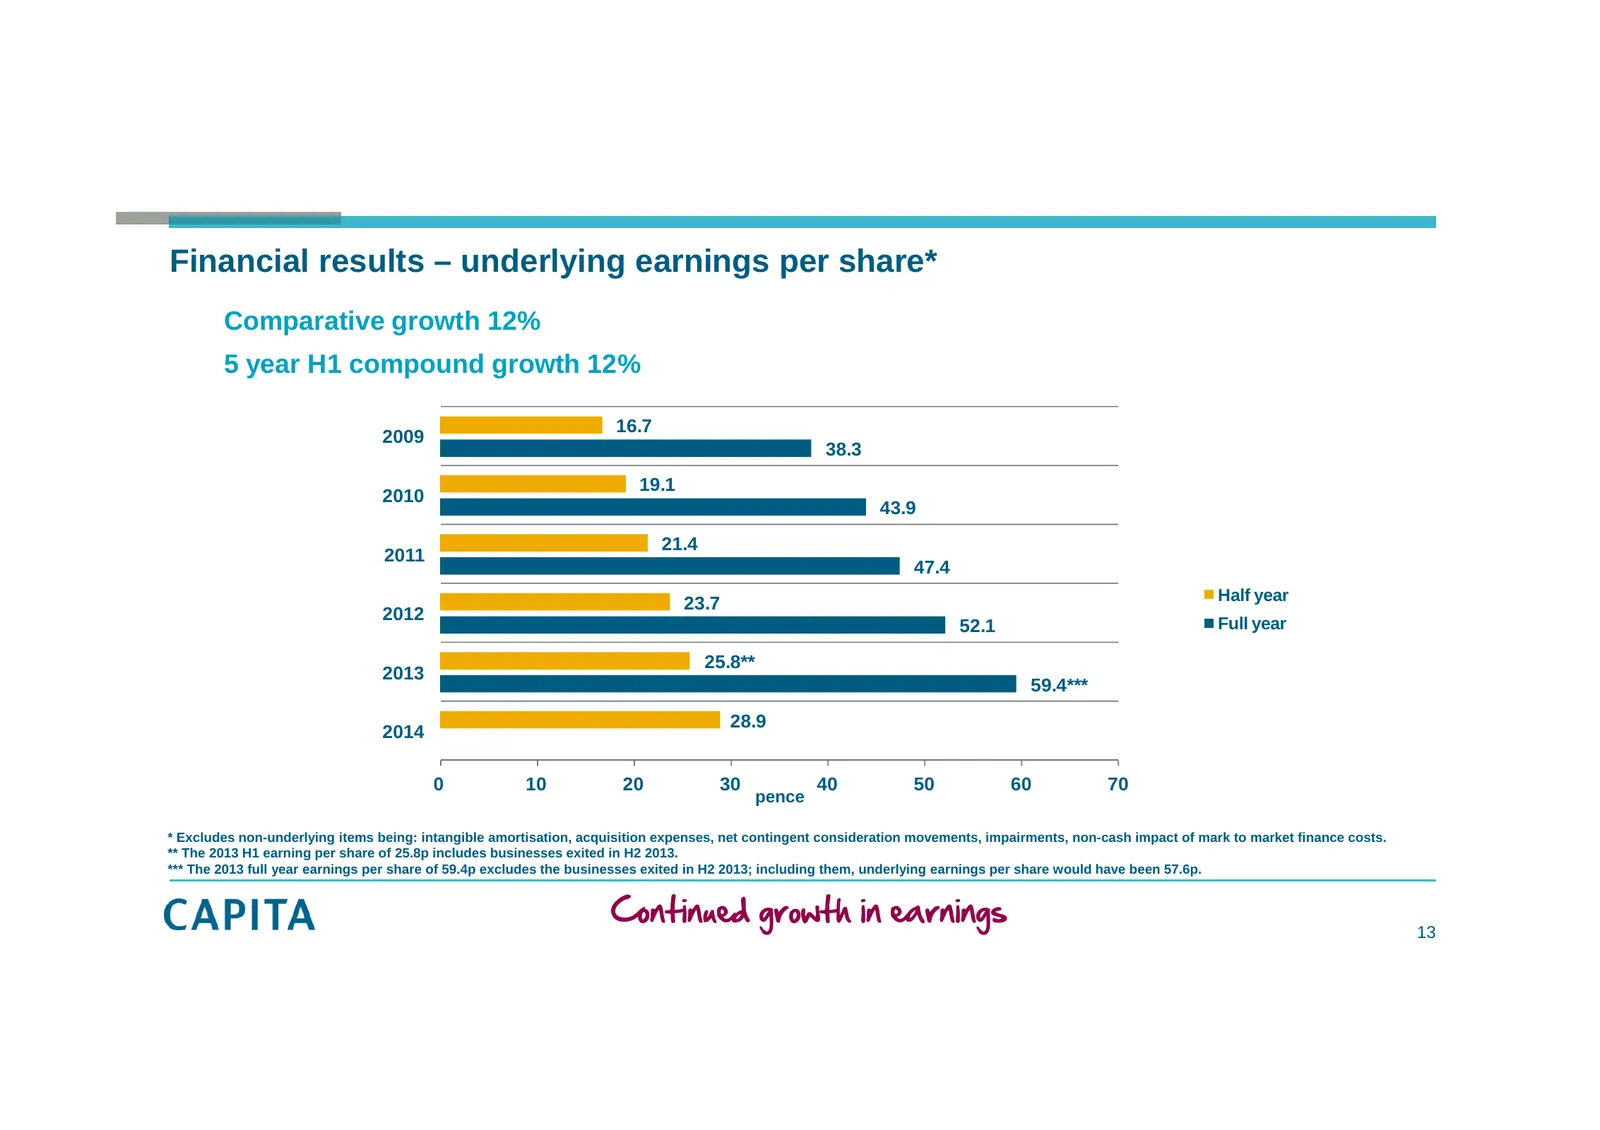
Financial results – underlying earnings per share* Comparative growth 12% 5 year H1 compound growth 12% 16.7 2009 38.3 19.1 2010 43.9 21.4 2011 47.4 23.7 Half year 2012 52.1 Full year 25.8** 2013 59.4*** 28.9 2014 0 10 20 30 40 50 60 70 pence * Excludes non-underlying items being: intangible amortis
Slide 14: Continued growth in dividends
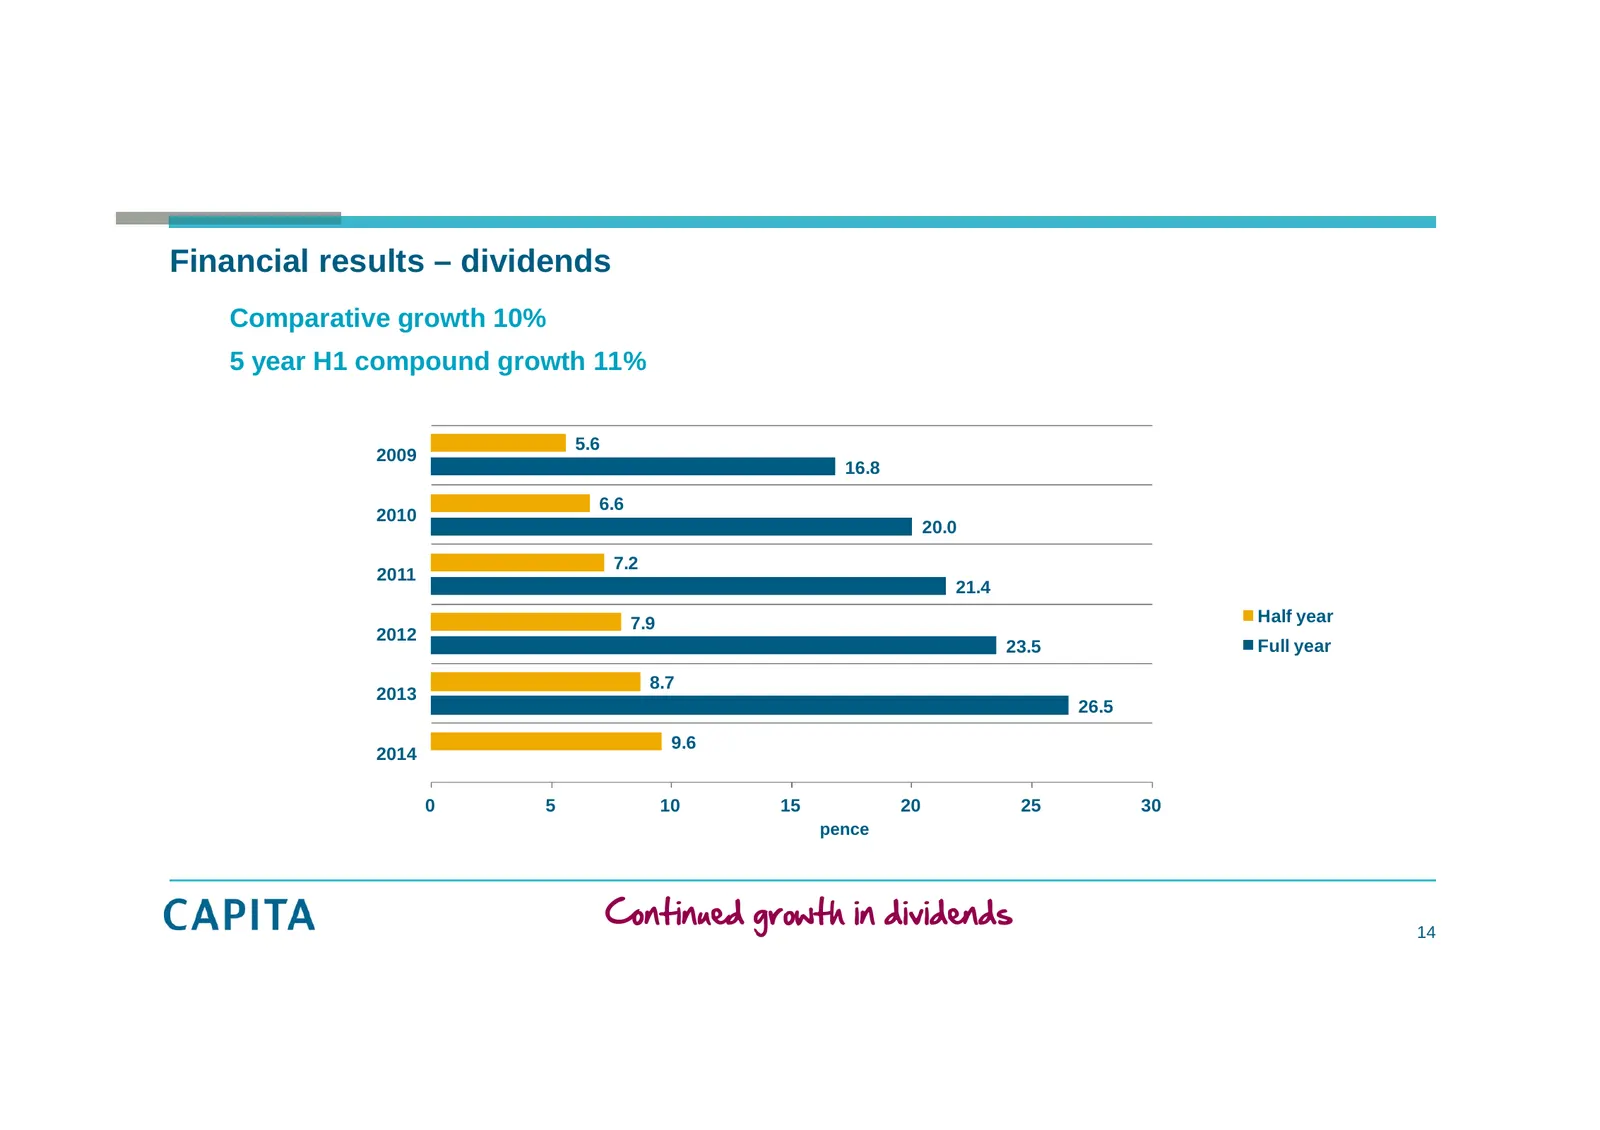
Financial results – dividends Comparative growth 10% 5 year H1 compound growth 11% 5.6 2009 16.8 6.6 2010 20.0 7.2 2011 21.4 7.9 Half year 2012 23.5 Full year 8.7 2013 26.5 9.6 2014 0 5 10 15 20 25 30 pence Continued growth in dividends 14
Slide 15: 22% growth in operating cash
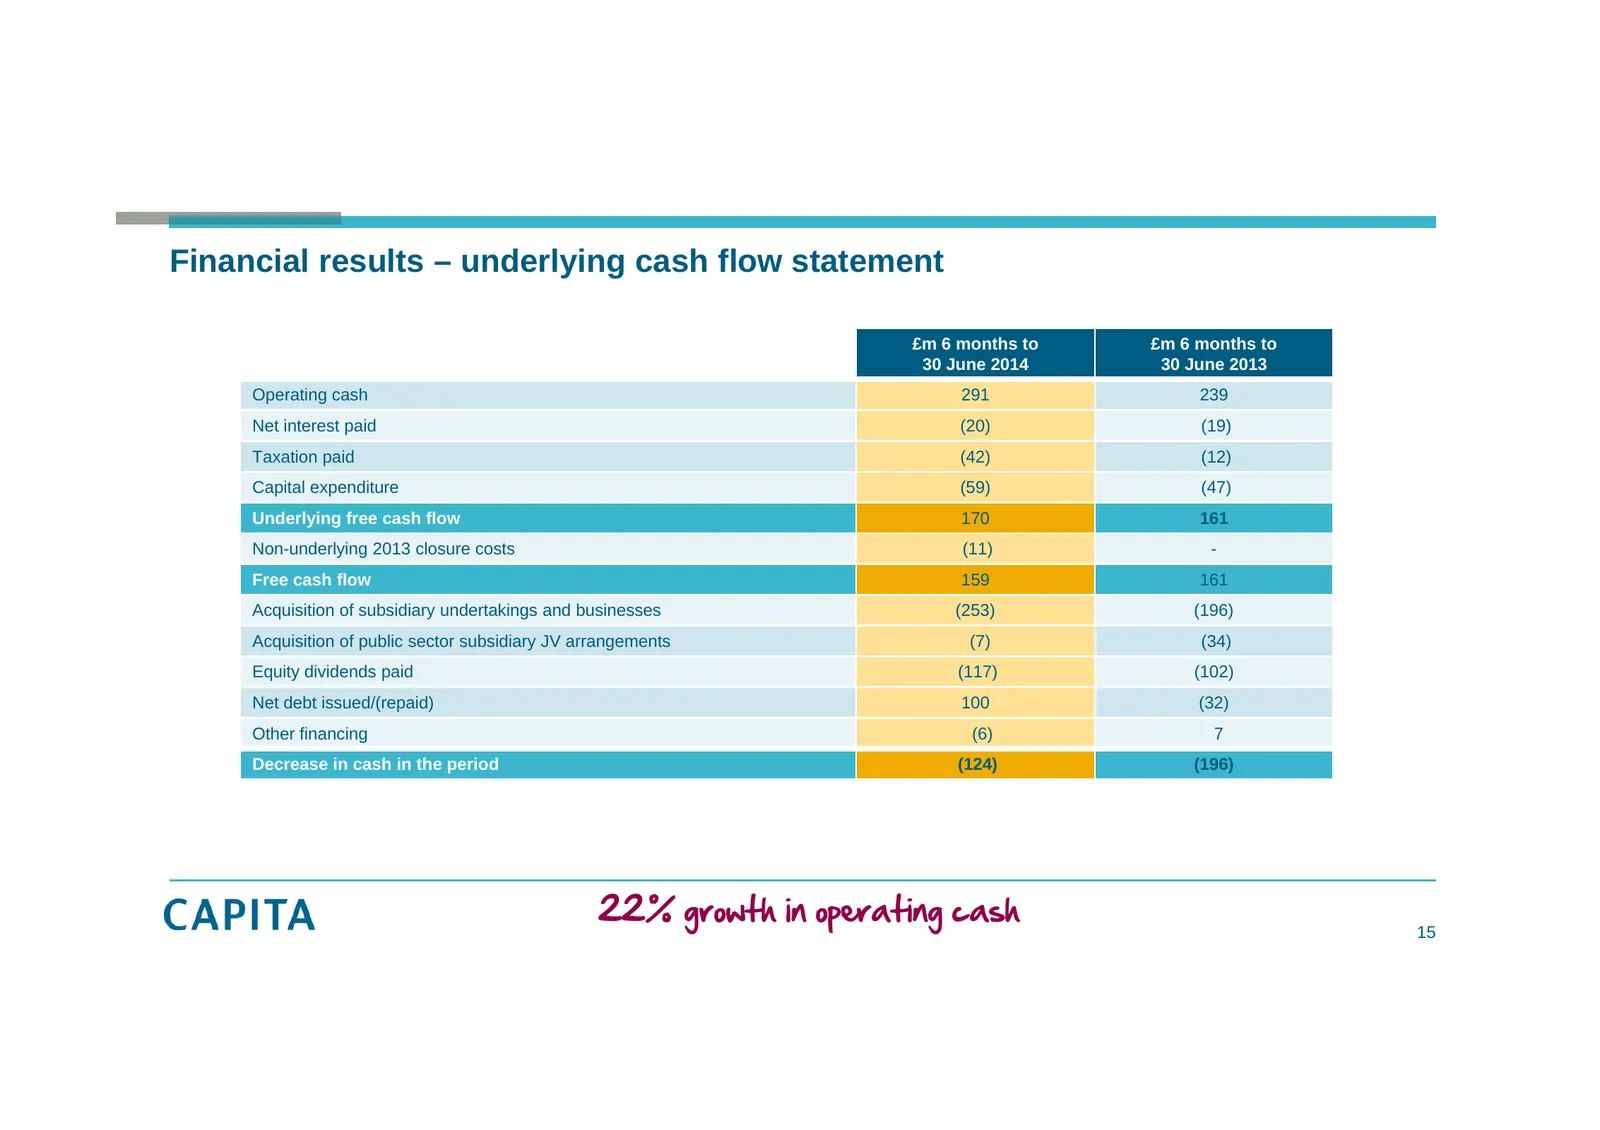
Financial results – underlying cash flow statement £m 6 months to £m 6 months to 30 June 2014 30 June 2013 Operating cash 291 239 Net interest paid (20) (19) Taxation paid (42) (12) Capital expenditure (59) (47) Underlying free cash flow 170 161 Non-underlying 2013 closure costs (11) - Free cash flo
Slide 16: Consistently achieving annual cash conversion at or above 100%
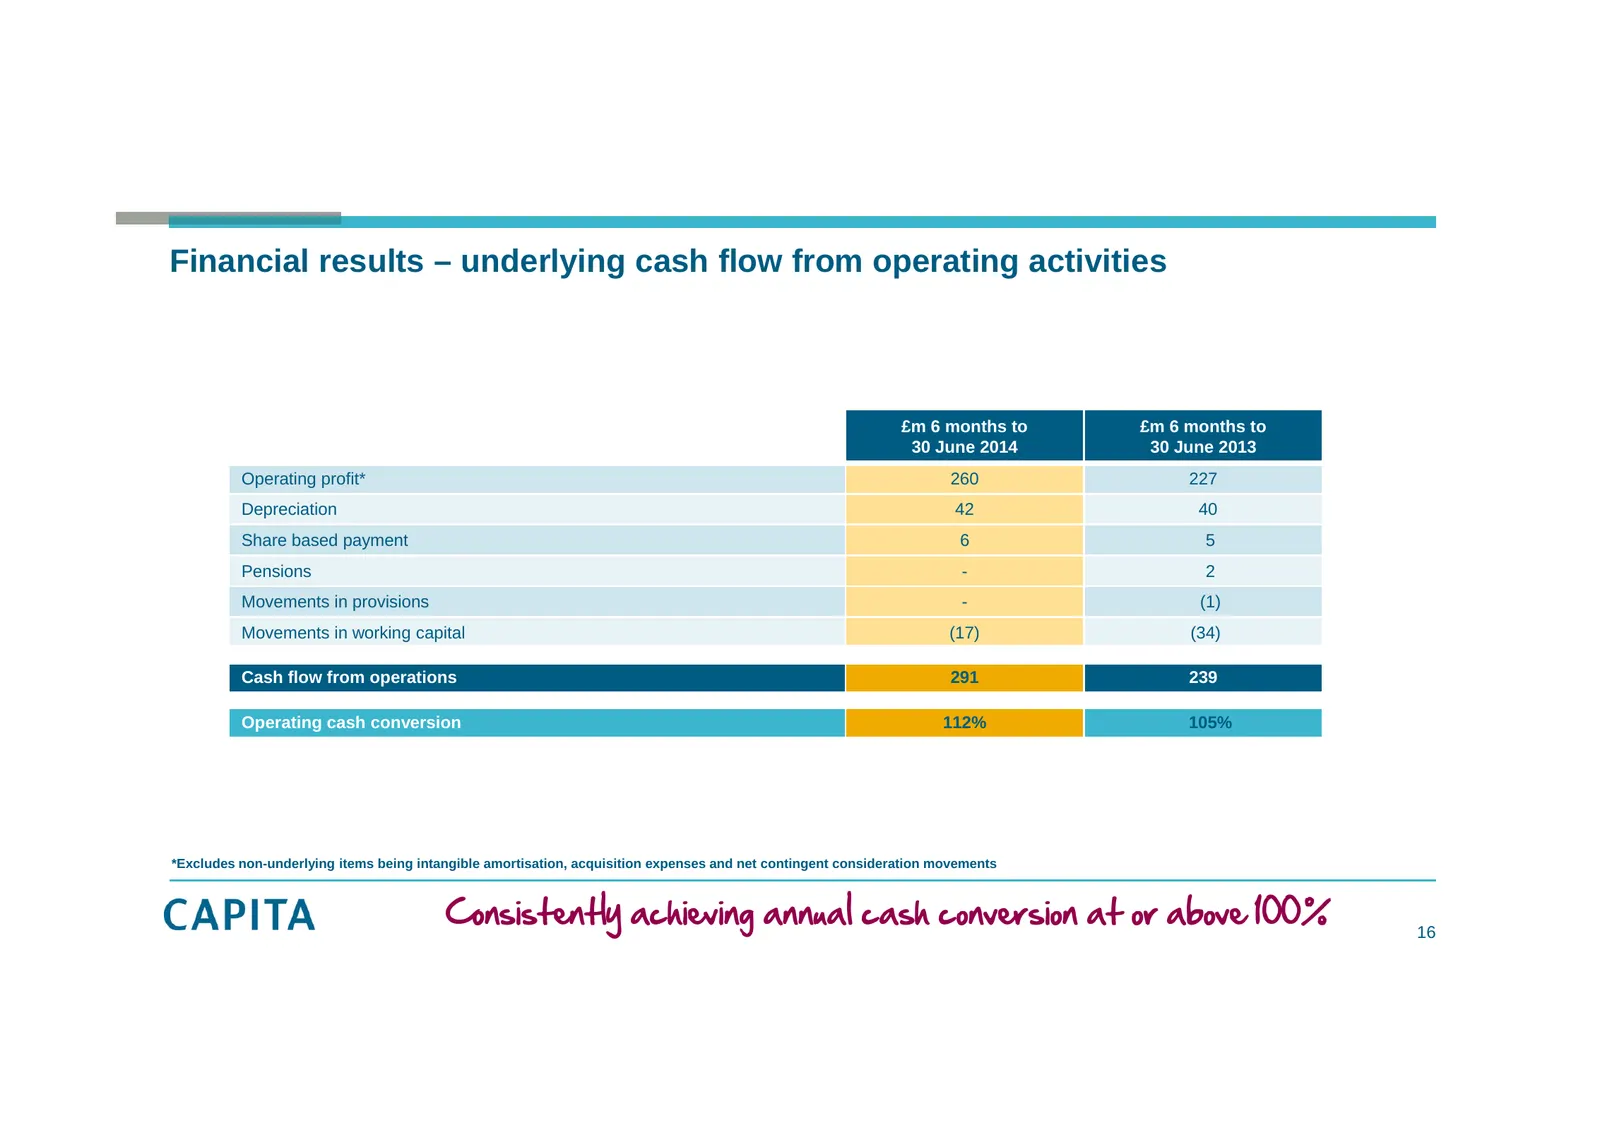
Financial results – underlying cash flow from operating activities £m 6 months to £m 6 months to 30 June 2014 30 June 2013 Operating profit* 260 227 Depreciation 42 40 Share based payment 6 5 Pensions - 2 Movements in provisions - (1) Movements in working capital (17) (34) Cash flow from operations
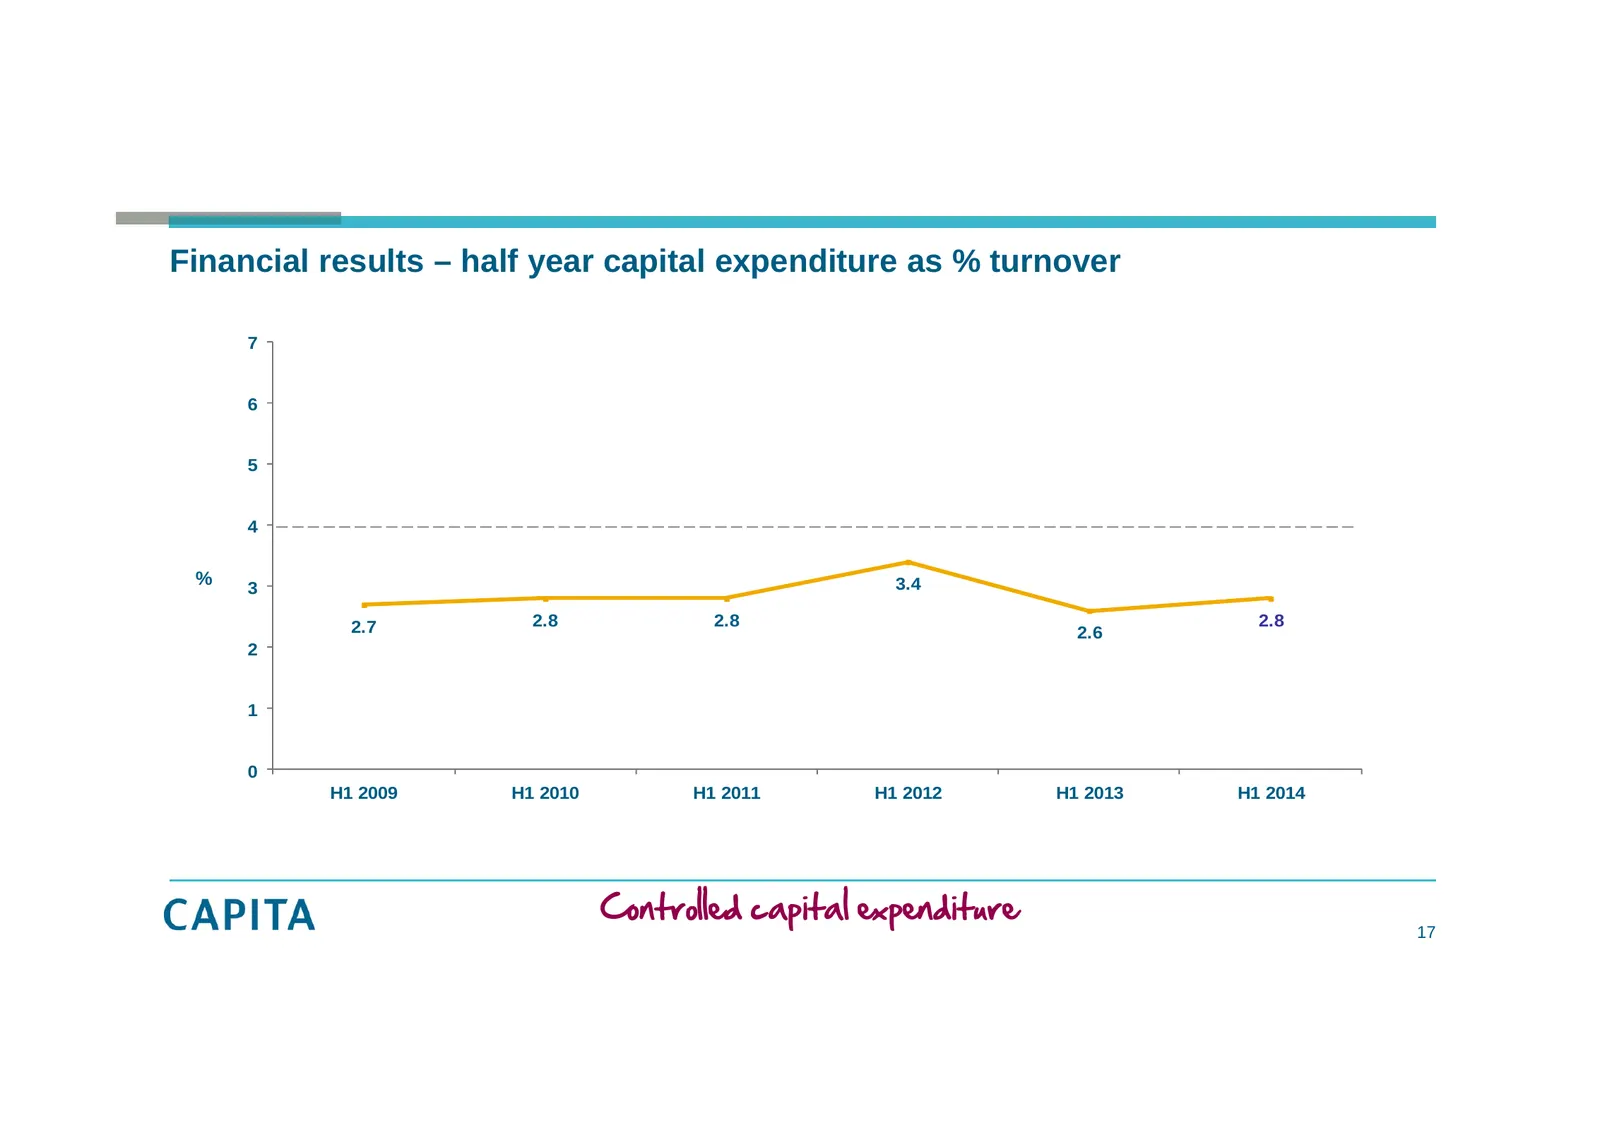
Slide 17: Controlled capital expenditure
Financial results – half year capital expenditure as % turnover 7 6 5 4 % 3 3.4 2.7 2.8 2.8 2.8 2.6 2 1 0 H1 2009 H1 2010 H1 2011 H1 2012 H1 2013 H1 2014 Controlled capital expenditure 17
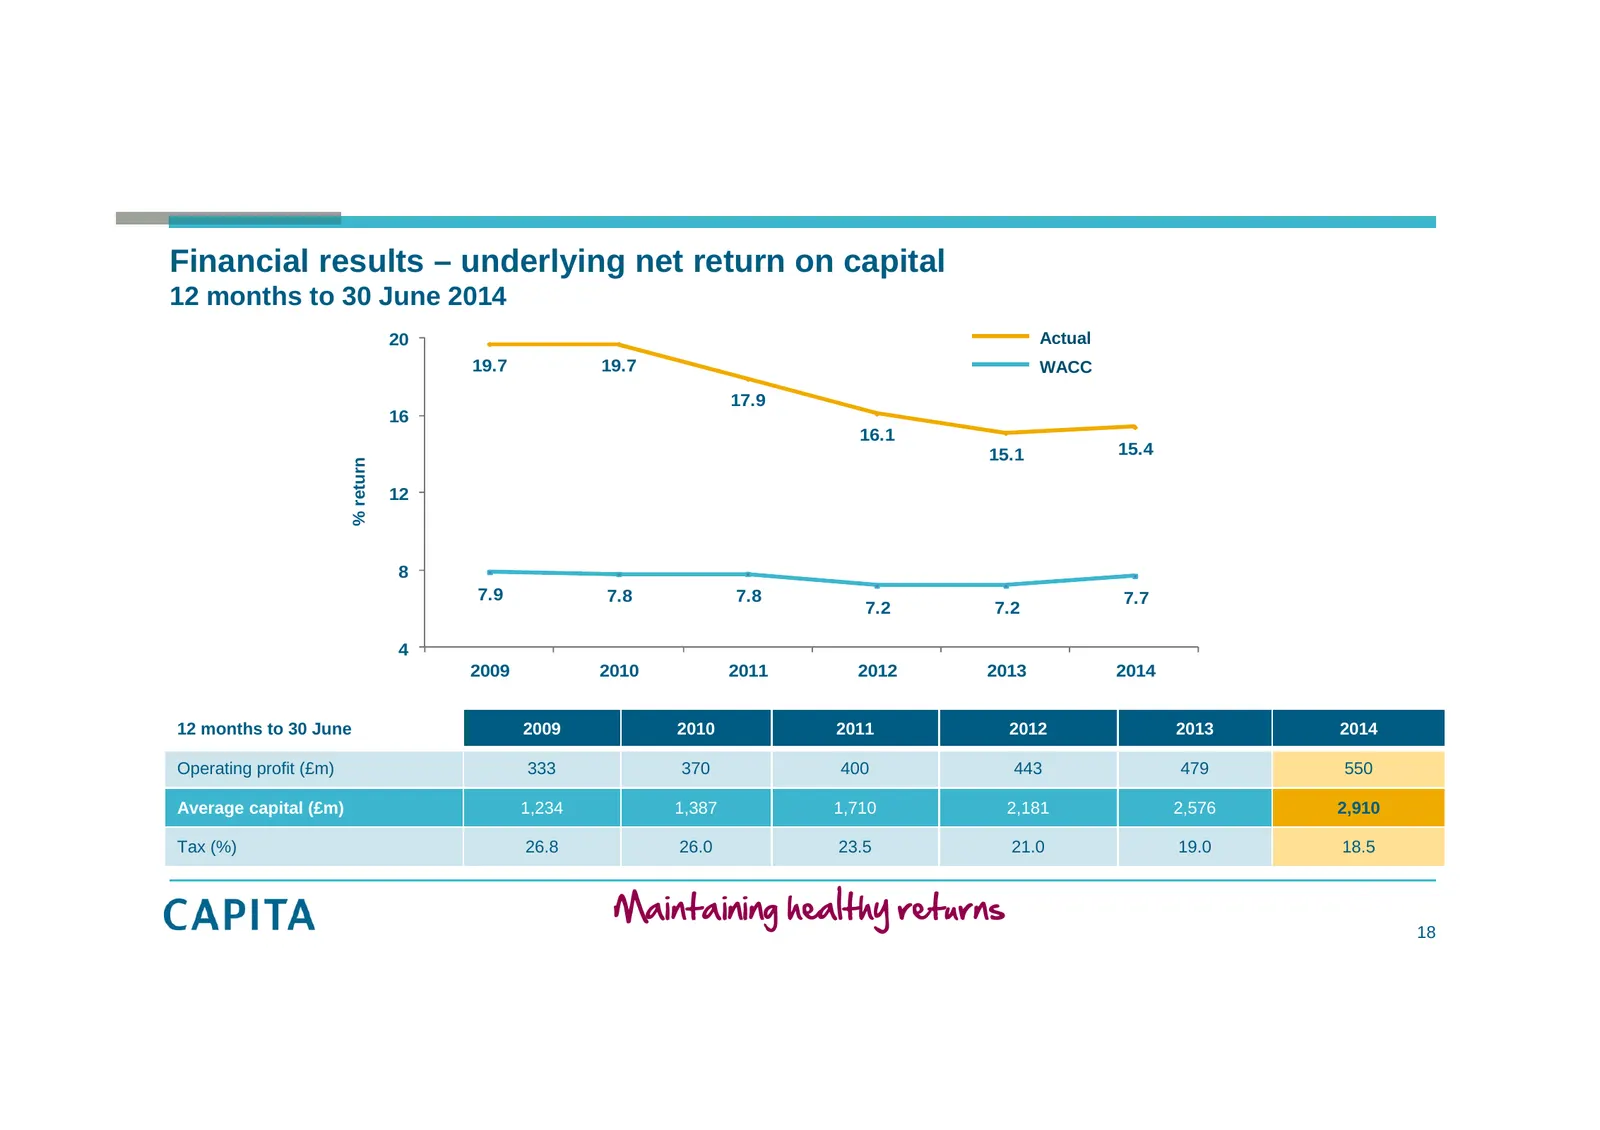
Slide 18: Maintaining healthy returns
Financial results – underlying net return on capital 12 months to 30 June 2014 20 Actual 19.7 19.7 WACC 17.9 16 16.1 15.1 15.4 % return 12 8 7.9 7.8 7.8 7.7 7.2 7.2 4 2009 2010 2011 2012 2013 2014 12 months to 30 June 2009 2010 2011 2012 2013 2014 Operating profit (£m) 333 370 400 443 479 550 Averag
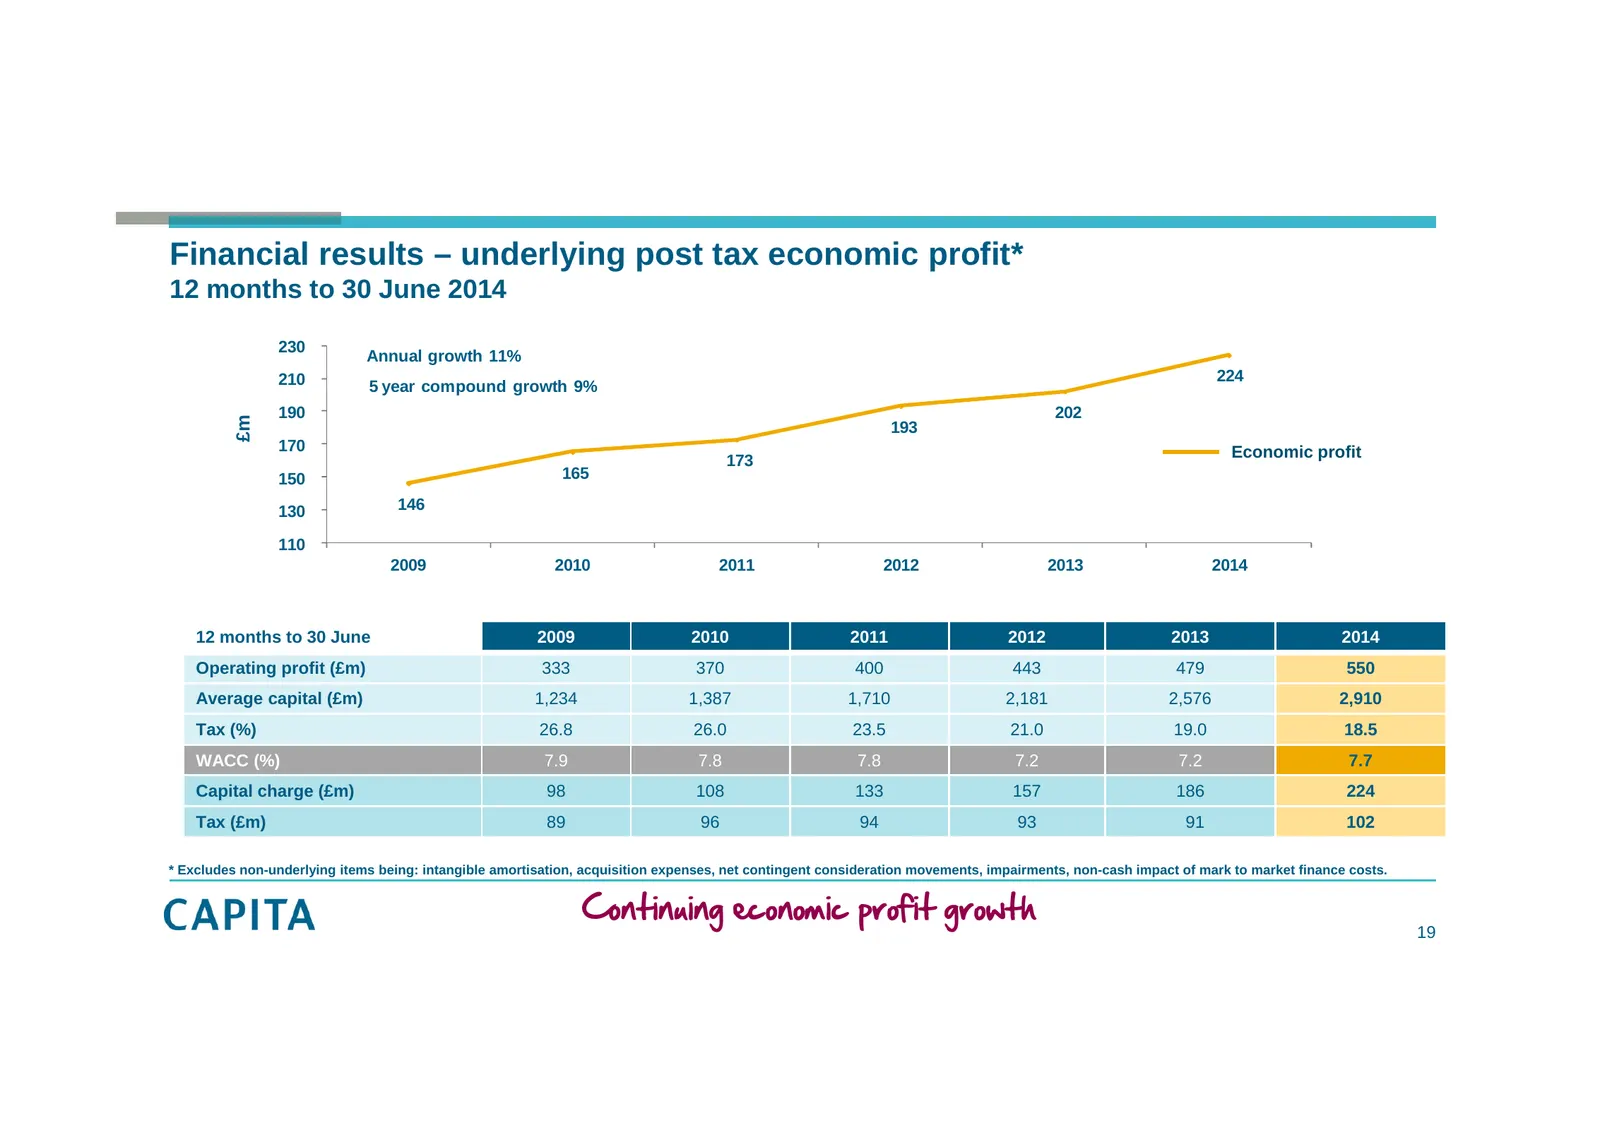
Slide 19: Continuing economic profit growth
Financial results – underlying post tax economic profit* 12 months to 30 June 2014 230 Annual growth 11% 210 224 5 year compound growth 9% 190 202 £m 193 170 Economic profit 173 150 165 130 146 110 2009 2010 2011 2012 2013 2014 12 months to 30 June 2009 2010 2011 2012 2013 2014 Operating profit (£m)
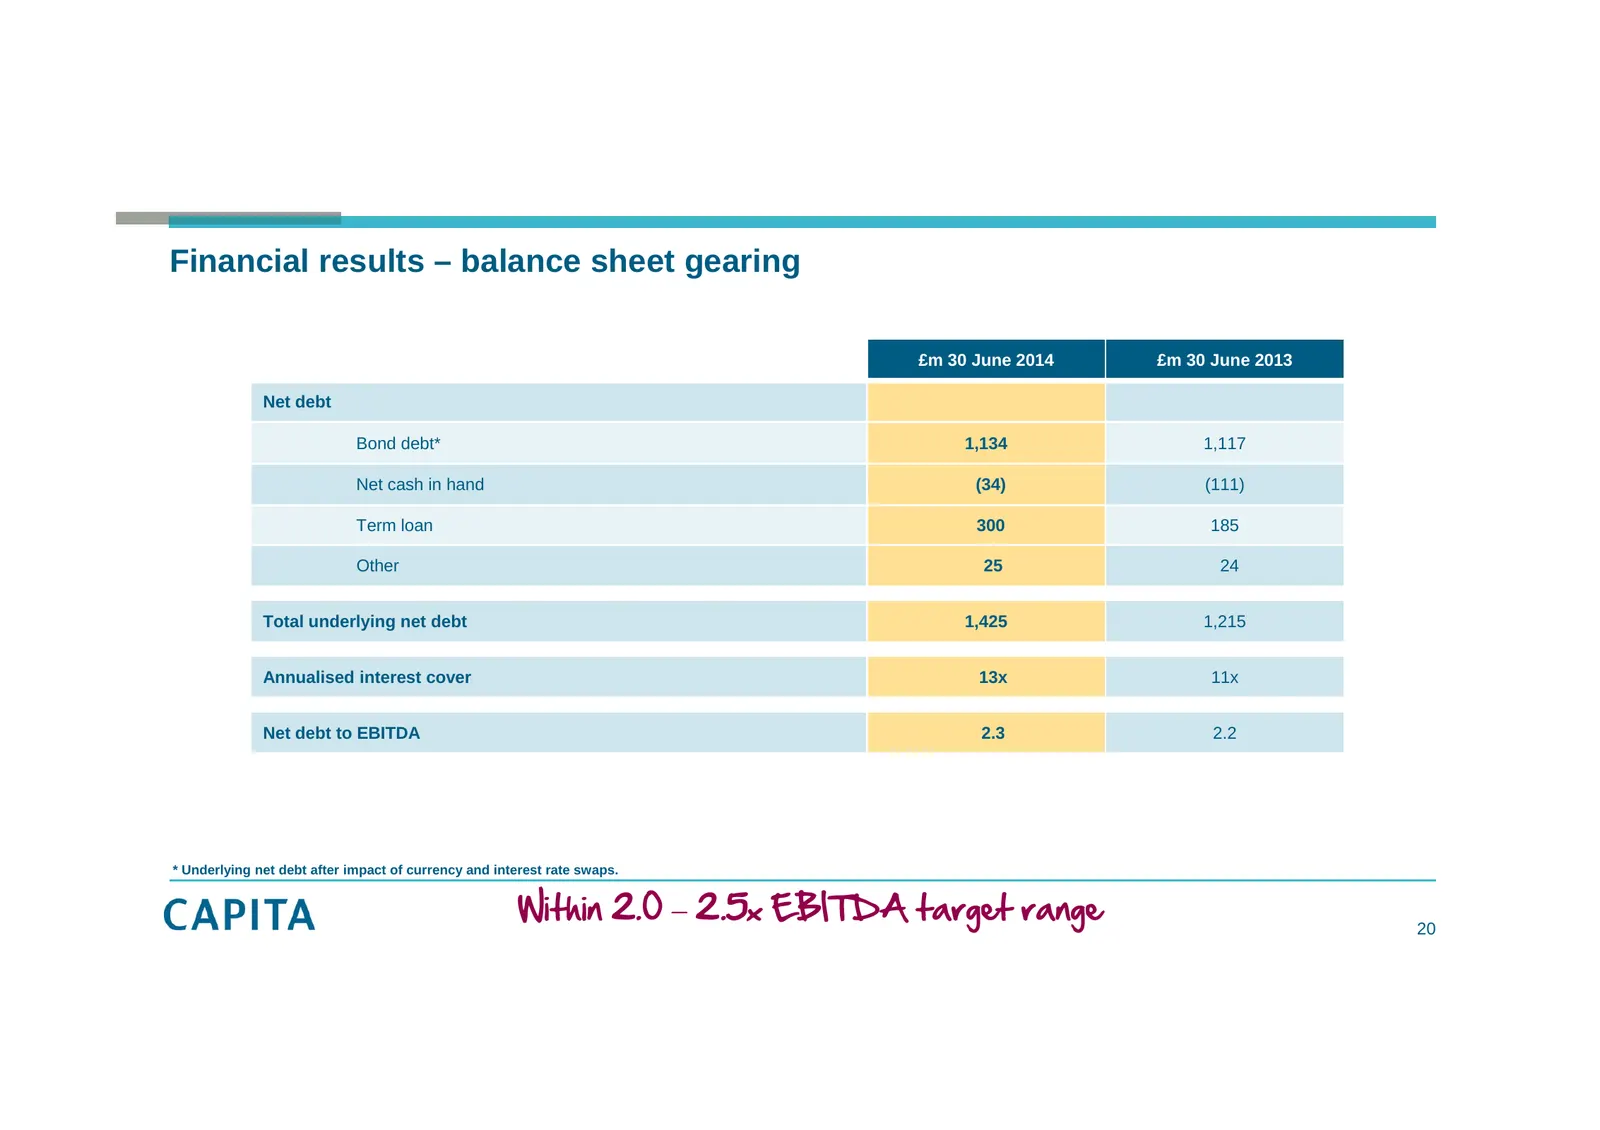
Slide 20: Within 2.0 – 2.5x EBITDA target range
Financial results – balance sheet gearing £m 30 June 2014 £m 30 June 2013 Net debt Bond debt* 1,134 1,117 Net cash in hand (34) (111) Term loan 300 185 Other 25 24 Total underlying net debt 1,425 1,215 Annualised interest cover 13x 11x Net debt to EBITDA 2.3 2.2 * Underlying net debt after impact of
Slide 21: Creating growth: Major sales update
Creating growth: Major sales update Maggi Bell Group Business Development Director 21
Slide 22: Securing diversified organic growth
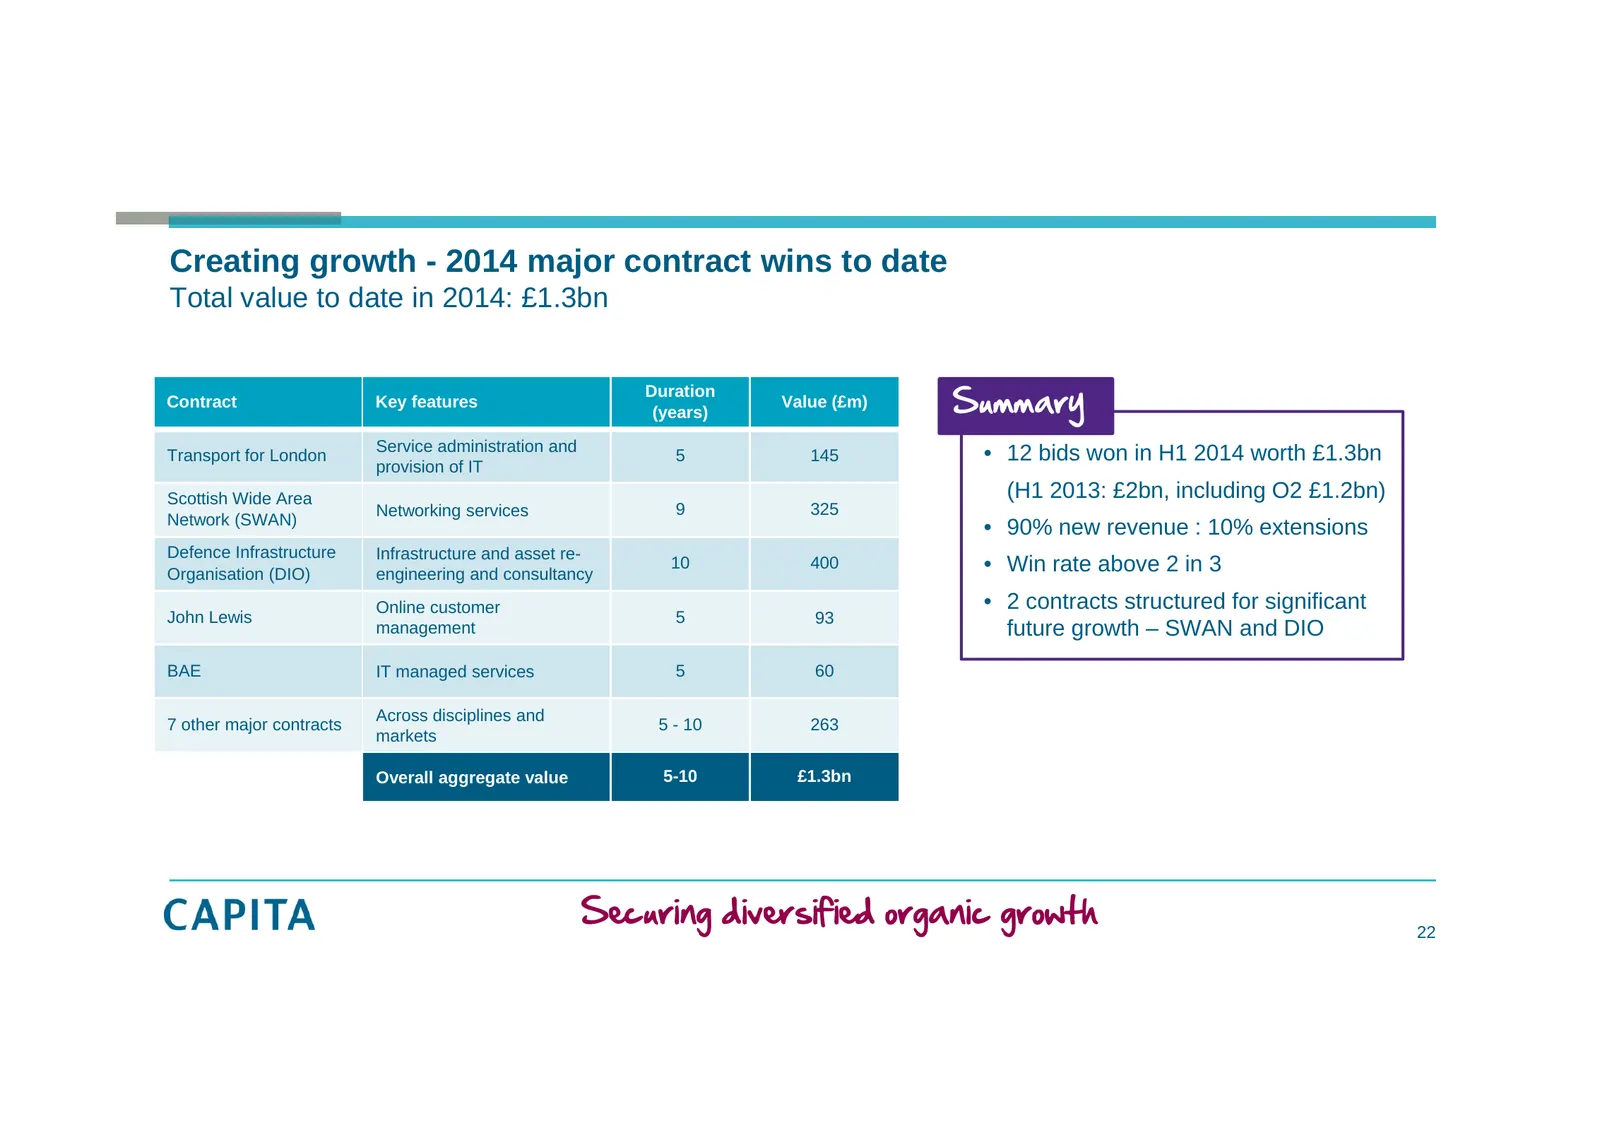
Creating growth - 2014 major contract wins to date Total value to date in 2014: £1.3bn Summary Duration Contract Key features Value (£m) (years) Service administration and Transport for London 5 145 • 12 bids won in H1 2014 worth £1.3bn provision of IT Scottish Wide Area (H1 2013: £2bn, including O2
Slide 23: Defence Infrastructure Organisation strategic partnership
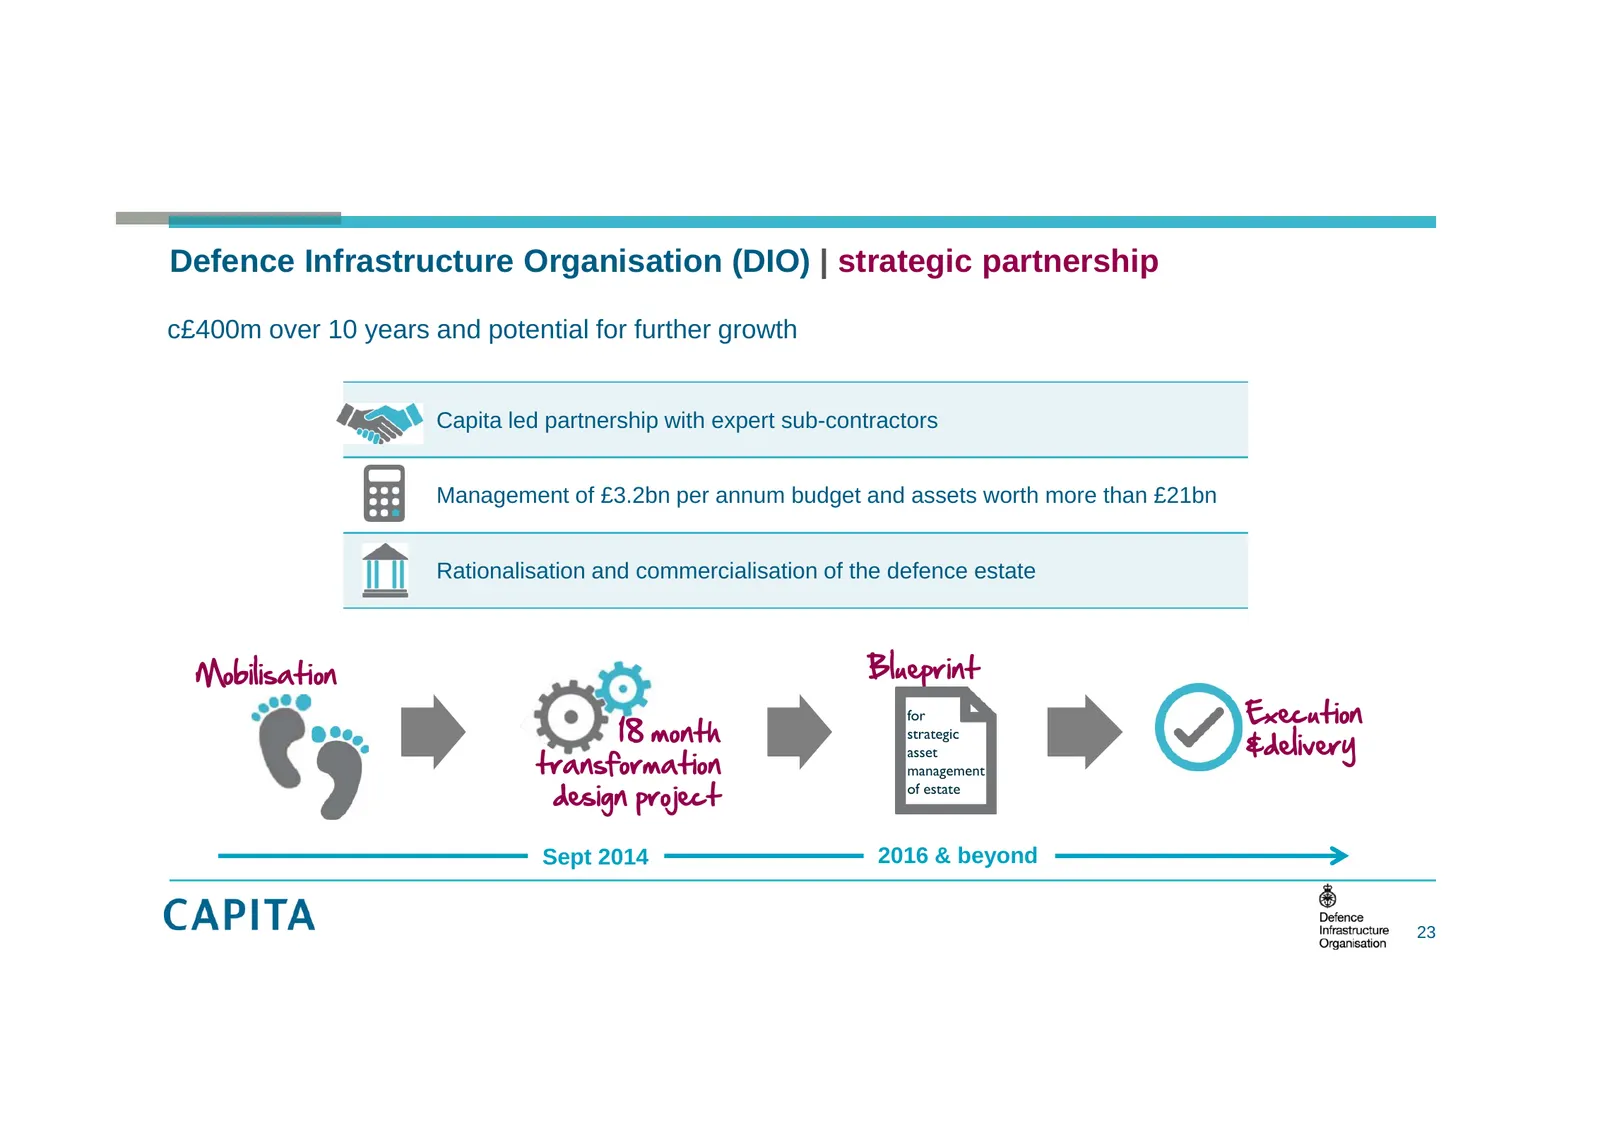
Defence Infrastructure Organisation (DIO) | strategic partnership c£400m over 10 years and potential for further growth Capita led partnership with expert sub-contractors Management of £3.2bn per annum budget and assets worth more than £21bn Rationalisation and commercialisation of the defence estat
Slide 24: John Lewis online contact centre partnership
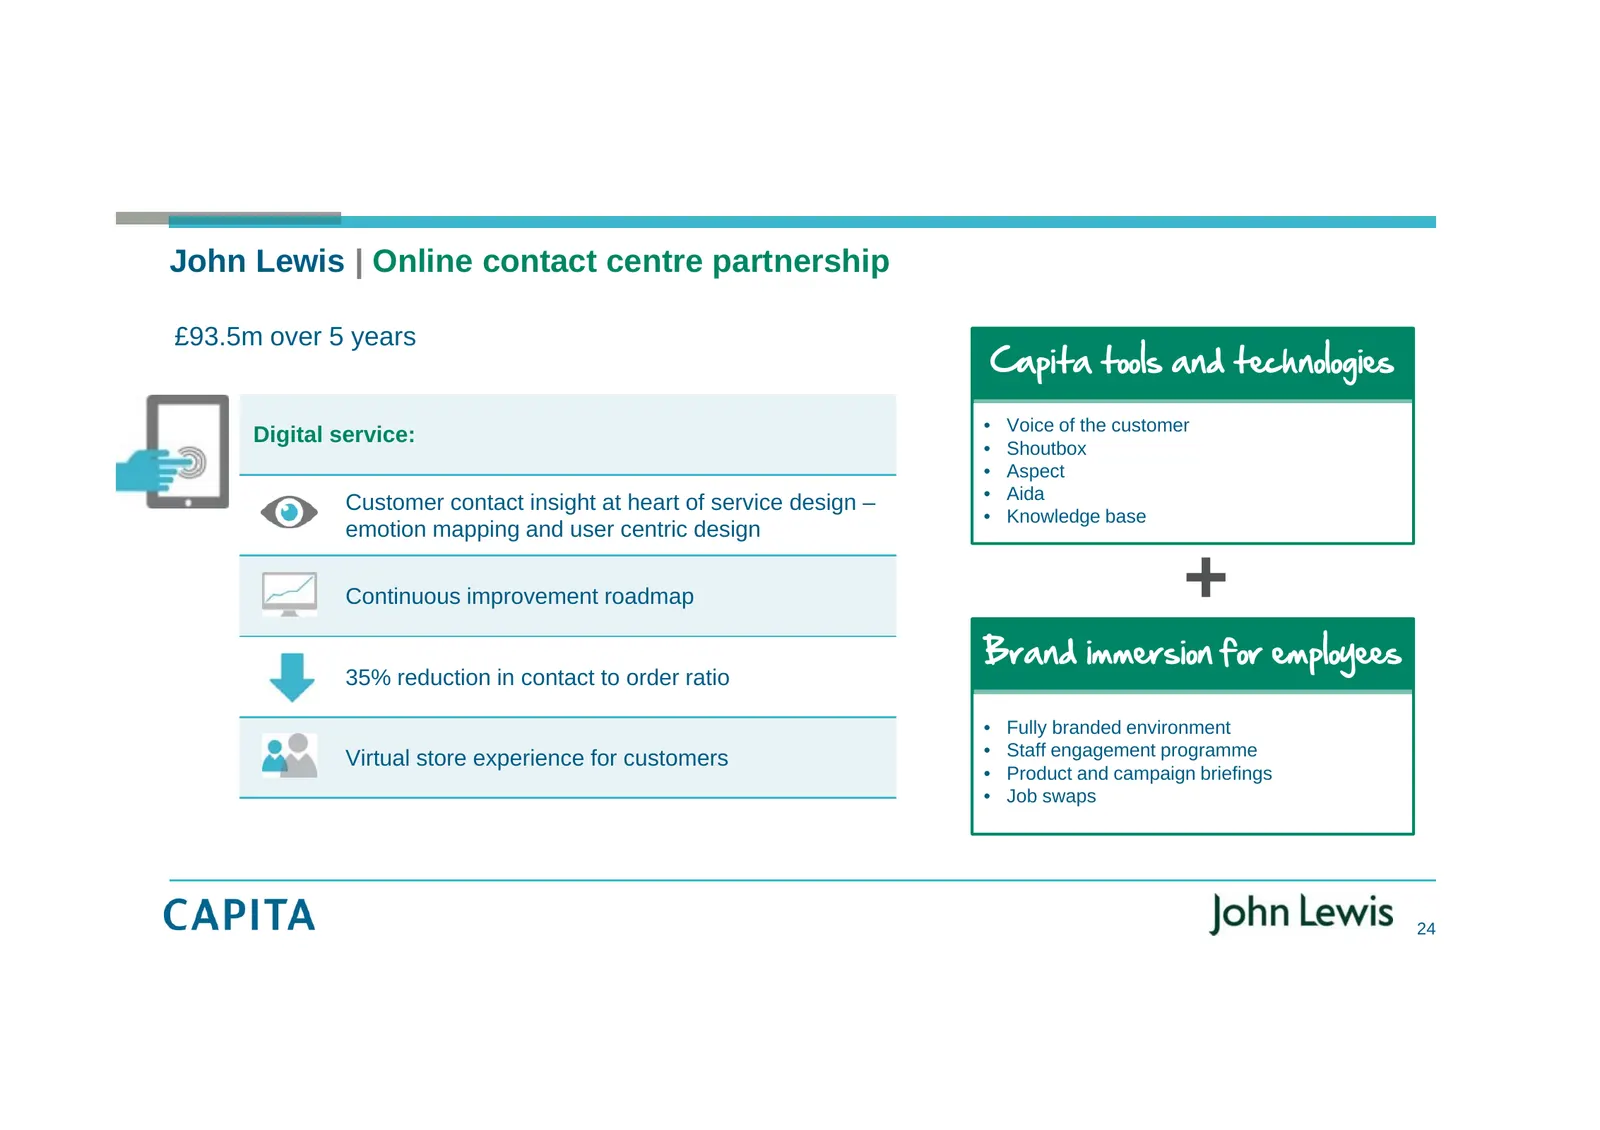
John Lewis | Online contact centre partnership £93.5m over 5 years Capita tools and technologies • Voice of the customer Digital service: • Shoutbox • Aspect Customer contact insight at heart of service design – • Aida • Knowledge base emotion mapping and user centric design Continuous improvement r
Slide 25: Targeting opportunities across diversified markets
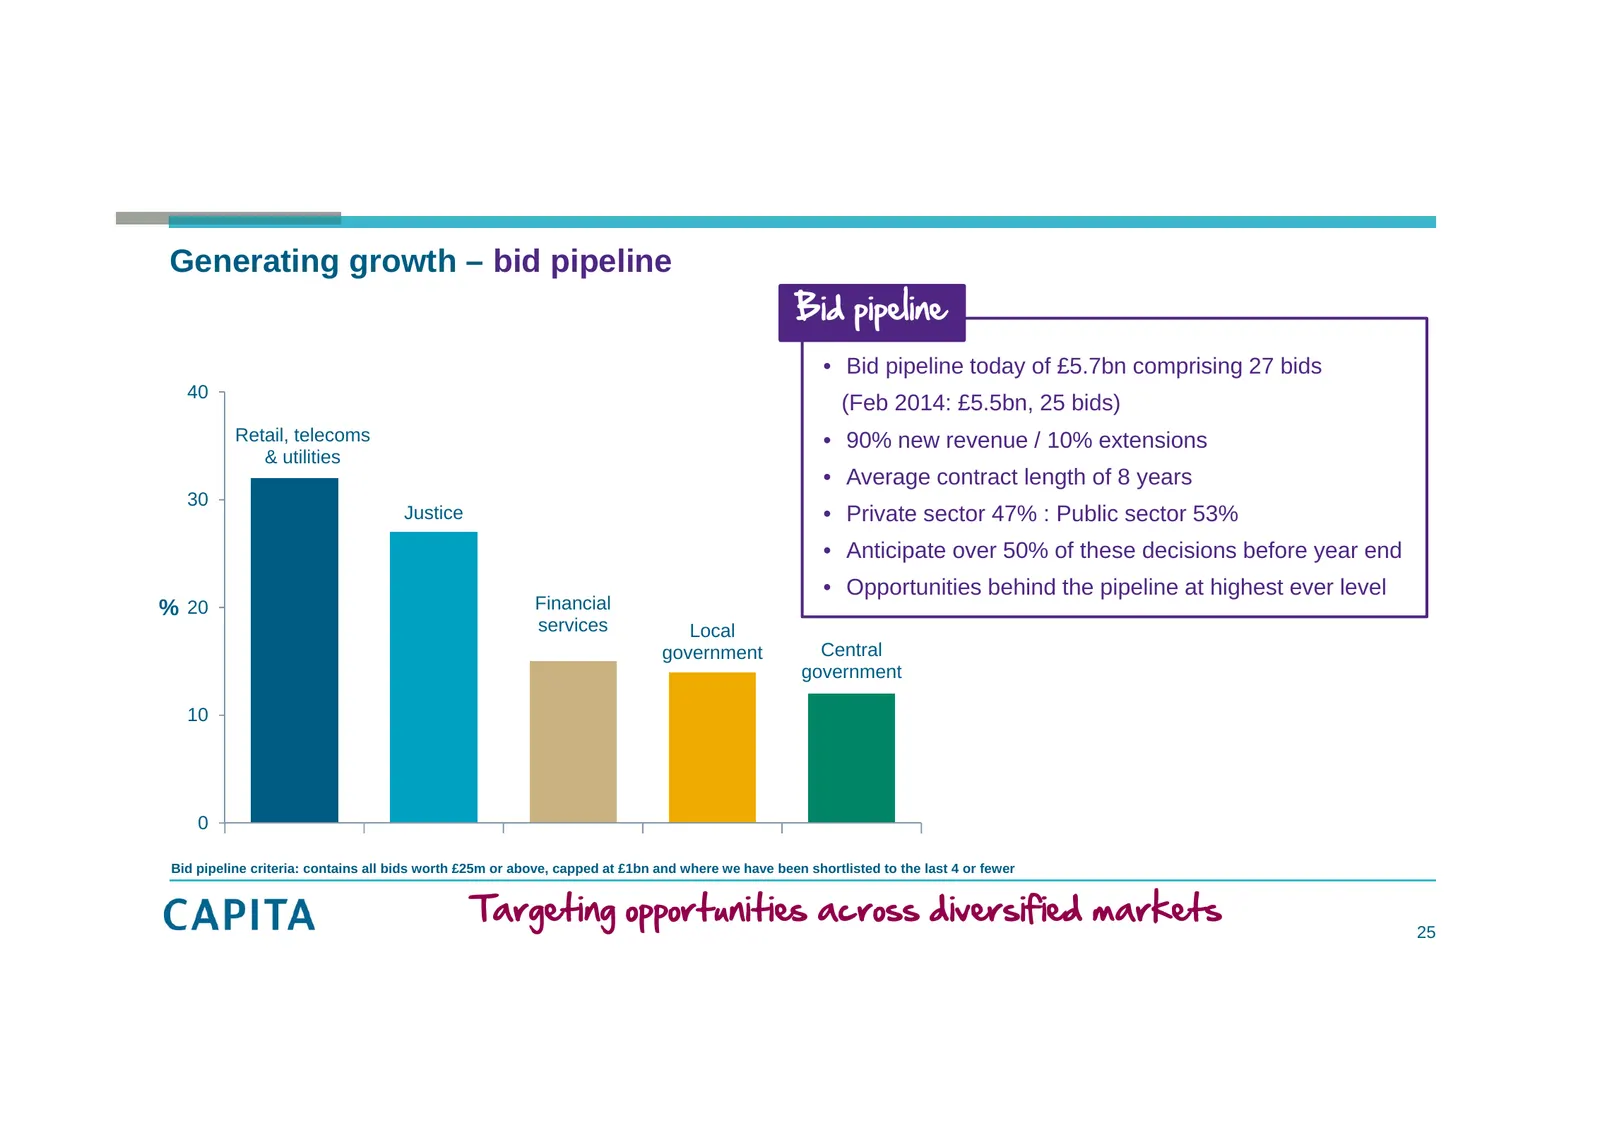
Generating growth – bid pipeline Bid pipeline • Bid pipeline today of £5.7bn comprising 27 bids 40 (Feb 2014: £5.5bn, 25 bids) Retail, telecoms • 90% new revenue / 10% extensions & utilities • Average contract length of 8 years 30 Justice • Private sector 47% : Public sector 53% • Anticipate over 50
Slide 26: The driver of transformational deals
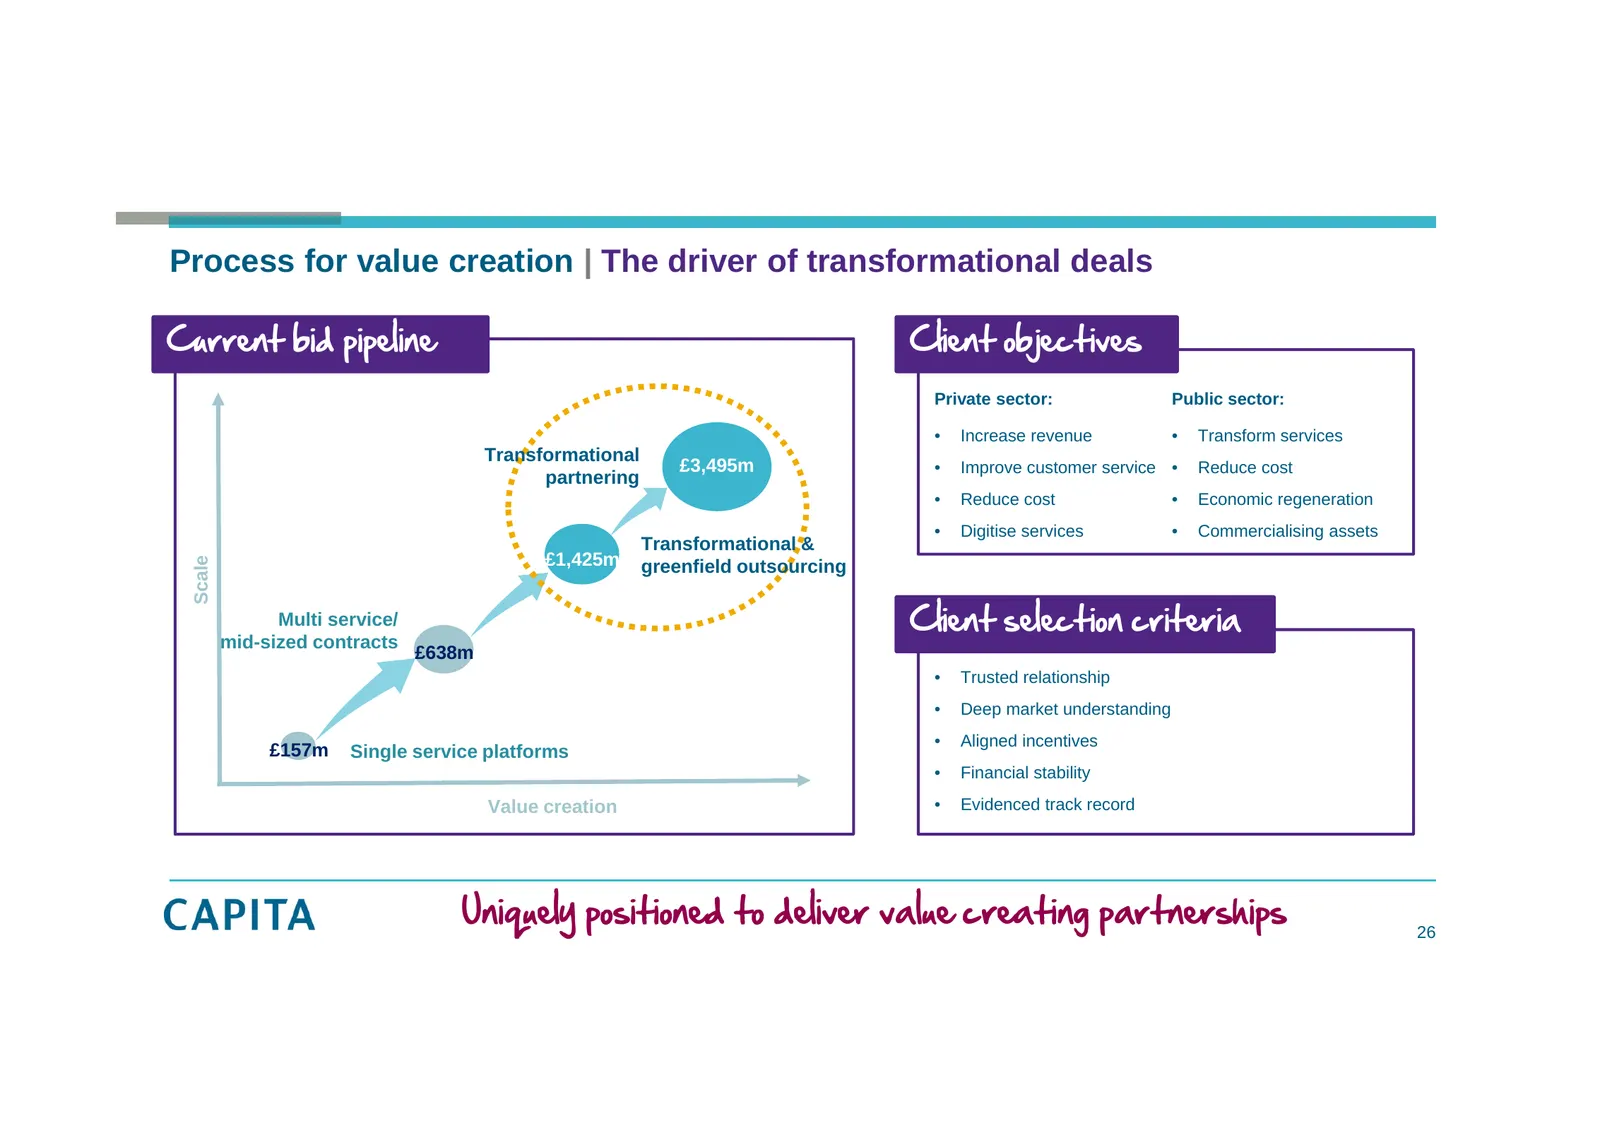
Process for value creation | The driver of transformational deals Current bid pipeline Client objectives Private sector: Public sector: • Increase revenue • Transform services Transformational £3,495m • Improve customer service • Reduce cost partnering • Reduce cost • Economic regeneration • Digitis
Slide 27: Targeted and efficient process
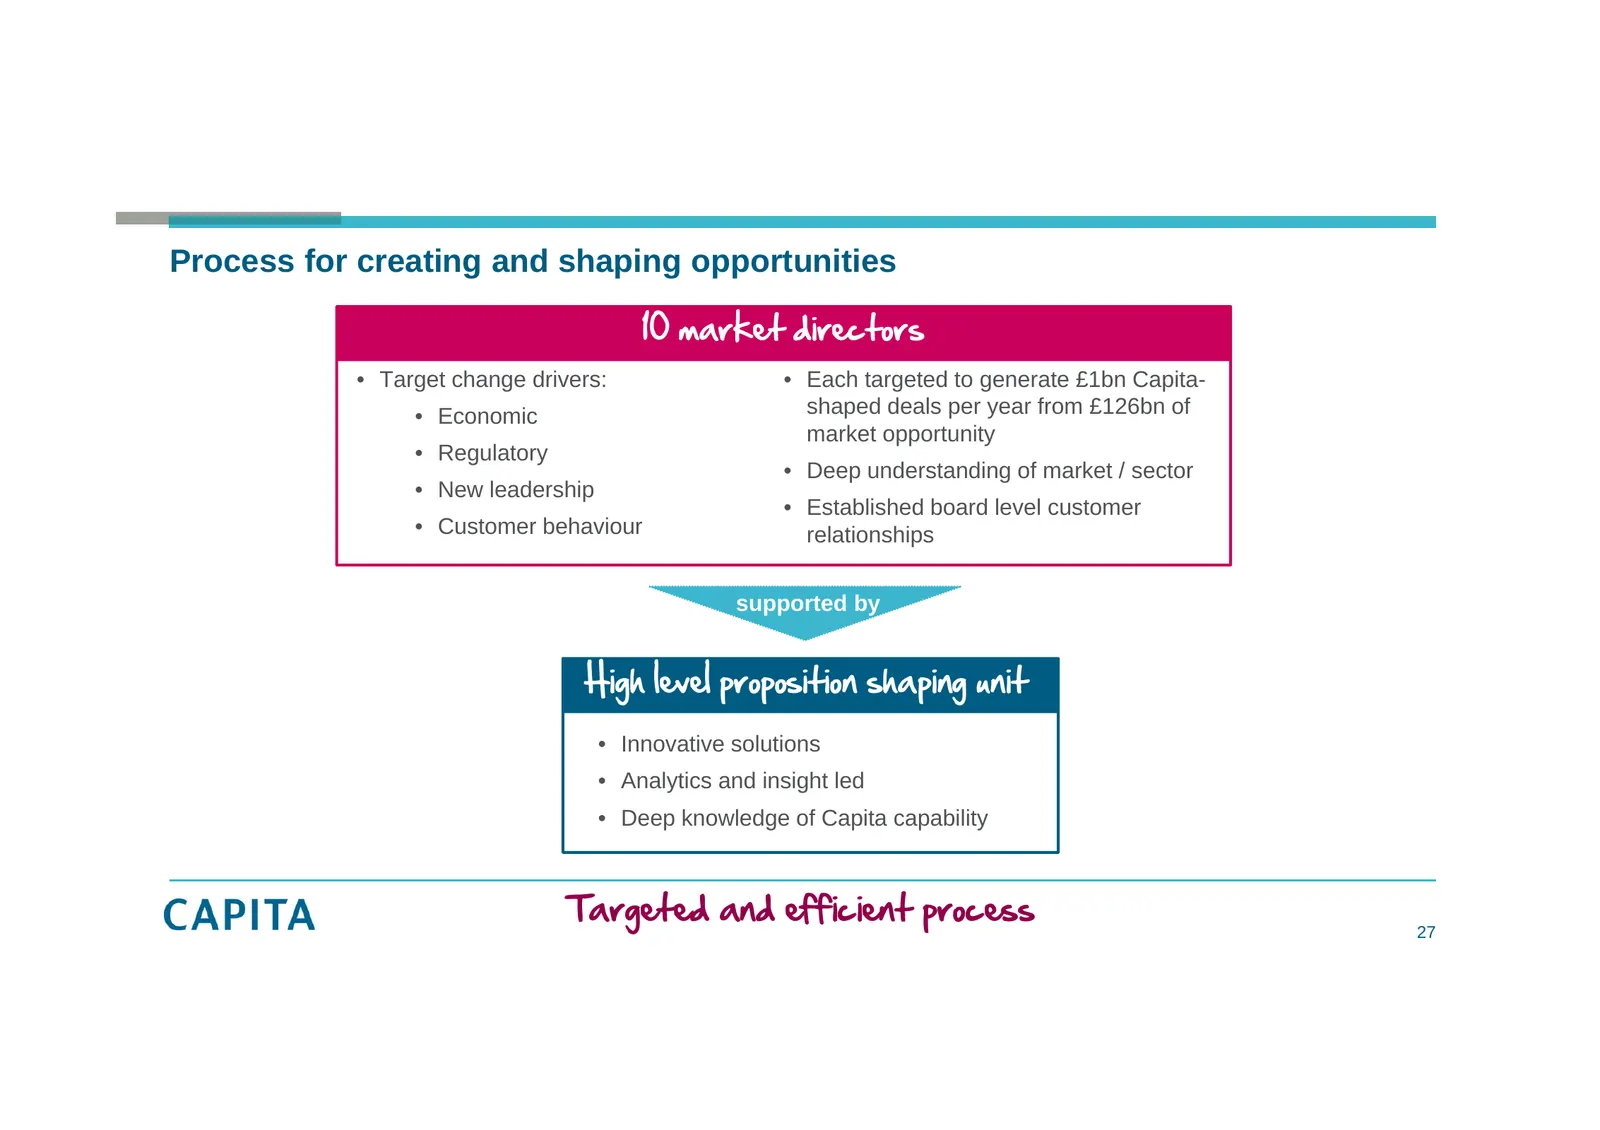
Process for creating and shaping opportunities 10 market directors • Target change drivers: • Each targeted to generate £1bn Capita- • Economic shaped deals per year from £126bn of market opportunity • Regulatory • Deep understanding of market / sector • New leadership • Established board level cust
Slide 28: Continued investment in sales capabilities
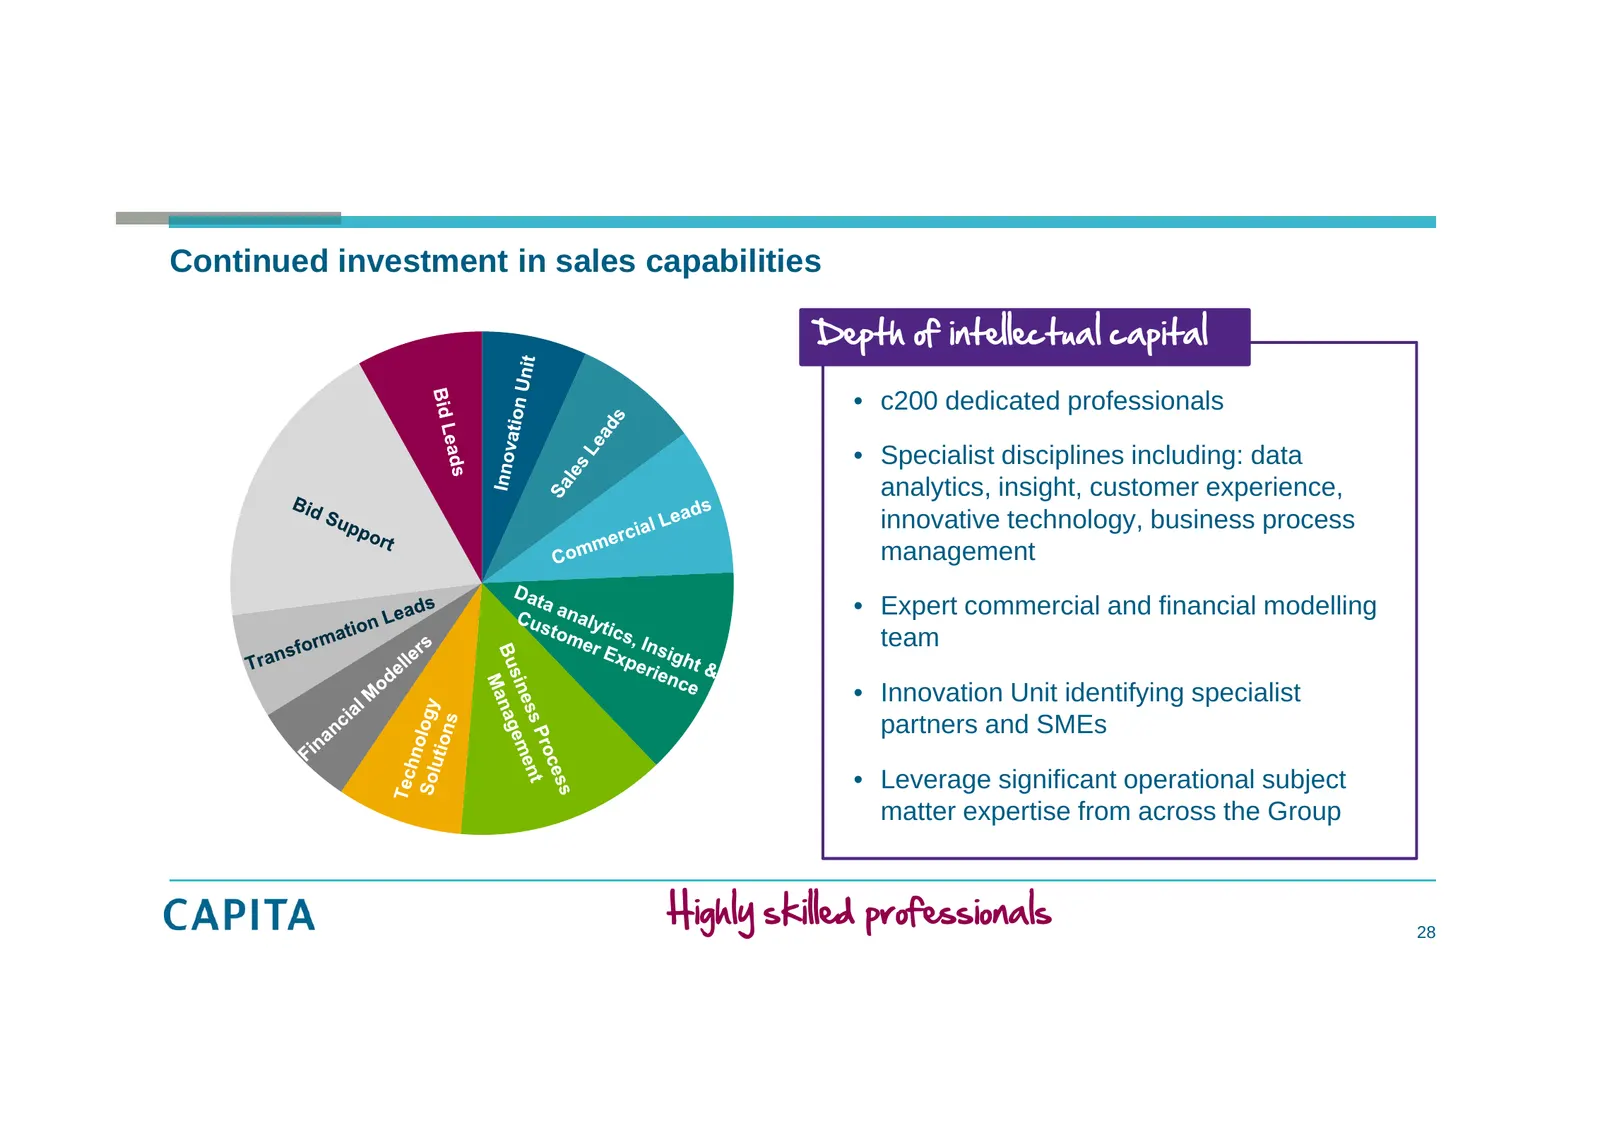
Continued investment in sales capabilities Depth of intellectual capital • c200 dedicated professionals • Specialist disciplines including: data analytics, insight, customer experience, innovative technology, business process management • Expert commercial and financial modelling team • Innovation U
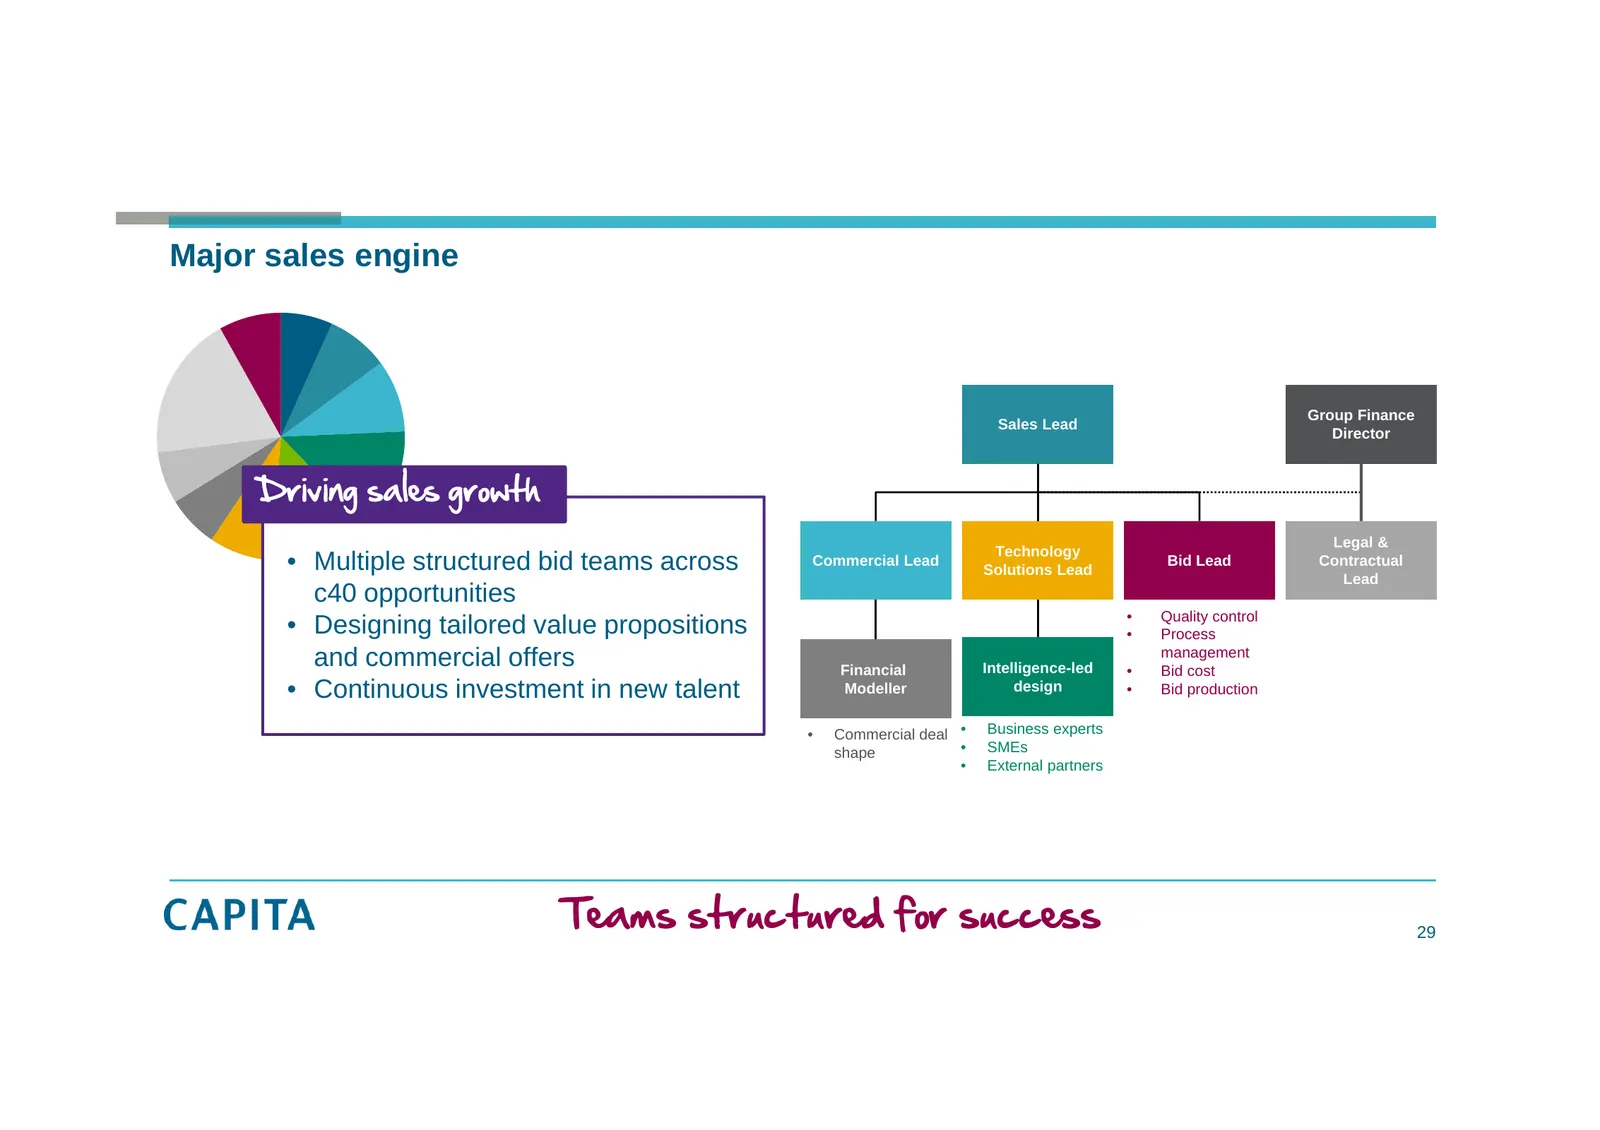
Slide 29: Teams structured for success
Major sales engine Group Finance Sales Lead Director Driving sales growth Legal & Technology • Multiple structured bid teams across Commercial Lead Solutions Lead Bid Lead Contractual Lead c40 opportunities • Quality control • Designing tailored value propositions • Process and commercial offers Fin
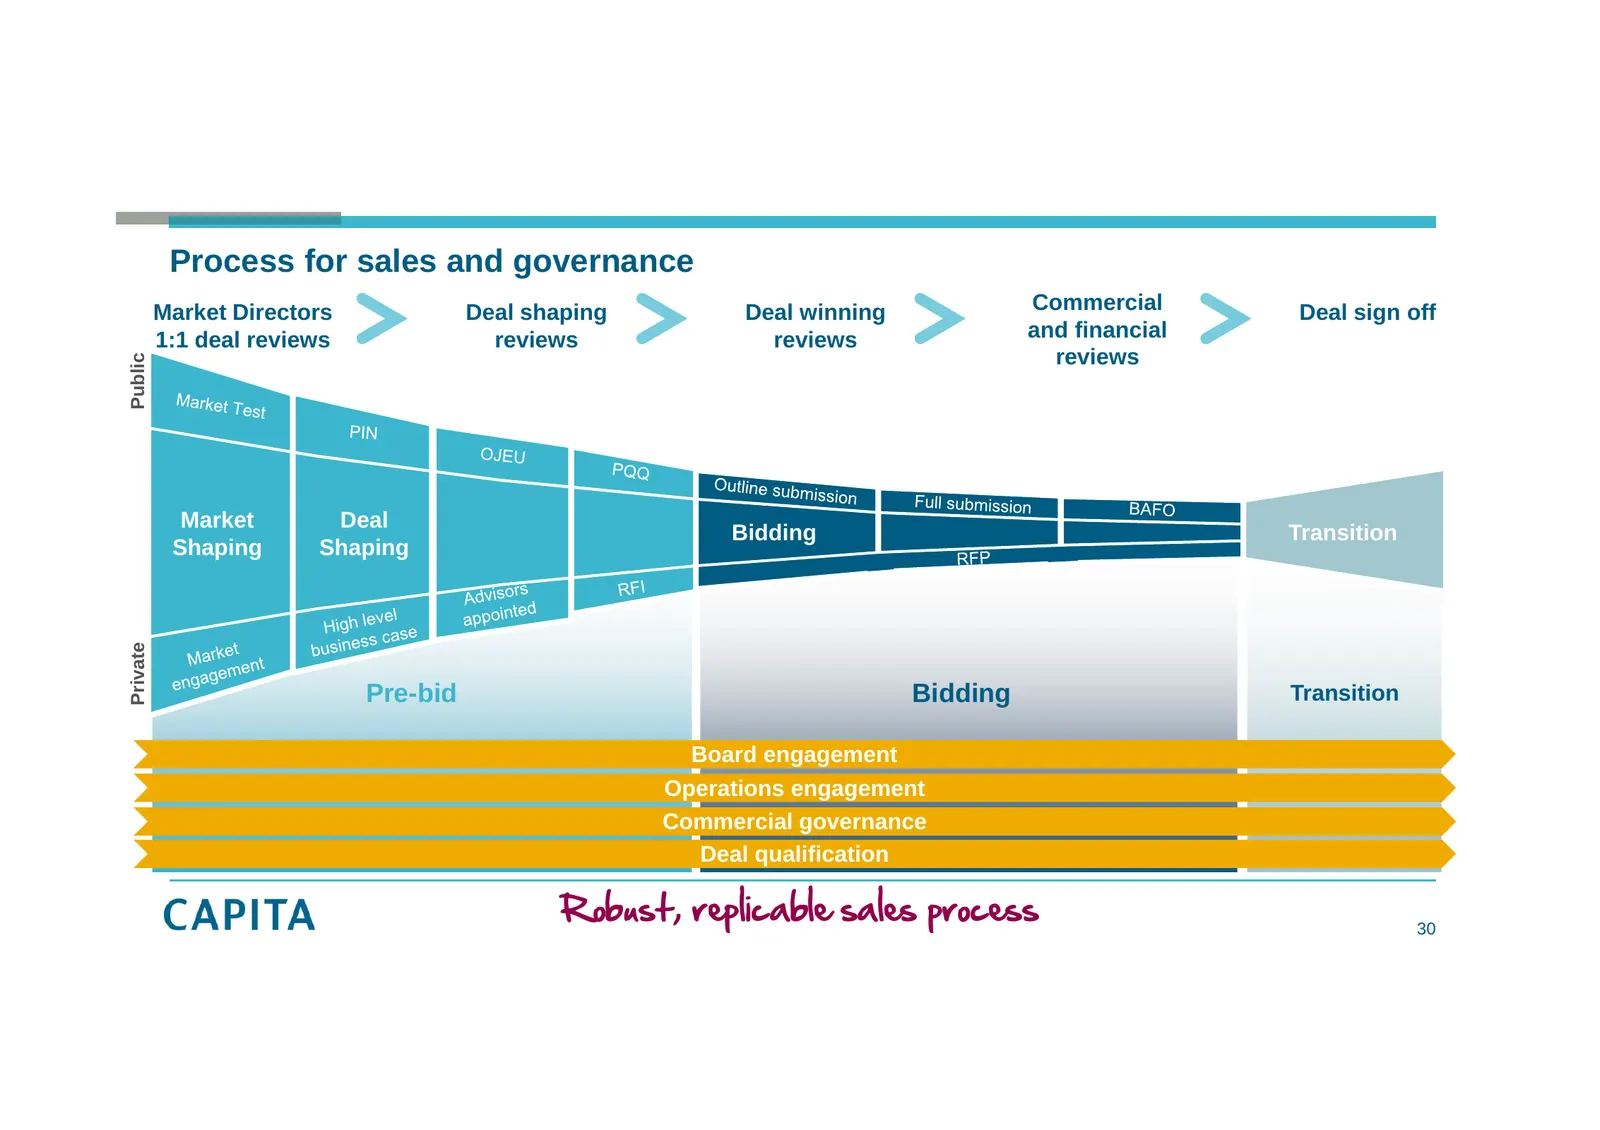
Slide 30: Process for sales and governance
Process for sales and governance Market Directors Deal shaping Deal winning Commercial Deal sign off 1:1 deal reviews reviews reviews and financial reviews Public Market Deal Bidding Transition Shaping Shaping Private Pre-bid Bidding Transition Board engagement Operations engagement Commercial gover
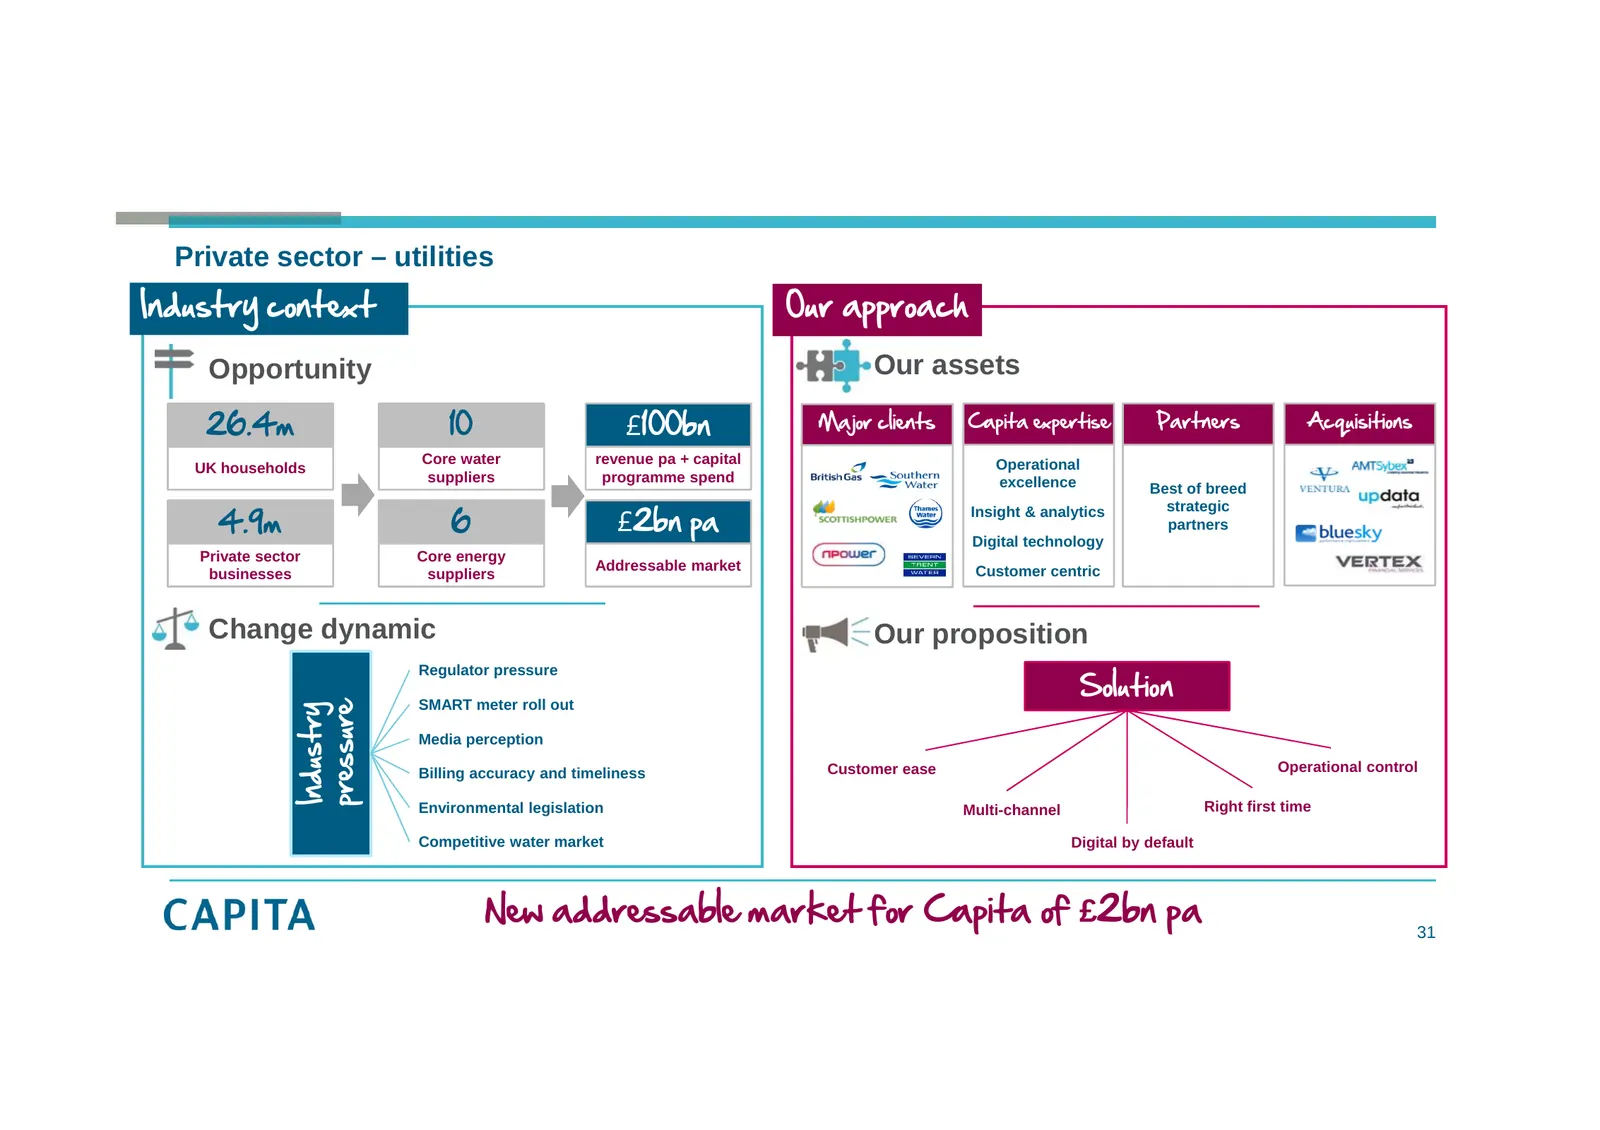
Slide 31: Industry pressure: private sector utilities
Private sector – utilities Industry context Our approach Opportunity Our assets 26.4m 10 £100bn Major clients Capita expertise Partners Acquisitions Core water revenue pa + capital Operational UK households suppliers programme spend excellence Best of breed strategic 4.9m 6 £2bn pa Insight & analyti
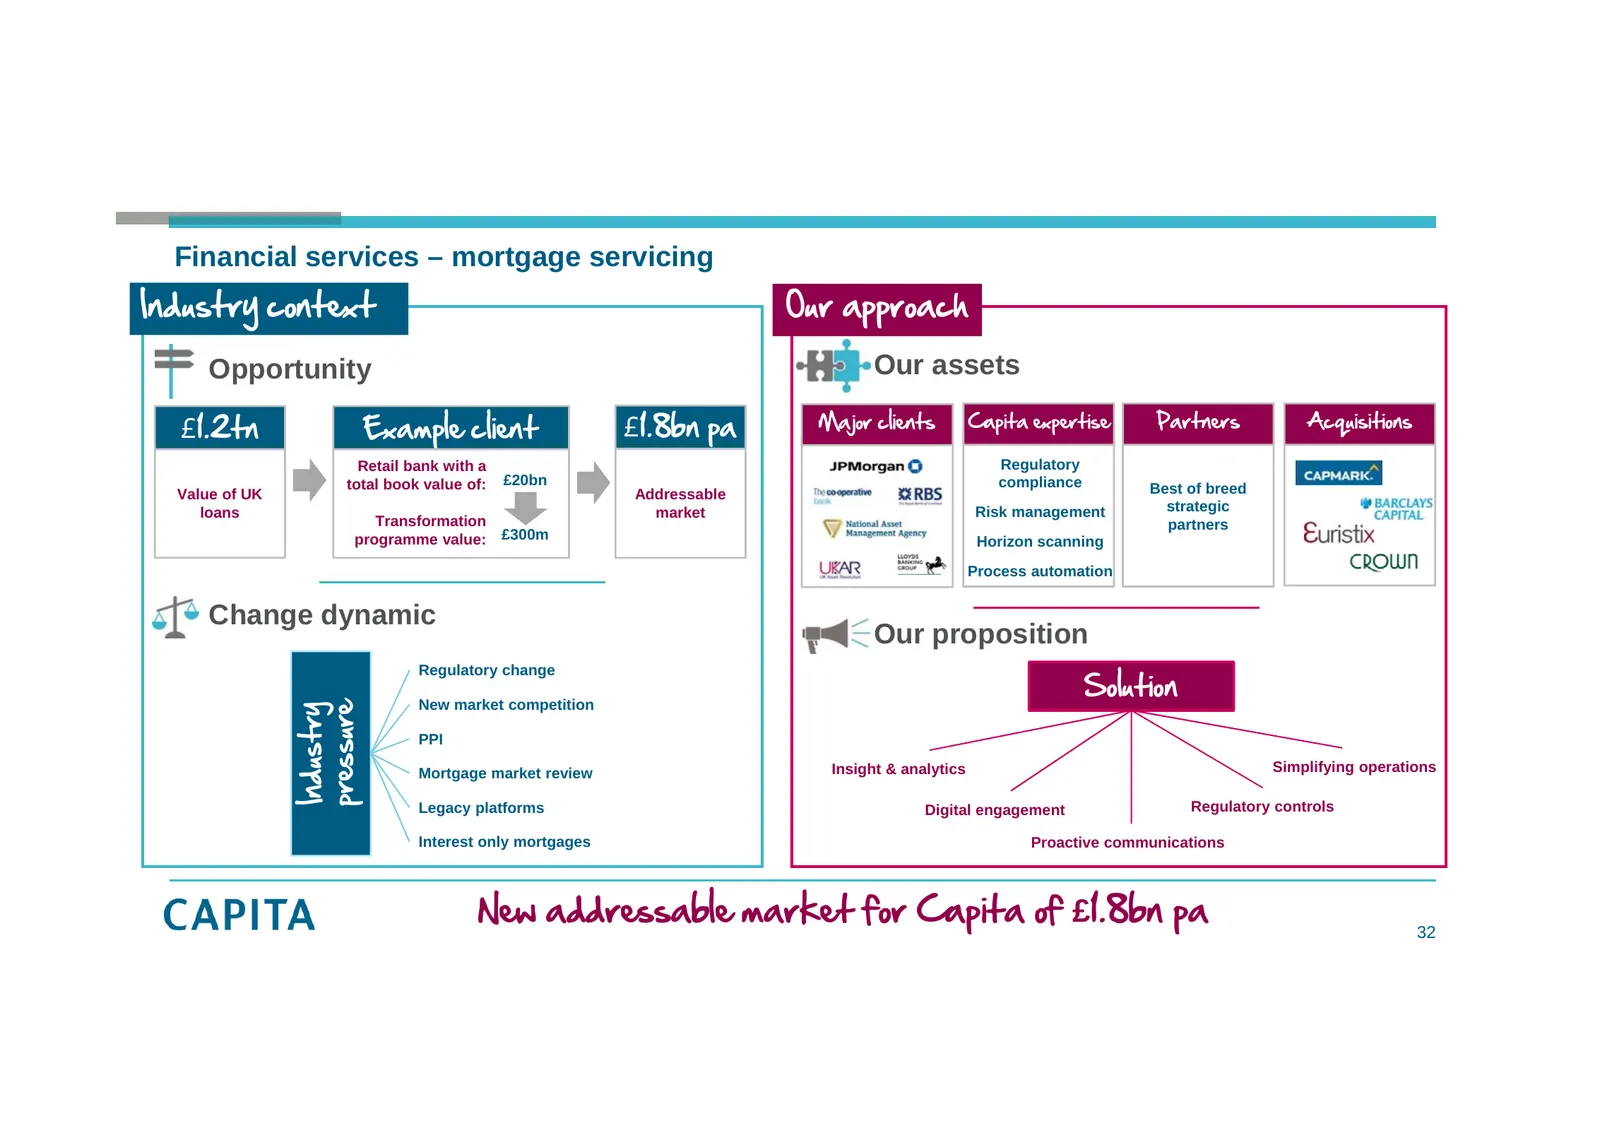
Slide 32: Industry pressure: mortgage servicing
Financial services – mortgage servicing Industry context Our approach Opportunity Our assets £1.8bn pa Major clients Capita expertise Partners Acquisitions £1.2tn Example client Retail bank with a Regulatory total book value of: £20bn compliance Value of UK Addressable Best of breed loans market Ris
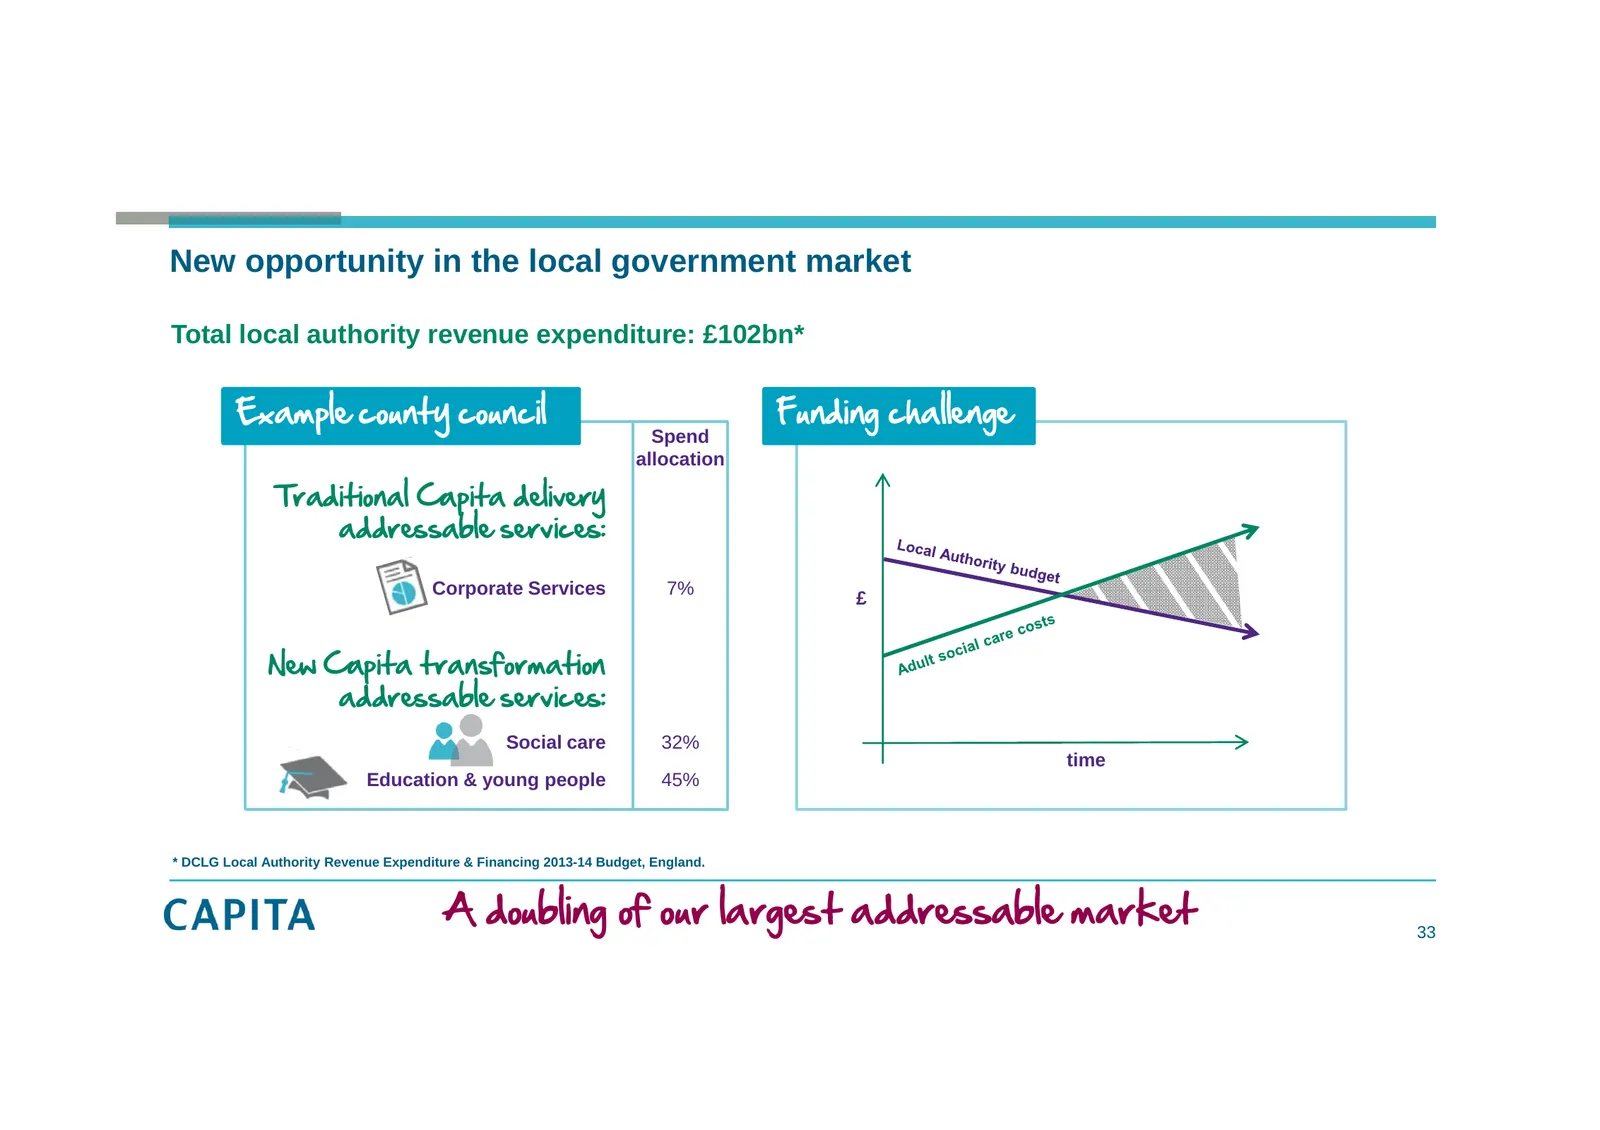
Slide 33: A doubling of our largest addressable market
New opportunity in the local government market Total local authority revenue expenditure: £102bn* Example county council Funding challenge Spend allocation Traditional Capita delivery addressable services: Corporate Services 7% £ New Capita transformation addressable services: Social care 32% time E
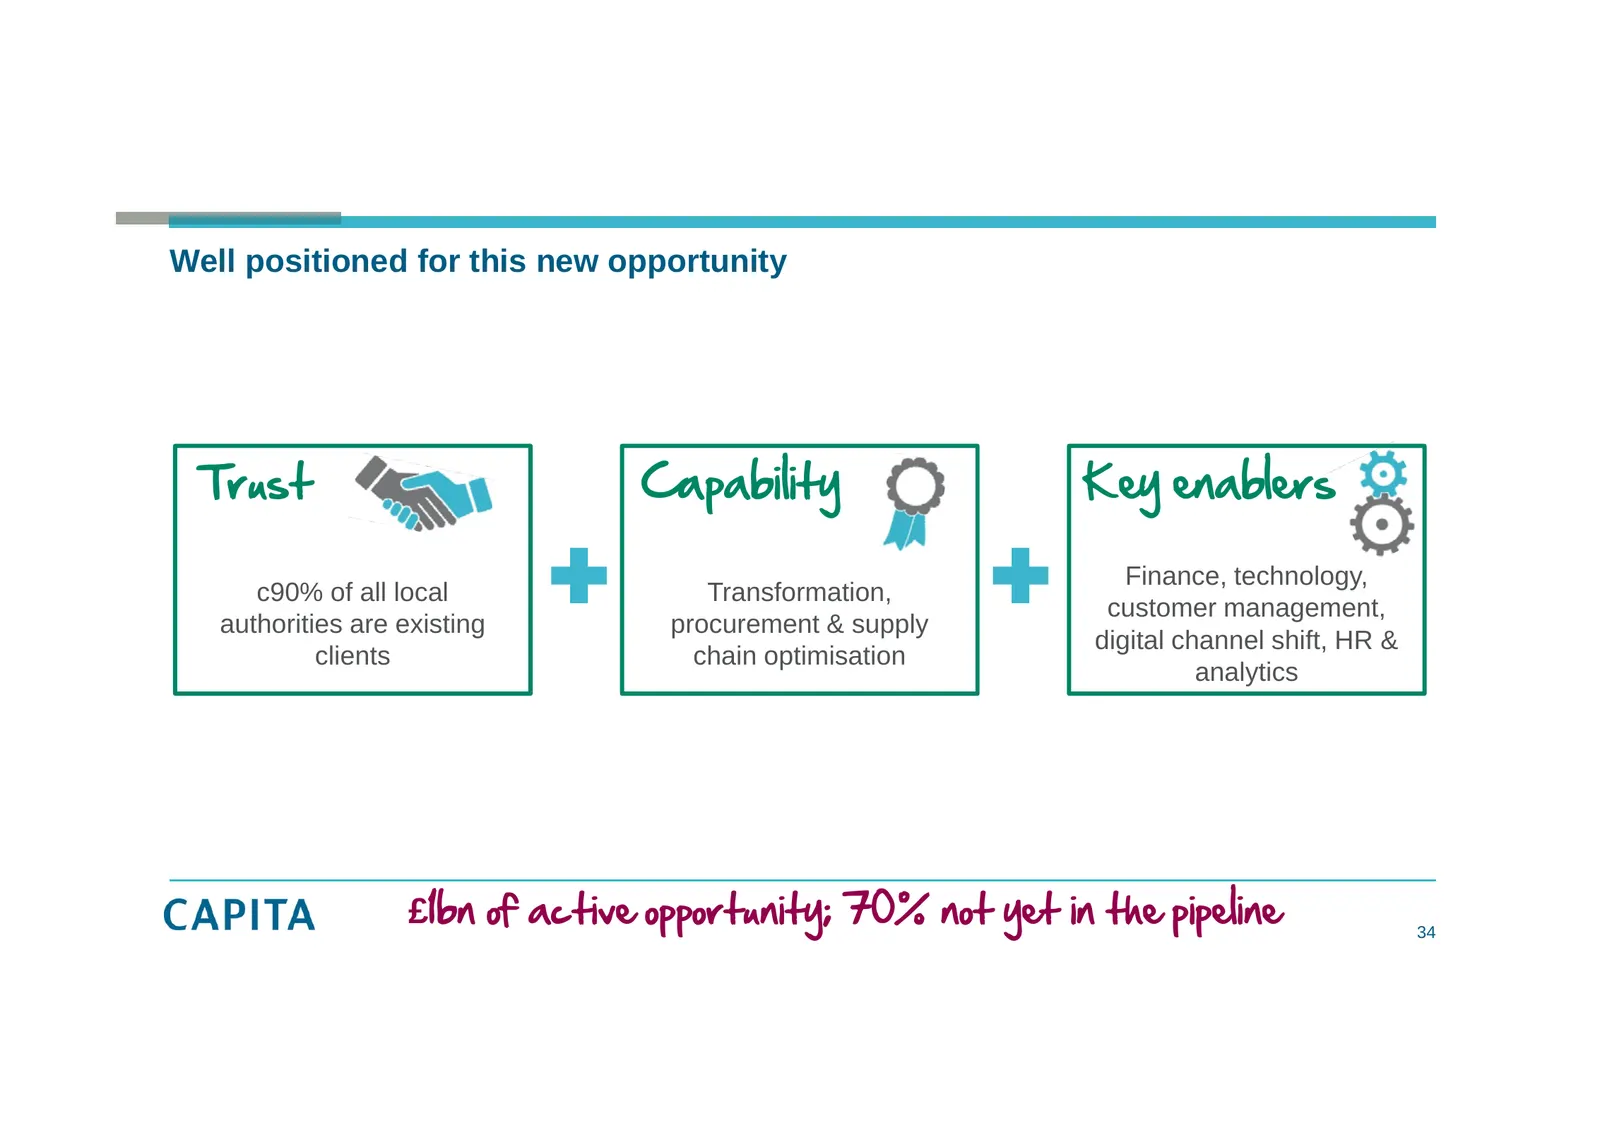
Slide 34: Well positioned for this new opportunity
Well positioned for this new opportunity Trust Capability Key enablers Finance, technology, c90% of all local Transformation, customer management, authorities are existing procurement & supply digital channel shift, HR & clients chain optimisation analytics £1bn of active opportunity; 70% not yet in
Slide 35: Creating growth: Building a platform for long term profitable growth
Creating growth: Building a platform for long term profitable growth Andy Parker 35
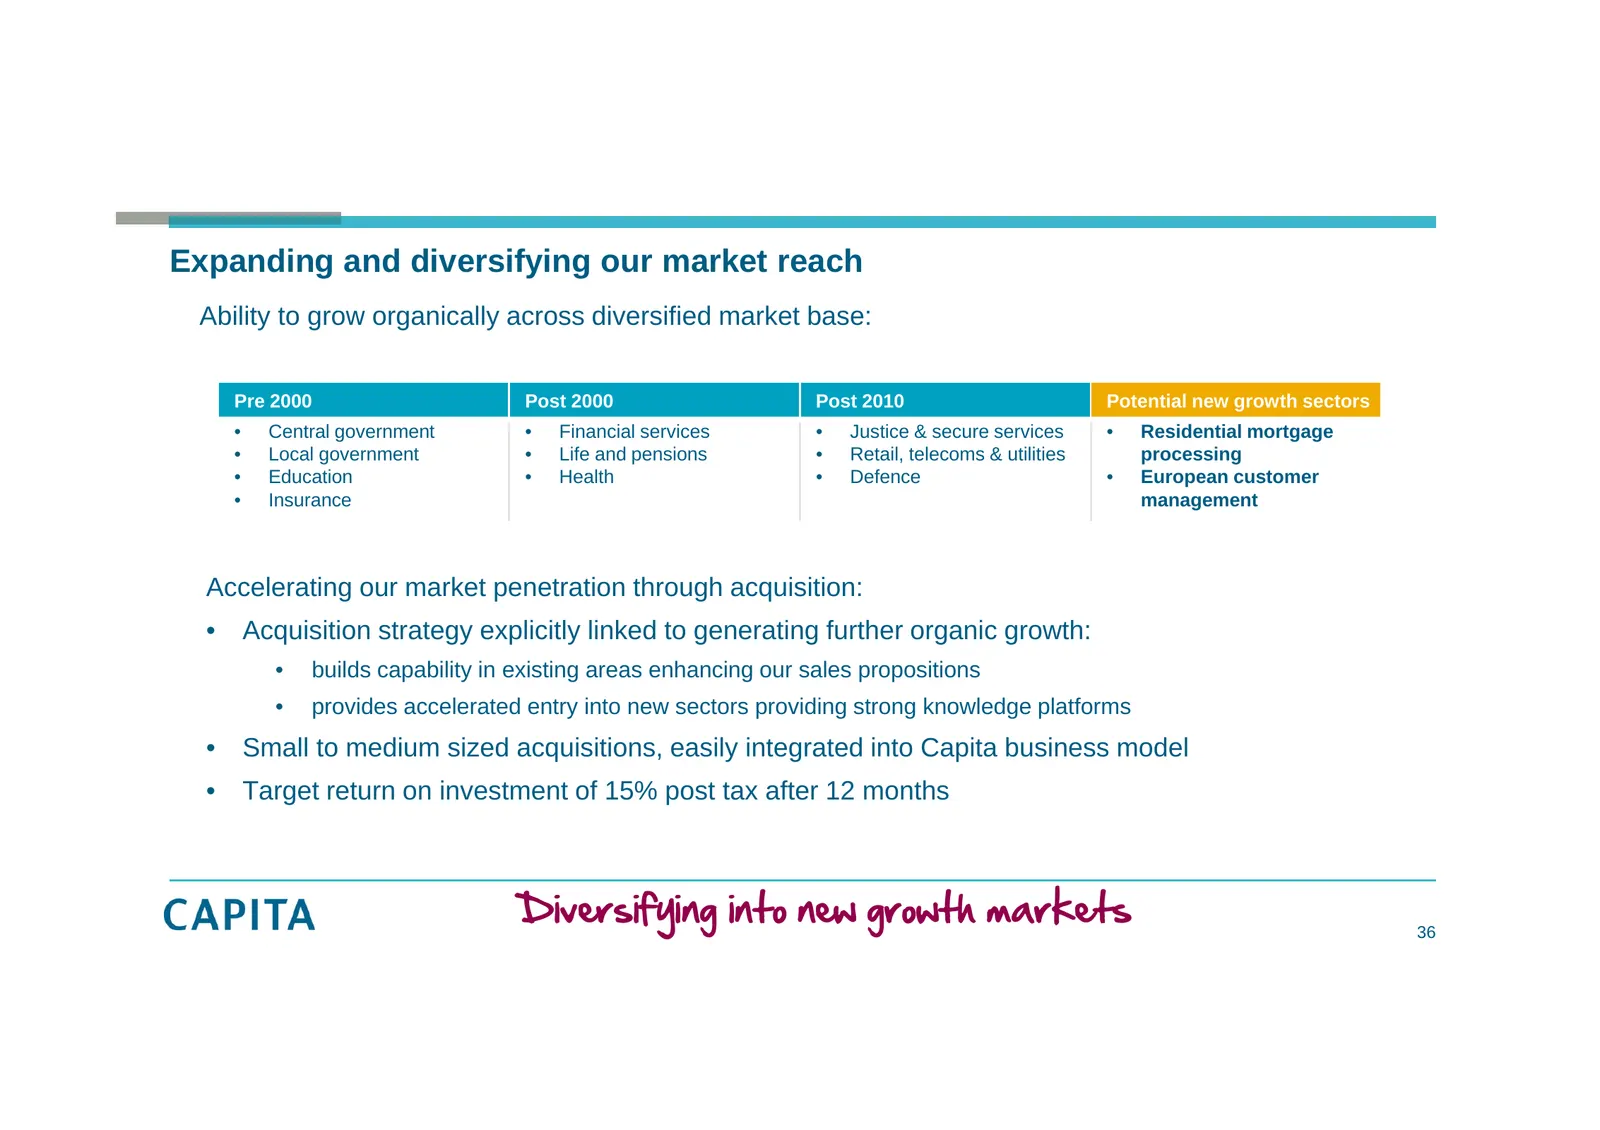
Slide 36: Diversifying into new growth markets
Expanding and diversifying our market reach Ability to grow organically across diversified market base: Pre 2000 Post 2000 Post 2010 Potential new growth sectors • Central government • Financial services • Justice & secure services • Residential mortgage • Local government • Life and pensions • Reta
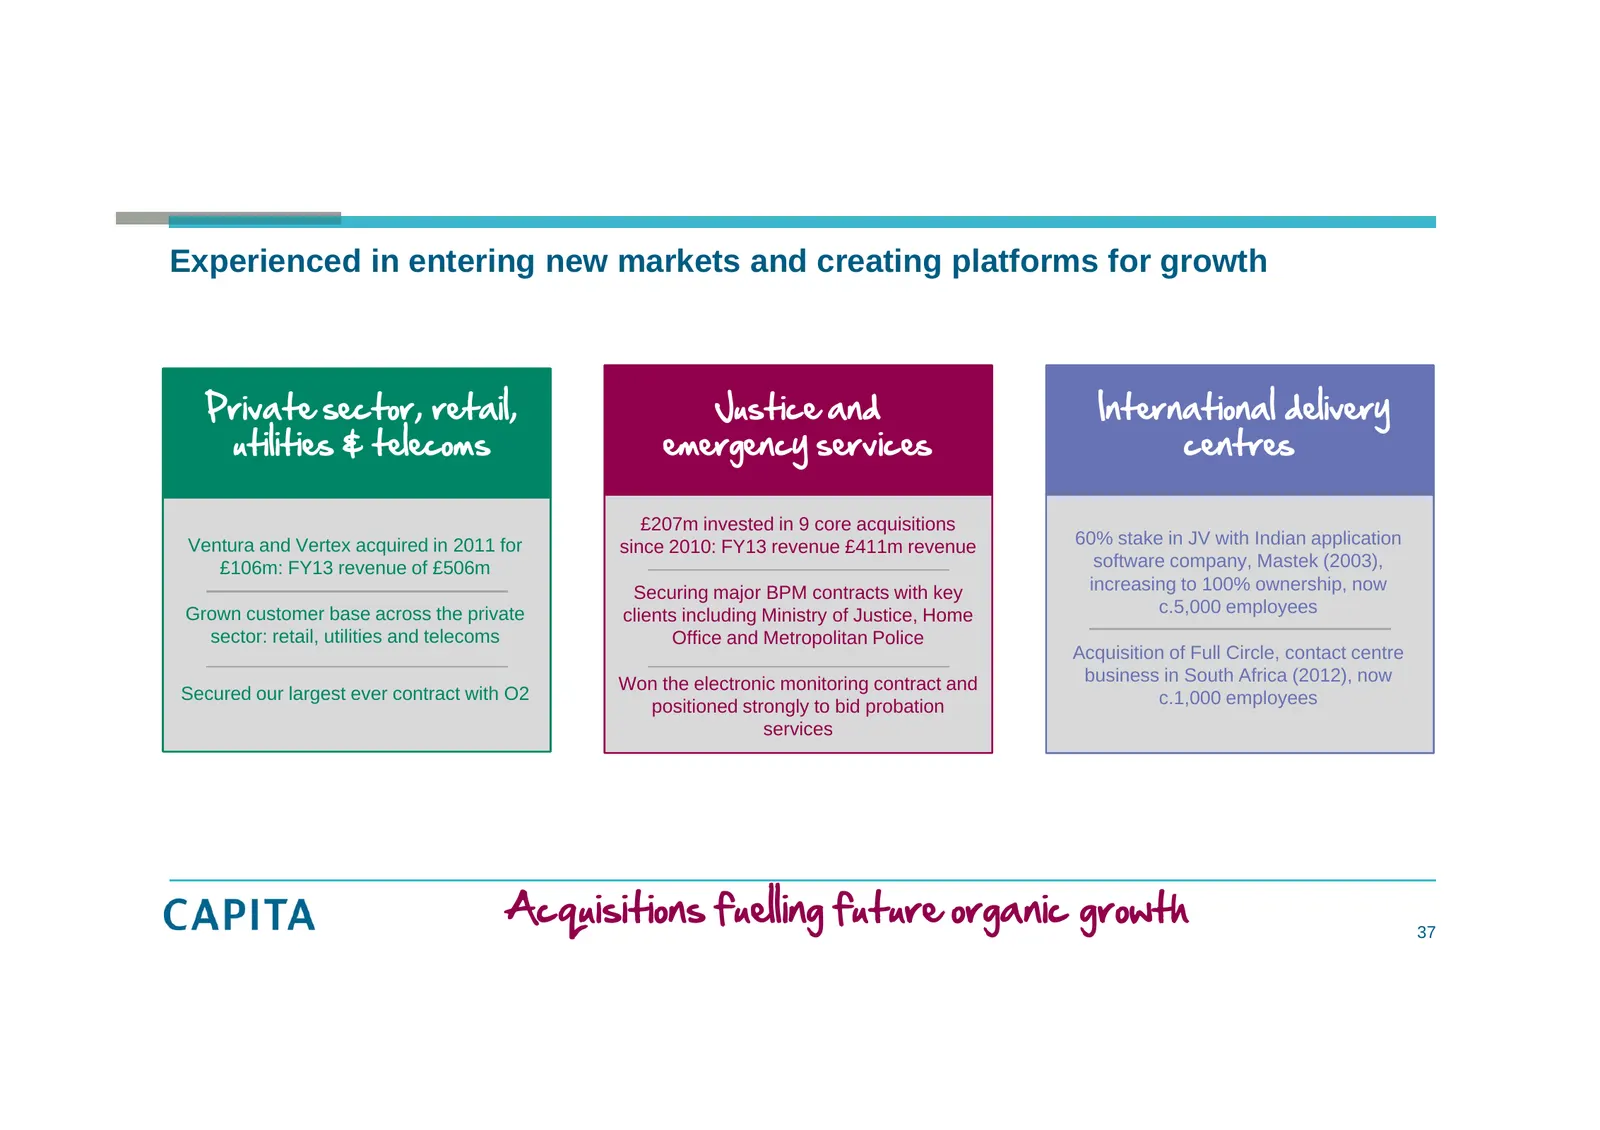
Slide 37: Acquisitions fuelling future organic growth
Experienced in entering new markets and creating platforms for growth Private sector, retail, Justice and International delivery utilities & telecoms emergency services centres £207m invested in 9 core acquisitions Ventura and Vertex acquired in 2011 for since 2010: FY13 revenue £411m revenue 60% st
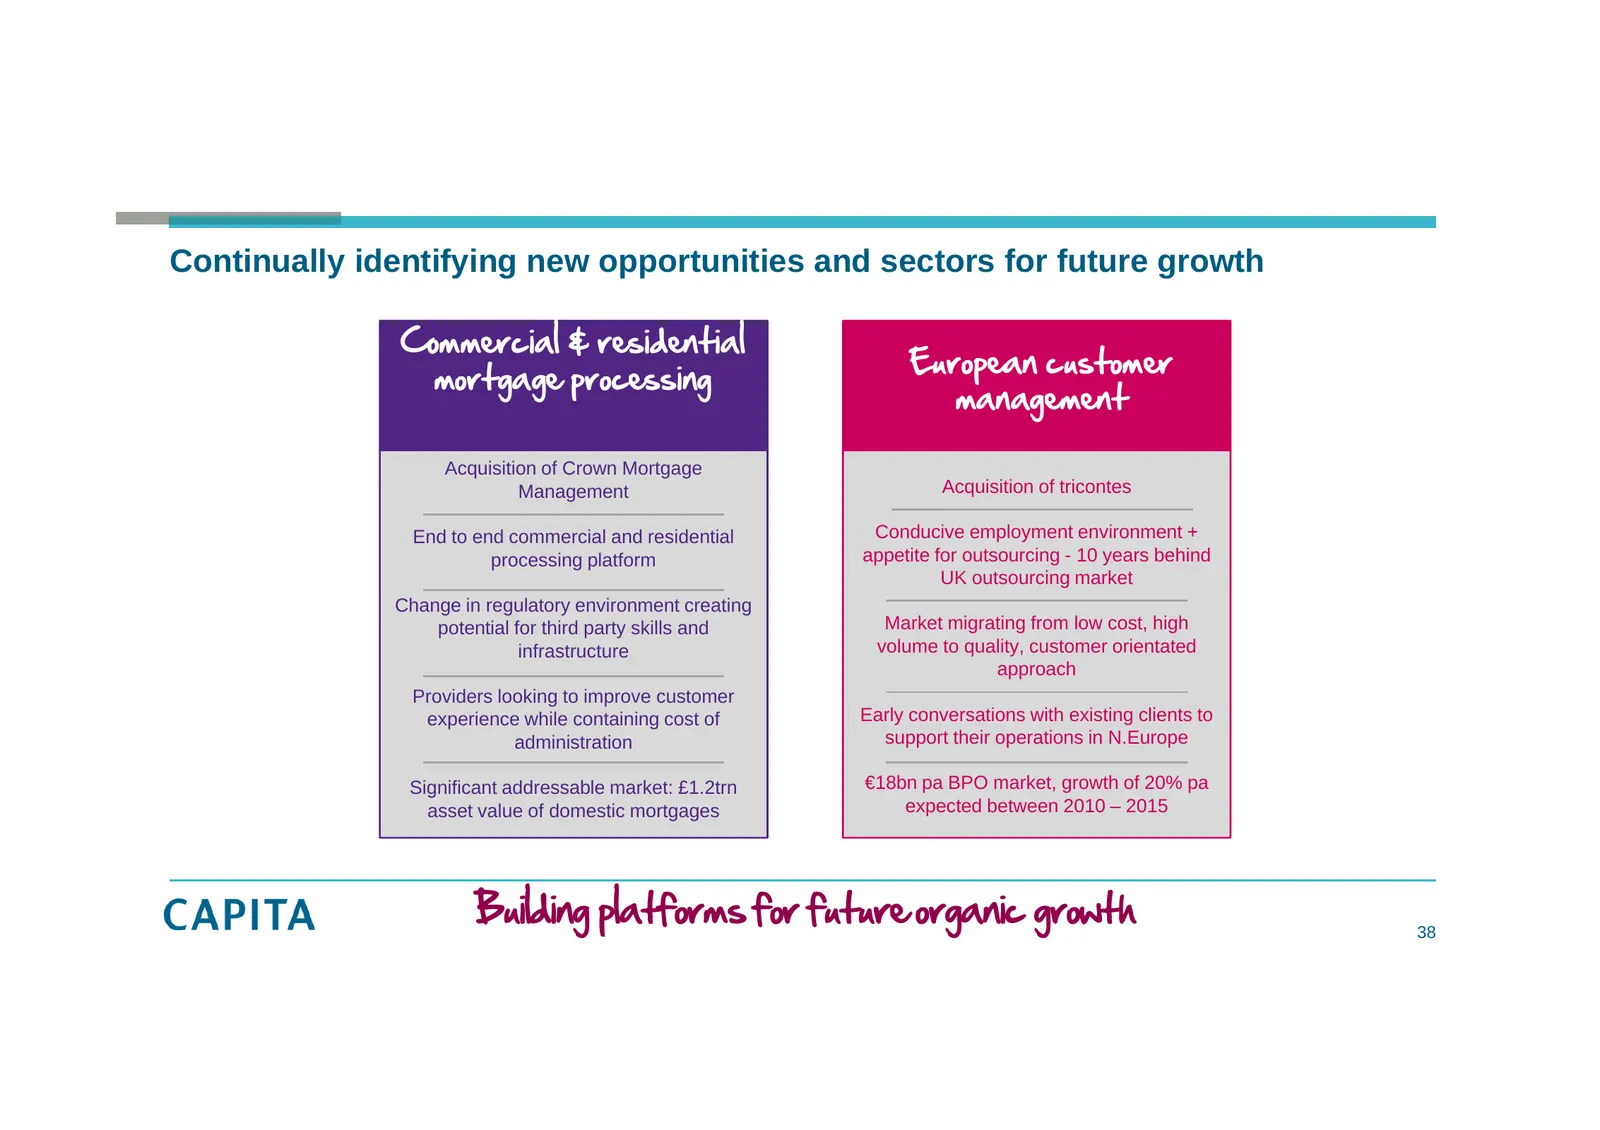
Slide 38: Building platforms for future organic growth
Continually identifying new opportunities and sectors for future growth Commercial & residential European customer mortgage processing management Acquisition of Crown Mortgage Management Acquisition of tricontes End to end commercial and residential Conducive employment environment + processing plat
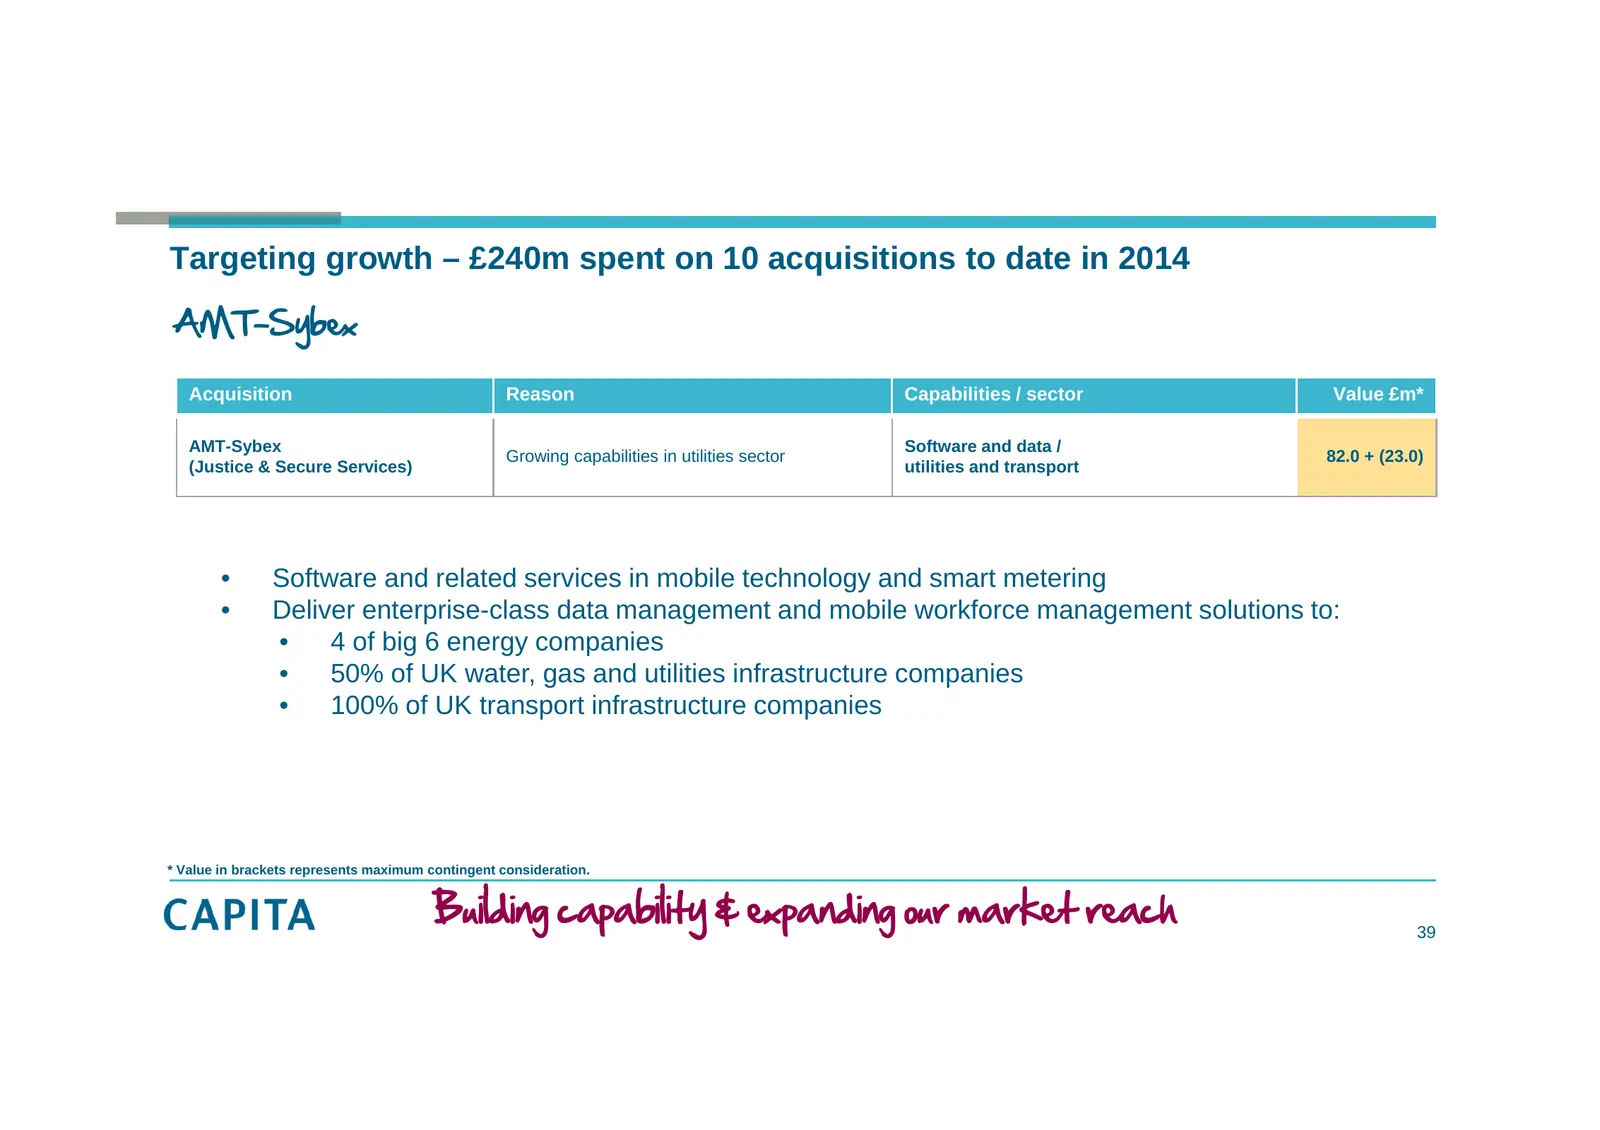
Slide 39: Building capability & expanding our market reach: AMT-Sybex
Targeting growth – £240m spent on 10 acquisitions to date in 2014 AMT-Sybex Acquisition Reason Capabilities / sector Value £m* AMT-Sybex Software and data / Growing capabilities in utilities sector 82.0 + (23.0) (Justice & Secure Services) utilities and transport • Software and related services in m
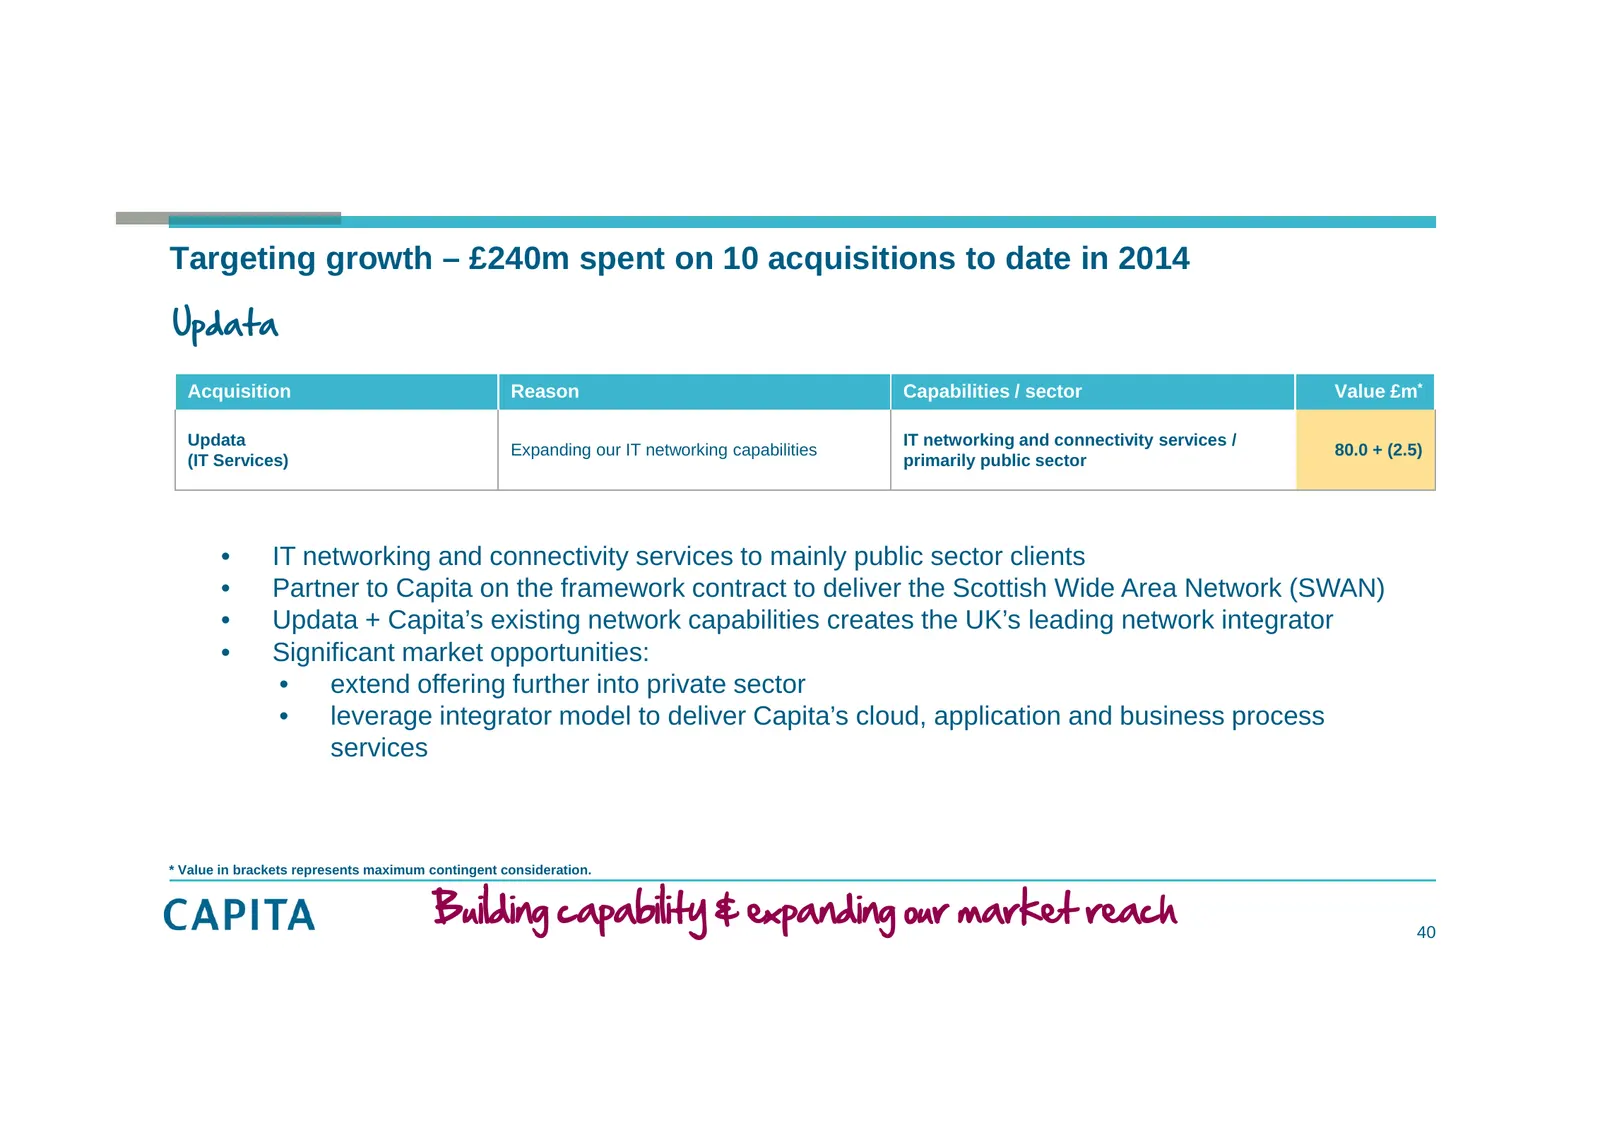
Slide 40: Building capability & expanding our market reach: Updata
Targeting growth – £240m spent on 10 acquisitions to date in 2014 Updata Acquisition Reason Capabilities / sector Value £m* Updata IT networking and connectivity services / Expanding our IT networking capabilities 80.0 + (2.5) (IT Services) primarily public sector • IT networking and connectivity se
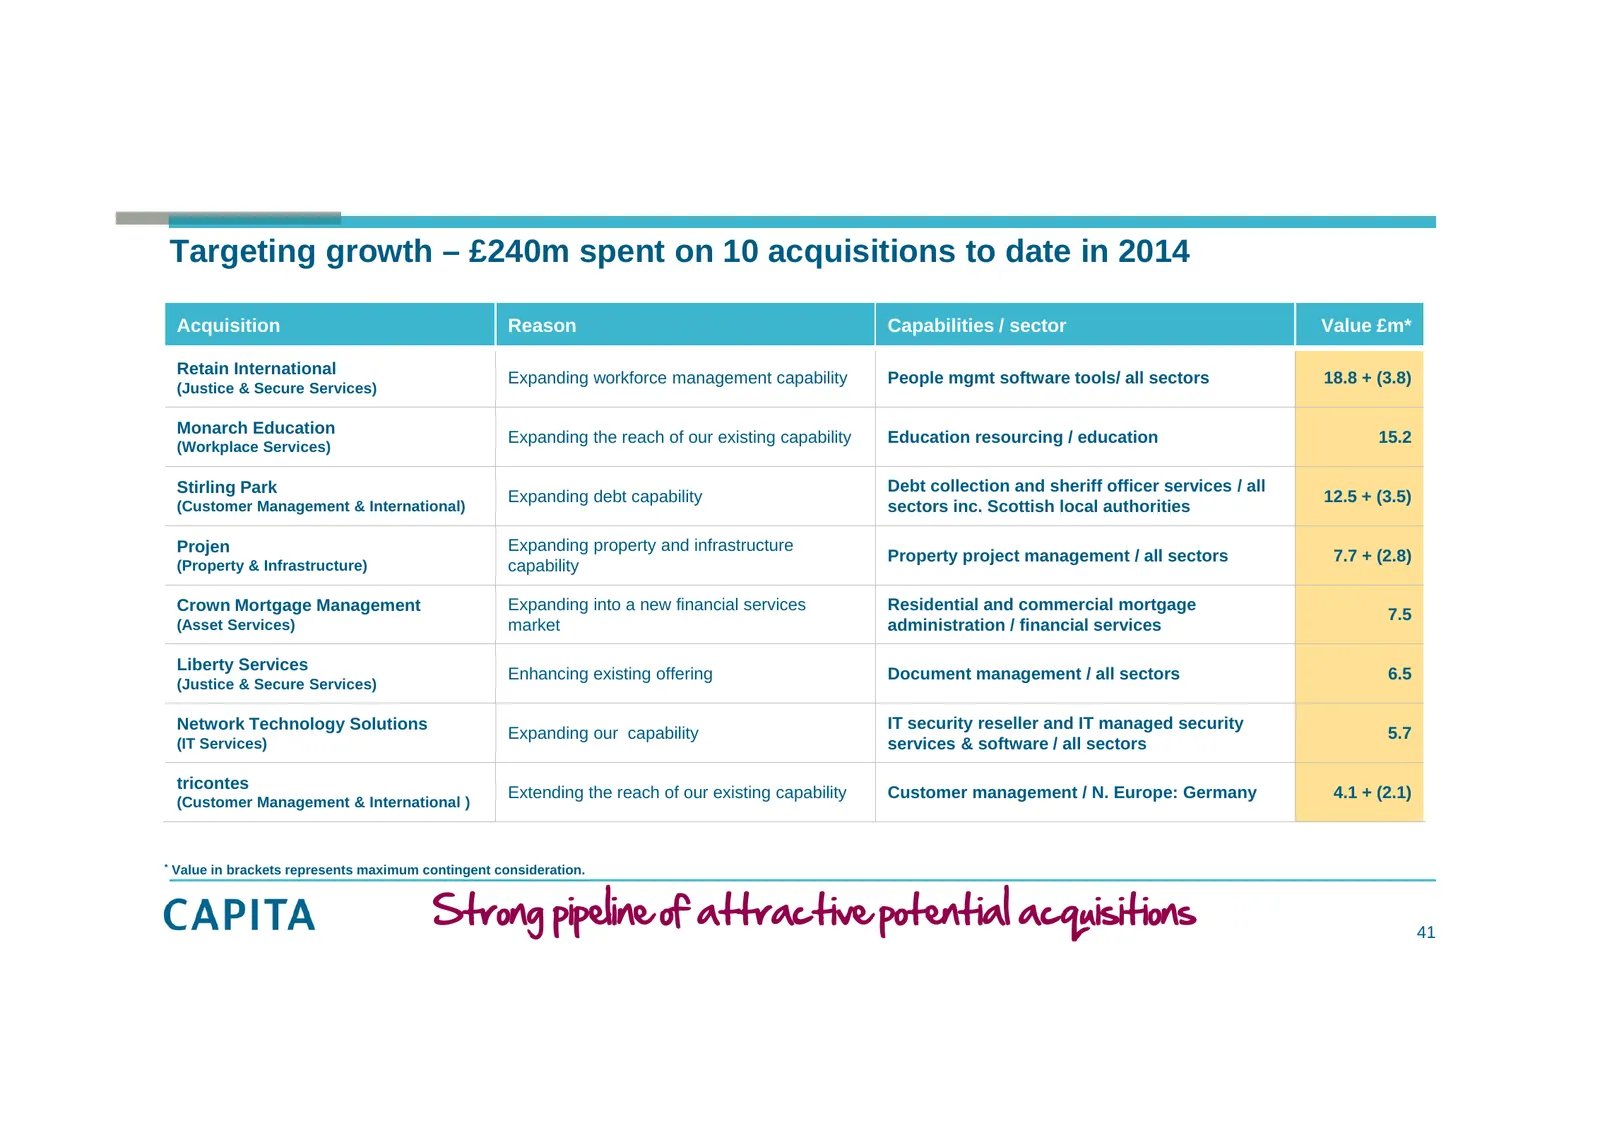
Slide 41: Strong pipeline of attractive potential acquisitions
Targeting growth – £240m spent on 10 acquisitions to date in 2014 Acquisition Reason Capabilities / sector Value £m* Retain International Expanding workforce management capability People mgmt software tools/ all sectors 18.8 + (3.8) (Justice & Secure Services) Monarch Education Expanding the reach o
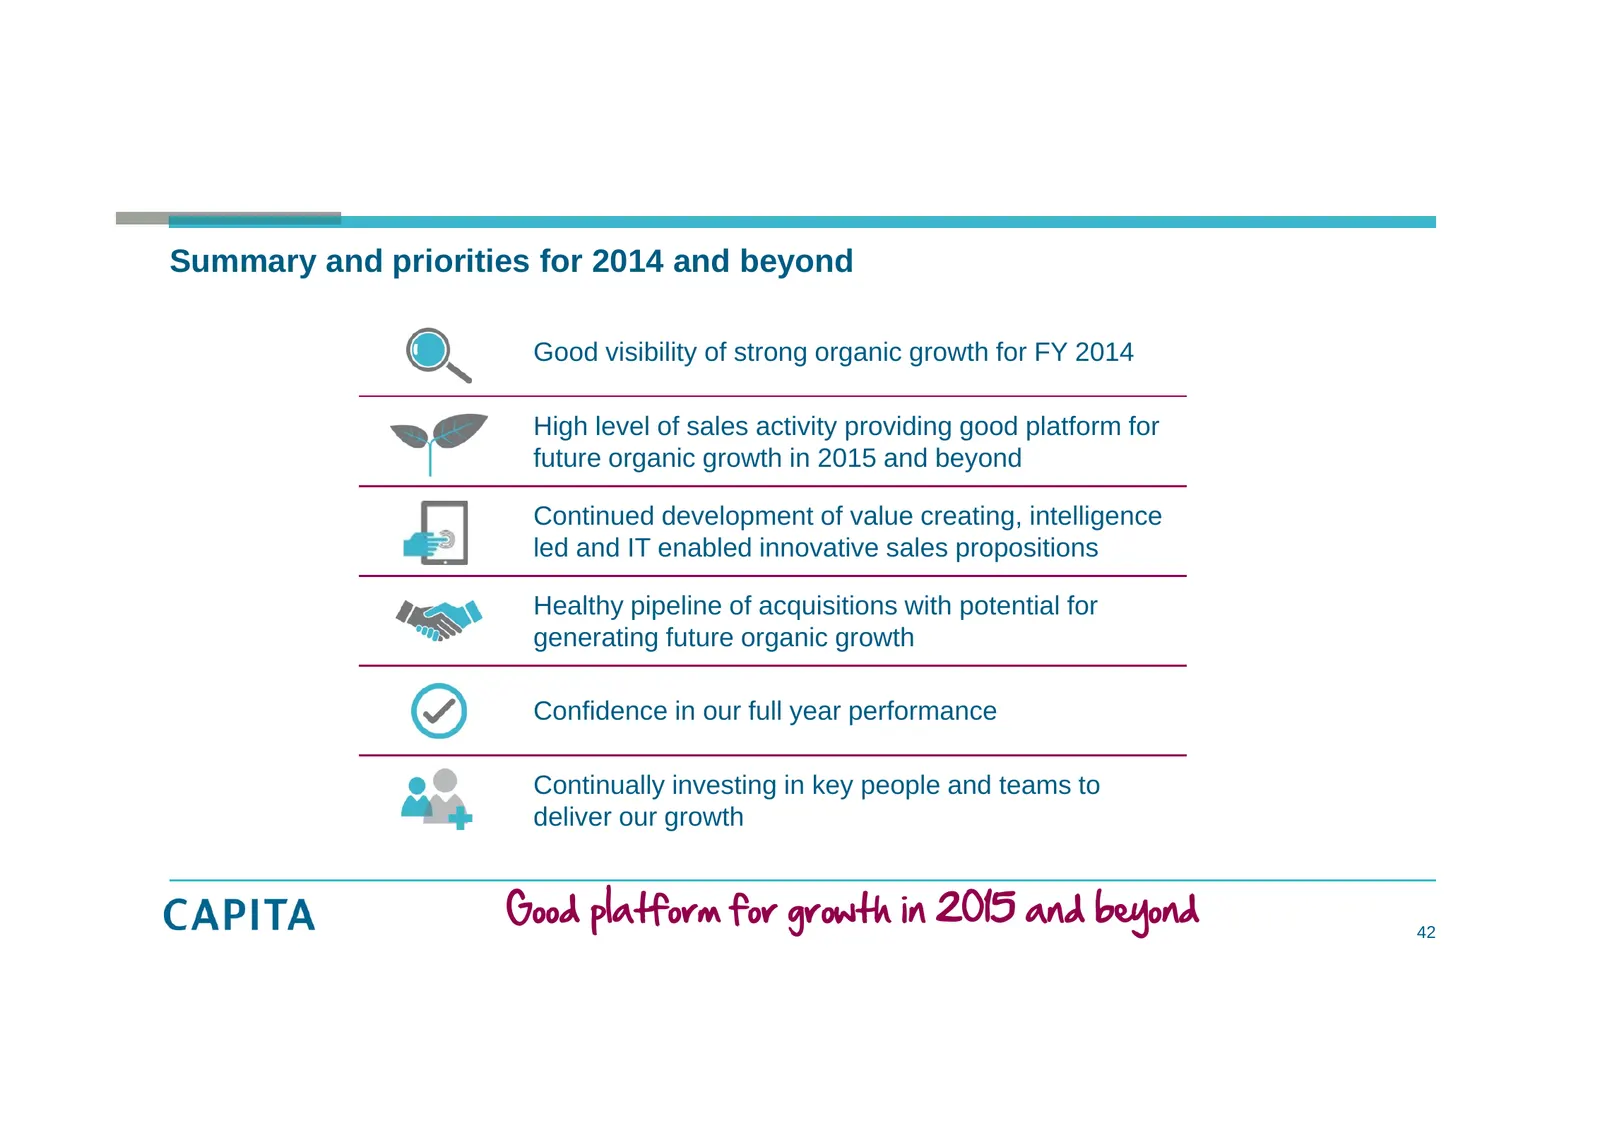
Slide 42: Good platform for growth in 2015 and beyond
Summary and priorities for 2014 and beyond Good visibility of strong organic growth for FY 2014 High level of sales activity providing good platform for future organic growth in 2015 and beyond Continued development of value creating, intelligence led and IT enabled innovative sales propositions Hea
Slide 43: Results for the 6 months to 30 June 2014
Results for the 6 months to 30 June 2014
Source: Internet Archive copy of investors.capita.com
More decks from Capita plc
 H1 2026 Earnings Presentation44 slides · Aug 4, 2026
 FY2025 Earnings Presentation46 slides · March 2026
 Merger or Acquisition (March 2026)10 slides · March 2026
 H1 2025 Earnings Presentation51 slides · August 2025
 FY2024 Earnings Presentation44 slides · March 2025
 H1 2024 Earnings Presentation33 slides · Aug 1, 2024