Scatec ASA · OSL:SCATC
Scatec ASA — Q3 2023 Earnings Presentation
25 slides from Scatec ASA's earnings presentation, 2023
Slide 1: Third quarter 2023
Third quarter 2023 Focus and discipline CEO, Terje Pilskog & CFO, Hans Jakob Hegge
Slide 2: Disclaimer
Disclaimer The following presentation is being made only to, and is only directed at, persons to whom such presentation may lawfully be communicated (’relevant persons’). Any person who is not a relevant person should not rely, act or make assessment on the basis of this presentation or anything inc
Slide 3: Key highlights
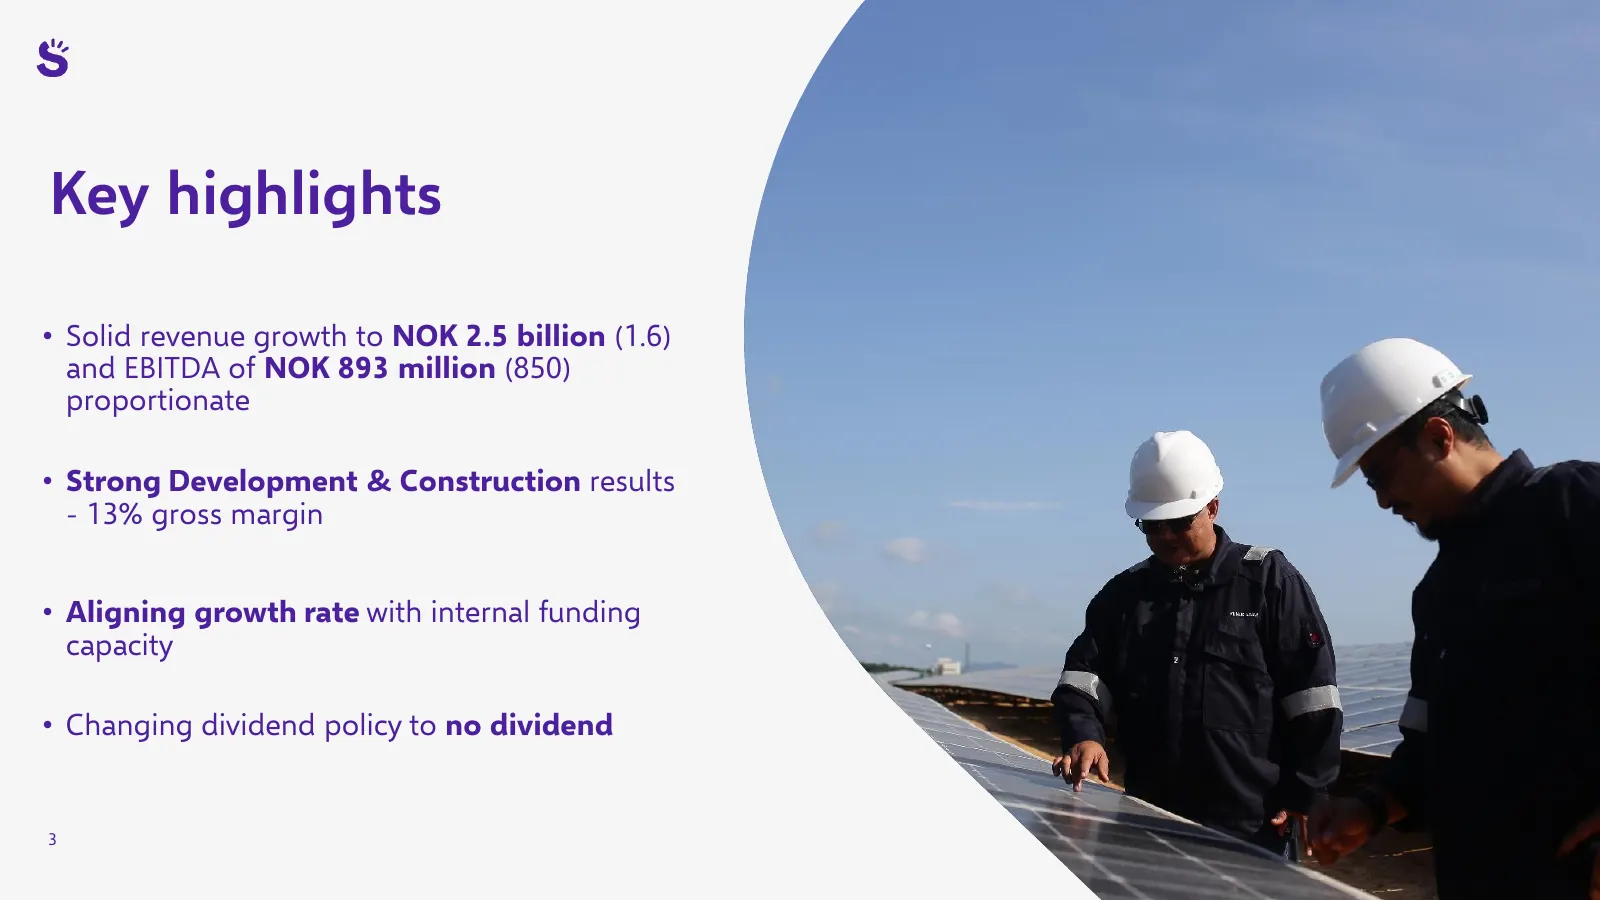
Key highlights • Solid revenue growth to NOK 2.5 billion (1.6) and EBITDA of NOK 893 million (850) proportionate • Strong Development & Construction results - 13% gross margin • Aligning growth rate with internal funding capacity • Changing dividend policy to no dividend 3
Slide 4: Fundamentals of renewables remain strong
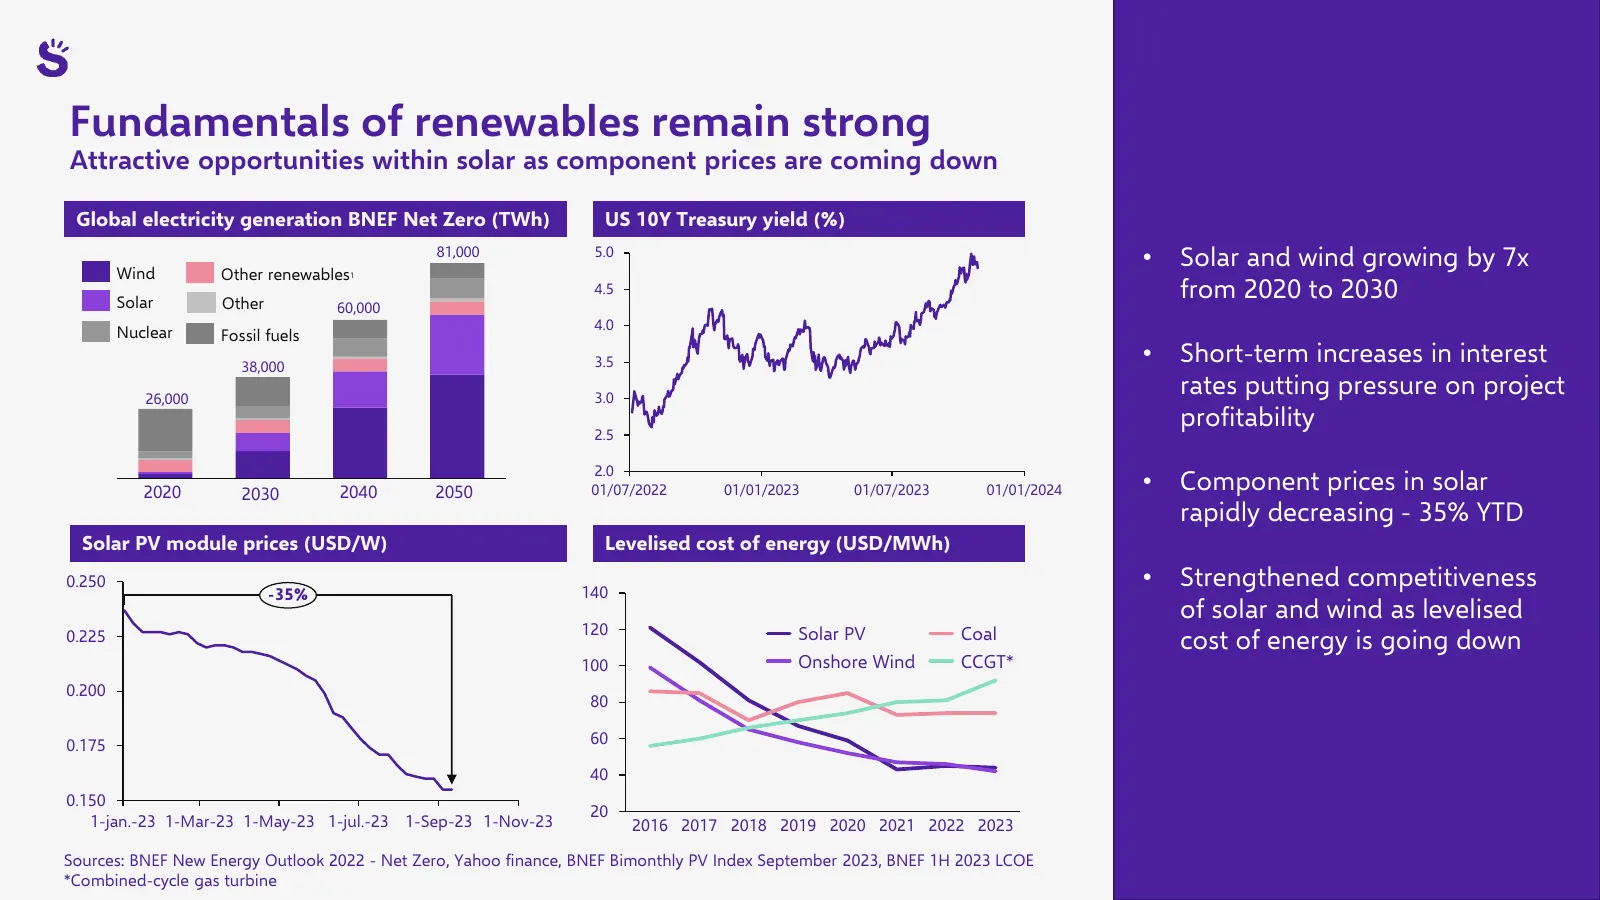
Fundamentals of renewables remain strong Attractive opportunities within solar as component prices are coming down Global electricity generation BNEF Net Zero (TWh) US 10Y Treasury yield (%) Wind 81,000 5.0 • Solar and wind growing by 7x Other renewables from 2020 to 2030 1 4.5 Solar Other 60,000 4.
Slide 5: Strong and predictable cash flow from operating assets
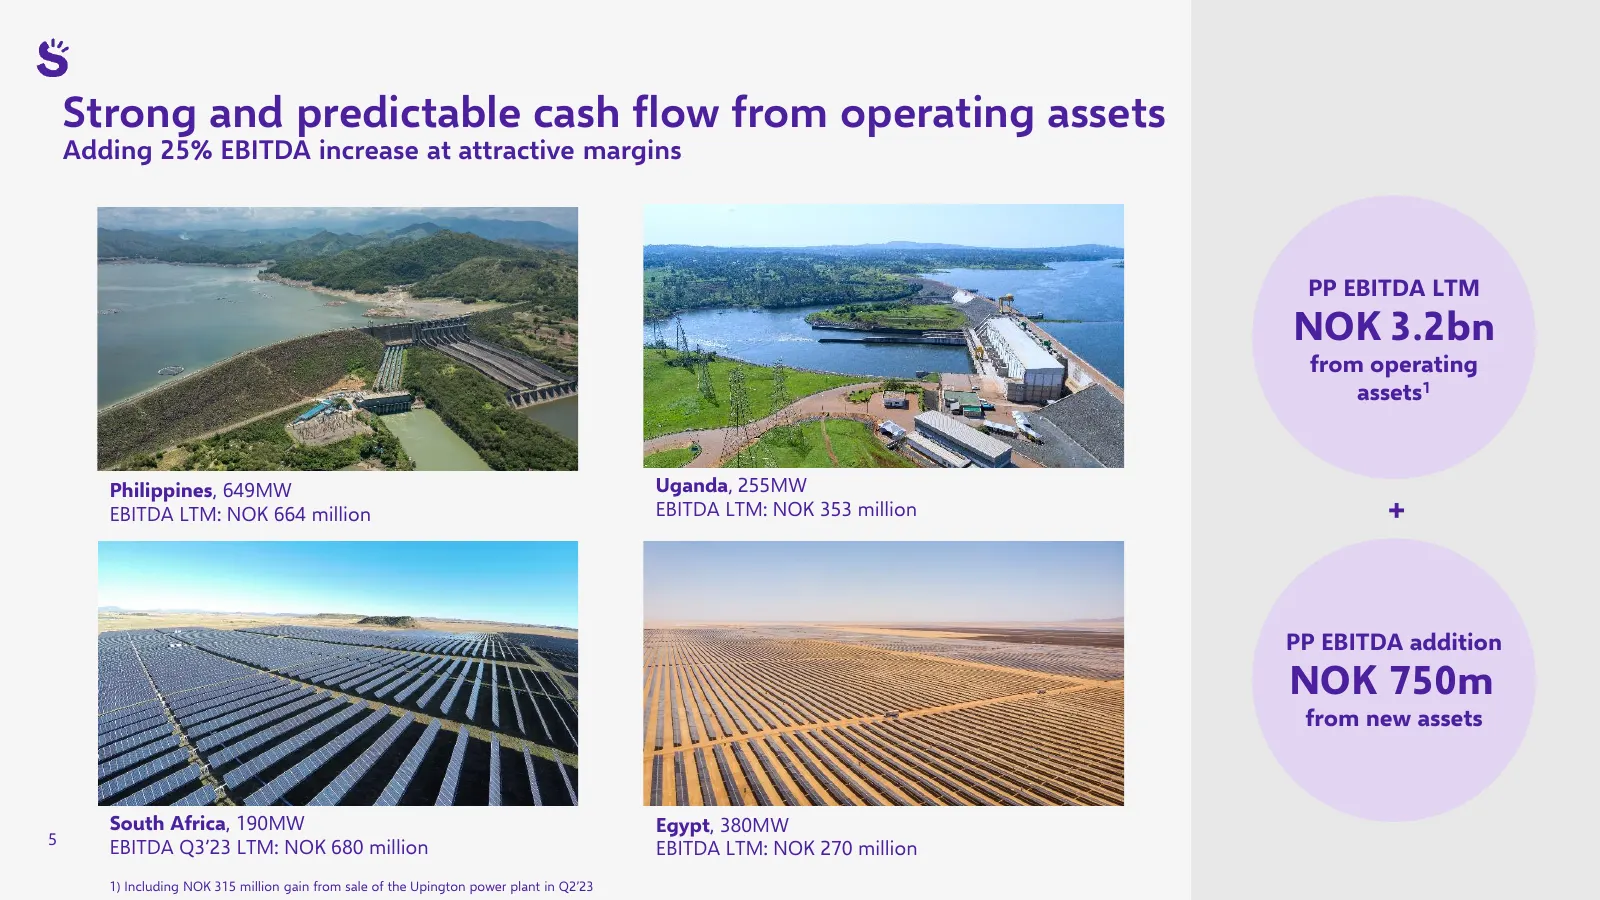
Strong and predictable cash flow from operating assets Adding 25% EBITDA increase at attractive margins PP EBITDA LTM NOK 3.2bn from operating assets1 Philippines, 649MW Uganda, 255MW EBITDA LTM: NOK 664 million EBITDA LTM: NOK 353 million + PP EBITDA addition NOK 750m from new assets South Africa,
Slide 6: Power Production: EBITDA of NOK 778 million
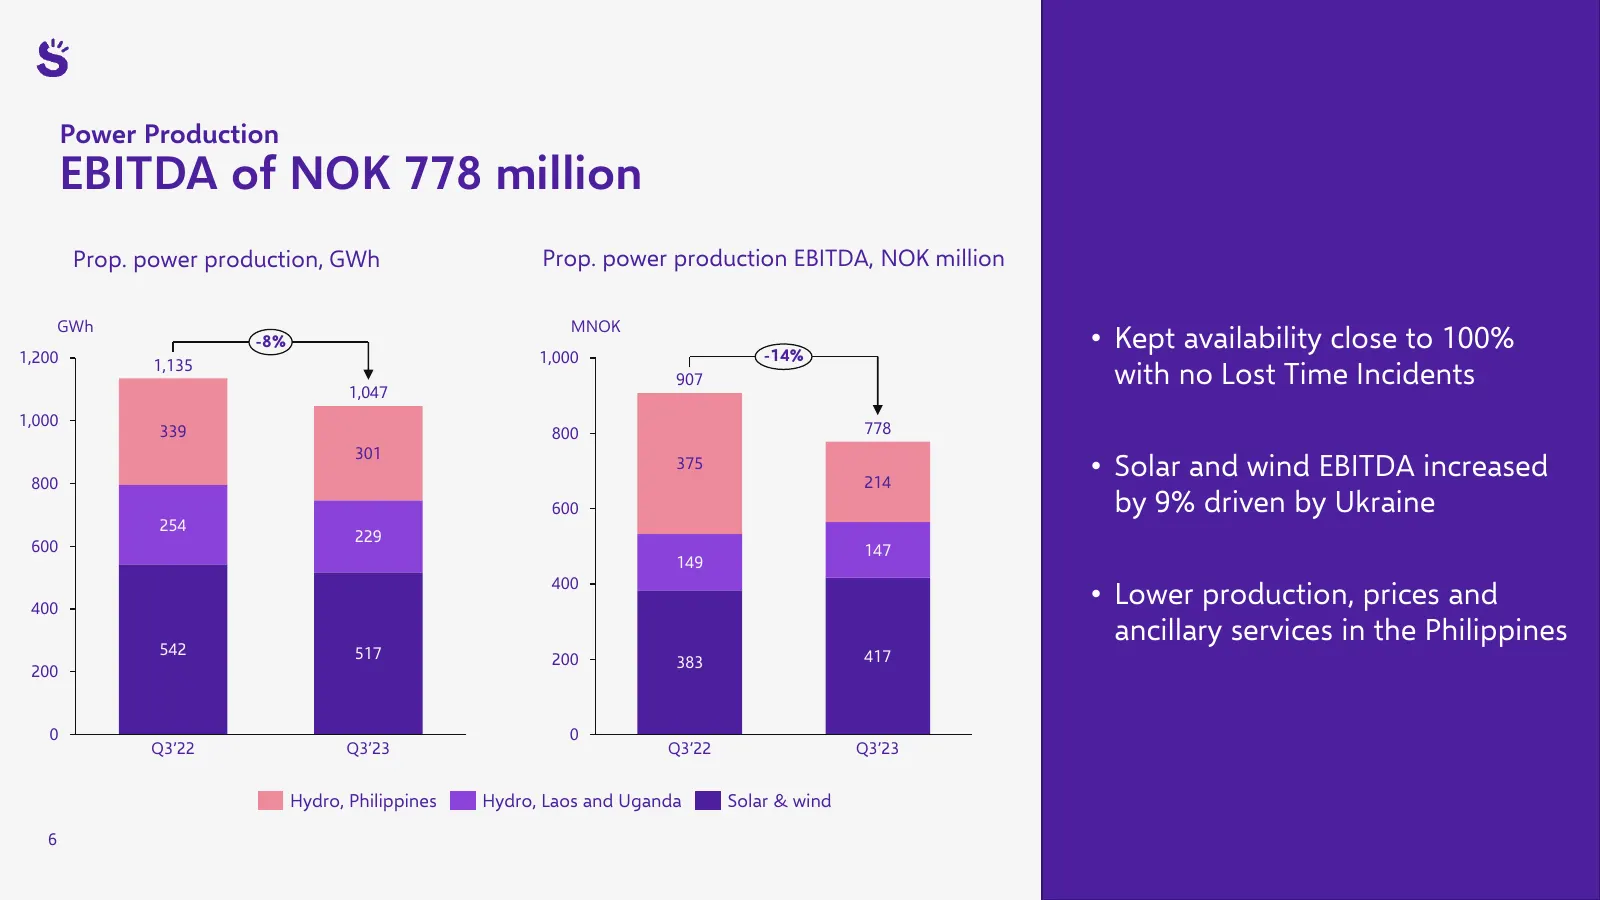
Power Production EBITDA of NOK 778 million Prop. power production, GWh Prop. power production EBITDA, NOK million GWh MNOK -8% -14% • Kept availability close to 100% 1,200 1,000 1,135 1,047 907 with no Lost Time Incidents 1,000 778 339 800 301 800 375 214 • Solar and wind EBITDA increased 600 by 9%
Slide 7: Philippines: 3Q'23 impacted by production, limited ancillary services and spot prices
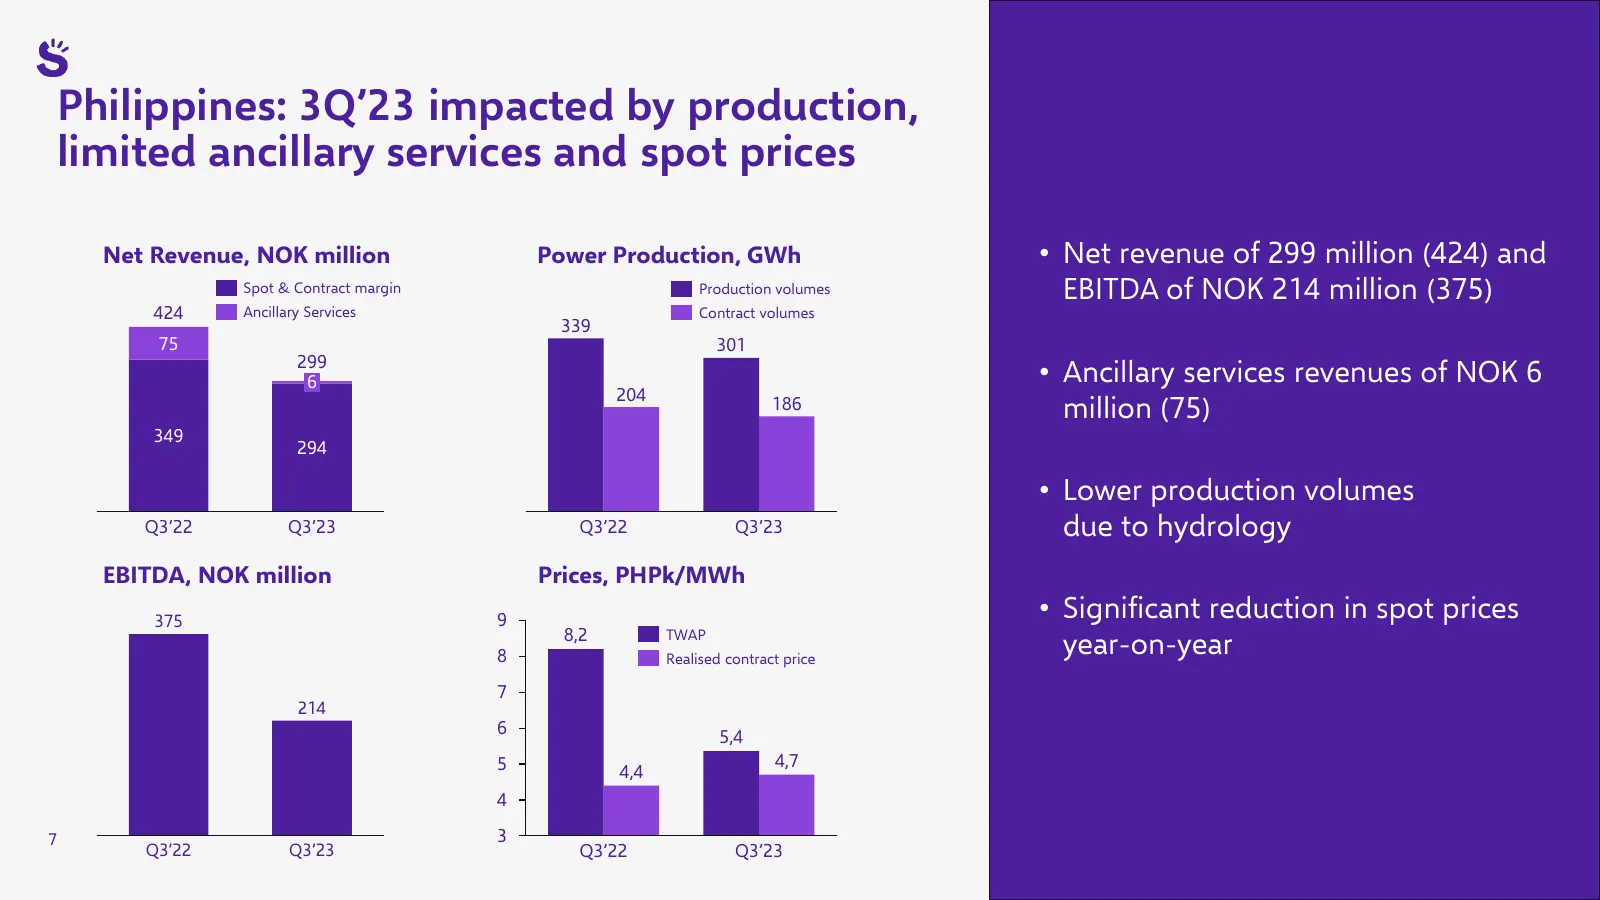
Philippines: 3Q’23 impacted by production, limited ancillary services and spot prices Net Revenue, NOK million Power Production, GWh • Net revenue of 299 million (424) and Spot & Contract margin Production volumes EBITDA of NOK 214 million (375) 424 Ancillary Services Contract volumes 339 75 301 299
Slide 8: High construction activity - preparing for commercial operations
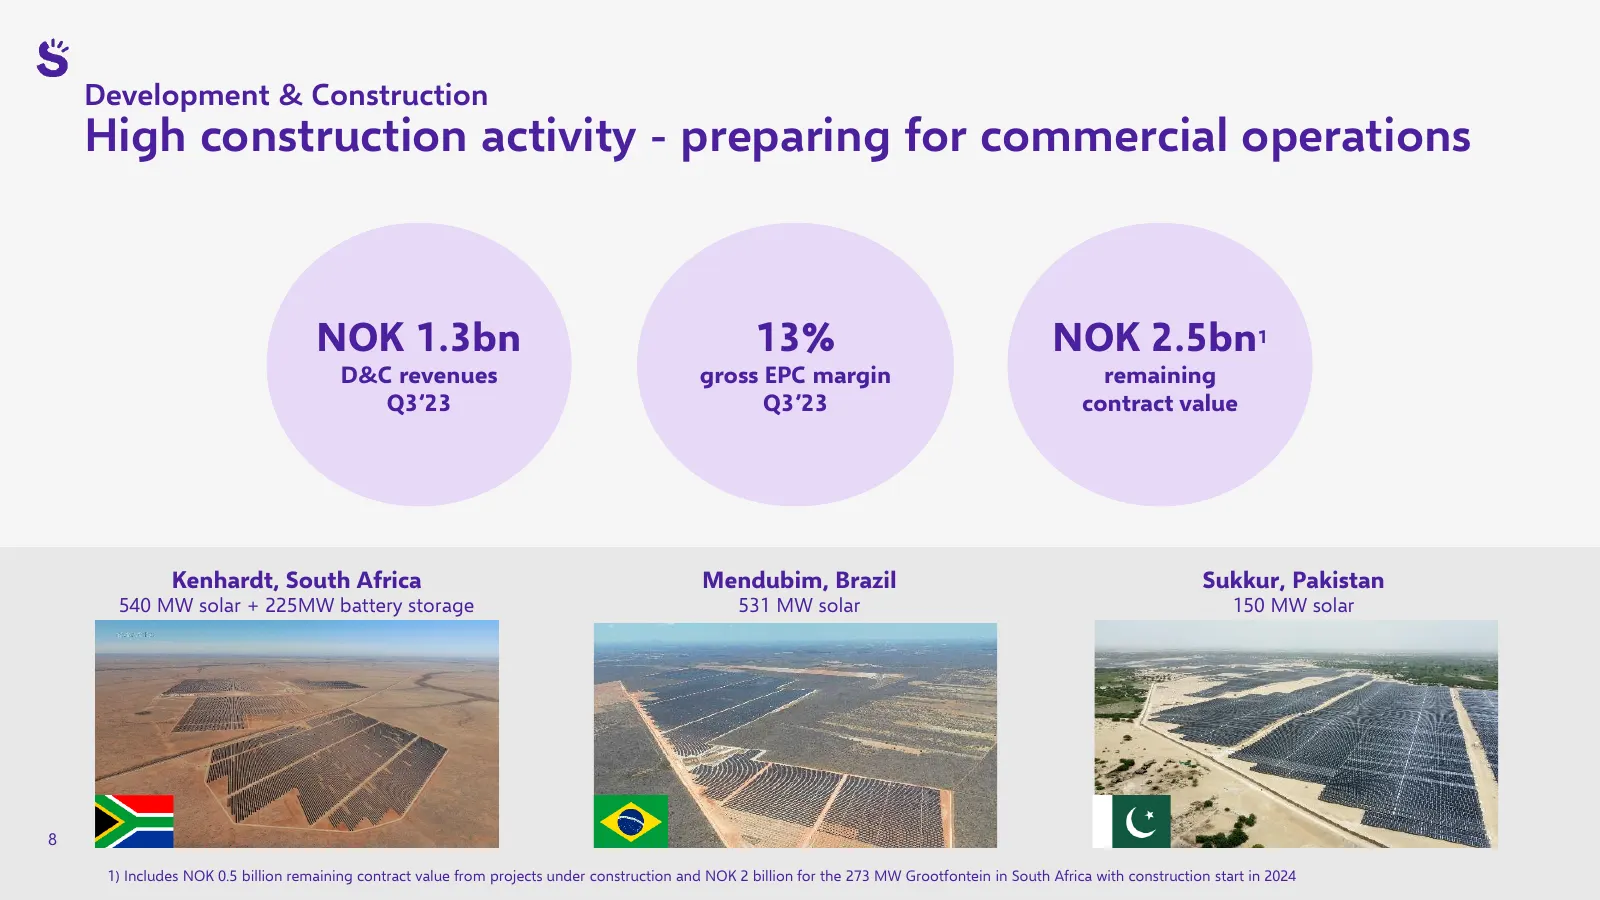
Development & Construction High construction activity - preparing for commercial operations NOK 1.3bn 13% NOK 2.5bn1 D&C revenues gross EPC margin remaining Q3’23 Q3’23 contract value Kenhardt, South Africa Mendubim, Brazil Sukkur, Pakistan 540 MW solar + 225MW battery storage 531 MW solar 150 MW so
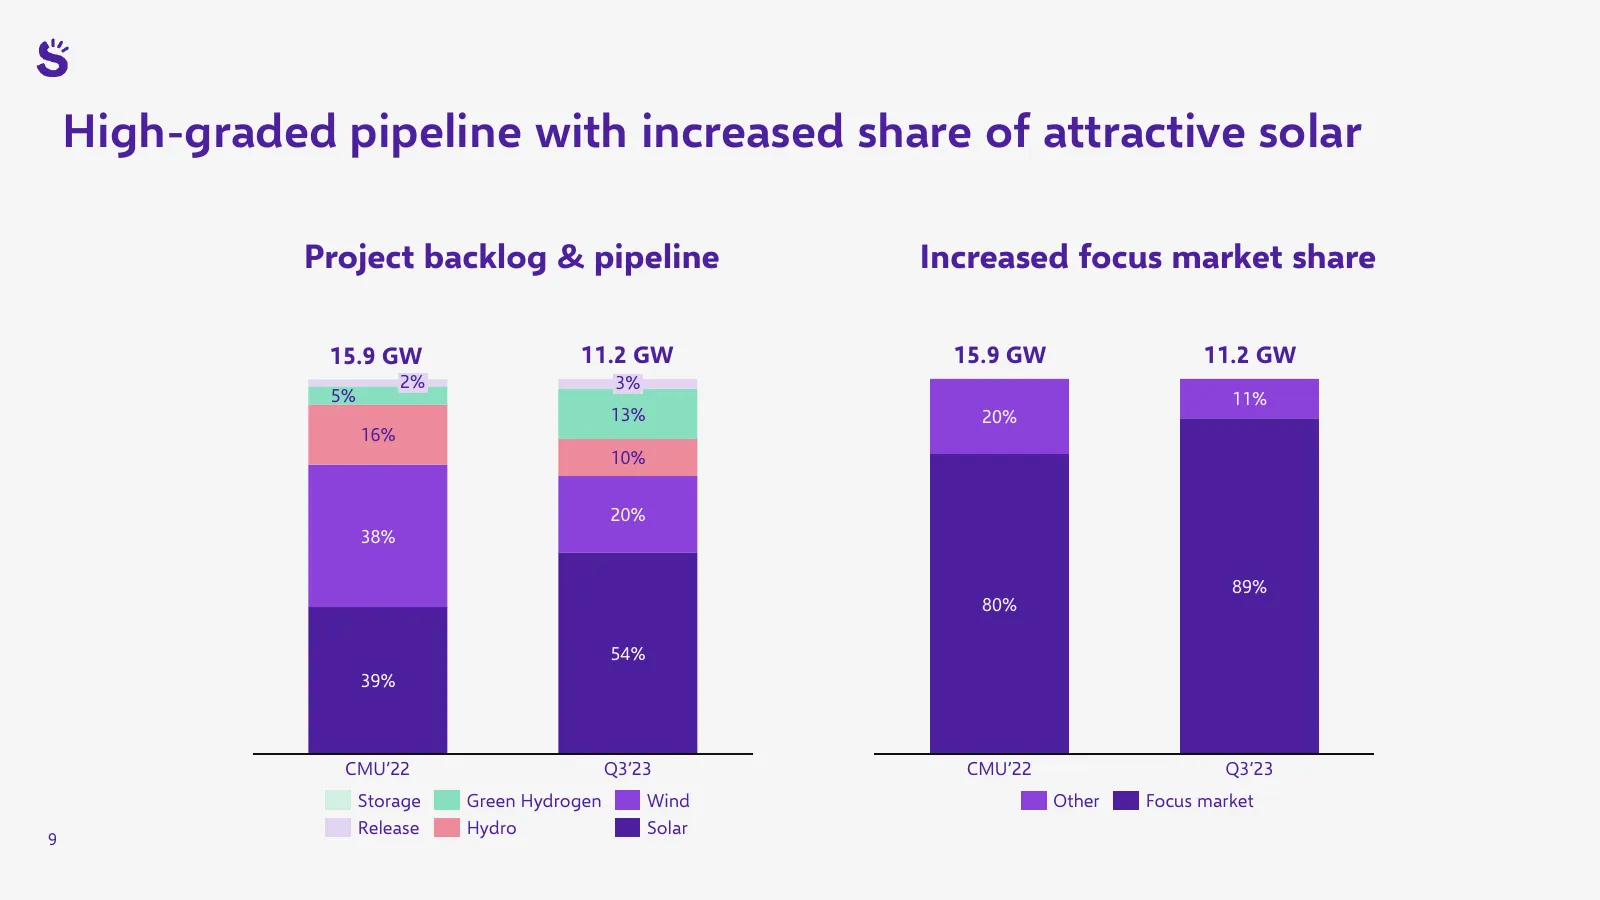
Slide 9: High-graded pipeline with increased share of attractive solar
High-graded pipeline with increased share of attractive solar Project backlog & pipeline Increased focus market share 15.9 GW 11.2 GW 15.9 GW 11.2 GW 2% 3% 5% 11% 13% 20% 16% 10% 20% 38% 89% 80% 54% 39% CMU’22 Q3’23 CMU’22 Q3’23 Storage Green Hydrogen Wind Other Focus market Release Hydro Solar 9
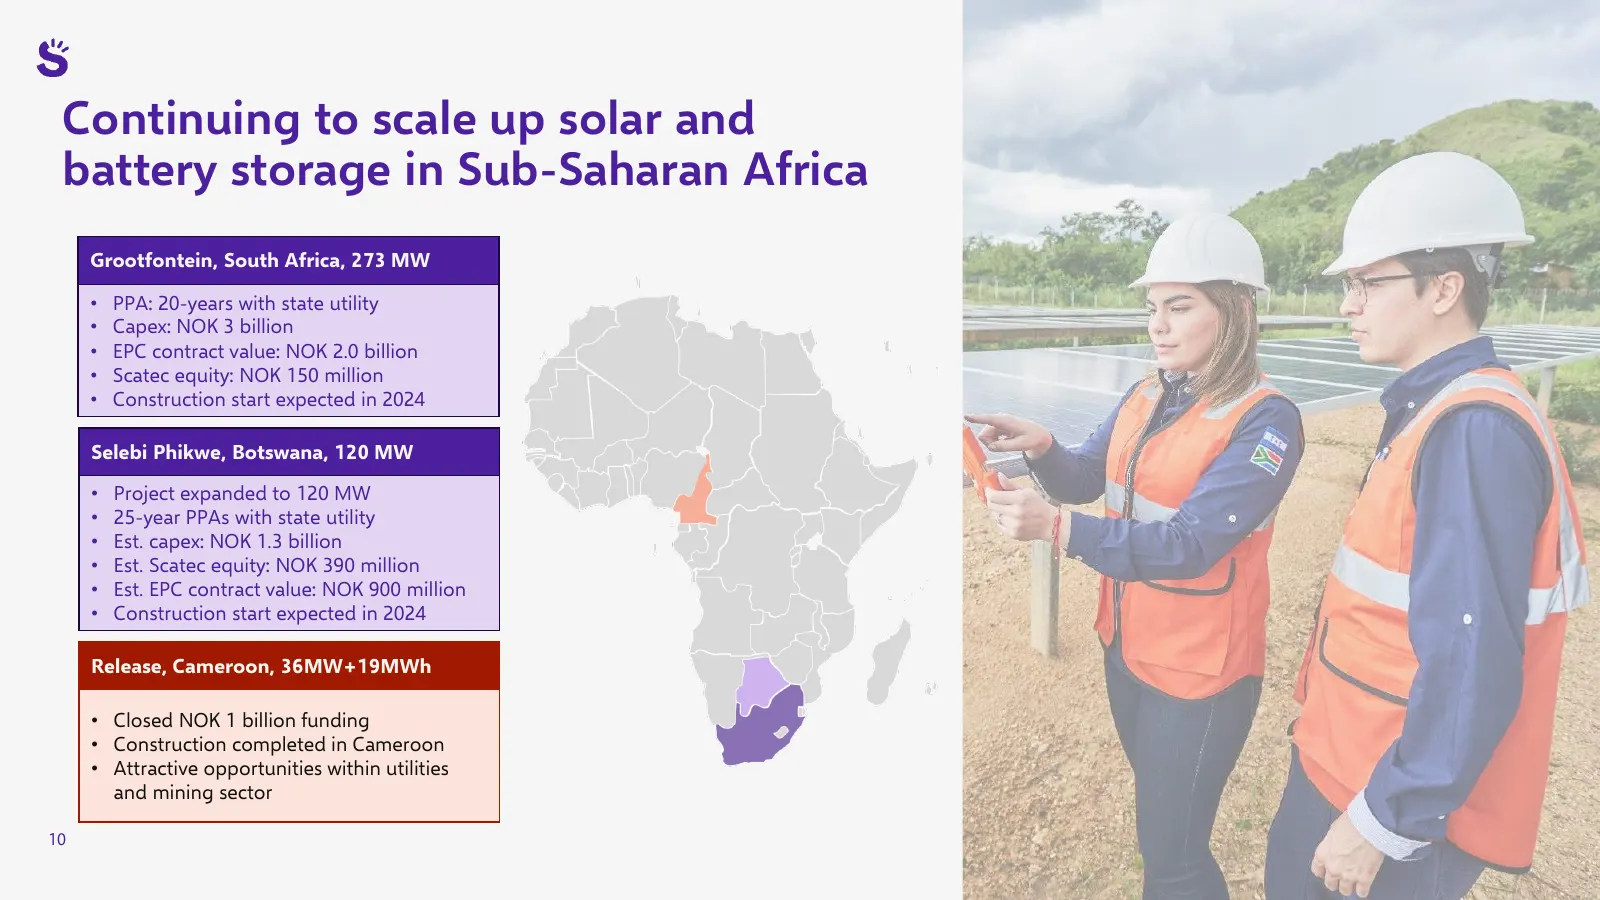
Slide 10: Continuing to scale up solar and battery storage in Sub-Saharan Africa
Continuing to scale up solar and battery storage in Sub-Saharan Africa Grootfontein, South Africa, 273 MW • PPA: 20-years with state utility • Capex: NOK 3 billion • EPC contract value: NOK 2.0 billion • Scatec equity: NOK 150 million • Construction start expected in 2024 Selebi Phikwe, Botswana, 12

Slide 11: Financial review
Financial review Hans Jakob Hegge, CFO
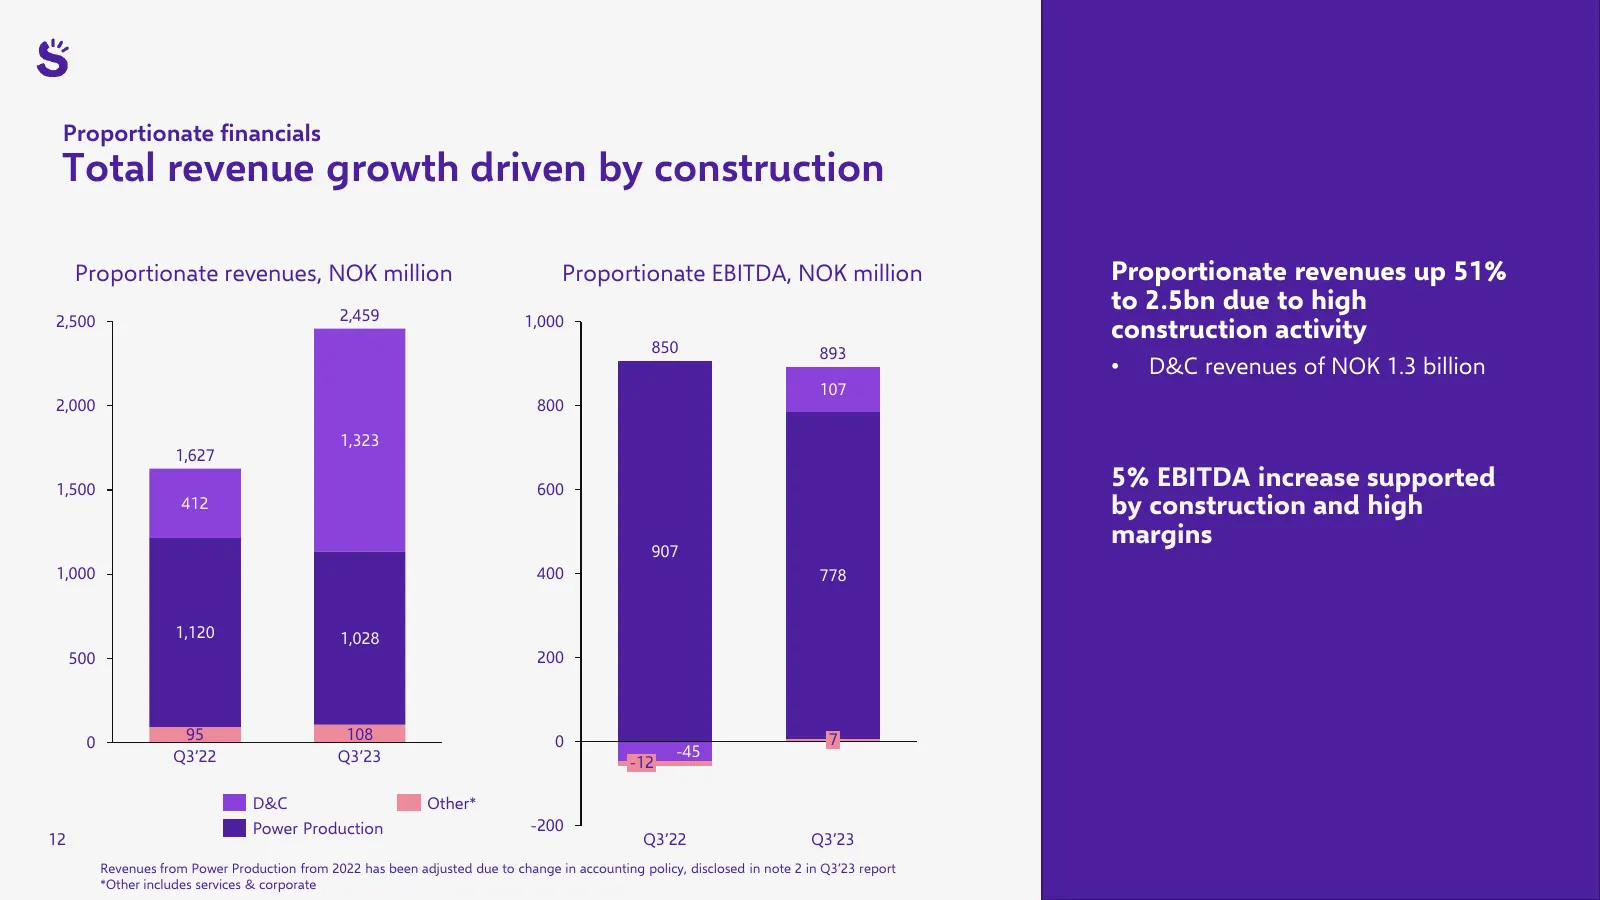
Slide 12: Total revenue growth driven by construction
Proportionate financials Total revenue growth driven by construction Proportionate revenues, NOK million Proportionate EBITDA, NOK million Proportionate revenues up 51% 2,459 to 2.5bn due to high 2,500 1,000 construction activity 850 893 • D&C revenues of NOK 1.3 billion 107 2,000 800 1,323 1,627 1,
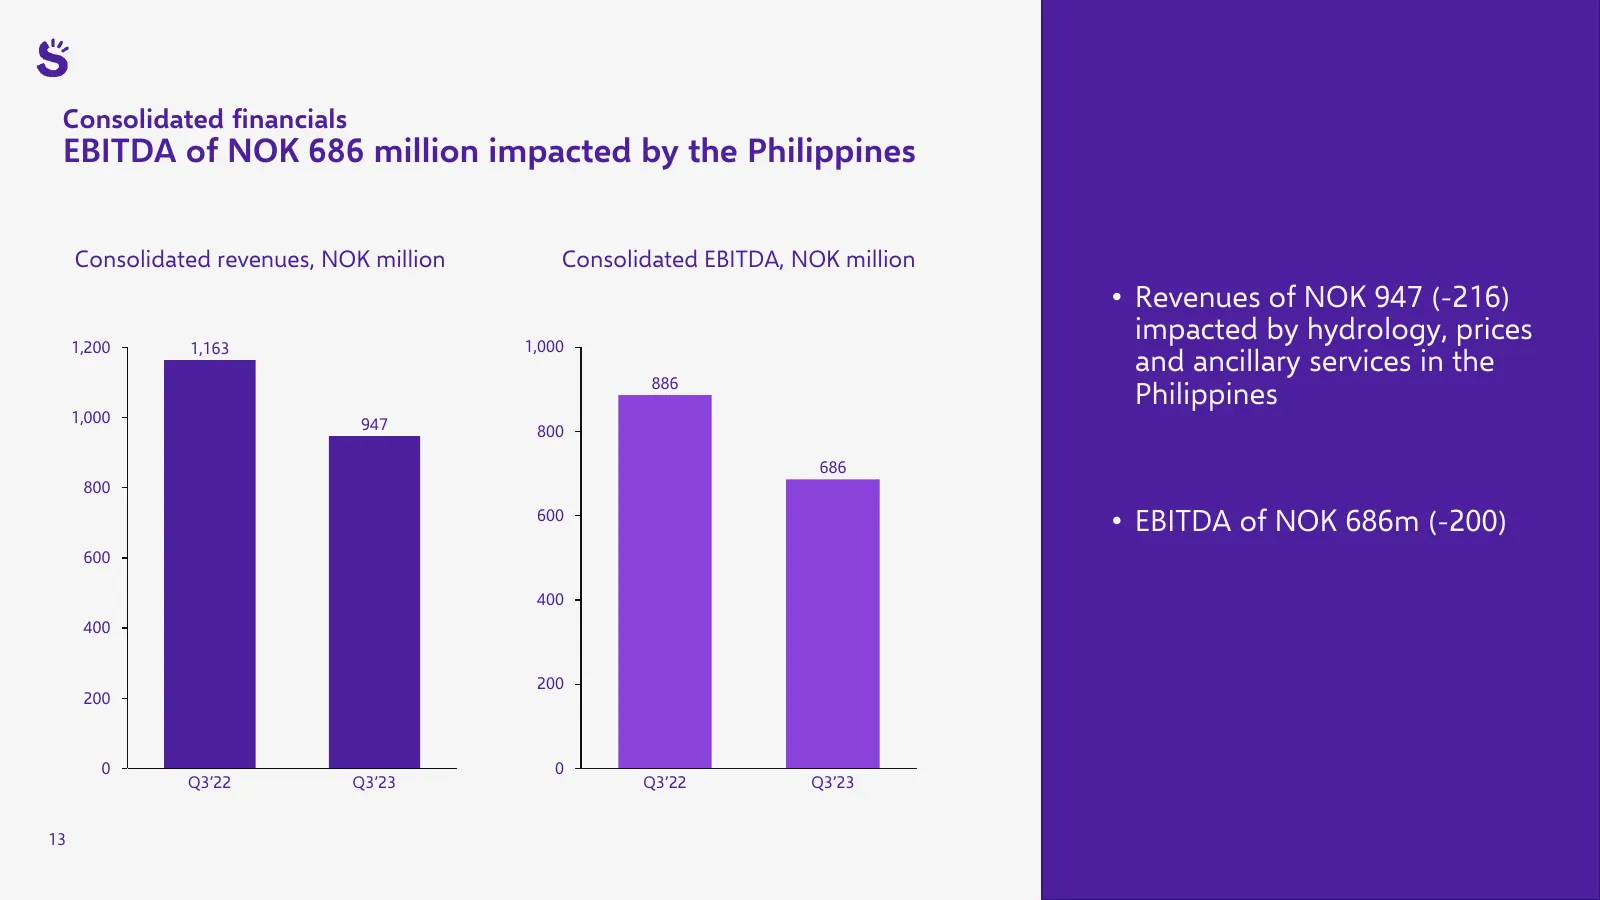
Slide 13: EBITDA of NOK 686 million impacted by the Philippines
Consolidated financials EBITDA of NOK 686 million impacted by the Philippines Consolidated revenues, NOK million Consolidated EBITDA, NOK million • Revenues of NOK 947 (-216) 1,200 1,000 impacted by hydrology, prices 1,163 and ancillary services in the 886 Philippines 1,000 947 800 686 800 600 • EBI
Slide 14: Net debt unchanged in the quarter
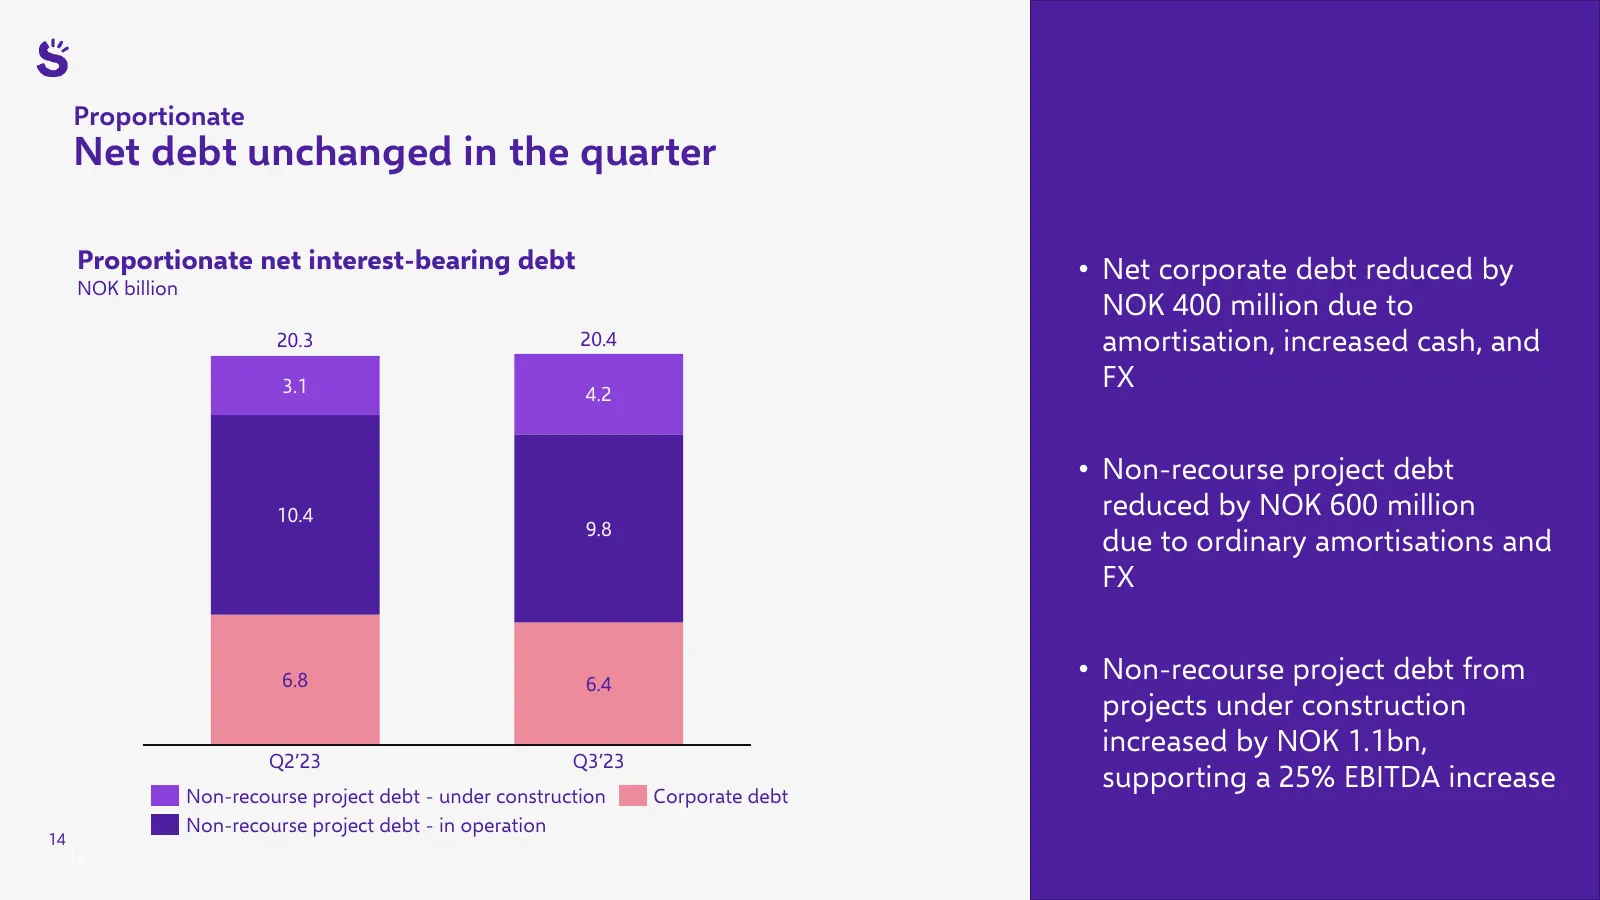
Proportionate Net debt unchanged in the quarter Proportionate net interest-bearing debt • Net corporate debt reduced by NOK billion NOK 400 million due to 20.3 20.4 amortisation, increased cash, and 3.1 4.2 FX • Non-recourse project debt 10.4 reduced by NOK 600 million 9.8 due to ordinary amortisati
Slide 15: Increased liquidity to NOK 3.9 billion
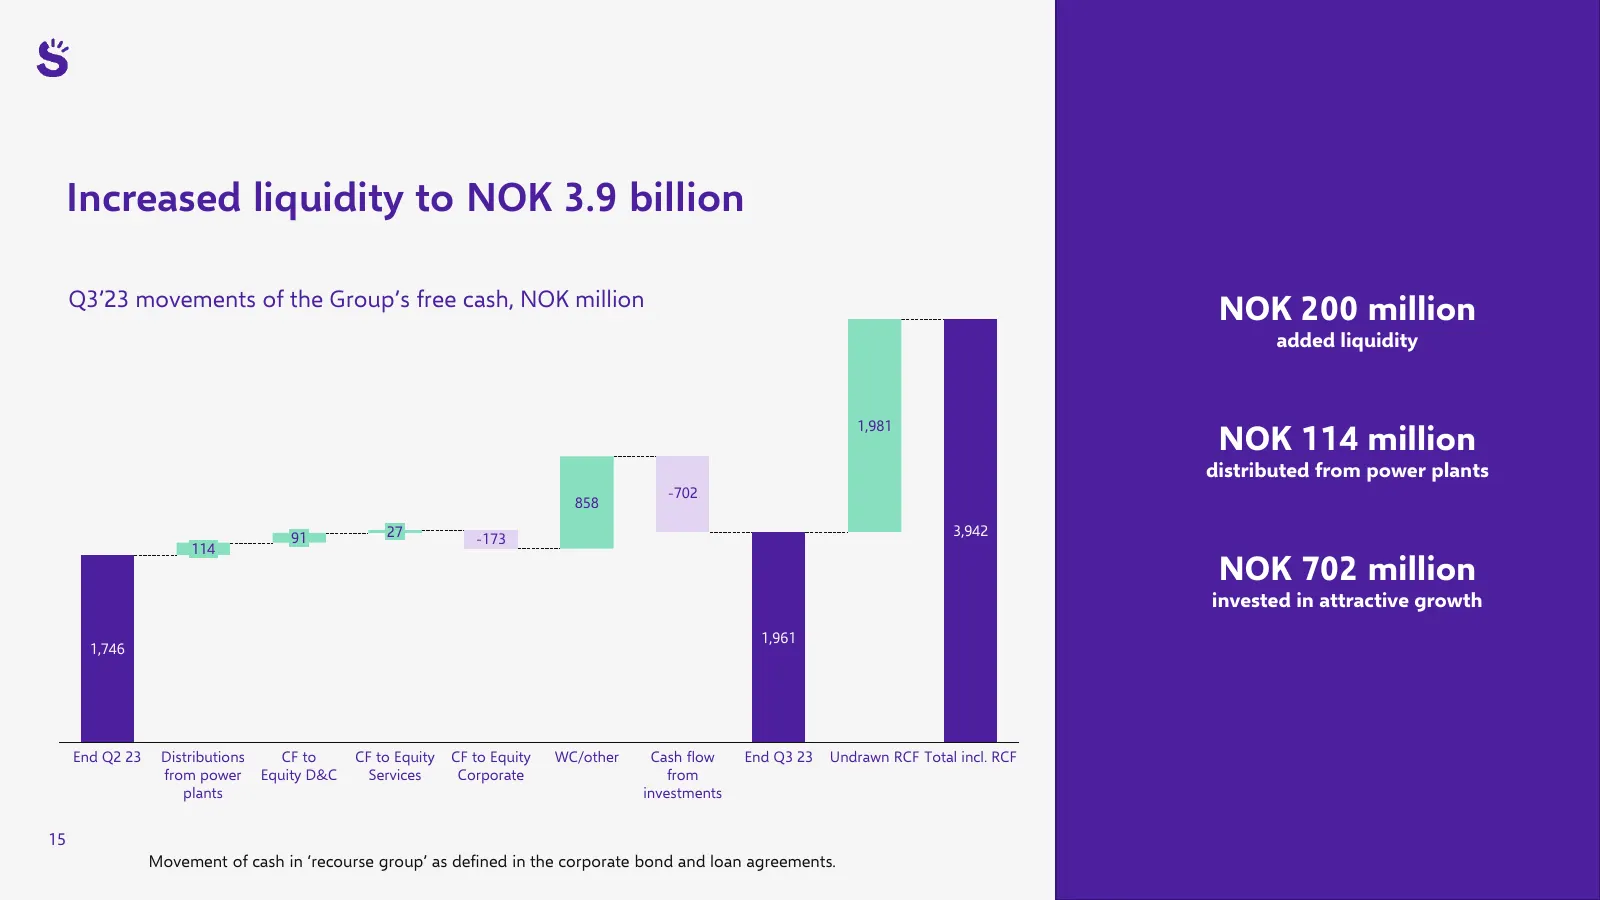
Increased liquidity to NOK 3.9 billion Q3’23 movements of the Group’s free cash, NOK million NOK 200 million added liquidity NOK 114 million 1,981 distributed from power plants -702 858 91 27 3,942 -173 114 NOK 702 million invested in attractive growth 1,961 1,746 End Q2 23 Distributions CF to CF to
Slide 16: Outlook
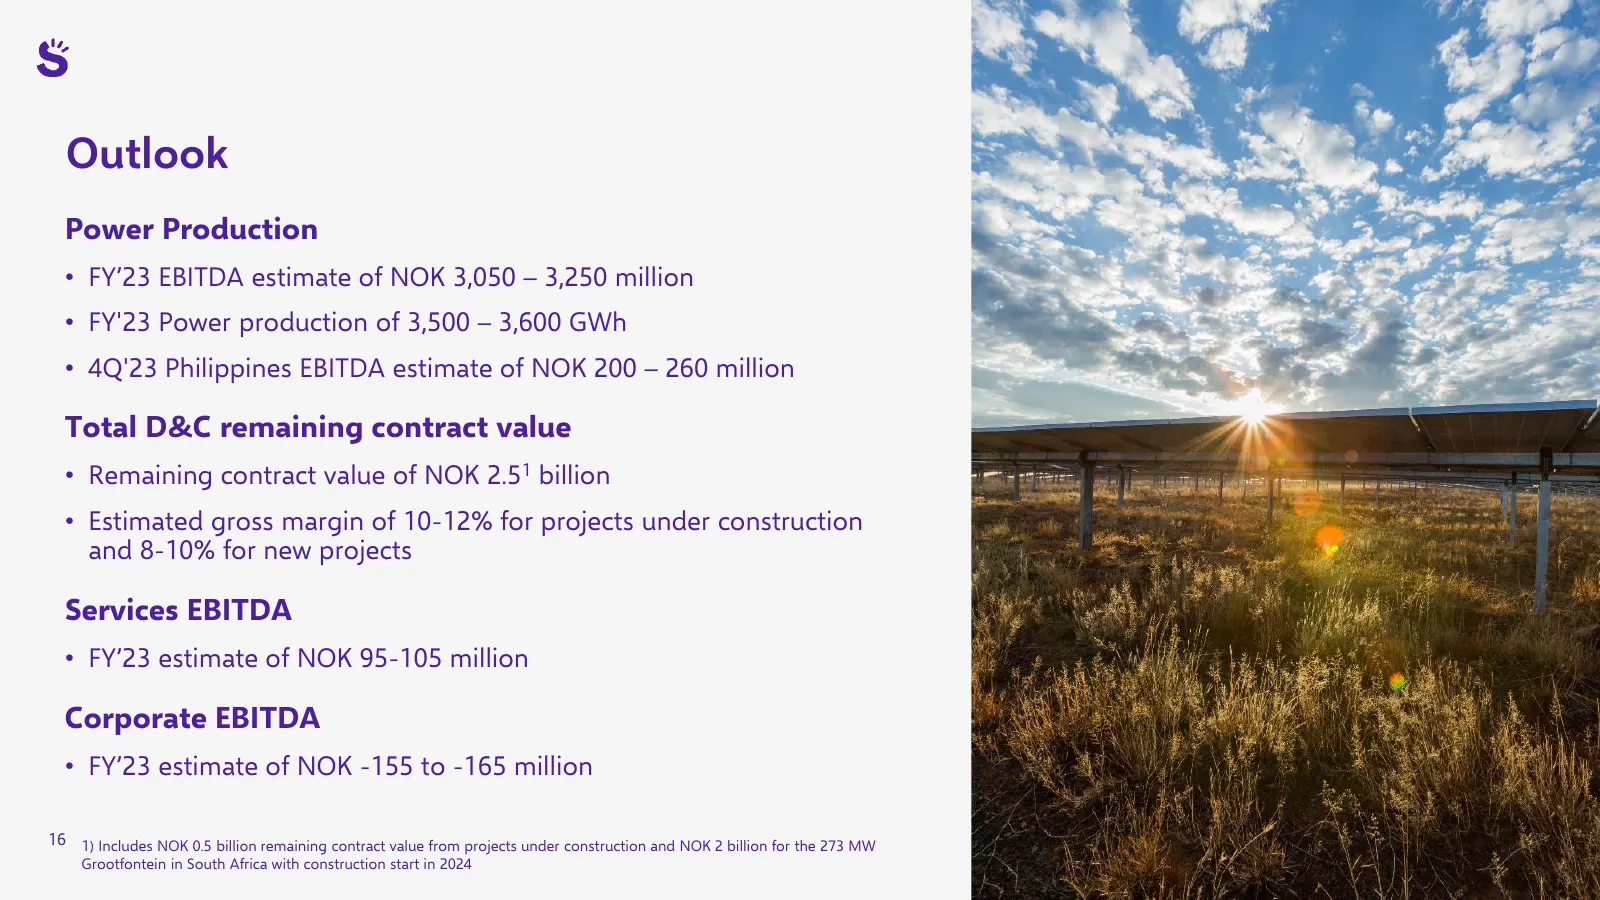
Outlook Power Production • FY’23 EBITDA estimate of NOK 3,050 – 3,250 million • FY'23 Power production of 3,500 – 3,600 GWh • 4Q'23 Philippines EBITDA estimate of NOK 200 – 260 million Total D&C remaining contract value • Remaining contract value of NOK 2.51 billion • Estimated gross margin of 10-12

Slide 17: Strategy update: Focus and discipline
Strategy update: Focus and discipline 17
Slide 18: Delivering attractive growth and recycling of capital
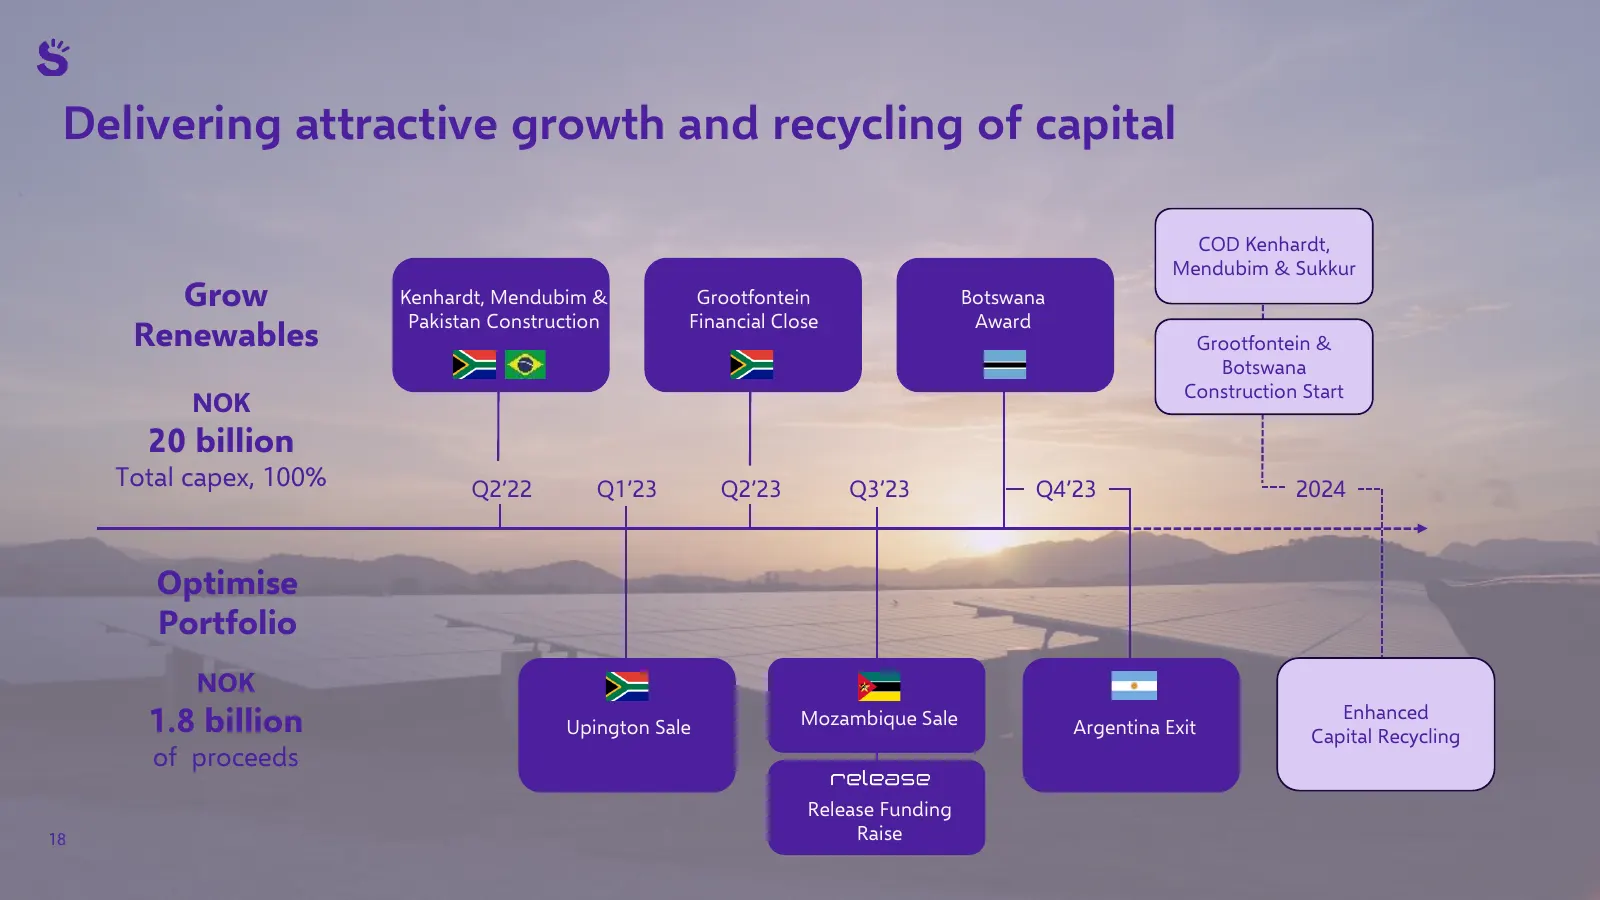
Delivering attractive growth and recycling of capital COD Kenhardt, Mendubim & Sukkur Grow Kenhardt, Mendubim & Grootfontein Botswana Pakistan Construction Financial Close Award Renewables Grootfontein & Botswana Construction Start NOK 20 billion Total capex, 100% Q2’22 Q1’23 Q2’23 Q3’23 Q4’23 2024
Slide 19: Building on our strengths
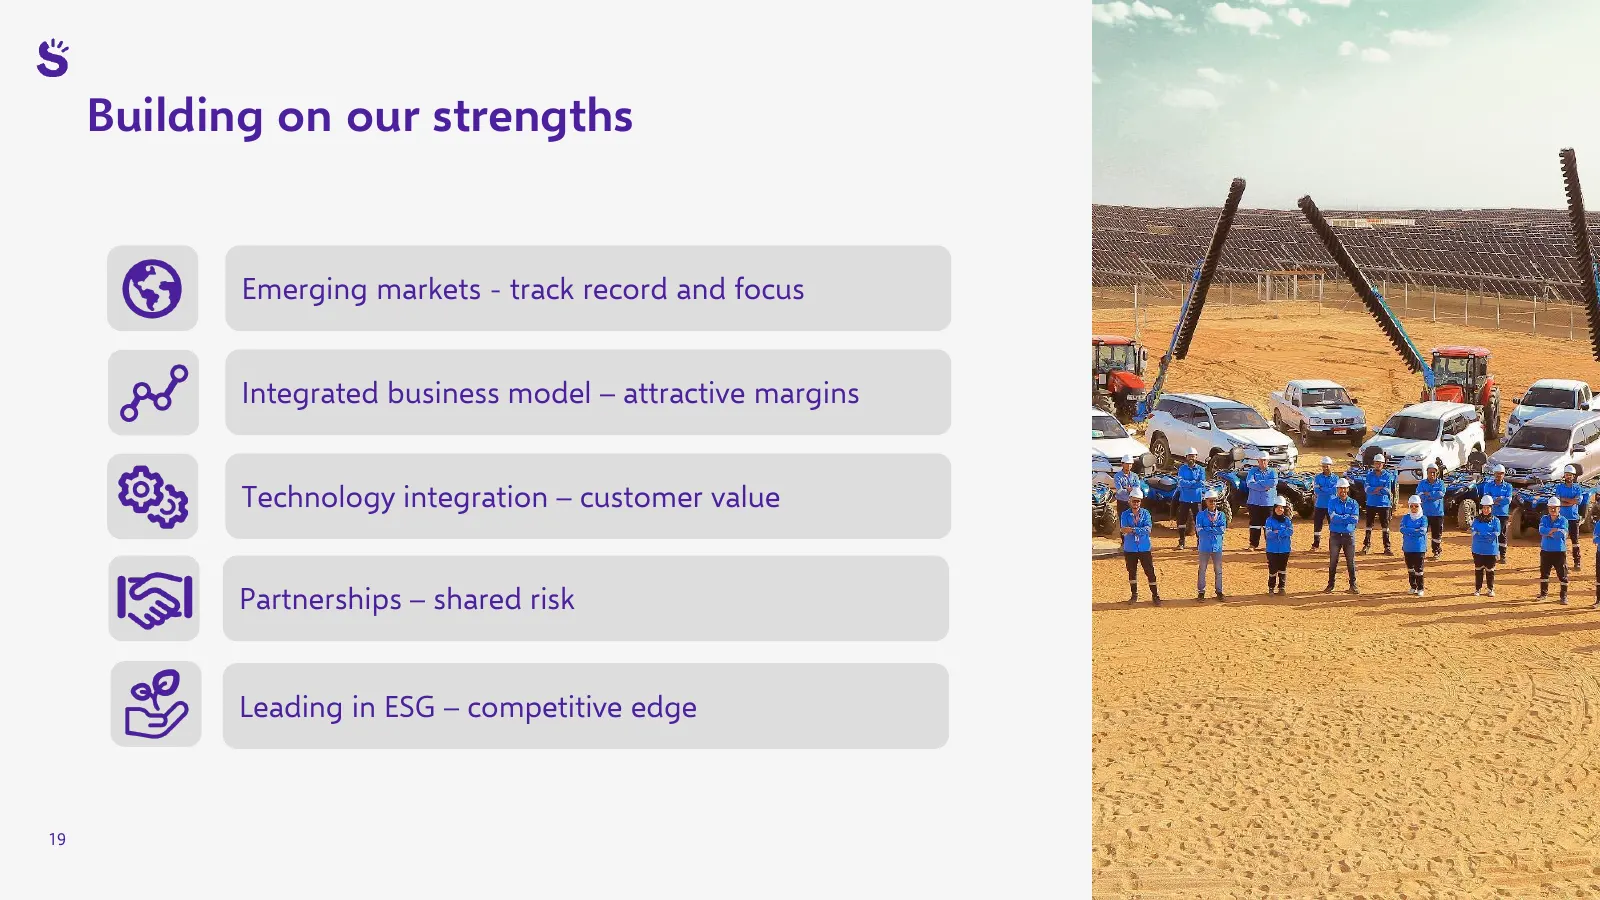
Building on our strengths Emerging markets - track record and focus Integrated business model – attractive margins Technology integration – customer value Partnerships – shared risk Leading in ESG – competitive edge 19
Slide 20: Our strategy remains: develop, build, own and operate renewables
Our strategy remains: Develop, build, own and operate renewable energy in emerging markets Grow Optimise Renewables Portfolio • Increased focus on solar, onshore wind & batteries • Enhanced focus on capital recycling • Selective growth• within Ba green hydrogen and hydro • Capital discipline and del
Slide 21: Aligning growth rate to internal funding capacity
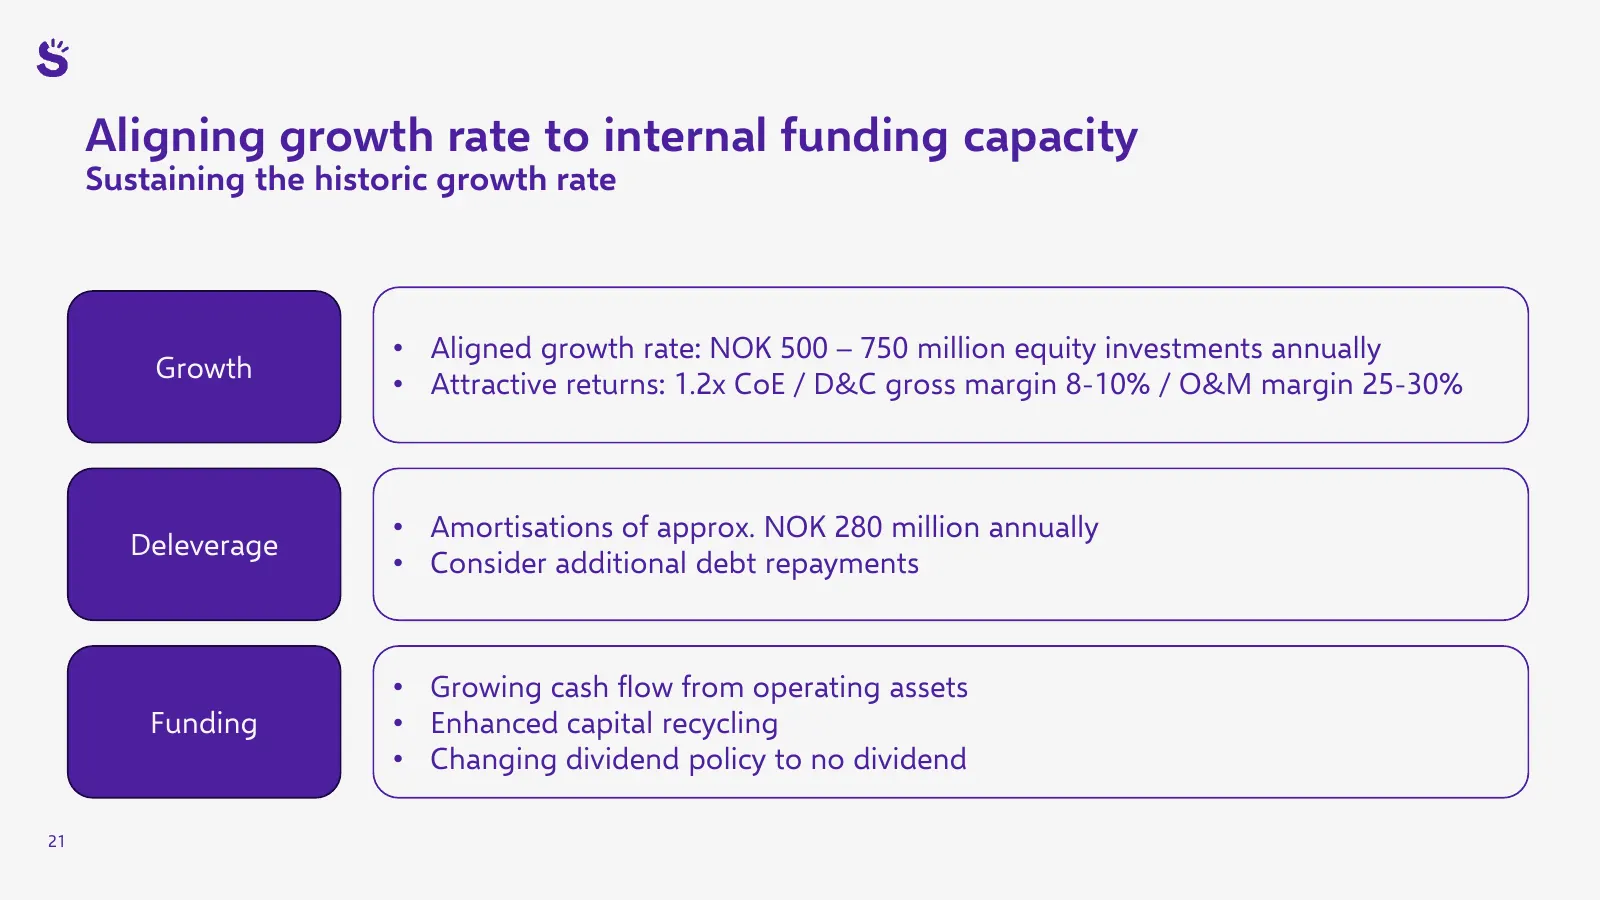
Aligning growth rate to internal funding capacity Sustaining the historic growth rate • Aligned growth rate: NOK 500 – 750 million equity investments annually Growth • Attractive returns: 1.2x CoE / D&C gross margin 8-10% / O&M margin 25-30% • Amortisations of approx. NOK 280 million annually Deleve
Slide 22: Summary
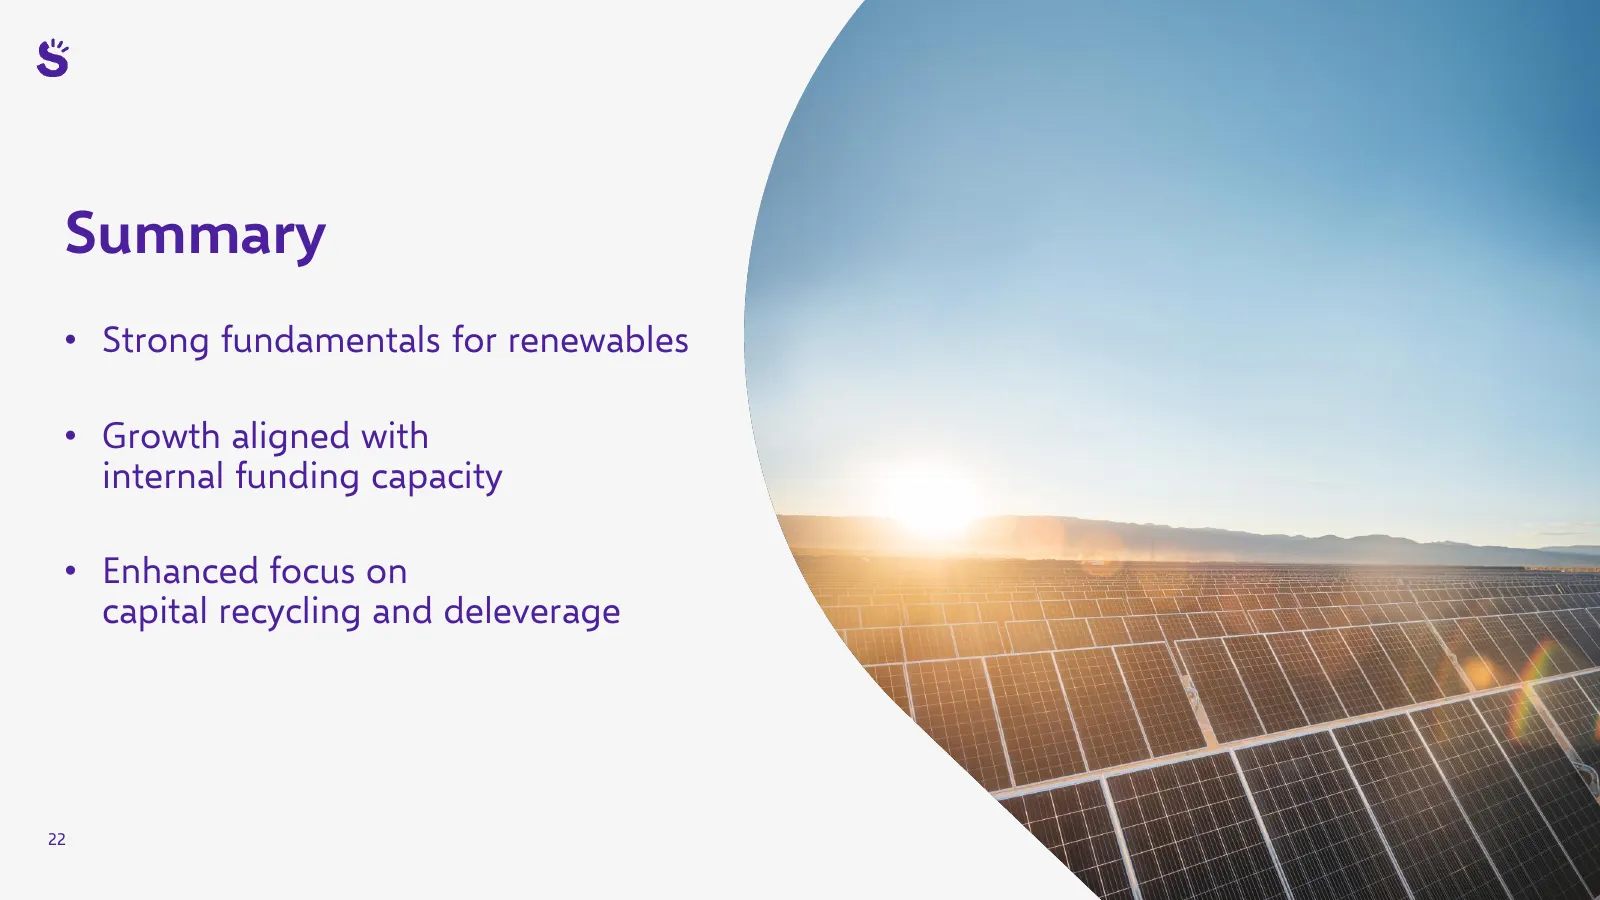
Summary • Strong fundamentals for renewables • Growth aligned with internal funding capacity • Enhanced focus on capital recycling and deleverage 22
Slide 23: Scatec
Scatec
Slide 24: Overview of change in proportionate net debt during the quarter
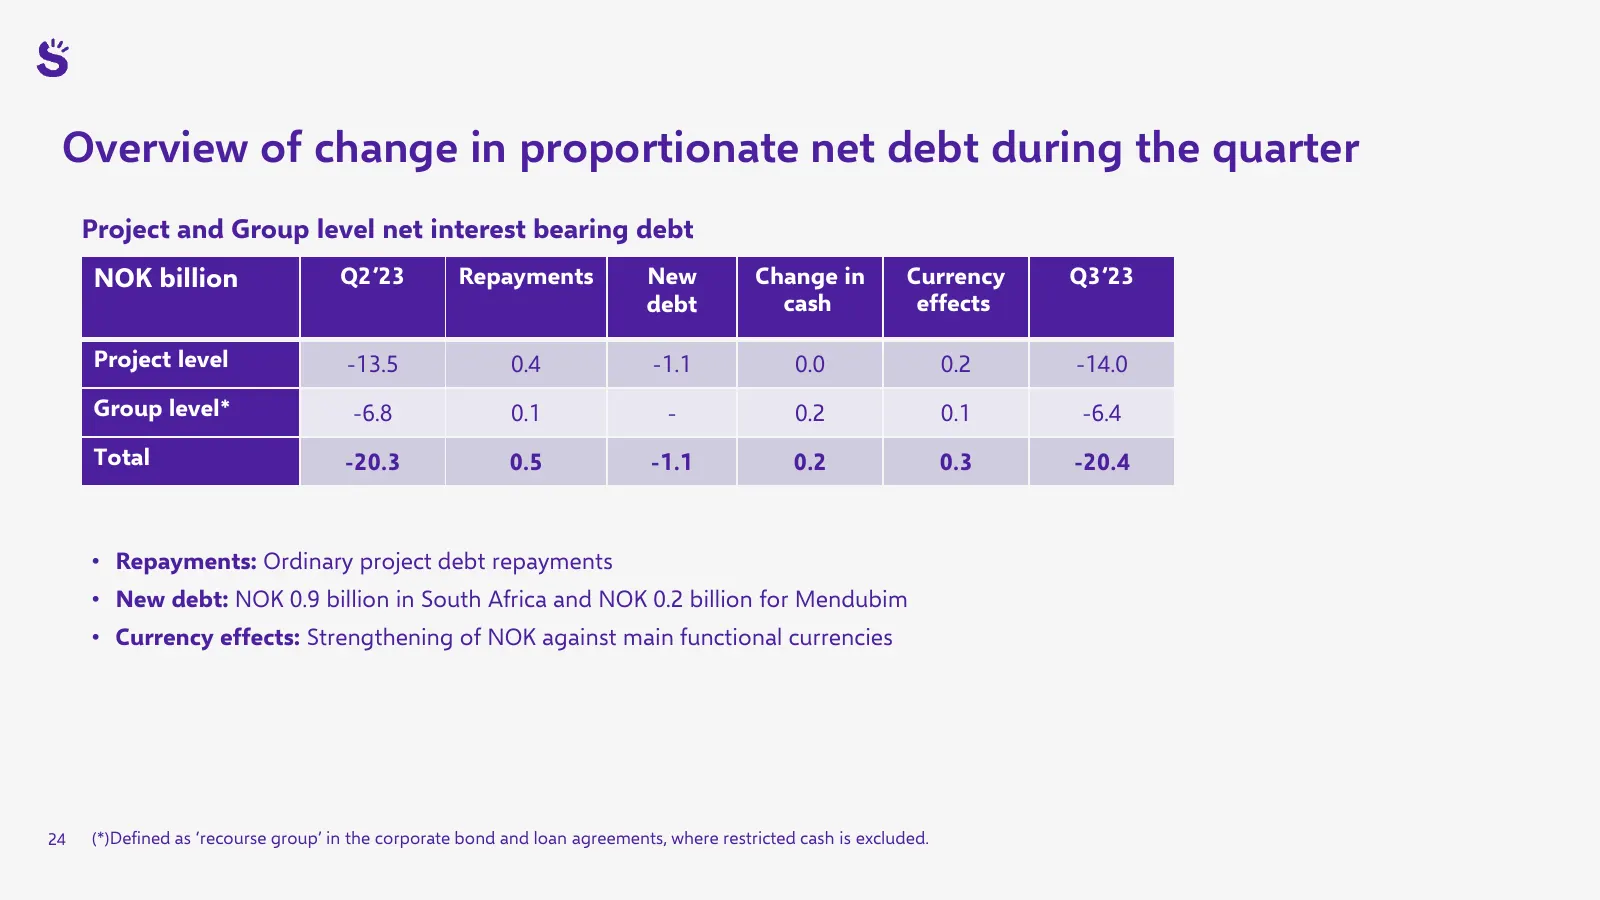
Overview of change in proportionate net debt during the quarter Project and Group level net interest bearing debt NOK billion Q2’23 Repayments New Change in Currency Q3’23 debt cash effects Project level -13.5 0.4 -1.1 0.0 0.2 -14.0 Group level* -6.8 0.1 - 0.2 0.1 -6.4 Total -20.3 0.5 -1.1 0.2 0.3 -
Slide 25: Our asset portfolio
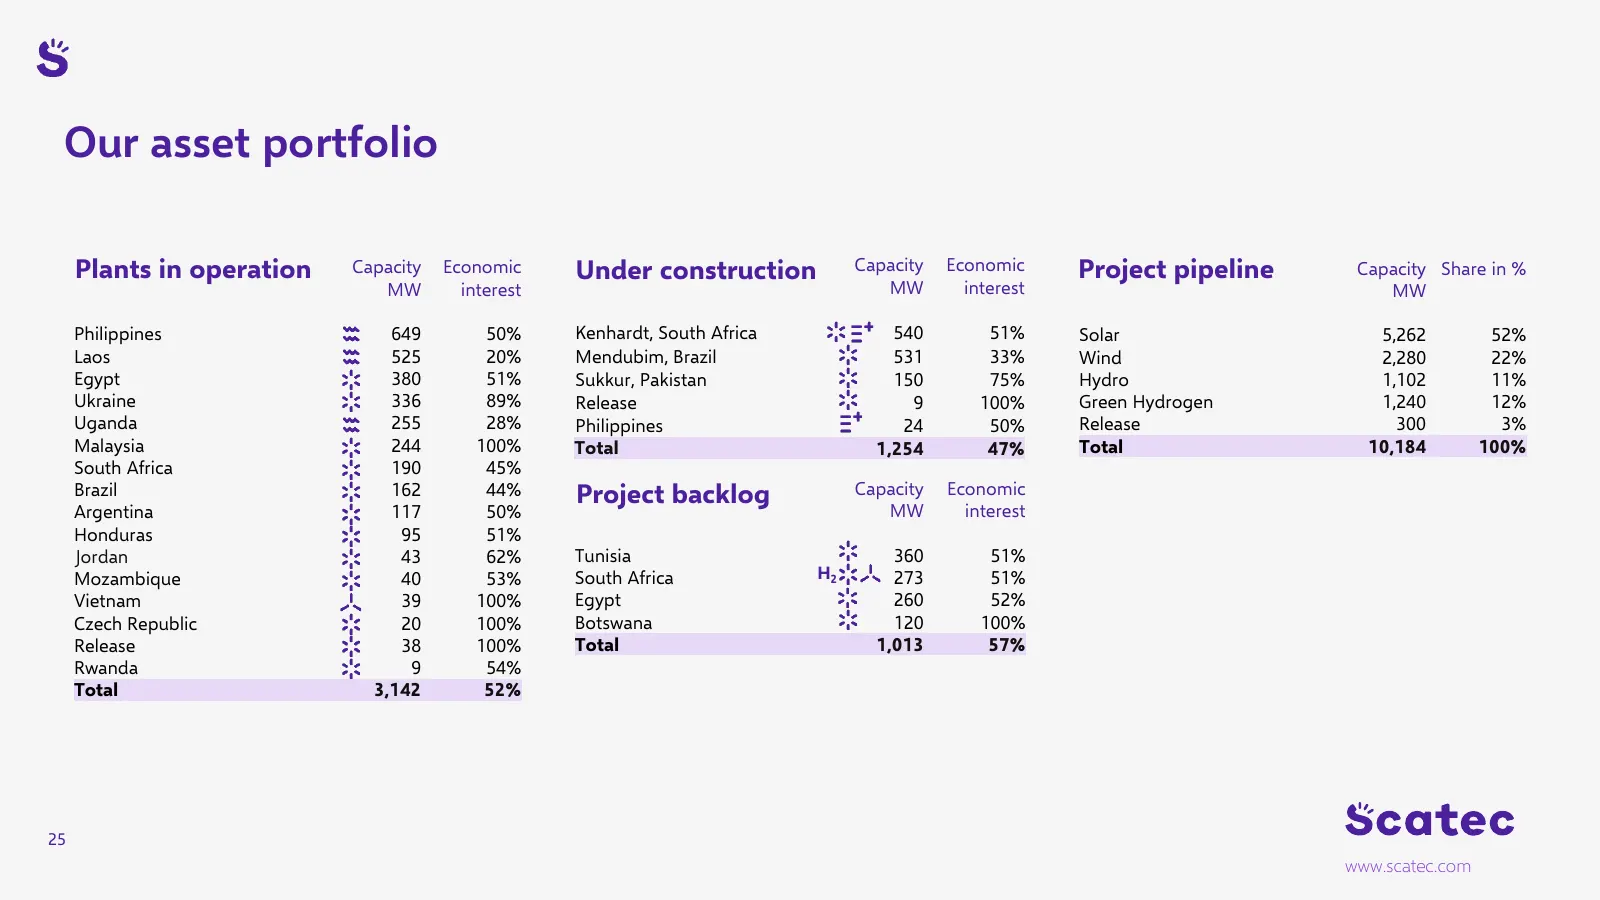
Our asset portfolio Plants in operation Capacity Economic Under construction Capacity Economic Project pipeline Capacity Share in % MW interest MW interest MW Philippines 649 50% Kenhardt, South Africa 540 51% Solar 5,262 52% Laos 525 20% Mendubim, Brazil 531 33% Wind 2,280 22% Egypt 380 51% Sukkur,
Source: Internet Archive copy of scatec.com
More decks from Scatec ASA
 Q3 2026 Earnings Presentation32 slides · Oct 30, 2026
 Q2 2026 Earnings Presentation23 slides · Aug 21, 2026
 Investor Presentation (August 2026)22 slides · August 2026
 Q1 2026 Earnings Presentation23 slides · May 6, 2026
 Investor Presentation (March 2026)22 slides · March 2026
 Q4 2025 Earnings Presentation24 slides · Jan 30, 2026