Cresud SA · BCBA:CRES
Cresud SA — Cresud S.A.C.I.F. y A. — Q1 2027 Earnings Presentation
17 slides from Cresud SA's earnings presentation, Nov 13, 2026
Slide 1: IQ 2027 Conference Call
IQ 2027 Hosted by: Conference Call Alejandro Elsztain, CEO Matias Gaivironsky, CFO November 13, 2026 Maximizing Agricultural Potential
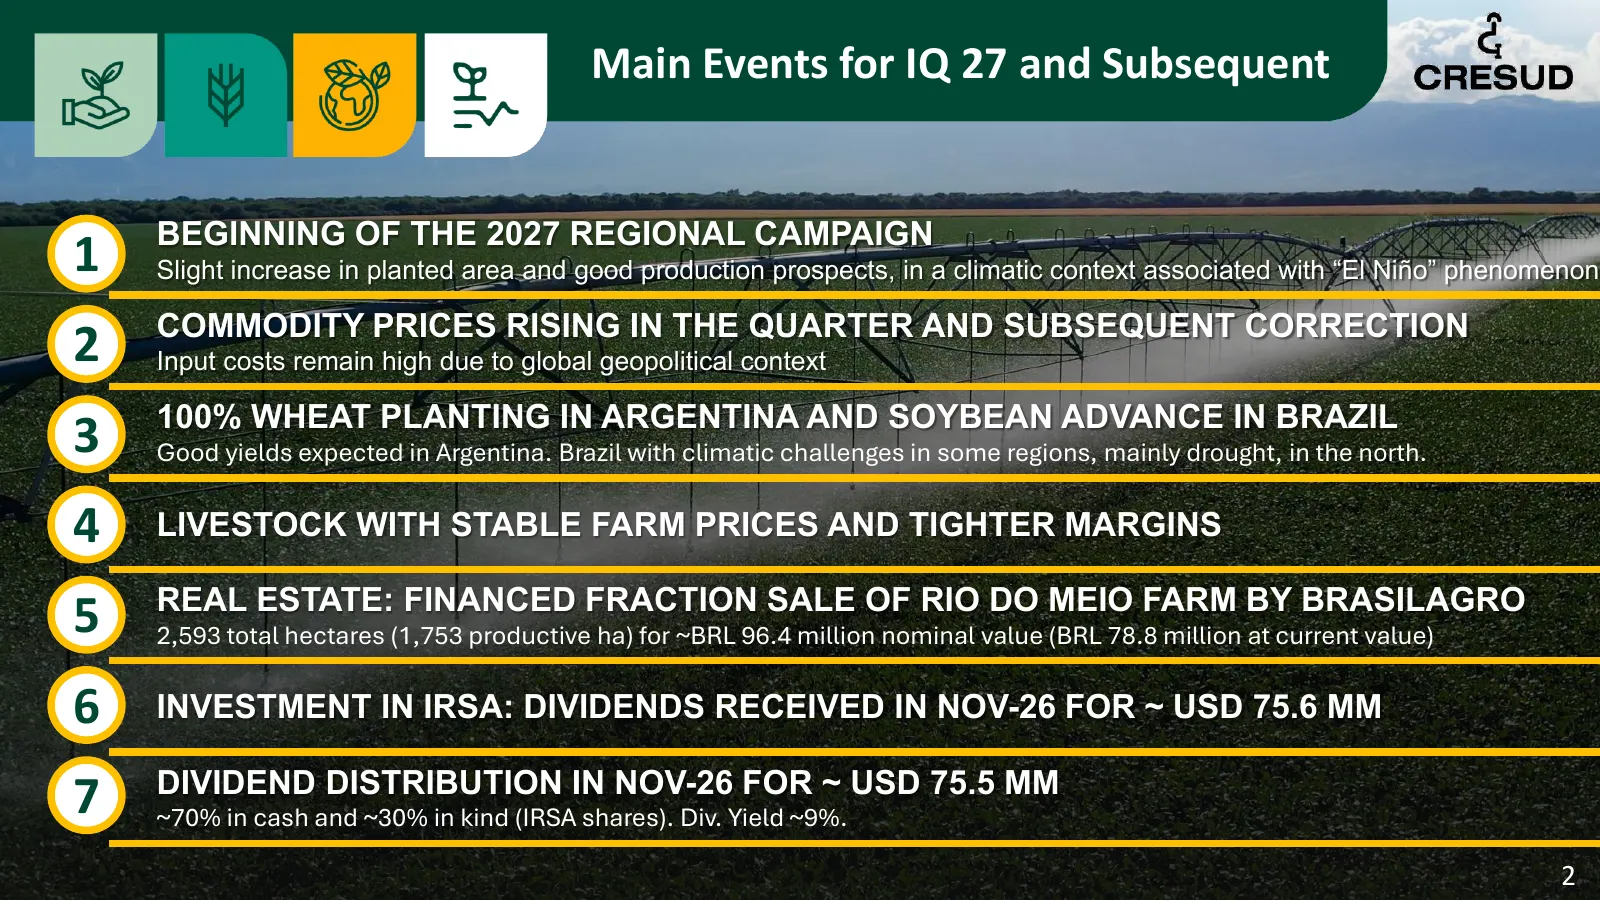
Slide 2: Main Events for IQ 27 and Subsequent
Main Events for IQ 27 and Subsequent BEGINNING OF THE 2027 REGIONAL CAMPAIGN 1 Slight increase in planted area and good production prospects, in a climatic context associated with “El Niño” phenomenon COMMODITY PRICES RISING IN THE QUARTER AND SUBSEQUENT CORRECTION 2 Input costs remain high due to g
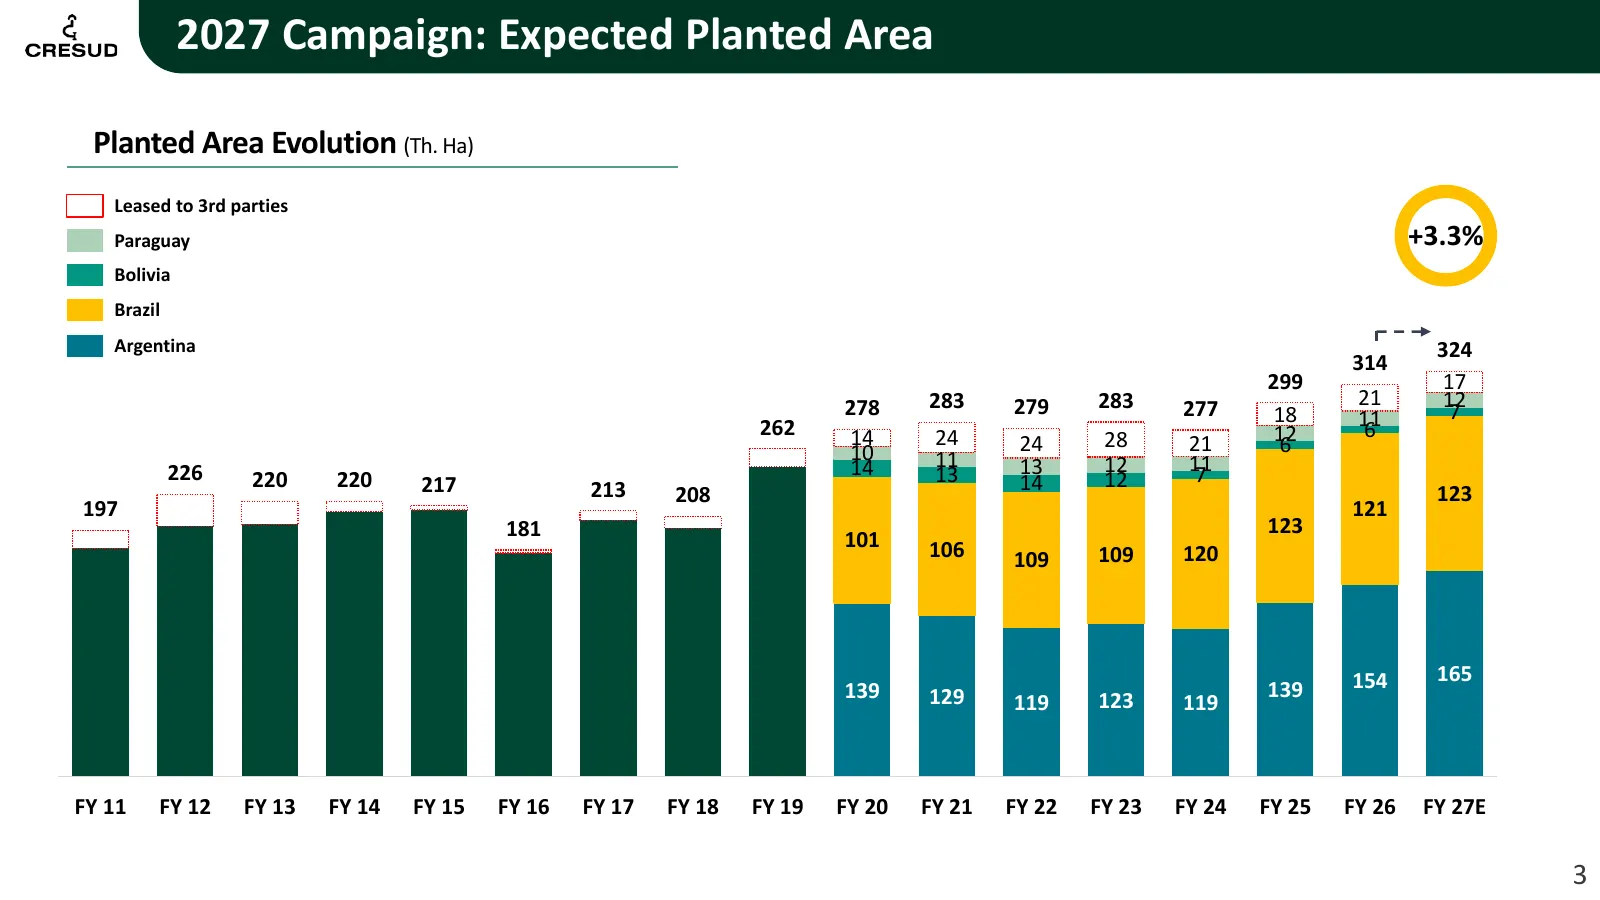
Slide 3: 2027 Campaign: Expected Planted Area
2027 Campaign: Expected Planted Area Planted Area Evolution (Th. Ha) Leased to 3rd parties Paraguay +3.3% Bolivia Brazil Argentina 324 314 299 17 278 283 279 283 277 21 12 18 11 7 262 14 24 12 6 24 28 21 6 10 11 11 226 14 13 13 12 7 220 220 217 213 14 12 208 123 197 121 181 123 101 106 109 109 120 1
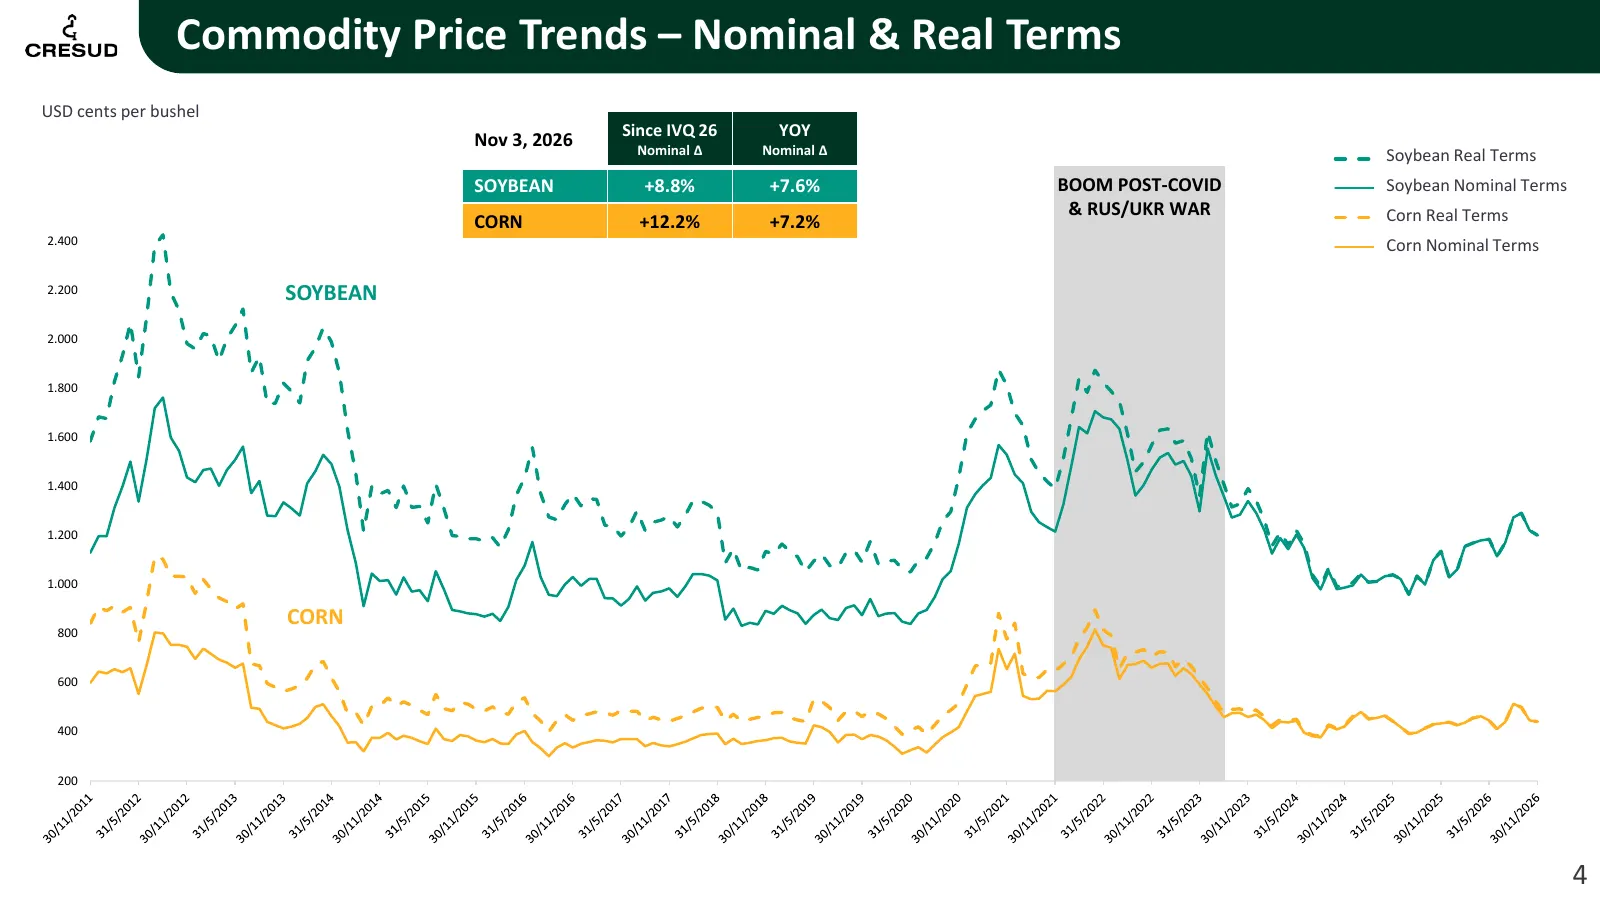
Slide 4: Commodity Price Trends – Nominal & Real Terms
Commodity Price Trends – Nominal & Real Terms USD cents per bushel Nov 3, 2026 Since IVQ 26 YOY Nominal Δ Nominal Δ Soybean Soja Real Real Terms SOYBEAN +8.8% +7.6% BOOM POST-COVID Soybean Soja Nominal Terms Nominal & RUS/UKR WAR CornReal Maiz Real Terms CORN +12.2% +7.2% 2.400 CornNominal Maiz Nomi
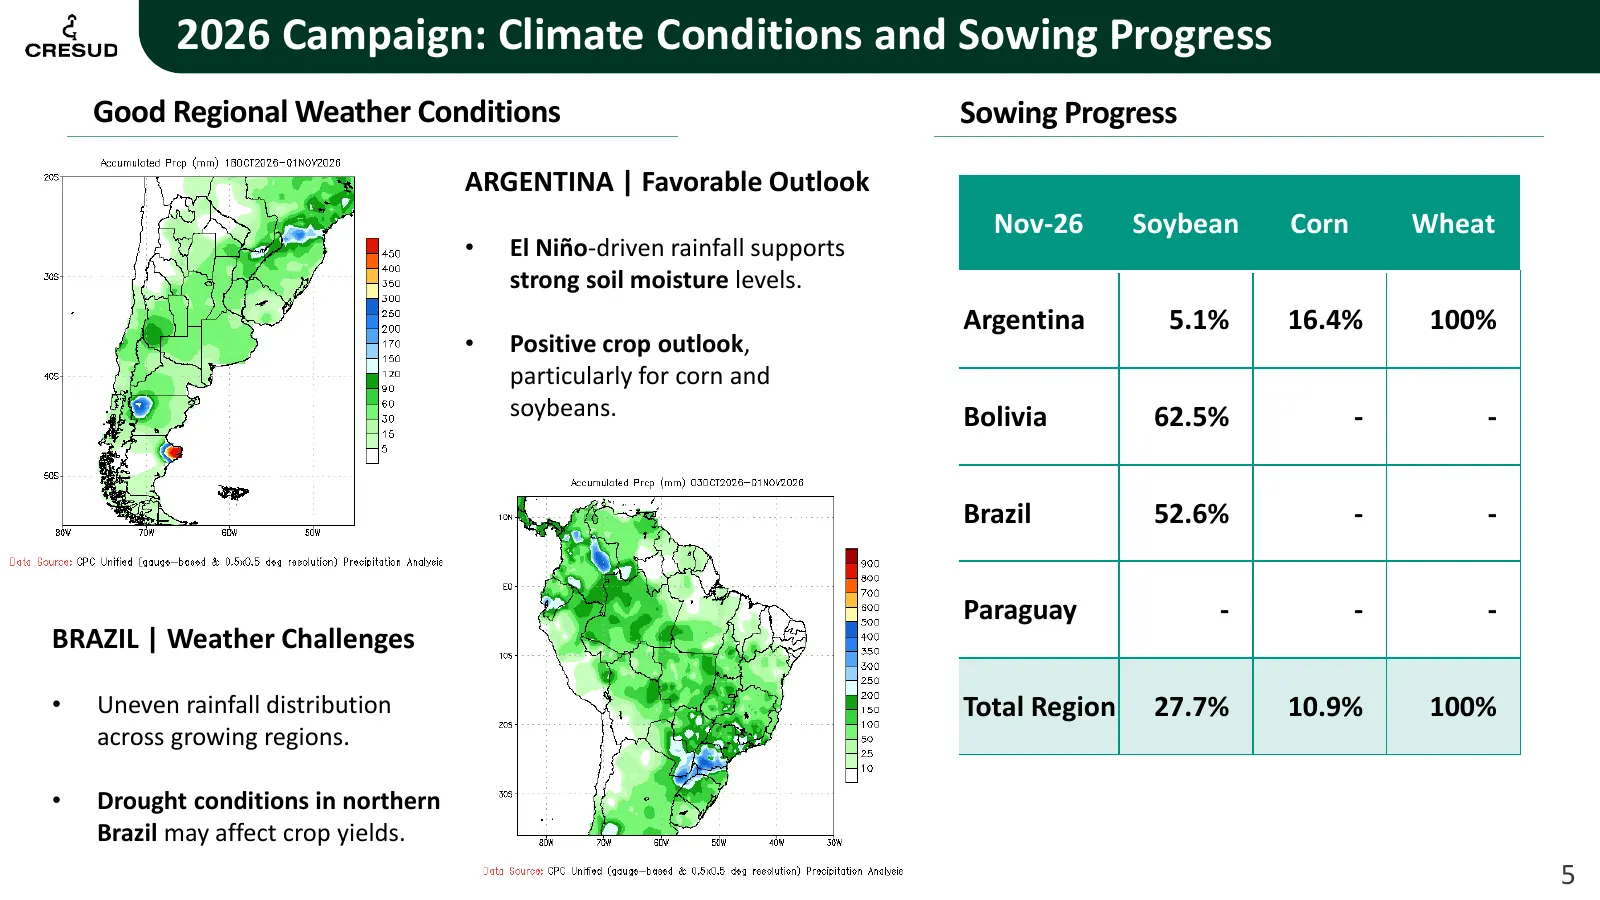
Slide 5: 2026 Campaign: Climate Conditions and Sowing Progress
2026 Campaign: Climate Conditions and Sowing Progress Good Regional Weather Conditions Sowing Progress ARGENTINA | Favorable Outlook Nov-26 Soybean Corn Wheat • El Niño-driven rainfall supports strong soil moisture levels. Argentina 5.1% 16.4% 100% • Positive crop outlook, particularly for corn and
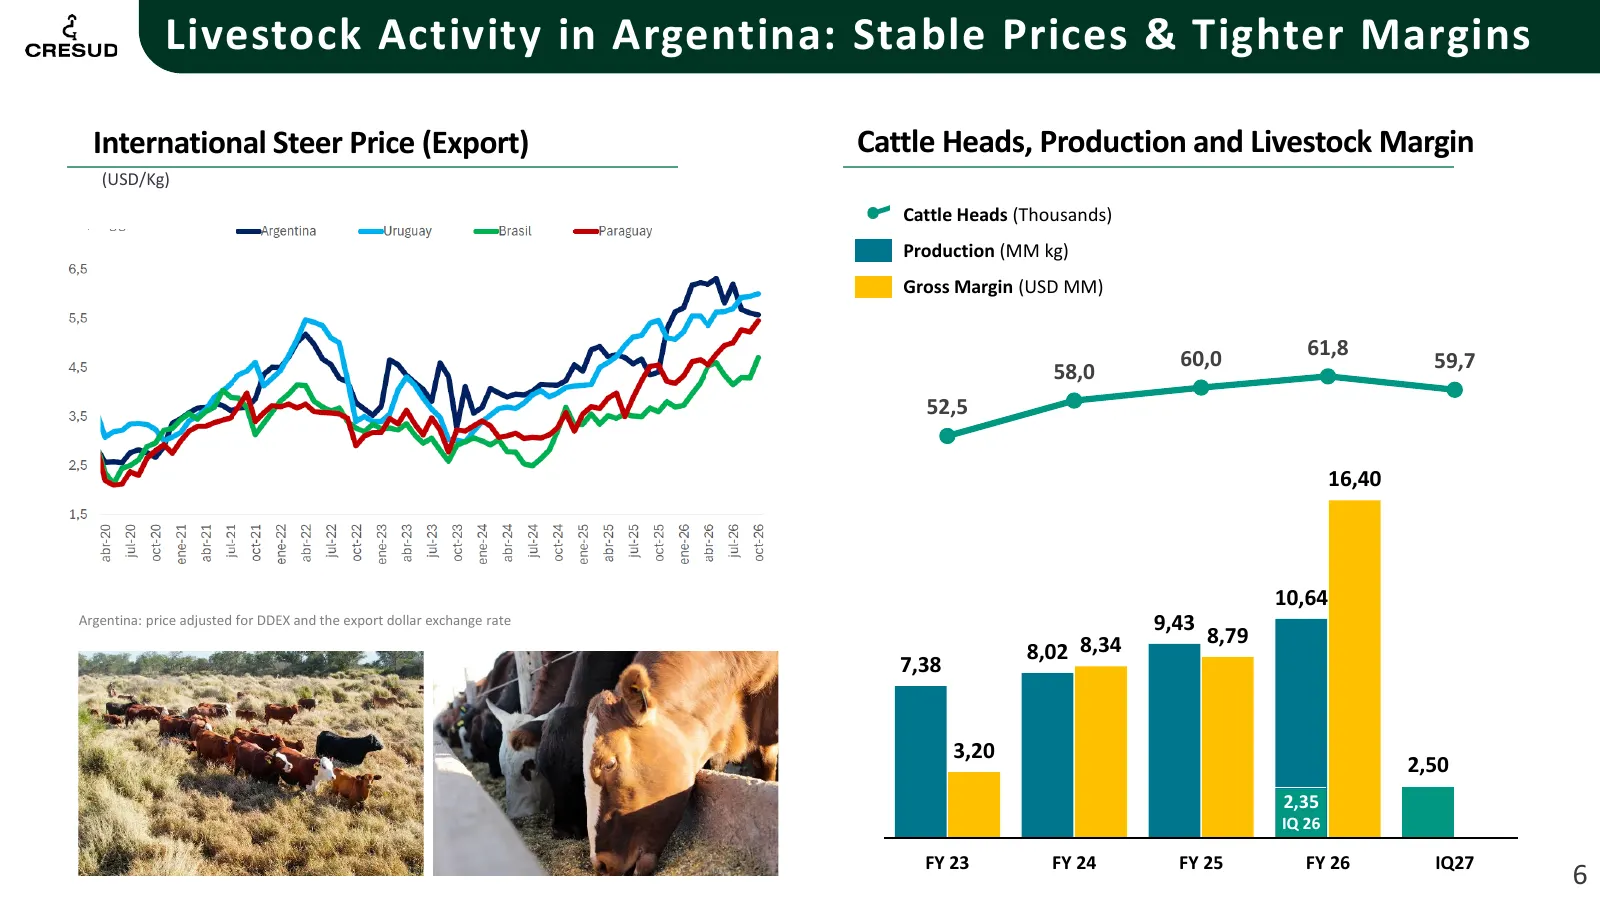
Slide 6: Livestock Activity in Argentina: Stable Prices & Tighter Margins
Livestock Activity in Argentina: Stable Prices & Tighter Margins International Steer Price (Export) Cattle Heads, Production and Livestock Margin (USD/Kg) Cattle Heads (Thousands) Production (MM kg) Gross Margin (USD MM) 60,0 61,8 58,0 59,7 52,5 16,40 10,64 Argentina: price adjusted for DDEX and the
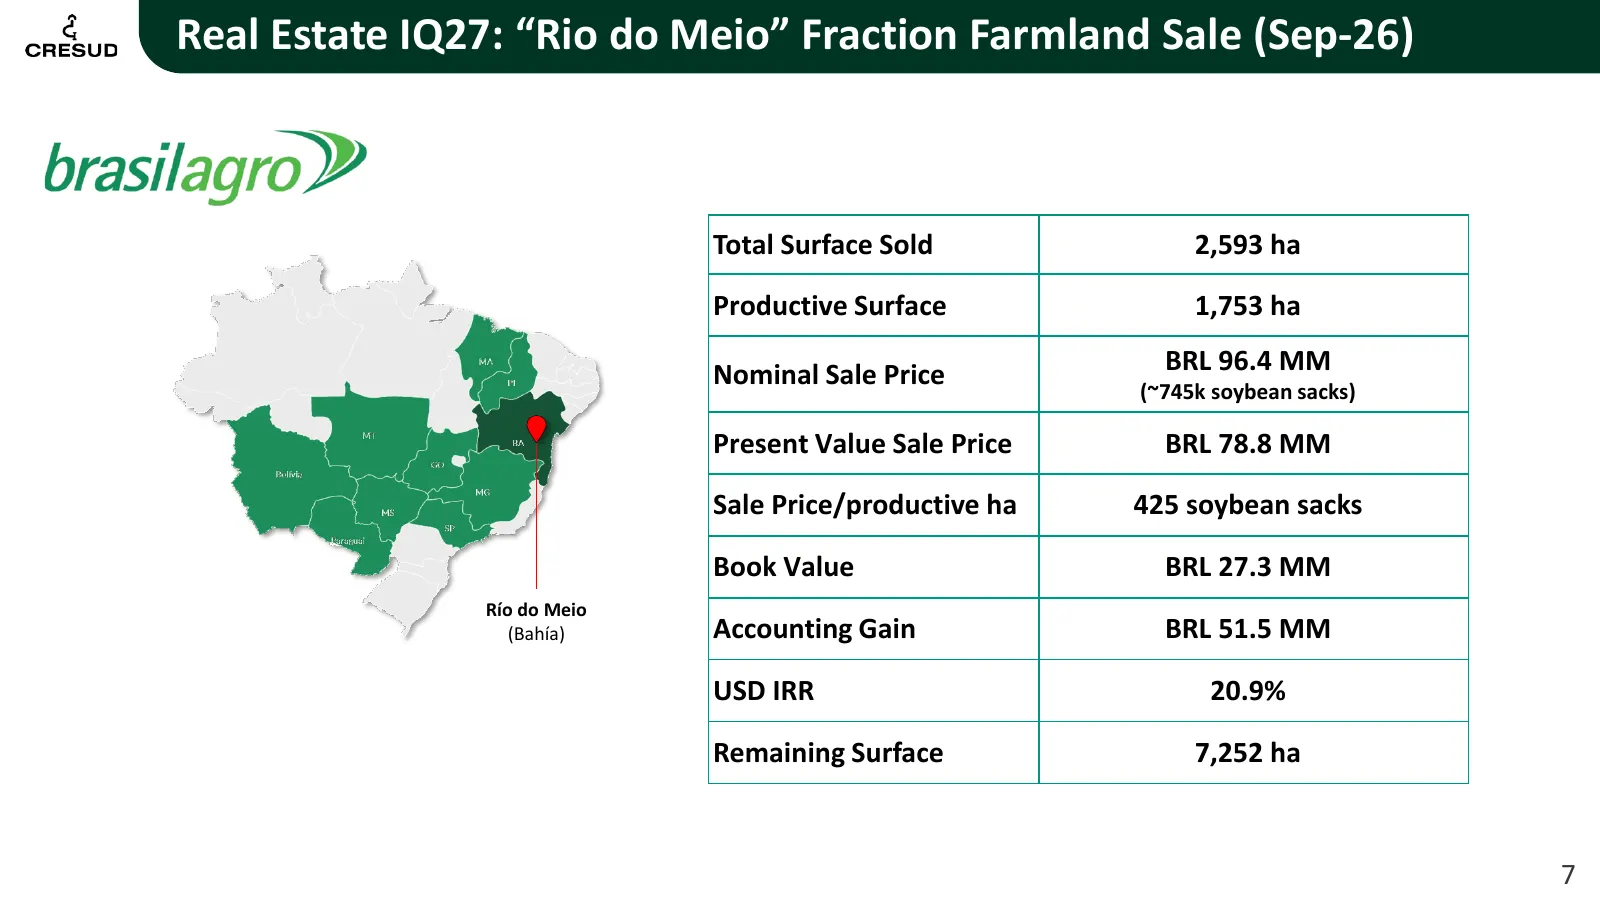
Slide 7: Real Estate IQ27: Rio do Meio Fraction Farmland Sale (Sep-26)
Real Estate IQ27: “Rio do Meio” Fraction Farmland Sale (Sep-26) Total Surface Sold 2,593 ha Productive Surface 1,753 ha Nominal Sale Price BRL 96.4 MM (~745k soybean sacks) Present Value Sale Price BRL 78.8 MM Sale Price/productive ha 425 soybean sacks Book Value BRL 27.3 MM Río do Meio (Bahía) Acco
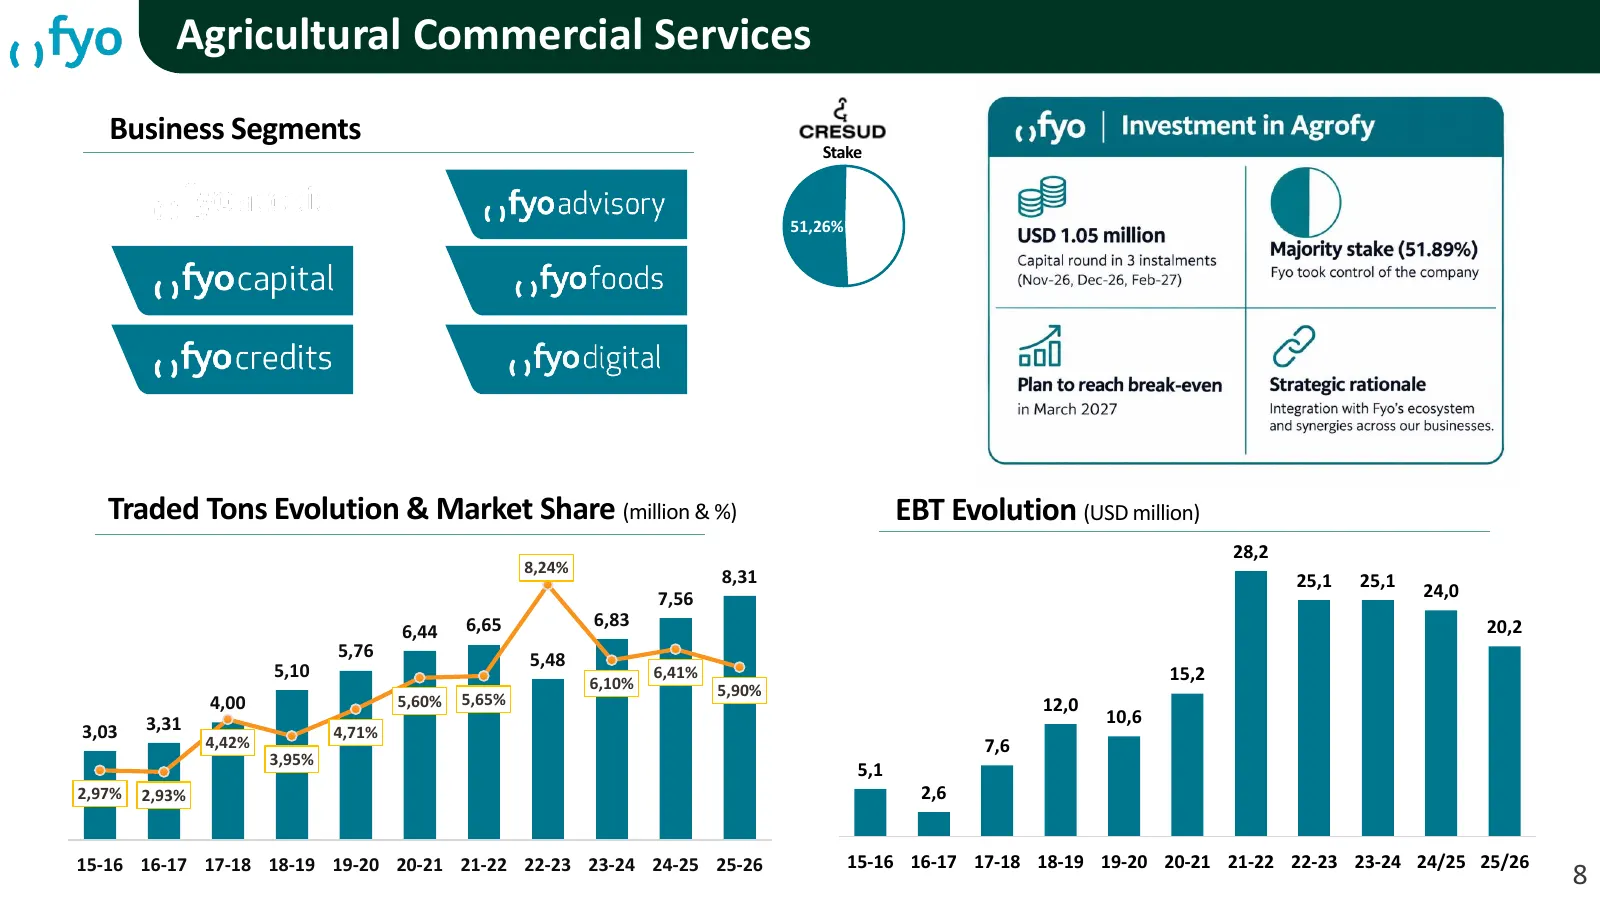
Slide 8: Agricultural Commercial Services
Agricultural Commercial Services Business Segments Stake 51,26% 49 % Traded Tons Evolution & Market Share (million & %) EBT Evolution (USD million) 28,2 8,24% 8,31 25,1 25,1 7,56 24,0 6,65 6,83 20,2 6,44 5,76 5,48 5,10 6,41% 15,2 6,10% 5,90% 4,00 5,60% 5,65% 12,0 3,31 10,6 3,03 4,71% 4,42% 7,6 3,95%
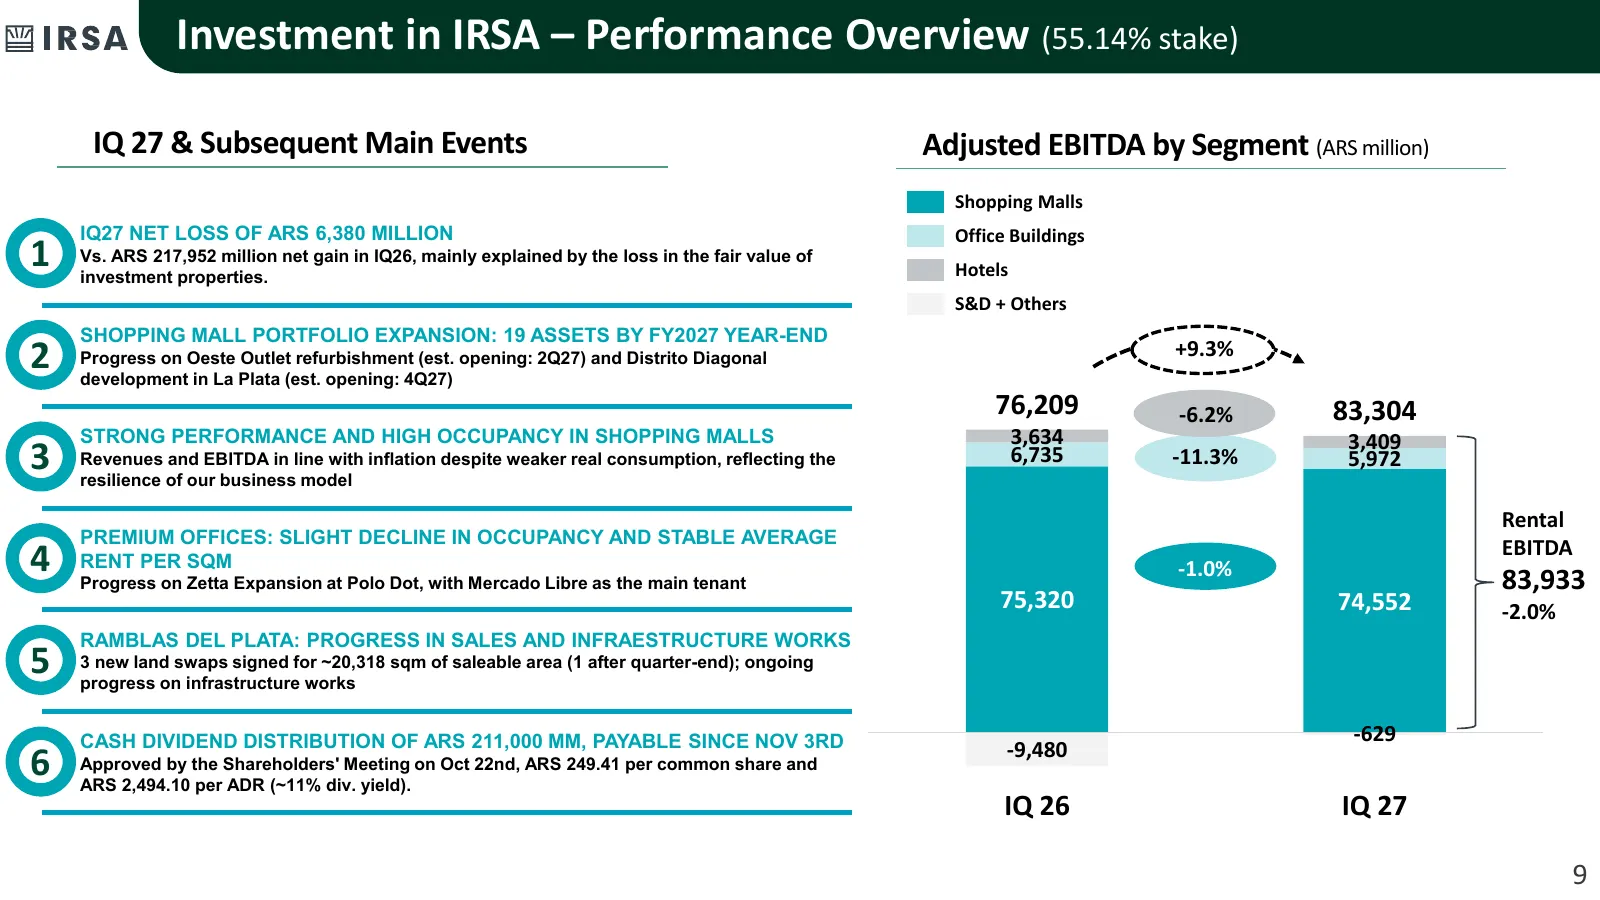
Slide 9: Investment in IRSA – Performance Overview (55.14% stake)
Investment in IRSA – Performance Overview (55.14% stake) IQ 27 & Subsequent Main Events Adjusted EBITDA by Segment (ARS million) Shopping Malls IQ27 NET LOSS OF ARS 6,380 MILLION Office Buildings 1 Vs. ARS 217,952 million net gain in IQ26, mainly explained by the loss in the fair value of investment
Slide 10: Financial Results
Financial CRESUD Results
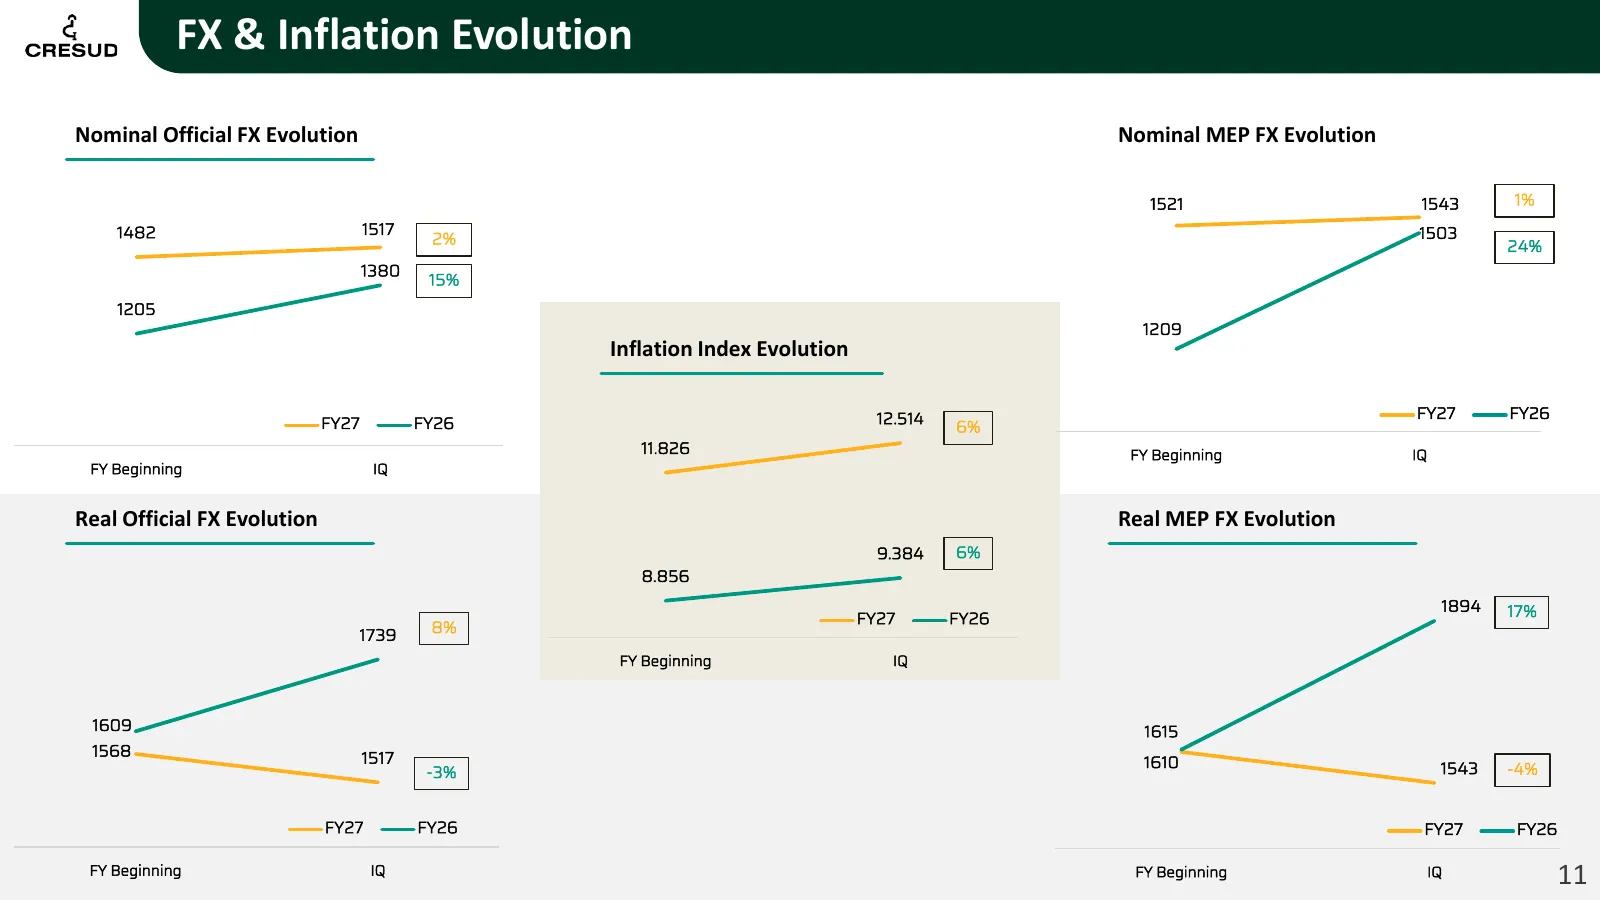
Slide 11: FX & Inflation Evolution
FX & Inflation Evolution Nominal Official FX Evolution Nominal MEP FX Evolution 1521 1543 1% 1482 1517 1503 2% 24% 1380 15% 1205 1209 Inflation Index Evolution 12.514 FY27 FY26 FY27 FY26 6% 11.826 FY Beginning IQ FY Beginning IQ Real Official FX Evolution Real MEP FX Evolution 9.384 6% 8.856 1894 17
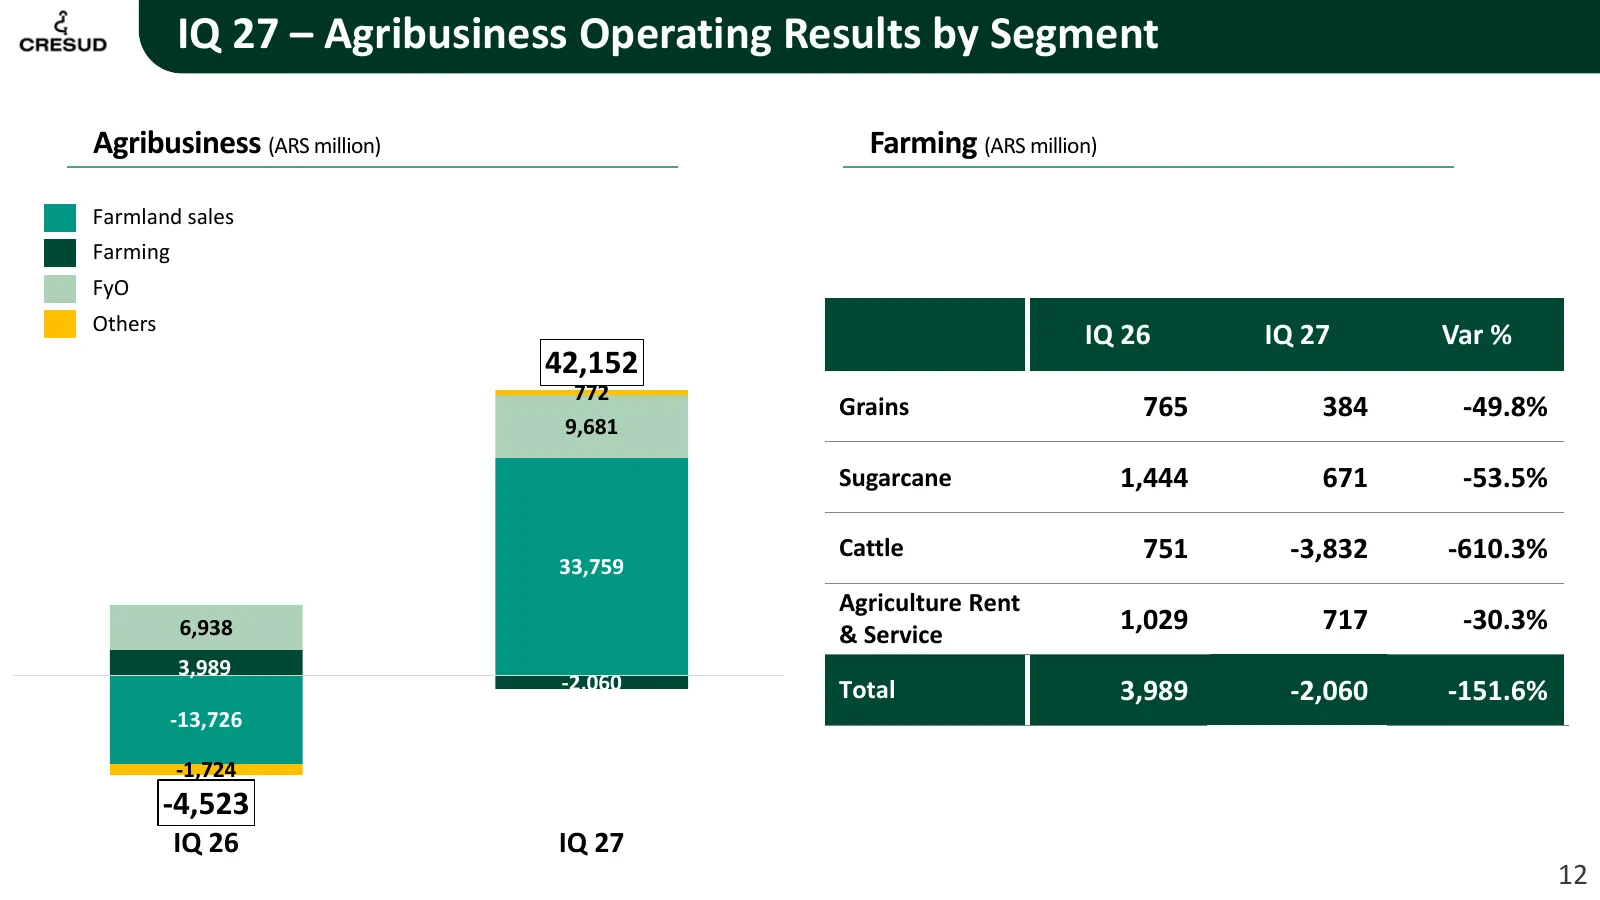
Slide 12: IQ 27 – Agribusiness Operating Results by Segment
IQ 27 – Agribusiness Operating Results by Segment Agribusiness (ARS million) Farming (ARS million) Farmland sales Farming FyO Others IQ 26 IQ 27 Var % 42,152 772 Grains 765 384 -49.8% 9,681 Sugarcane 1,444 671 -53.5% Cattle 751 -3,832 -610.3% 33,759 Agriculture Rent 6,938 & Service 1,029 717 -30.3%
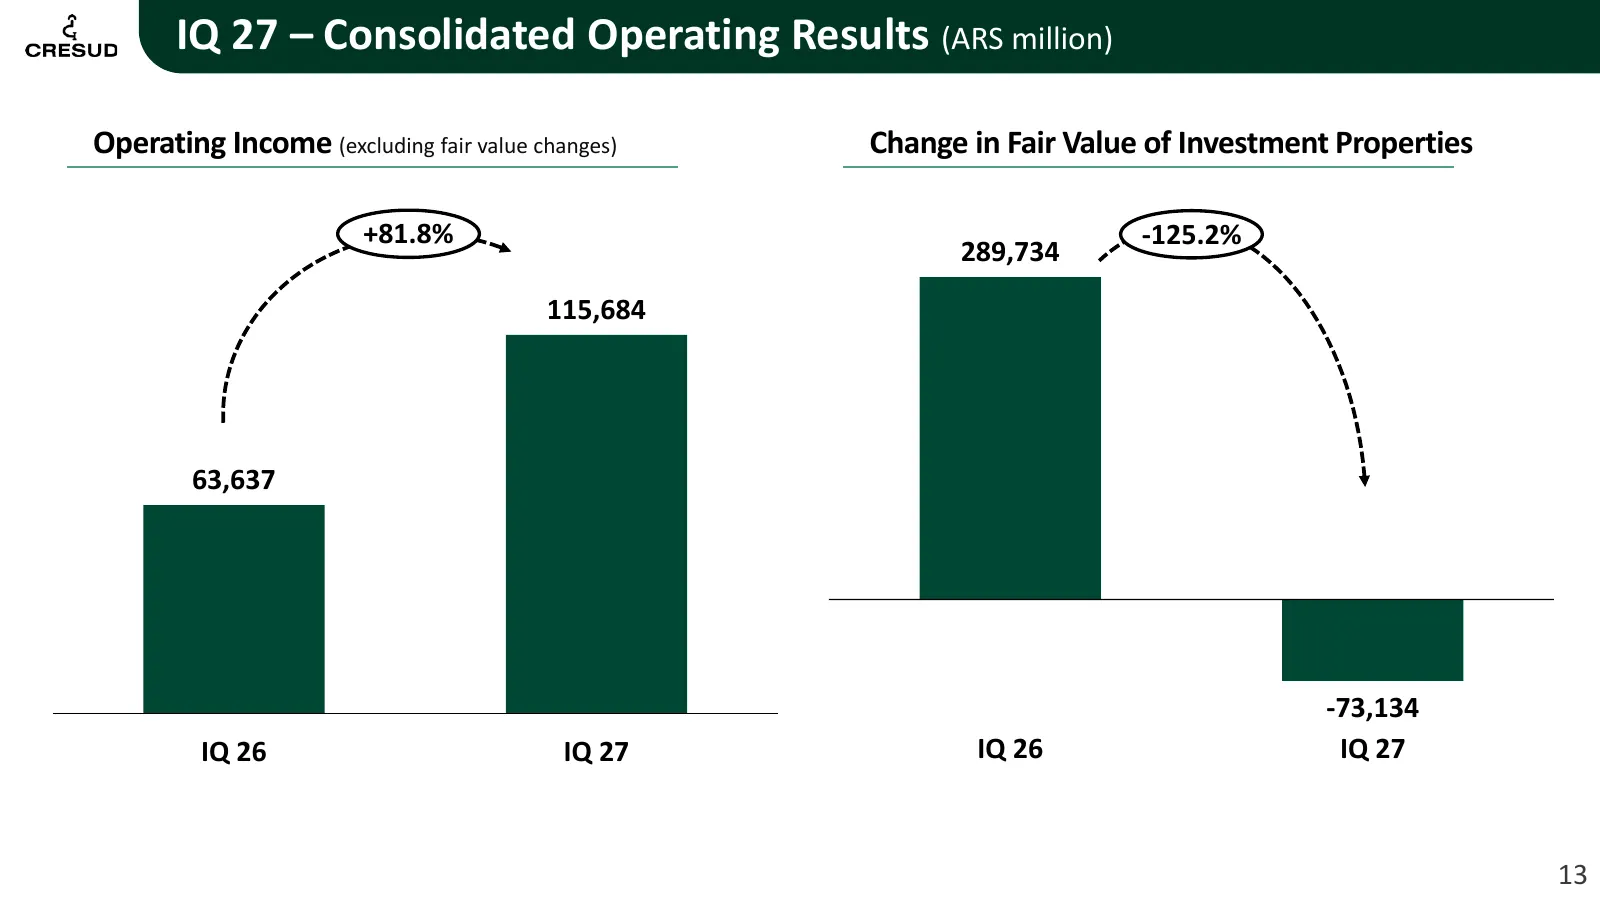
Slide 13: IQ 27 – Consolidated Operating Results (ARS million)
IQ 27 – Consolidated Operating Results (ARS million) Operating Income (excluding fair value changes) Change in Fair Value of Investment Properties +81.8% -125.2% 289,734 115,684 63,637 -73,134 IQ 26 IQ 27 IQ 26 IQ 27 13
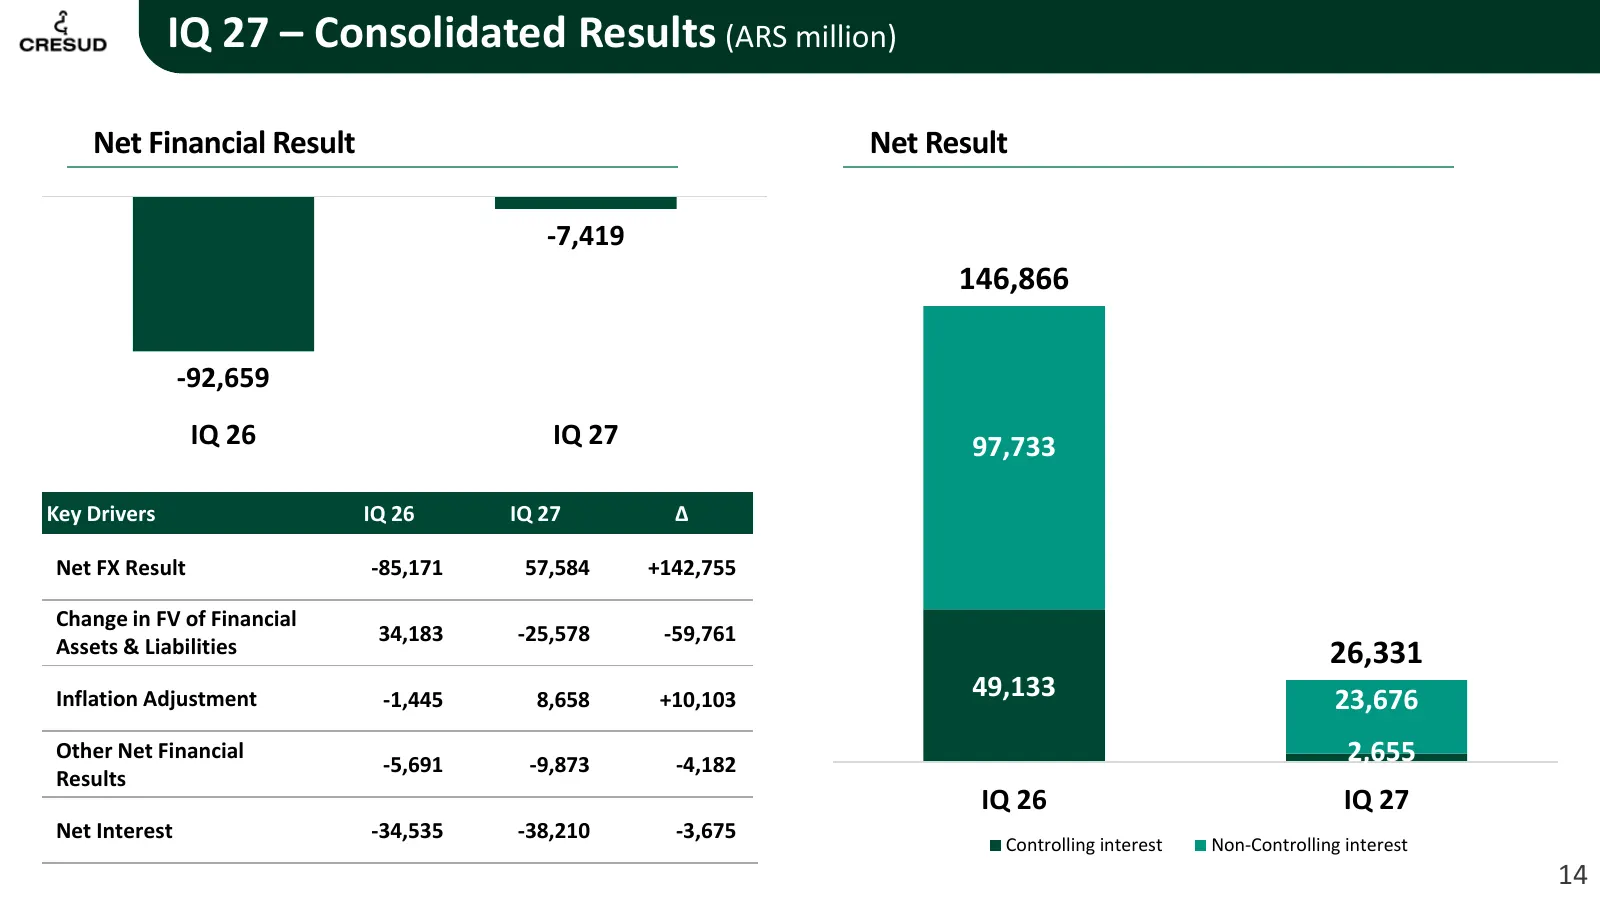
Slide 14: IQ 27 – Consolidated Results (ARS million)
IQ 27 – Consolidated Results (ARS million) Net Financial Result Net Result -7,419 146,866 -92,659 IQ 26 IQ 27 97,733 Key Drivers IQ 26 IQ 27 Δ Net FX Result -85,171 57,584 +142,755 Change in FV of Financial 34,183 -25,578 -59,761 Assets & Liabilities 26,331 Inflation Adjustment -1,445 8,658 +10,103
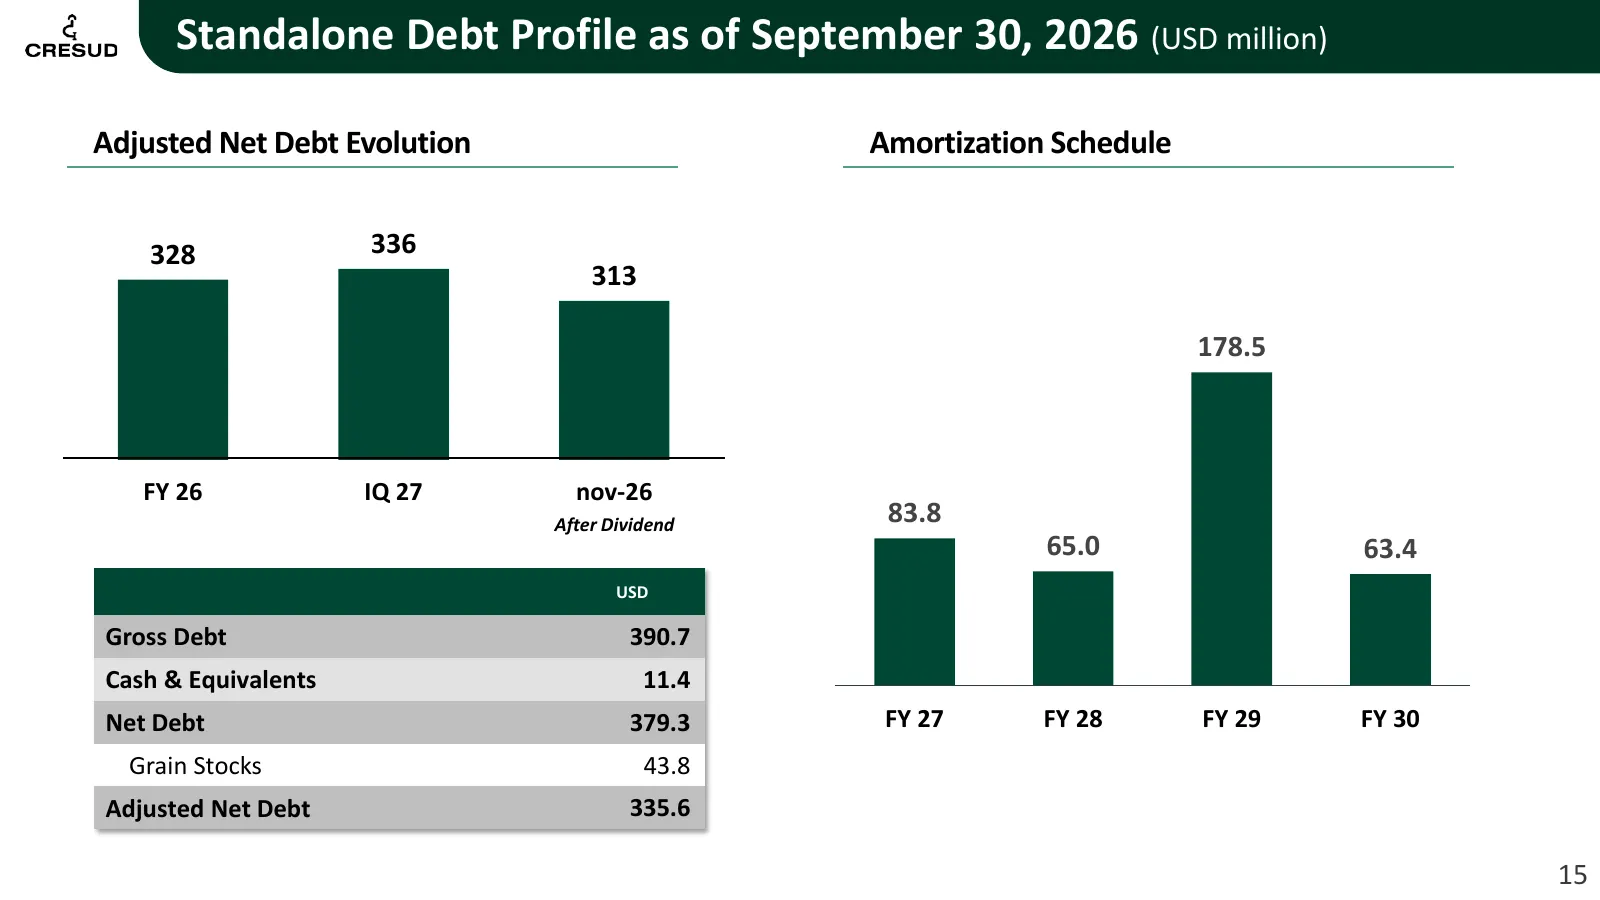
Slide 15: Standalone Debt Profile as of September 30, 2026
Standalone Debt Profile as of September 30, 2026 (USD million) Adjusted Net Debt Evolution Amortization Schedule 328 336 313 178.5 FY 26 IQ 27 nov-26 After Dividend 83.8 65.0 63.4 USD Gross Debt 390.7 Cash & Equivalents 11.4 Net Debt 379.3 FY 27 FY 28 FY 29 FY 30 Grain Stocks 43.8 Adjusted Net Debt
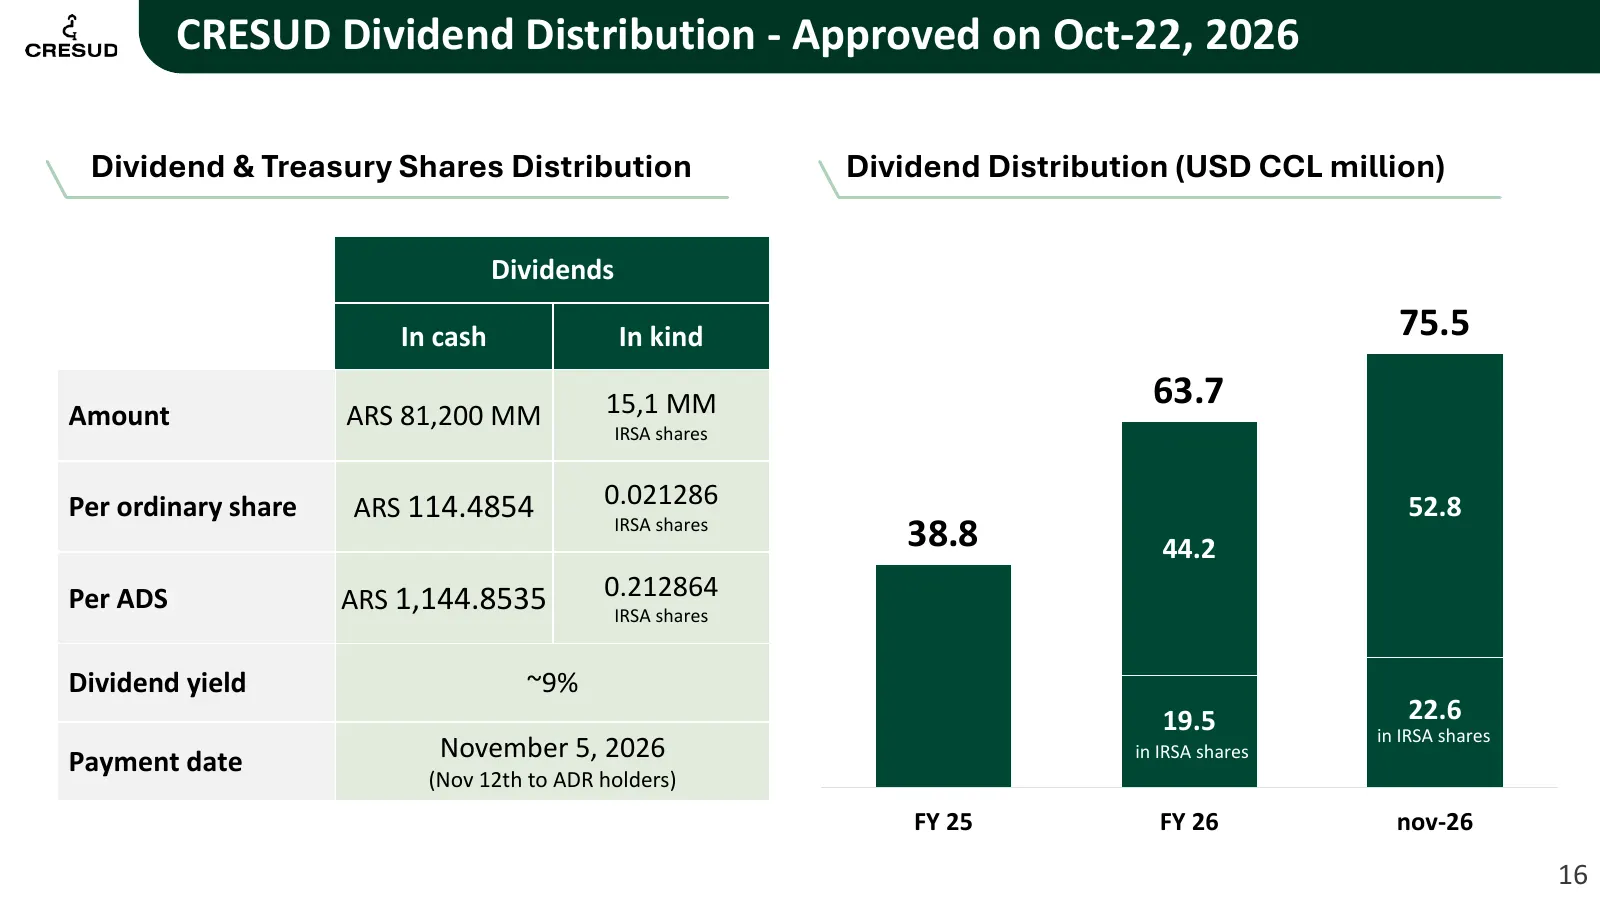
Slide 16: CRESUD Dividend Distribution - Approved on Oct-22, 2026
CRESUD Dividend Distribution - Approved on Oct-22, 2026 Dividend & Treasury Shares Distribution Dividend Distribution (USD CCL million) Dividends In cash In kind 75.5 15,1 MM 63.7 Amount ARS 81,200 MM IRSA shares Per ordinary share ARS 114.4854 0.021286 52.8 IRSA shares 38.8 44.2 Per ADS ARS 1,144.8
Slide 17: Contact Information
Contact Alejandro Elsztain Matías Gaivironsky Santiago Donato CEO CFO Head of IR & ESG Information Corporate Offices Independent Auditors Della Paolera 261, 9th Floor PricewaterhouseCoopers Argentina www.cresud.com.ar +54 911 4323-7449 C1001ADA – City of Buenos Aires, Argentina Bouchard 557, 7th Flo
Source: 6ix earnings call
More decks from Cresud SA
 Investor Presentation (November 2026)25 slides · November 2026
 FY2026 Earnings Presentation22 slides · Sep 8, 2026
 Cresud S.A.C.I.F. y A. — Q3 2026 Earnings Presentation16 slides · May 8, 2026
 Investor Presentation (2026)21 slides · 2026
 Investor Presentation (2026)26 slides · 2026
 Cresud S.A.C.I.F. y A. — Investor Presentation (2026)24 slides · 2026