Kansas City Southern — Corporate Update (June 2020)
10 slides from Kansas City Southern's corporate update, Jun 23, 2020
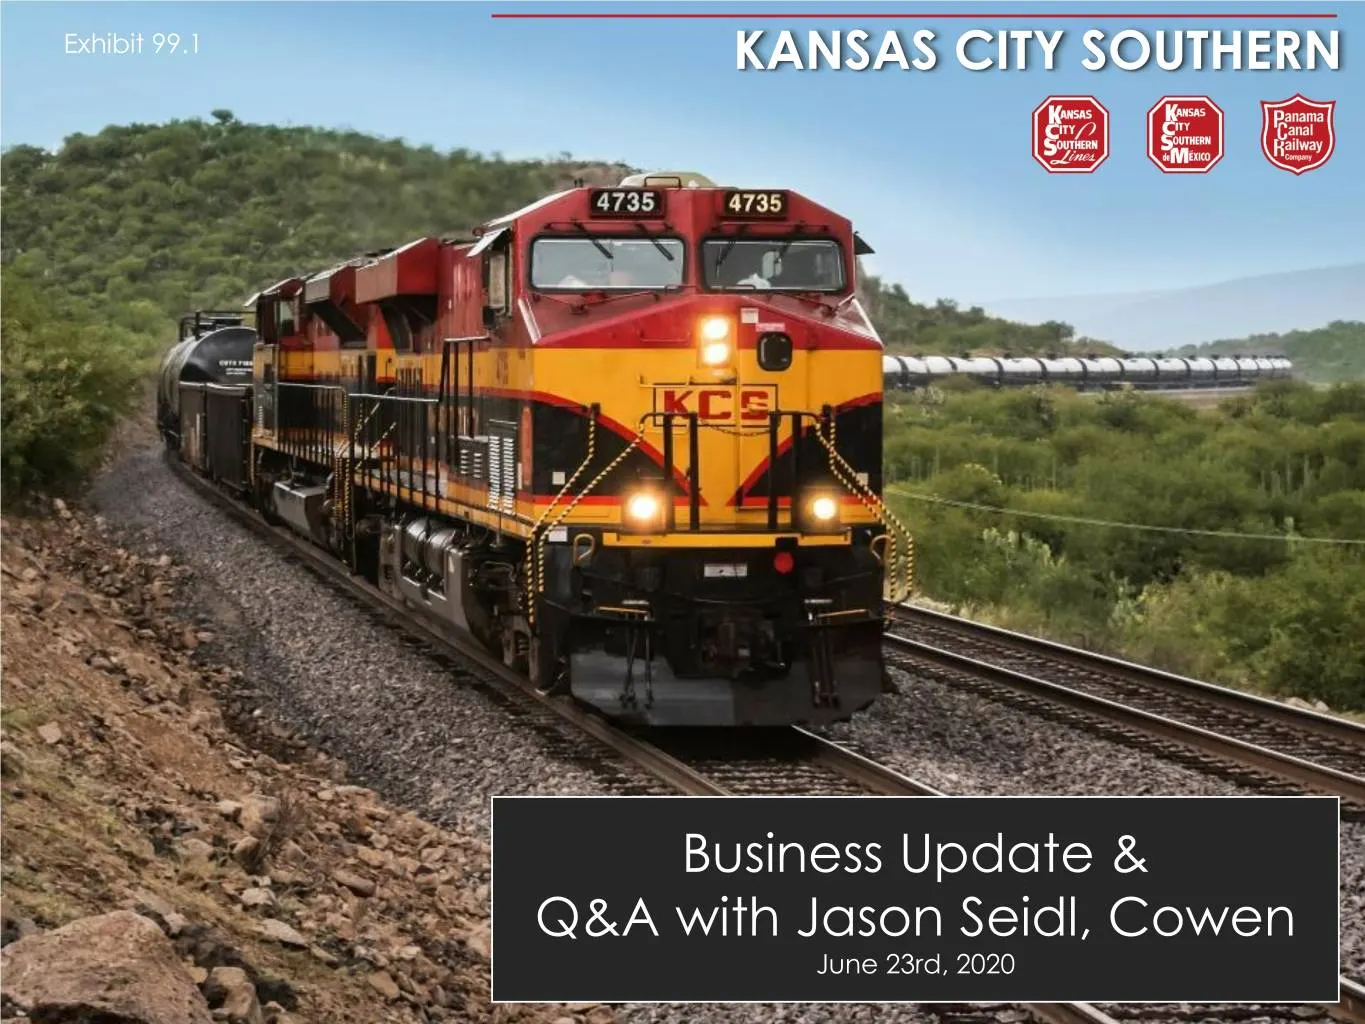
Slide 1: Business Update & Q&A with Jason Seidl, Cowen
Exhibit 99.1 KANSAS CITY SOUTHERN Business Update & Q&A with Jason Seidl, Cowen KCS June 23rd, 2020
Slide 2: Safe Harbor Statement
Safe Harbor Statement This presentation contains forward-looking statements within the meaning of Section 27A of the Securities Act of 1933, as amended, Section 21E of the Securities Exchange Act of 1934, as amended and the Private Securities Litigation Reform Act of 1995. In addition, management ma
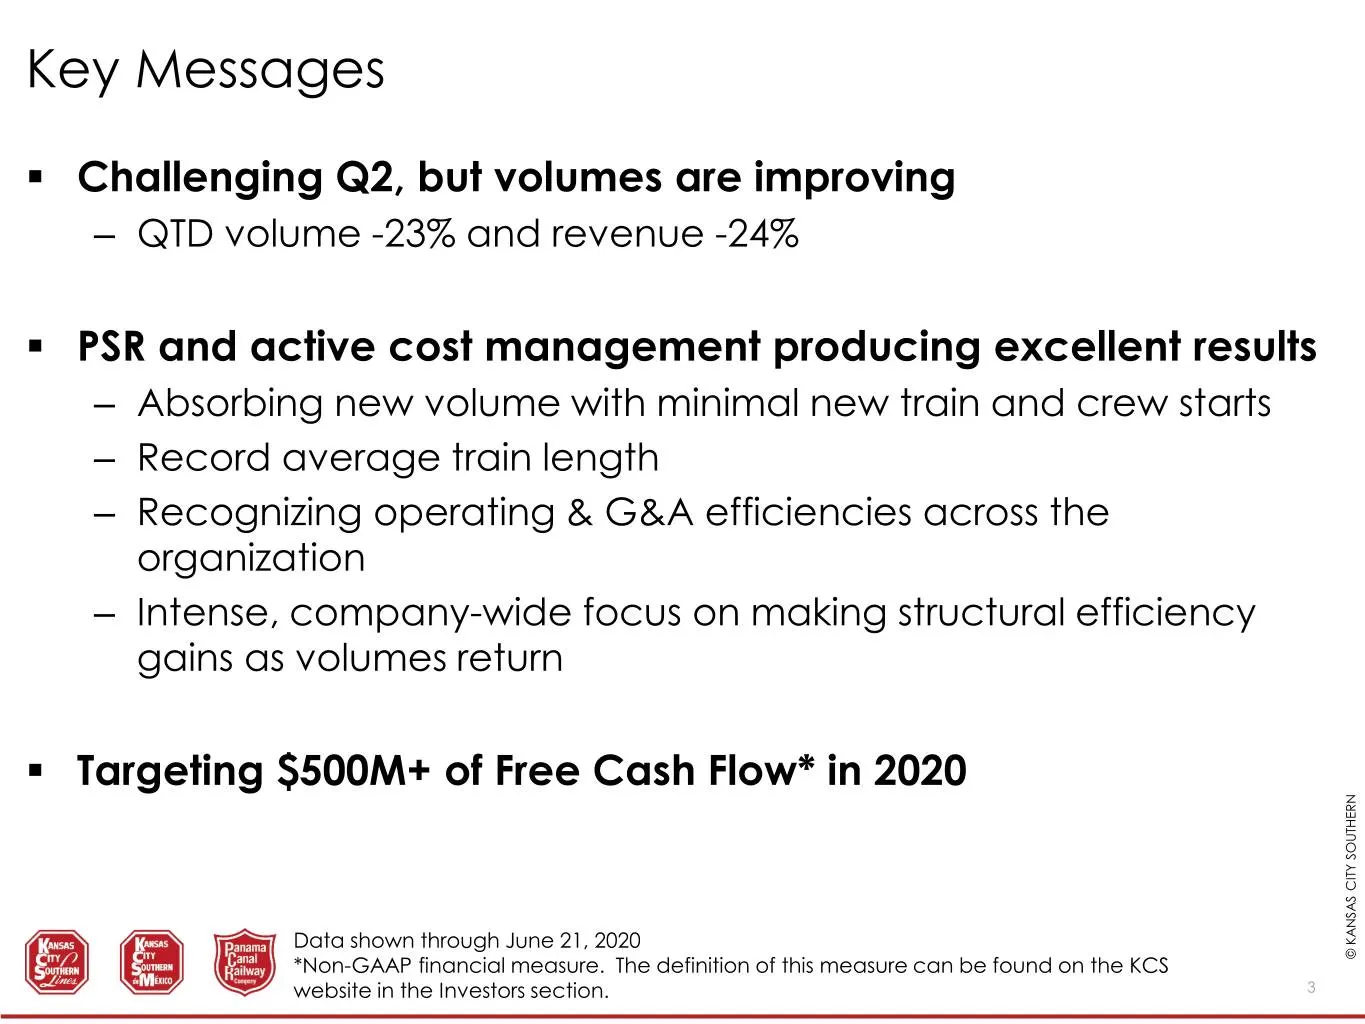
Slide 3: Key Messages
Key Messages . Challenging Q2, but volumes are improving – QTD volume -23% and revenue -24% . PSR and active cost management producing excellent results – Absorbing new volume with minimal new train and crew starts – Record average train length – Recognizing operating & G&A efficiencies across the o
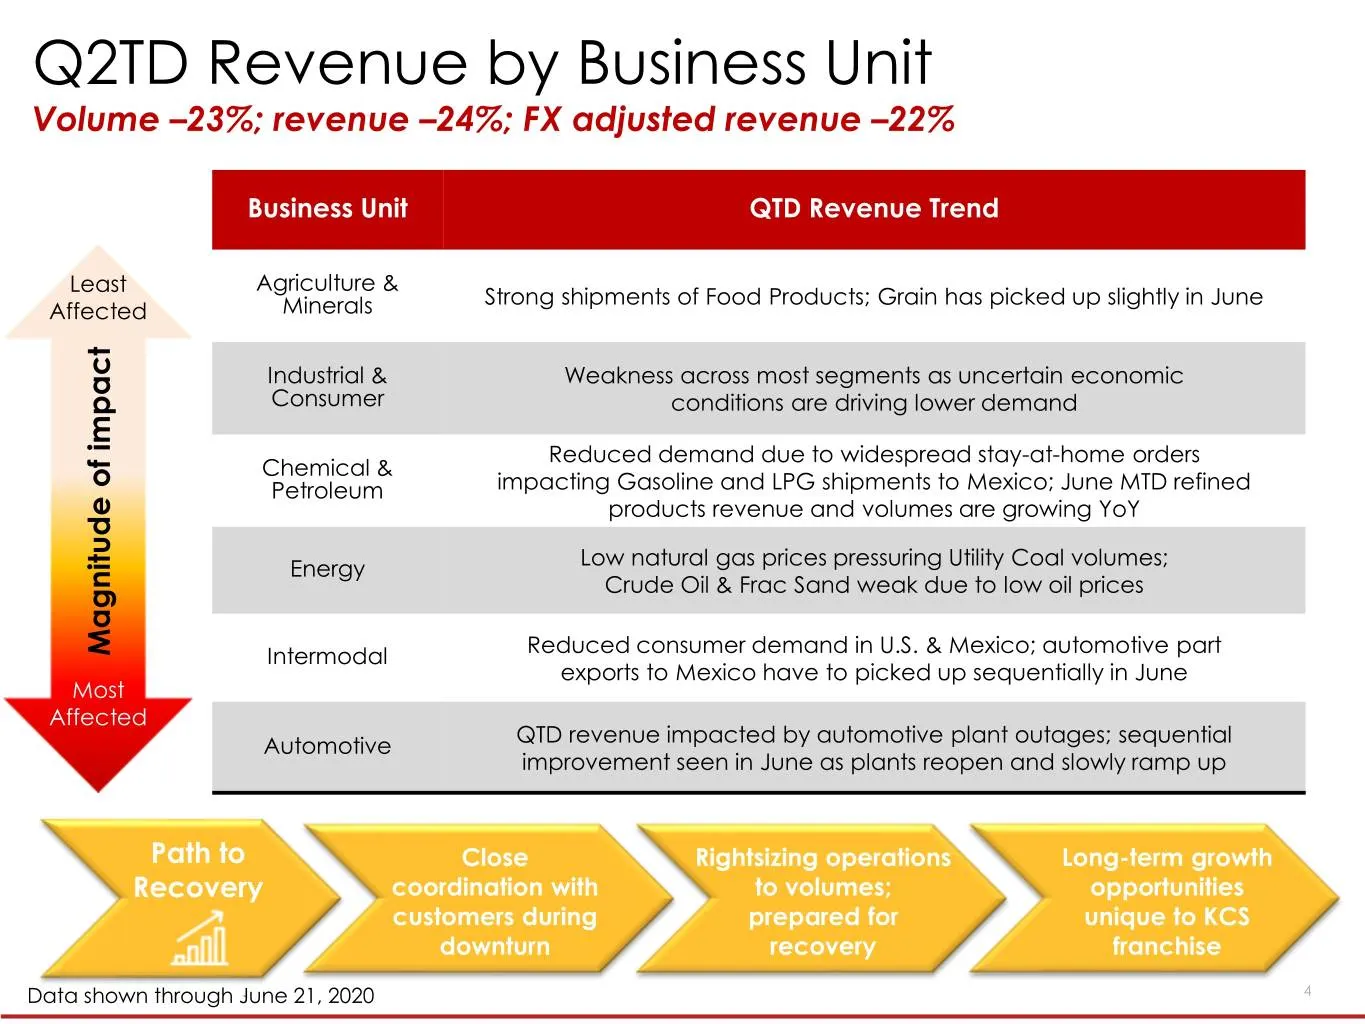
Slide 4: Q2TD Revenue by Business Unit
Q2TD Revenue by Business Unit Volume –23%; revenue –24%; FX adjusted revenue –22% Business Unit QTD Revenue Trend Least Agriculture & Strong shipments of Food Products; Grain has picked up slightly in June Affected Minerals Industrial & Weakness across most segments as uncertain economic Consumer co
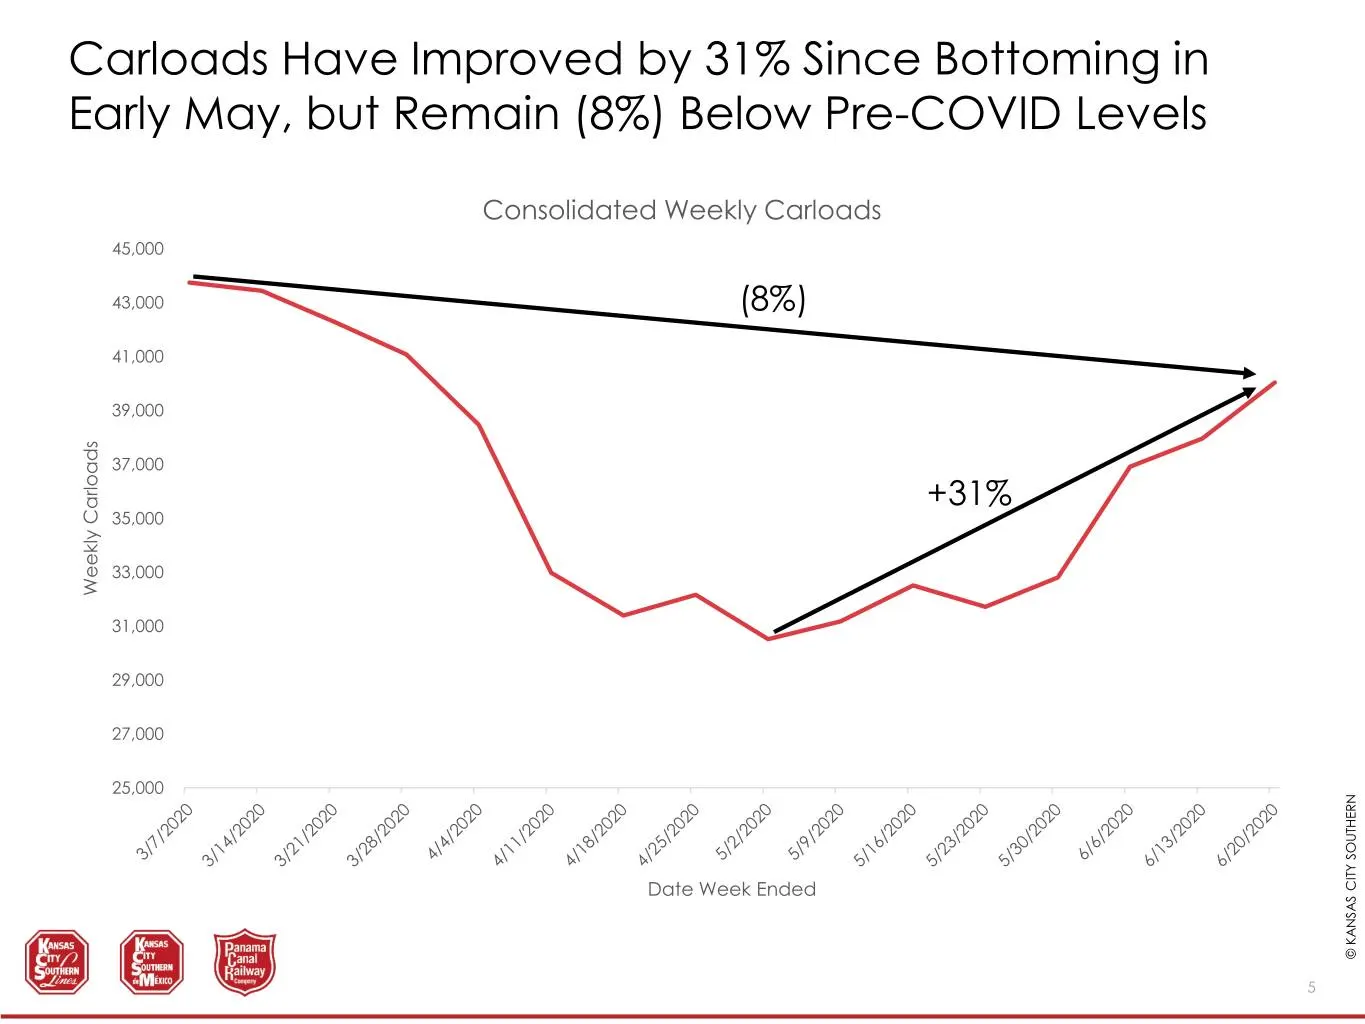
Slide 5: Carloads Have Improved by 31% Since Bottoming in Early May
Carloads Have Improved by 31% Since Bottoming in Early May, but Remain (8%) Below Pre-COVID Levels Consolidated Weekly Carloads 45,000 43,000 (8%) 41,000 39,000 37,000 +31% 35,000 33,000 Weekly Carloads 31,000 29,000 27,000 25,000 Date Week Ended © KANSAS © KANSAS CITY SOUTHERN KCS 5
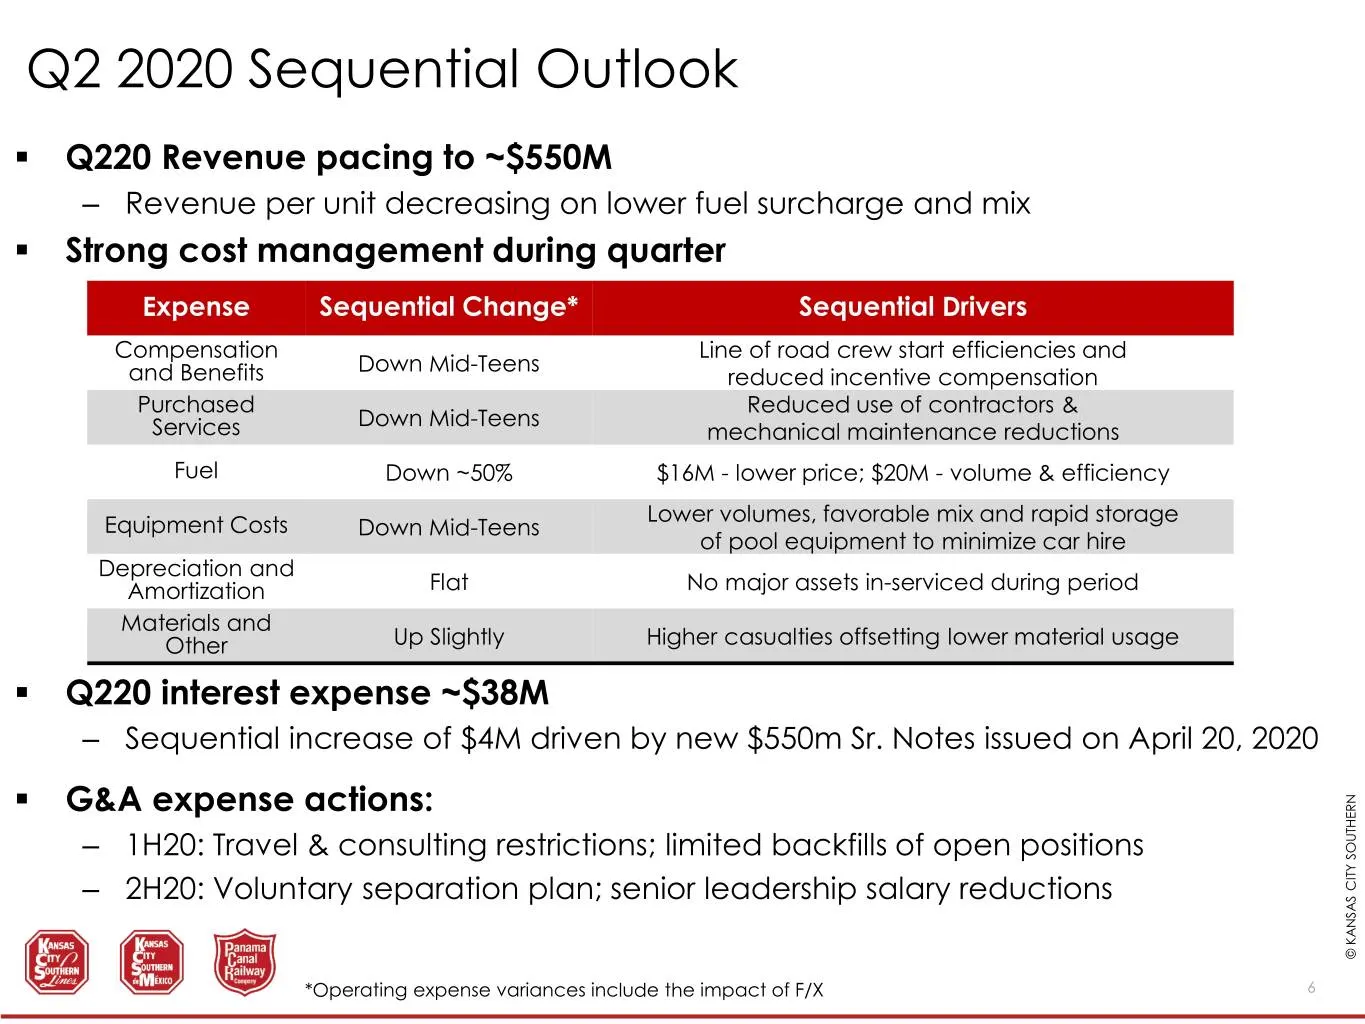
Slide 6: Q2 2020 Sequential Outlook
Q2 2020 Sequential Outlook . Q220 Revenue pacing to ~$550M – Revenue per unit decreasing on lower fuel surcharge and mix . Strong cost management during quarter Expense Sequential Change* Sequential Drivers Compensation Line of road crew start efficiencies and Down Mid-Teens and Benefits reduced inc
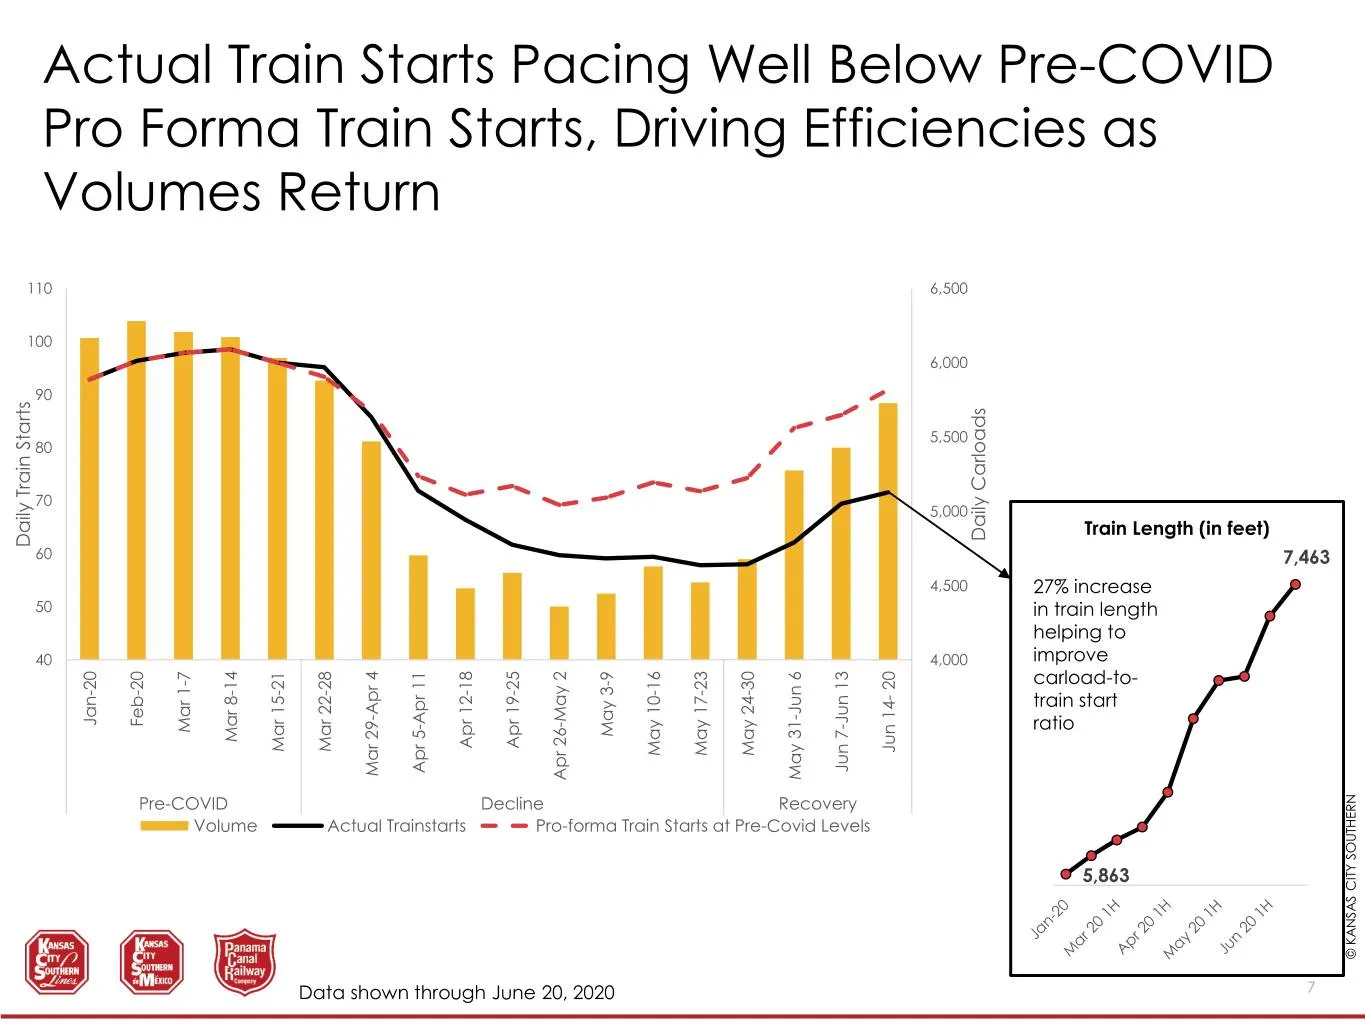
Slide 7: Actual Train Starts Pacing Well Below Pre-COVID Pro Forma Train Starts
Actual Train Starts Pacing Well Below Pre-COVID Pro Forma Train Starts, Driving Efficiencies as Volumes Return 110 6,500 100 6,000 90 5,500 80 70 5,000 Train Length (in feet) DailyCarloads Daily Train Starts DailyTrain 60 7,463 4,500 27% increase 50 in train length helping to 40 4,000 improve carloa
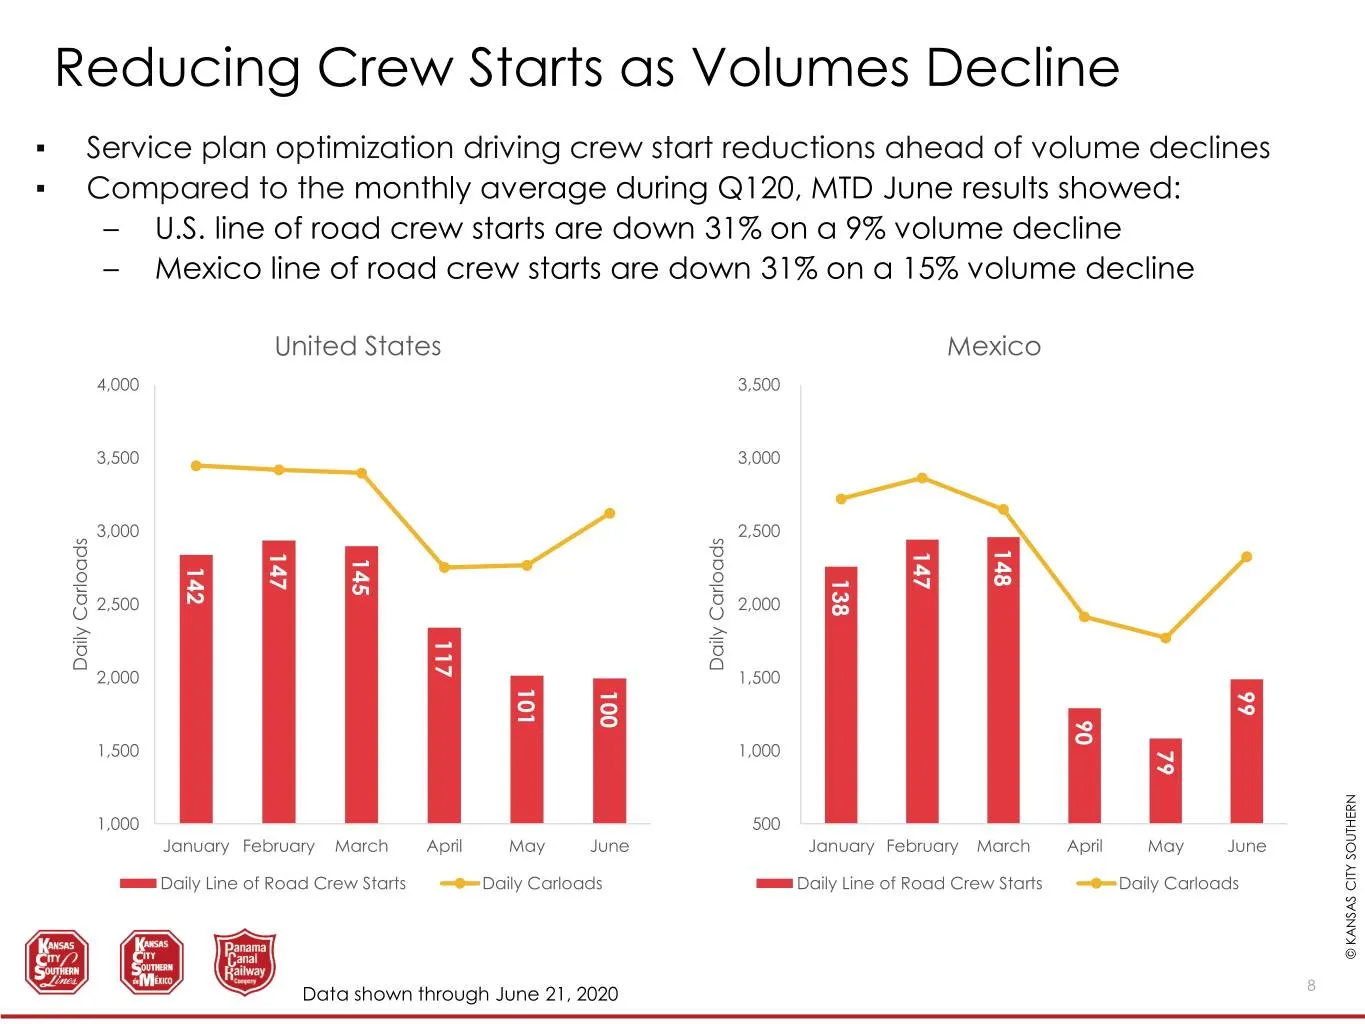
Slide 8: Reducing Crew Starts as Volumes Decline
Reducing Crew Starts as Volumes Decline ▪ Service plan optimization driving crew start reductions ahead of volume declines ▪ Compared to the monthly average during Q120, MTD June results showed: – U.S. line of road crew starts are down 31% on a 9% volume decline – Mexico line of road crew starts are
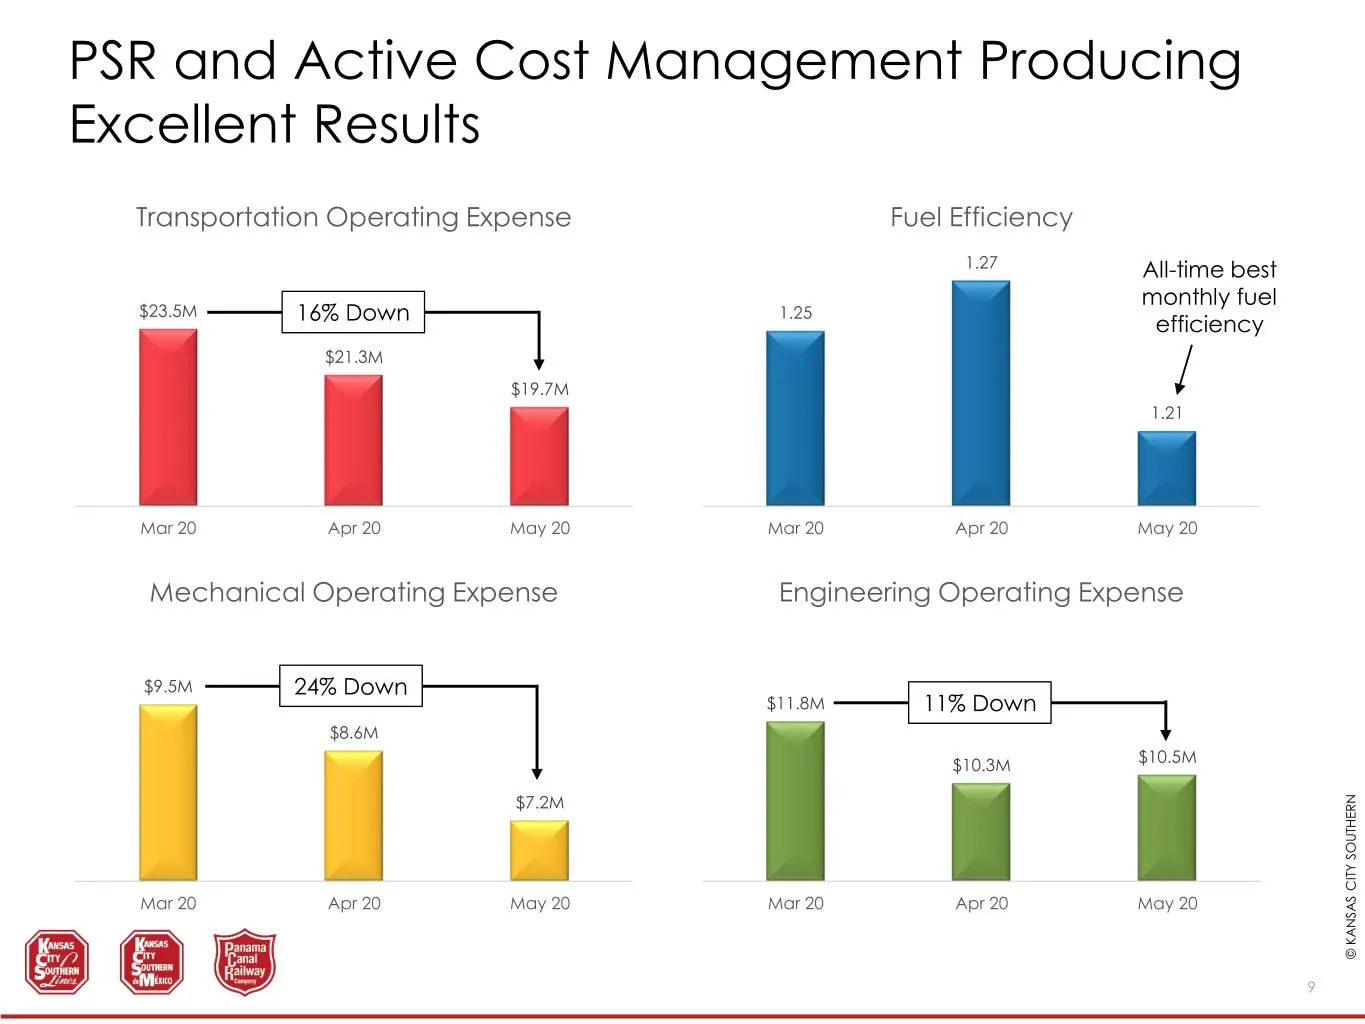
Slide 9: PSR and Active Cost Management Producing Excellent Results
PSR and Active Cost Management Producing Excellent Results Transportation Operating Expense Fuel Efficiency 1.27 All-time best monthly fuel $23.5M 16% Down 1.25 efficiency $21.3M $19.7M 1.21 Mar 20 Apr 20 May 20 Mar 20 Apr 20 May 20 Mechanical Operating Expense Engineering Operating Expense $9.5M 24
Slide 10: Thank You!
Thank You! www.KCSouthern.com © KANSAS © KANSAS CITY SOUTHERN KCS 10
Source: SEC EDGAR · 8-K filed Jun 23, 2020
More decks from Kansas City Southern
 Merger or Acquisition (September 2021)9 slides · Sep 16, 2021
 Merger or Acquisition (September 2021)10 slides · Sep 1, 2021
 Merger or Acquisition (August 2021)12 slides · Aug 27, 2021
 Merger or Acquisition (August 2021)11 slides · Aug 17, 2021
 Merger or Acquisition (August 2021)13 slides · Aug 10, 2021
 Merger or Acquisition (August 2021)7 slides · Aug 5, 2021