Nedbank Group · JSE:NED
Nedbank — Investor Presentation (November 2015)
52 slides from Nedbank's investor presentation, November 2015
Slide 1: Basel III & IFRS 9 Investor presentation
NEDBANK GROUP LIMITED Basel III & IFRS 9 Investor presentation November 2015 Raisibe Morathi, Chief Financial Officer Trevor Adams, Chief Risk Officer Mike Davis, Group Executive: Balance Sheet Management
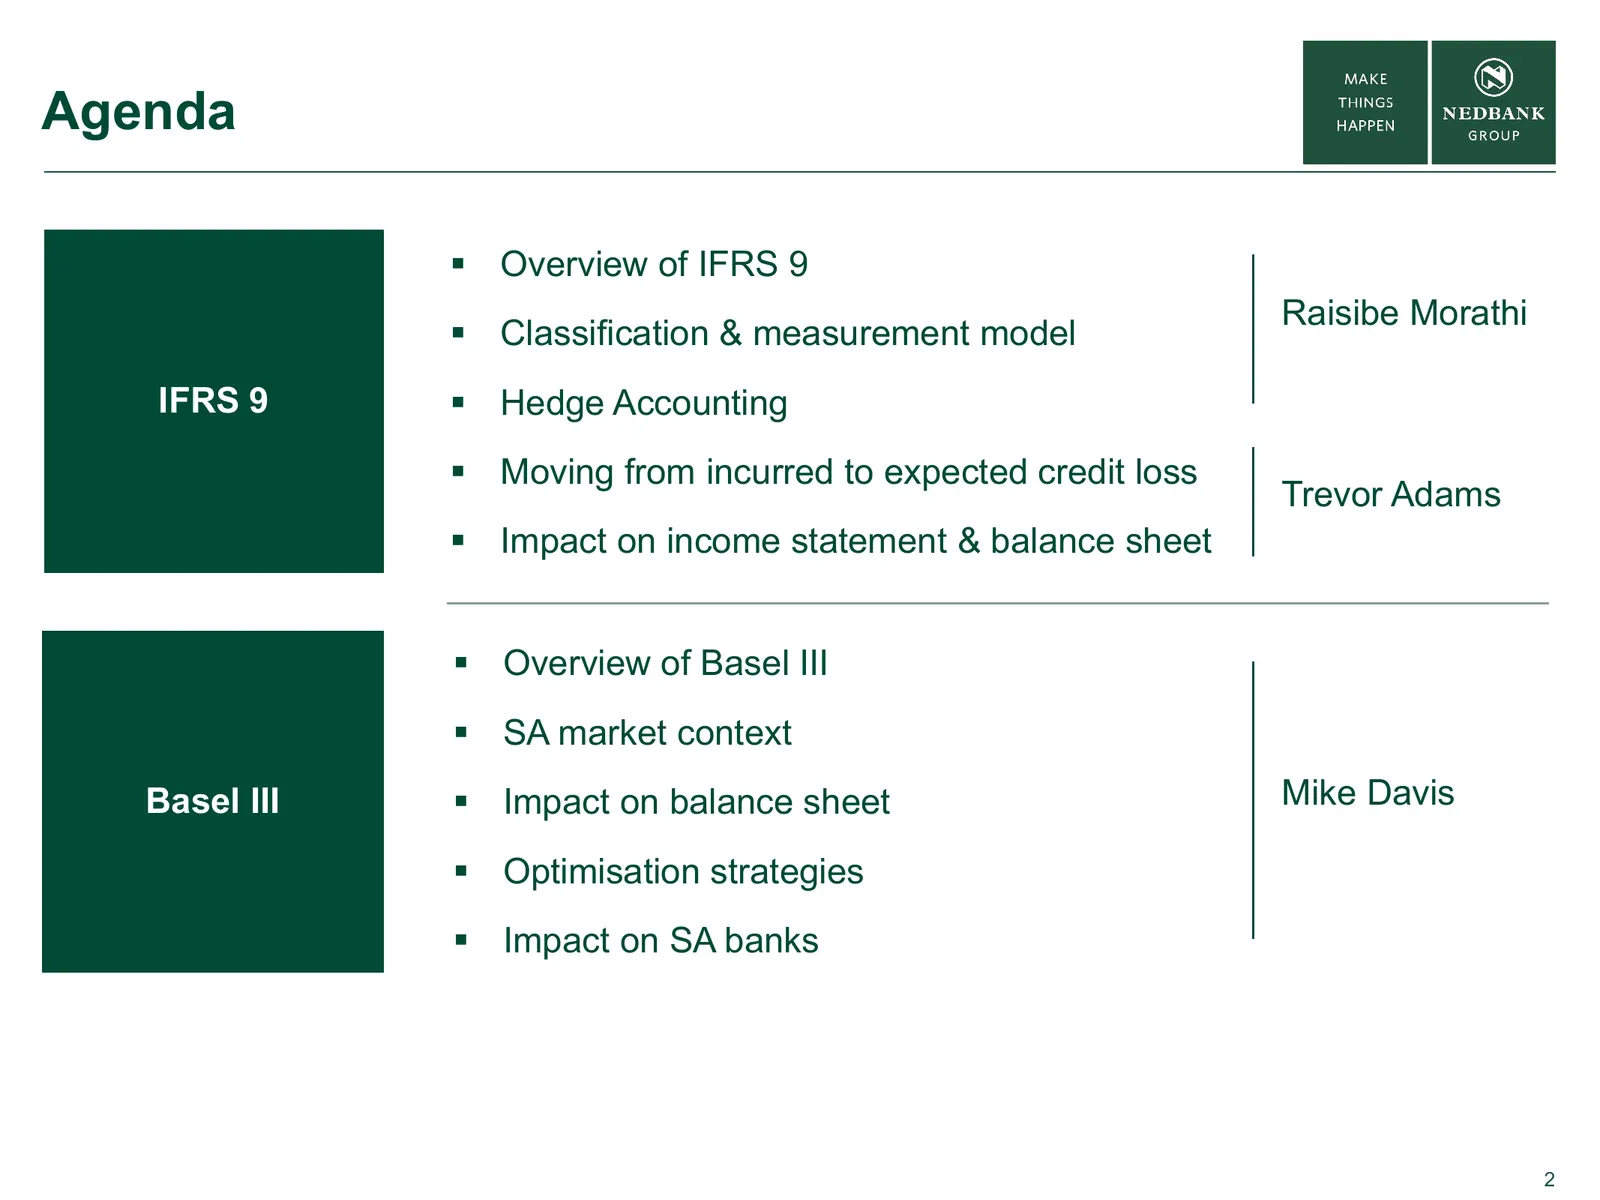
Slide 2: Agenda
Agenda Overview of IFRS 9 Raisibe Morathi Classification & measurement model IFRS 9 Hedge Accounting Moving from incurred to expected credit loss Trevor Adams Impact on income statement & balance sheet Overview of Basel III SA market context Basel III Impact on balance sheet Mike Dav
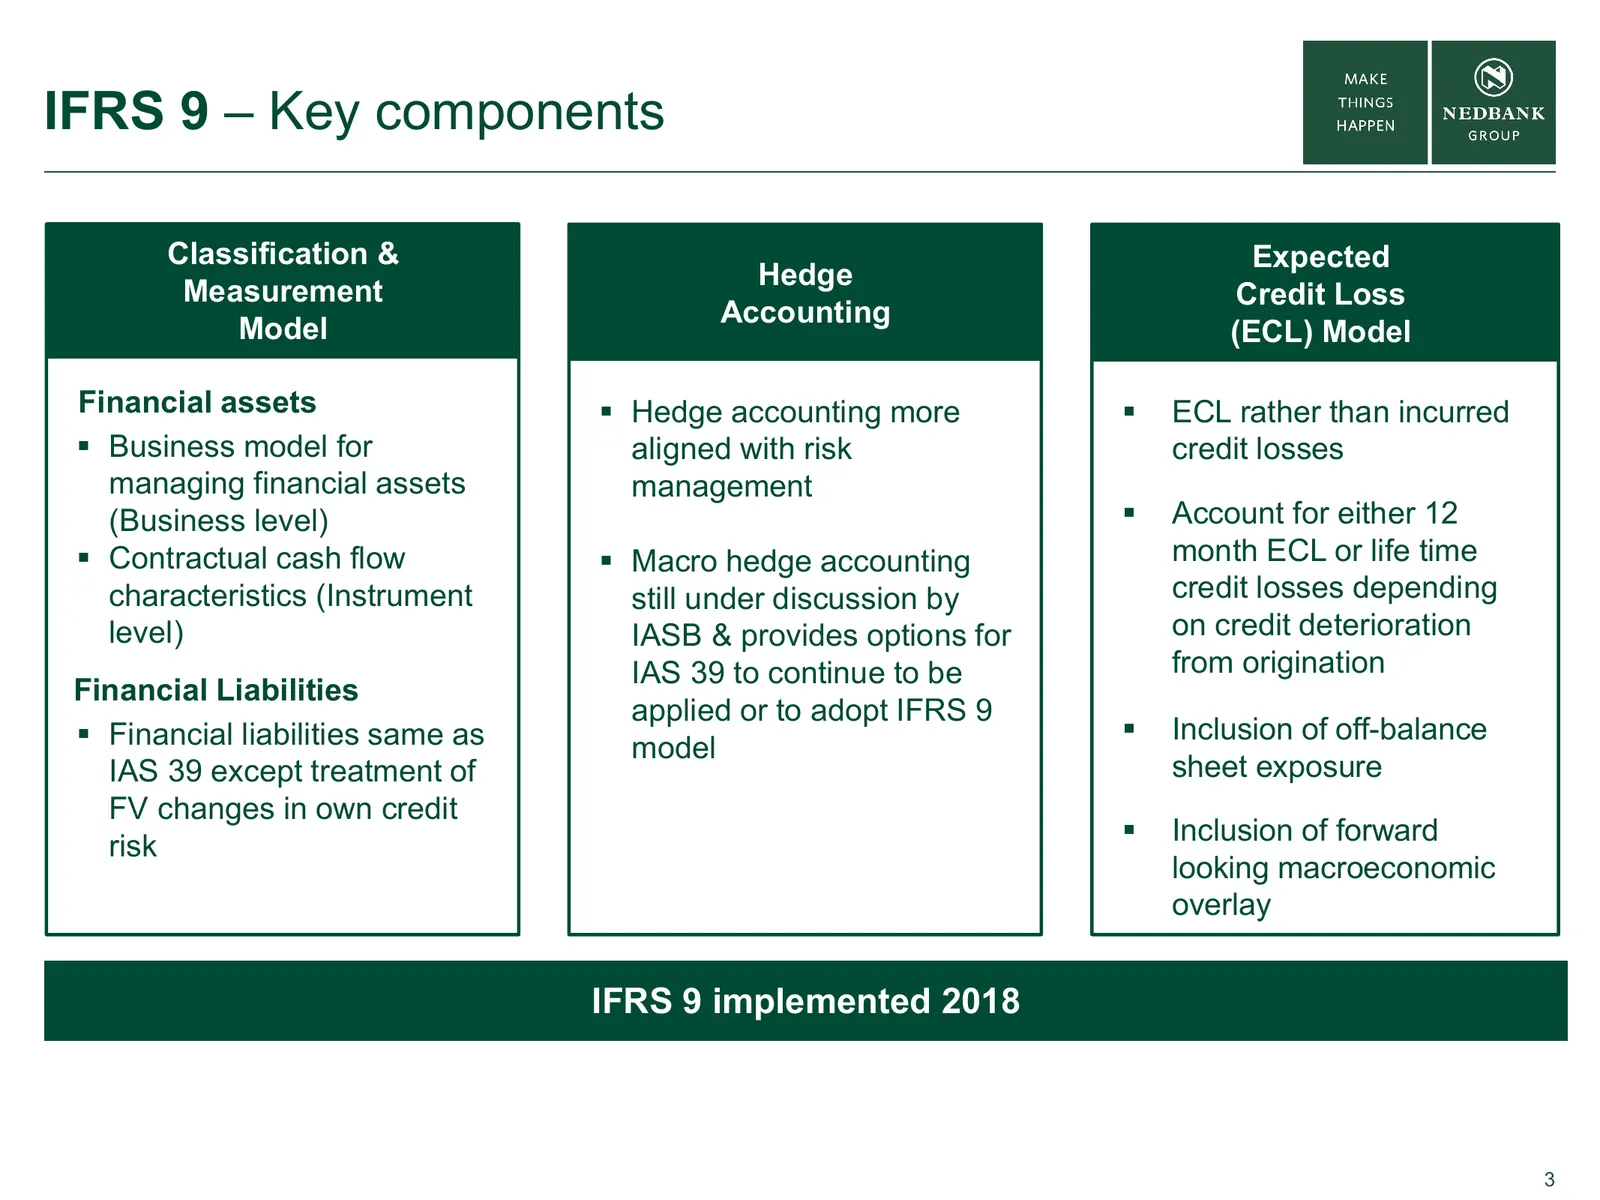
Slide 3: IFRS 9 – Key components
IFRS 9 – Key components Classification&& Classification Expected Expected Hedge Measurement Measurement Hedge CreditLoss Credit Loss Accounting Model Model Accounting (ECL)Model (ECL) Model Financial assets Hedge accounting more ECL rather than incurred Business model for aligned with risk cre
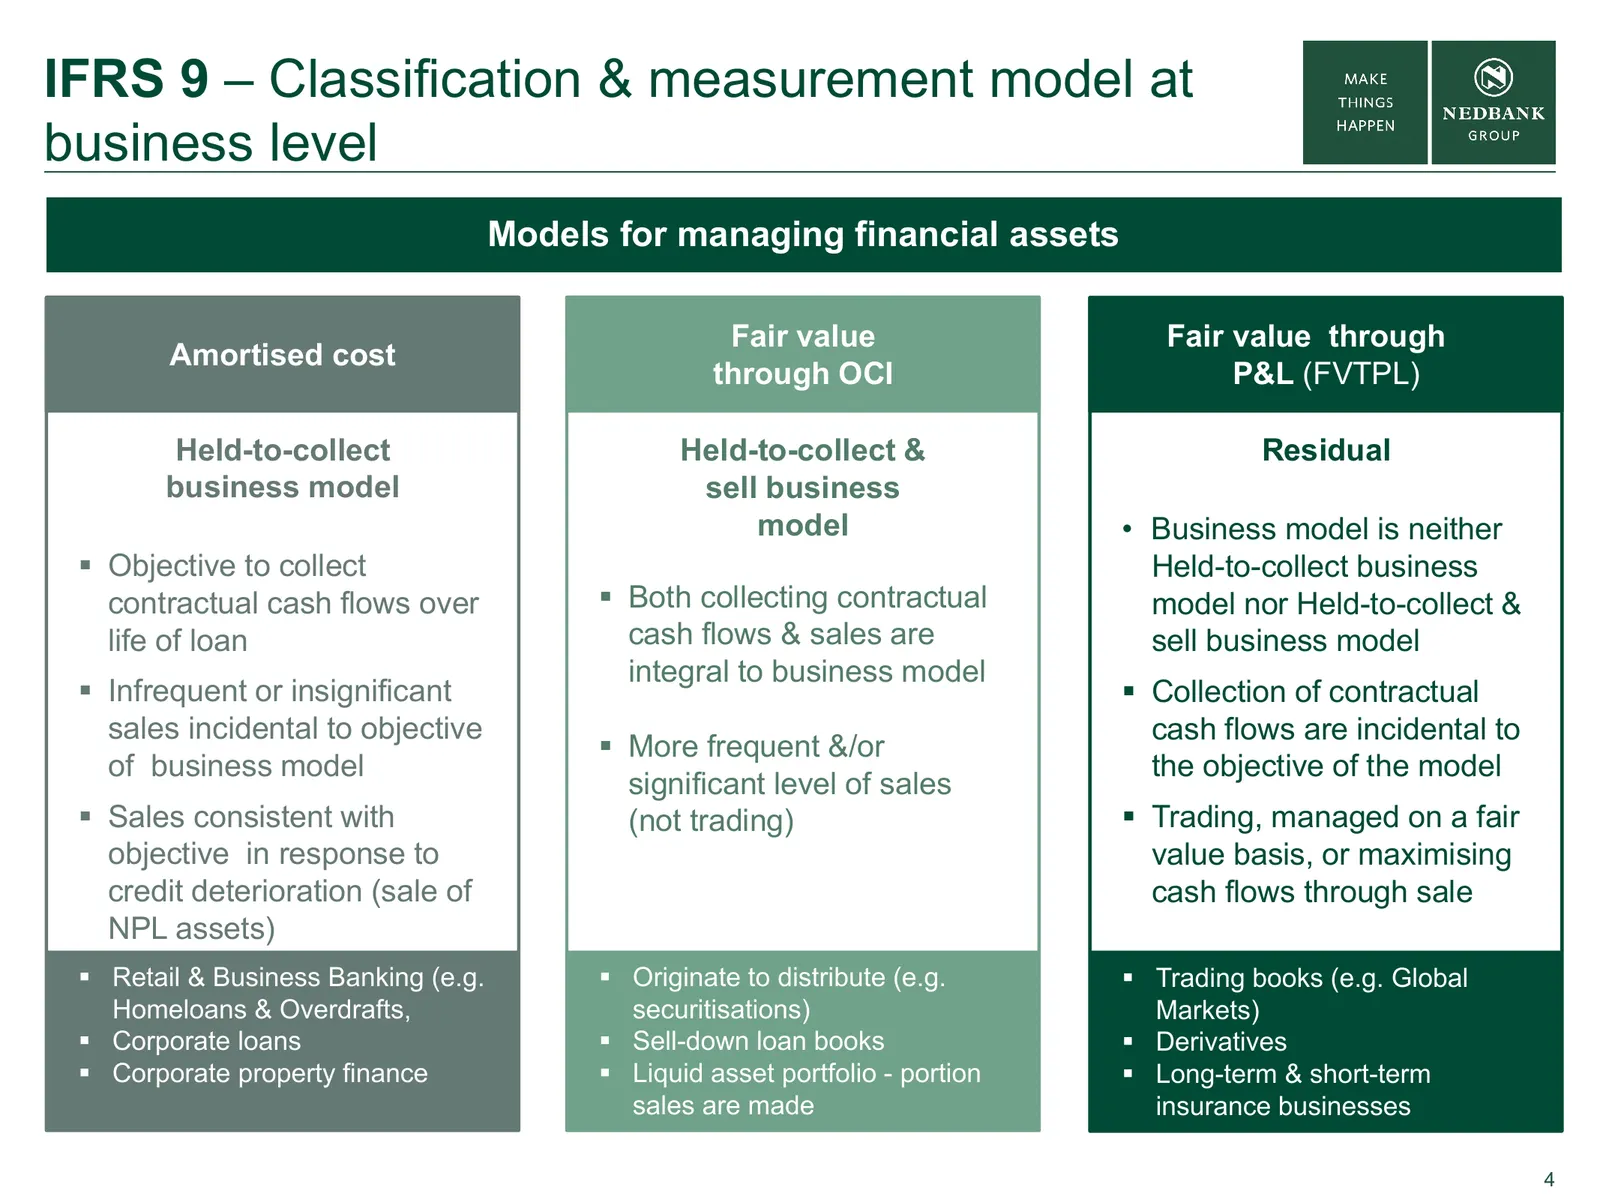
Slide 4: IFRS 9 – Classification & measurement model at business level
IFRS 9 – Classification & measurement model at business level Models for managing financial assets Fair value Fair value through Amortised cost through OCI P&L (FVTPL) Held-to-collect Held-to-collect & Residual business model sell business model • Business model is neither Objective to collect Hel
Slide 5: IFRS 9 – Classification & measurement model at financial instrument level
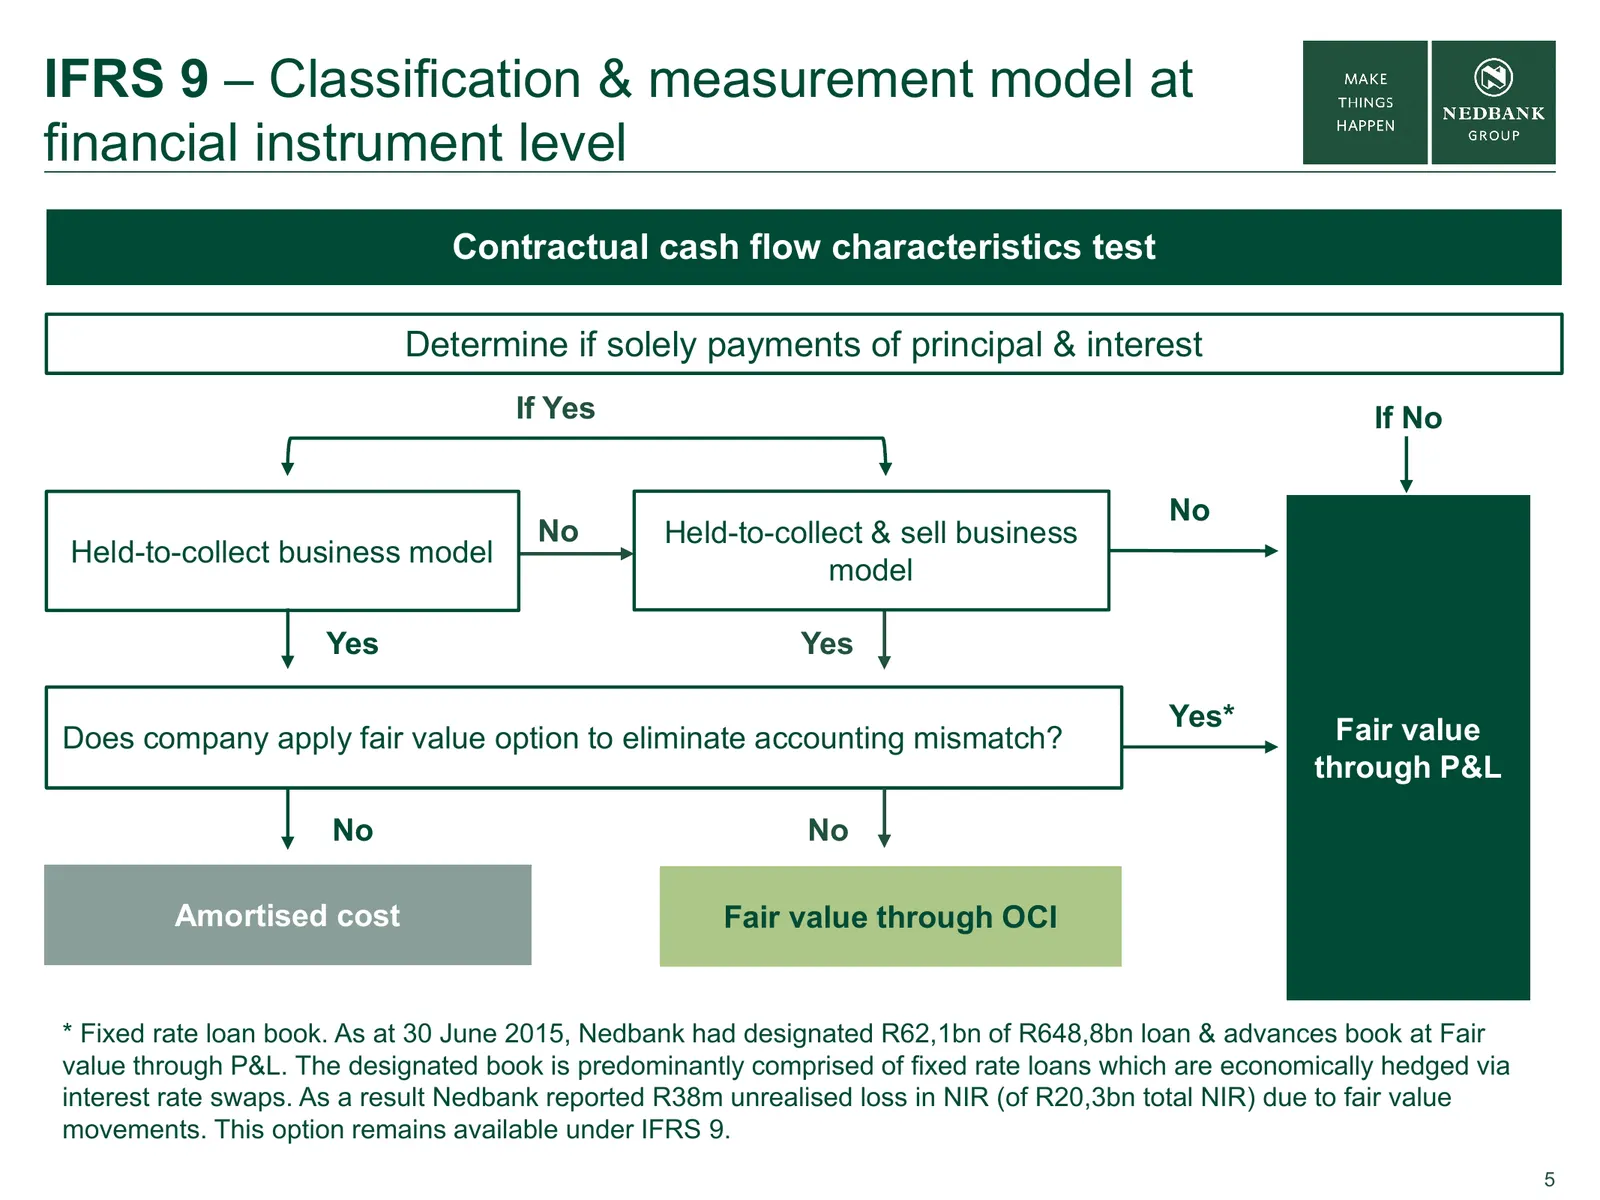
IFRS 9 – Classification & measurement model at financial instrument level Contractual cash flow characteristics test Determine if solely payments of principal & interest If Yes If No No No Held-to-collect & sell business Held-to-collect business model model Yes Yes Yes* Fair value Does company apply
Slide 6: IFRS 9 – Classification & measurement model at financial instrument level
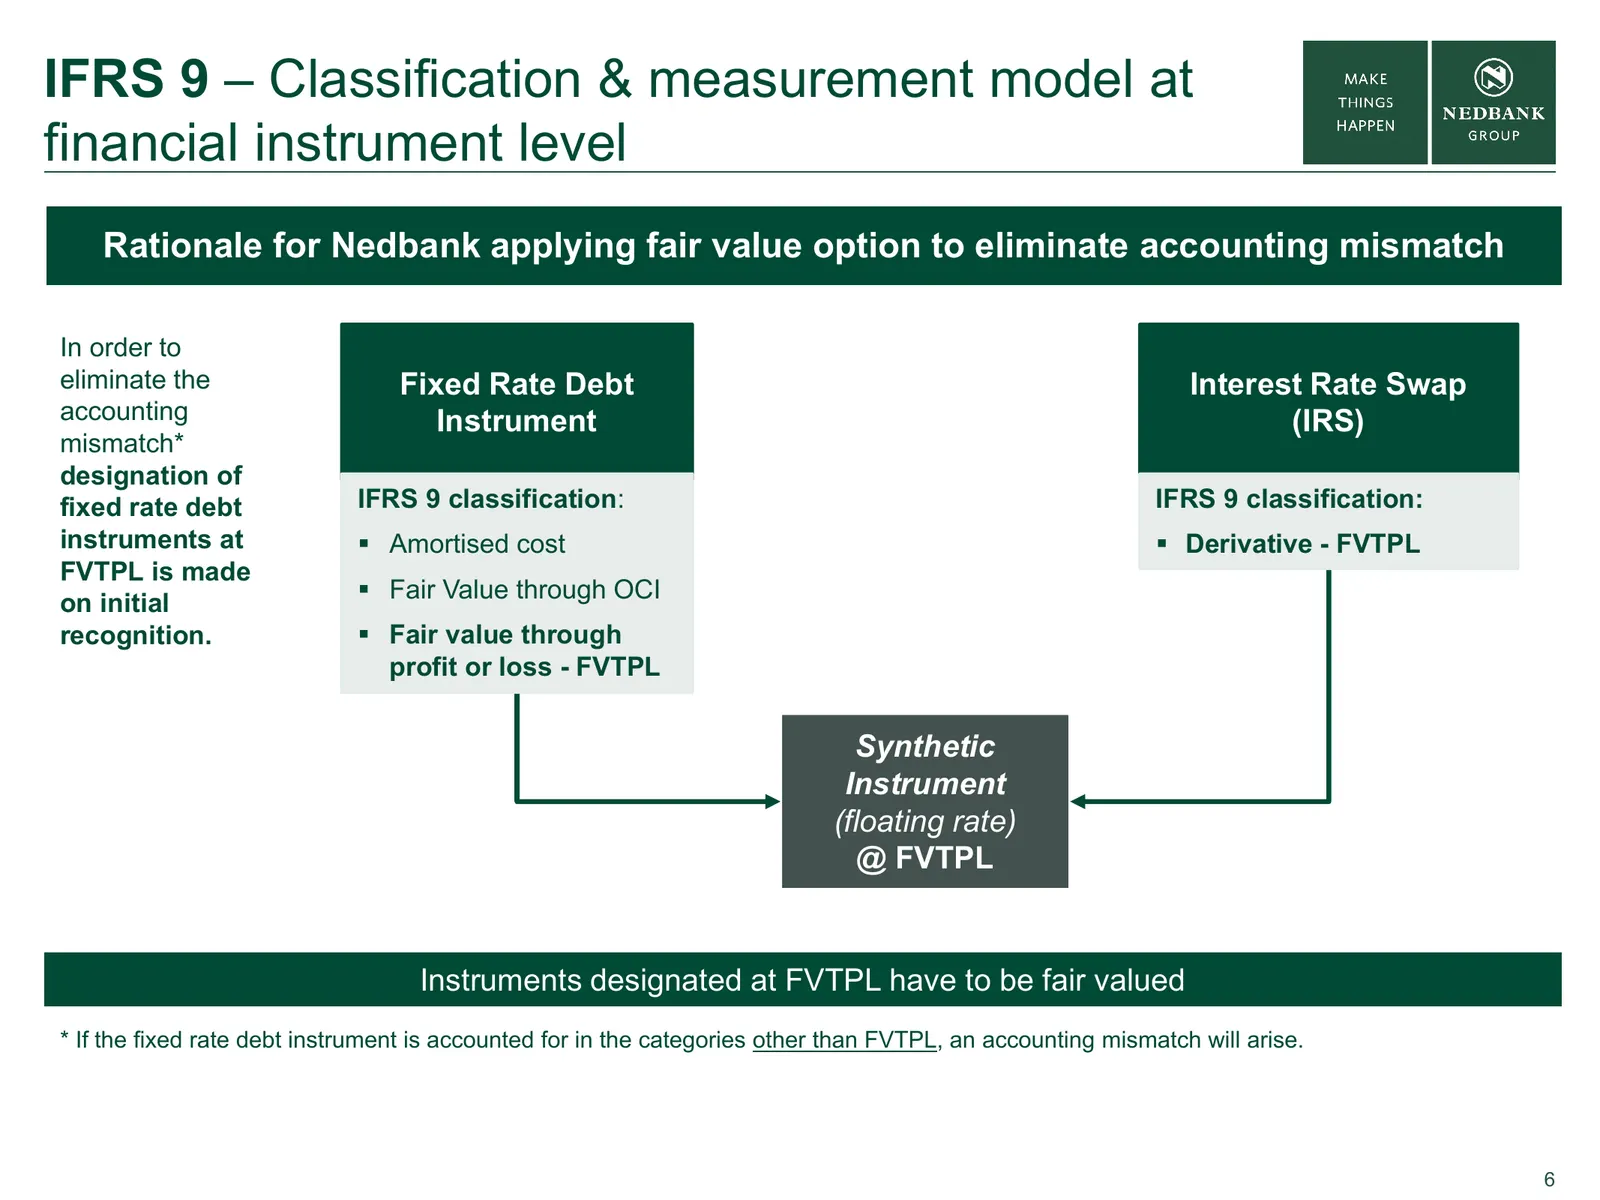
IFRS 9 – Classification & measurement model at financial instrument level Rationale for Nedbank applying fair value option to eliminate accounting mismatch In order to eliminate the Fixed Rate Debt Interest Rate Swap accounting Instrument (IRS) mismatch* designation of fixed rate debt IFRS 9 classif
Slide 7: IFRS 9 – Financial liabilities
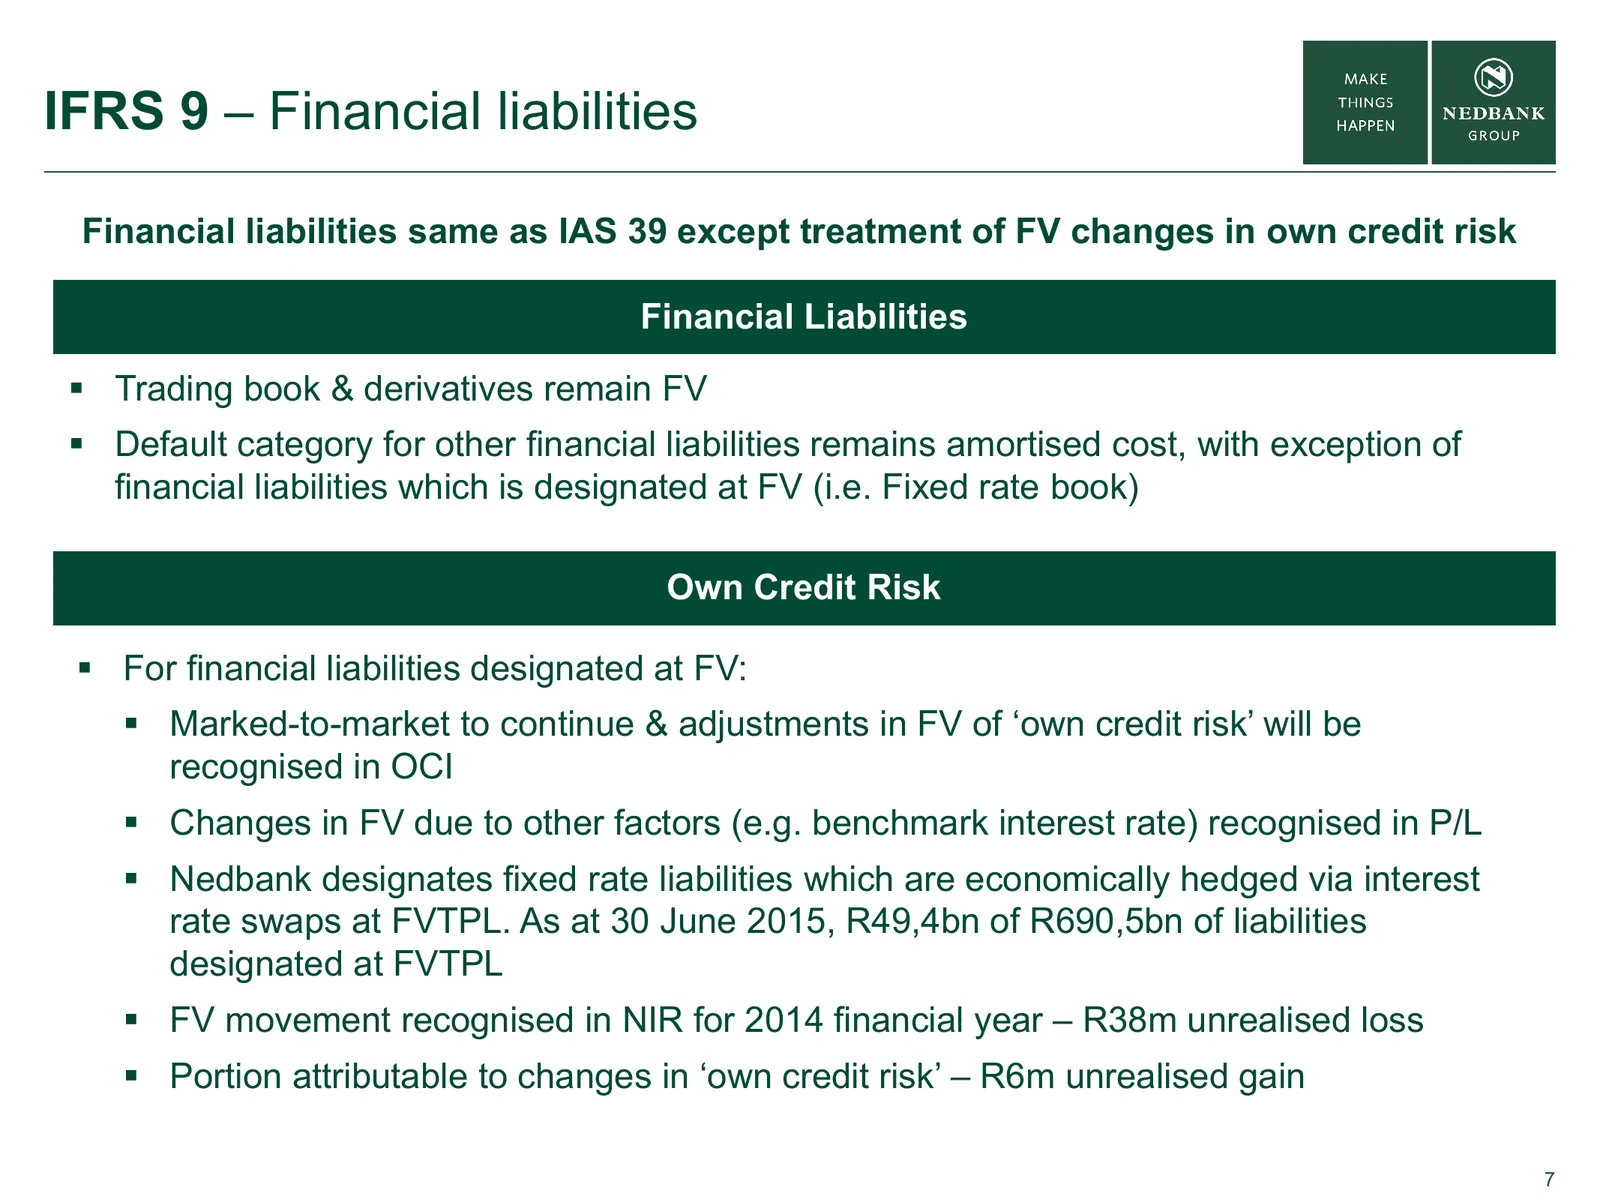
IFRS 9 – Financial liabilities Financial liabilities same as IAS 39 except treatment of FV changes Nedbank inprice share own(Rand) credit risk Financial Liabilities Trading book & derivatives remain FV Default category for other financial liabilities remains amortised cost, with exception of fin
Slide 8: IFRS 9 – Hedge accounting
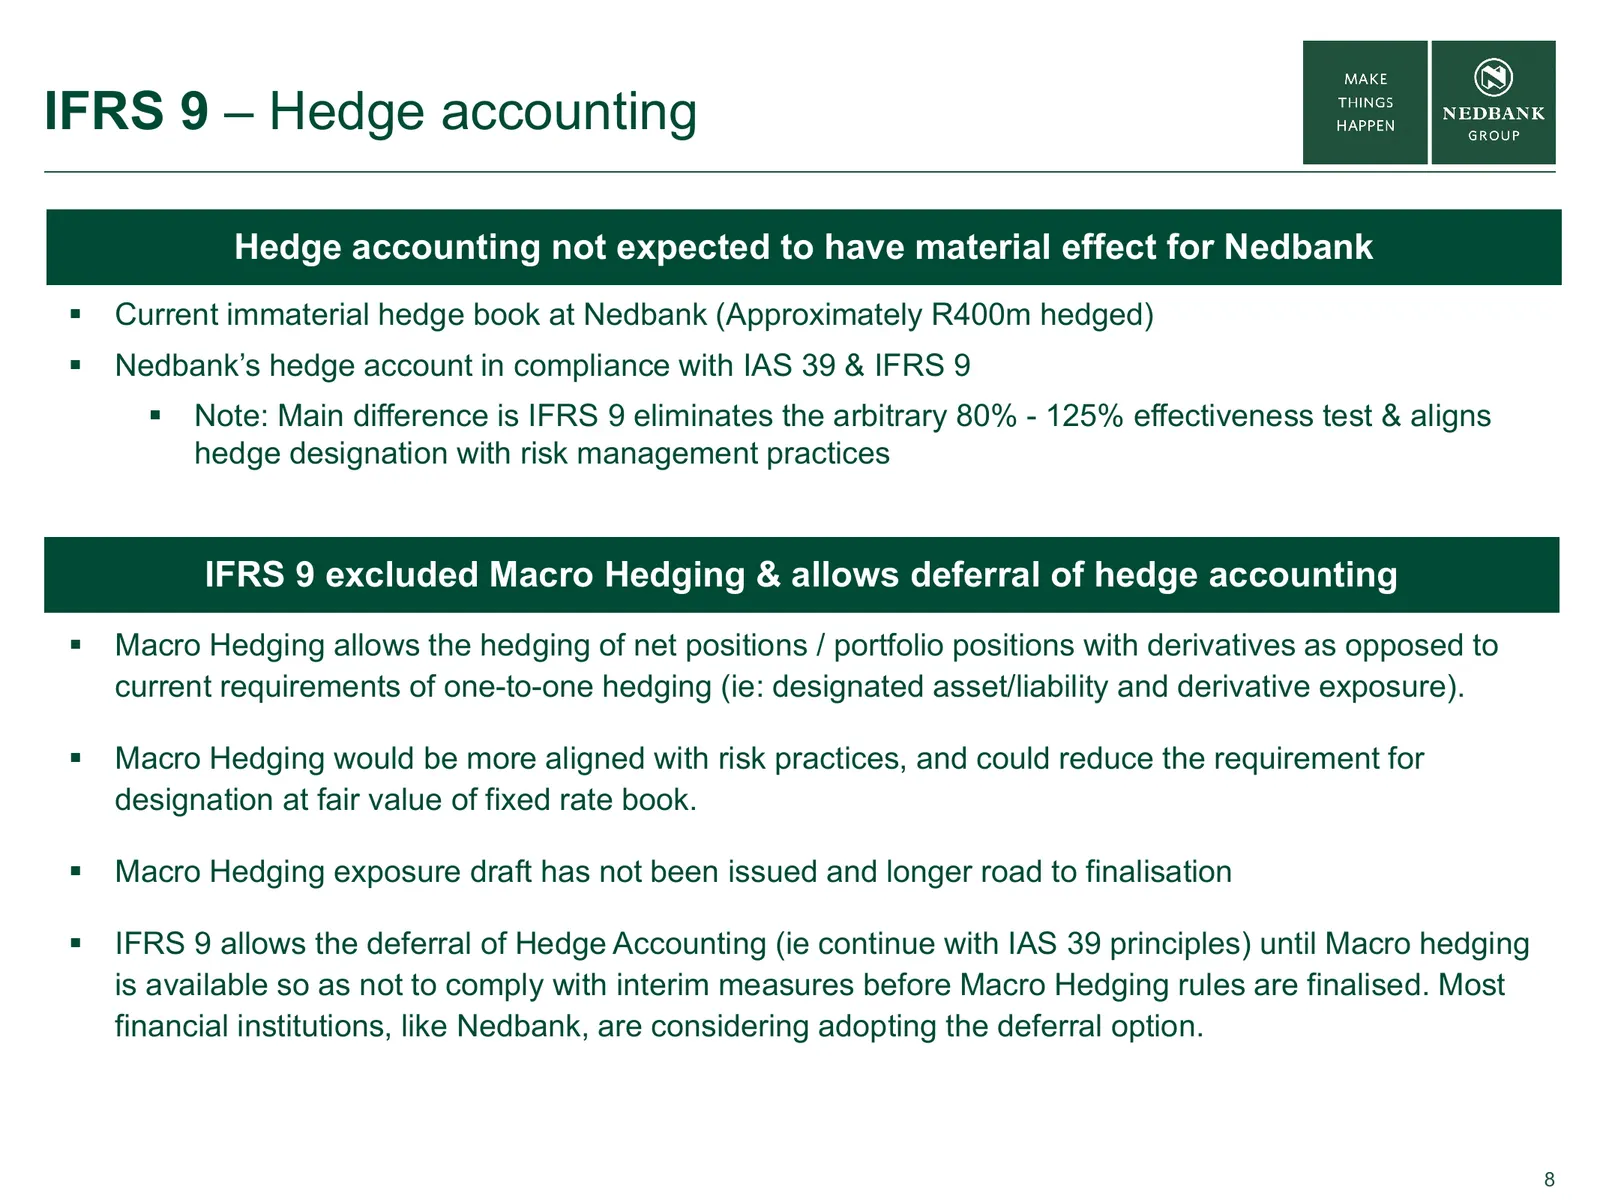
IFRS 9 – Hedge accounting Hedge accounting not expected to have material effect share Nedbank for Nedbank price (Rand) Current immaterial hedge book at Nedbank (Approximately R400m hedged) Nedbank’s hedge account in compliance with IAS 39 & IFRS 9 Note: Main difference is IFRS 9 eliminates the
Slide 9: IFRS 9 – Disclosure
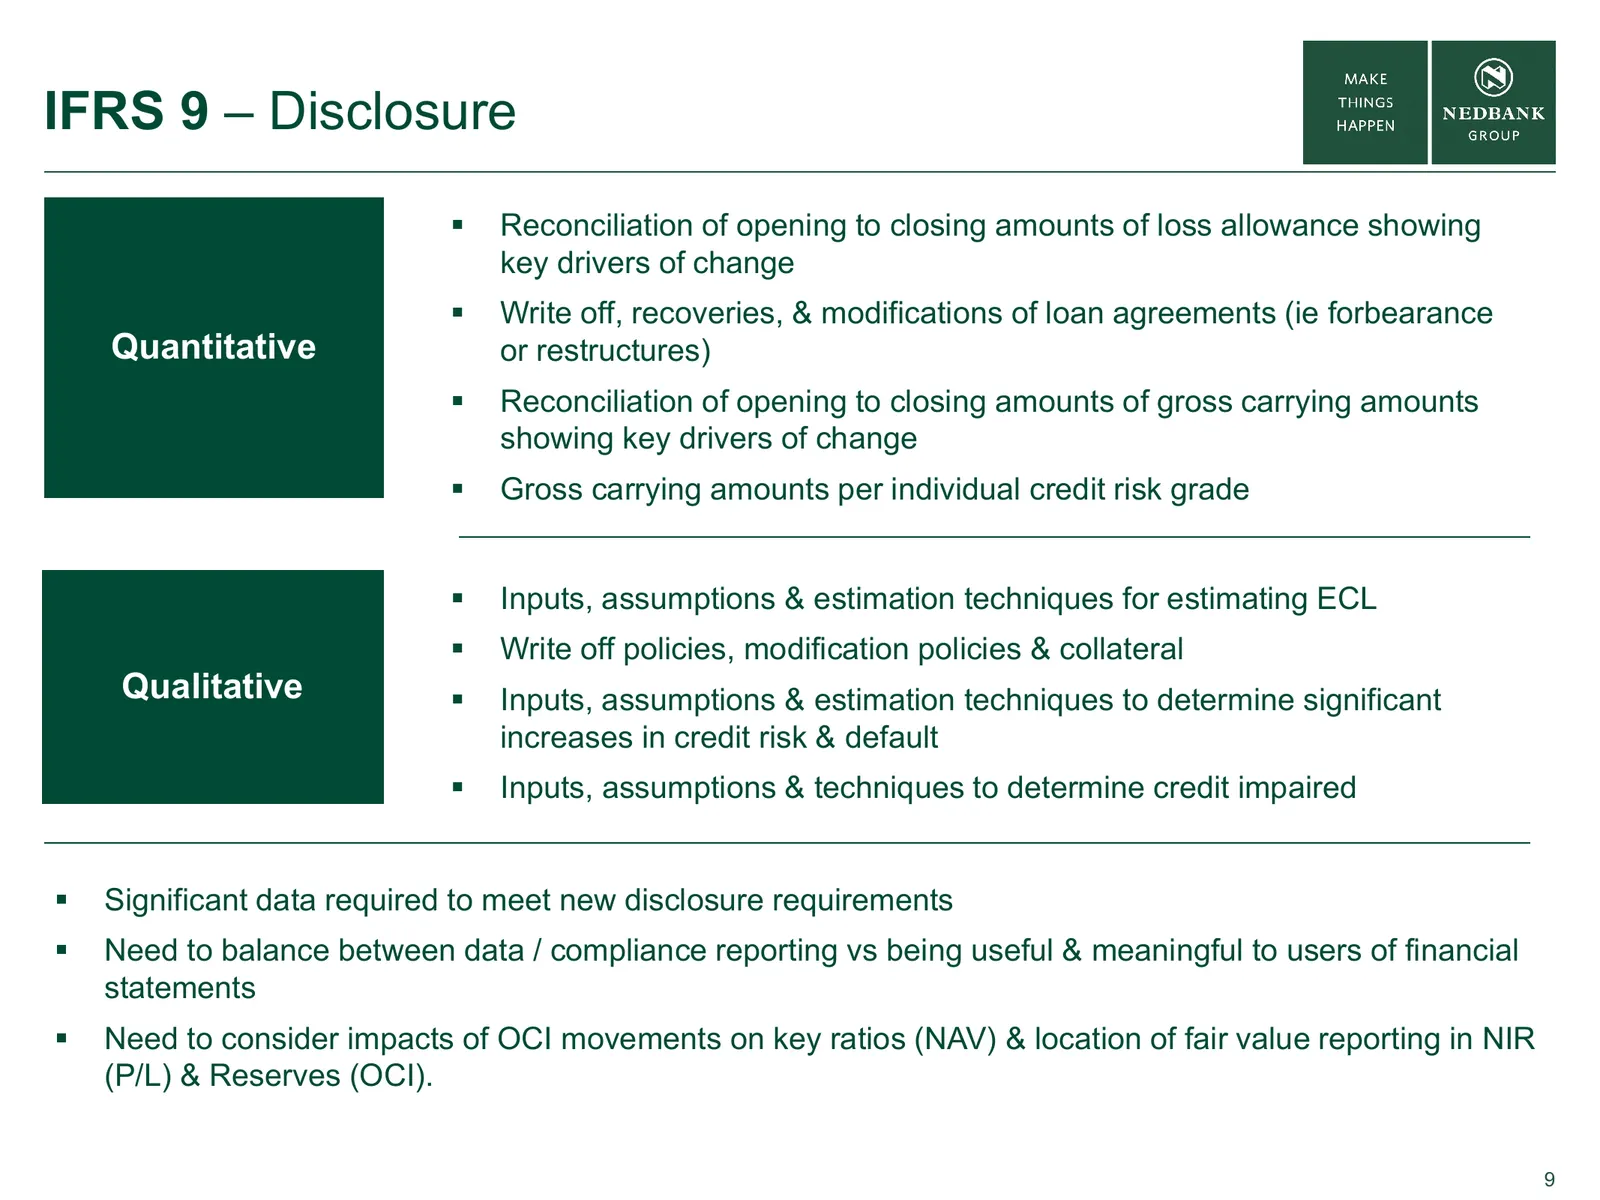
IFRS 9 – Disclosure Reconciliation of opening to closing amounts of loss allowance showing Nedbank share price (Rand) key drivers of change Write off, recoveries, & modifications of loan agreements (ie forbearance Quantitative or restructures) Reconciliation of opening to closing amounts of gr
Slide 10: IFRS 9 – Alignment to regulatory guidelines
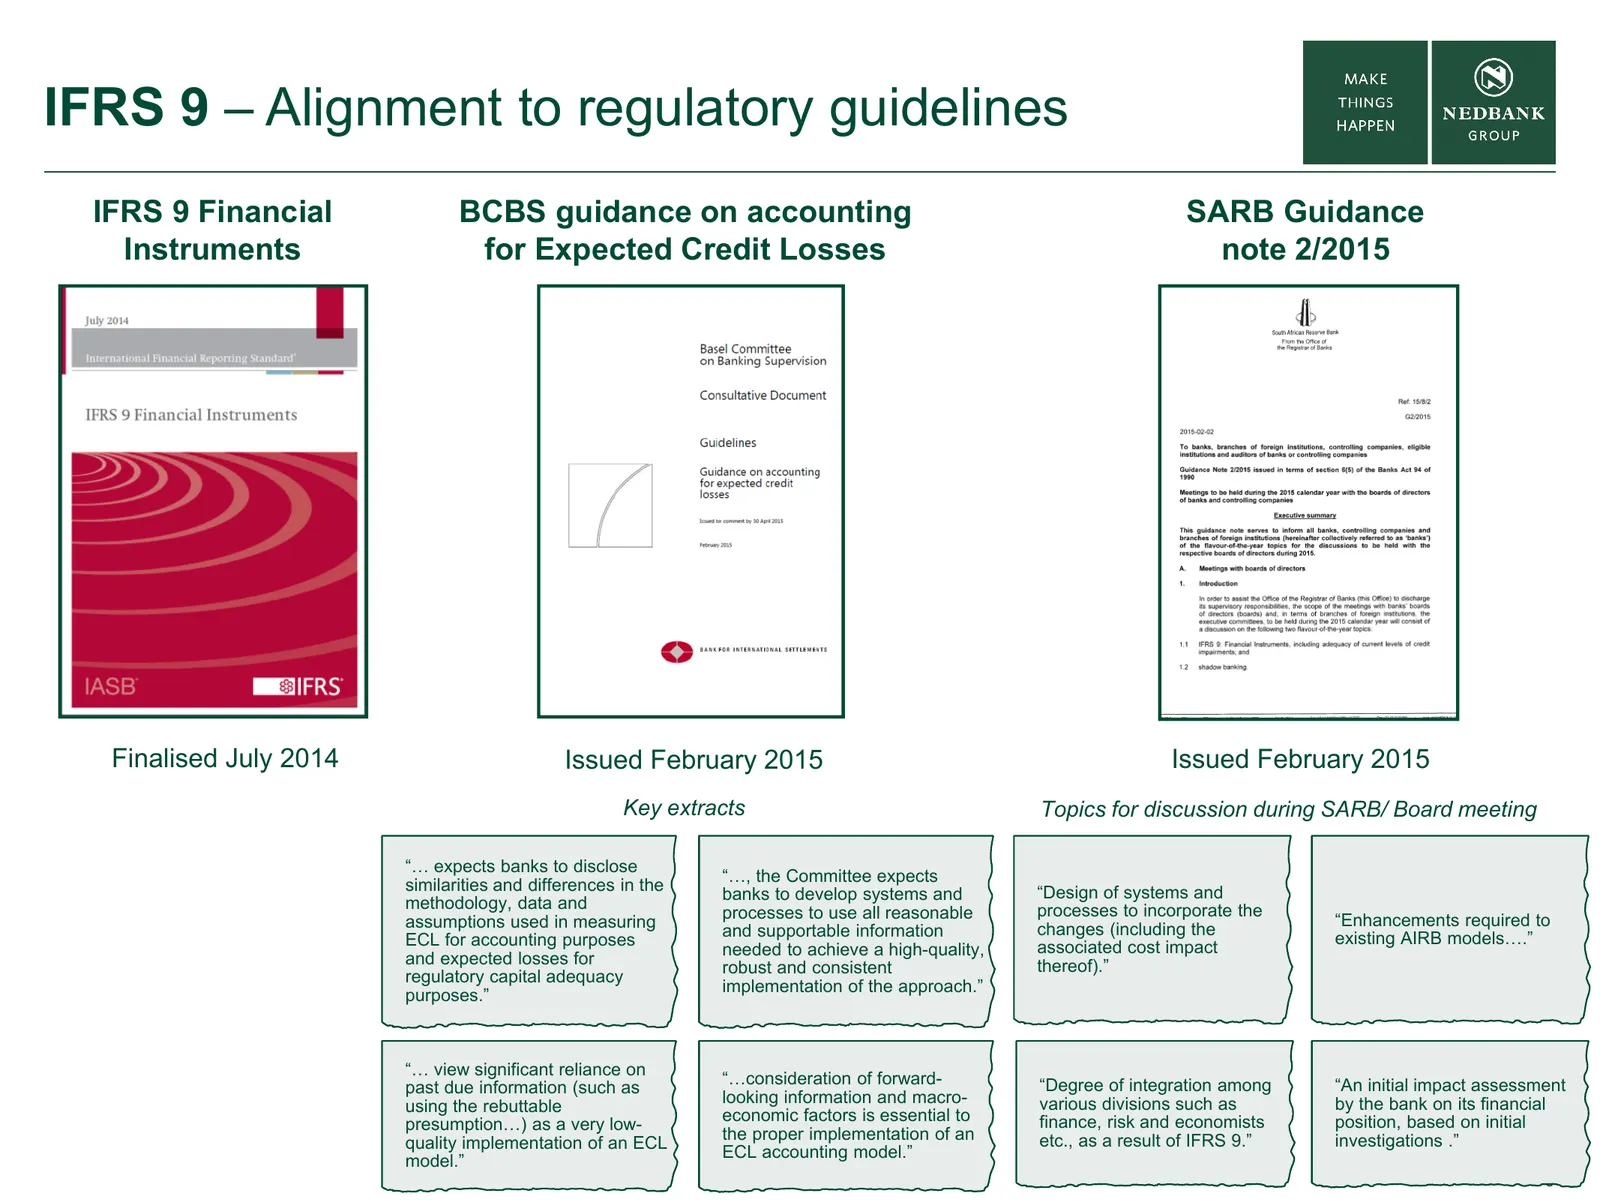
IFRS 9 – Alignment to regulatory guidelines IFRS 9 Financial BCBS guidance on accounting SARB Guidance Instruments for Expected Credit Losses note 2/2015 Finalised July 2014 Issued February 2015 Issued February 2015 Key extracts Topics for discussion during SARB/ Board meeting “… expects banks to di
Slide 11: IFRS 9 – Alignment to regulatory guidelines
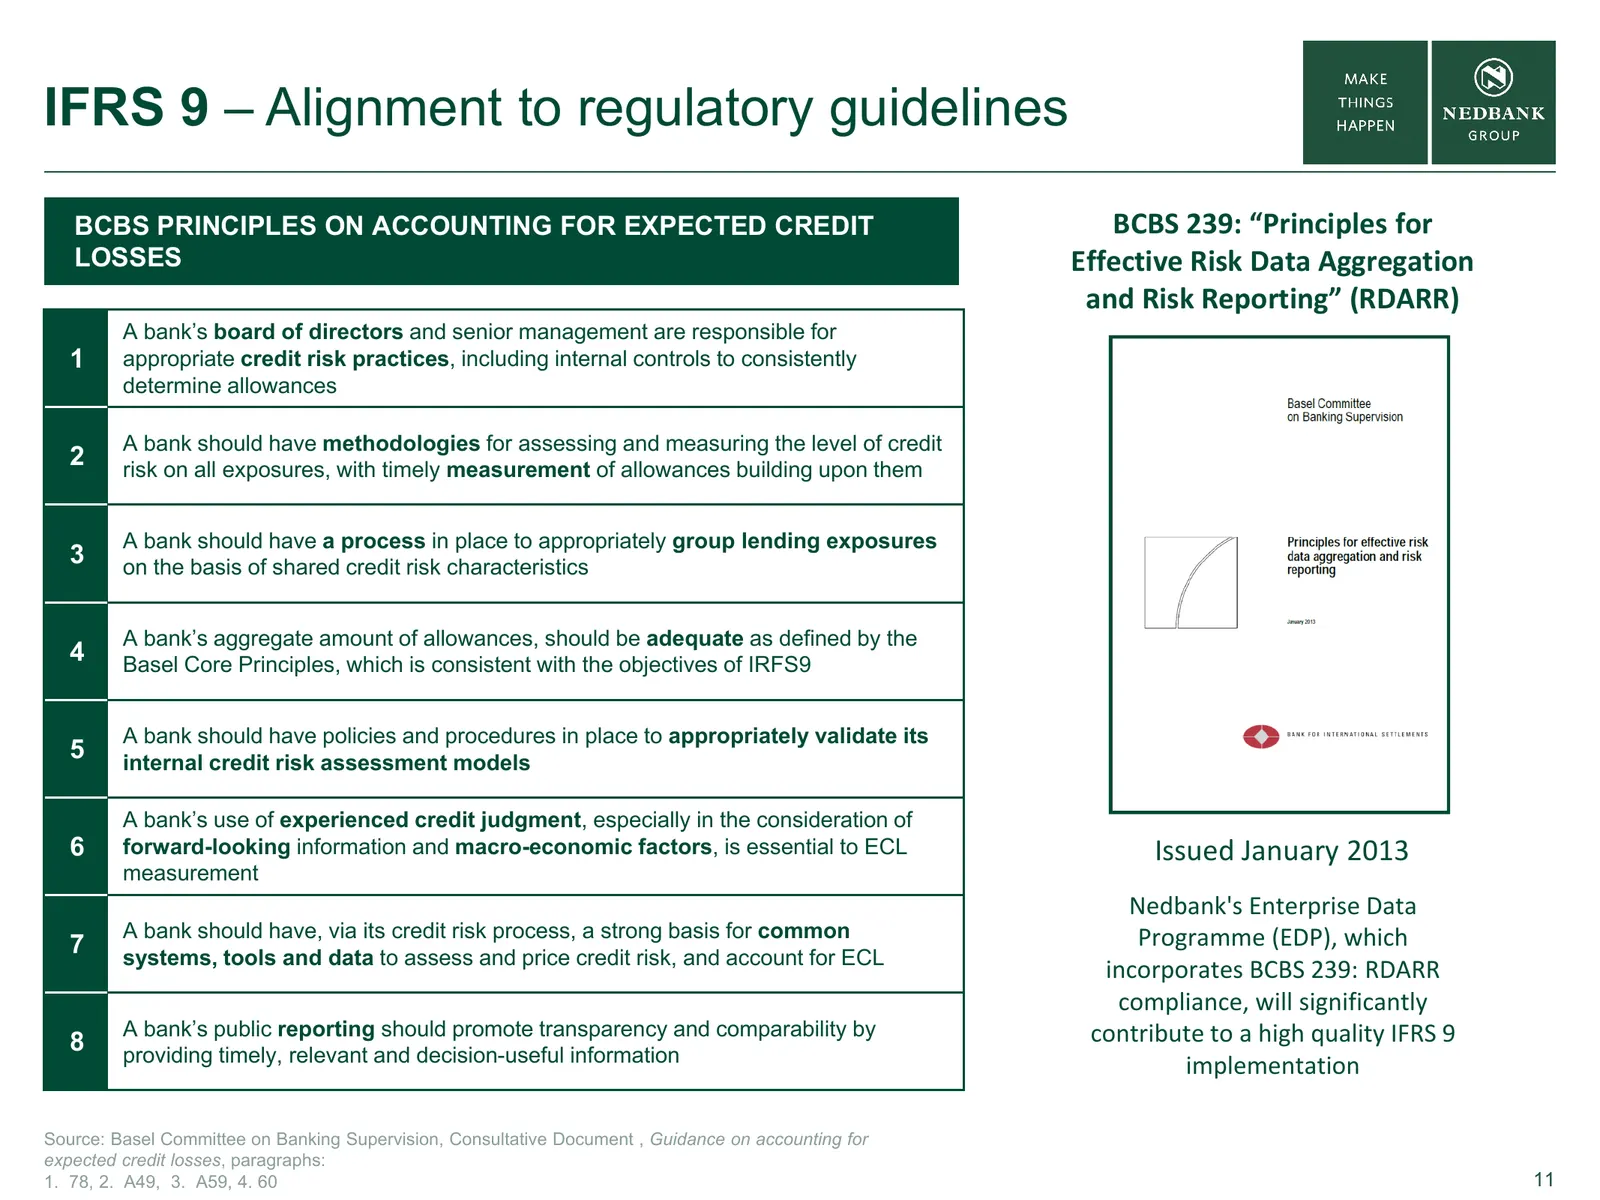
IFRS 9 – Alignment to regulatory guidelines BCBS PRINCIPLES ON ACCOUNTING FOR EXPECTED CREDIT BCBS 239: “Principles for LOSSES Effective Risk Data Aggregation and Risk Reporting” (RDARR) A bank’s board of directors and senior management are responsible for 1 appropriate credit risk practices, includ
Slide 12: IFRS 9 – Group wide programme across all entities
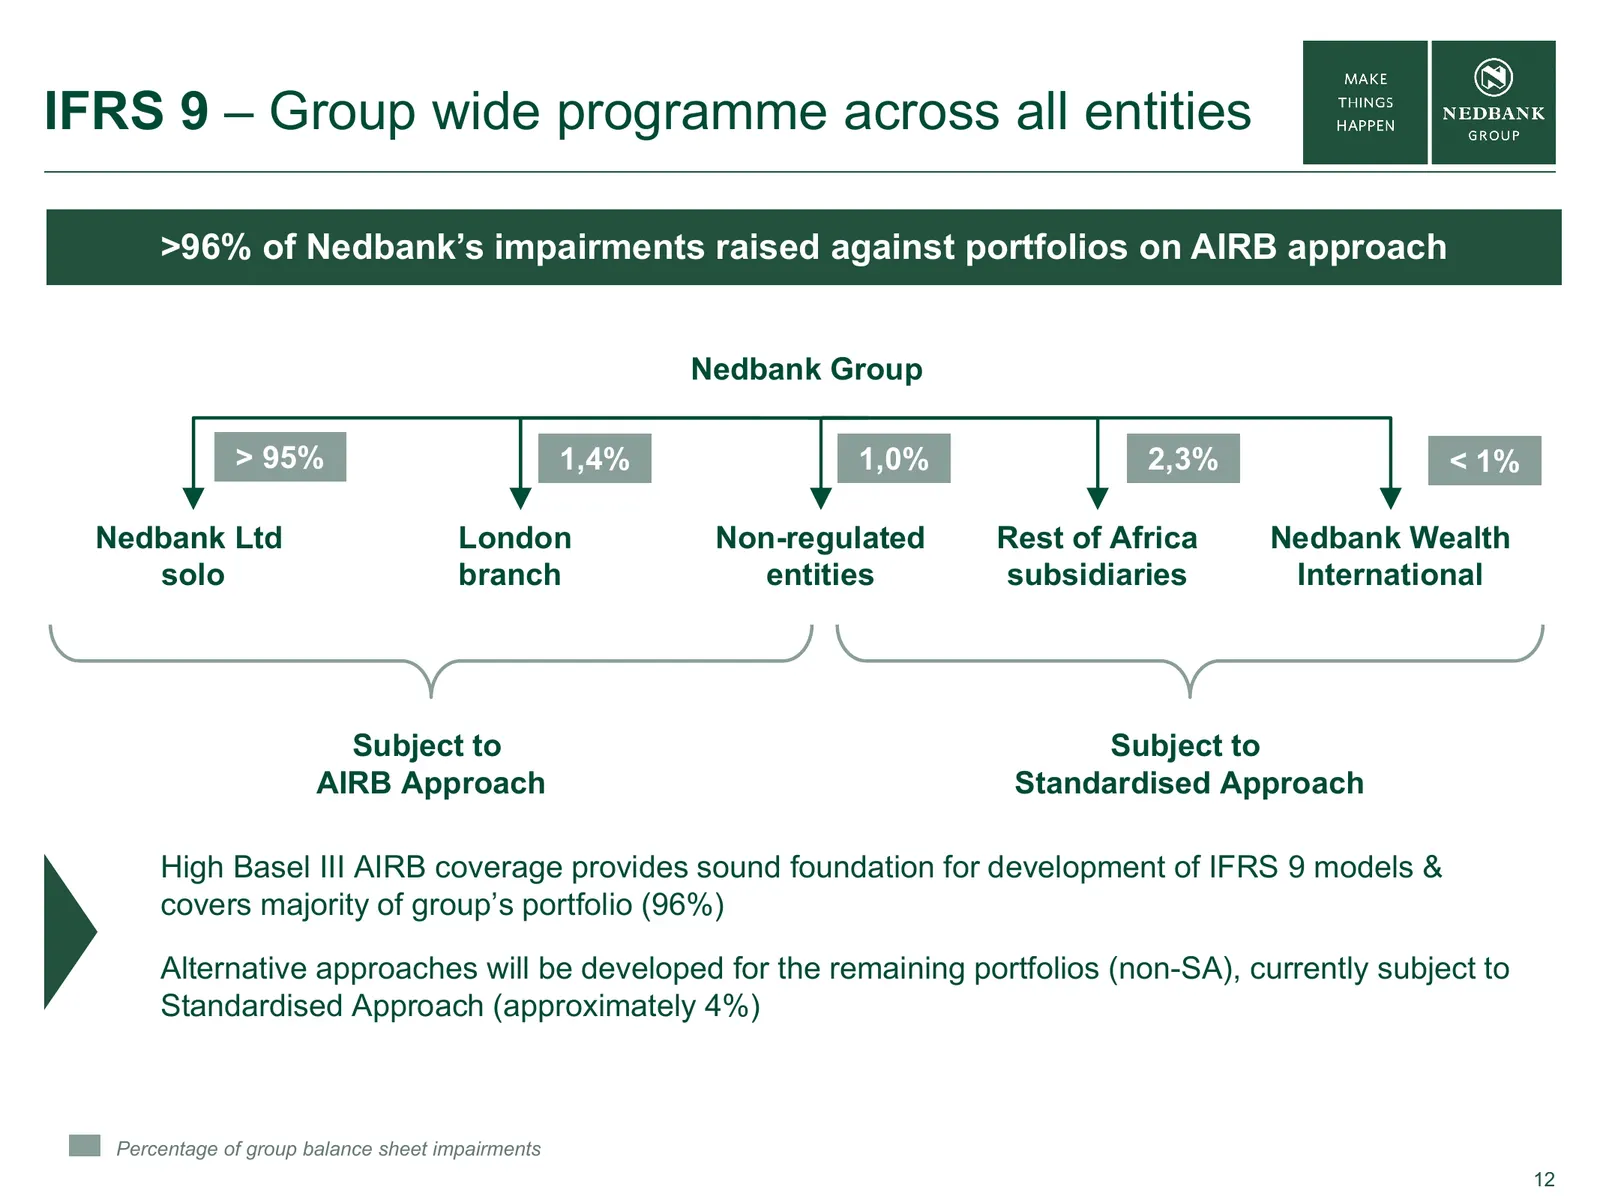
IFRS 9 – Group wide programme across all entities >96% of Nedbank’s impairments raised against portfolios on AIRB approach Nedbank Group > 95% 1,4% 1,0% 2,3% < 1% Nedbank Ltd London Non-regulated Rest of Africa Nedbank Wealth solo branch entities subsidiaries International Subject to Subject to AIRB
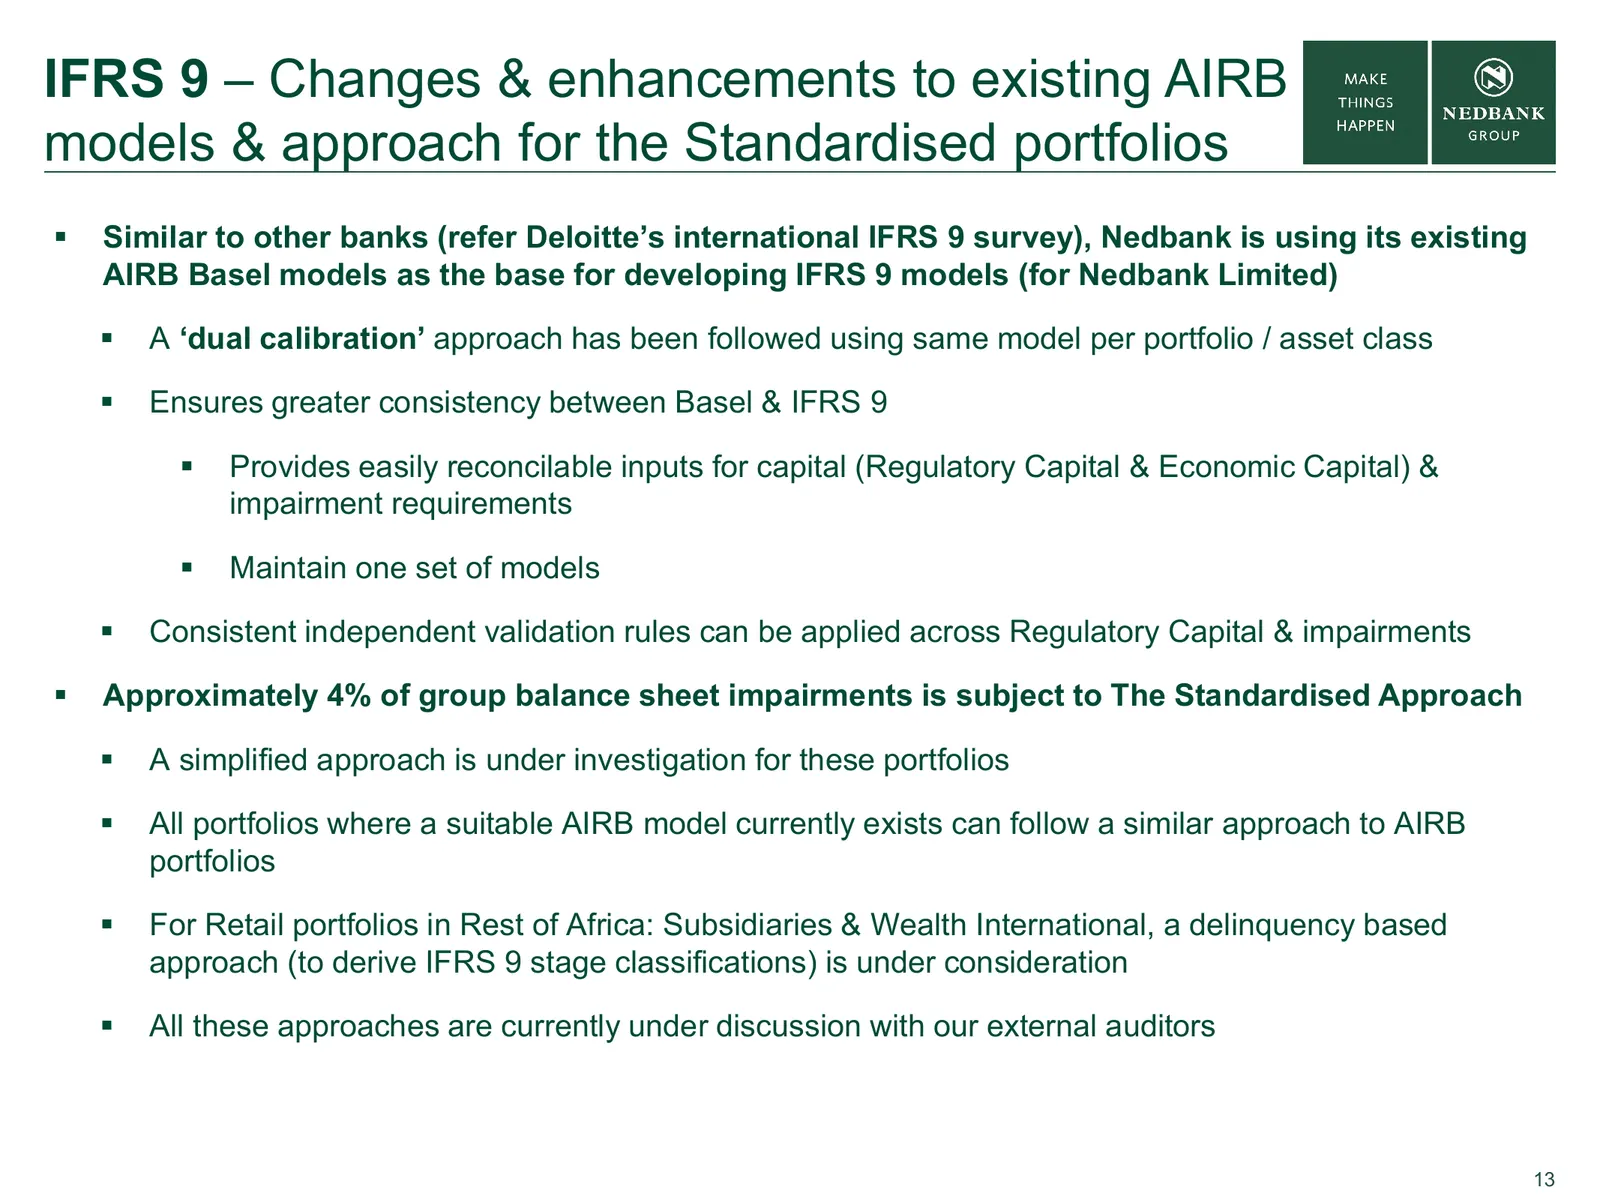
Slide 13: Changes & enhancements to existing AIRB models
IFRS 9 – Changes & enhancements to existing AIRB models & approach for the Standardised portfolios Similar to other banks (refer Deloitte’s international IFRS 9 survey), Nedbank is using its existing AIRB Basel models as the base for developing IFRS 9 models (for Nedbank Limited) A ‘dual calibra
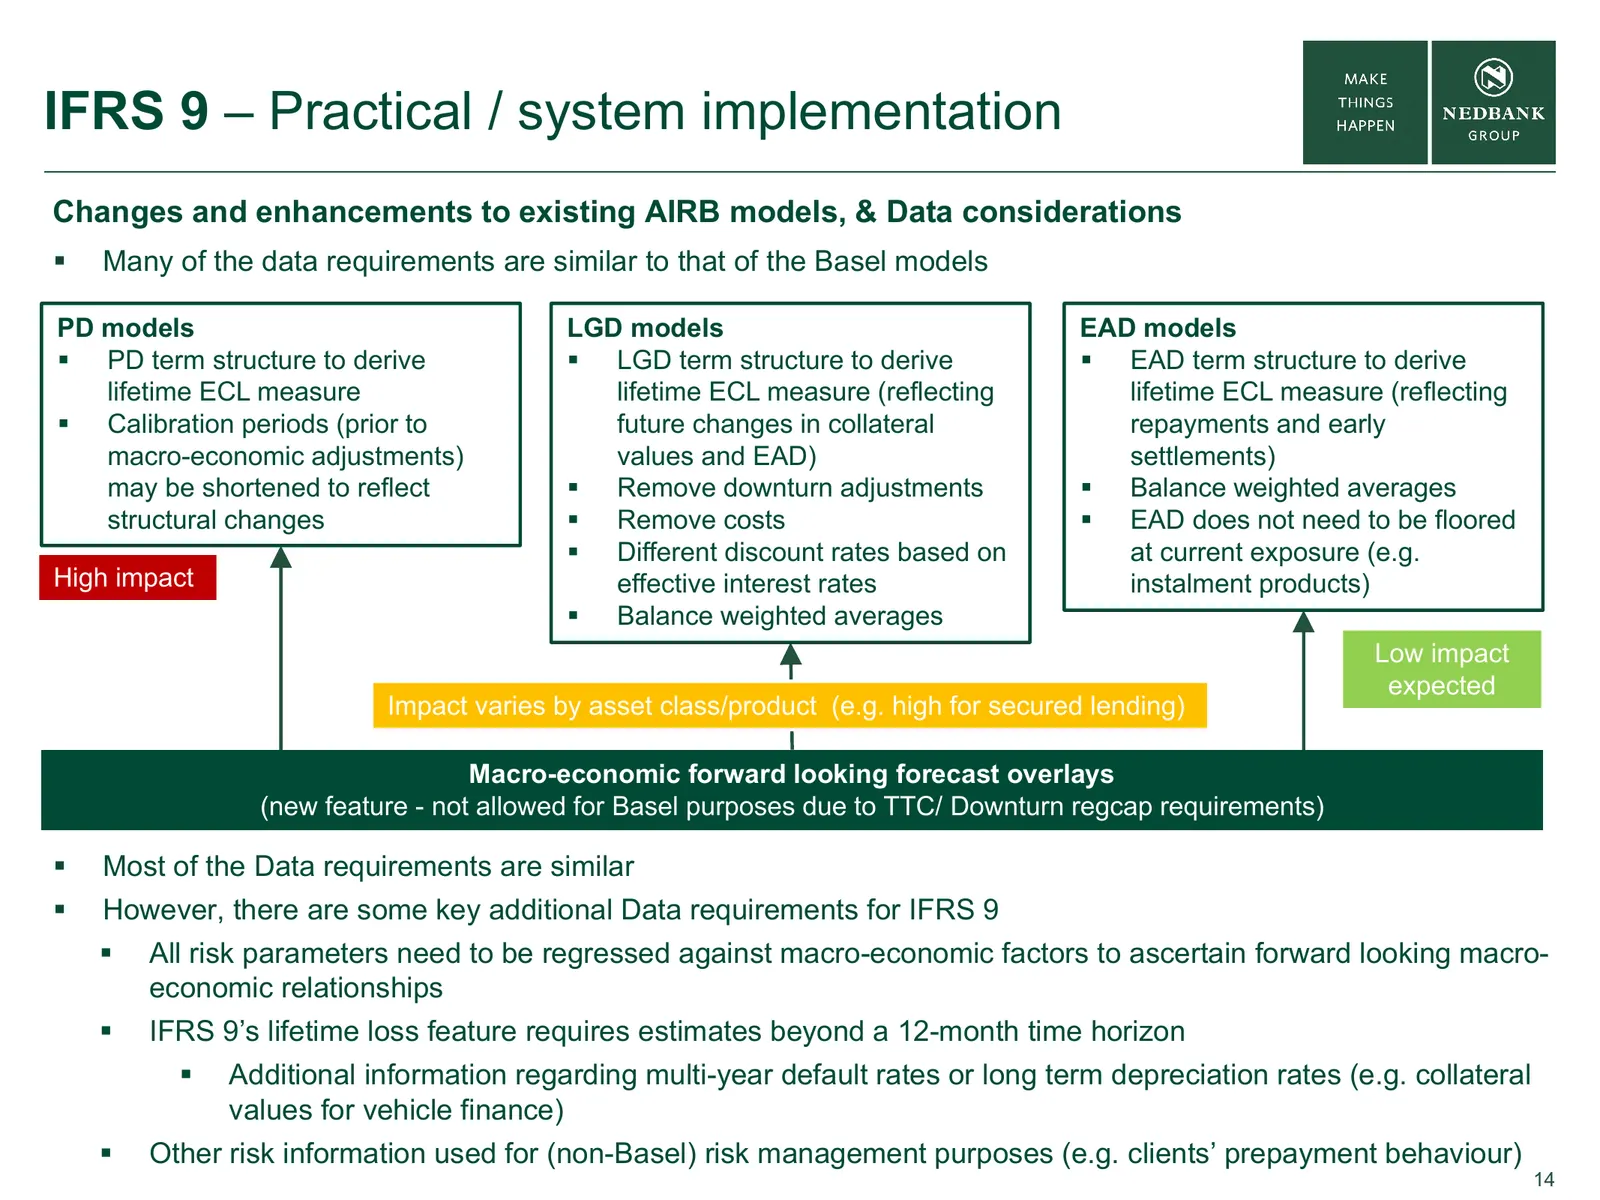
Slide 14: IFRS 9 – Practical / system implementation
IFRS 9 – Practical / system implementation Changes and enhancements to existing AIRB models, & Data considerations Many of the data requirements are similar to that of the Basel models PD models LGD models EAD models PD term structure to derive LGD term structure to derive EAD term structure
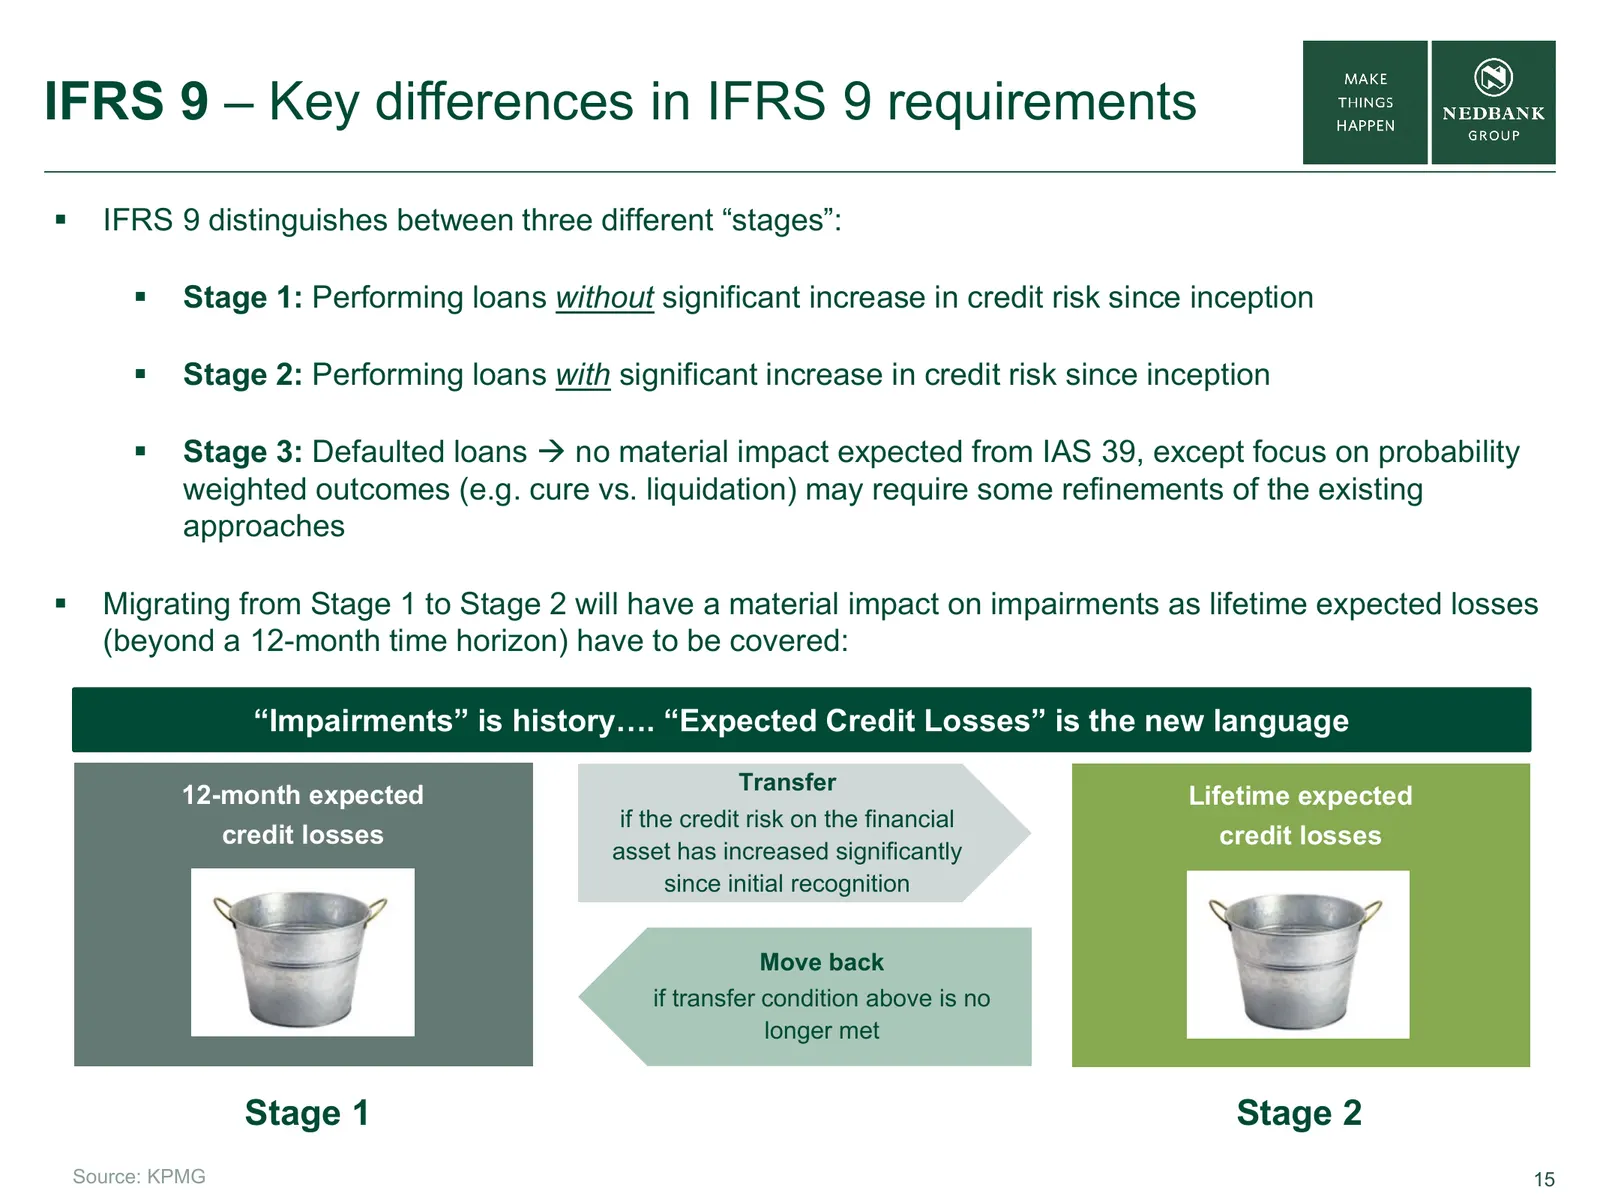
Slide 15: IFRS 9 – Key differences in IFRS 9 requirements
IFRS 9 – Key differences in IFRS 9 requirements IFRS 9 distinguishes between three different “stages”: Stage 1: Performing loans without significant increase in credit risk since inception Stage 2: Performing loans with significant increase in credit risk since inception Stage 3: Defaulted l
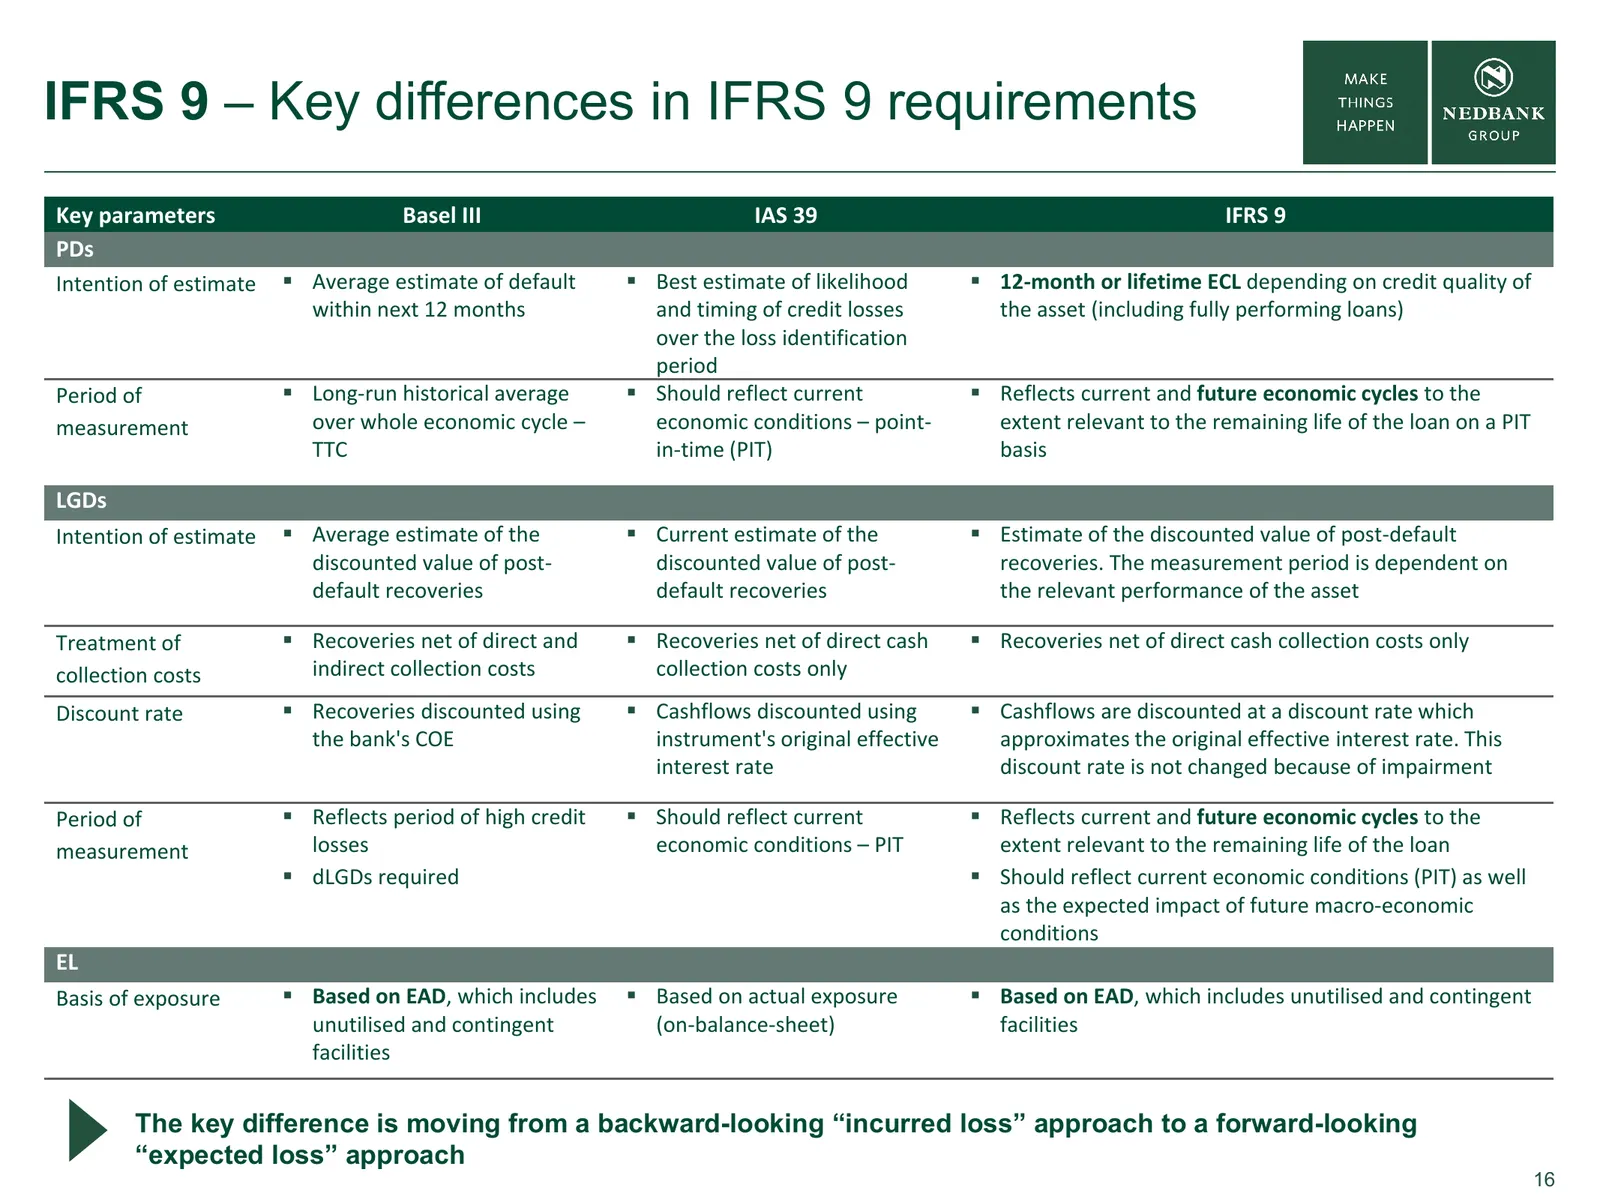
Slide 16: IFRS 9 – Key differences in IFRS 9 requirements
IFRS 9 – Key differences in IFRS 9 requirements Key parameters Basel III IAS 39 IFRS 9 PDs Intention of estimate Average estimate of default Best estimate of likelihood 12‐month or lifetime ECL depending on credit quality of within next 12 months and timing of credit losses the asset (includin
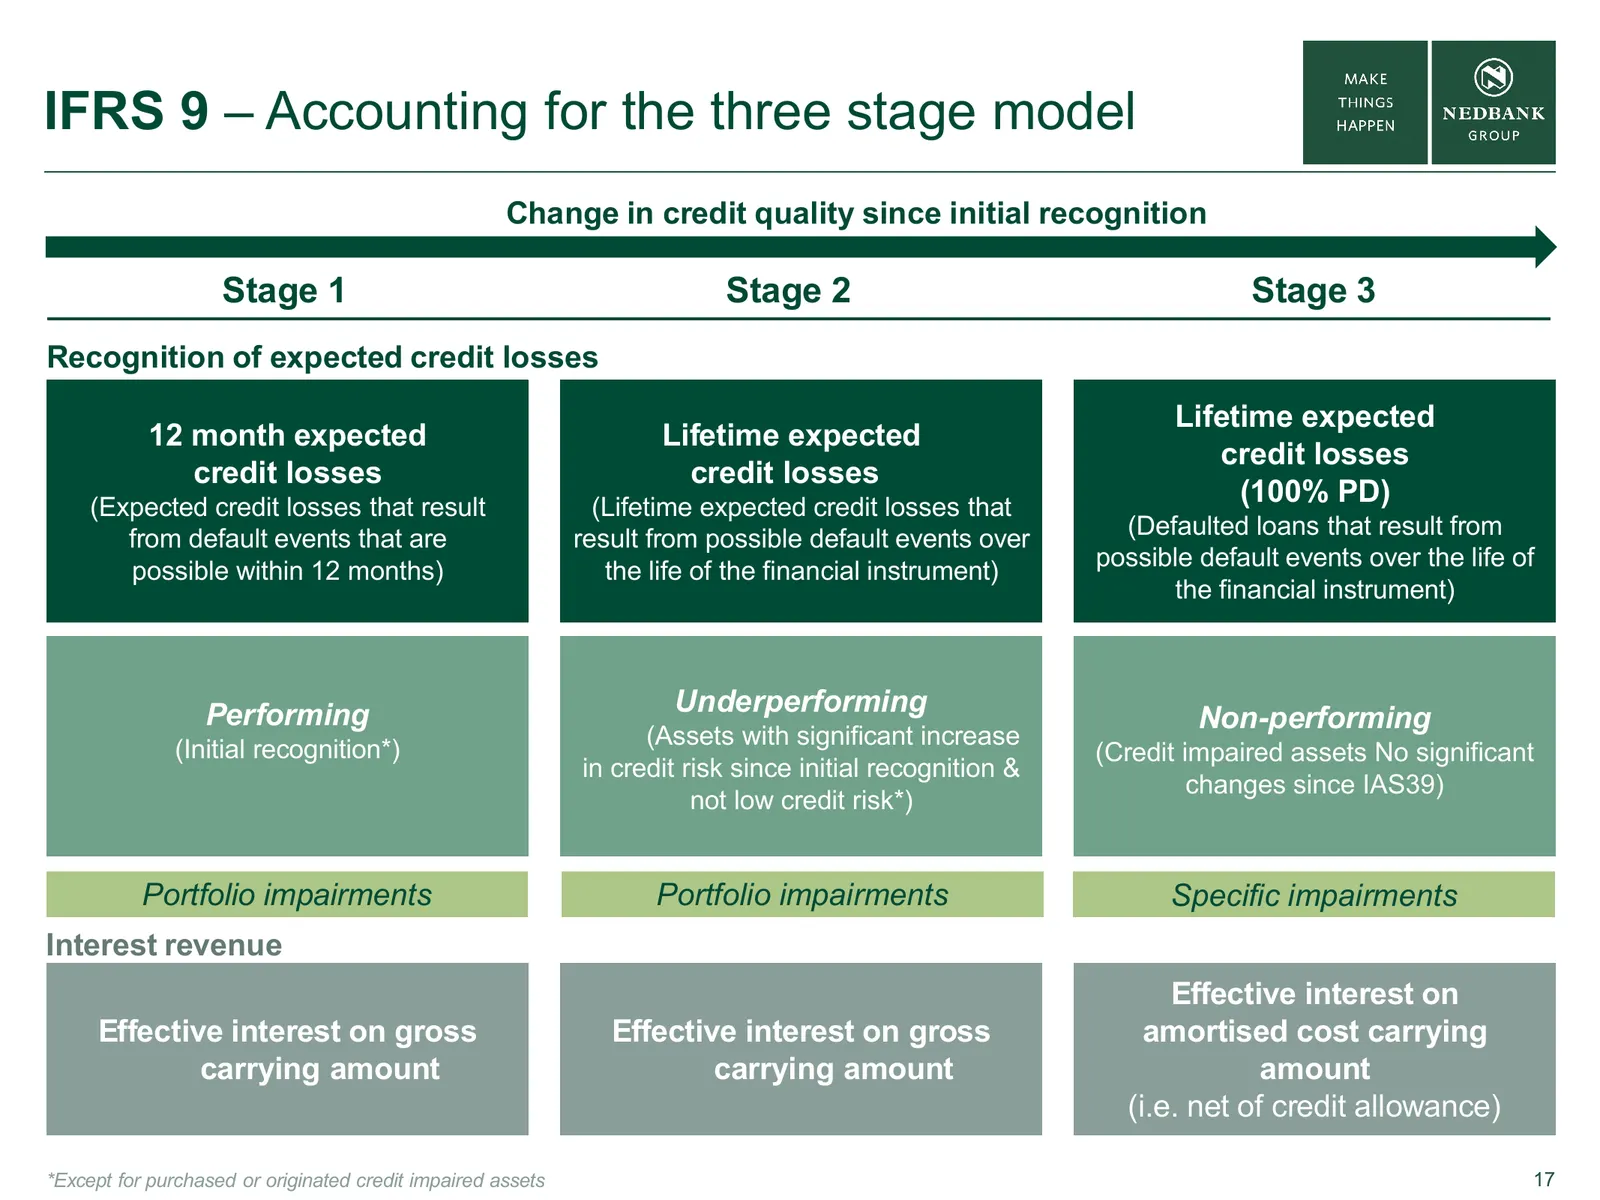
Slide 17: IFRS 9 – Accounting for the three stage model
IFRS 9 – Accounting for the three stage model Change in credit quality since initial recognition Stage 1 Stage 2 Stage 3 Recognition of expected credit losses Lifetime expected 12 month expected Lifetime expected credit losses credit losses credit losses (Expected credit losses that result (Lifetime
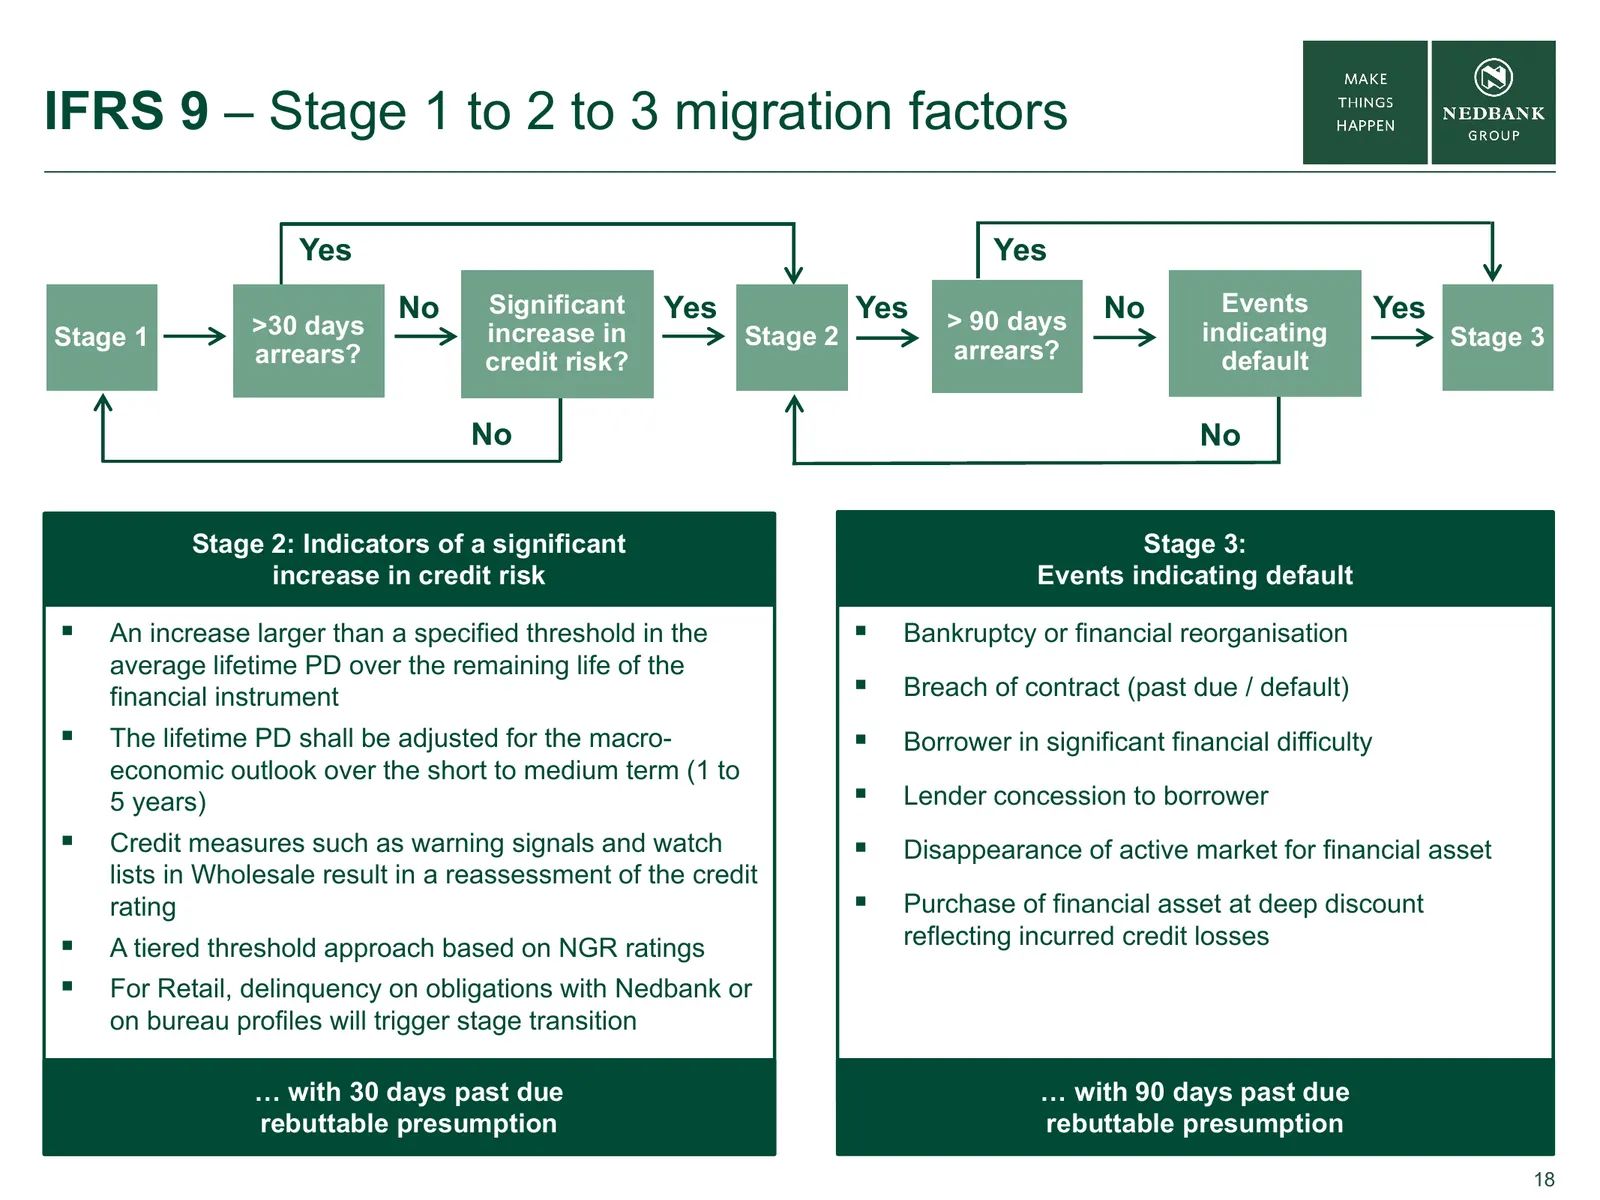
Slide 18: IFRS 9 – Stage 1 to 2 to 3 migration factors
IFRS 9 – Stage 1 to 2 to 3 migration factors Yes Yes No Significant Yes Yes No Events Yes >30 days increase in > 90 days indicating Stage 1 Stage 2 Stage 3 arrears? credit risk? arrears? default No No Stage 2: Indicators of a significant Stage 3: increase in credit risk Events indicating default A
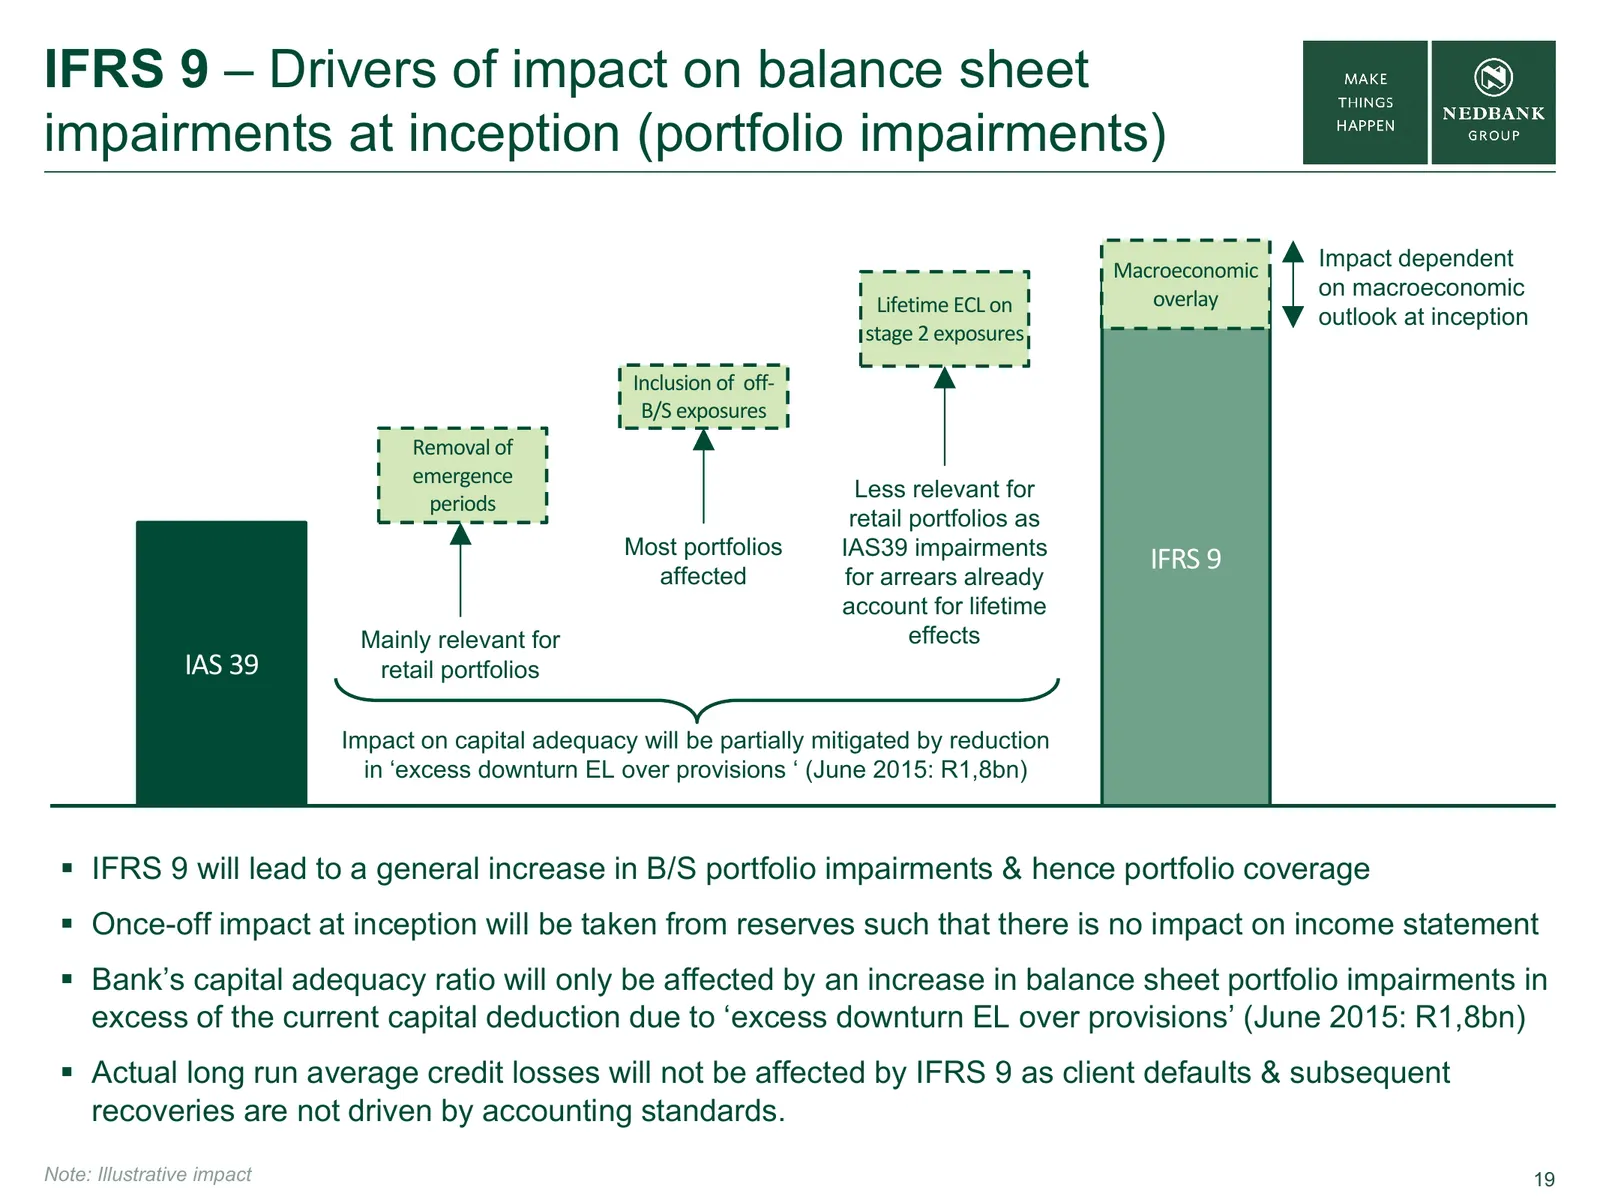
Slide 19: Drivers of impact on balance sheet impairments at inception
IFRS 9 – Drivers of impact on balance sheet impairments at inception (portfolio impairments) Macroeconomic Impact dependent overlay on macroeconomic Lifetime ECL on outlook at inception stage 2 exposures Inclusion of off‐ B/S exposures Removal of emergence Less relevant for periods retail portfolios
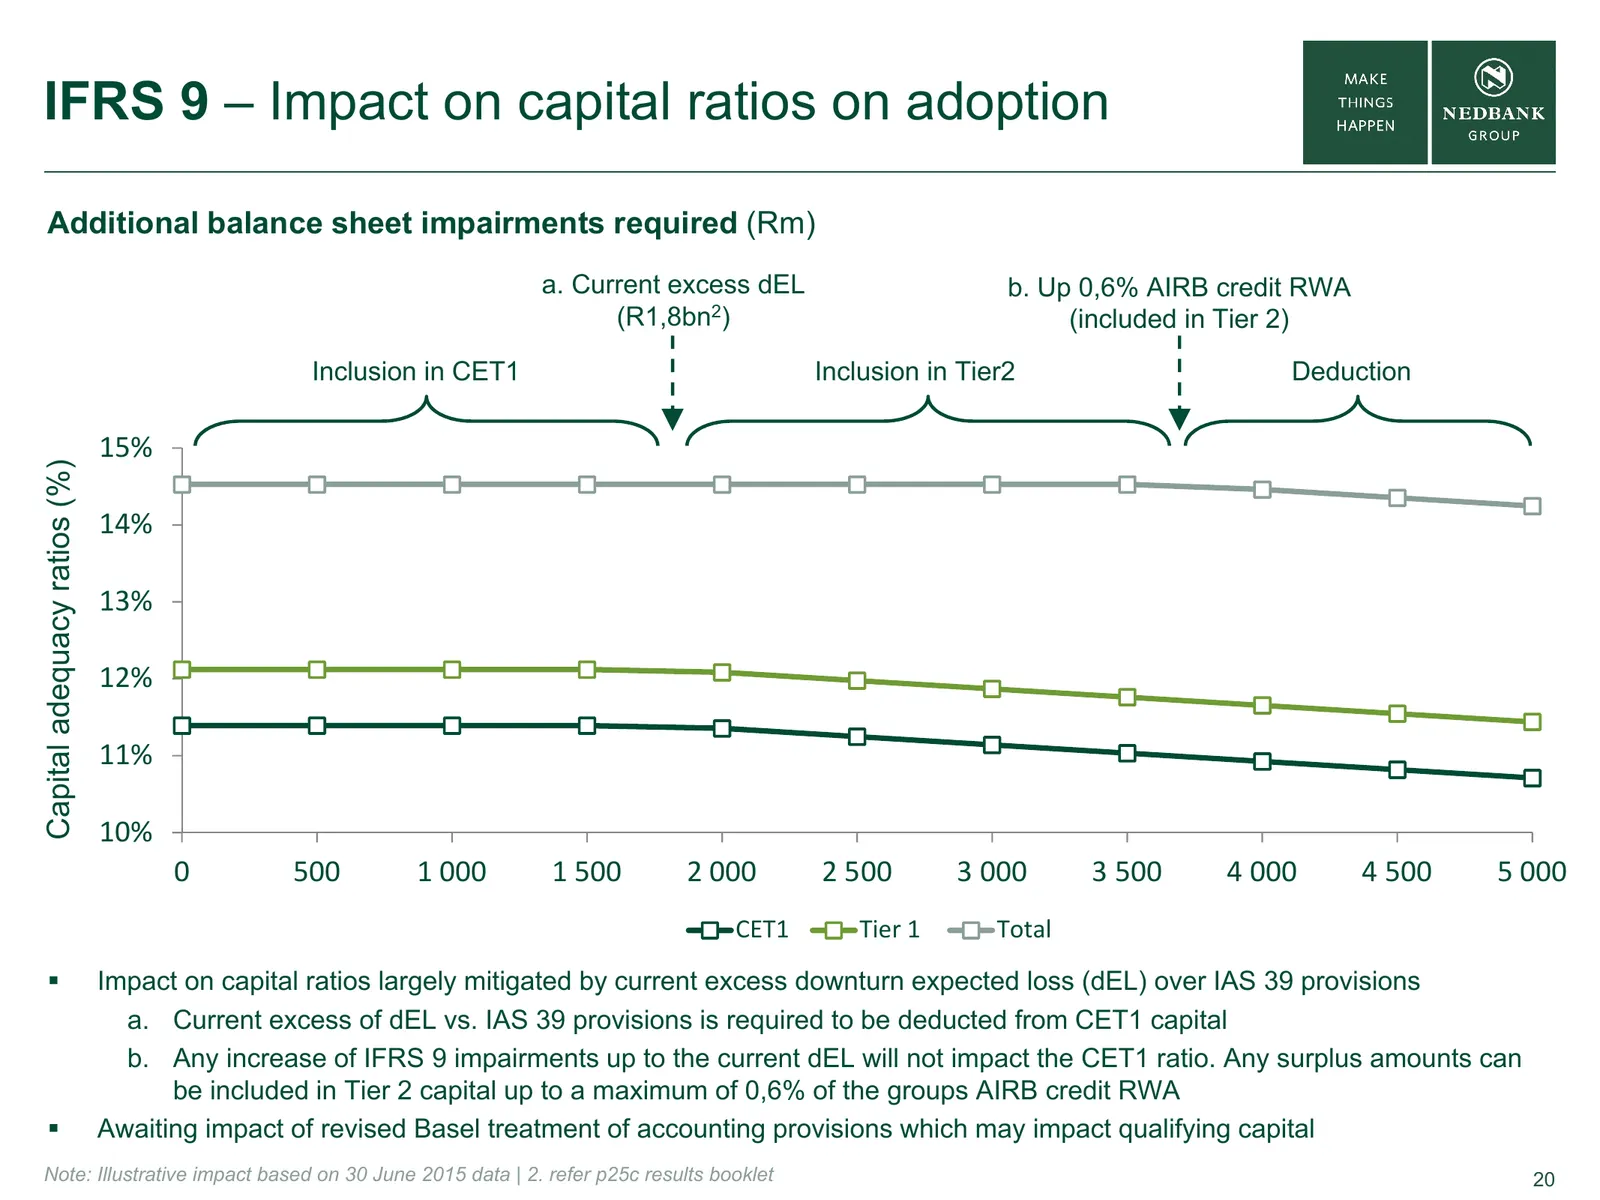
Slide 20: Impact on capital ratios on adoption
IFRS 9 – Impact on capital ratios on adoption Additional balance sheet impairments required (Rm) a. Current excess dEL b. Up 0,6% AIRB credit RWA (R1,8bn2) (included in Tier 2) Inclusion in CET1 Inclusion in Tier2 Deduction 15% Capital adequacy ratios (%) 14% 13% 12% 11% 10% 0 500 1 000 1 500 2 000
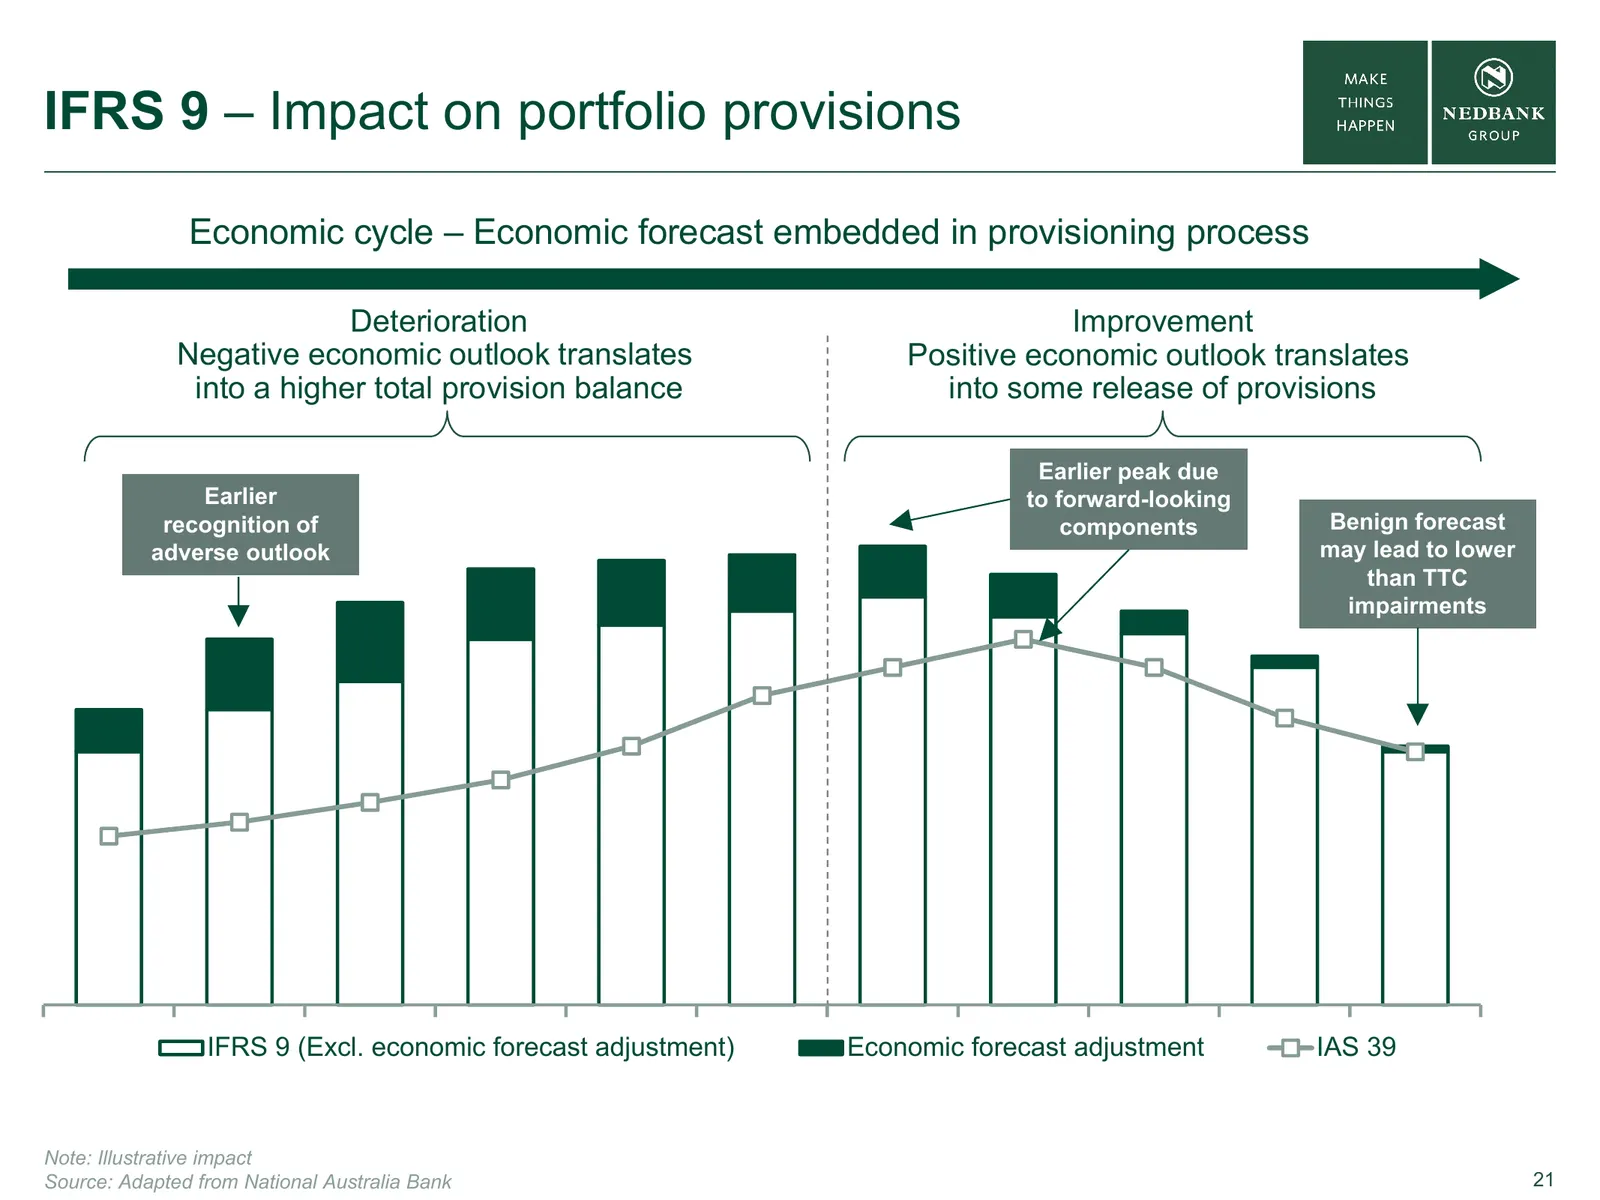
Slide 21: IFRS 9 – Impact on portfolio provisions
IFRS 9 – Impact on portfolio provisions Economic cycle – Economic forecast embedded in provisioning process Deterioration Improvement Negative economic outlook translates Positive economic outlook translates into a higher total provision balance into some release of provisions Earlier peak due Earli
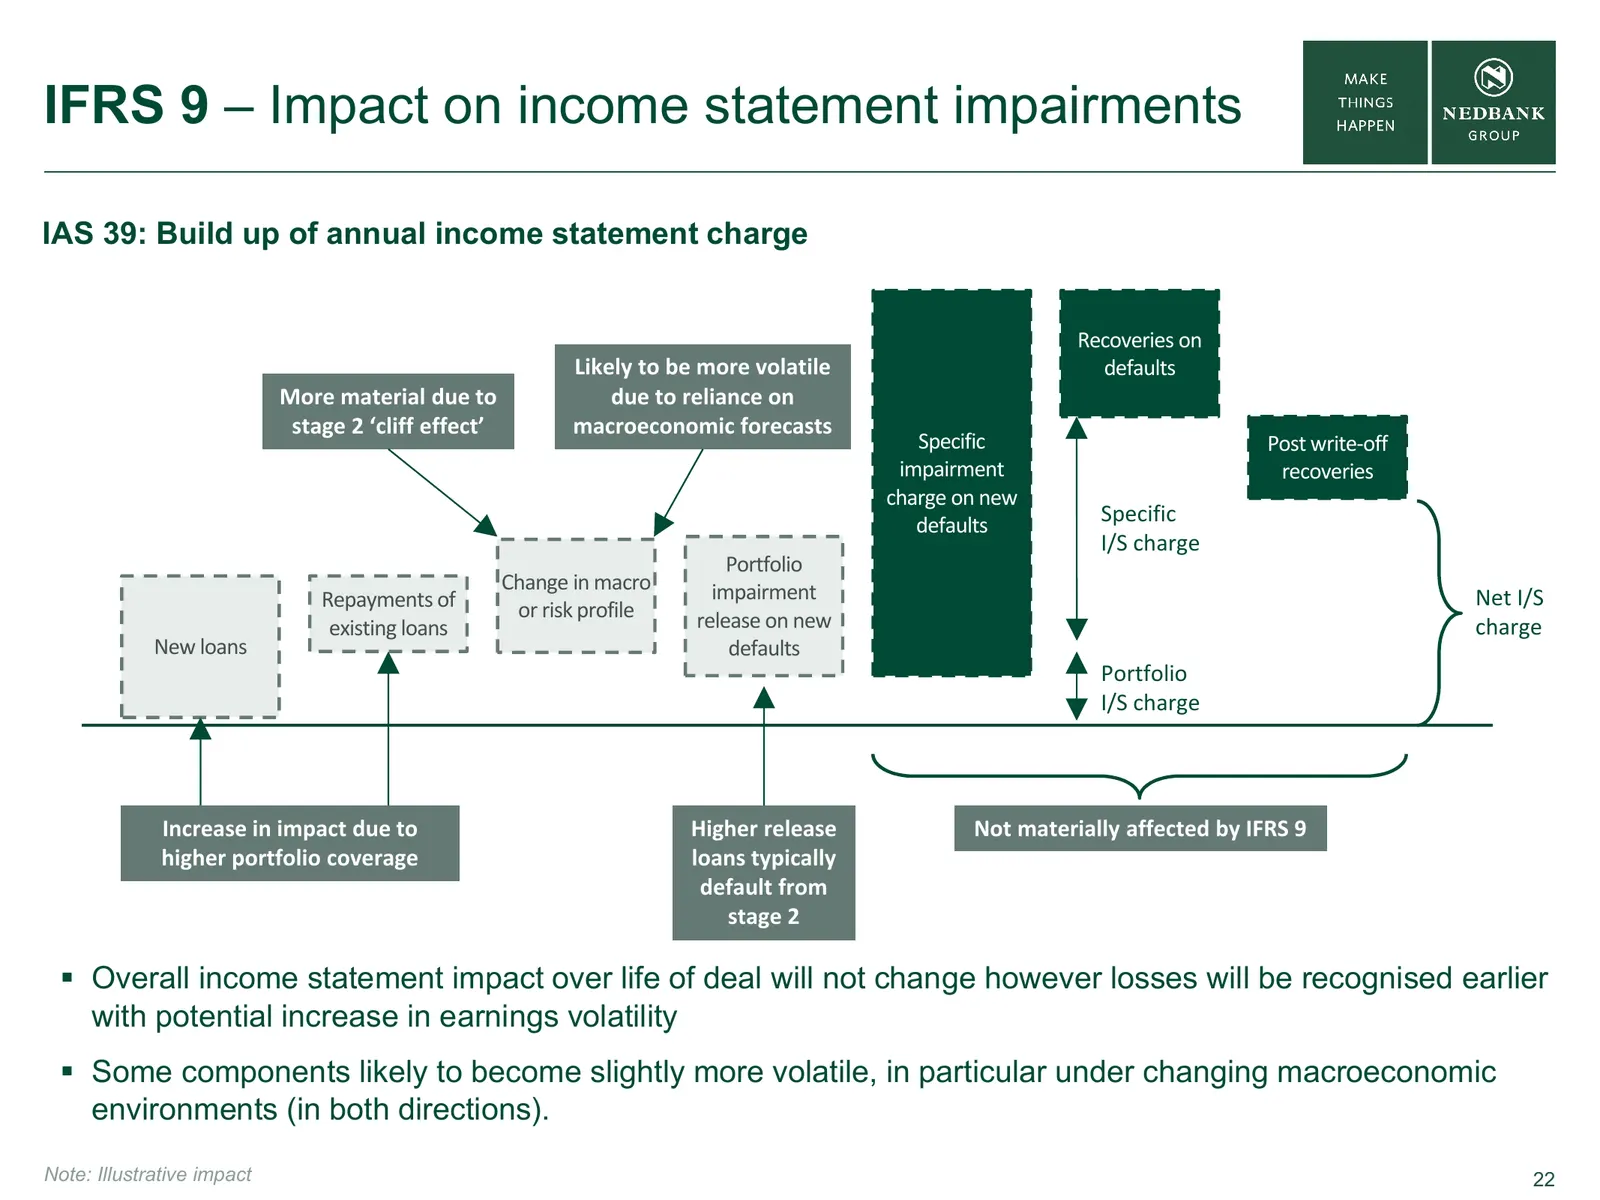
Slide 22: IFRS 9 – Impact on income statement impairments
IFRS 9 – Impact on income statement impairments IAS 39: Build up of annual income statement charge Recoveries on Likely to be more volatile defaults More material due to due to reliance on stage 2 ‘cliff effect’ macroeconomic forecasts Specific Post write‐off impairment recoveries charge on new defa
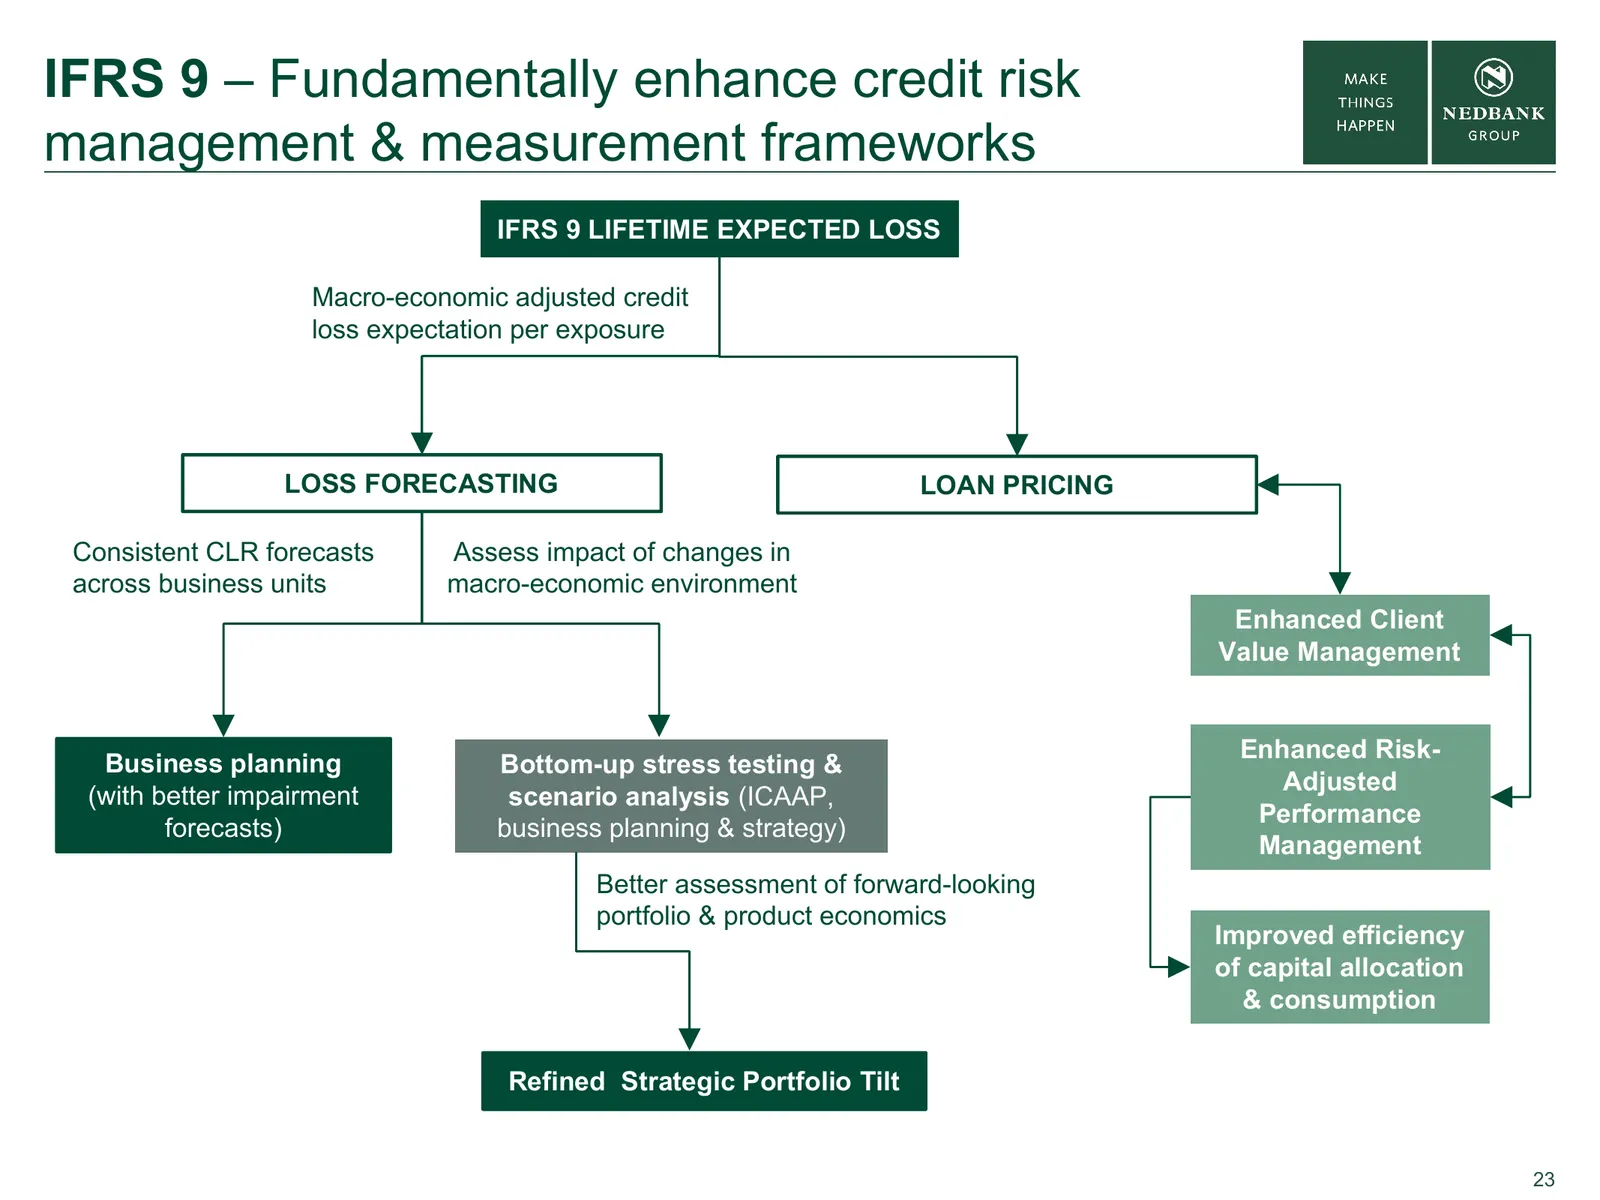
Slide 23: Fundamentally enhance credit risk management & measurement frameworks
IFRS 9 – Fundamentally enhance credit risk management & measurement frameworks IFRS 9 LIFETIME EXPECTED LOSS Macro-economic adjusted credit loss expectation per exposure LOSS FORECASTING LOAN PRICING Consistent CLR forecasts Assess impact of changes in across business units macro-economic environmen
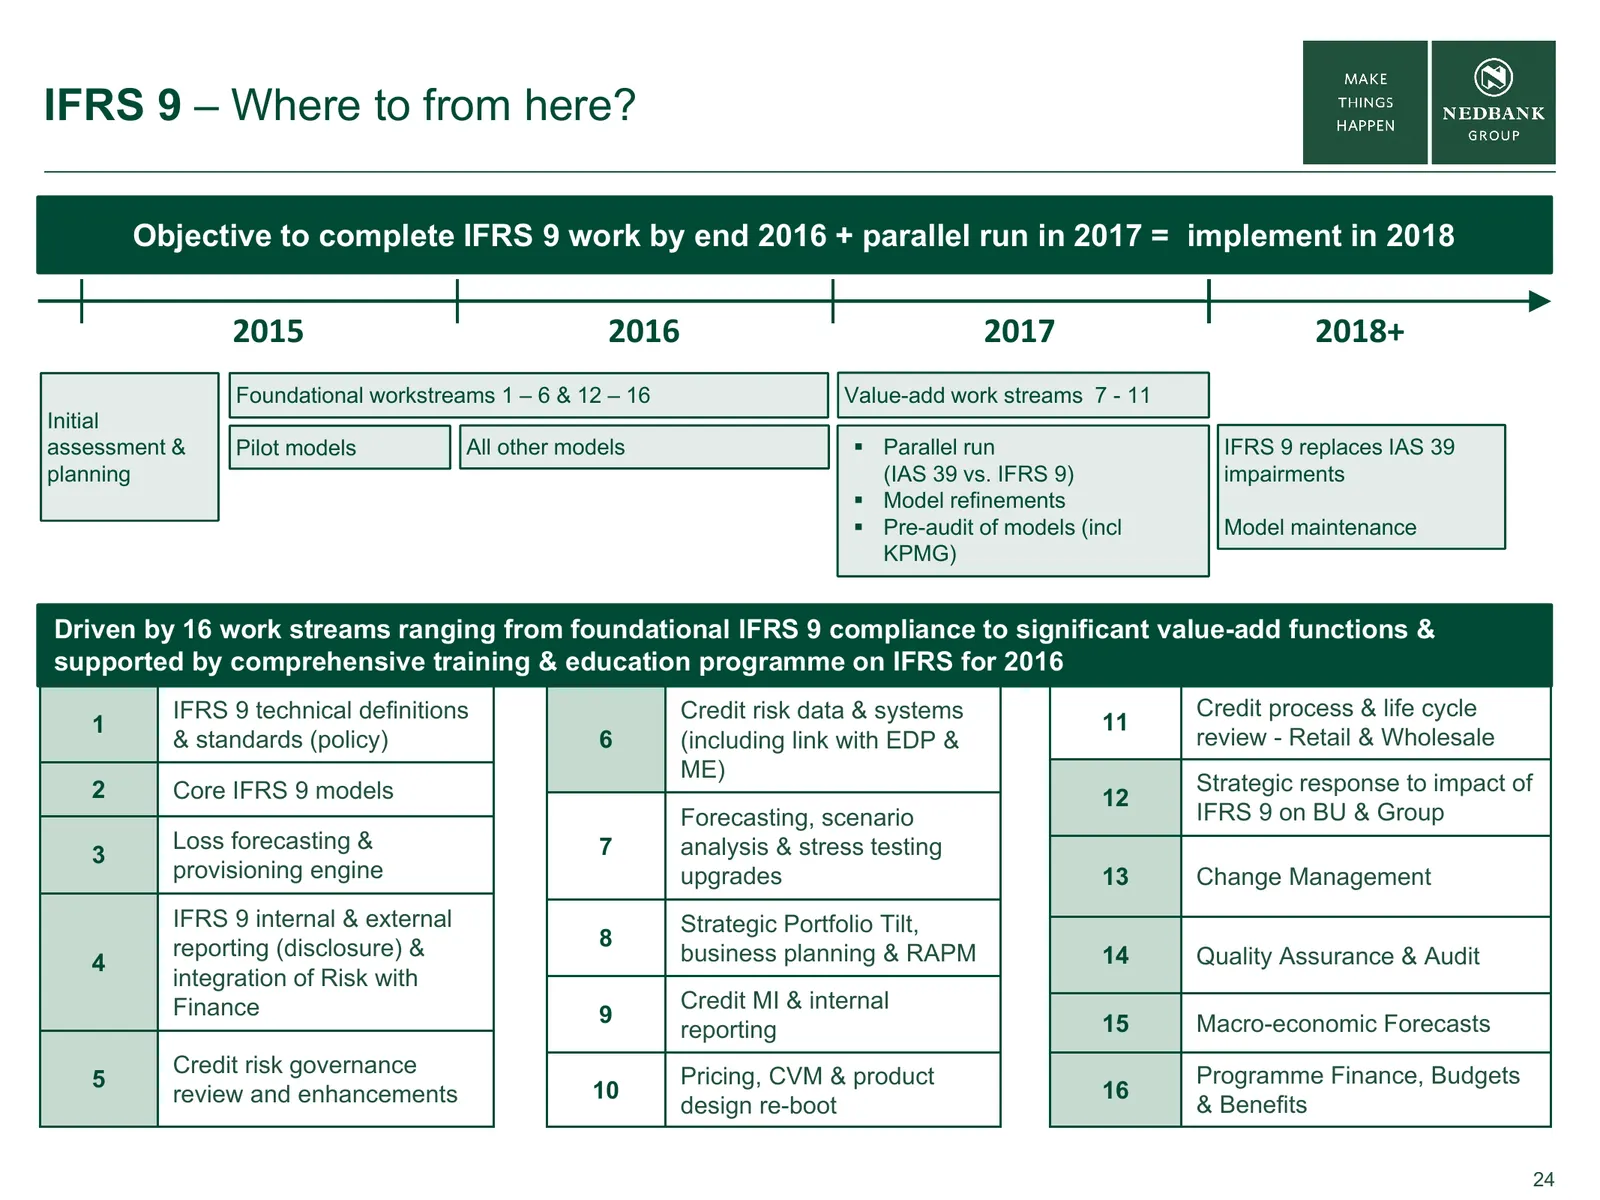
Slide 24: IFRS 9 – Where to from here?
IFRS 9 – Where to from here? Objective to complete IFRS 9 work by end 2016 + parallel run in 2017 = implement in 2018 2015 2016 2017 2018+ Foundational workstreams 1 – 6 & 12 – 16 Value-add work streams 7 - 11 Initial assessment & Pilot models All other models Parallel run IFRS 9 replaces IAS 39 p
Slide 25: Agenda
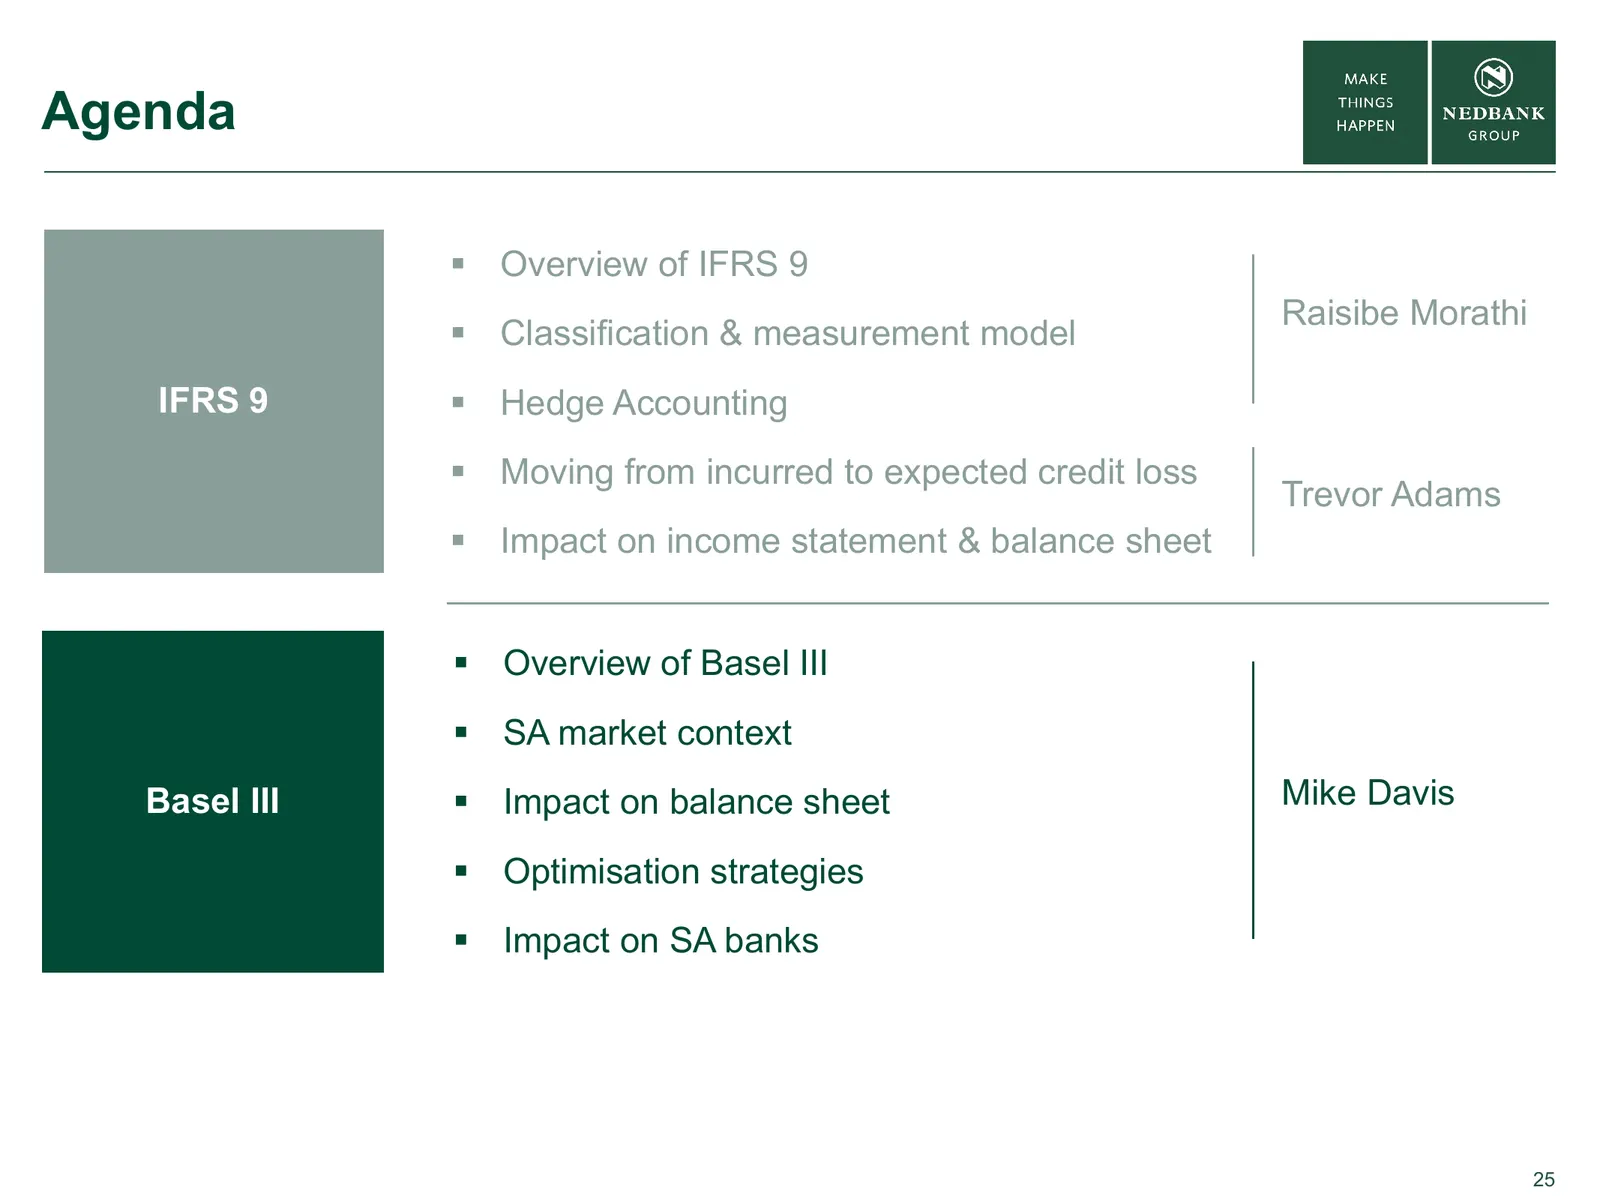
Agenda Overview of IFRS 9 Raisibe Morathi Classification & measurement model IFRS 9 Hedge Accounting Moving from incurred to expected credit loss Trevor Adams Impact on income statement & balance sheet Overview of Basel III SA market context Basel III Impact on balance sheet Mike Dav
Slide 26: Basel III – Consequences of implementation
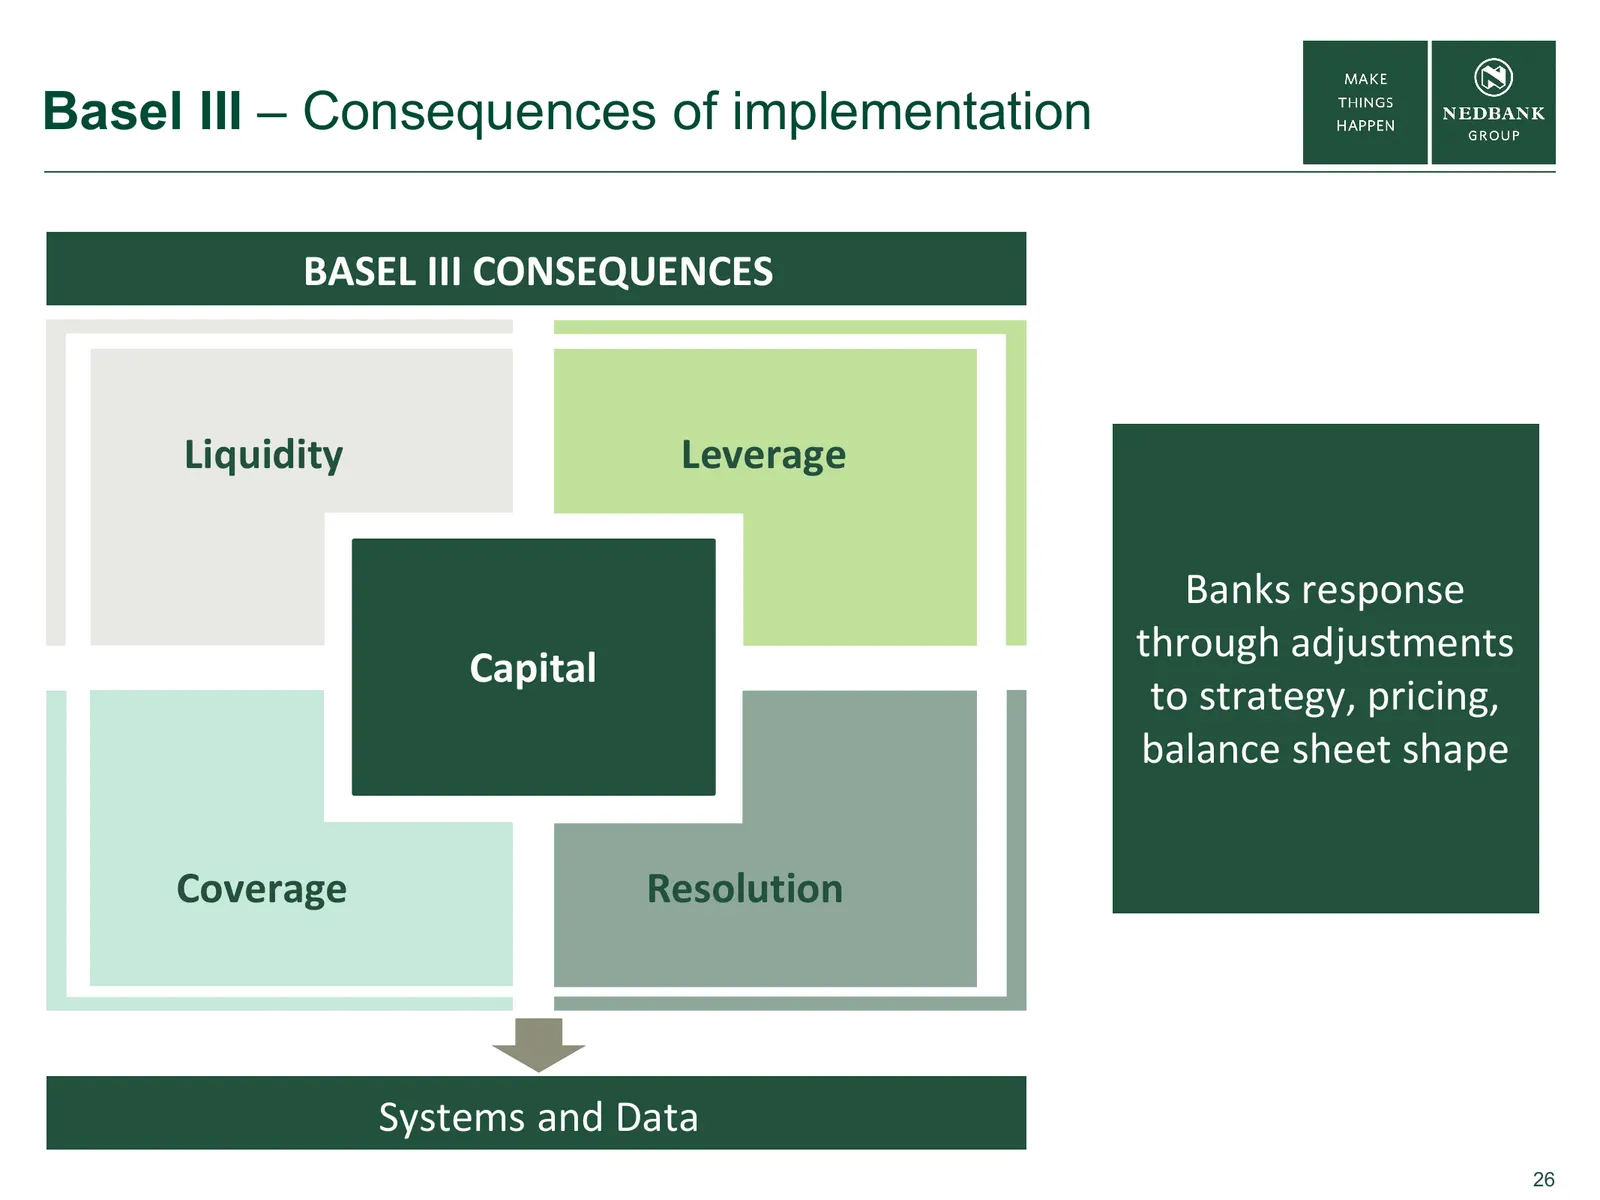
Basel III – Consequences of implementation BASEL III CONSEQUENCES Liquidity Leverage Banks response through adjustments Capital to strategy, pricing, balance sheet shape Coverage Resolution Systems and Data 26
Slide 27: Basel III - Overview
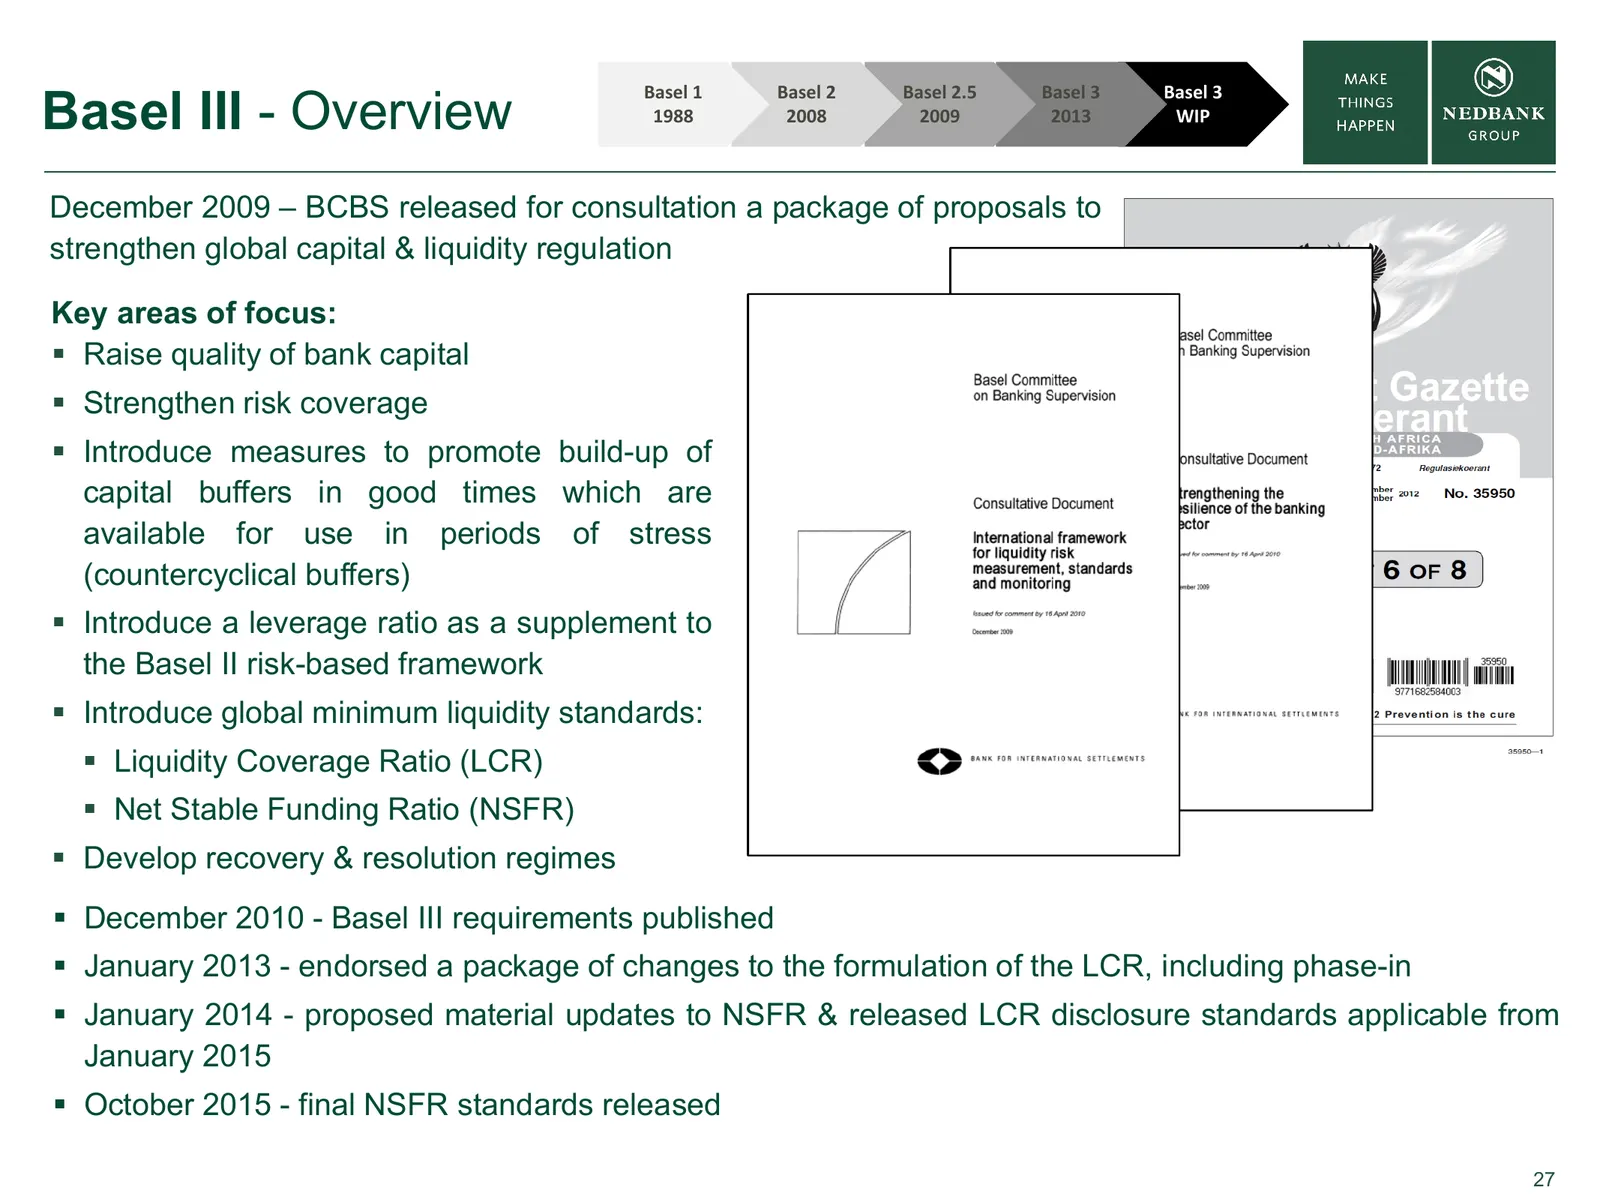
Basel III - Overview Basel 1 Basel 2 Basel 2.5 Basel 3 Basel 3 1988 2008 2009 2013 WIP December 2009 – BCBS released for consultation a package of proposals to strengthen global capital & liquidity regulation Key areas of focus: Raise quality of bank capital Strengthen risk coverage Introduce
Slide 28: Basel III – Impacts all components of balance sheet
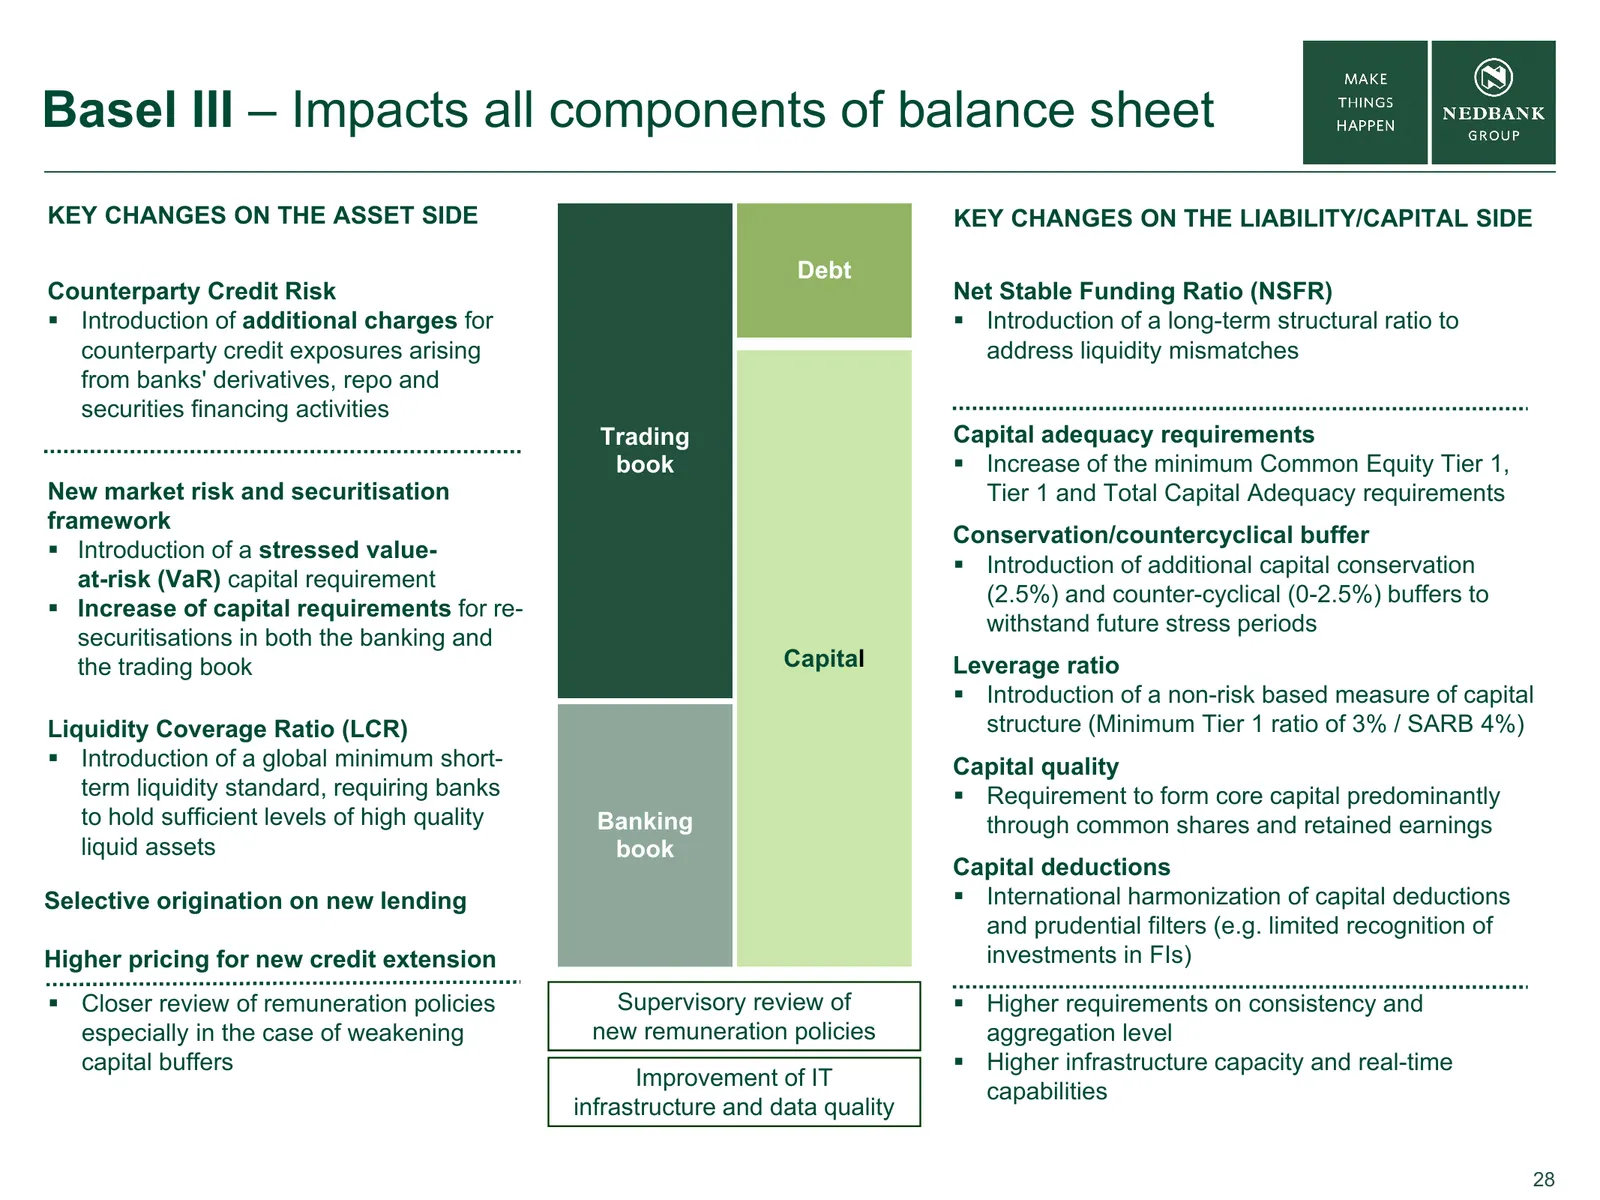
Basel III – Impacts all components of balance sheet KEY CHANGES ON THE ASSET SIDE KEY CHANGES ON THE LIABILITY/CAPITAL SIDE Debt Counterparty Credit Risk Net Stable Funding Ratio (NSFR) Introduction of additional charges for Introduction of a long-term structural ratio to counterparty credit exp
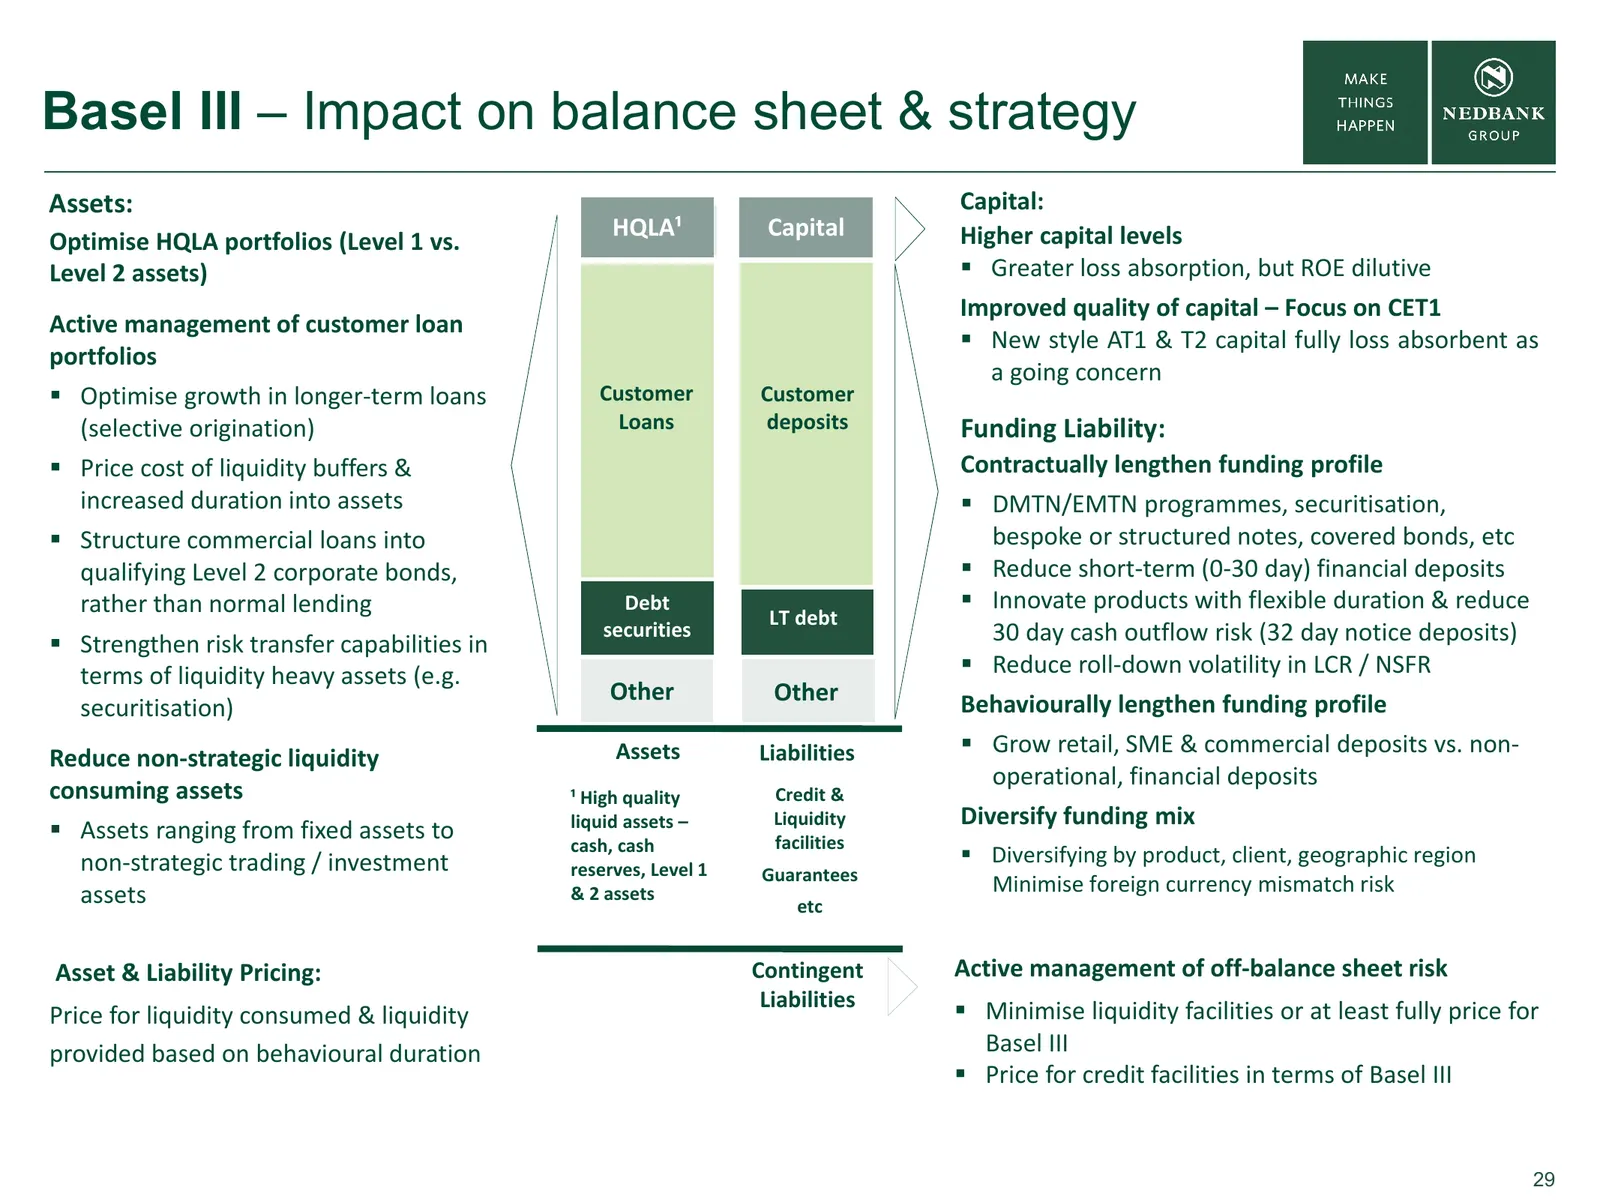
Slide 29: Basel III – Impact on balance sheet & strategy
Basel III – Impact on balance sheet & strategy Assets: Capital: HQLA¹ Other Capital Higher capital levels Optimise HQLA portfolios (Level 1 vs. Level 2 assets) Greater loss absorption, but ROE dilutive Improved quality of capital – Focus on CET1 Active management of customer loan New style AT1 &
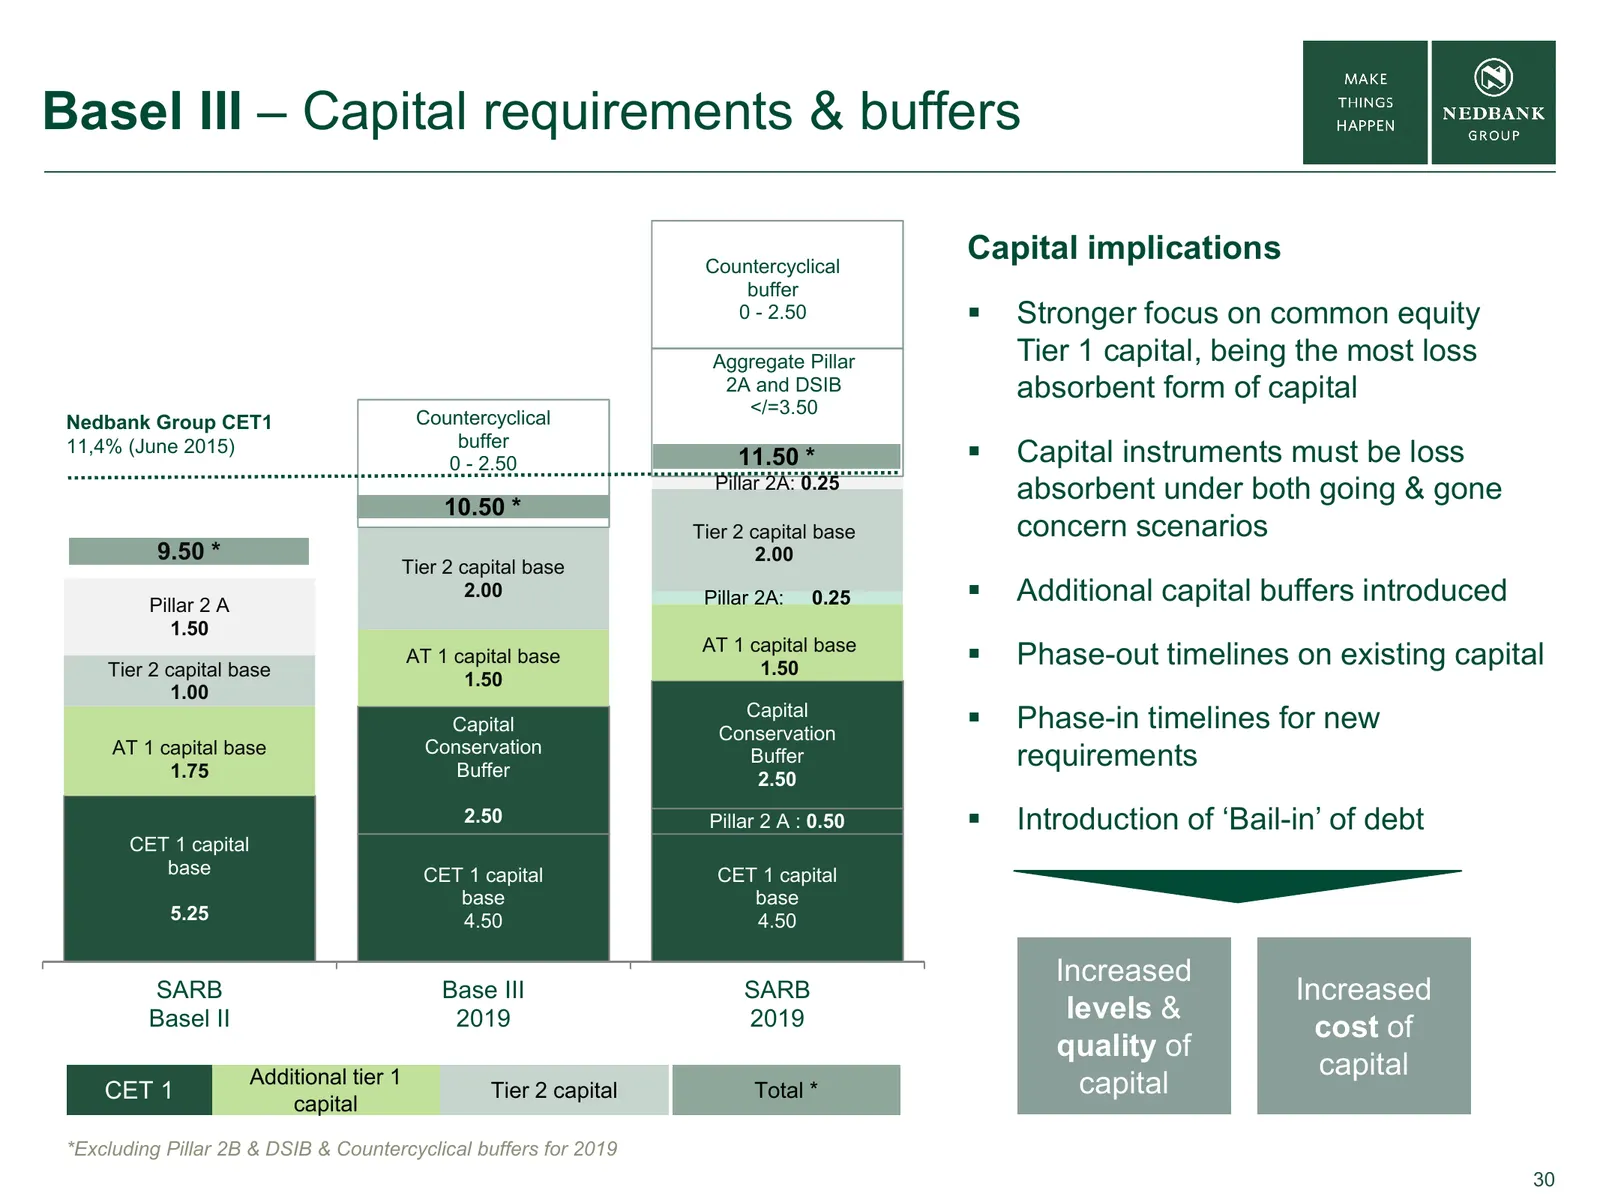
Slide 30: Basel III – Capital requirements & buffers
Basel III – Capital requirements & buffers Countercyclical Capital implications buffer 0 - 2.50 Stronger focus on common equity Aggregate Pillar Tier 1 capital, being the most loss 2A and DSIB absorbent form of capital </=3.50 Nedbank Group CET1 Countercyclical buffer 11,4% (June 2015) 0 - 2.50 11
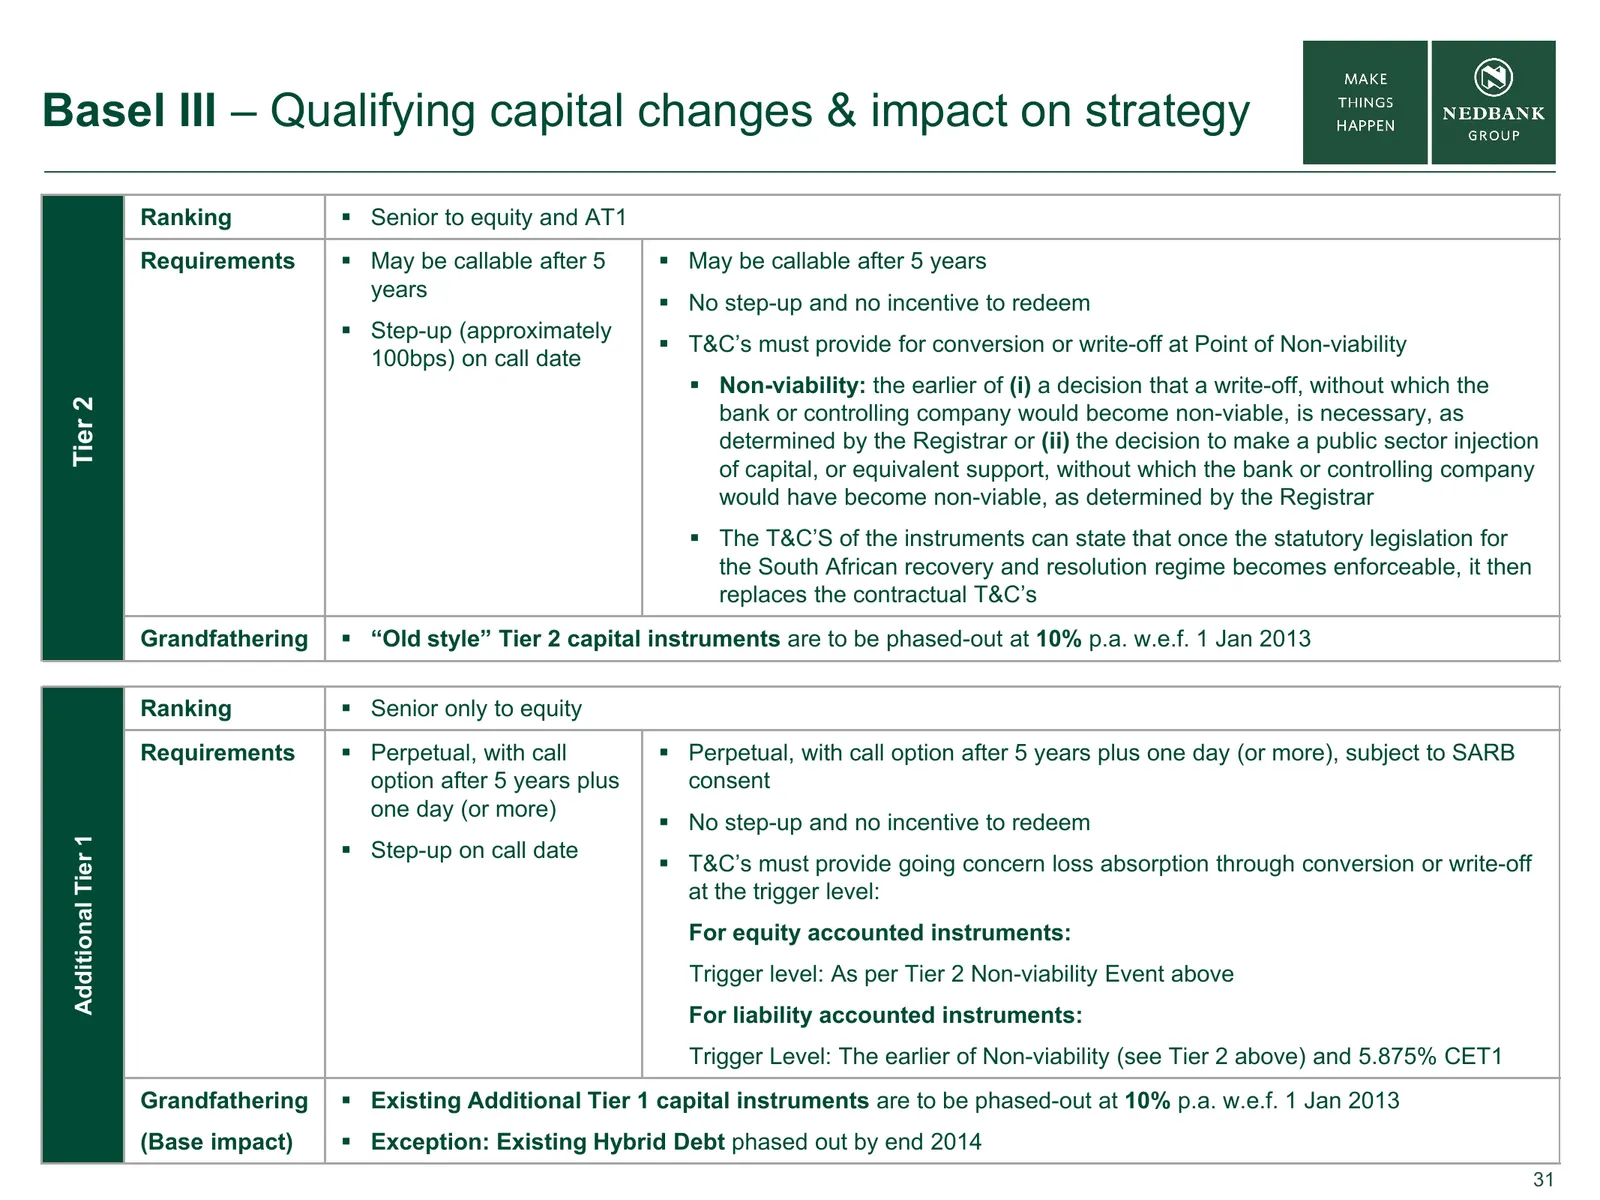
Slide 31: Qualifying capital changes & impact on strategy
Basel III – Qualifying capital changes & impact on strategy Ranking Senior to equity and AT1 Requirements May be callable after 5 May be callable after 5 years years No step-up and no incentive to redeem Step-up (approximately T&C’s must provide for conversion or write-off at Point of No
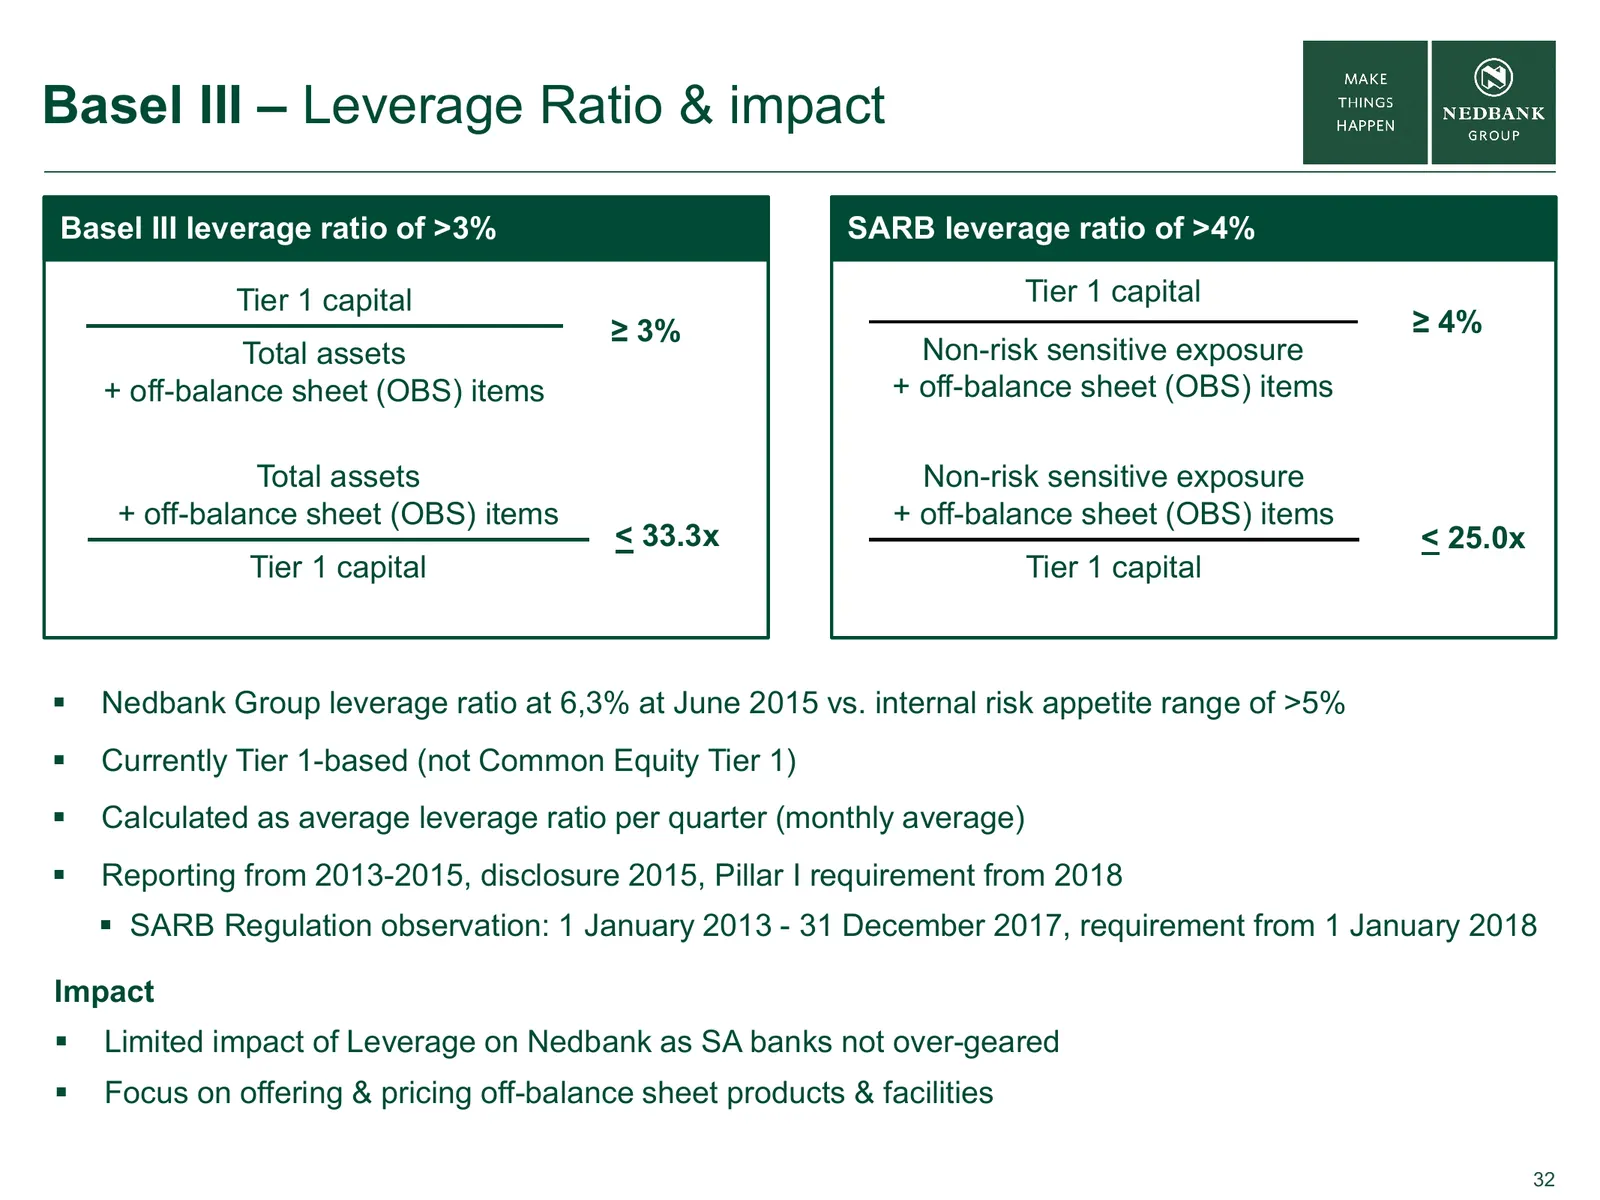
Slide 32: Basel III – Leverage Ratio & impact
Basel III – Leverage Ratio & impact Basel III leverage ratio of >3% SARB leverage ratio of >4% Tier 1 capital Tier 1 capital ≥ 3% ≥ 4% Total assets Non-risk sensitive exposure + off-balance sheet (OBS) items + off-balance sheet (OBS) items Total assets Non-risk sensitive exposure + off-balance sheet
Slide 33: Liquidity Coverage Ratio & Net Stable Funding Ratio
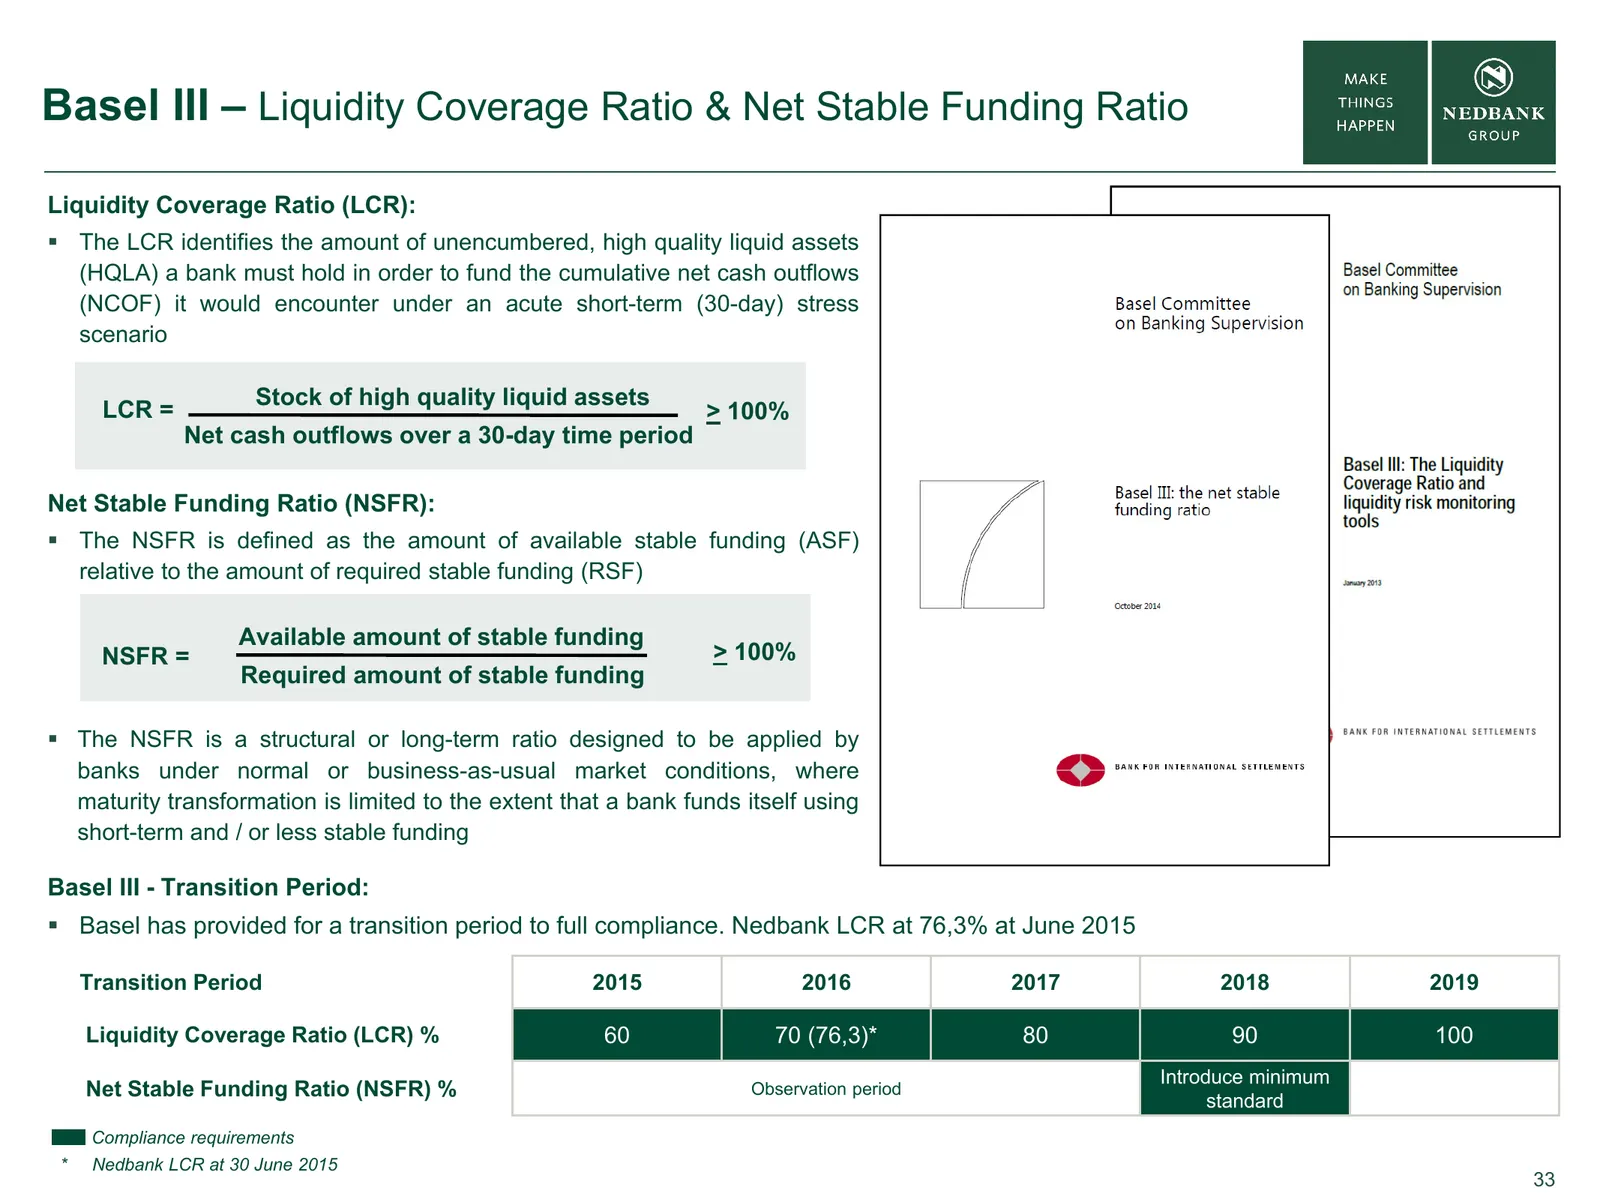
Basel III – Liquidity Coverage Ratio & Net Stable Funding Ratio Liquidity Coverage Ratio (LCR): The LCR identifies the amount of unencumbered, high quality liquid assets (HQLA) a bank must hold in order to fund the cumulative net cash outflows (NCOF) it would encounter under an acute short-term (3
Slide 34: Basel III – SA market context
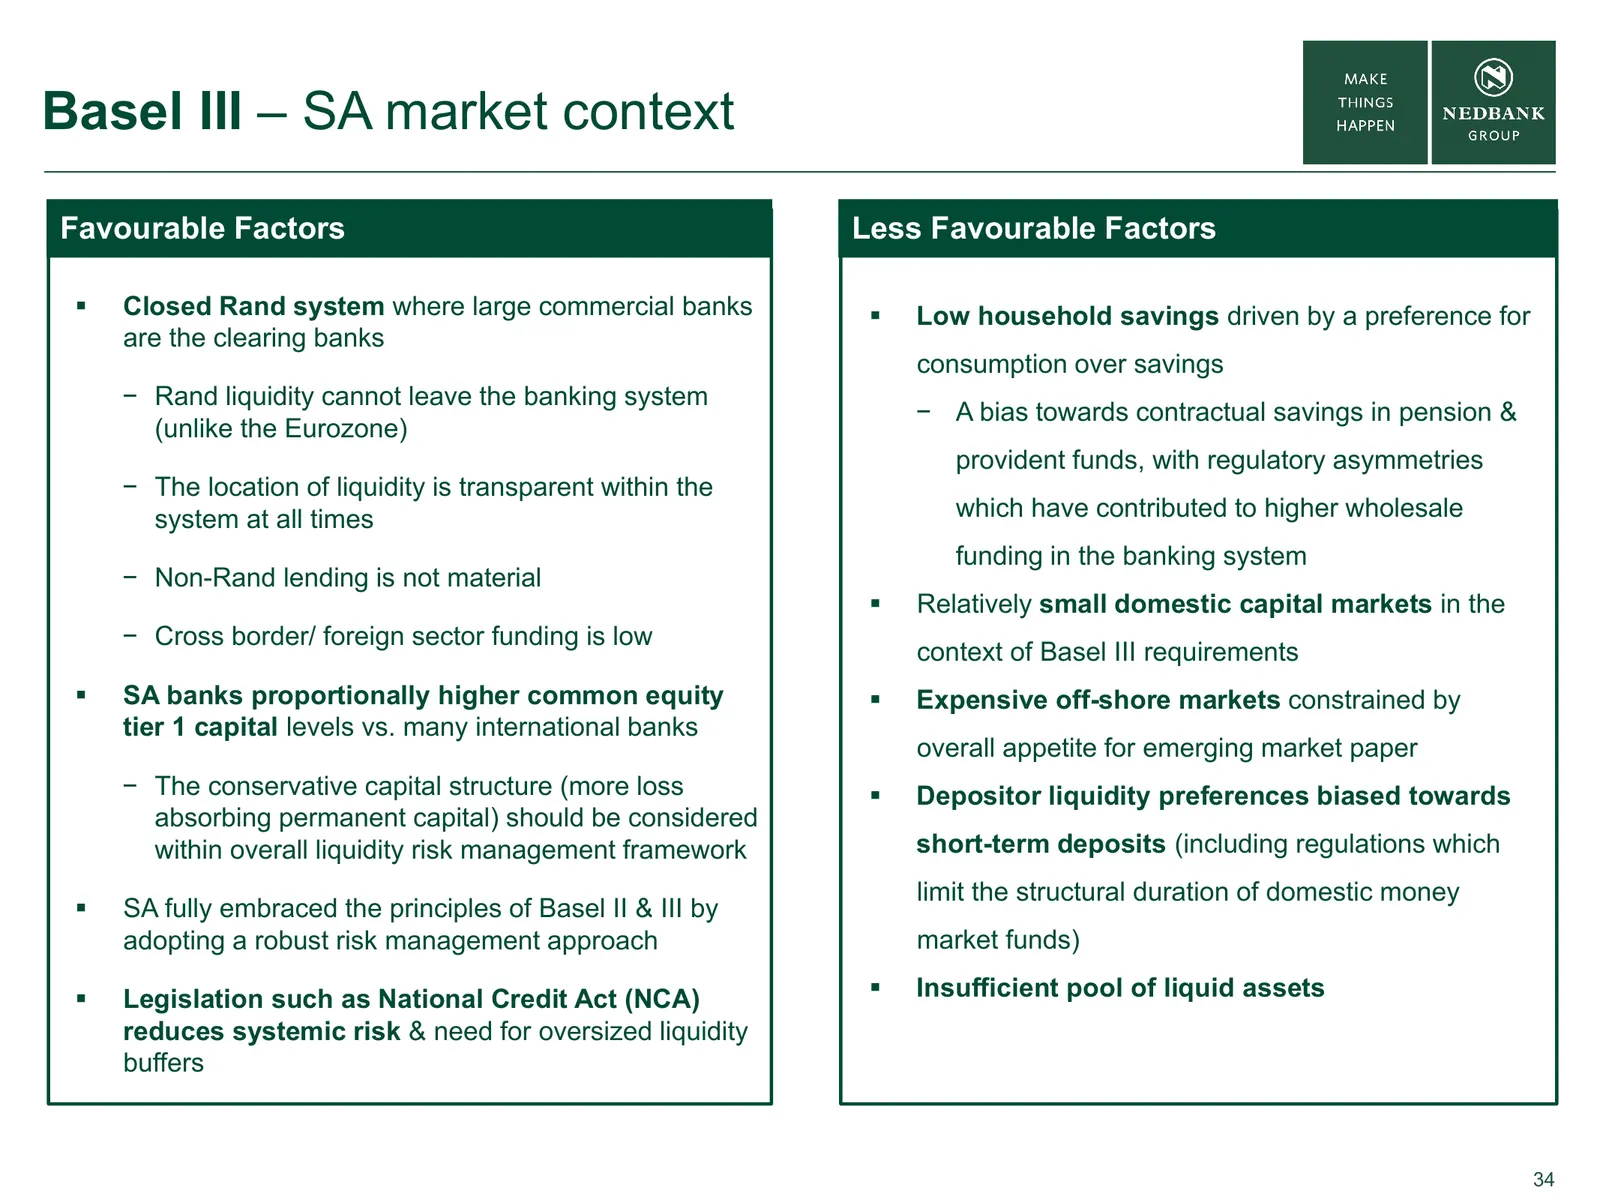
Basel III – SA market context Favourable Factors Less Favourable Factors Closed Rand system where large commercial banks Low household savings driven by a preference for are the clearing banks consumption over savings − Rand liquidity cannot leave the banking system − A bias towards contractual
Slide 35: Impact of LCR & NSFR on SA markets
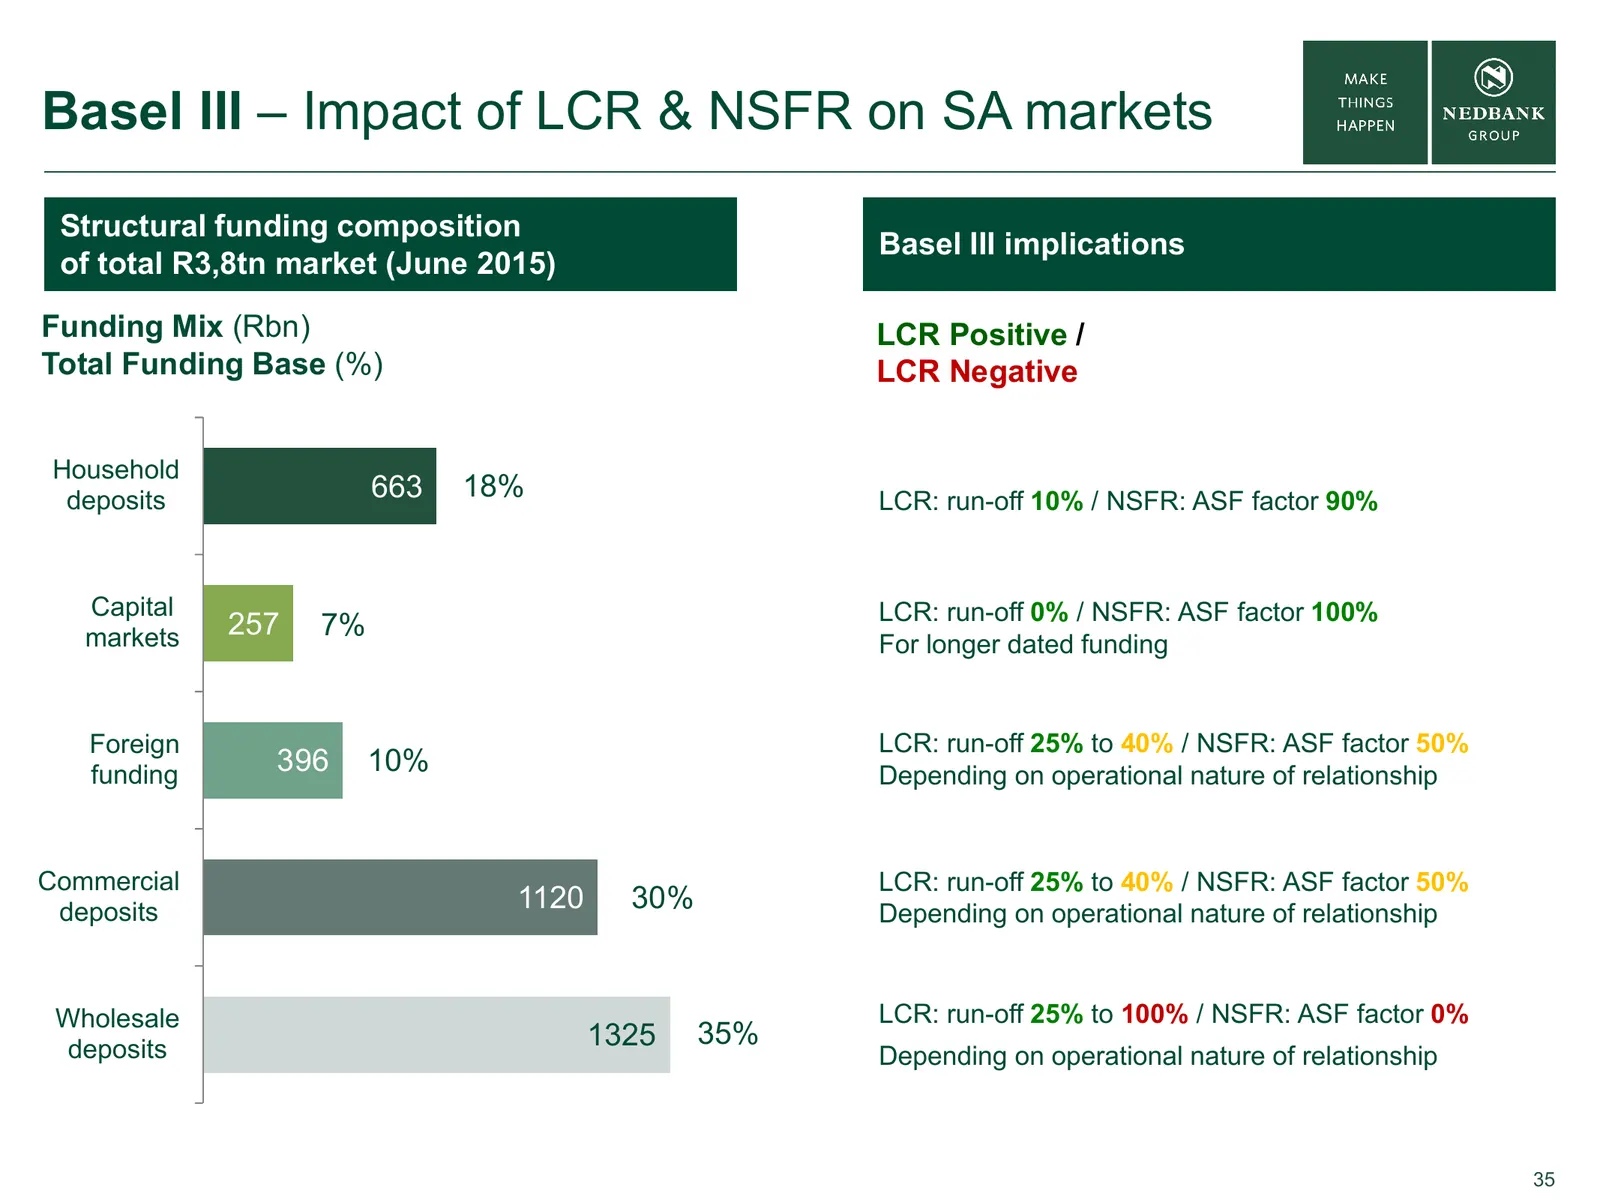
Basel III – Impact of LCR & NSFR on SA markets Structural funding composition Basel III implications of total R3,8tn market (June 2015) Funding Mix (Rbn) LCR Positive / Total Funding Base (%) LCR Negative Household deposits 663 18% LCR: run-off 10% / NSFR: ASF factor 90% Capital LCR: run-off 0% / NS
Slide 36: Basel III – LCR High Quality Liquid Assets
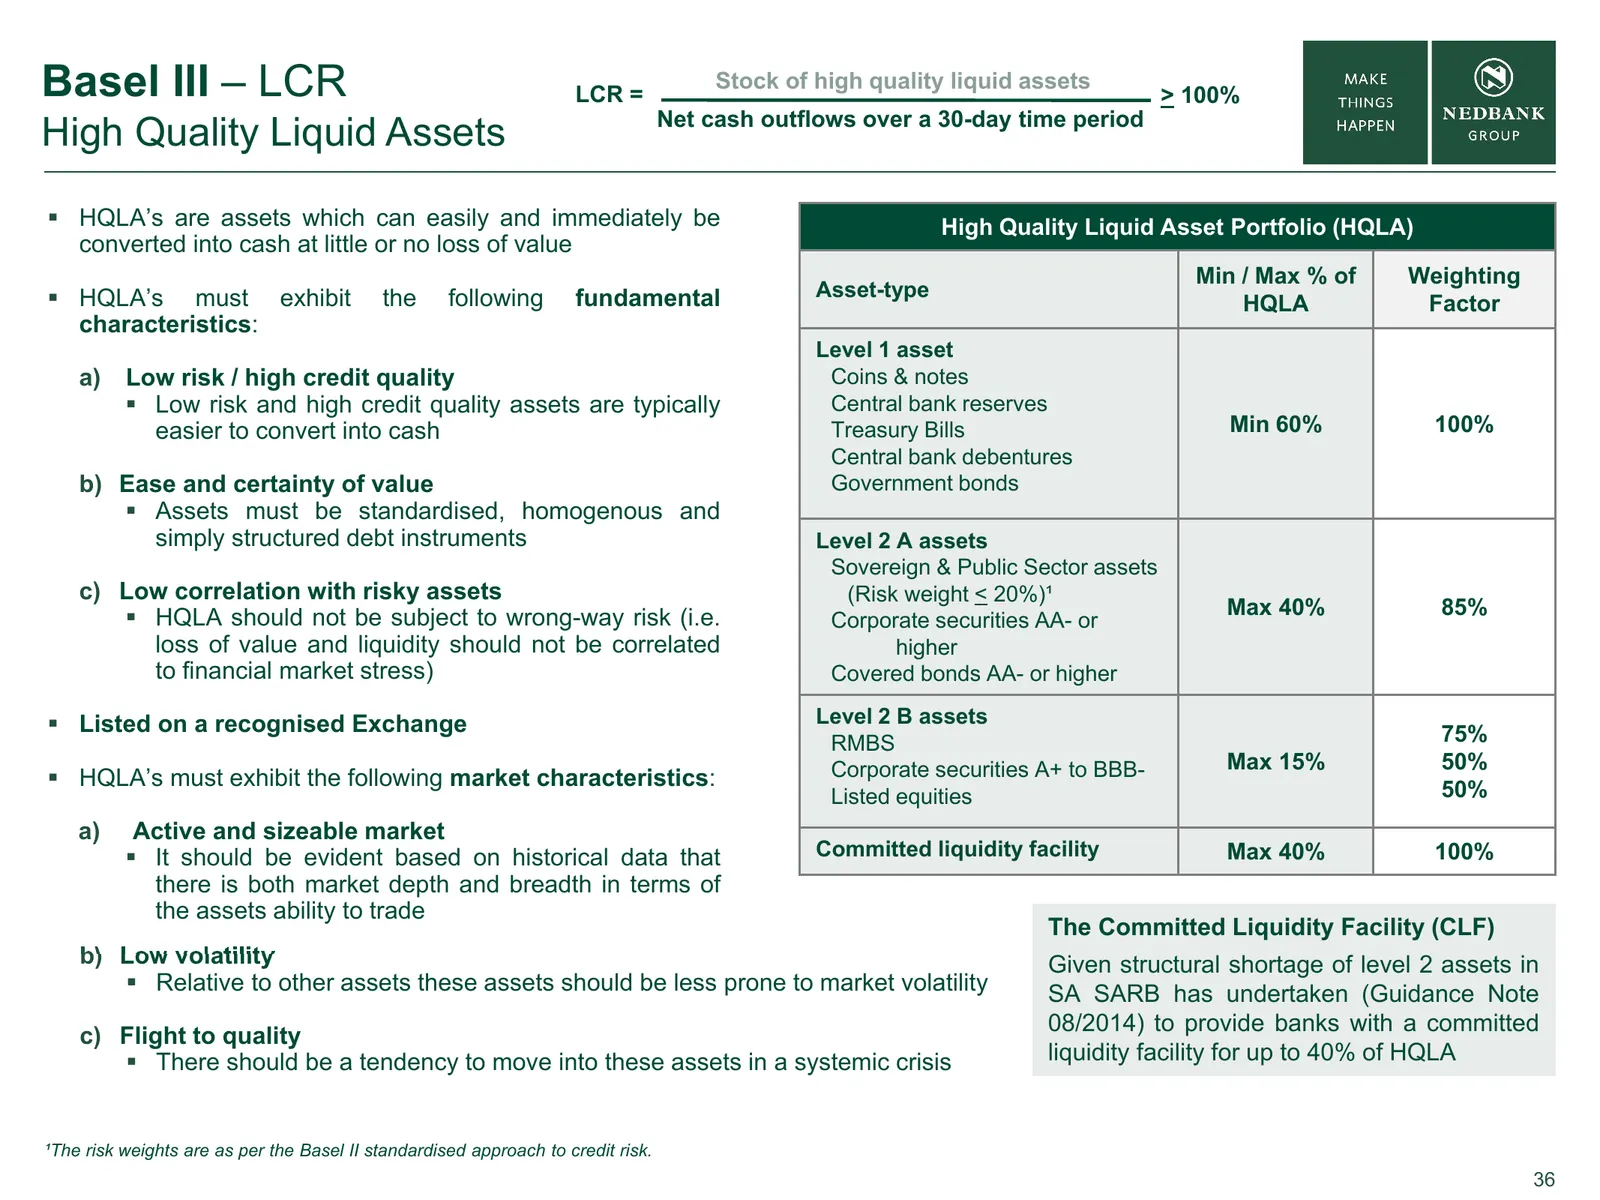
Basel III – LCR LCR = Stock of high quality liquid assets > 100% Net cash outflows over a 30-day time period High Quality Liquid Assets HQLA’s are assets which can easily and immediately be High Quality Liquid Asset Portfolio (HQLA) converted into cash at little or no loss of value Min / Max % of
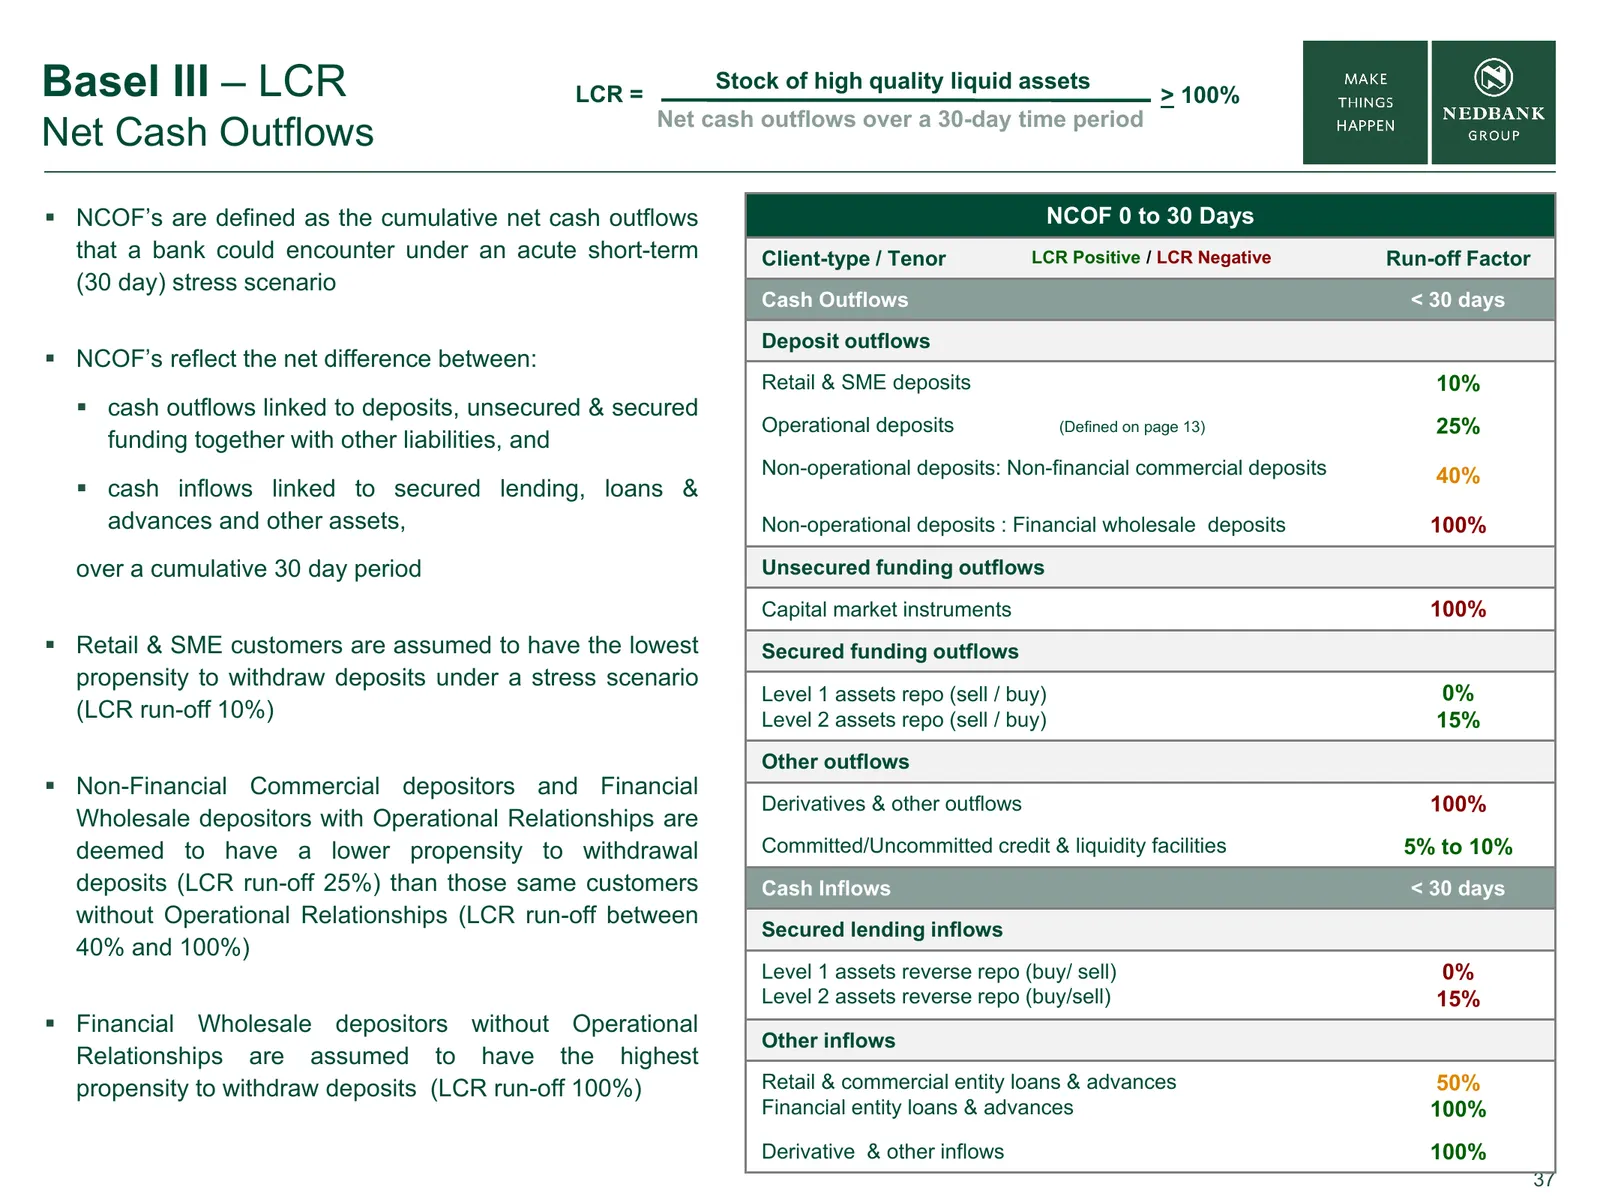
Slide 37: Basel III – LCR Net Cash Outflows
Basel III – LCR LCR = Stock of high quality liquid assets > 100% Net cash outflows over a 30-day time period Net Cash Outflows NCOF’s are defined as the cumulative net cash outflows NCOF 0 to 30 Days that a bank could encounter under an acute short-term Client-type / Tenor LCR Positive / LCR Negat
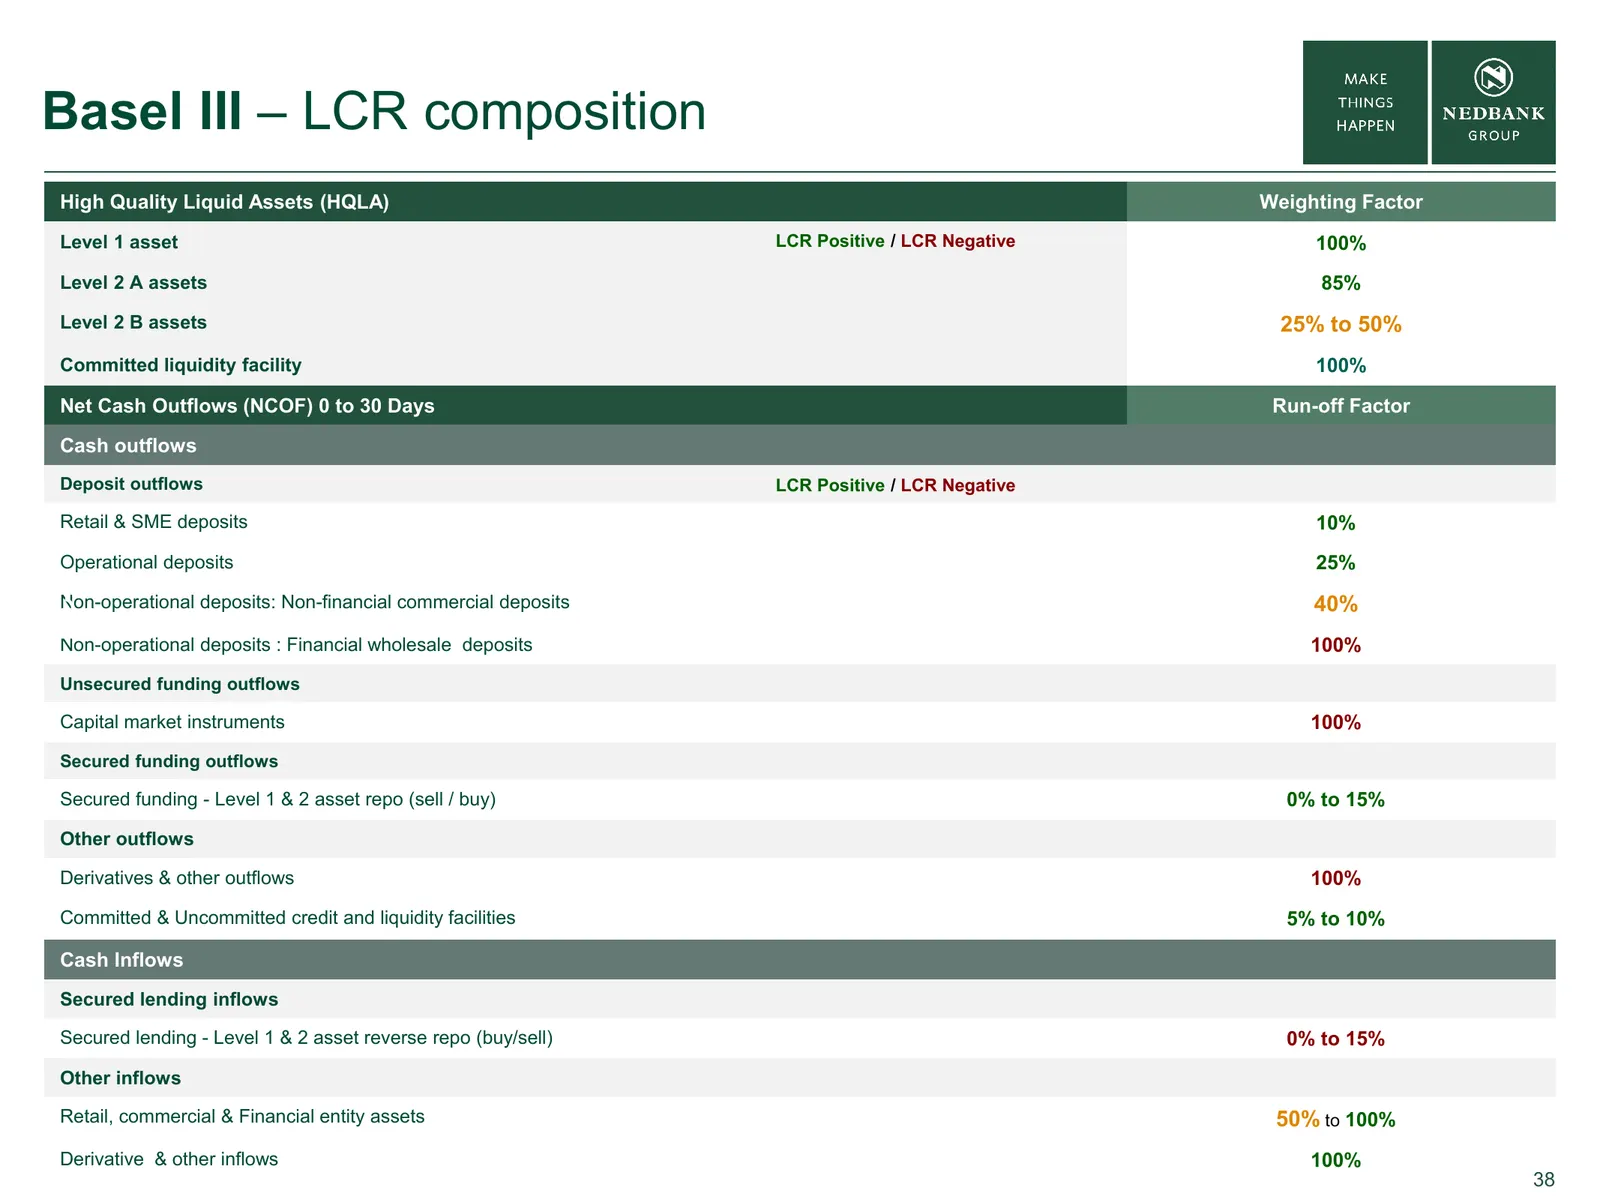
Slide 38: LCR composition
Basel III – LCR composition High Quality Liquid Assets (HQLA) Weighting Factor Level 1 asset LCR Positive / LCR Negative 100% Level 2 A assets 85% Level 2 B assets 25% to 50% Committed liquidity facility 100% Net Cash Outflows (NCOF) 0 to 30 Days Run-off Factor Cash outflows Deposit outflows LCR Pos
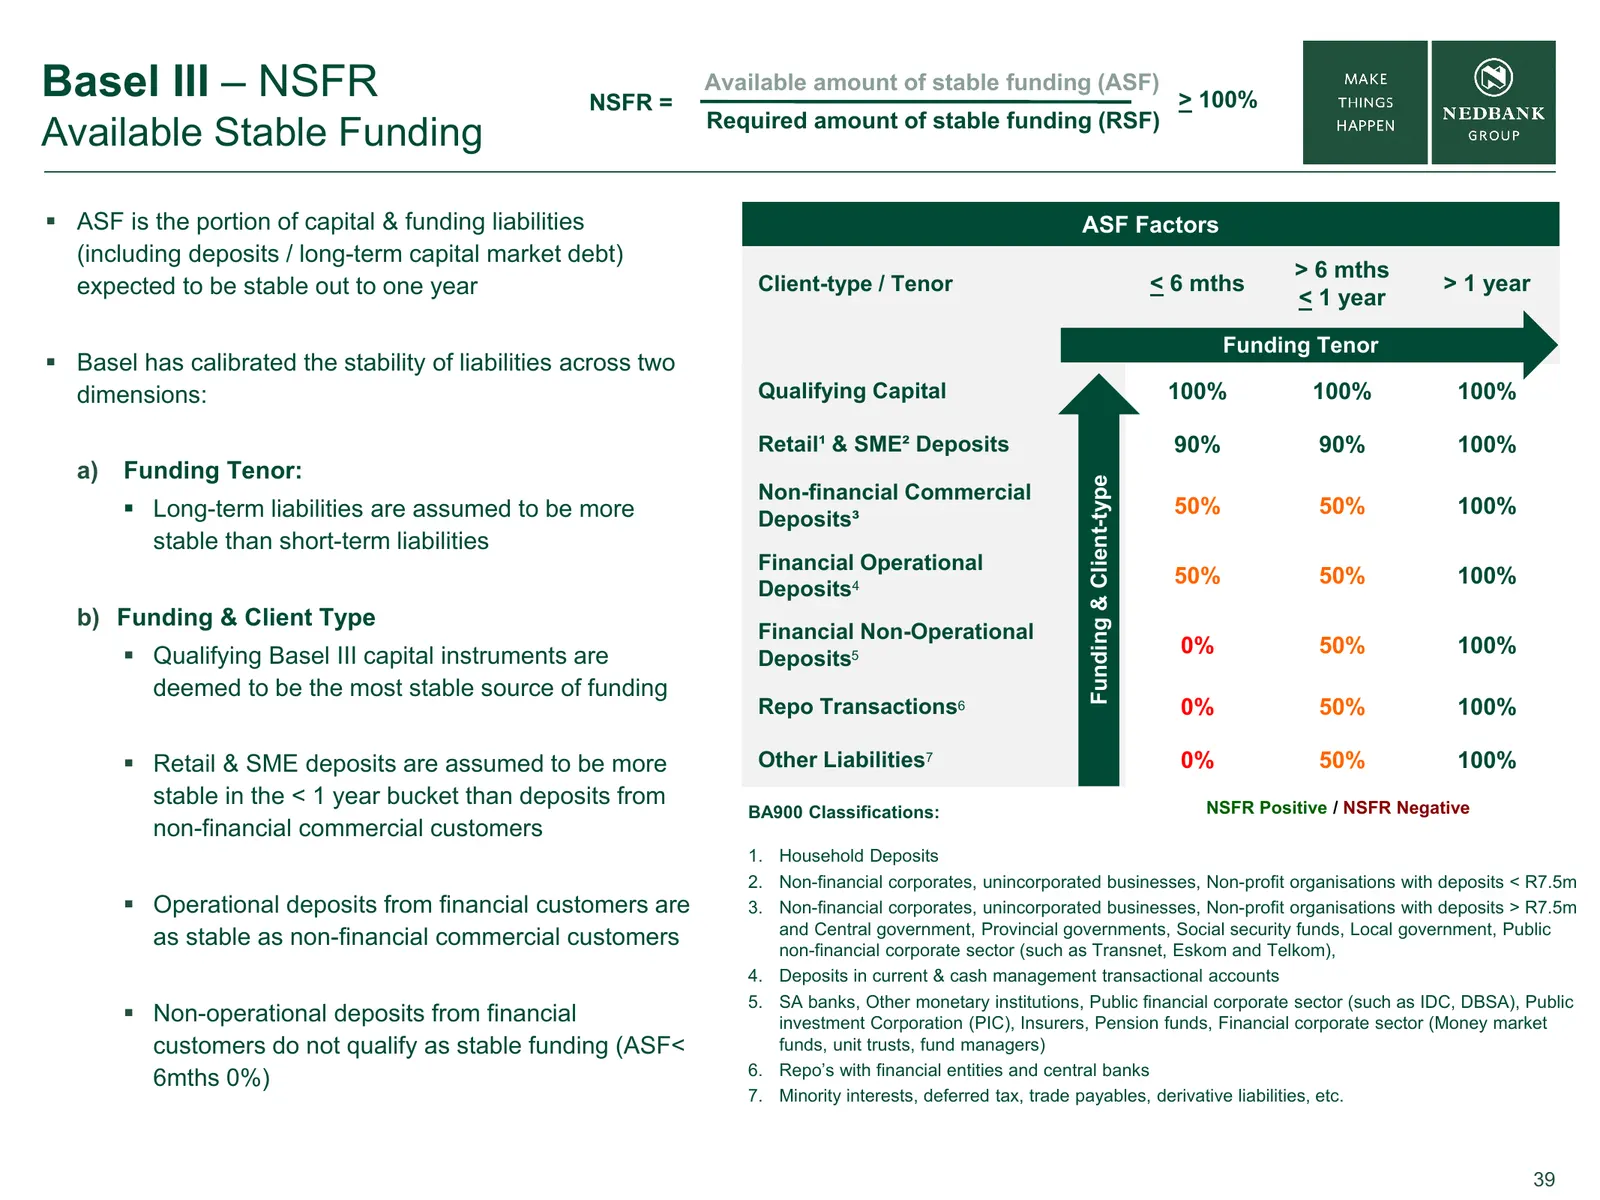
Slide 39: NSFR – Available Stable Funding
Basel III – NSFR NSFR = Available amount of stable funding (ASF) > 100% Required amount of stable funding (RSF) Available Stable Funding ASF is the portion of capital & funding liabilities ASF Factors (including deposits / long-term capital market debt) > 6 mths expected to be stable out to one ye
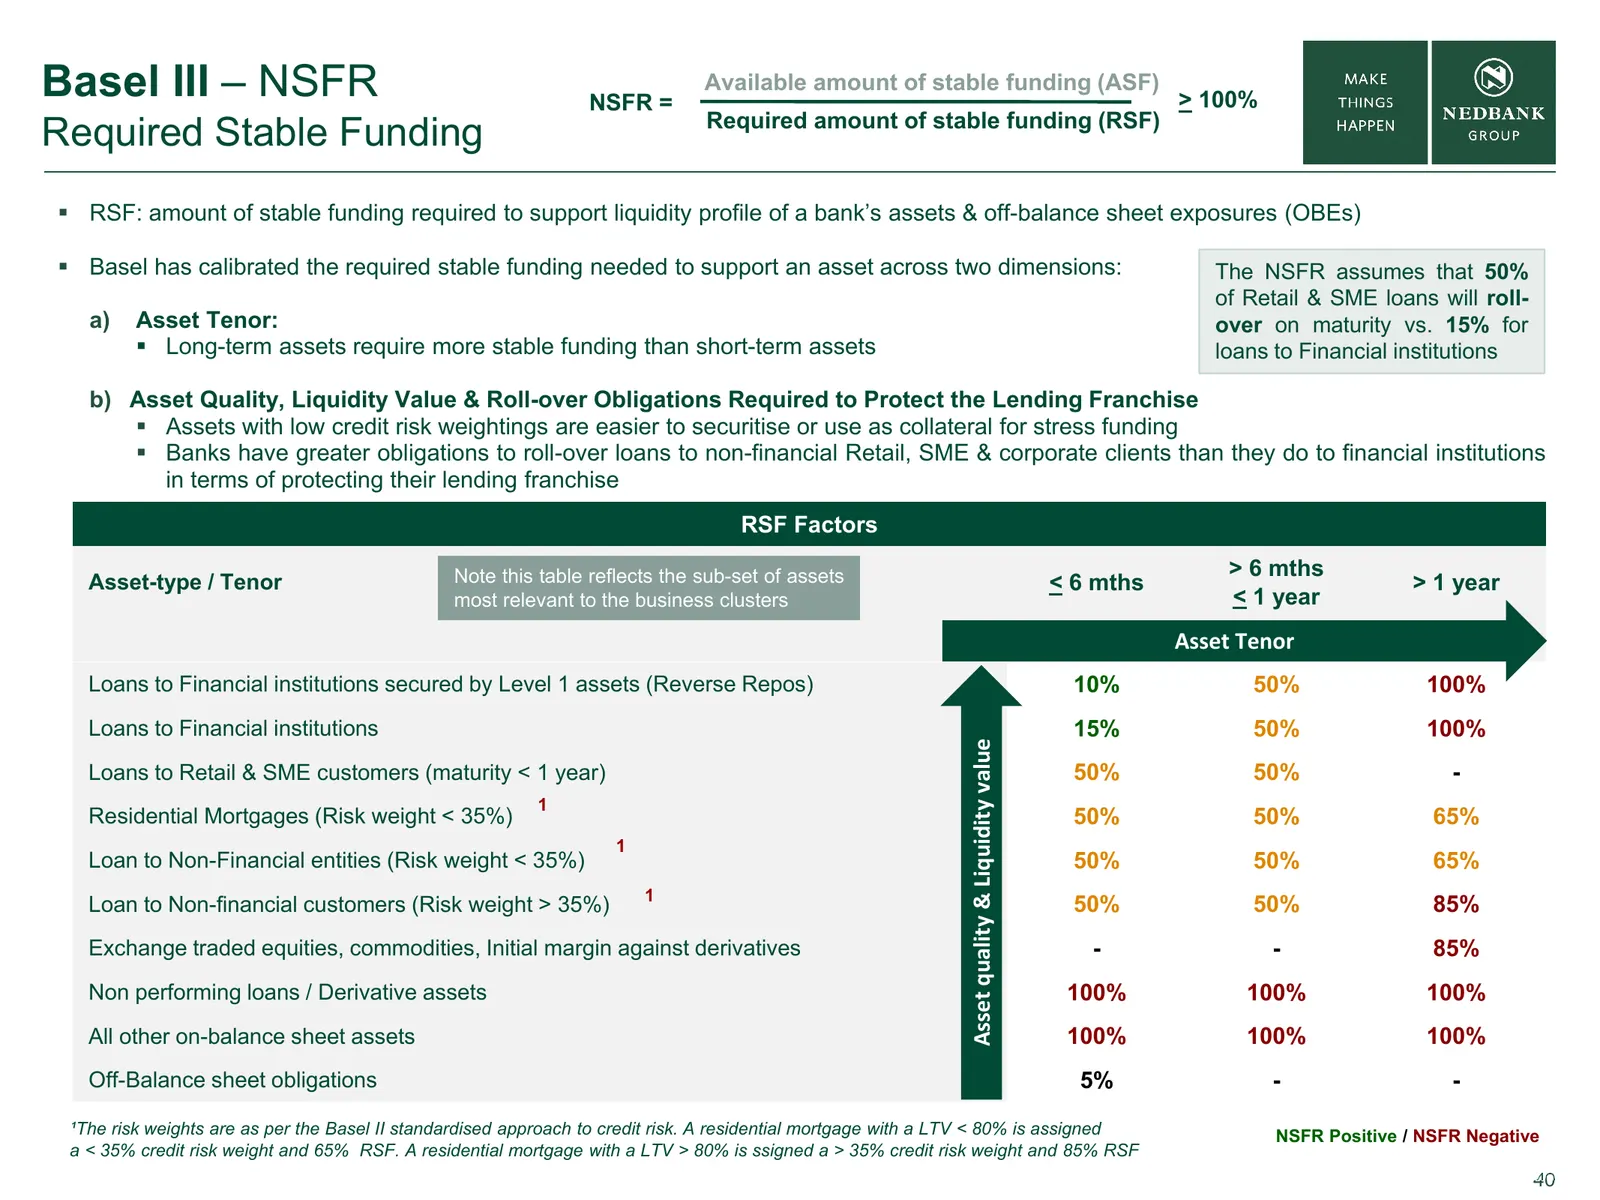
Slide 40: NSFR – Required Stable Funding
Basel III – NSFR NSFR = Available amount of stable funding (ASF) > 100% Required amount of stable funding (RSF) Required Stable Funding RSF: amount of stable funding required to support liquidity profile of a bank’s assets & off-balance sheet exposures (OBEs) Basel has calibrated the required st
Slide 41: Basel III – NSFR composition
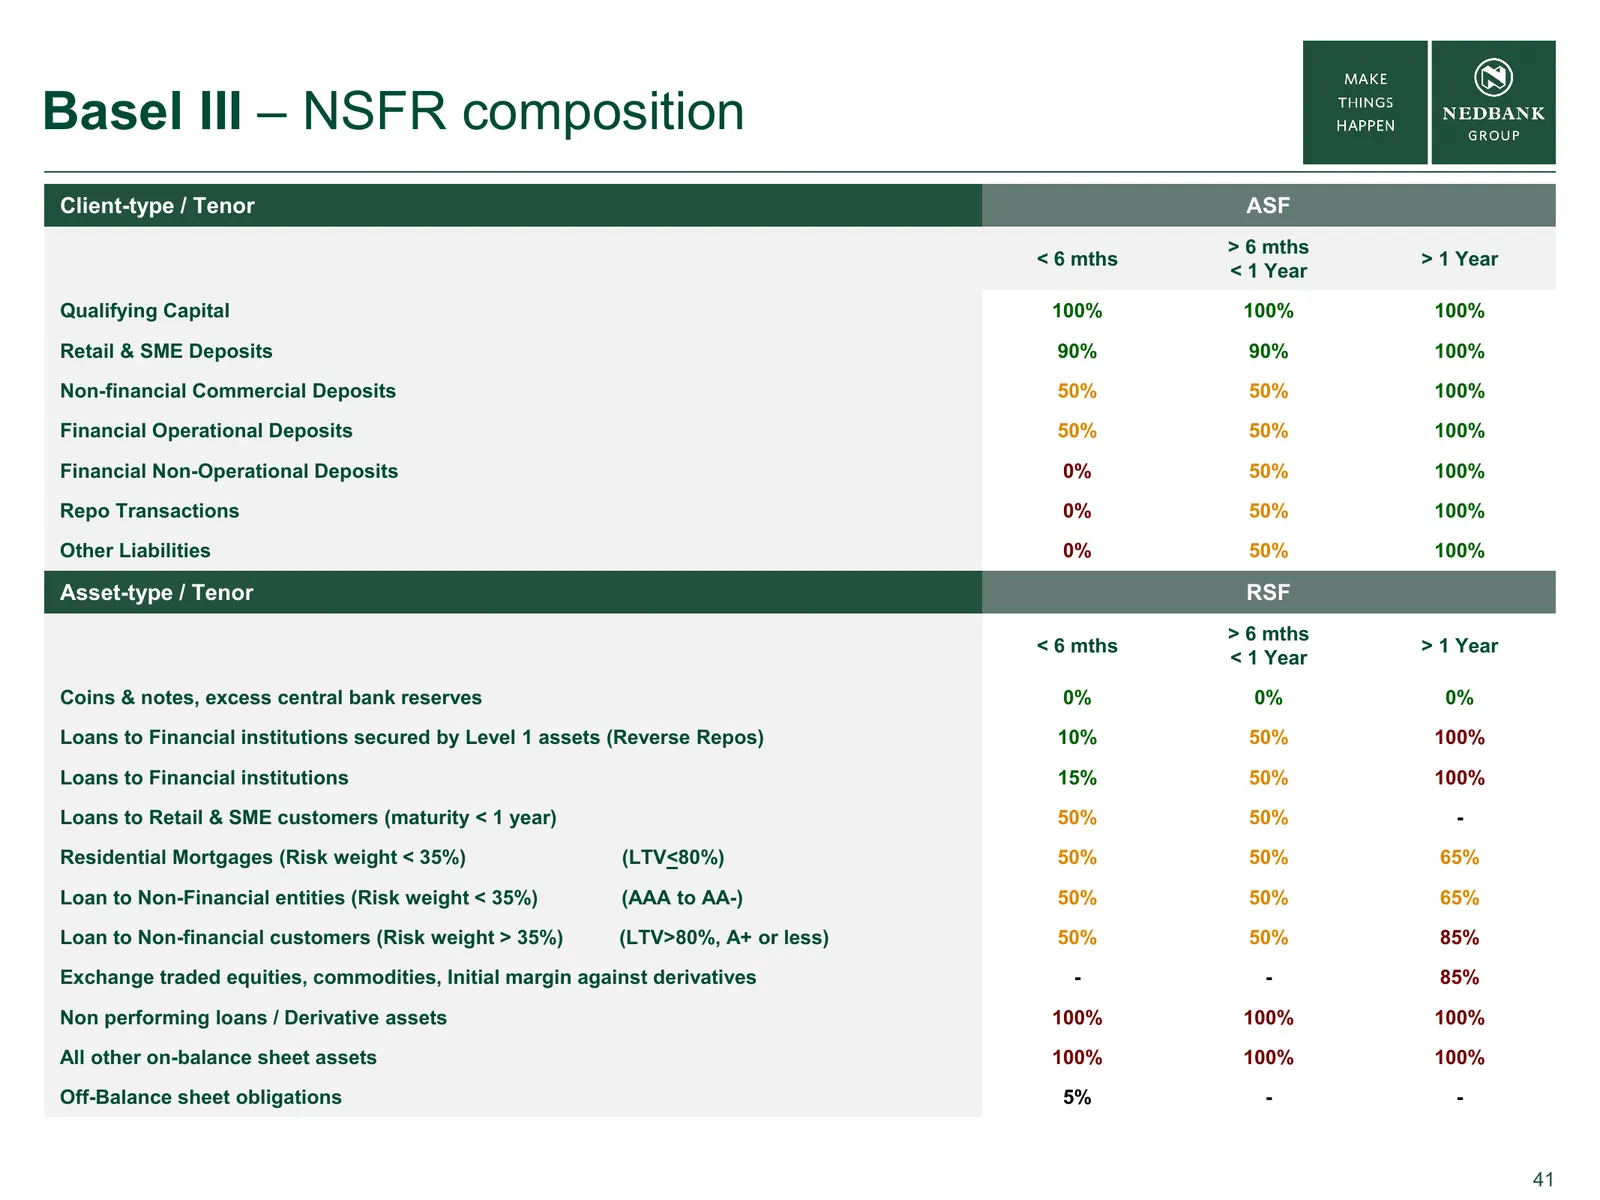
Basel III – NSFR composition Client-type / Tenor ASF > 6 mths < 6 mths > 1 Year < 1 Year Qualifying Capital 100% 100% 100% Retail & SME Deposits 90% 90% 100% Non-financial Commercial Deposits 50% 50% 100% Financial Operational Deposits 50% 50% 100% Financial Non-Operational Deposits 0% 50% 100% Repo
Slide 42: LCR optimisation strategies
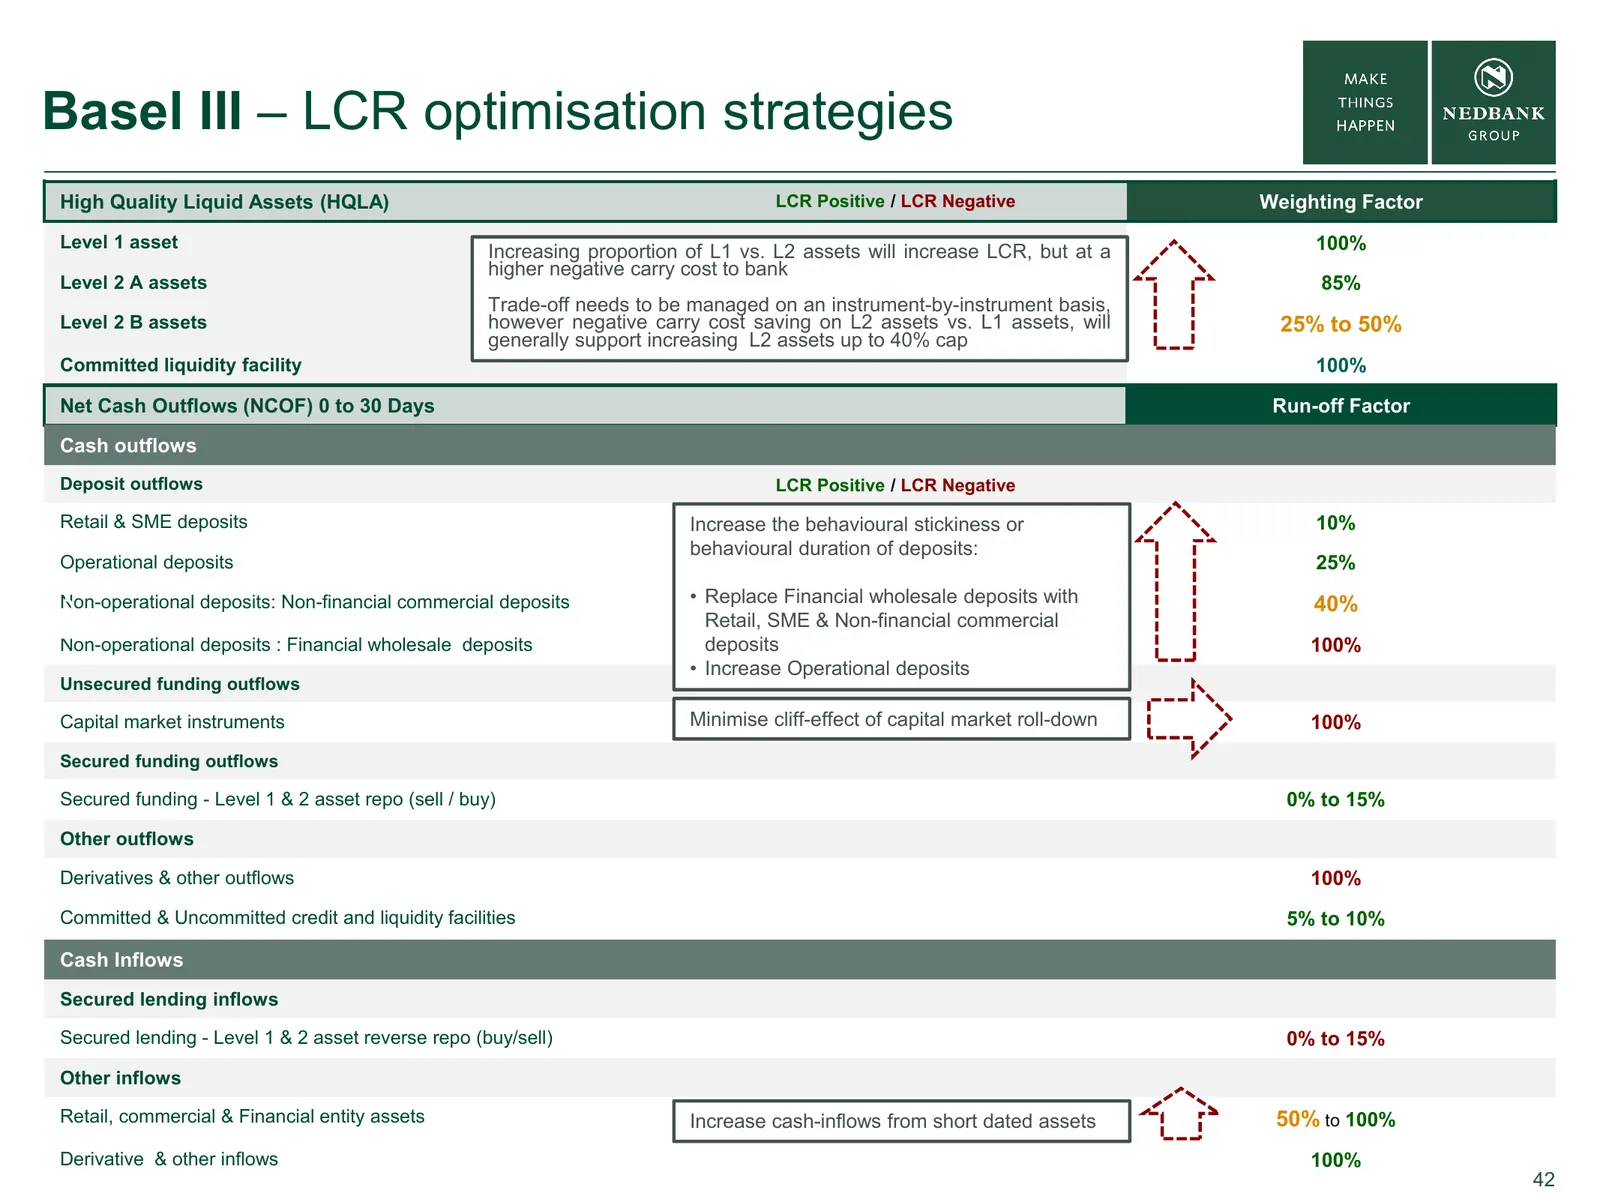
Basel III – LCR optimisation strategies High Quality Liquid Assets (HQLA) LCR Positive / LCR Negative Weighting Factor Level 1 asset Increasing proportion of L1 vs. L2 assets will increase LCR, but at a 100% higher negative carry cost to bank Level 2 A assets 85% Trade-off needs to be managed on an
Slide 43: Increase Deposit Stickiness (Behavioural Duration)
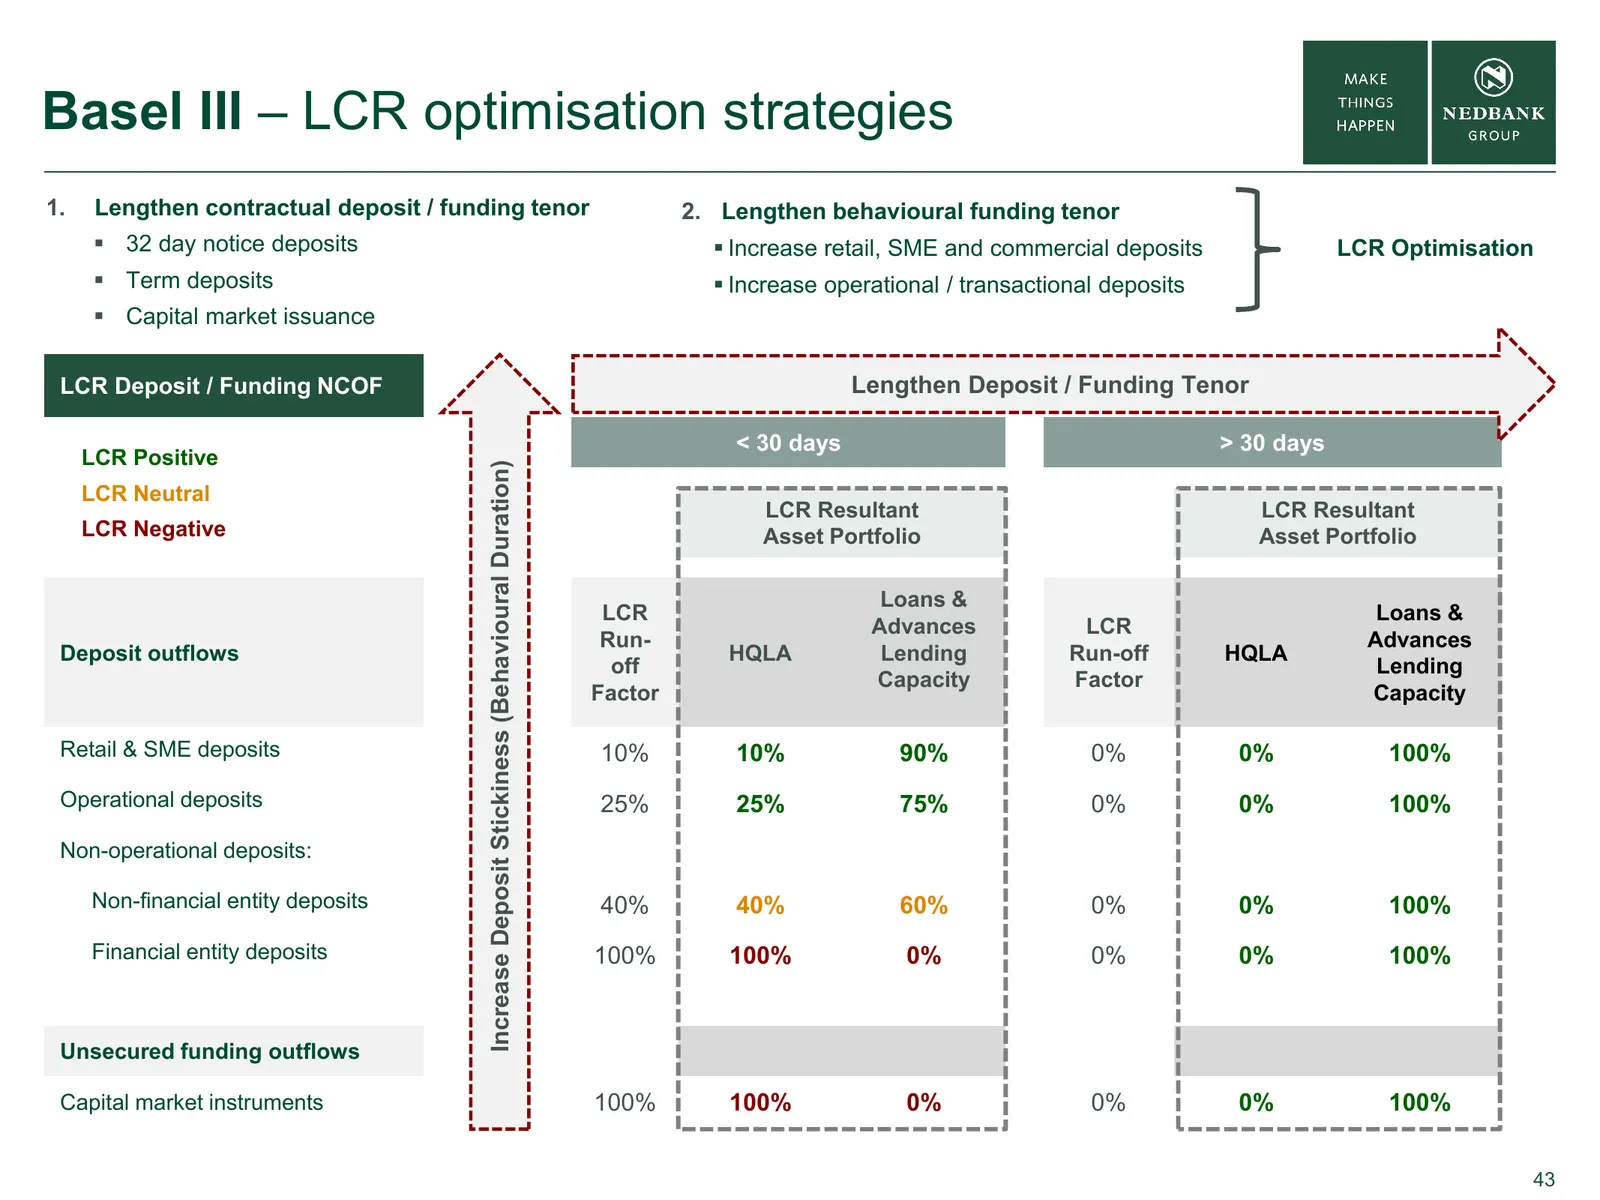
Basel III – LCR optimisation strategies 1. Lengthen contractual deposit / funding tenor 2. Lengthen behavioural funding tenor 32 day notice deposits Increase retail, SME and commercial deposits LCR Optimisation Term deposits Increase operational / transactional deposits Capital market issu
Slide 44: NSFR optimisation strategies
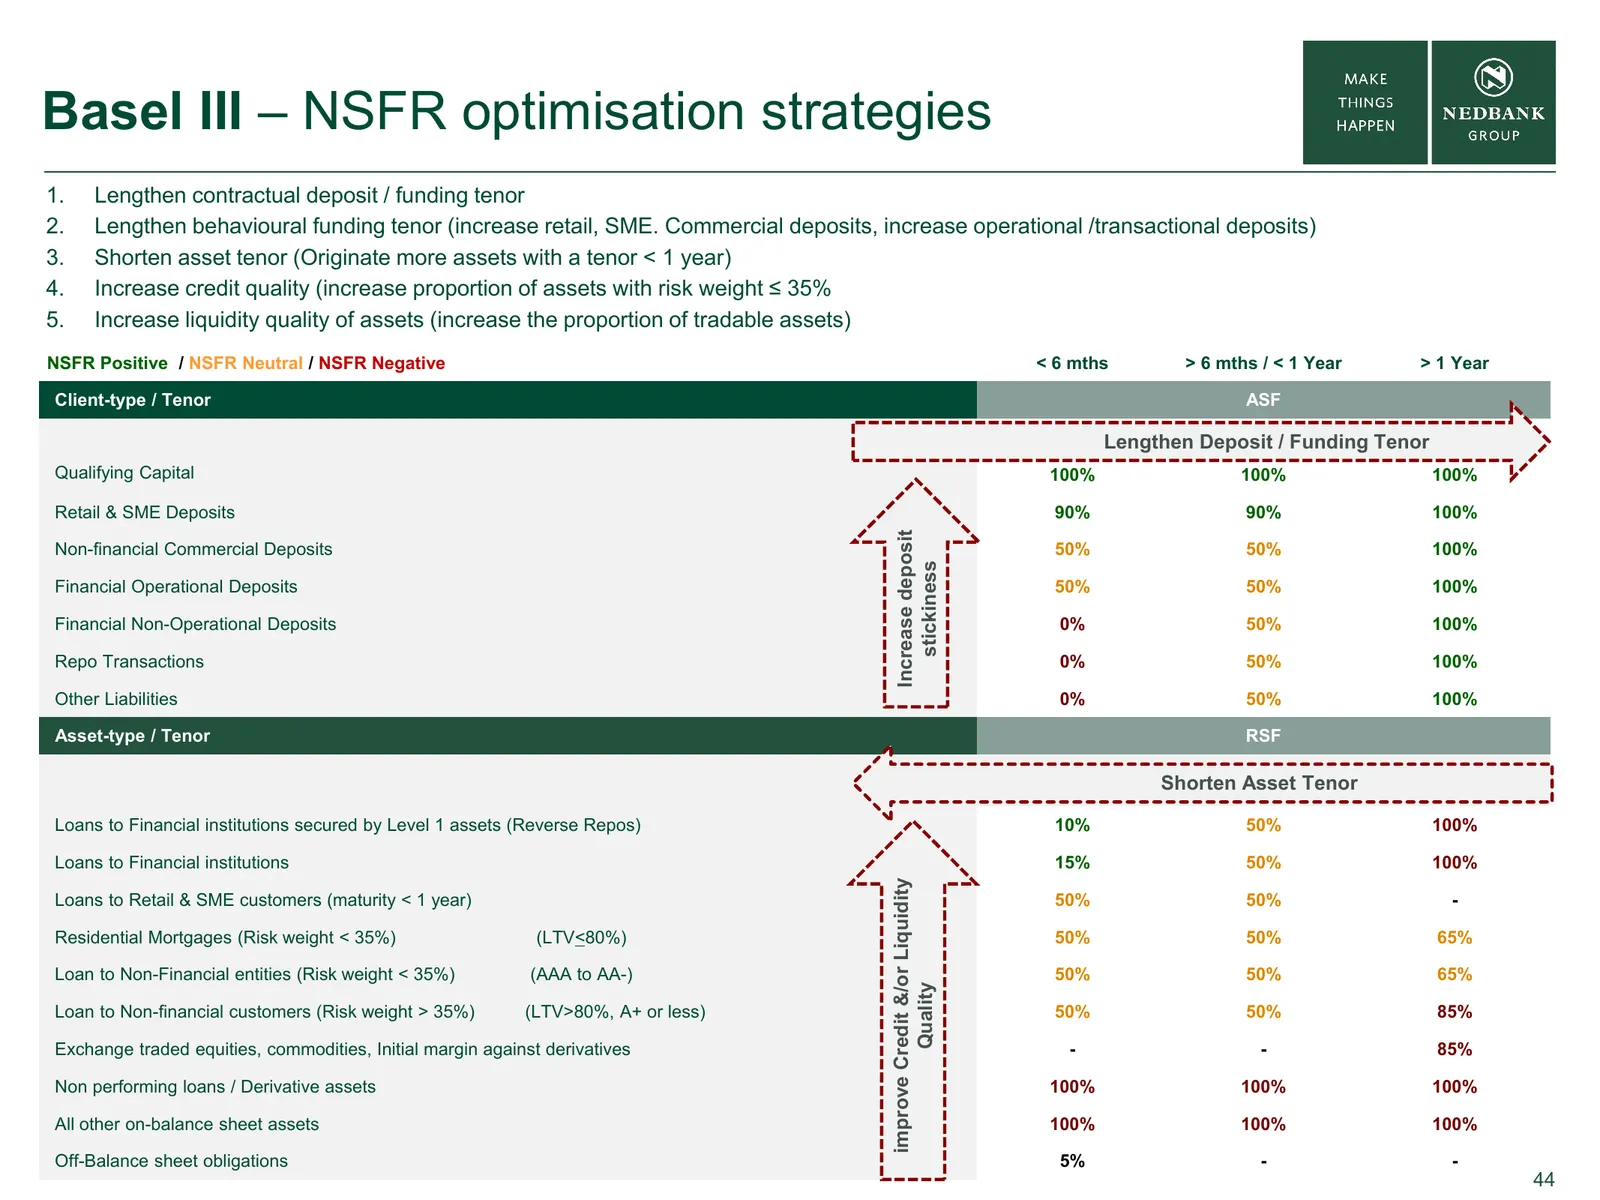
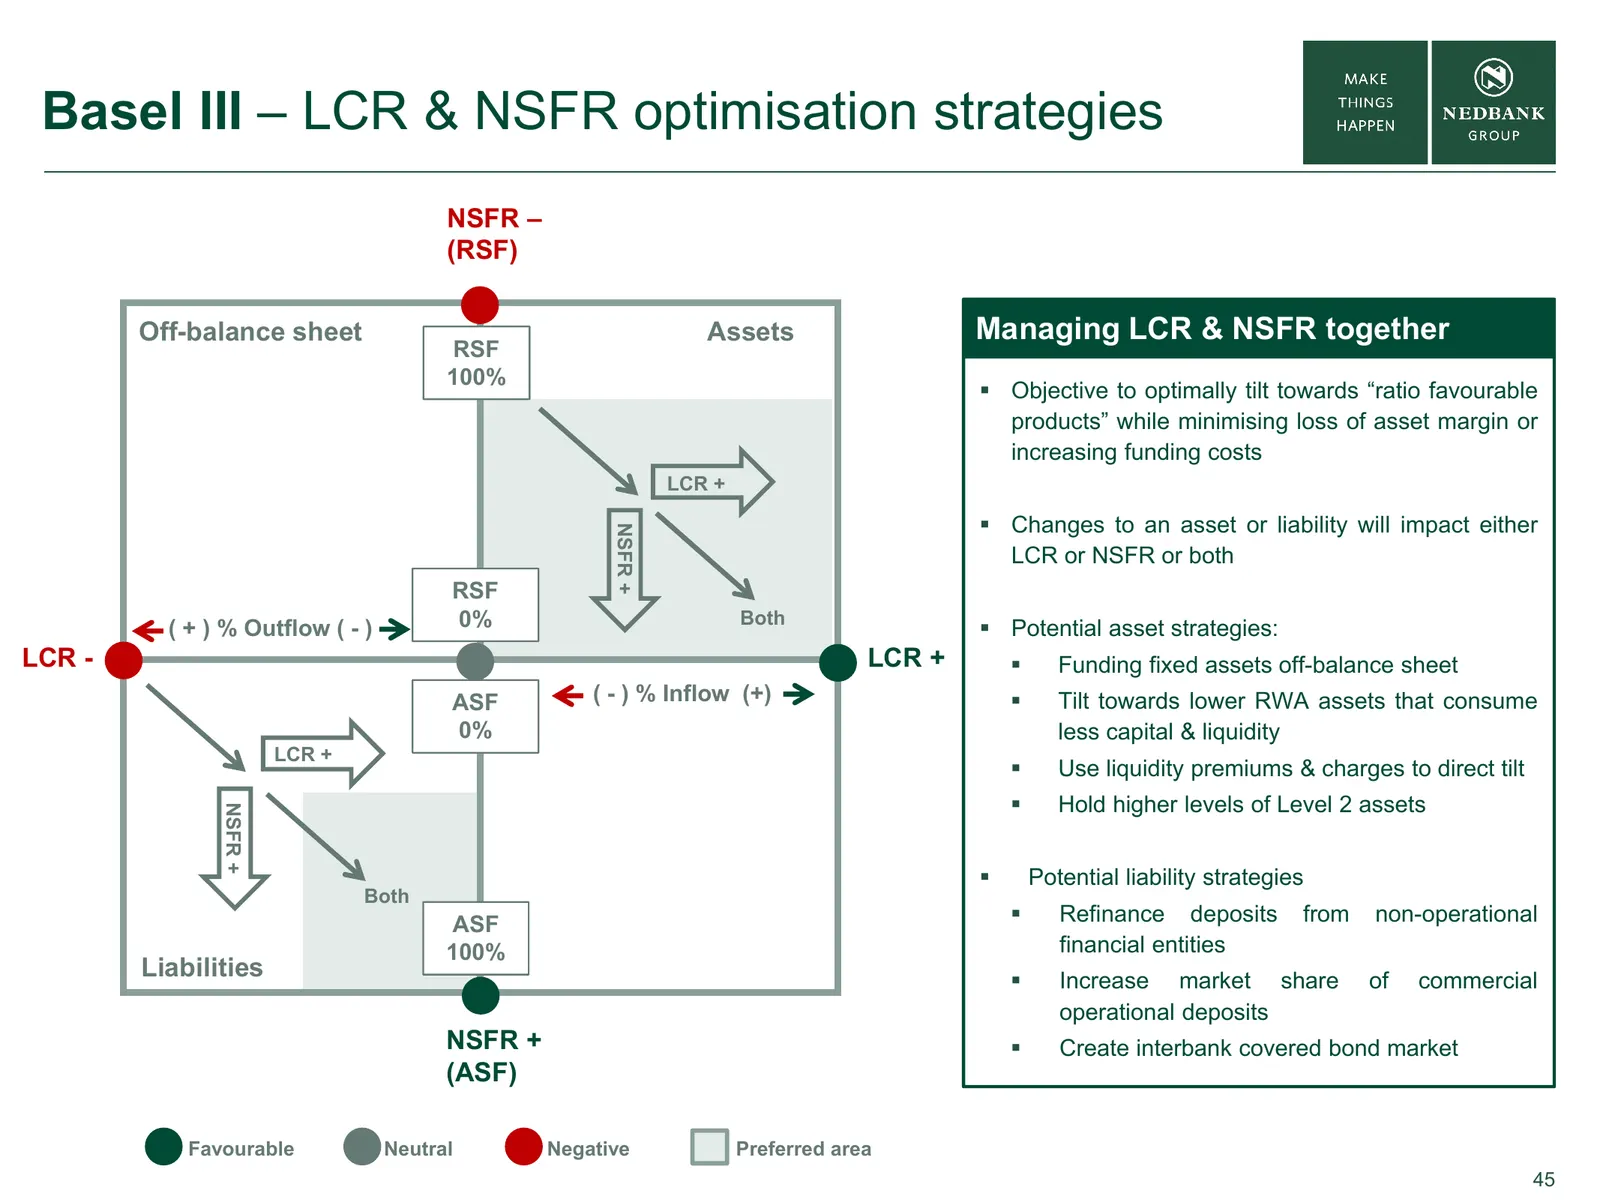
Basel III – NSFR optimisation strategies 1. Lengthen contractual deposit / funding tenor 2. Lengthen behavioural funding tenor (increase retail, SME. Commercial deposits, increase operational /transactional deposits) 3. Shorten asset tenor (Originate more assets with a tenor < 1 year) 4. Increase cr
Slide 45: LCR & NSFR optimisation strategies
Basel III – LCR & NSFR optimisation strategies NSFR – (RSF) Off-balance sheet Assets Managing LCR & NSFR together RSF 100% Objective to optimally tilt towards “ratio favourable products” while minimising loss of asset margin or increasing funding costs LCR + Changes to an asset or liability will
Slide 46: Basel III – Impact of LCR & NSFR on SA banks
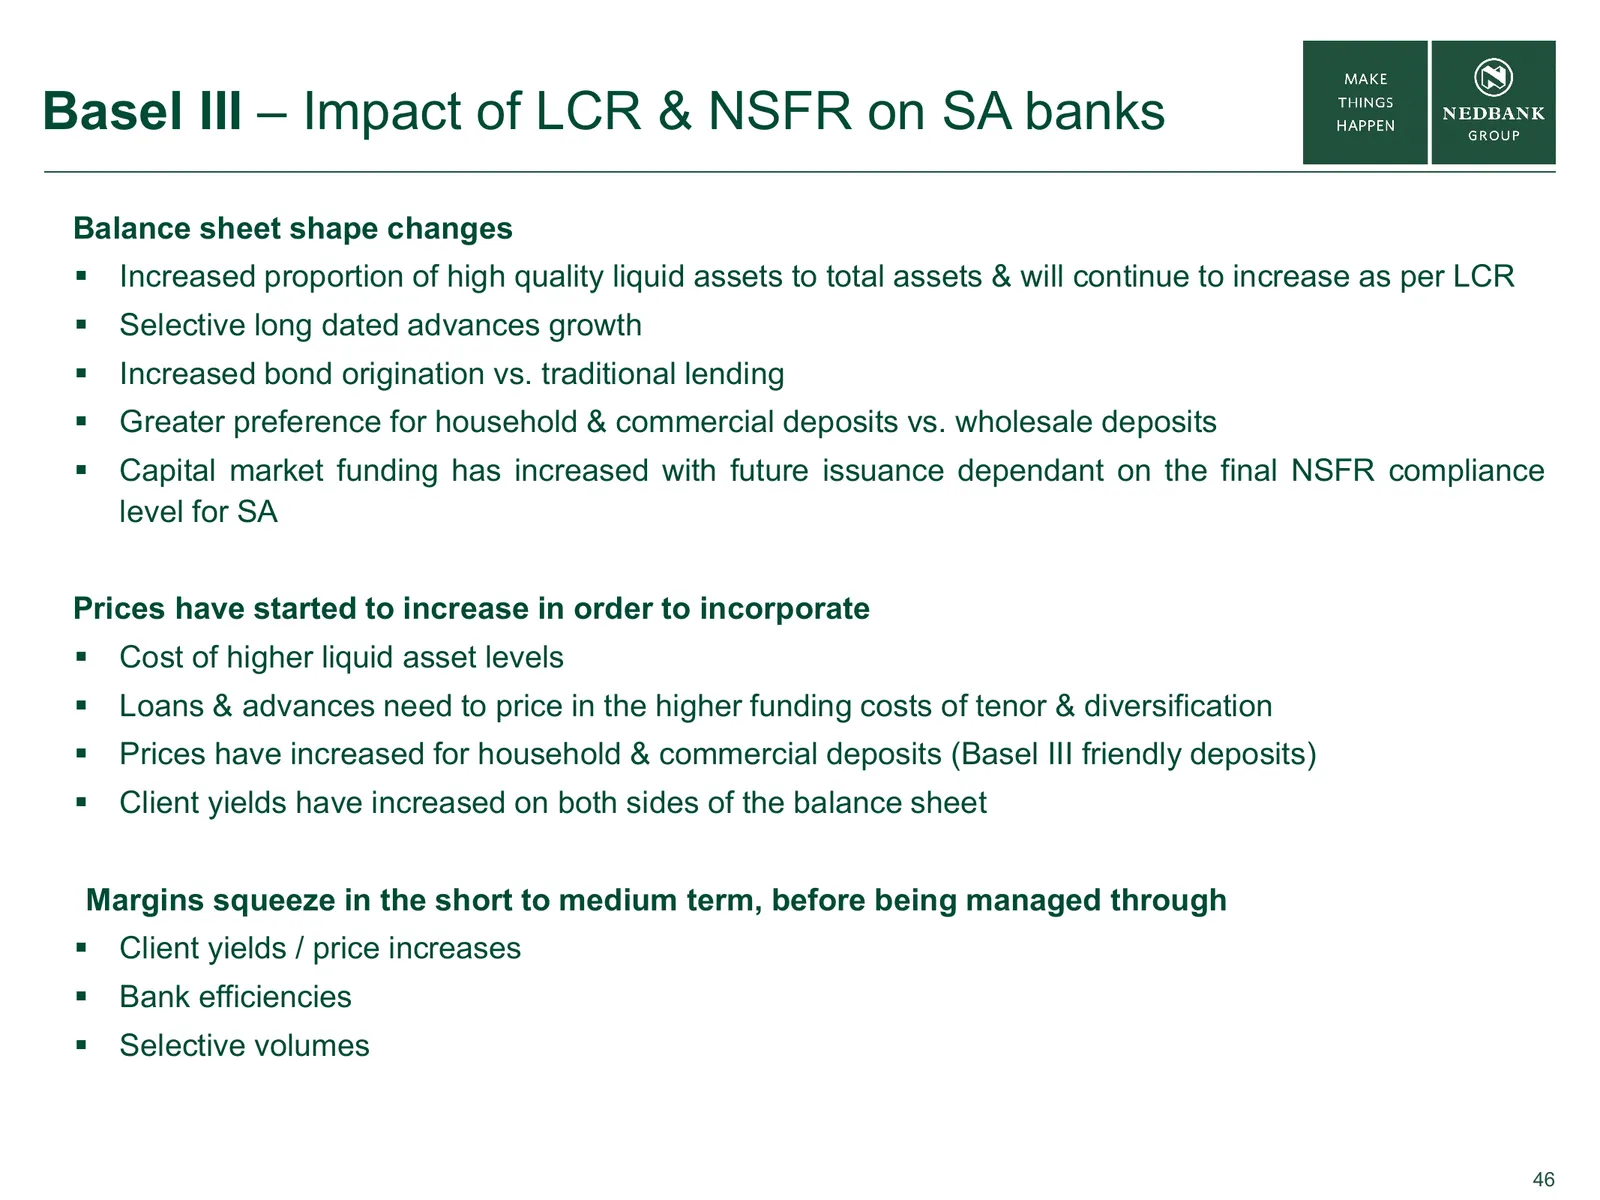
Basel III – Impact of LCR & NSFR on SA banks Balance sheet shape changes Increased proportion of high quality liquid assets to total assets & will continue to increase as per LCR Selective long dated advances growth Increased bond origination vs. traditional lending Greater preference for ho
Slide 47: Basel III – Proposed resolution framework
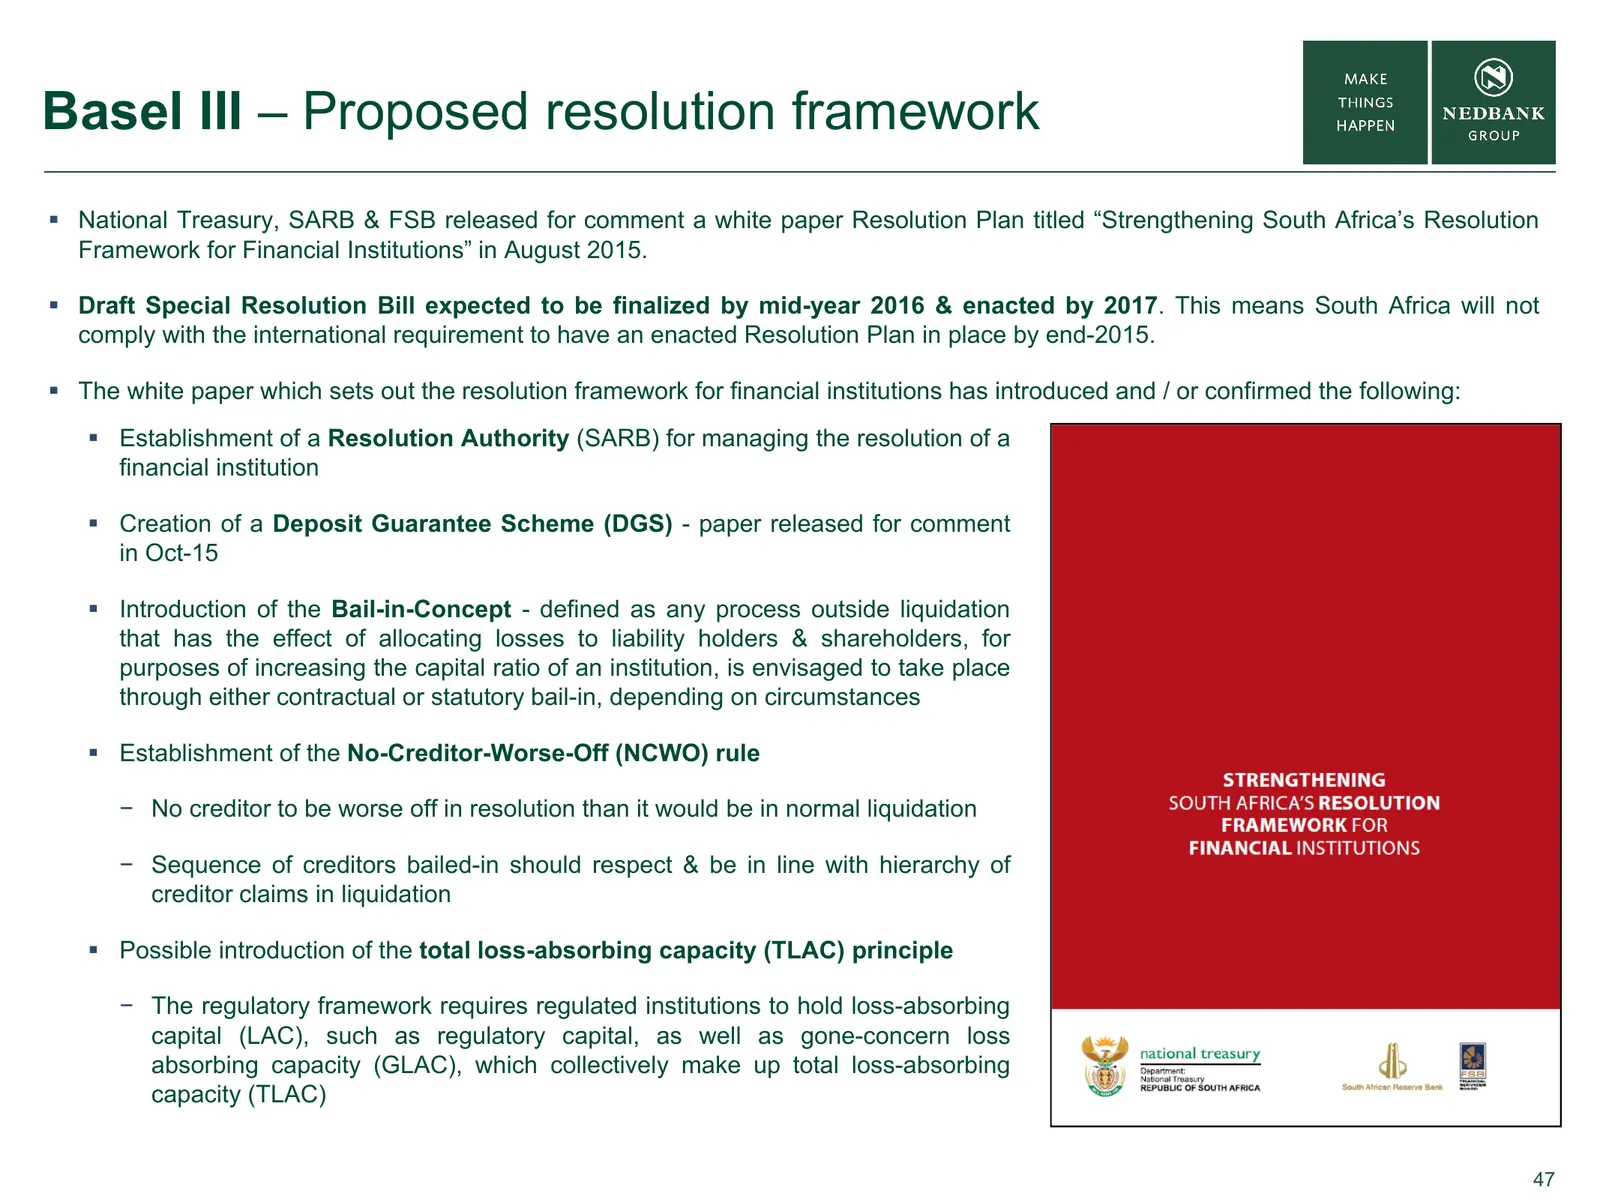
Basel III – Proposed resolution framework National Treasury, SARB & FSB released for comment a white paper Resolution Plan titled “Strengthening South Africa’s Resolution Framework for Financial Institutions” in August 2015. Draft Special Resolution Bill expected to be finalized by mid-year 2016
Slide 48: Basel III – Summary
Basel III – Summary SA Banks well above minimum regulatory requirements & within new Basel III target ranges on day one as a result of proactive and early capital management actions LCR compliance during the transitional phase-in will be achieved through acquisition of surplus liquid asset buffe

Slide 49: Thank you
THANK YOU 49
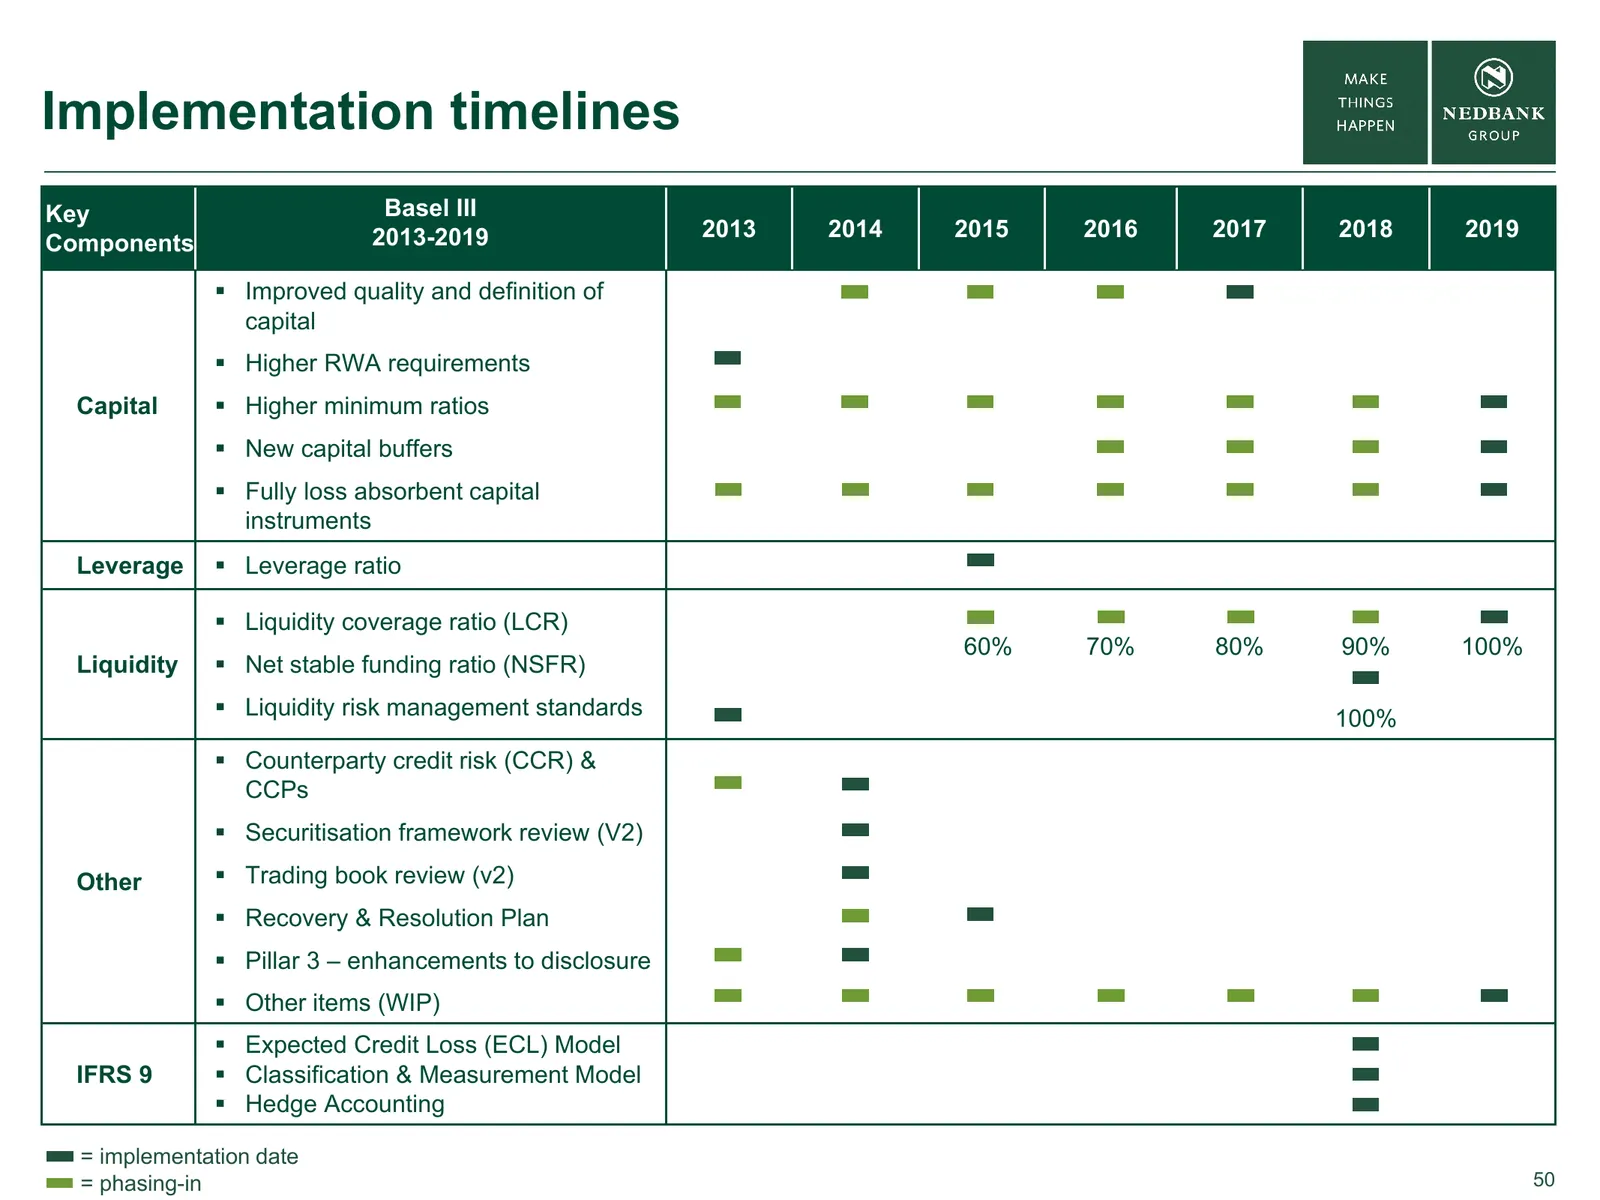
Slide 50: Implementation timelines
Implementation timelines Key Basel III 2013-2019 2013 2014 2015 2016 2017 2018 2019 Components Improved quality and definition of capital Higher RWA requirements Capital Higher minimum ratios New capital buffers Fully loss absorbent capital instruments Leverage Leverage ratio Liquidity
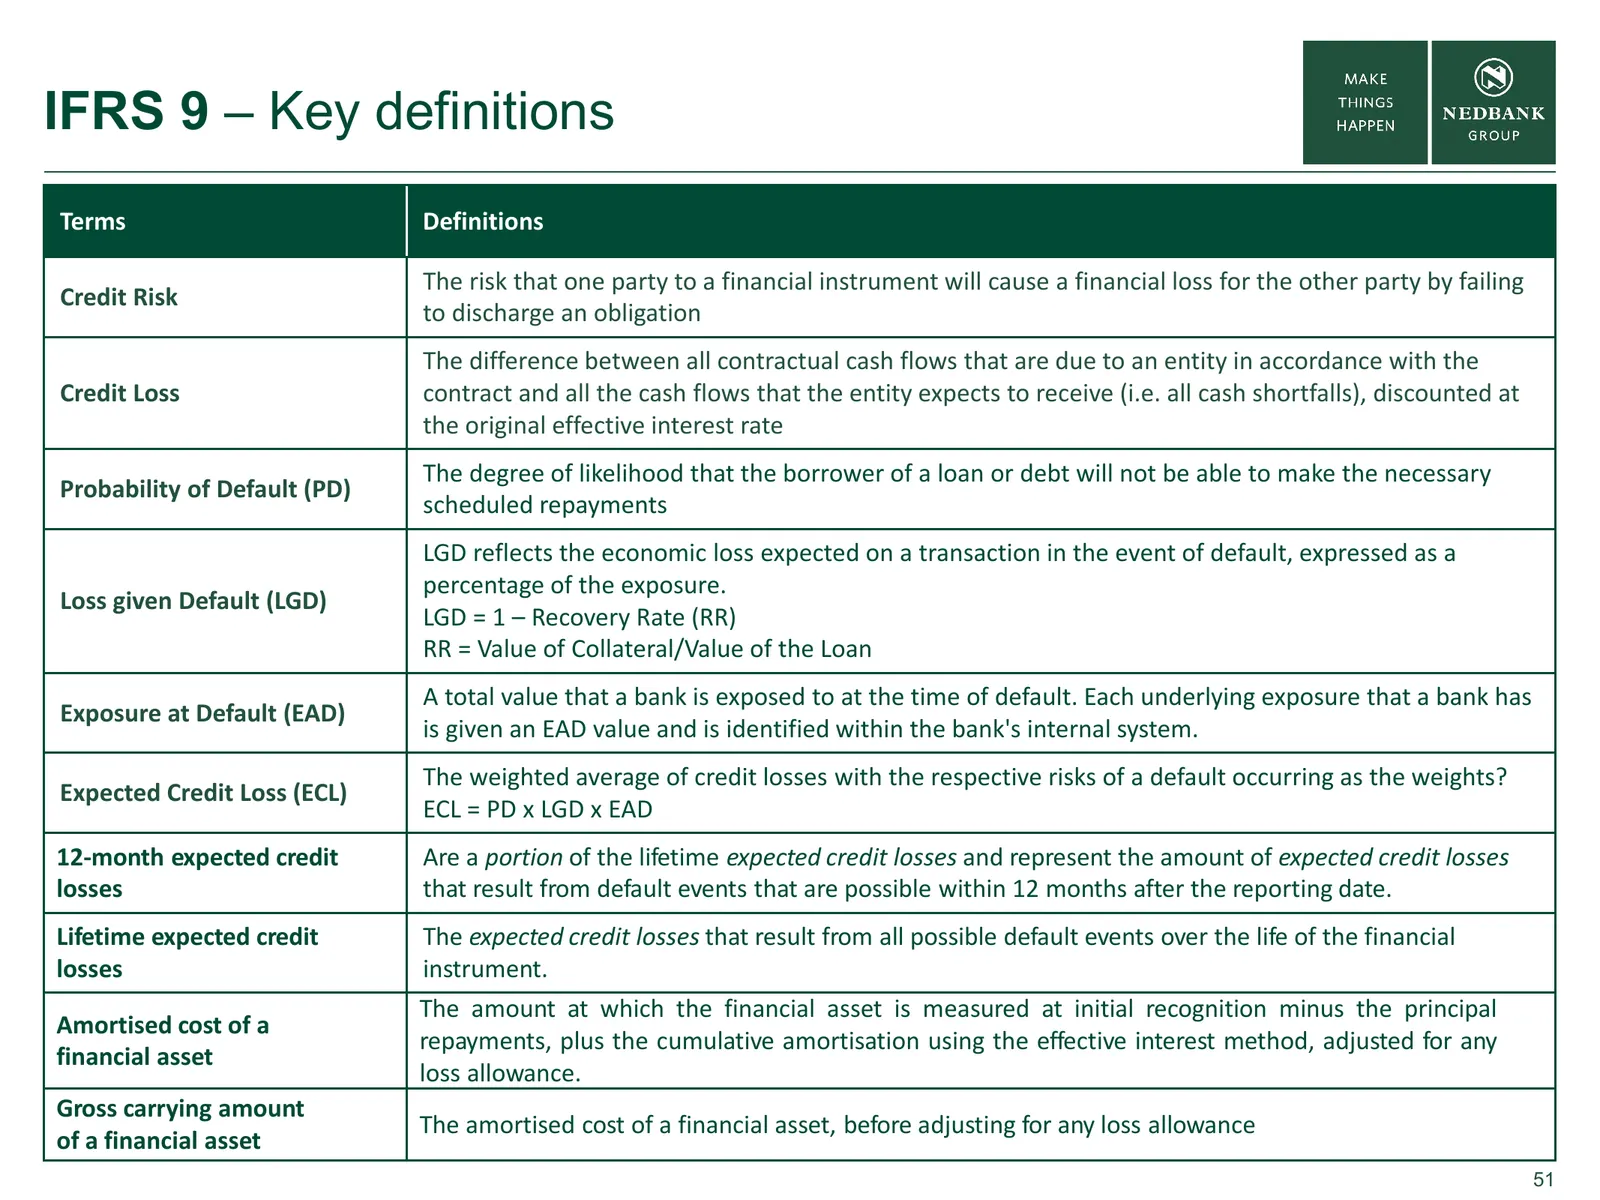
Slide 51: IFRS 9 – Key definitions
IFRS 9 – Key definitions Terms Definitions Nedbank share price (Rand) The risk that one party to a financial instrument will cause a financial loss for the other party by failing Credit Risk to discharge an obligation The difference between all contractual cash flows that are due to an entity in acc

Slide 52: Contact us & Disclaimer
Contact us & Disclaimer Nedbank Group Nedbank Investor Relations www.nedbankgroup.co.za Head of Investor Relations Nedbank Group Limited Alfred Visagie Tel: +27 (0) 11 294 4444 Direct tel: +27 (0) 11 295 6249 Physical address Cell: +27 (0) 82 855 4692 135 Rivonia Road Email: AlfredV@nedbank.co.za Sa
Source: Internet Archive copy of nedbank.co.za
More decks from Nedbank Group
 FY2025 Earnings Presentation50 slides · February 2026
 FY2024 Earnings Presentation63 slides · March 2025
 27th UBS SA Financial Services Conference 202424 slides · October 2024
 Investor Presentation (October 2024)20 slides · October 2024
 Emerge — Nedbank Investment Conference (2024)22 slides · Sep 10, 2024
 H1 2024 Earnings Presentation85 slides · Aug 6, 2024