Flutter Entertainment plc · NYSE:FLUT
Flutter Entertainment — Paddy Power Betfair — H1 2018 Earnings Presentation
28 slides from Flutter Entertainment's earnings presentation, 2018
Slide 1: Paddy Power Betfair plc 2018 Interim Results
Paddy Power Betfair plc 2018 Interim Results
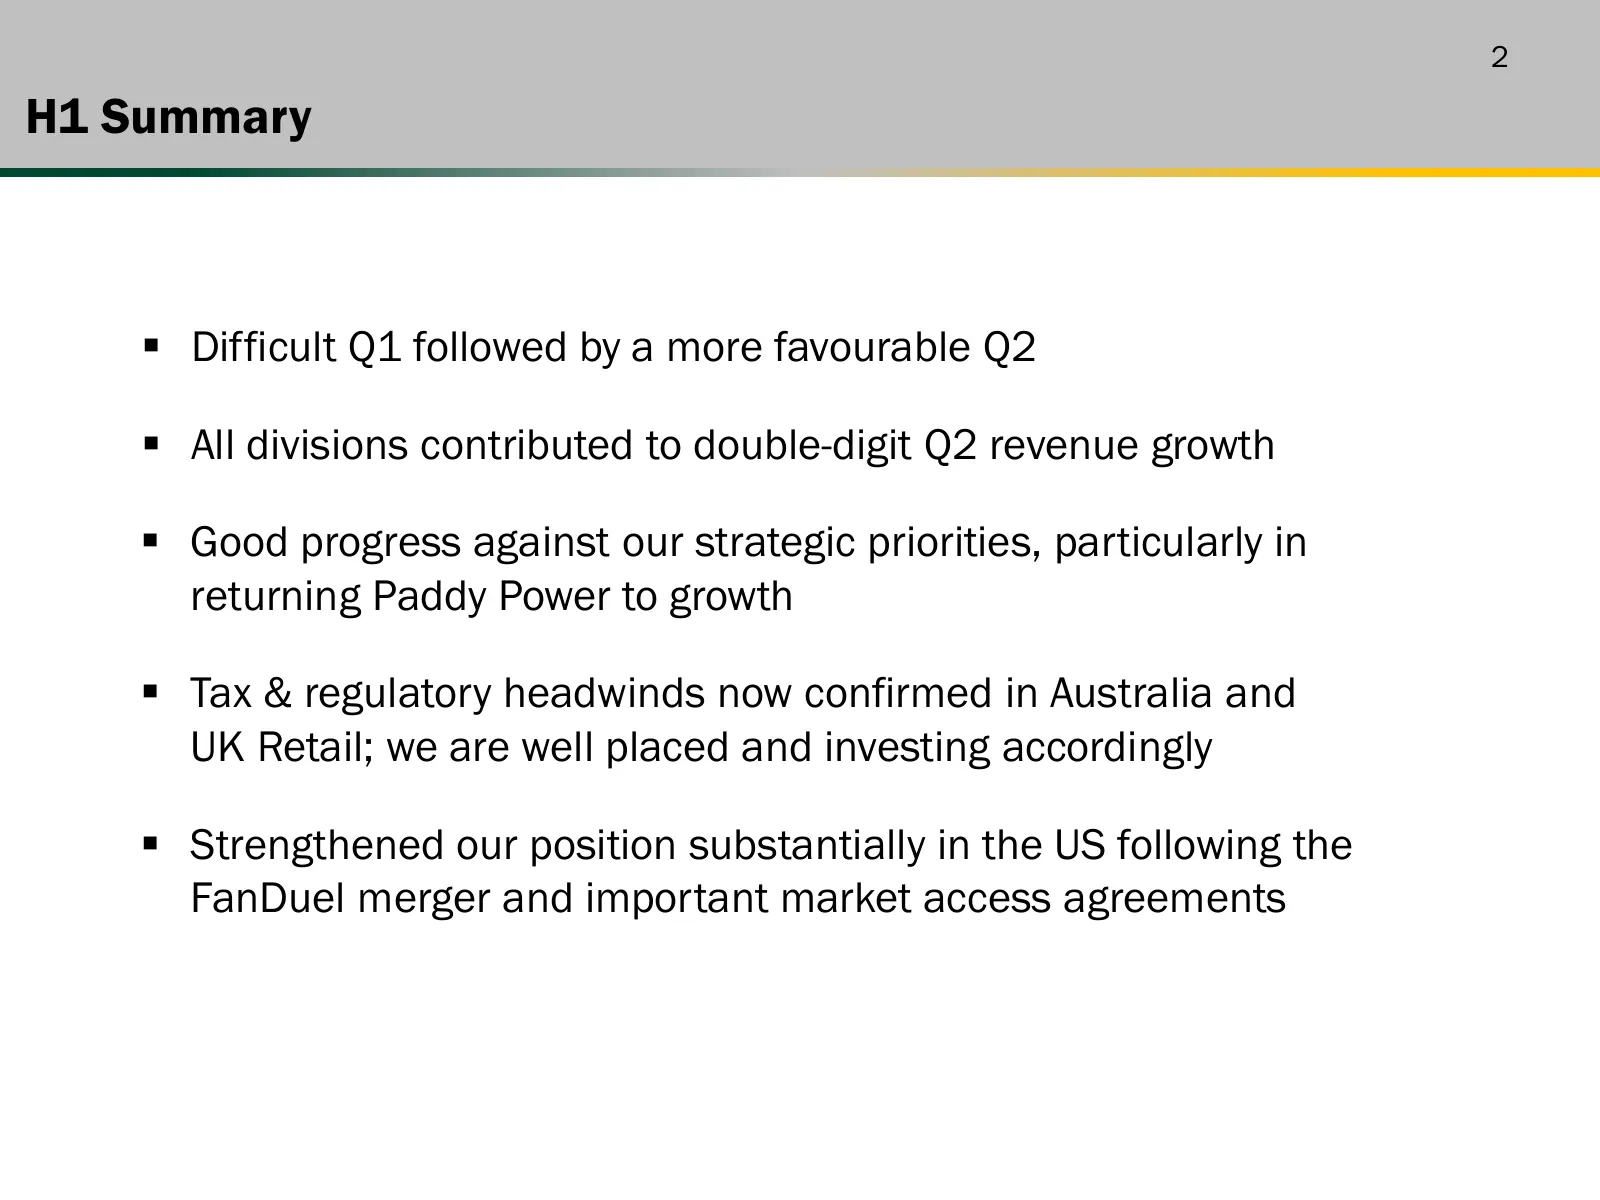
Slide 2: H1 Summary
2 H1 Summary Difficult Q1 followed by a more favourable Q2 All divisions contributed to double-digit Q2 revenue growth Good progress against our strategic priorities, particularly in returning Paddy Power to growth Tax & regulatory headwinds now confirmed in Australia and UK Retail; we are w

Slide 3: Financial & Operating Review
Financial & Operating Review
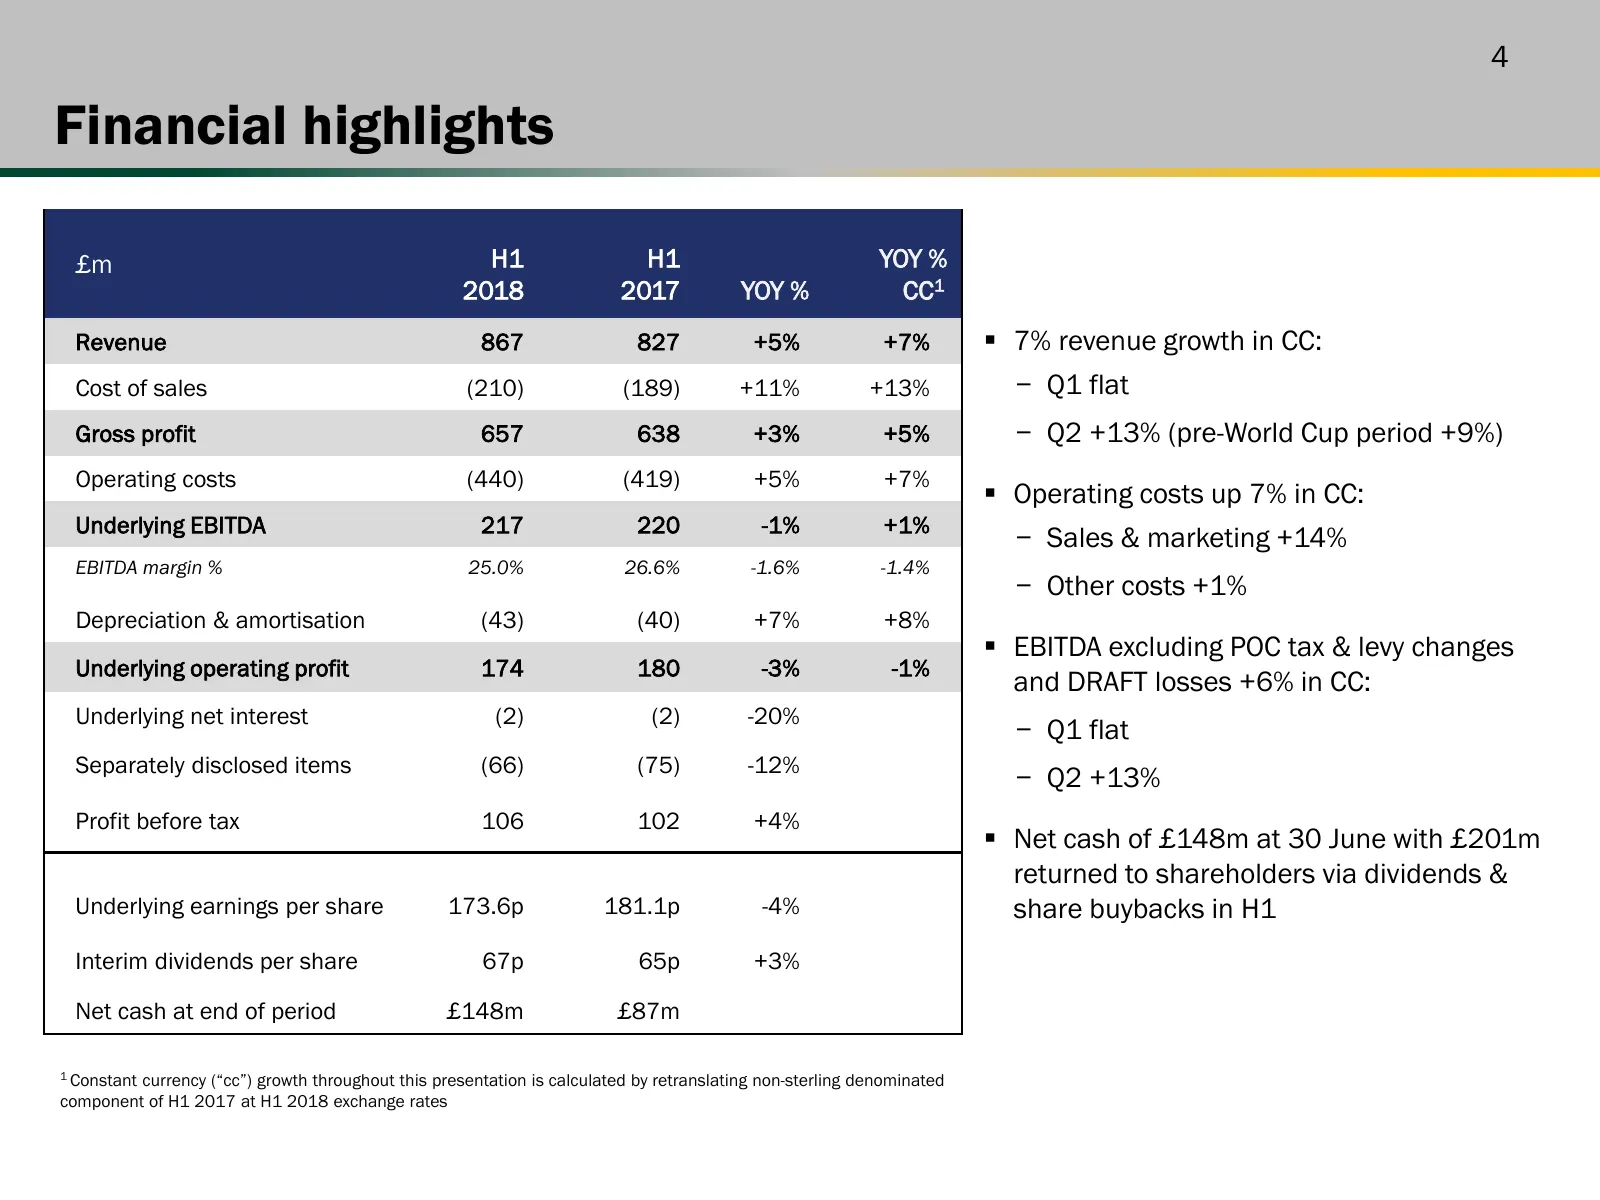
Slide 4: Financial highlights
4 Financial highlights £m H1 H1 YOY % 2018 2017 YOY % CC1 Revenue 867 827 +5% +7% 7% revenue growth in CC: Cost of sales (210) (189) +11% +13% − Q1 flat Gross profit 657 638 +3% +5% − Q2 +13% (pre-World Cup period +9%) Operating costs (440) (419) +5% +7% Operating costs up 7% in CC: Underlying E
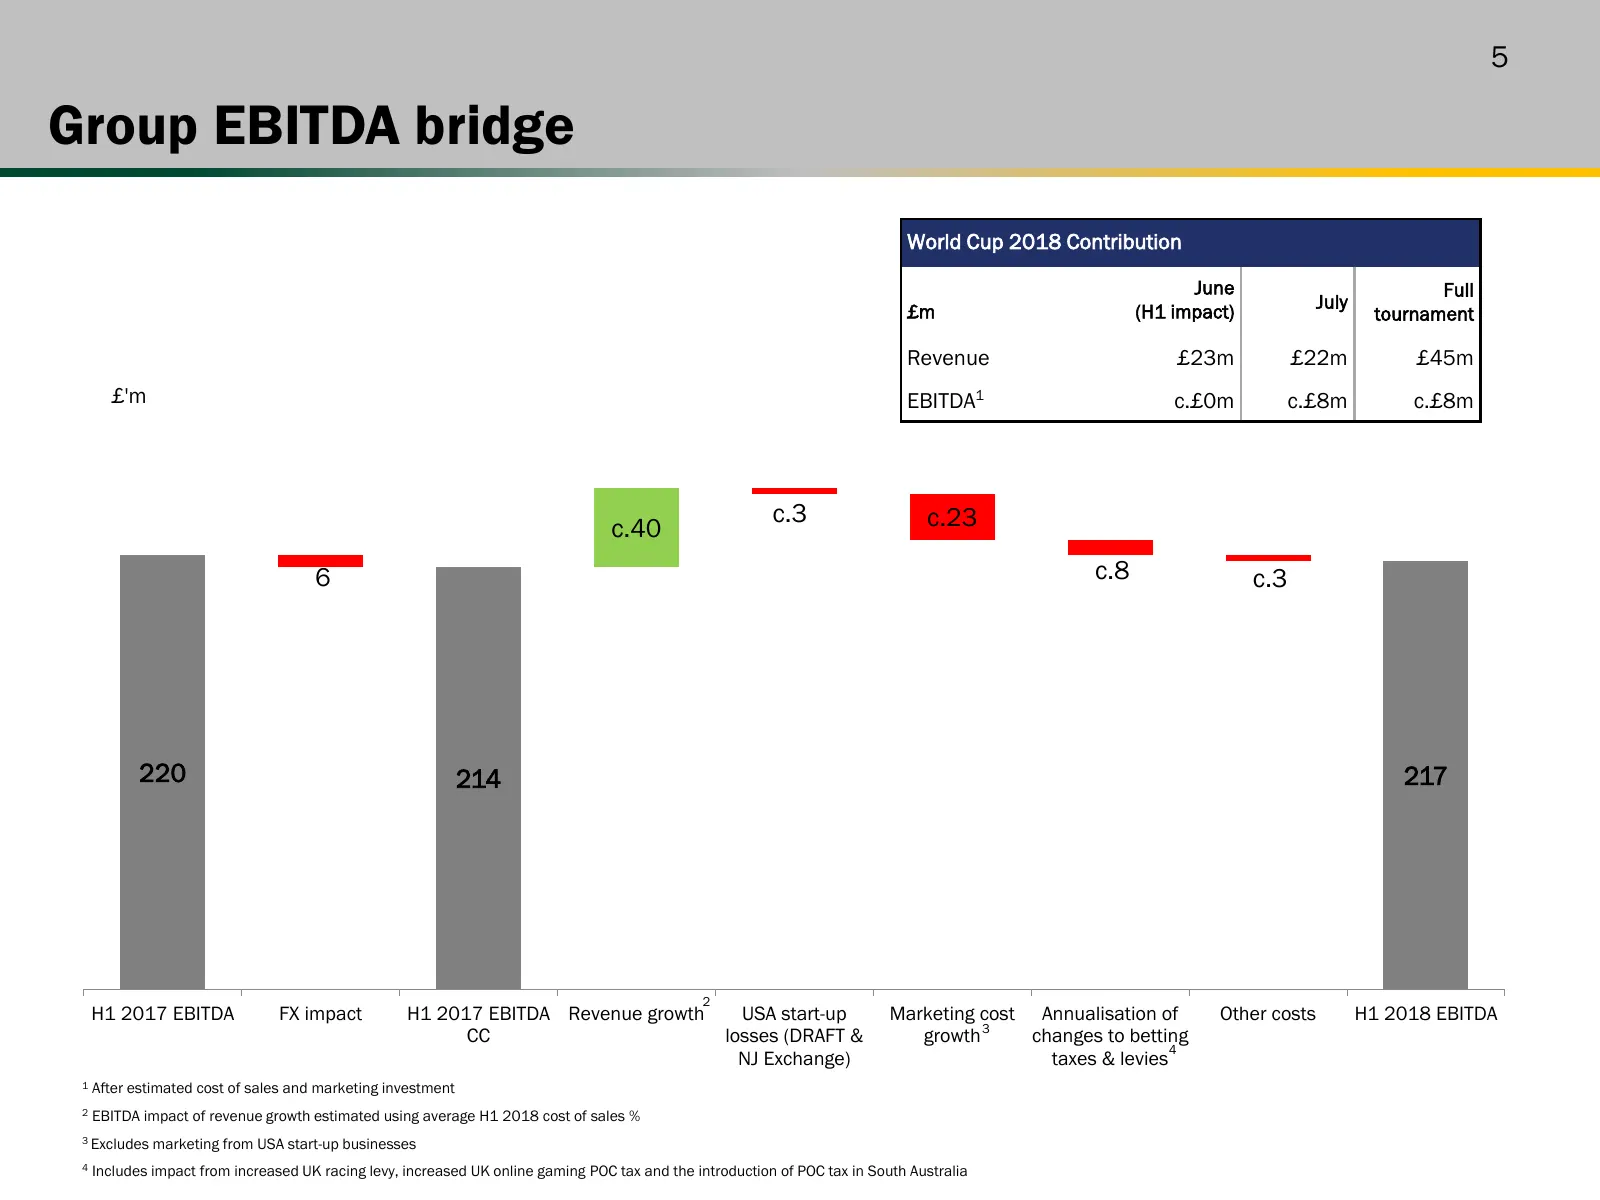
Slide 5: Group EBITDA bridge
5 Group EBITDA bridge World Cup 2018 Contribution June Full £m (H1 impact) July tournament Revenue £23m £22m £45m £'m EBITDA1 c.£0m c.£8m c.£8m c.3 c.23 c.40 6 c.8 c.3 220 214 217 2 H1 2017 EBITDA FX impact H1 2017 EBITDA Revenue growth USA start-up Marketing cost Annualisation of Other costs H1 201
Slide 6: Online
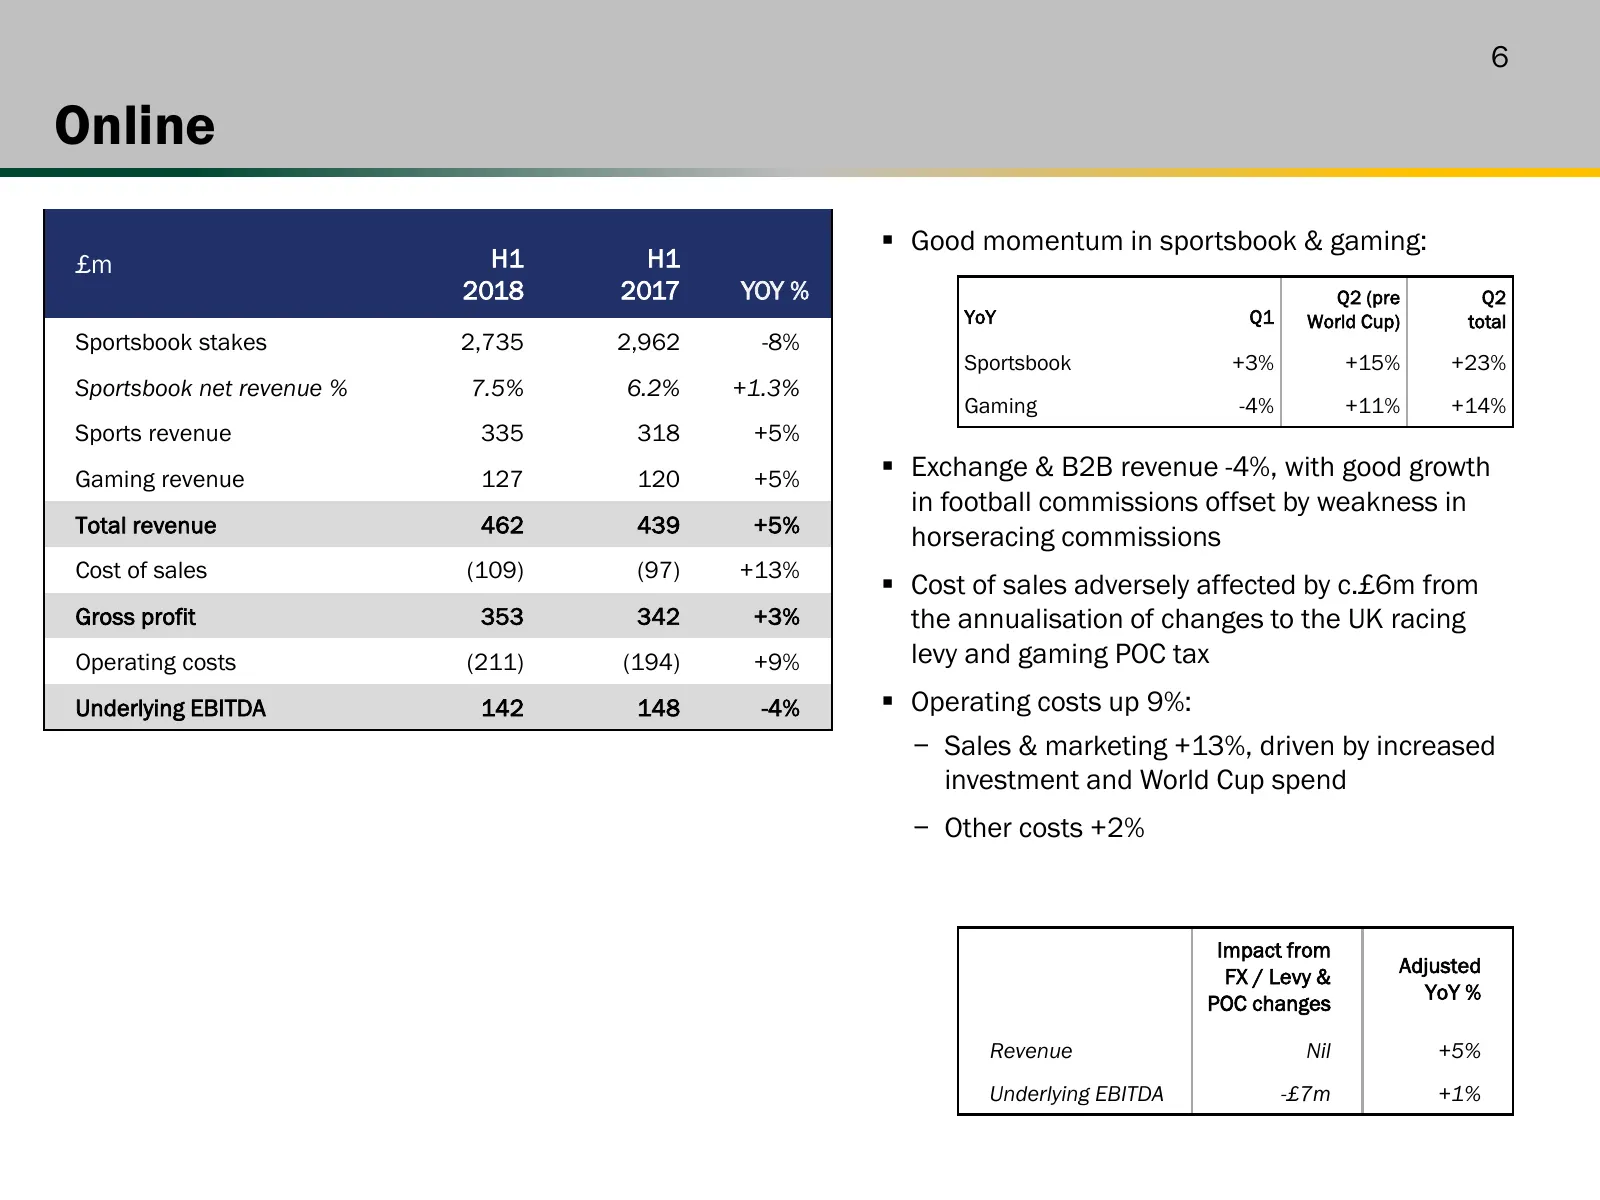
6 Online Good momentum in sportsbook & gaming: £m H1 H1 2018 2017 YOY % Q2 (pre Q2 YoY Q1 World Cup) total Sportsbook stakes 2,735 2,962 -8% Sportsbook +3% +15% +23% Sportsbook net revenue % 7.5% 6.2% +1.3% Gaming -4% +11% +14% Sports revenue 335 318 +5% Gaming revenue 127 120 +5% Exchange & B2B
Slide 7: Australia
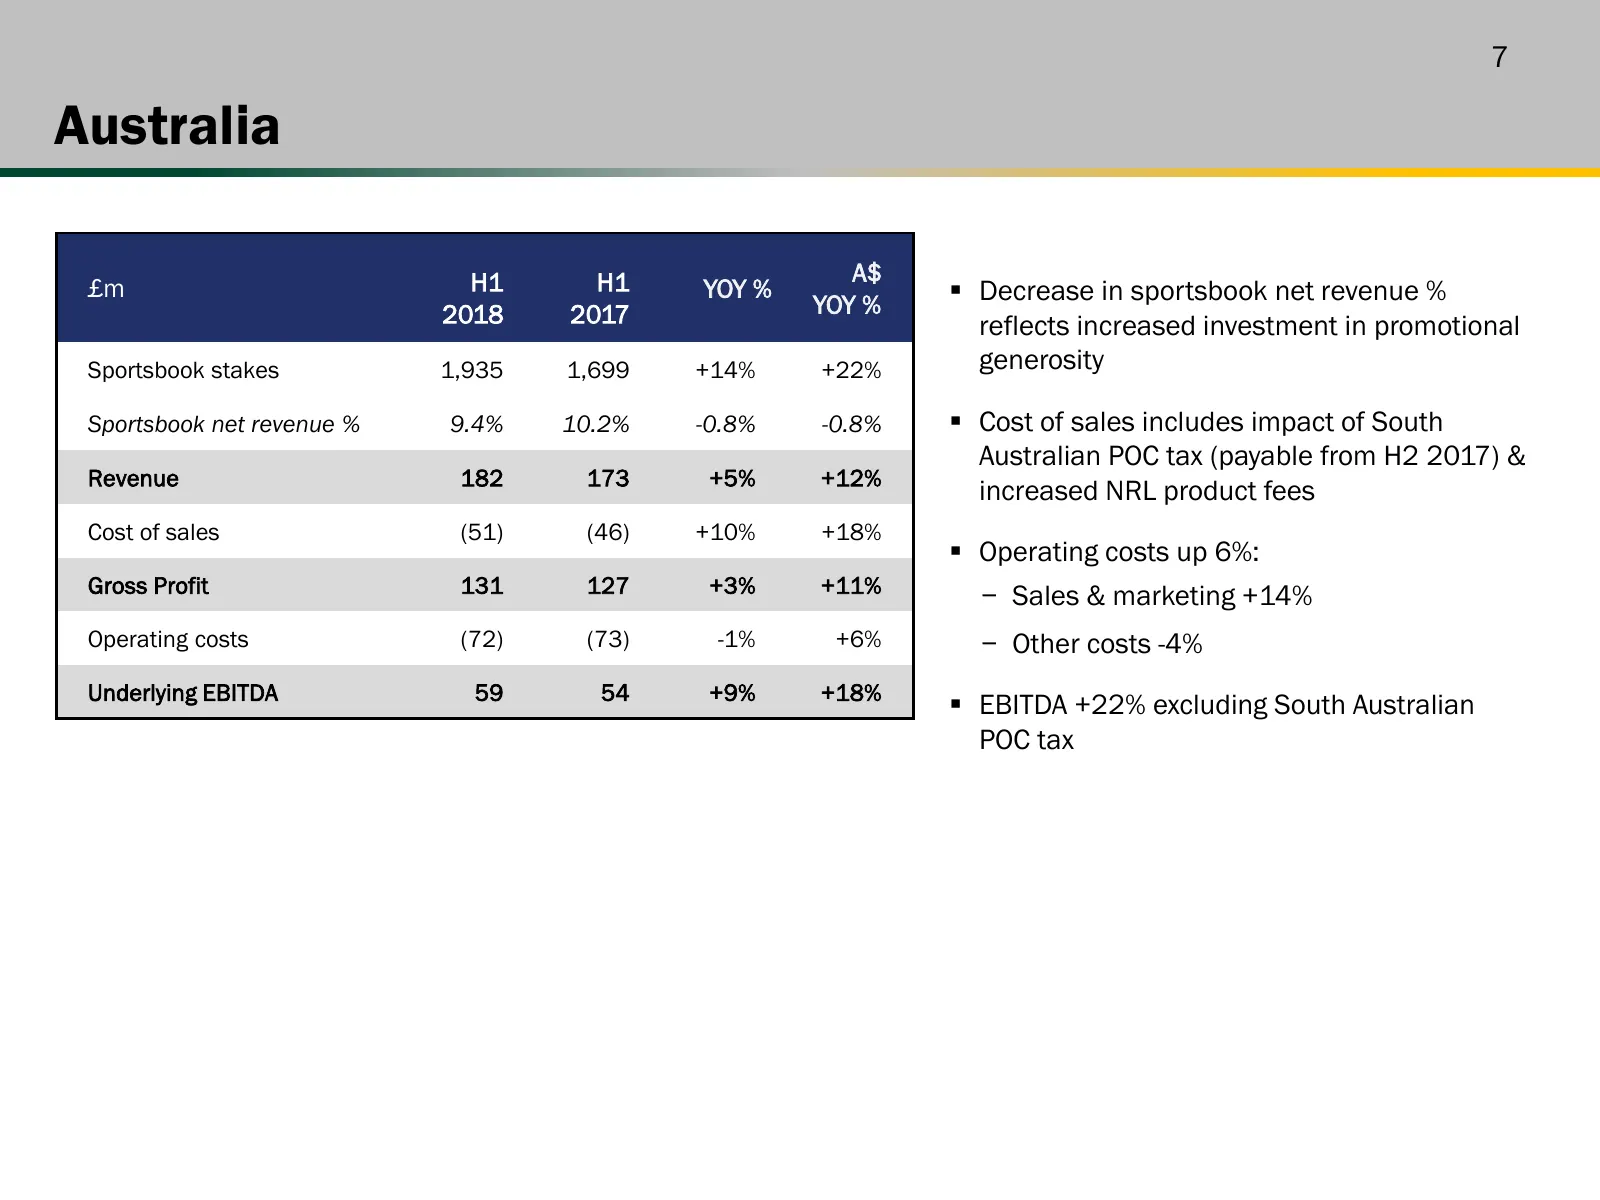
7 Australia H1 H1 A$ £m YOY % Decrease in sportsbook net revenue % 2018 2017 YOY % reflects increased investment in promotional Sportsbook stakes 1,935 1,699 +14% +22% generosity Sportsbook net revenue % 9.4% 10.2% -0.8% -0.8% Cost of sales includes impact of South Australian POC tax (payable fr
Slide 8: Retail
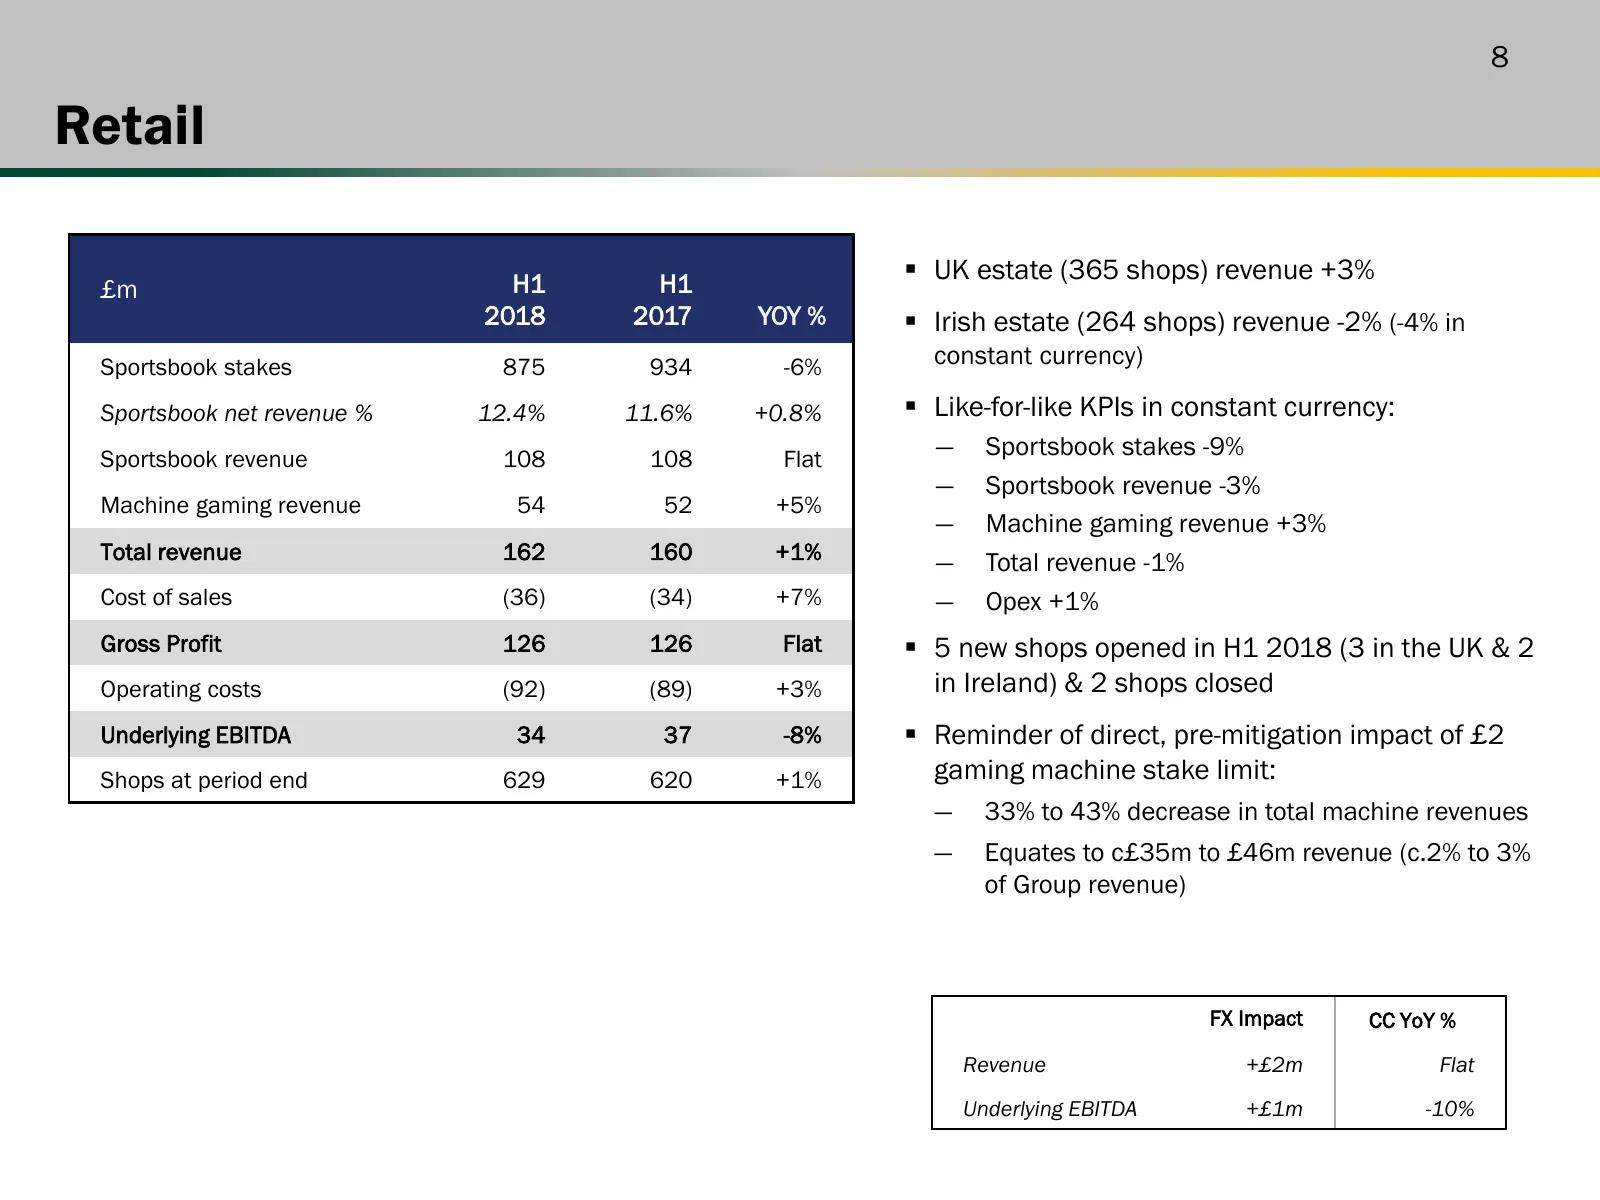
8 Retail H1 H1 UK estate (365 shops) revenue +3% £m 2018 2017 YOY % Irish estate (264 shops) revenue -2% (-4% in Sportsbook stakes 875 934 -6% constant currency) Sportsbook net revenue % 12.4% 11.6% +0.8% Like-for-like KPIs in constant currency: Sportsbook revenue 108 108 Flat ― Sportsbook sta
Slide 9: US
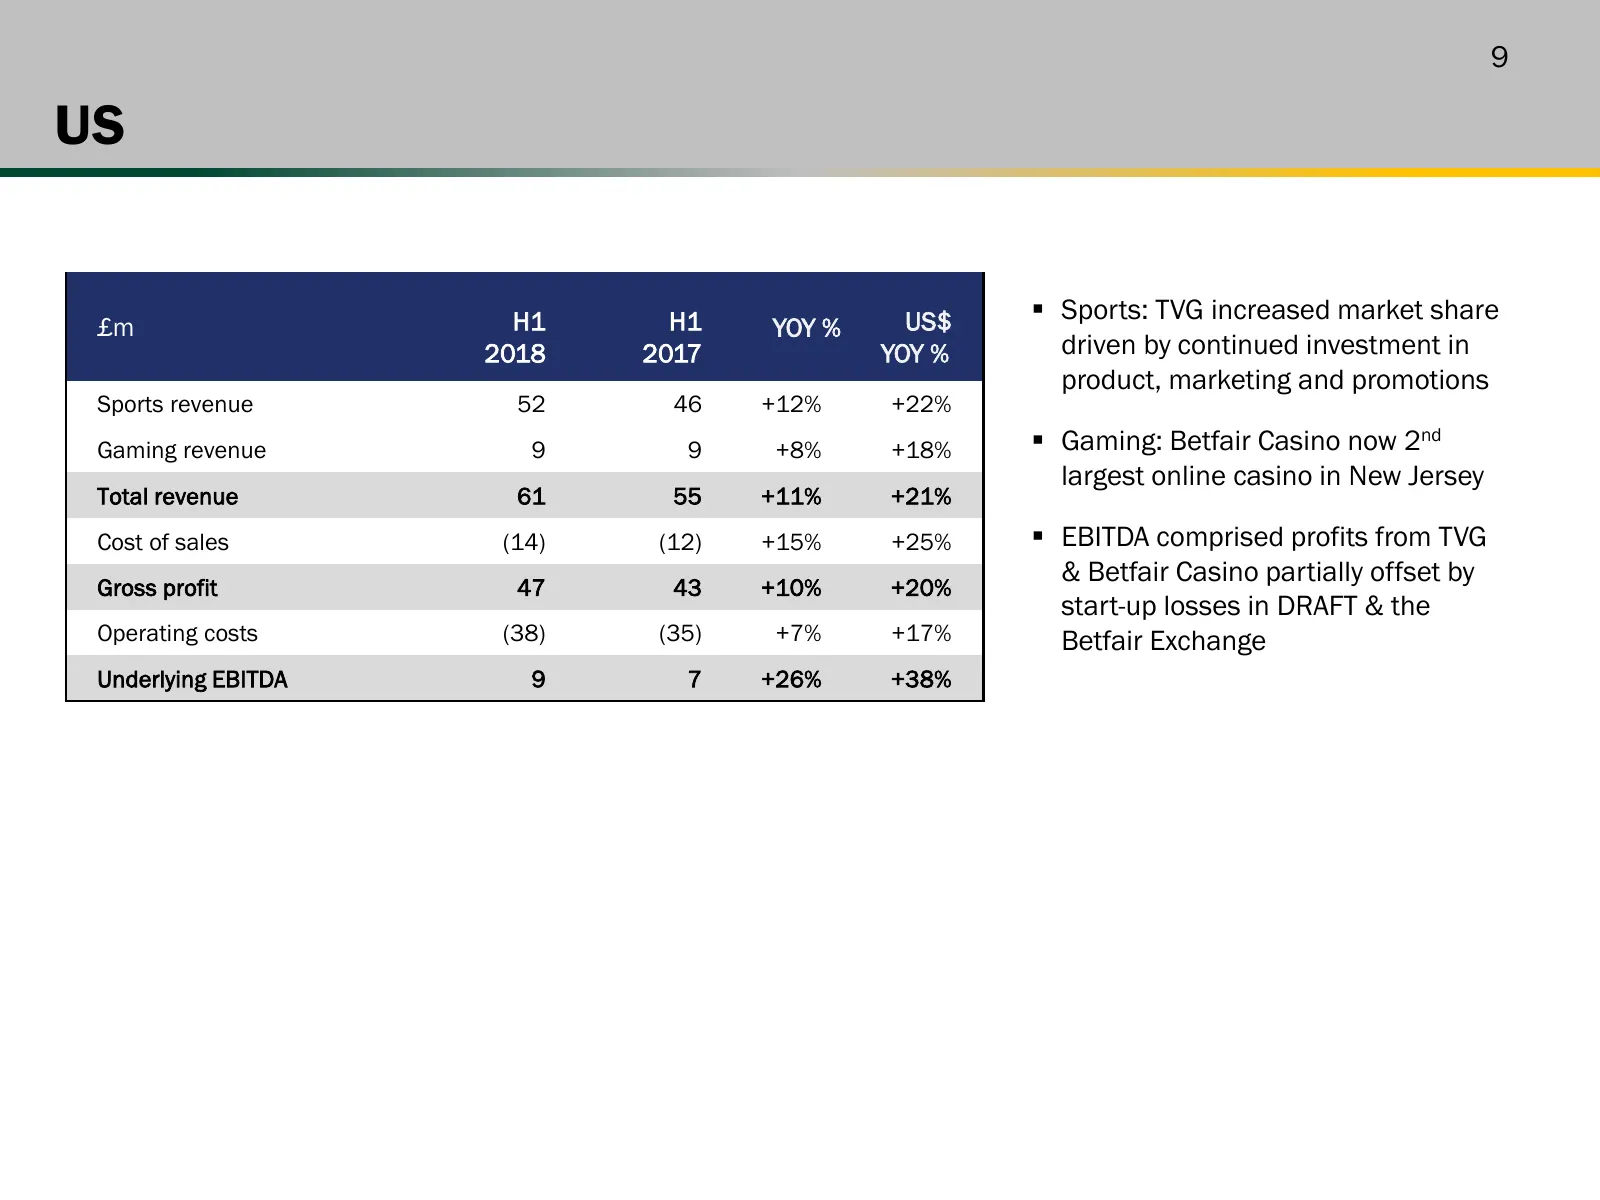
9 US H1 H1 US$ Sports: TVG increased market share £m YOY % 2018 2017 YOY % driven by continued investment in product, marketing and promotions Sports revenue 52 46 +12% +22% Gaming revenue 9 9 +8% +18% Gaming: Betfair Casino now 2nd largest online casino in New Jersey Total revenue 61 55 +11% +2
Slide 10: Cash flow
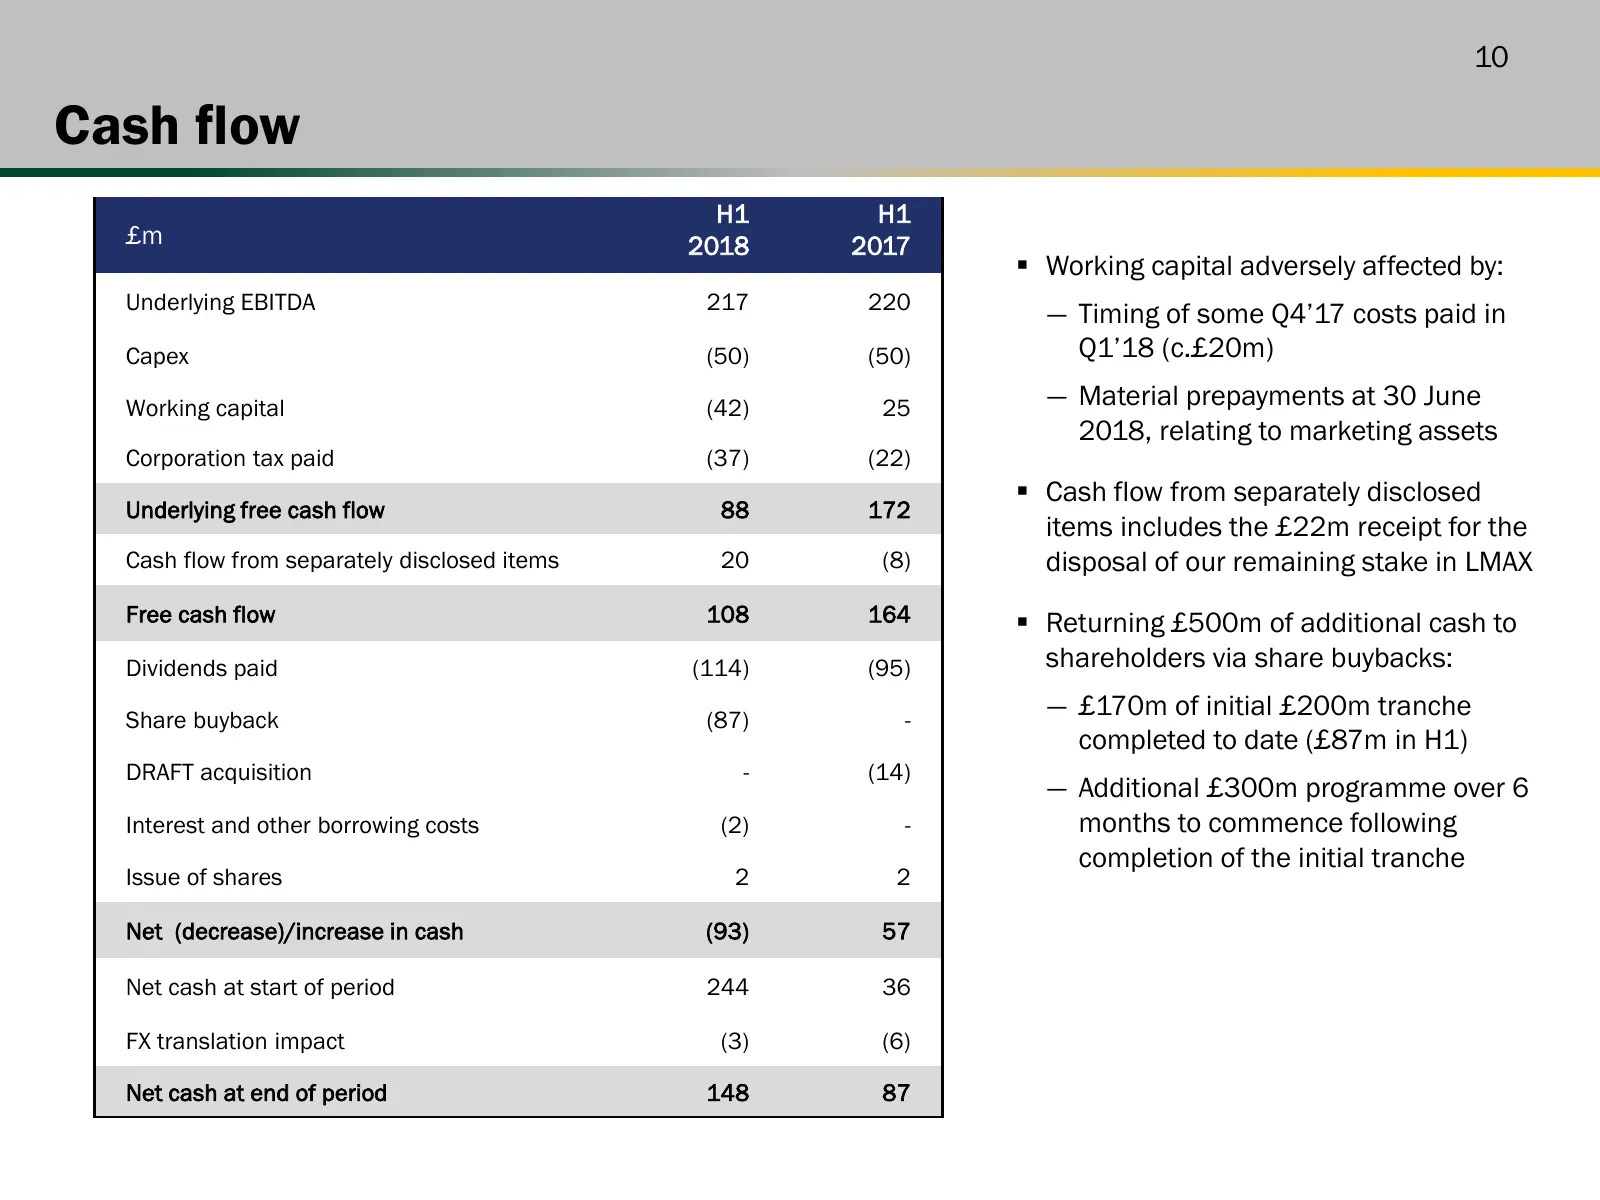
10 Cash flow H1 H1 £m 2018 2017 Working capital adversely affected by: Underlying EBITDA 217 220 ― Timing of some Q4’17 costs paid in Capex (50) (50) Q1’18 (c.£20m) Working capital (42) 25 ― Material prepayments at 30 June 2018, relating to marketing assets Corporation tax paid (37) (22) Cash fl
Slide 11: Financial guidance
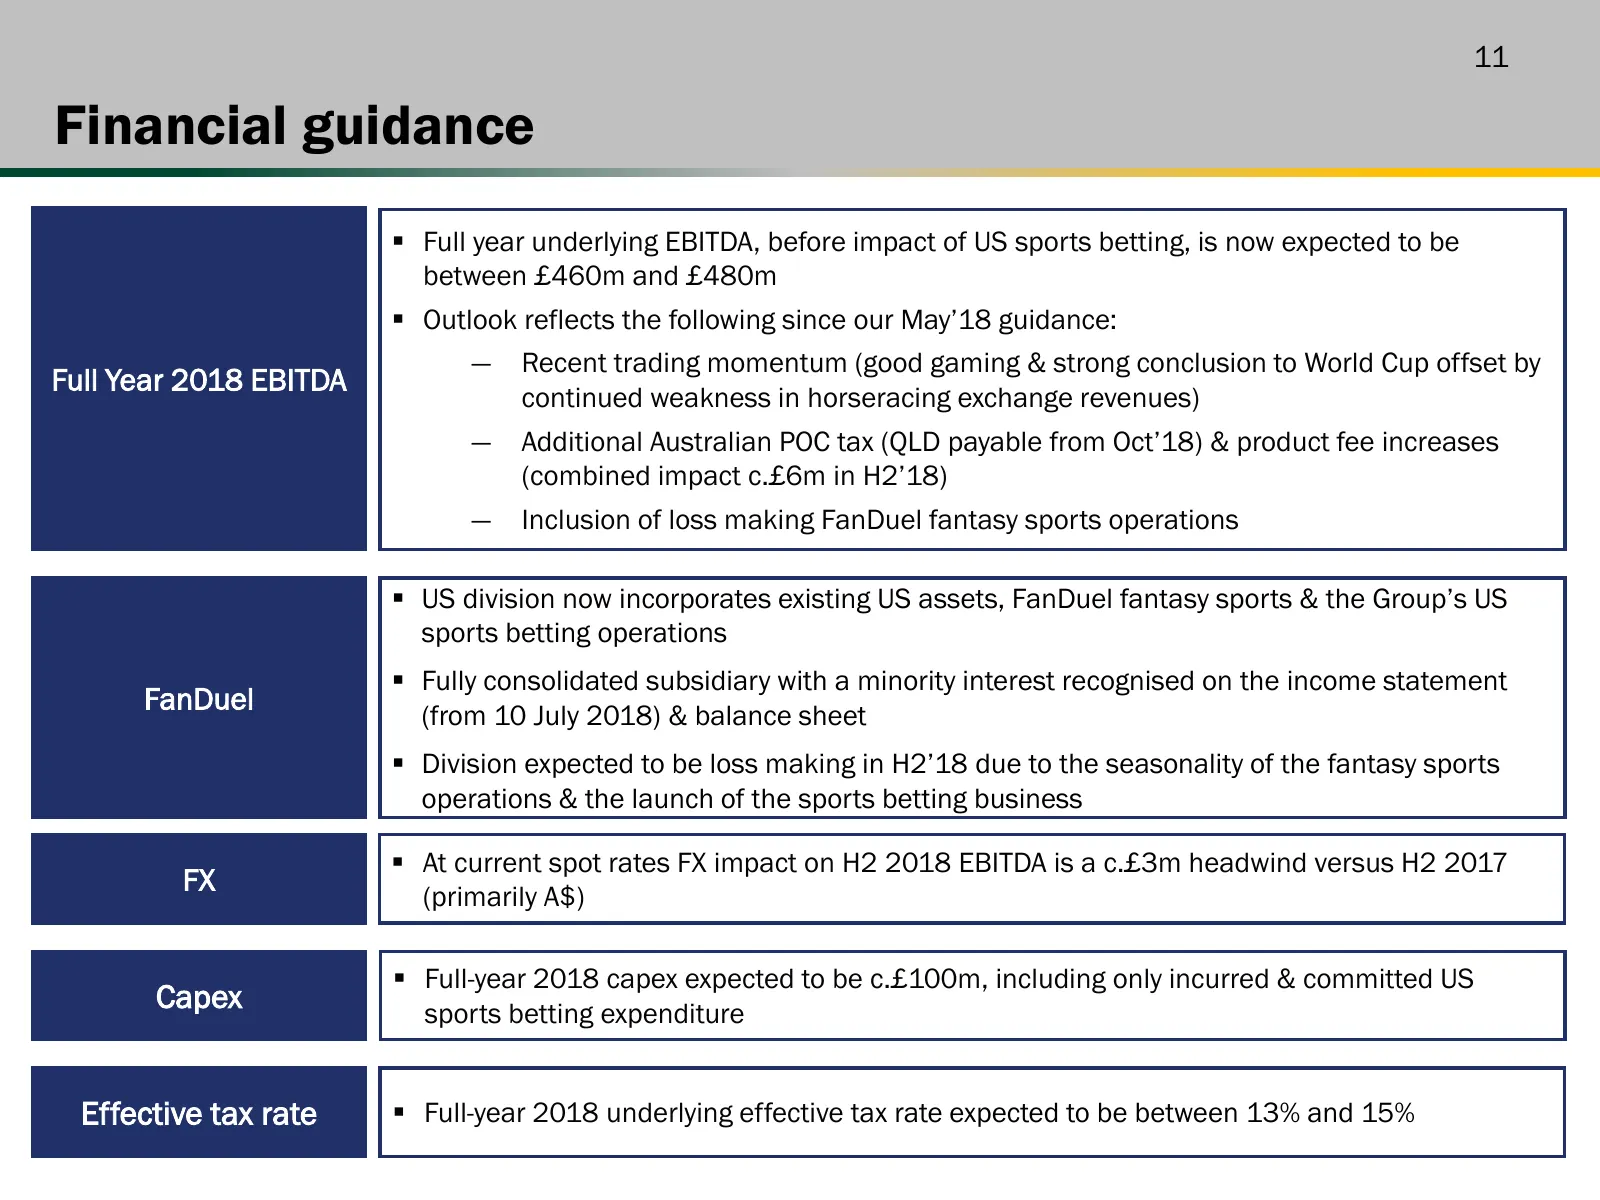
11 Financial guidance Full year underlying EBITDA, before impact of US sports betting, is now expected to be between £460m and £480m Outlook reflects the following since our May’18 guidance: ― Recent trading momentum (good gaming & strong conclusion to World Cup offset by Full Year 2018 EBITDA c

Slide 12: Business Review
PADDYPOWER PADDYPOWER ENOUGH OF THE NONSENSE Business Review {6 / CONJUNCTI | win attitude |
Slide 13: Good progress on priorities outlined in March 2018
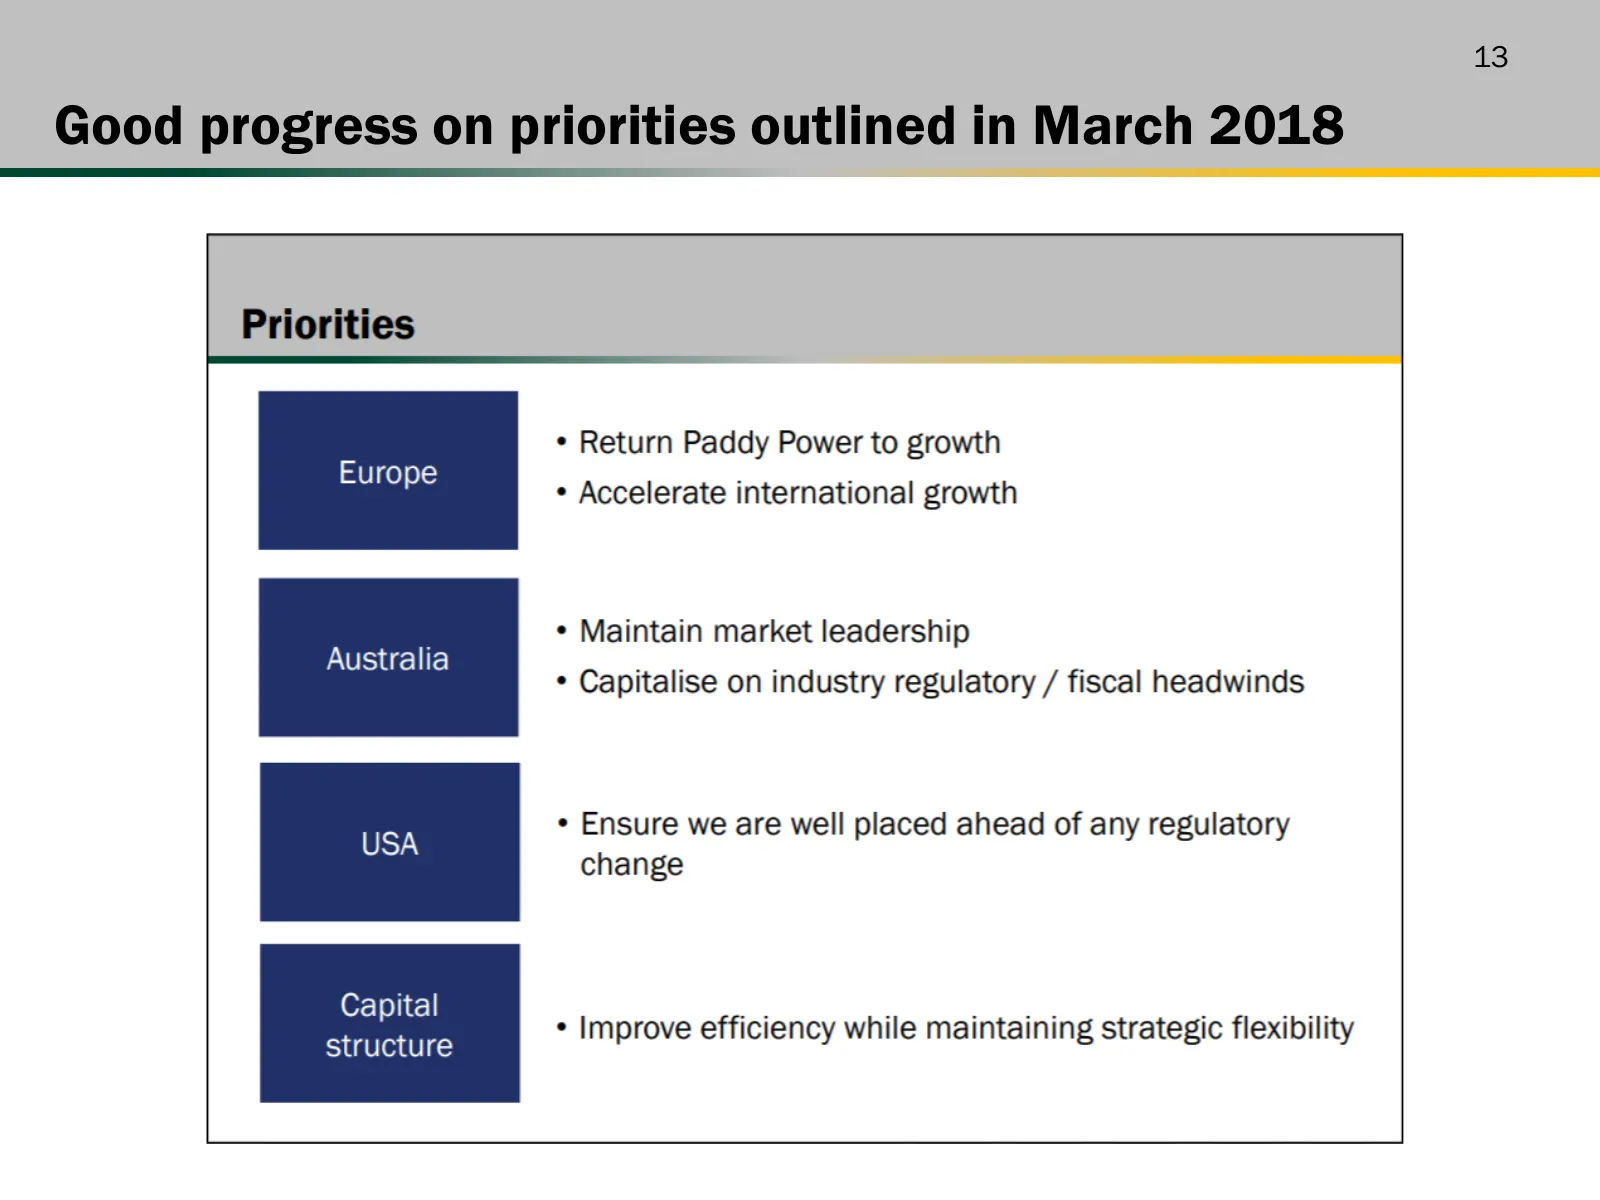
13 Good progress on priorities outlined in March 2018
Slide 14: Approach to reinvigorating Paddy Power
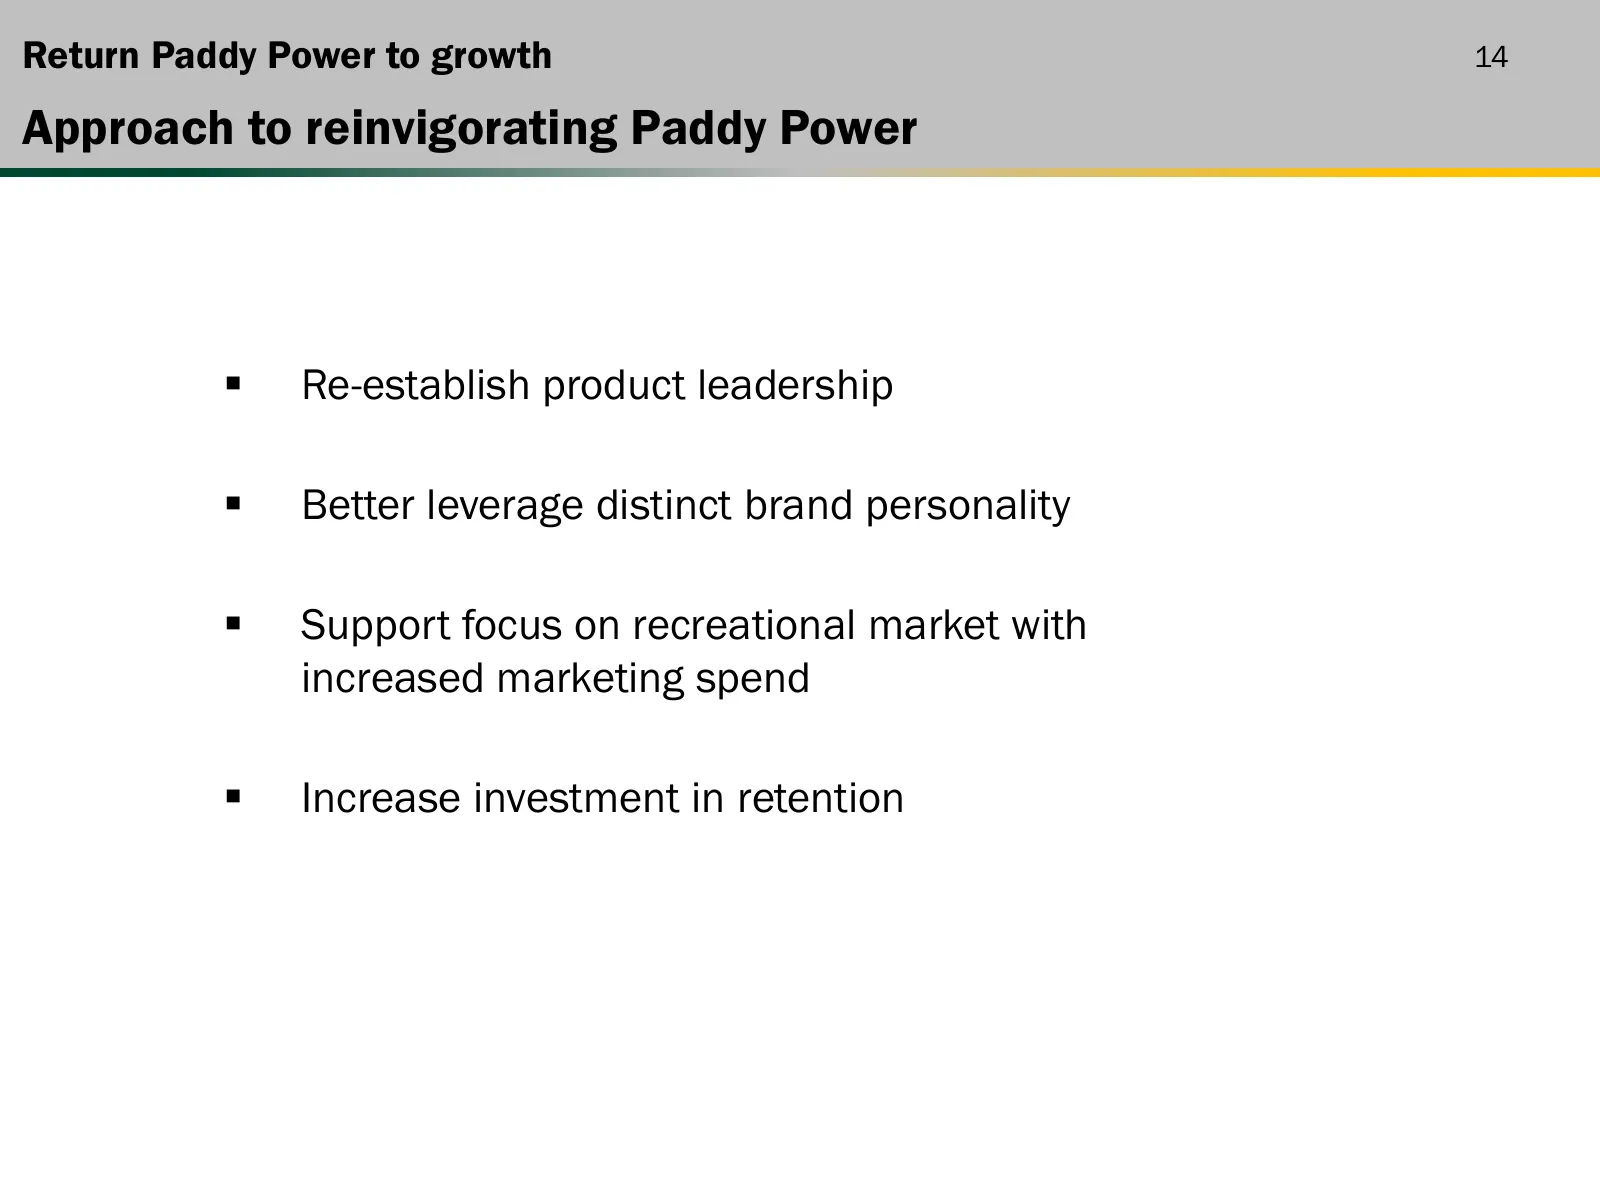
Return Paddy Power to growth 14 Approach to reinvigorating Paddy Power Re-establish product leadership Better leverage distinct brand personality Support focus on recreational market with increased marketing spend Increase investment in retention
Slide 15: Product development now improving customer proposition
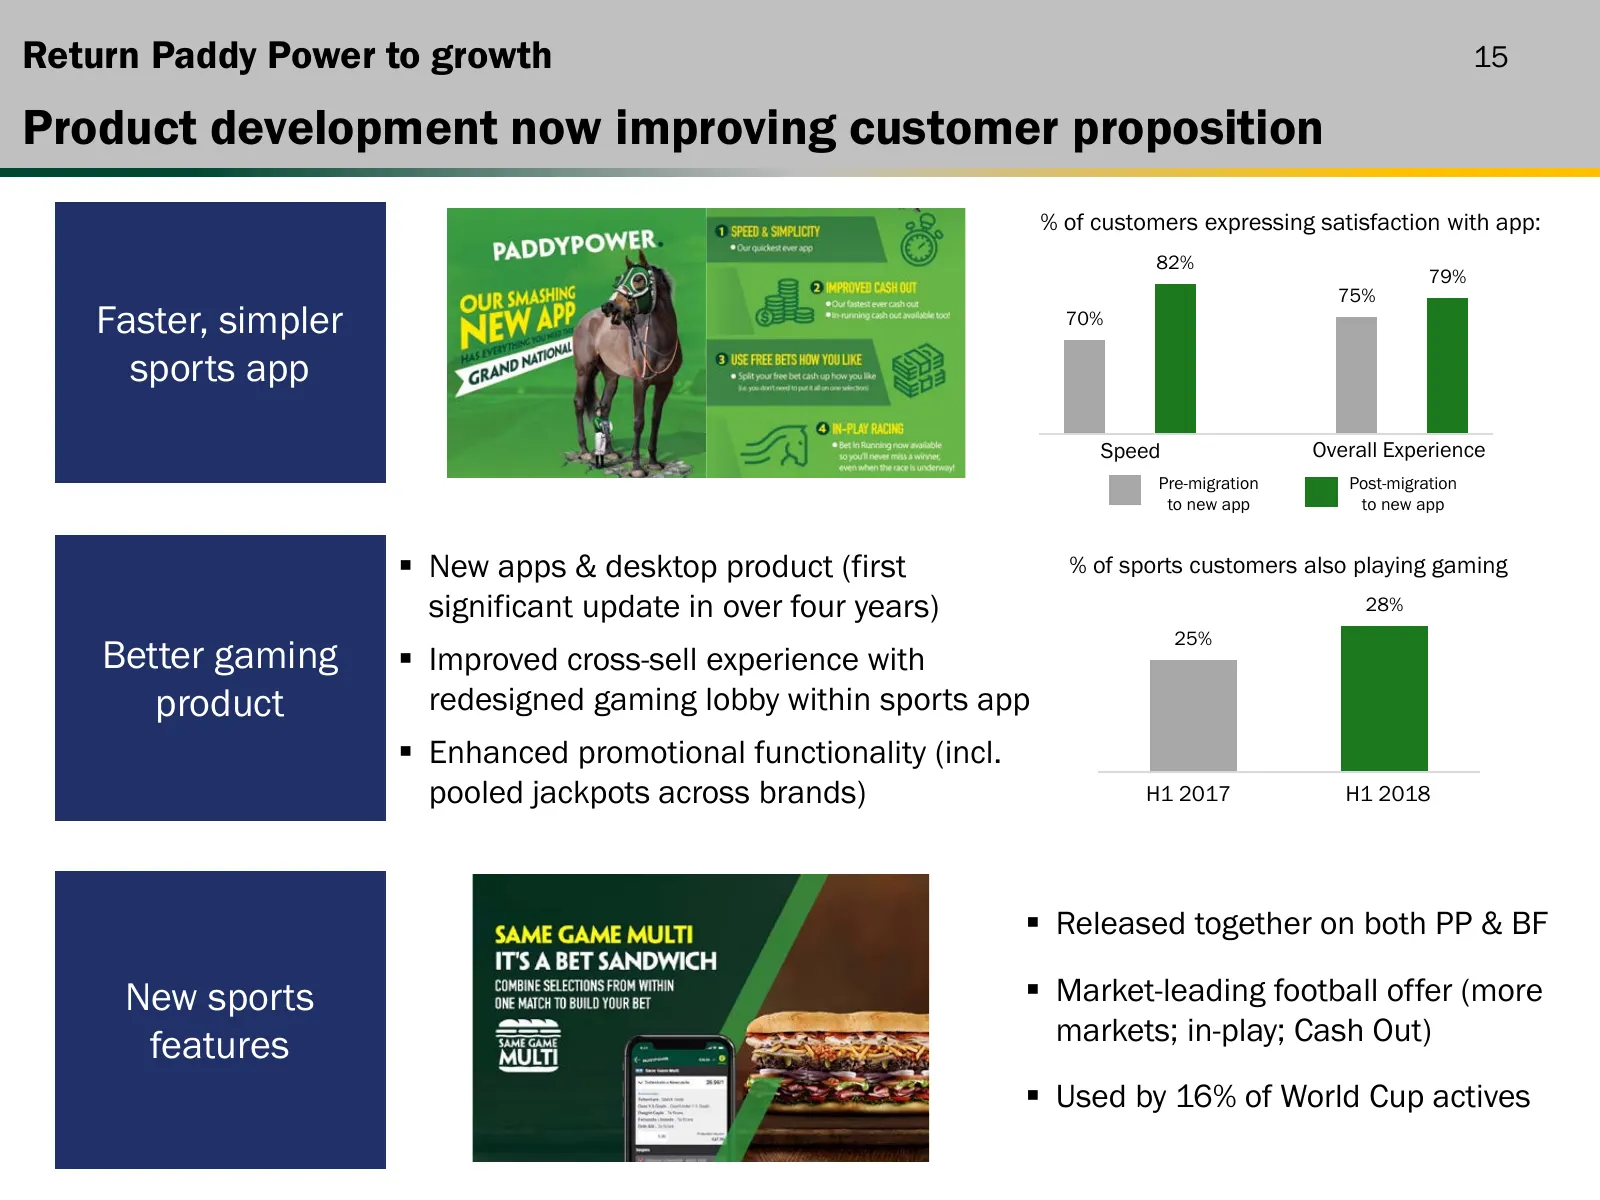
Return Paddy Power to growth 15 Product development now improving customer proposition % of customers expressing satisfaction with app: 82% 79% 75% Faster, simpler 70% sports app Speed Overall Experience Pre-migration Post-migration to new app to new app New apps & desktop product (first % of spor
Slide 16: Increased brand investment with improved execution
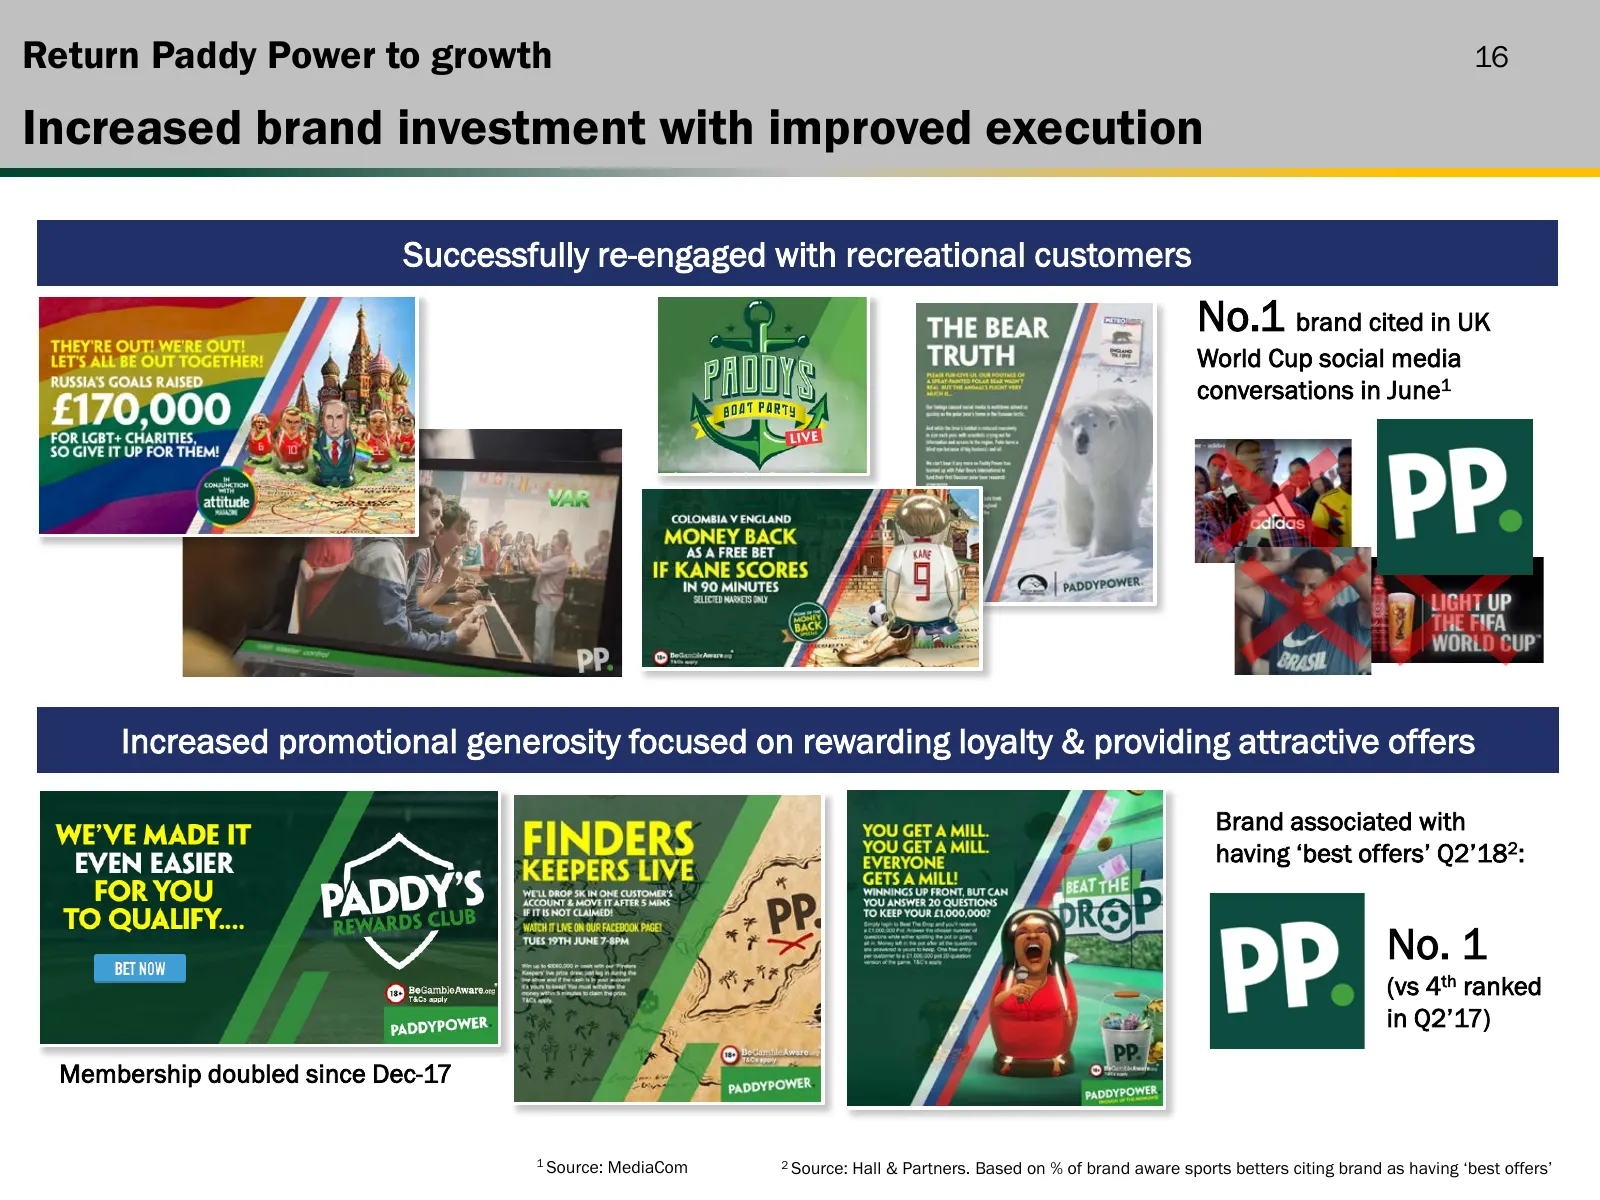
Return Paddy Power to growth 16 Increased brand investment with improved execution Successfully re-engaged with recreational customers No.1 brand cited in UK World Cup social media conversations in June1 Increased promotional generosity focused on rewarding loyalty & providing attractive offers Bran
Slide 17: Strategy depends on regulatory profile
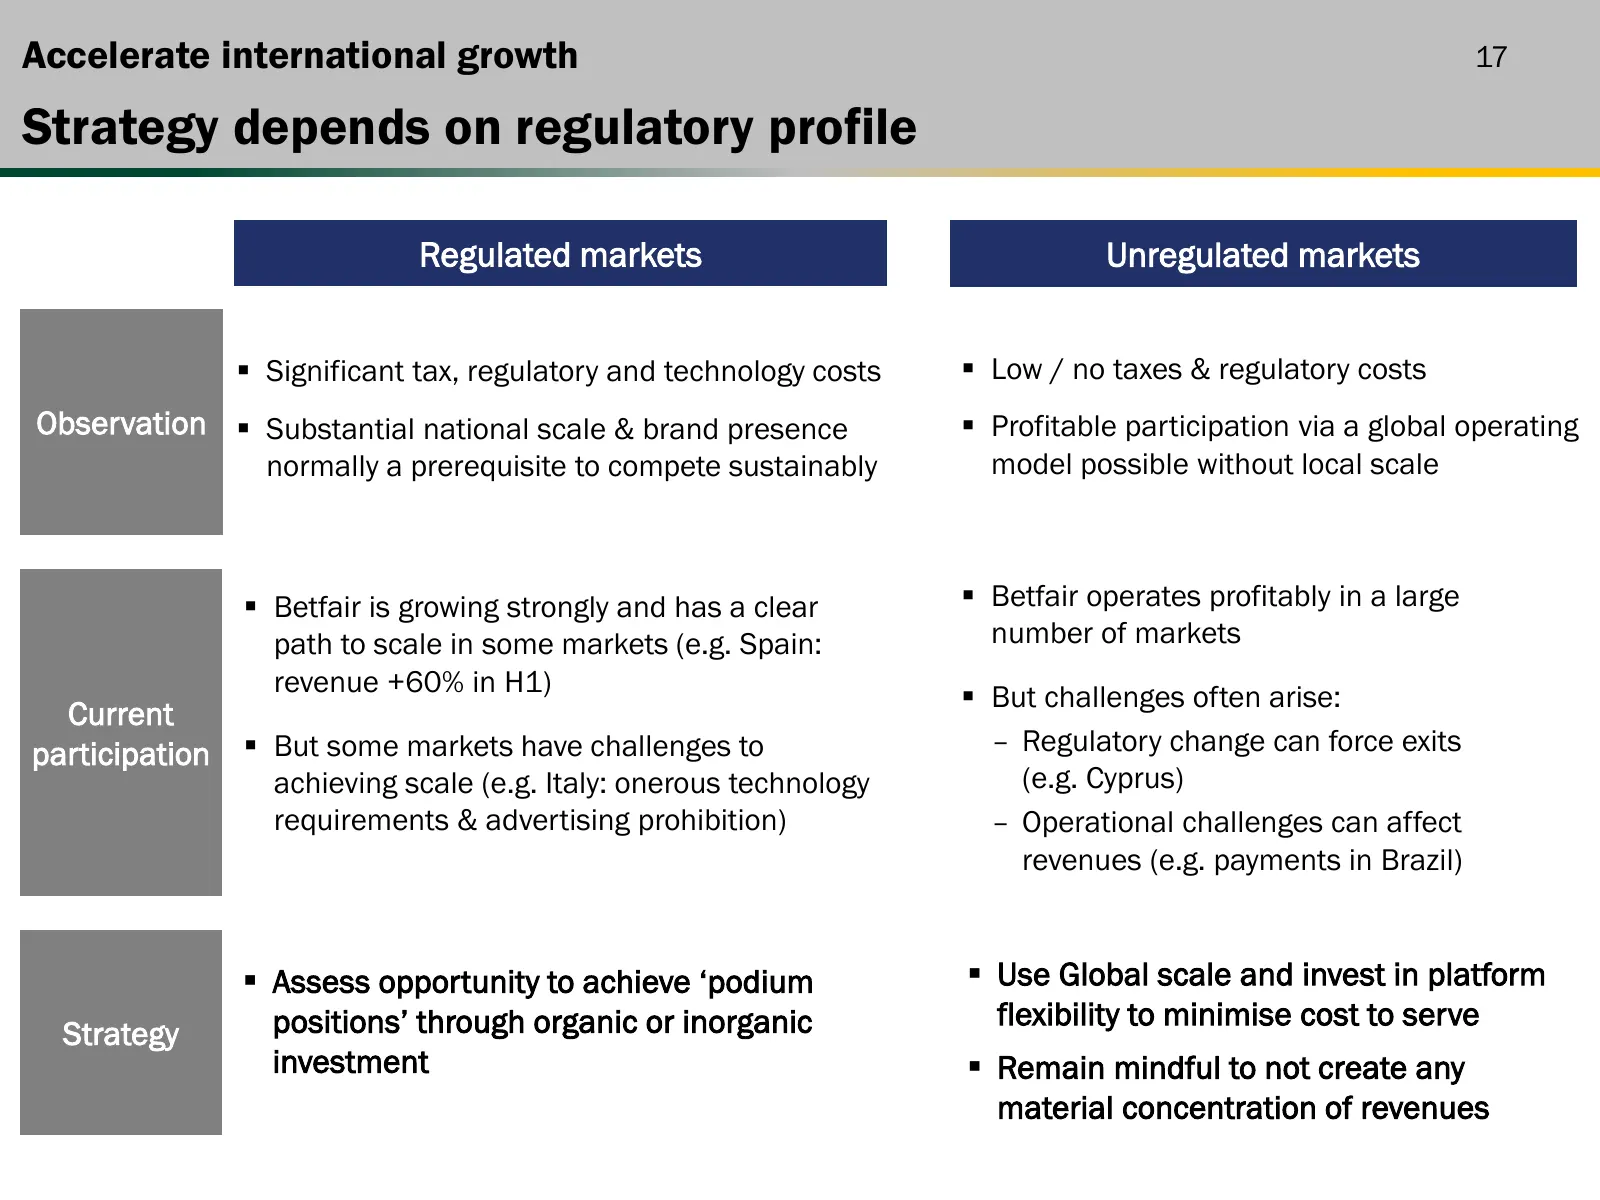
Accelerate international growth 17 Strategy depends on regulatory profile Regulated markets Unregulated markets Significant tax, regulatory and technology costs Low / no taxes & regulatory costs Observation Substantial national scale & brand presence Profitable participation via a global ope
Slide 18: Industry fiscal & regulatory headwinds
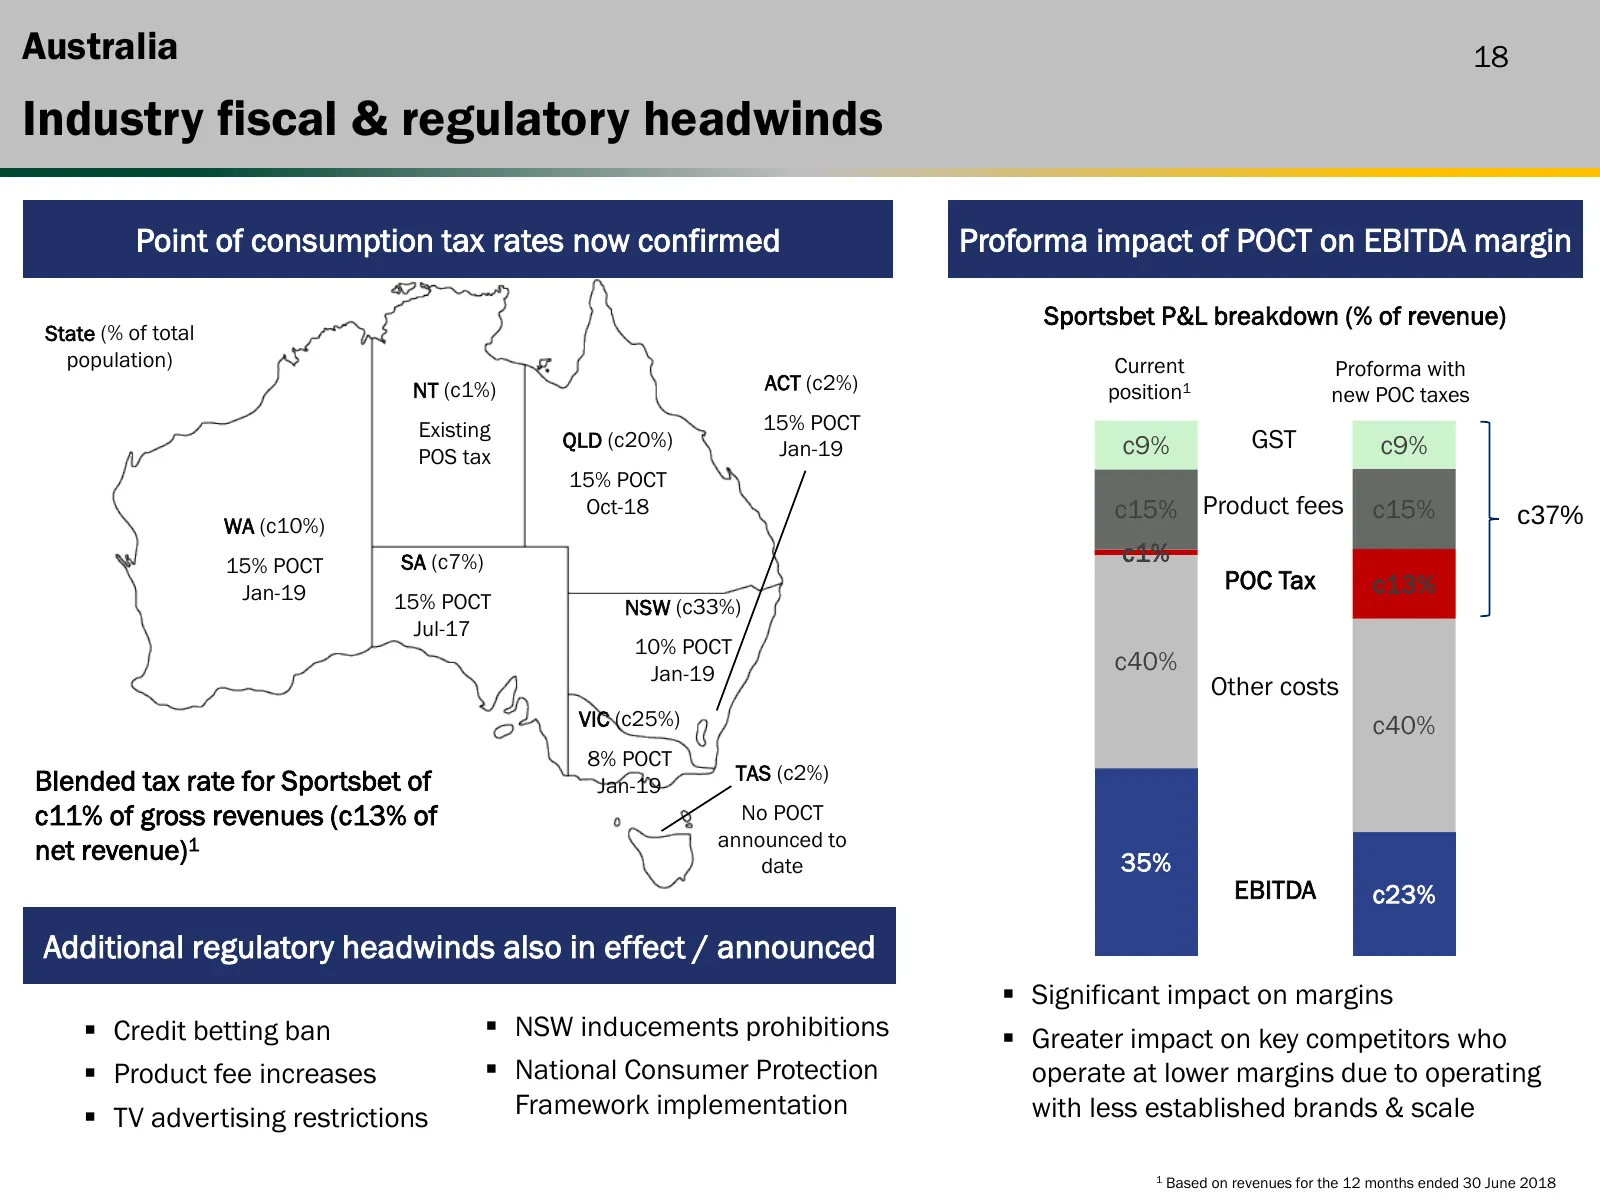
Australia 18 Industry fiscal & regulatory headwinds Point of consumption tax rates now confirmed Proforma impact of POCT on EBITDA margin Sportsbet P&L breakdown (% of revenue) State (% of total population) Current Proforma with NT (c1%) ACT (c2%) position1 new POC taxes Existing 15% POCT QLD (c20%)
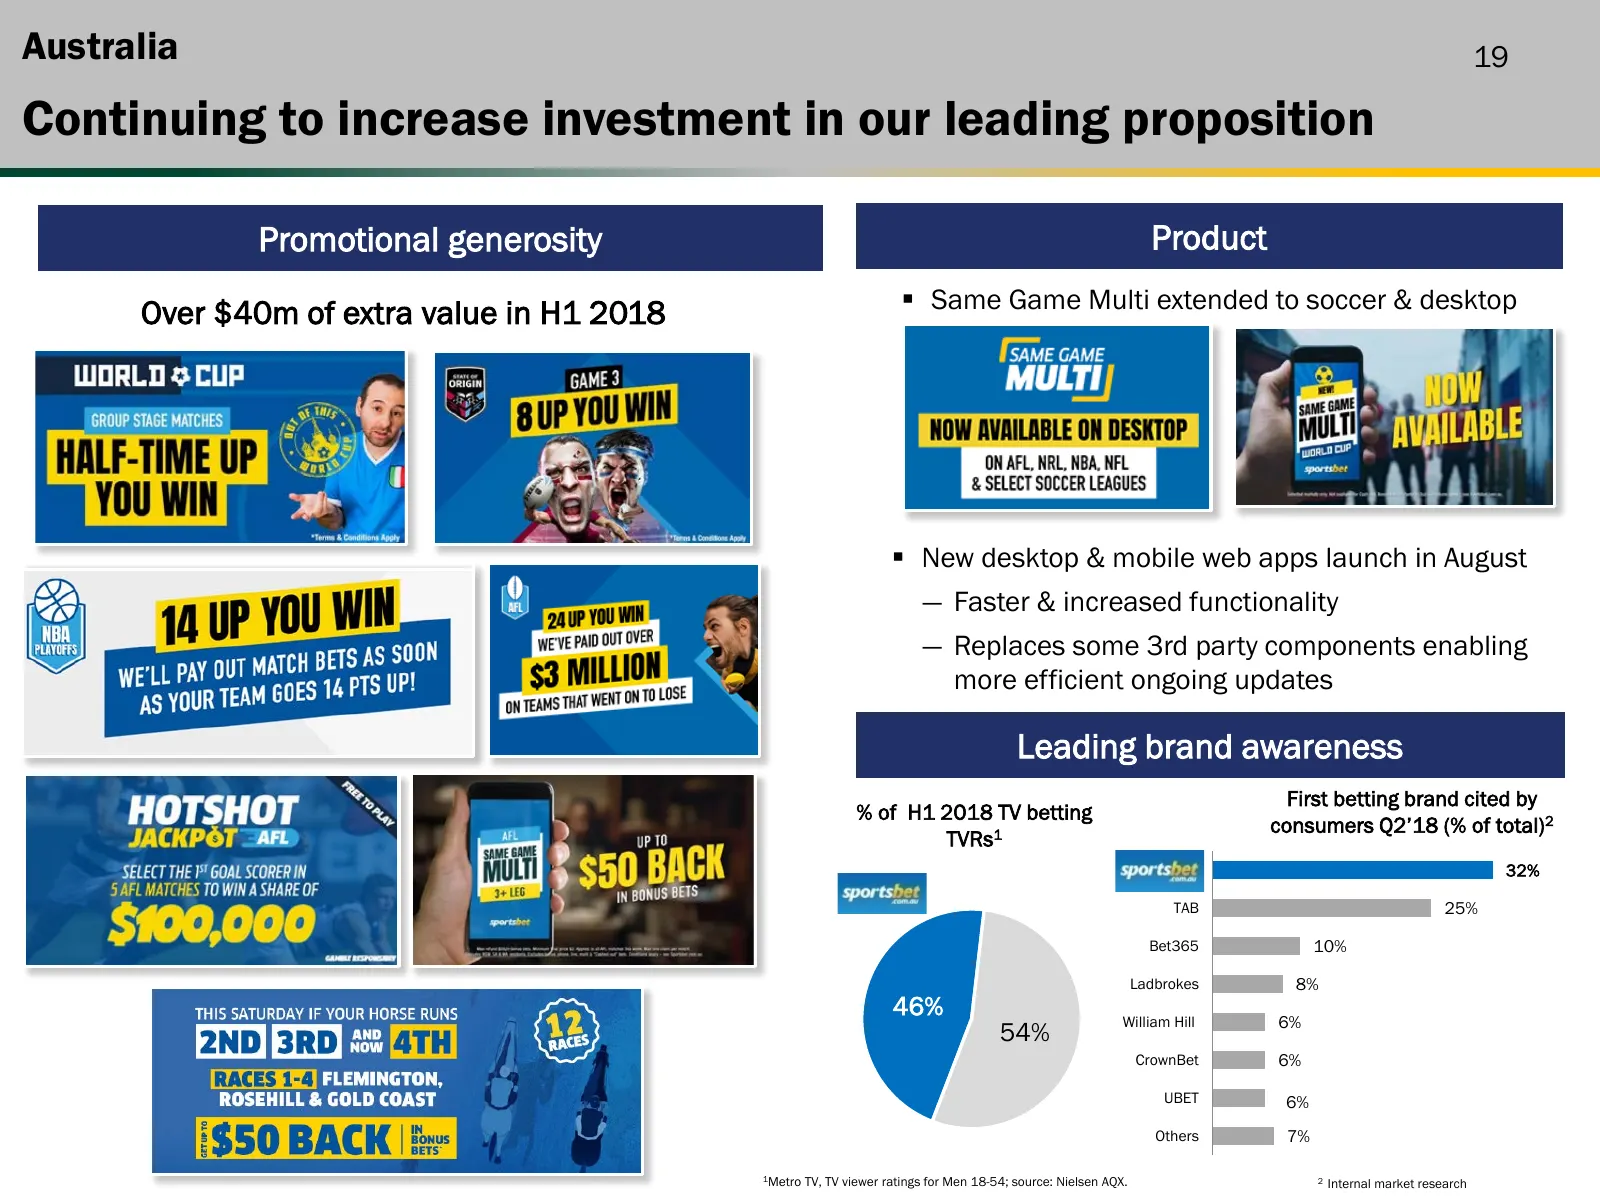
Slide 19: Continuing to increase investment in our leading proposition
Australia 19 Continuing to increase investment in our leading proposition Promotional generosity Product Same Game Multi extended to soccer & desktop Over $40m of extra value in H1 2018 William Hill New desktop & mobile web apps launch in August ― Faster & increased functionality ― Replaces some
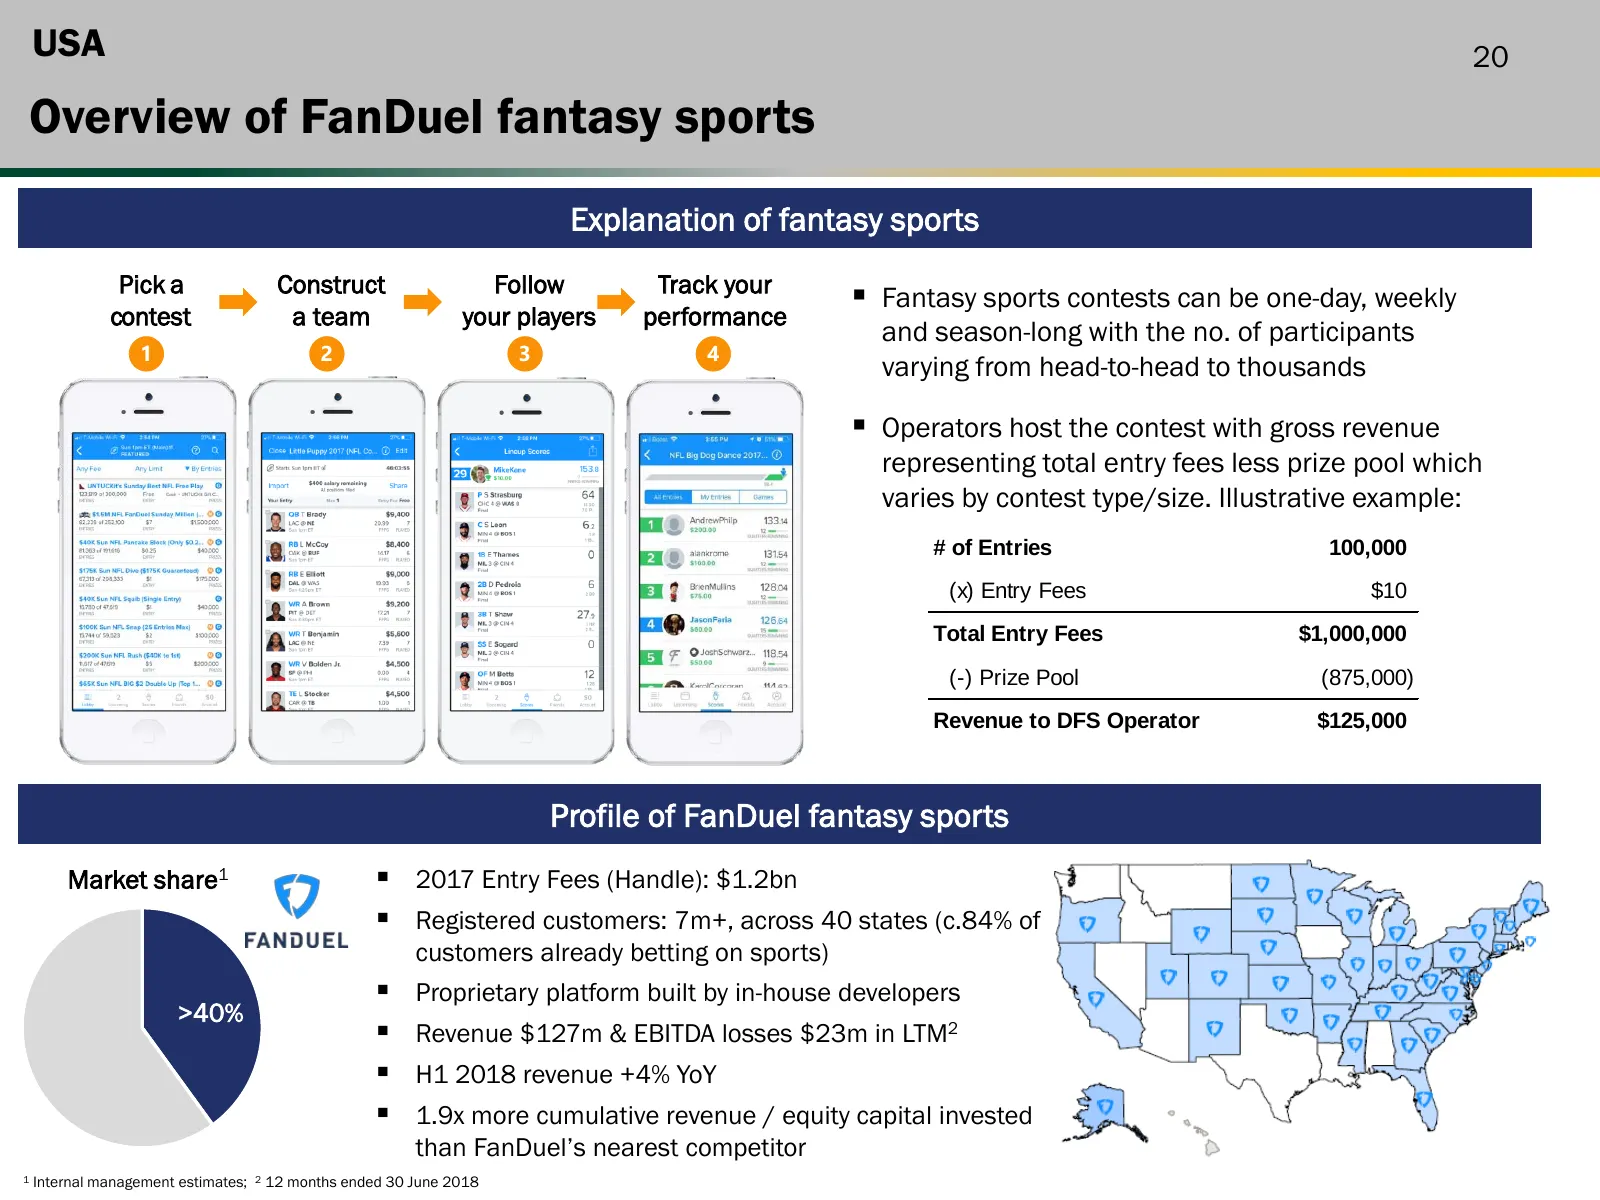
Slide 20: Overview of FanDuel fantasy sports
USA 20 Overview of FanDuel fantasy sports Explanation of fantasy sports Pick a Construct Follow Track your Fantasy sports contests can be one-day, weekly contest a team your players performance and season-long with the no. of participants 1 2 3 4 varying from head-to-head to thousands Operators

Slide 21: Sports betting market update
USA 21 Sports betting market update States expected to allow sports betting by 2019 Substantial market access secured States that currently allow States that have passed States most likely to pass Includes key ‘early adopter’ states sports betting laws (but not yet regulated) legislation by 2019
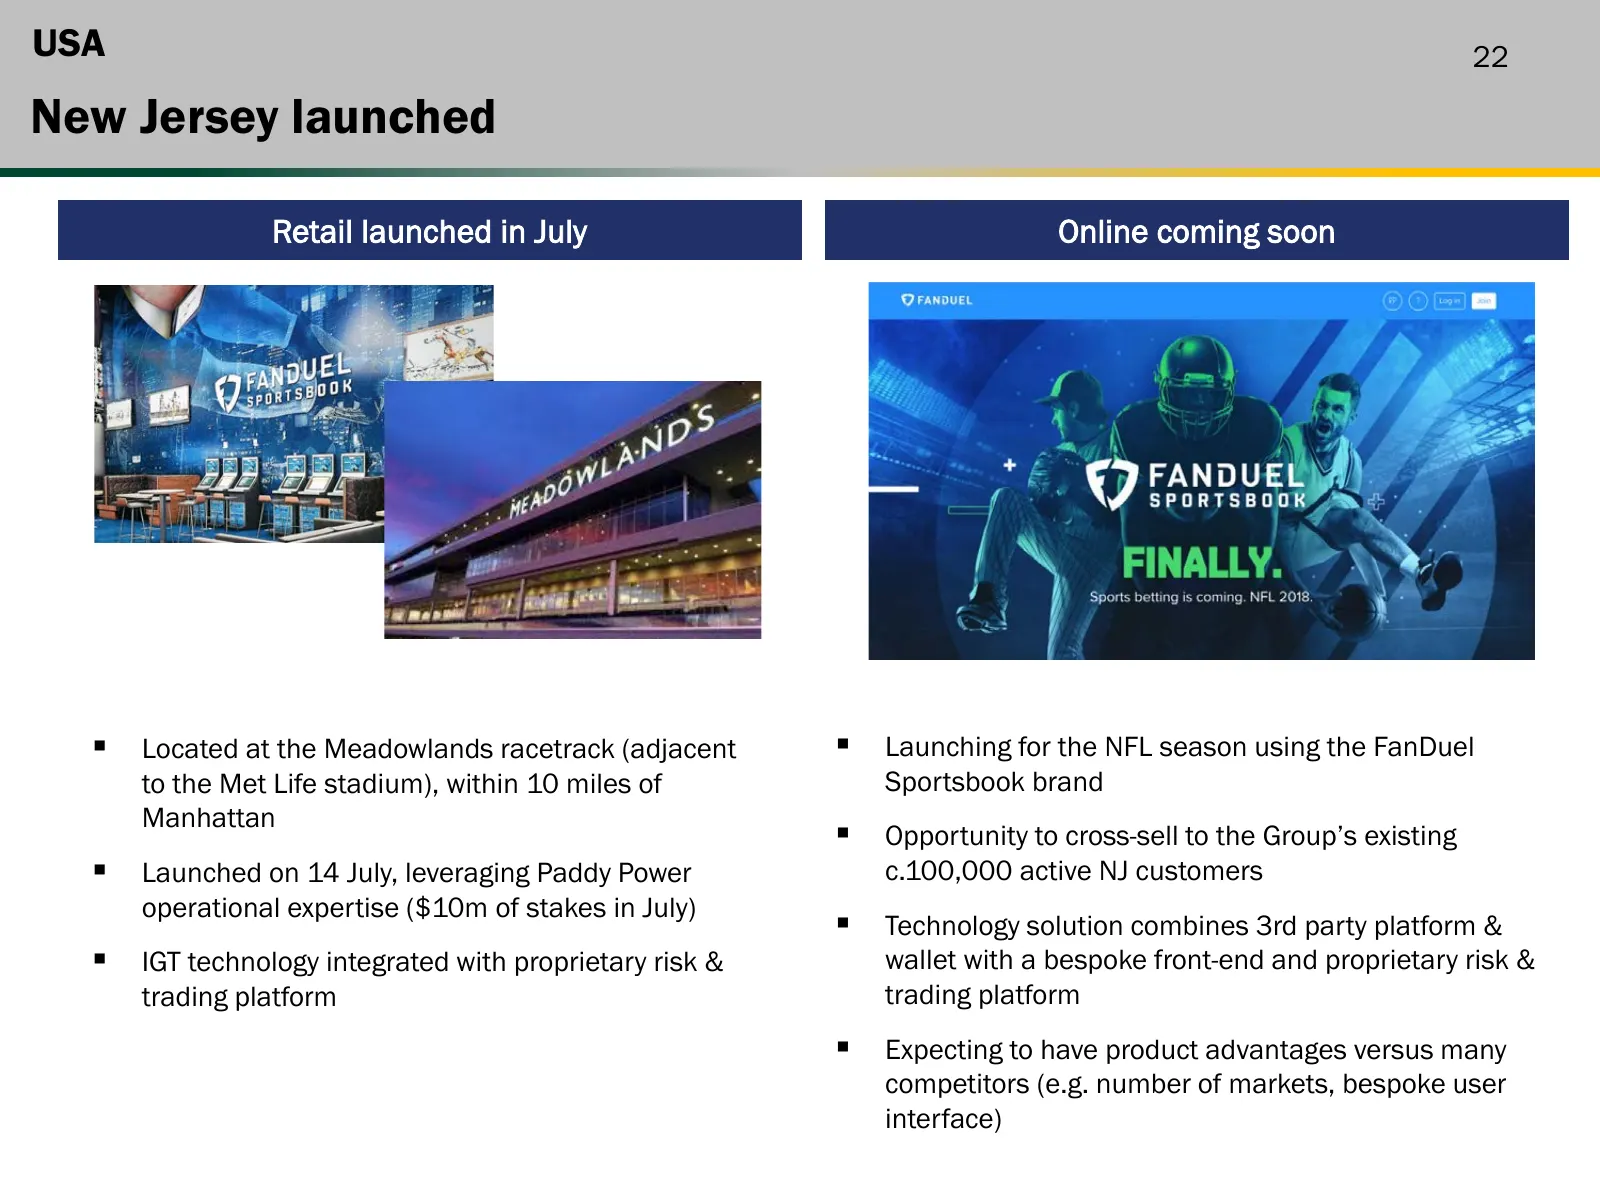
Slide 22: New Jersey launched
USA 22 New Jersey launched Retail launched in July Online coming soon Located at the Meadowlands racetrack (adjacent Launching for the NFL season using the FanDuel to the Met Life stadium), within 10 miles of Sportsbook brand Manhattan Opportunity to cross-sell to the Group’s existing Launch
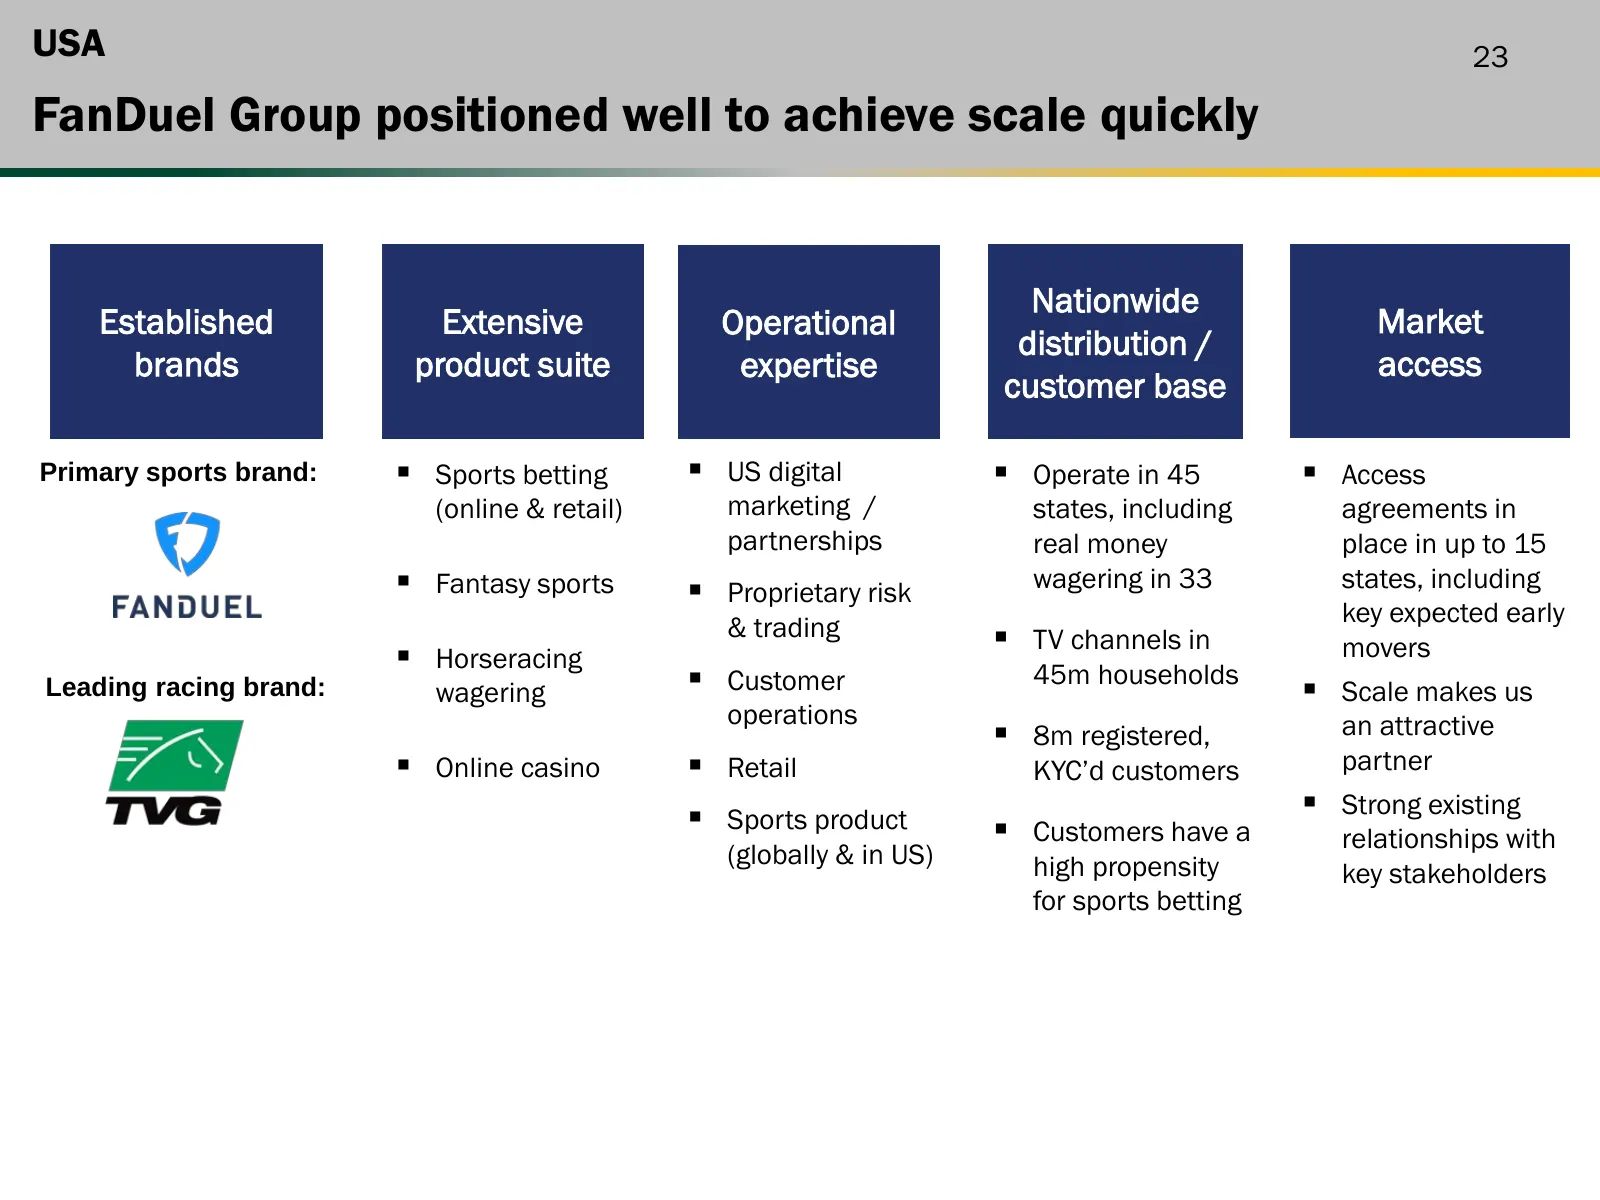
Slide 23: FanDuel Group positioned well to achieve scale quickly
USA 23 FanDuel Group positioned well to achieve scale quickly Nationwide Established Extensive Operational Market distribution / brands product suite expertise access customer base Primary sports brand: Sports betting US digital Operate in 45 Access (online & retail) marketing / states, incl
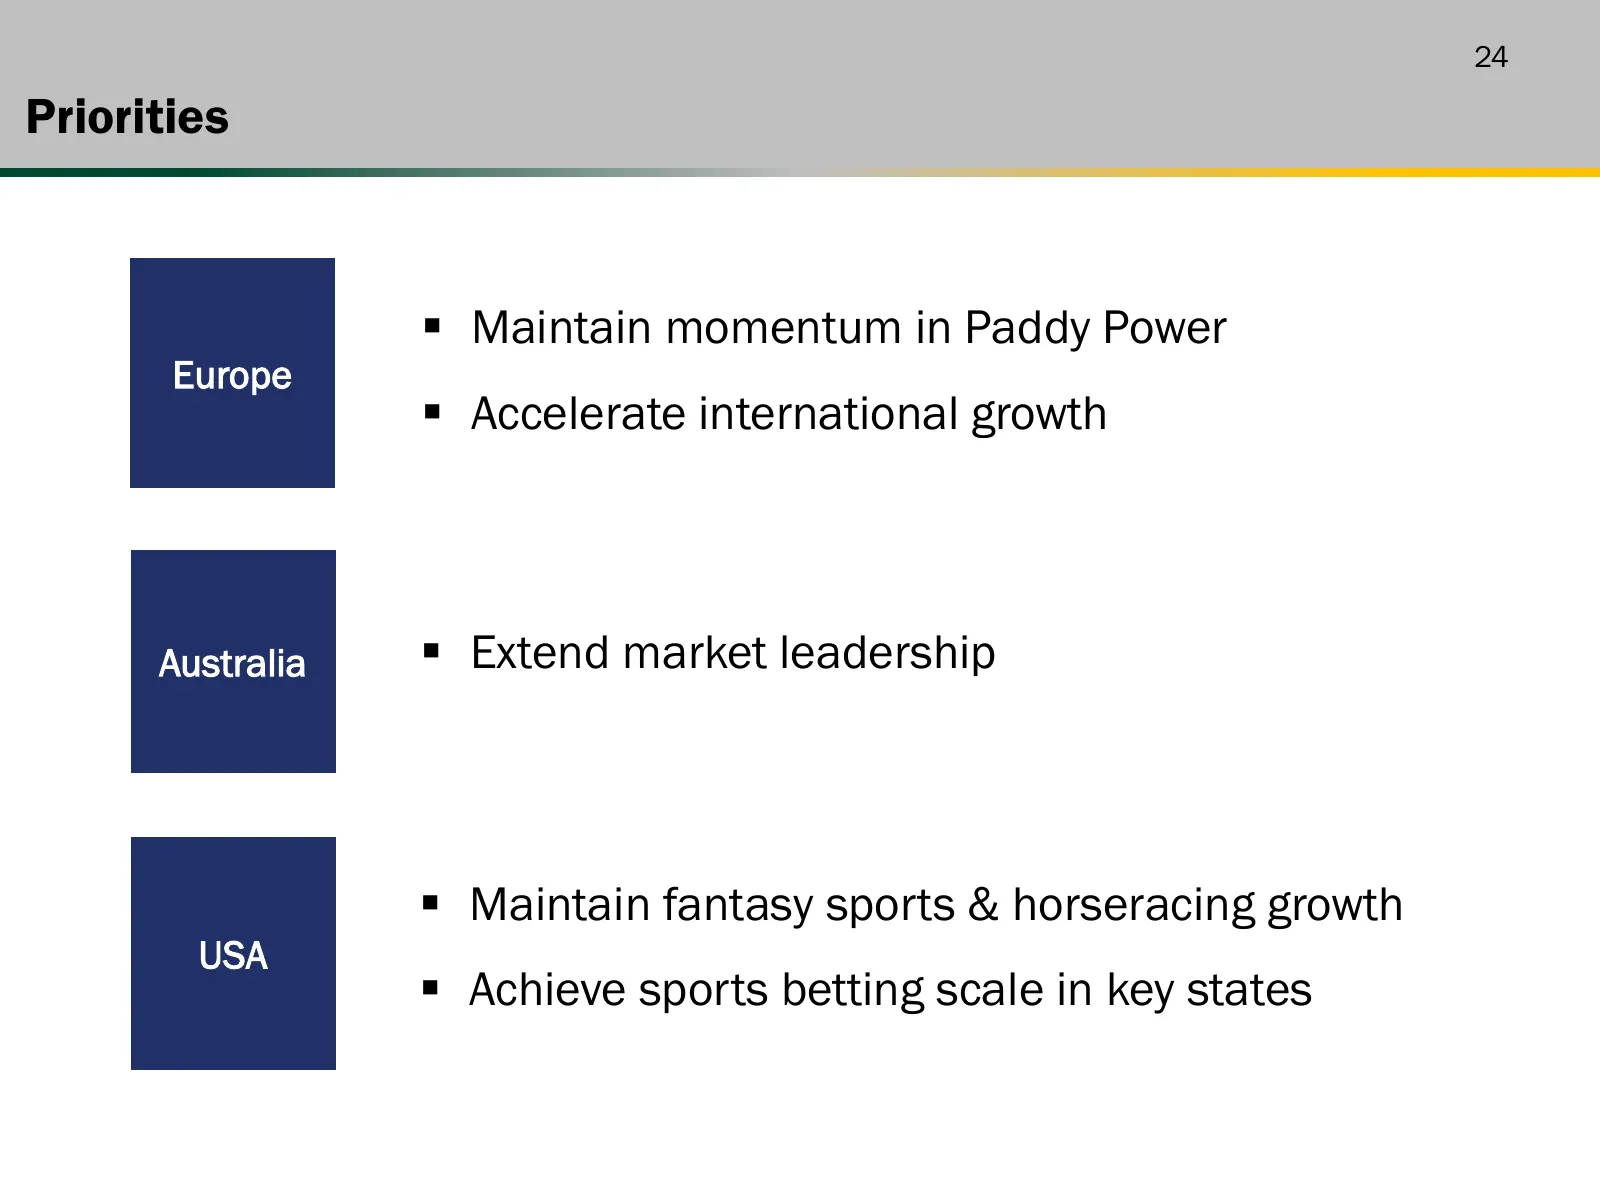
Slide 24: Priorities
24 Priorities Maintain momentum in Paddy Power Europe Accelerate international growth Australia Extend market leadership Maintain fantasy sports & horseracing growth USA Achieve sports betting scale in key states

Slide 25: PA te z ° a a < a
PA te z ° 4 a a < a

Slide 26: Appendix
pETHIR CHASE 2017 /WINNER - =
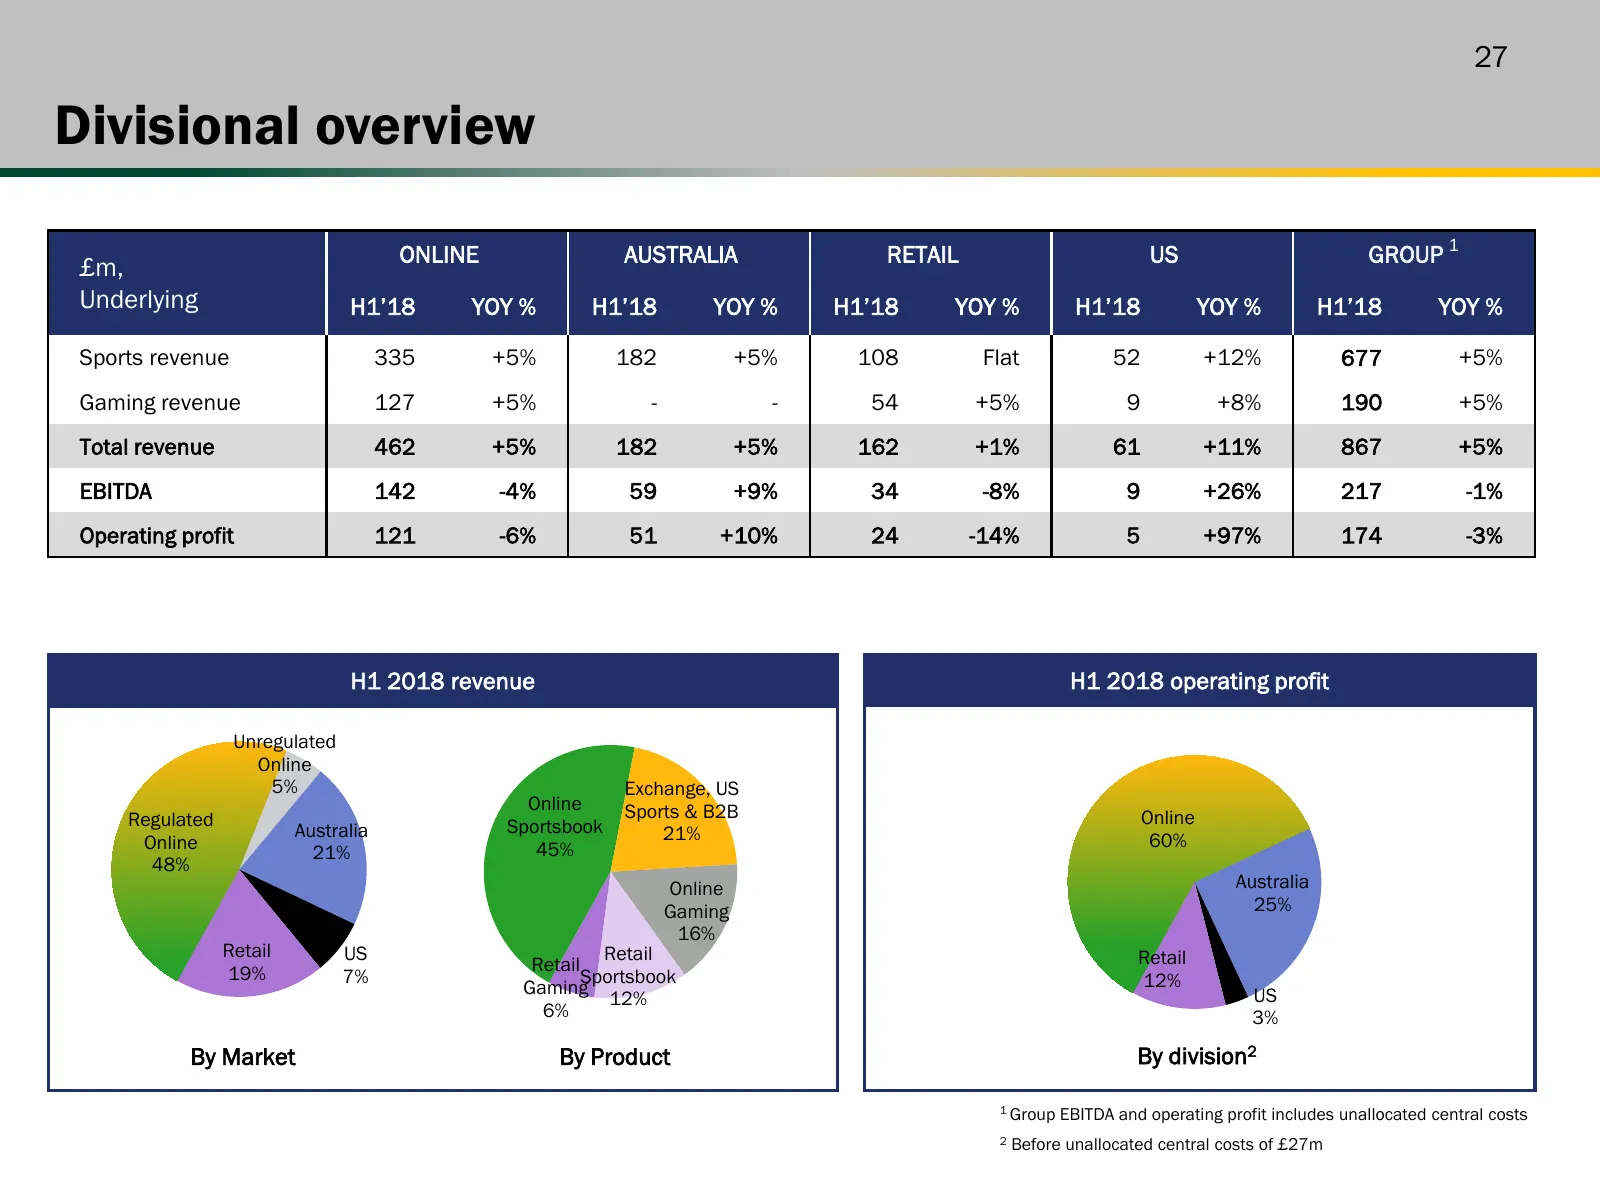
Slide 27: Divisional overview
27 Divisional overview ONLINE AUSTRALIA RETAIL US GROUP 1 £m, Underlying H1’18 YOY % H1’18 YOY % H1’18 YOY % H1’18 YOY % H1’18 YOY % Sports revenue 335 +5% 182 +5% 108 Flat 52 +12% 677 +5% Gaming revenue 127 +5% - - 54 +5% 9 +8% 190 +5% Total revenue 462 +5% 182 +5% 162 +1% 61 +11% 867 +5% EBITDA 14
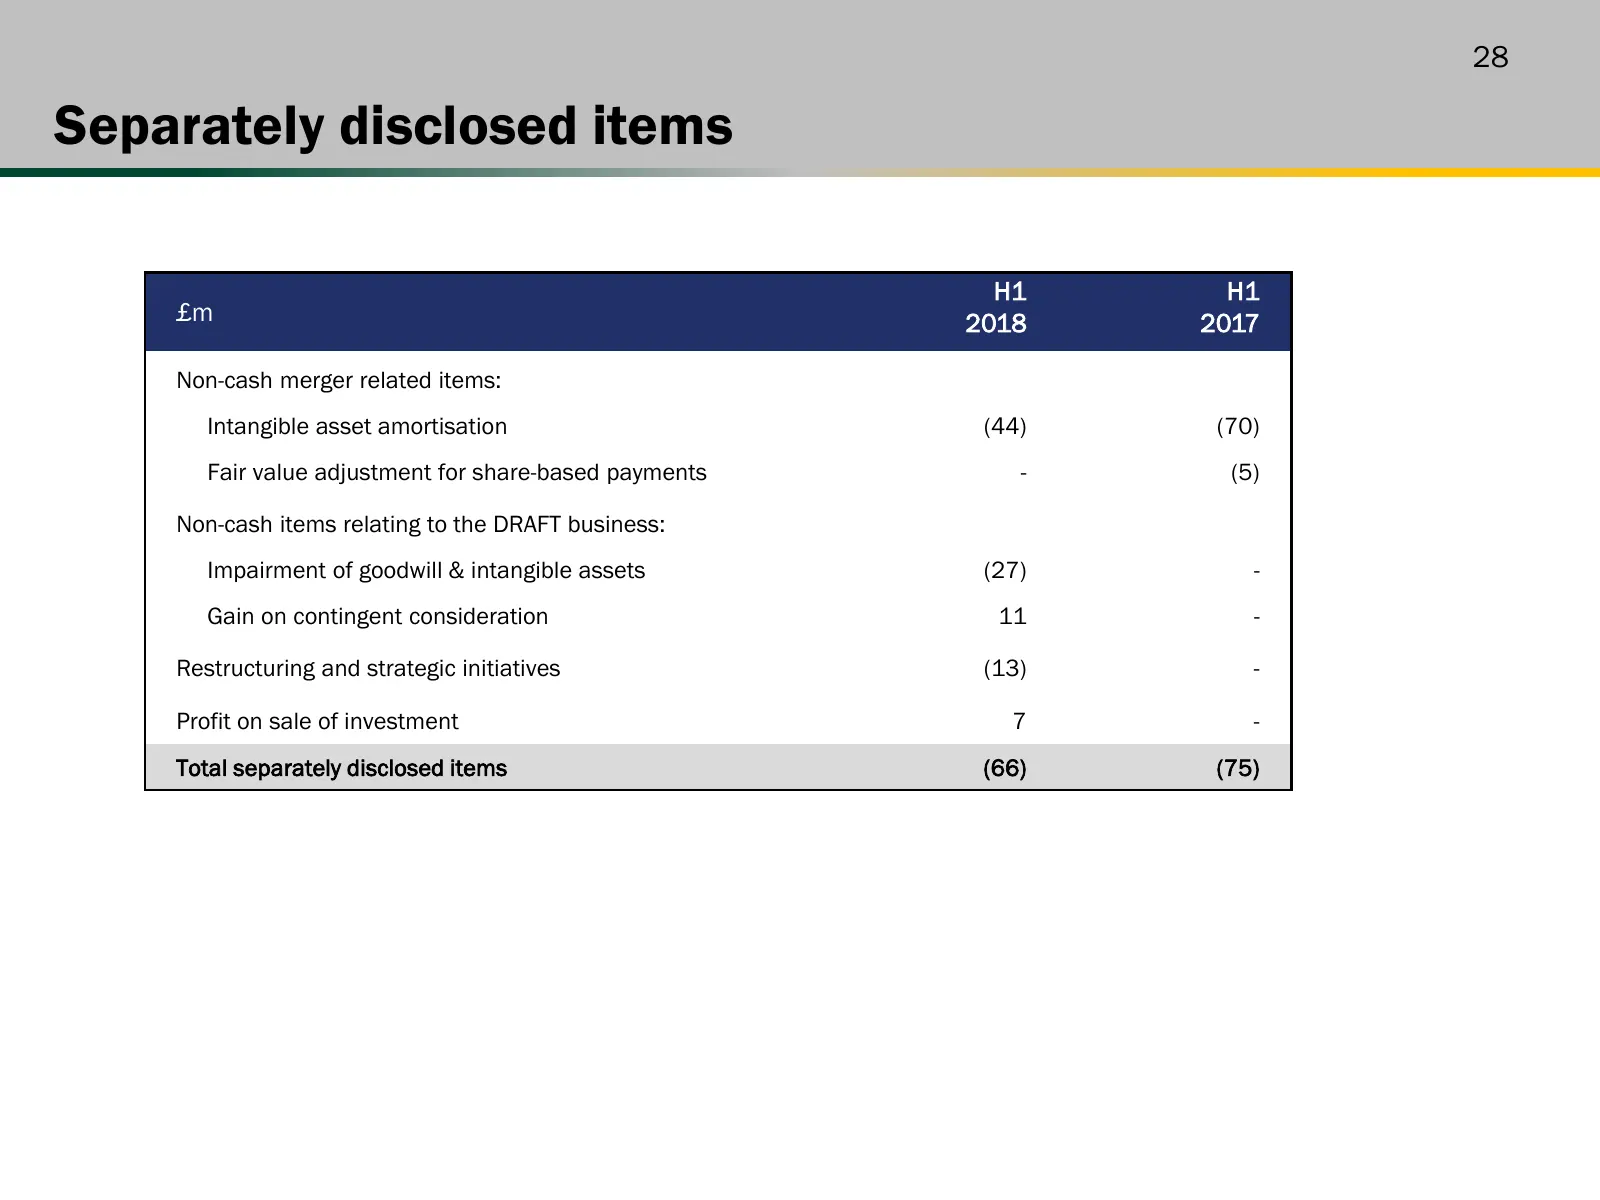
Slide 28: Separately disclosed items
28 Separately disclosed items H1 H1 £m 2018 2017 Non-cash merger related items: Intangible asset amortisation (44) (70) Fair value adjustment for share-based payments - (5) Non-cash items relating to the DRAFT business: Impairment of goodwill & intangible assets (27) - Gain on contingent considerati
Source: Internet Archive copy of flutter.com
More decks from Flutter Entertainment plc
 Q3 2026 Earnings Presentation15 slides · Nov 4, 2026
 Q2 2026 Earnings Presentation14 slides · Aug 5, 2026
 Investor Day (September 2024)152 slides · Sep 25, 2024
 Q2 2024 Earnings Presentation20 slides · Aug 13, 2024
 Q1 2024 Earnings Presentation20 slides · May 14, 2024
 FY2023 Earnings Presentation36 slides · Mar 26, 2024