Quadient SA · EURONEXT:QDT
Quadient SA — H1 2024 Earnings Presentation
45 slides from Quadient SA's earnings presentation, Sep 23, 2024
Slide 1: 2024 first-half results
QUADIENT 2024 first-half results 23 September 2024 © 2024 Quadient. All rights reserved. 1
Slide 2: Disclaimer
Disclaimer FORWARD-LOOKING STATEMENT This presentation contains forward-looking statements (made pursuant to (i) the safe harbour provisions of the Private Securities Litigation Reform Act of 1995 and (ii) the principles of the French Autorité des Marchés Financiers' guide to periodical disclosures
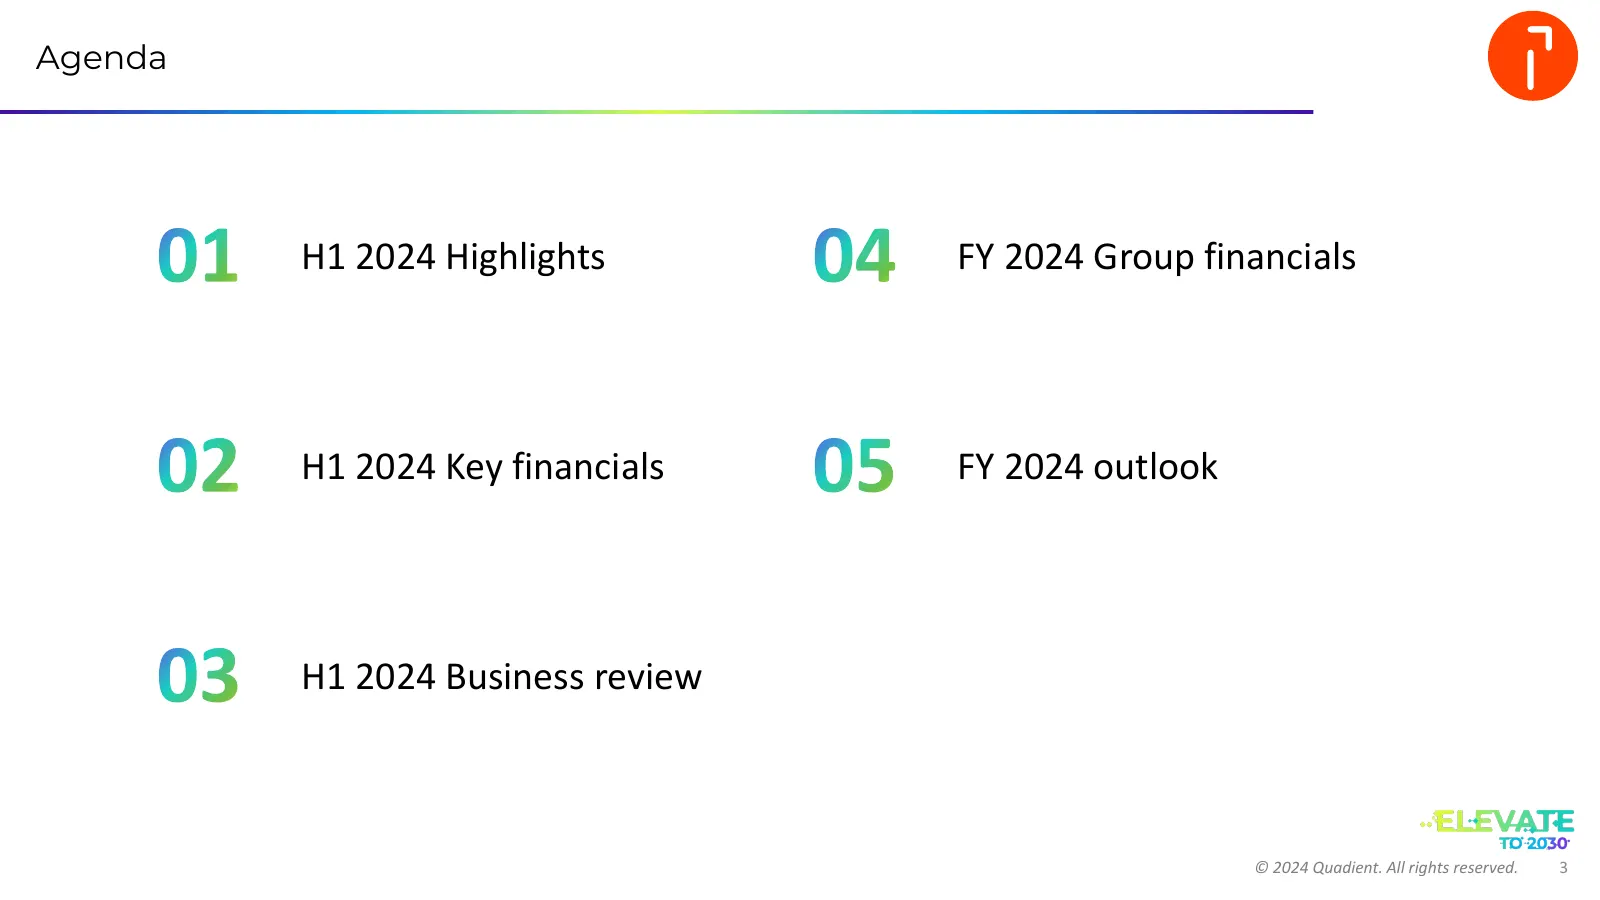
Slide 3: Agenda
Agenda 01 H1 2024 Highlights 04 FY 2024 Group financials 02 H1 2024 Key financials 05 FY 2024 outlook 03 H1 2024 Business review © 2024 Quadient. All rights reserved. 3

Slide 4: H1 2024 Highlights
Geoffrey GODET Chief Executive Officer 01 H1 2024 HIGHLIGHTS © 2024 Quadient. All rights reserved. 4
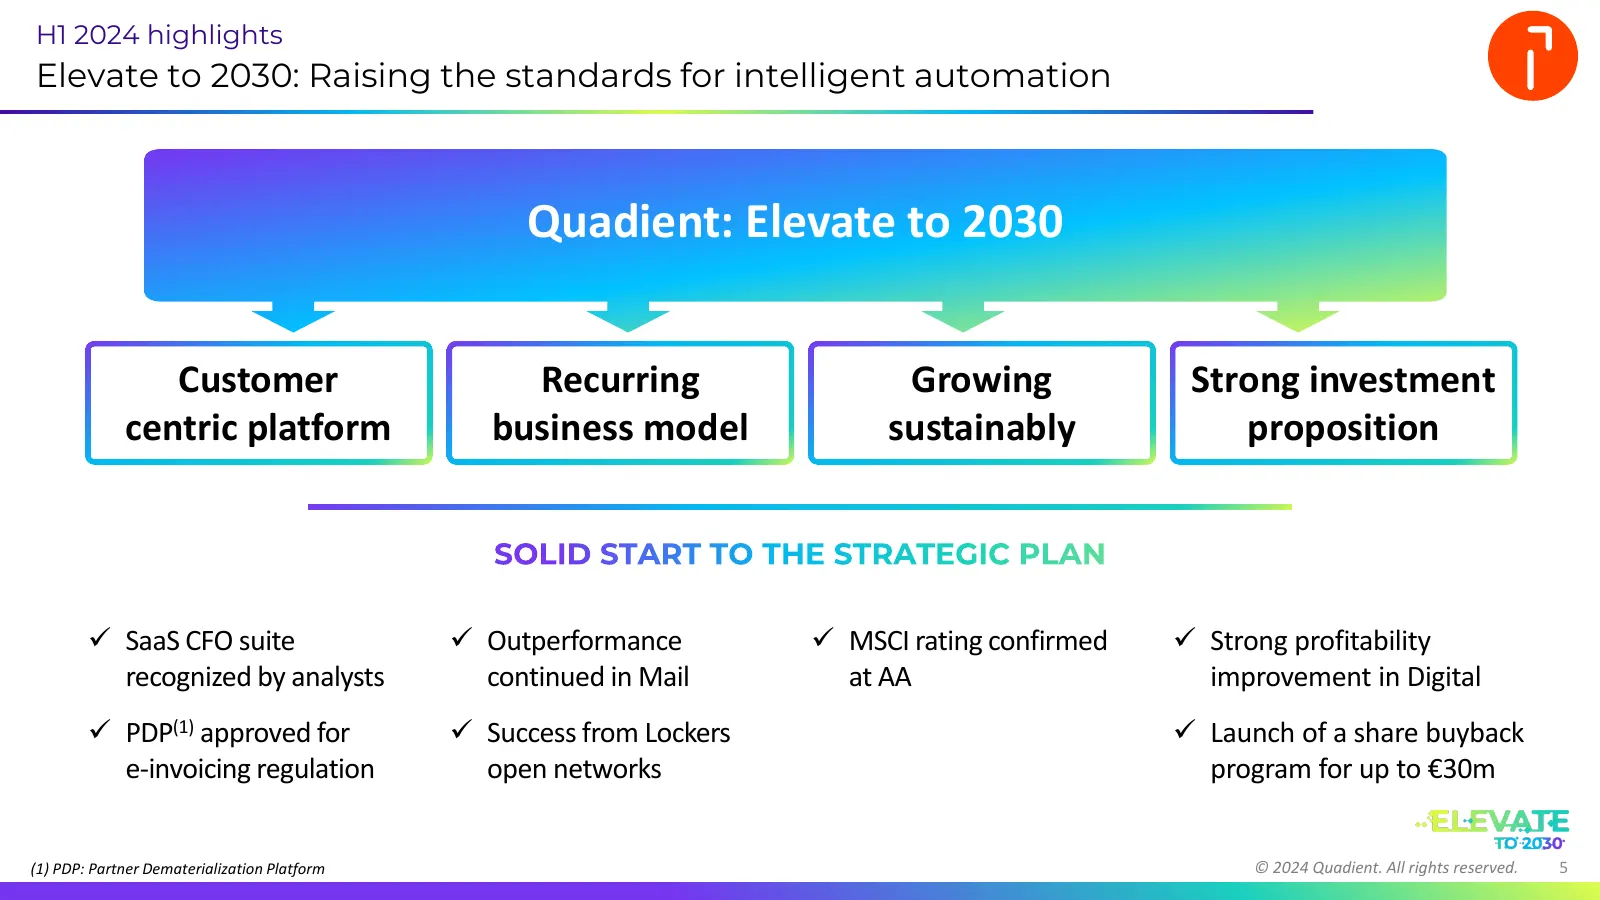
Slide 5: Quadient: Elevate to 2030
H1 2024 highlights Elevate to 2030: Raising the standards for intelligent automation Quadient: Elevate to 2030 Customer Recurring Growing Strong investment centric platform business model sustainably proposition SOLID START TO THE STRATEGIC PLAN ✓ SaaS CFO suite ✓ Outperformance ✓ MSCI rating confir
Slide 6: Performance in line with our expectations
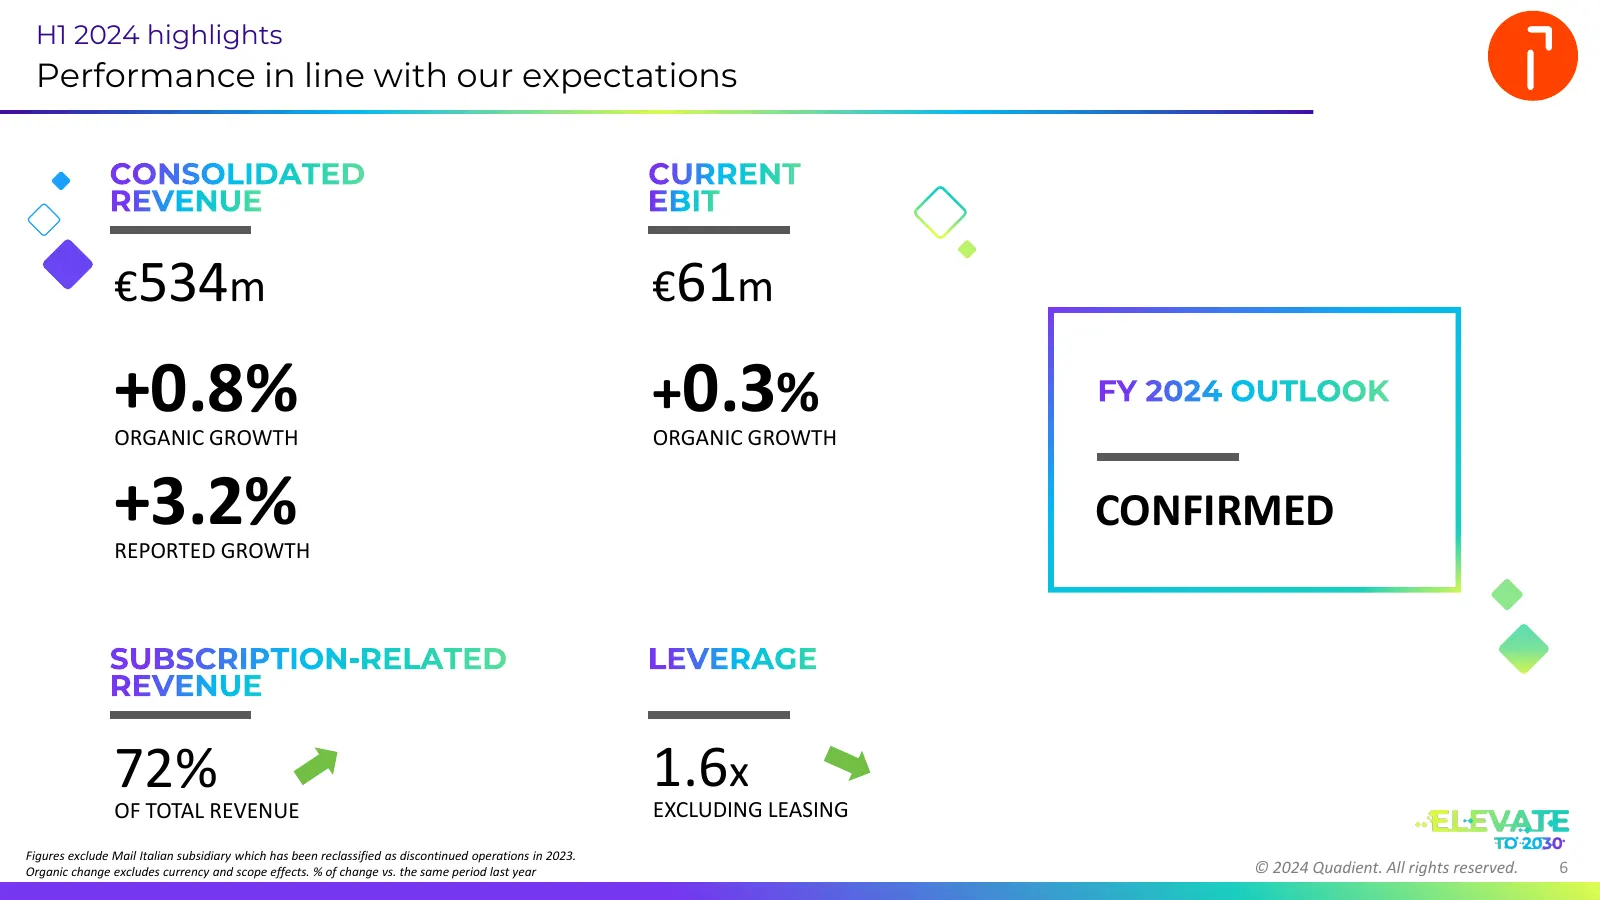
H1 2024 highlights Performance in line with our expectations CONSOLIDATED CURRENT REVENUE EBIT €534m €61m +0.8% ORGANIC GROWTH +0.3% ORGANIC GROWTH FY 2024 OUTLOOK … +3.2% REPORTED GROWTH CONFIRMED SUBSCRIPTION-RELATED LEVERAGE… REVENUE………. 72% 1.6x OF TOTAL REVENUE EXCLUDING LEASING Figures exclude
Slide 7: Launch of a share buy back program
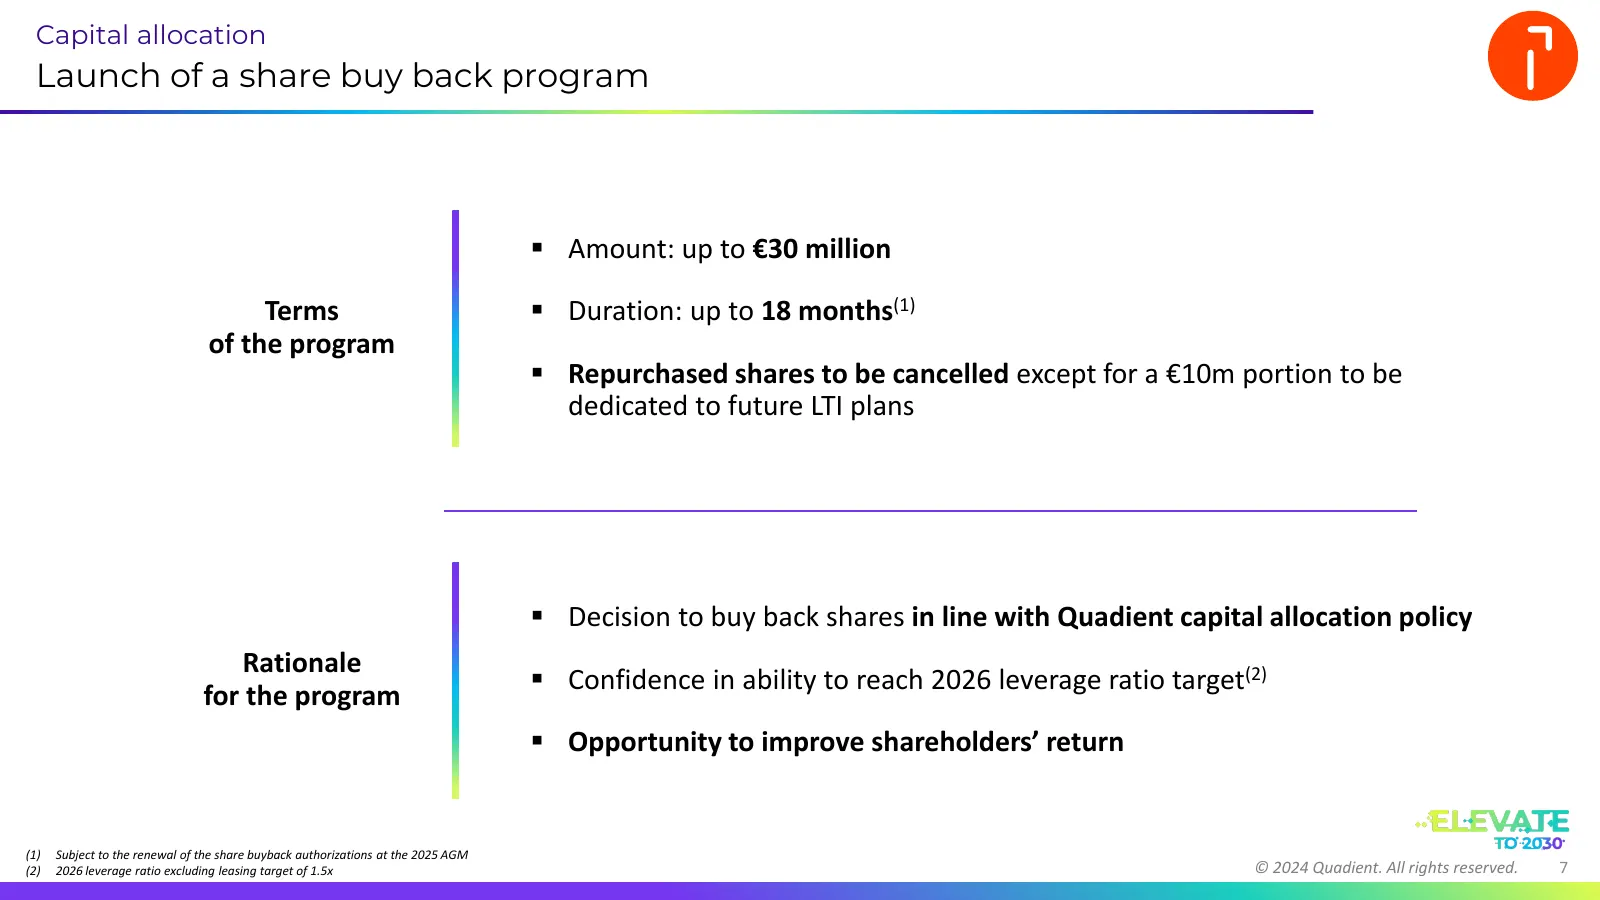
Capital allocation Launch of a share buy back program ▪ Amount: up to €30 million Terms ▪ Duration: up to 18 months(1) of the program ▪ Repurchased shares to be cancelled except for a €10m portion to be dedicated to future LTI plans ▪ Decision to buy back shares in line with Quadient capital allocat
Slide 8: Shareholding and governance updates
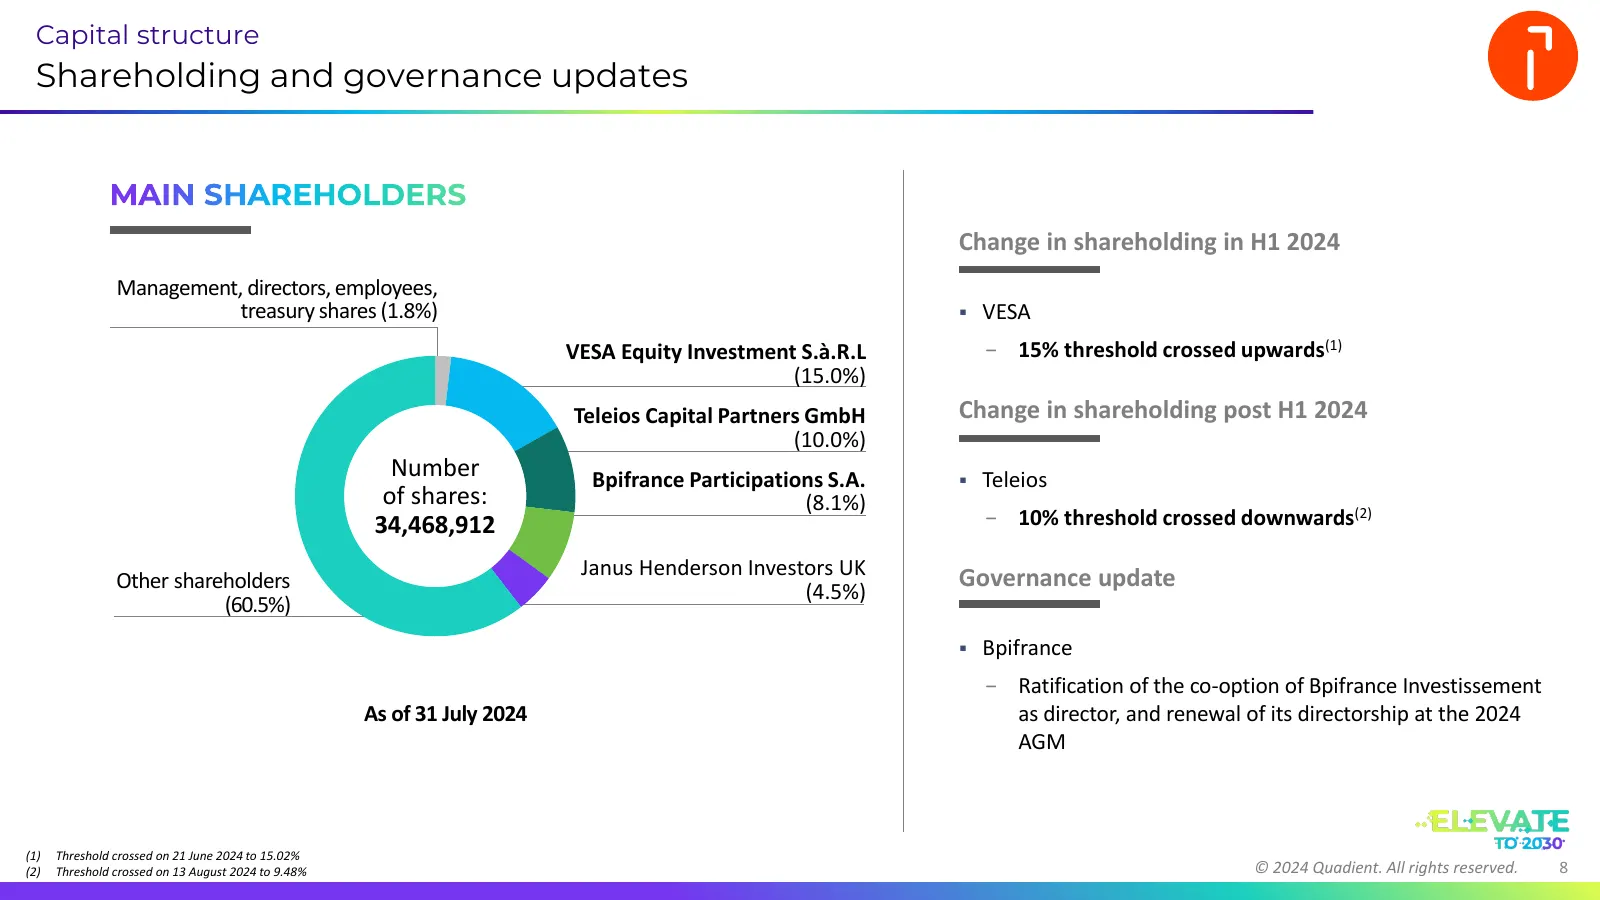
Capital structure Shareholding and governance updates MAIN SHAREHOLDERS Change in shareholding in H1 2024 Management, directors, employees, treasury shares (1.8%) ▪ VESA VESA Equity Investment S.à.R.L − 15% threshold crossed upwards(1) (15.0%) Teleios Capital Partners GmbH Change in shareholding pos
Slide 9: Key financials
Laurent du PASSAGE Chief Financial Officer 02 H1 2024 KEY FINANCIALS © 2024 Quadient. All rights reserved. 9
Slide 10: Strong performance from North America
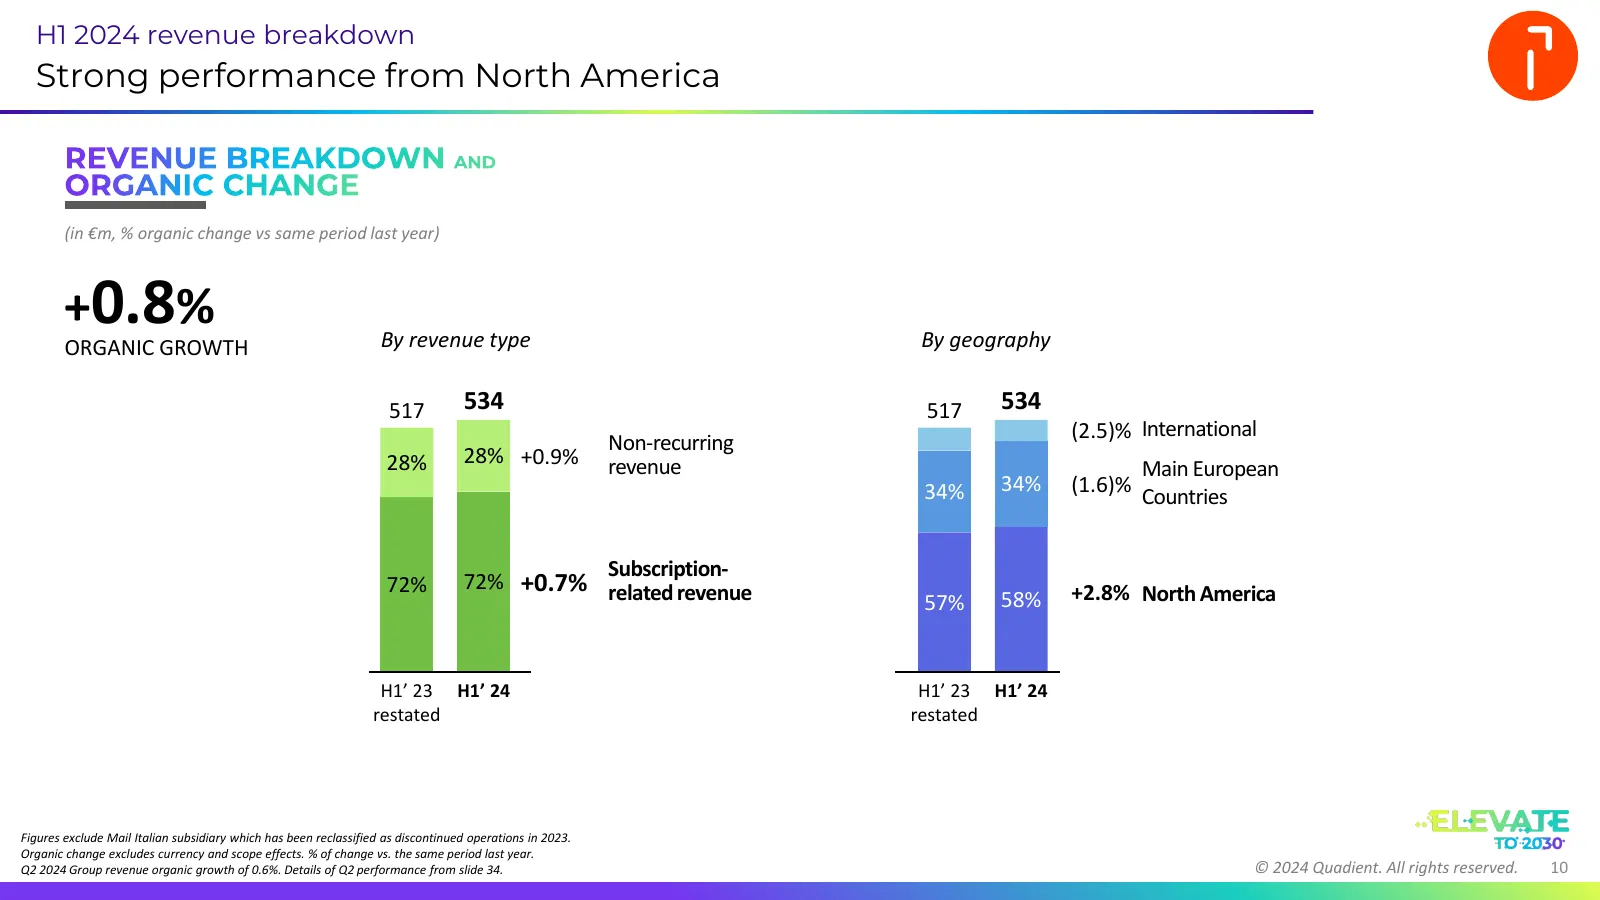
H1 2024 revenue breakdown Strong performance from North America REVENUE BREAKDOWN AND ORGANIC CHANGE (in €m, % organic change vs same period last year) +0.8% By revenue type By geography ORGANIC GROWTH 517 534 517 534 (2.5)% International Non-recurring 28% 28% +0.9% revenue Main European 34% 34% (1.
Slide 11: H1 2024 revenue bridge
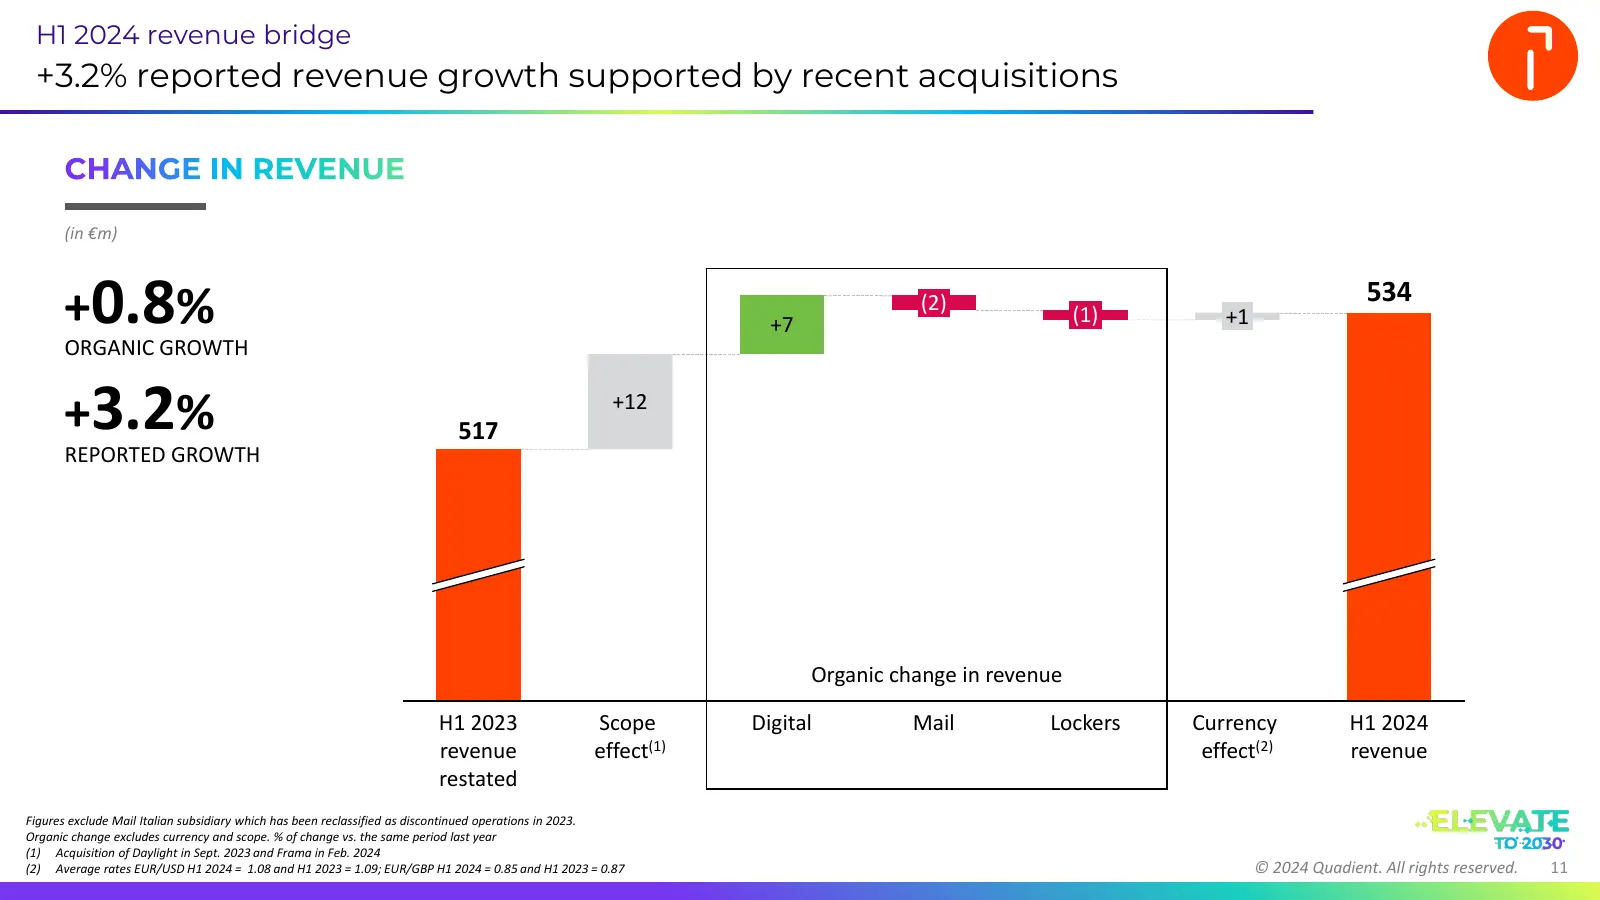
H1 2024 revenue bridge +3.2% reported revenue growth supported by recent acquisitions CHANGE IN REVENUE (in €m) +0.8% +7 (2) (1) +1 534 ORGANIC GROWTH +3.2% 517 +12 REPORTED GROWTH Organic change in revenue H1 2023 Scope Digital Mail Lockers Currency H1 2024 revenue effect(1) effect(2) revenue resta
Slide 12: H1 2024 current EBIT bridge
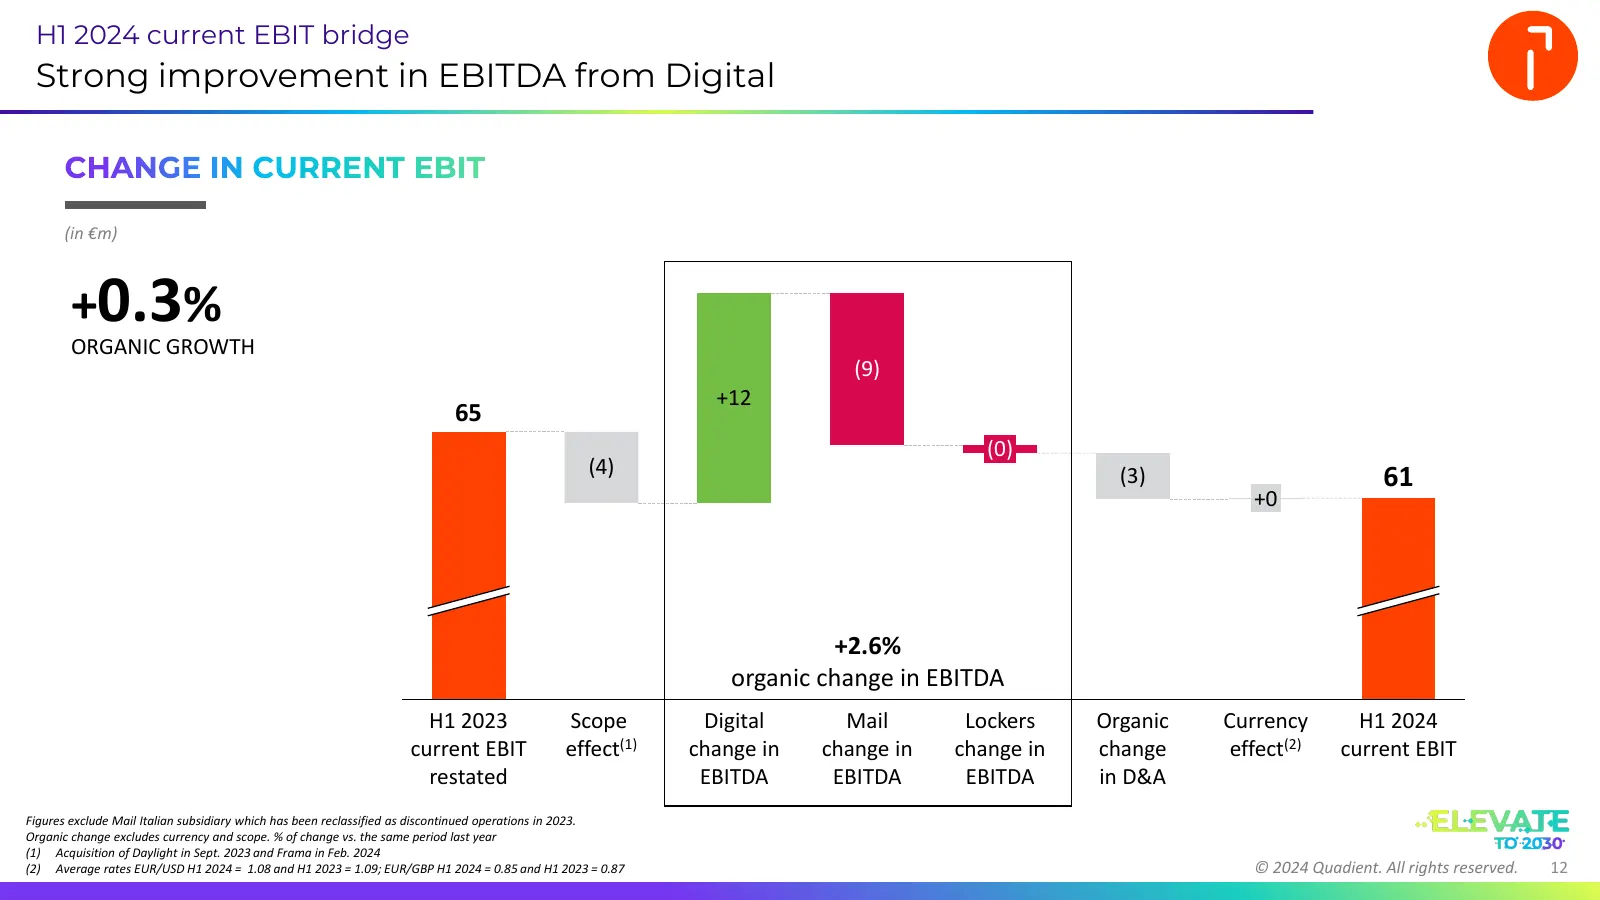
H1 2024 current EBIT bridge Strong improvement in EBITDA from Digital CHANGE IN CURRENT EBIT (in €m) +0.3% ORGANIC GROWTH (9) +12 65 (0) (4) (3) 61 +0 +2.6% organic change in EBITDA H1 2023 Scope Digital Mail Lockers Organic Currency H1 2024 current EBIT effect(1) change in change in change in chang
Slide 13: Business review
Geoffrey GODET Chief Executive Officer Laurent du PASSAGE Chief Financial Officer 03 H1 2024 BUSINESS REVIEW…………….. © 2024 Quadient. All rights reserved. 13
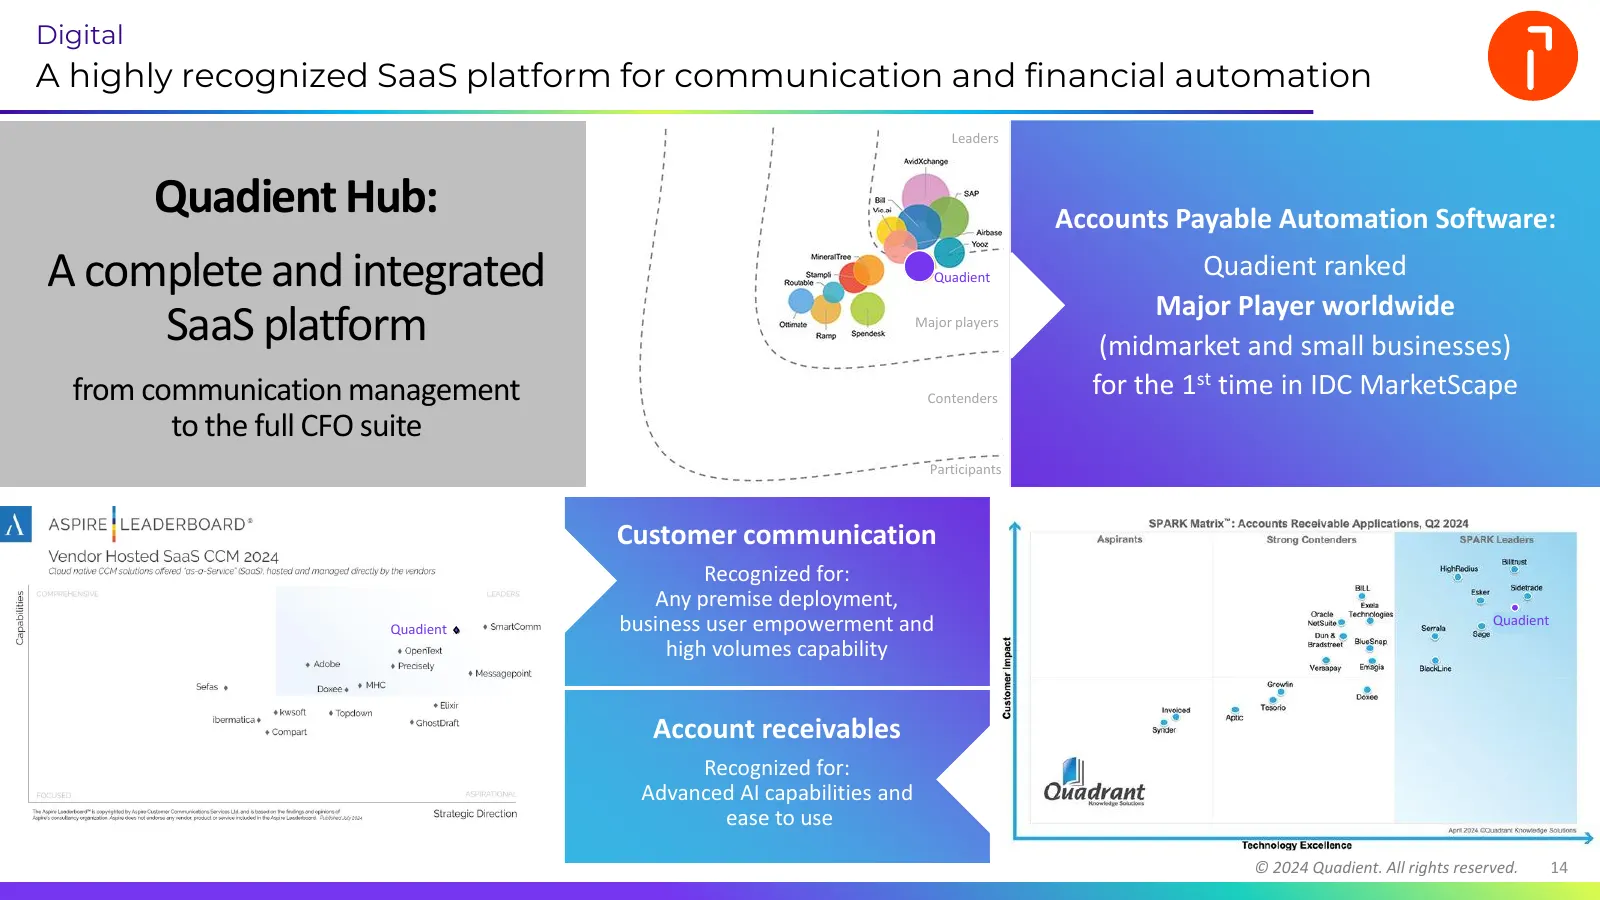
Slide 14: Quadient Hub: A complete and integrated SaaS platform
Digital A highly recognized SaaS platform for communication and financial automation Leaders Quadient Hub: Accounts Payable Automation Software: A complete and integrated Quadient Quadient ranked Major Player worldwide SaaS platform Major players (midmarket and small businesses) from communication m
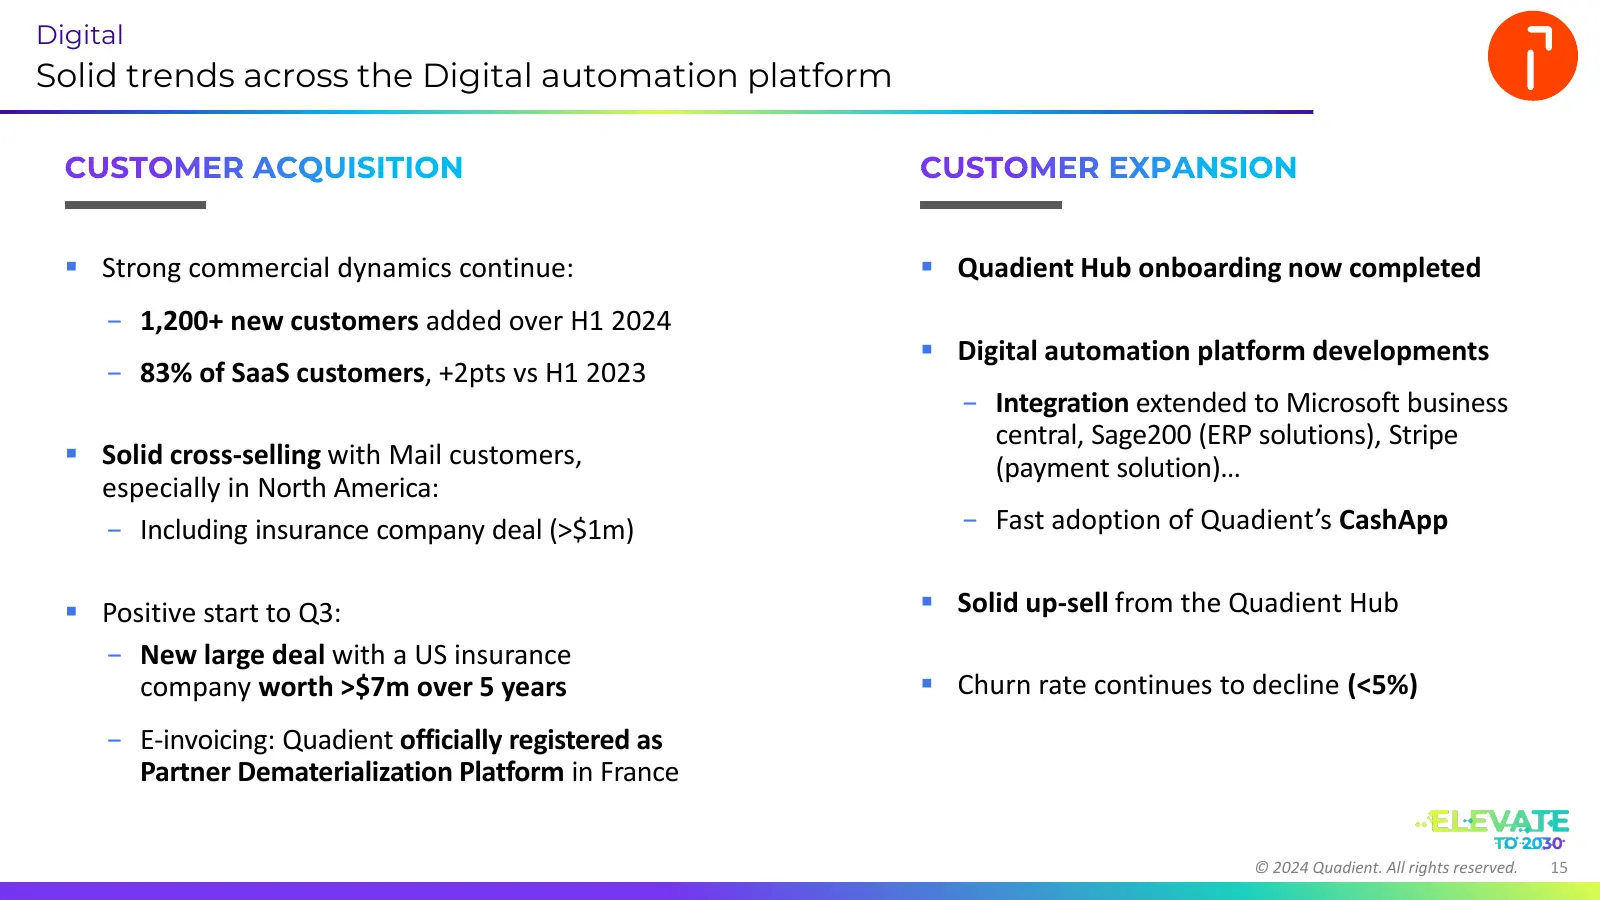
Slide 15: Solid trends across the Digital automation platform
Digital Solid trends across the Digital automation platform CUSTOMER ACQUISITION CUSTOMER EXPANSION ▪ Strong commercial dynamics continue: ▪ Quadient Hub onboarding now completed − 1,200+ new customers added over H1 2024 ▪ Digital automation platform developments − 83% of SaaS customers, +2pts vs H1
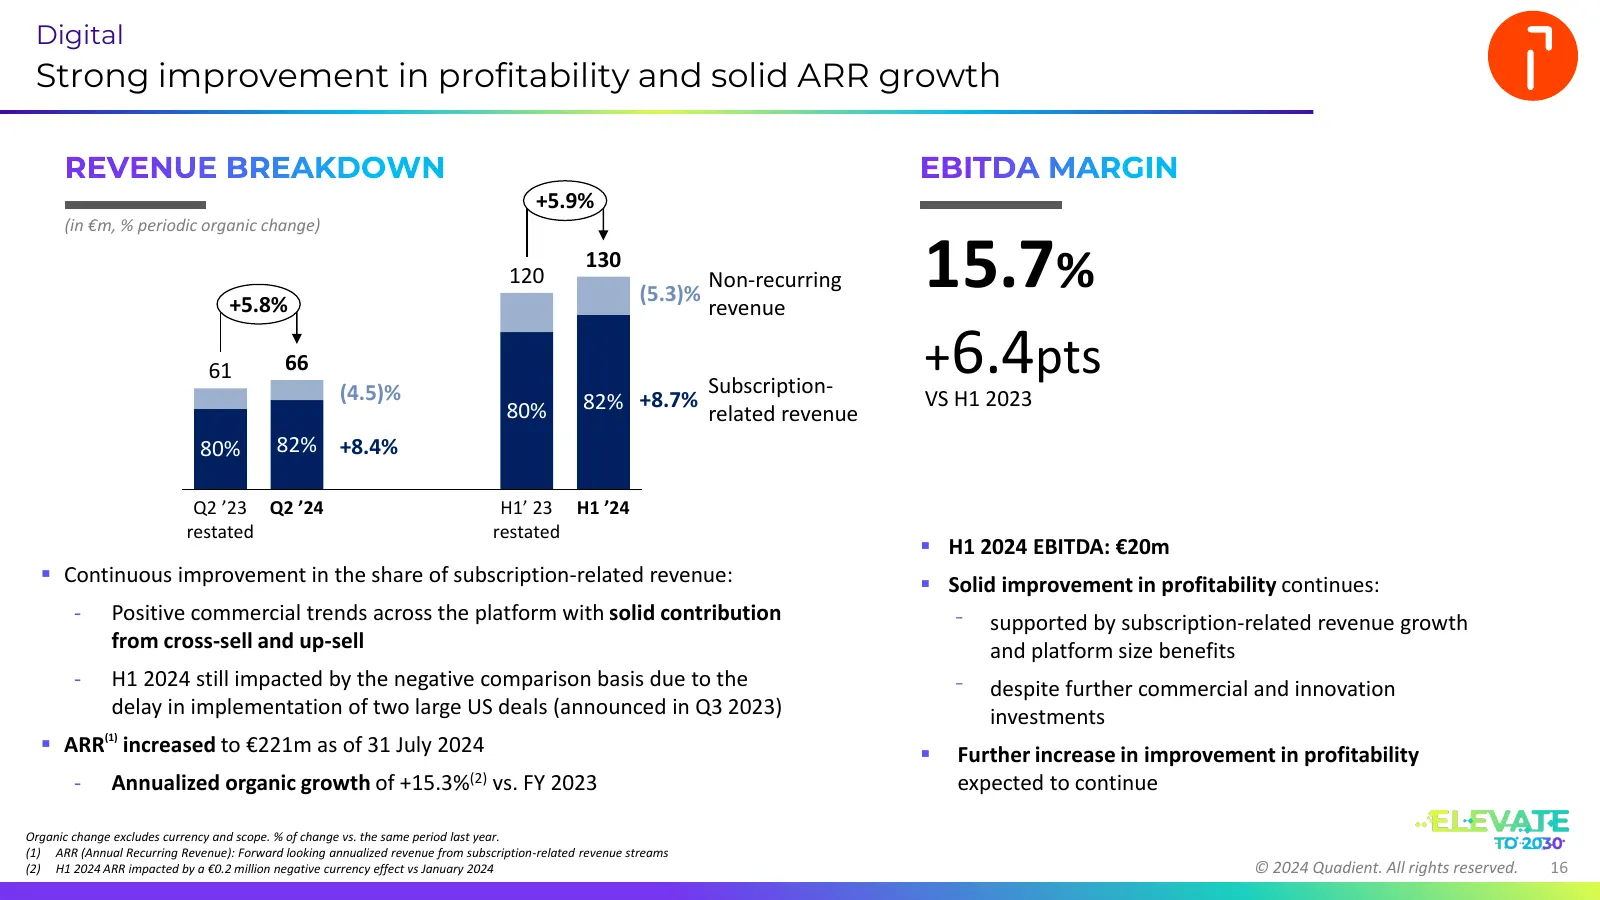
Slide 16: Digital: strong improvement in profitability and solid ARR growth
Digital Strong improvement in profitability and solid ARR growth REVENUE BREAKDOWN EBITDA MARGIN +5.9% (in €m, % periodic organic change) +5.8% 120 130 (5.3)% Non-recurring revenue 15.7% 61 66 Subscription- +6.4pts (4.5)% 82% +8.7% VS H1 2023 80% related revenue 80% 82% +8.4% Q2 ’23 Q2 ’24 H1’ 23 H1
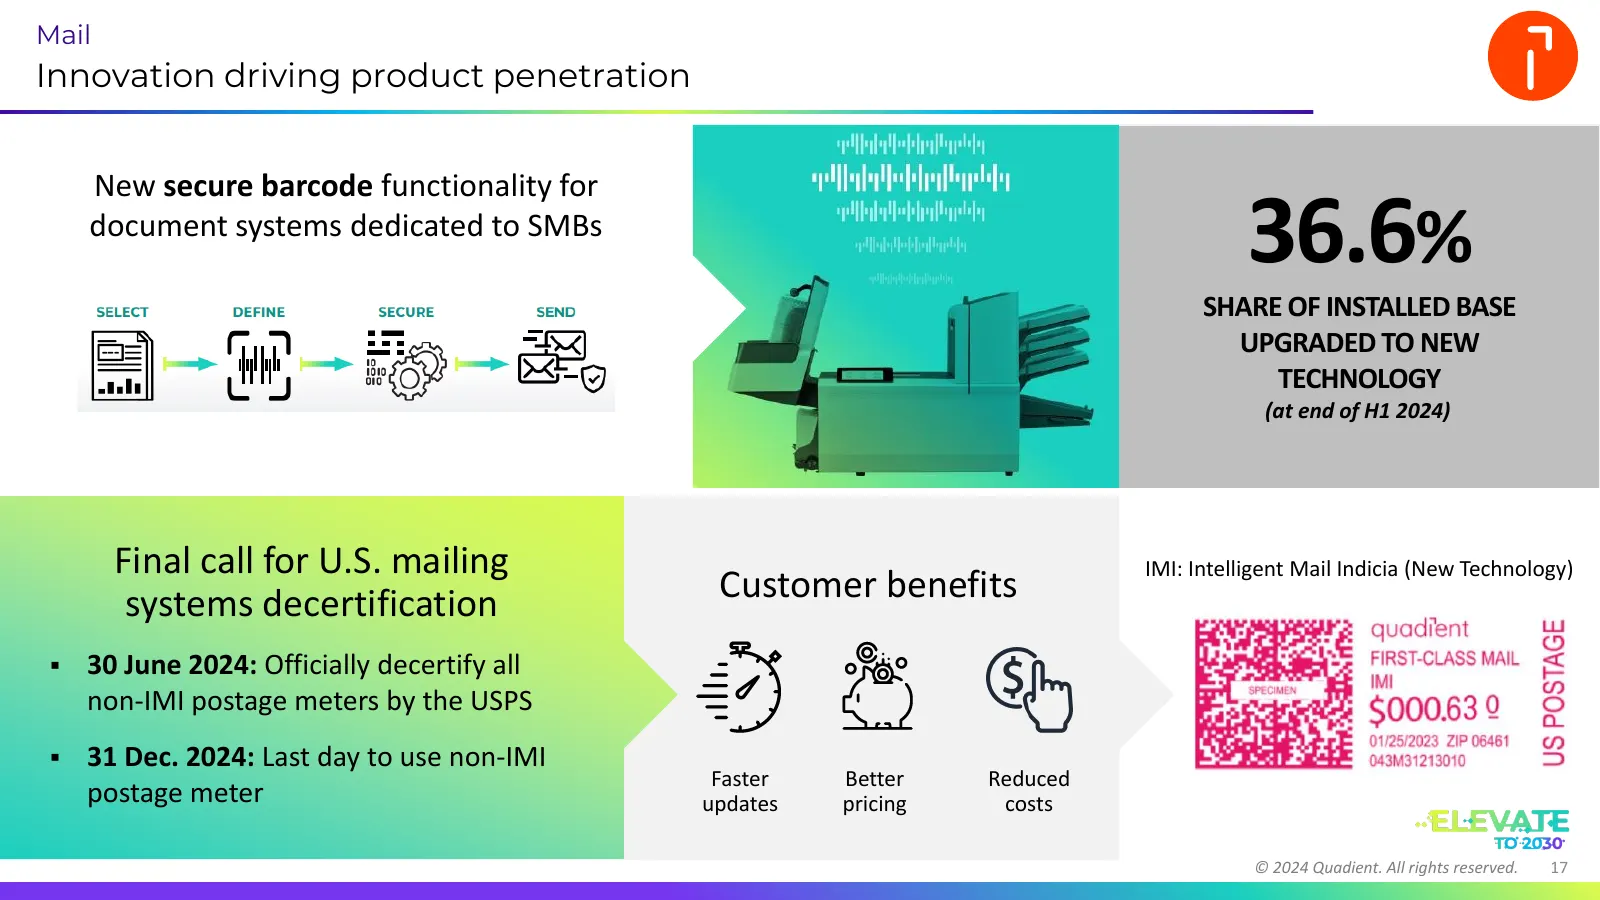
Slide 17: Mail: Innovation driving product penetration
Mail Innovation driving product penetration New secure barcode functionality for document systems dedicated to SMBs 36.6% SHARE OF INSTALLED BASE UPGRADED TO NEW TECHNOLOGY (at end of H1 2024) Final call for U.S. mailing IMI: Intelligent Mail Indicia (New Technology) systems decertification Customer
Slide 18: Mail: Strong commercial trends
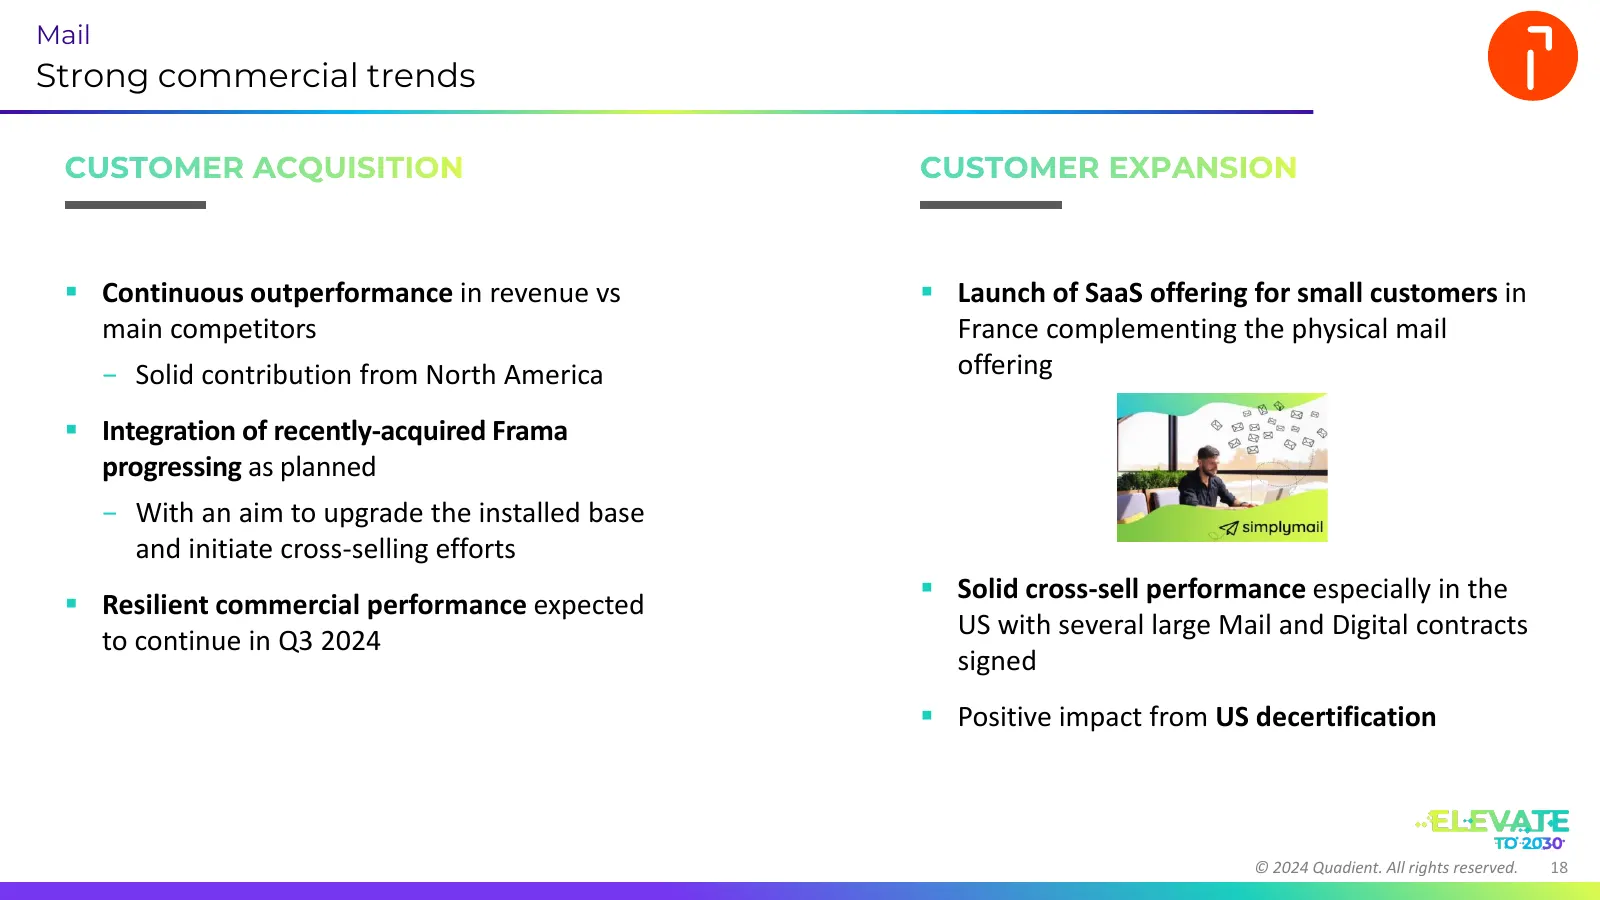
Mail Strong commercial trends CUSTOMER ACQUISITION CUSTOMER EXPANSION ▪ Continuous outperformance in revenue vs ▪ Launch of SaaS offering for small customers in main competitors France complementing the physical mail − Solid contribution from North America offering ▪ Integration of recently-acquired
Slide 19: Mail: Resilient revenue performance
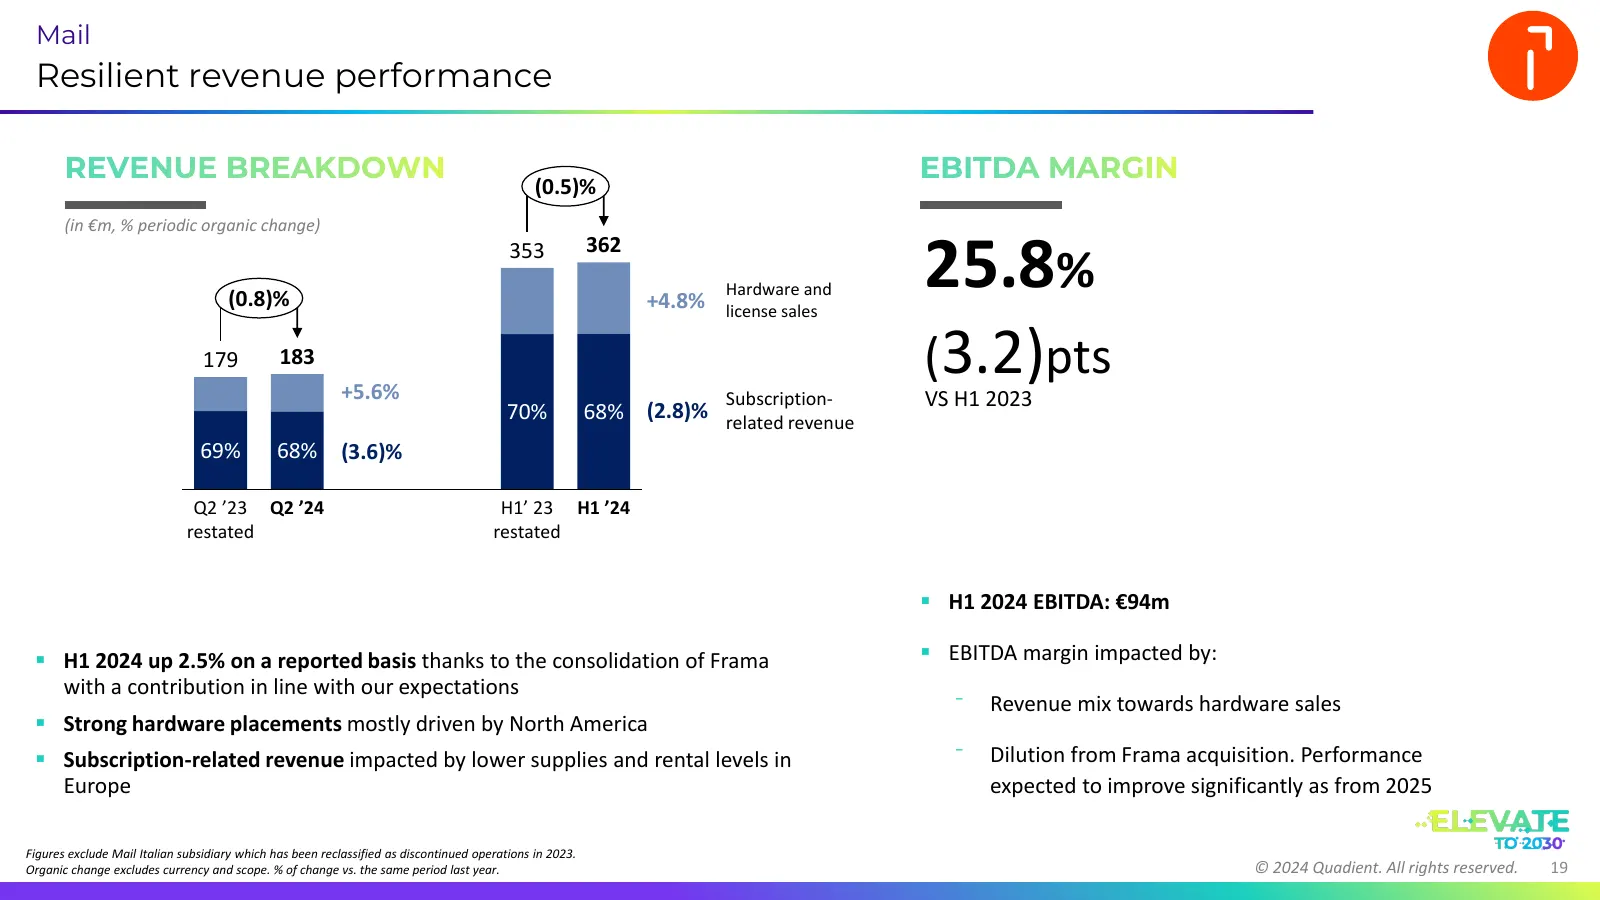
Mail Resilient revenue performance REVENUE BREAKDOWN EBITDA MARGIN (0.5)% (in €m, % periodic organic change) (0.8)% 353 362 +4.8% Hardware and license sales 25.8% 179 183 +5.6% (3.2)pts Subscription- VS H1 2023 70% 68% (2.8)% related revenue 69% 68% (3.6)% Q2 ’23 Q2 ’24 H1’ 23 H1 ’24 restated restat
Slide 20: Steady expansion of the Lockers installed base
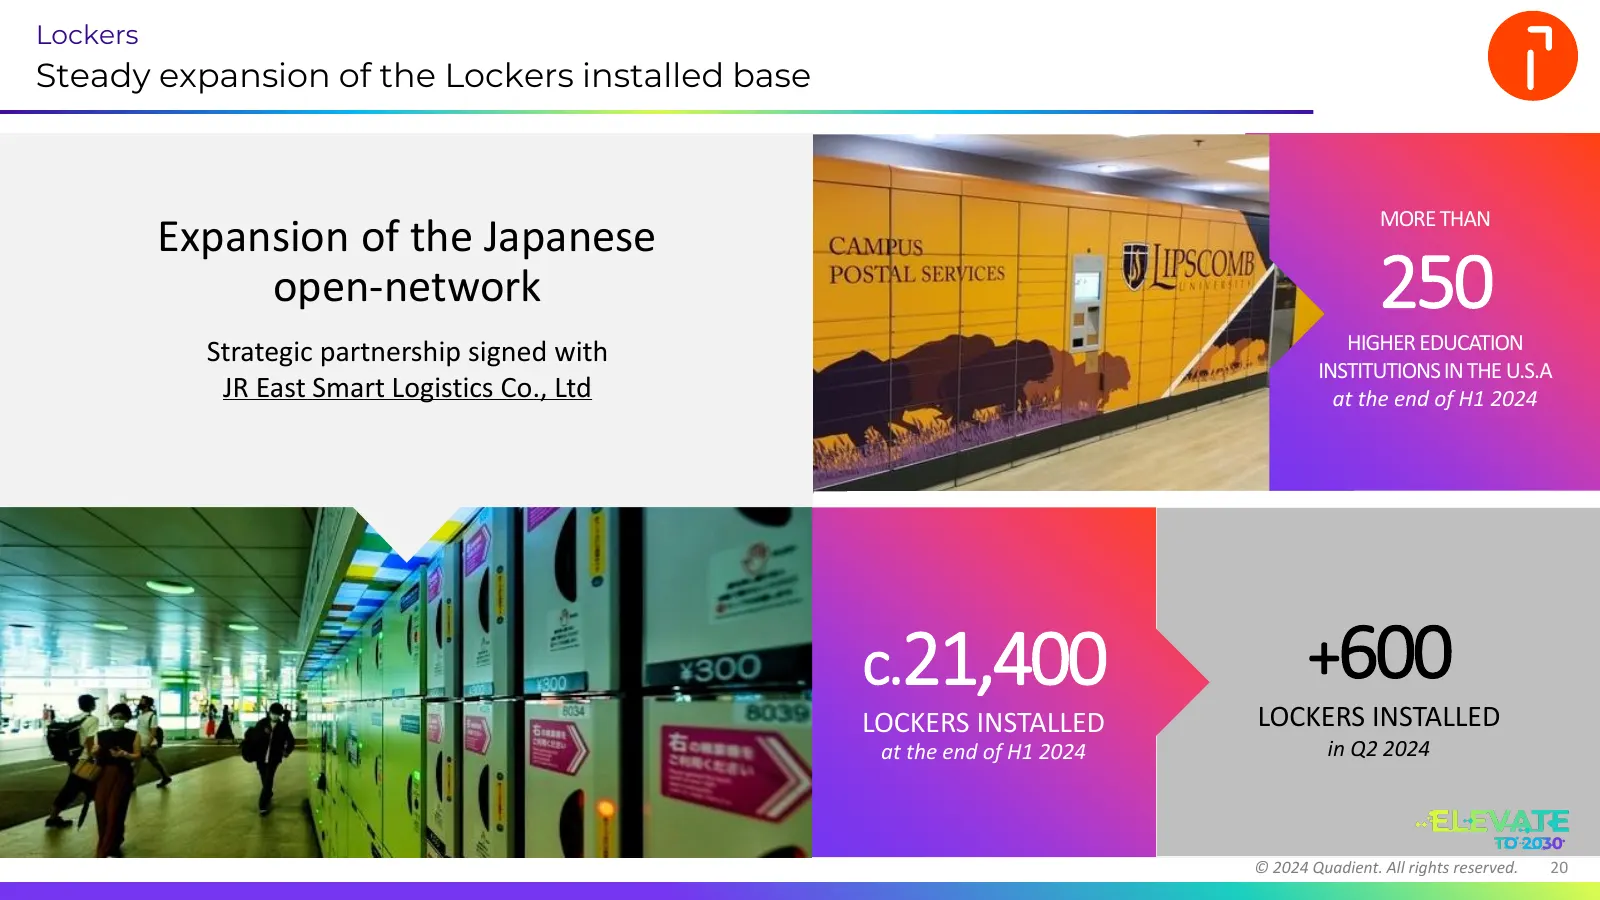
Lockers Steady expansion of the Lockers installed base MORE THAN Expansion of the Japanese open-network 250 Strategic partnership signed with HIGHER EDUCATION INSTITUTIONS IN THE U.S.A JR East Smart Logistics Co., Ltd at the end of H1 2024 c.21,400 +600 LOCKERS INSTALLED LOCKERS INSTALLED at the end
Slide 21: Fast adoption of the open network lockers
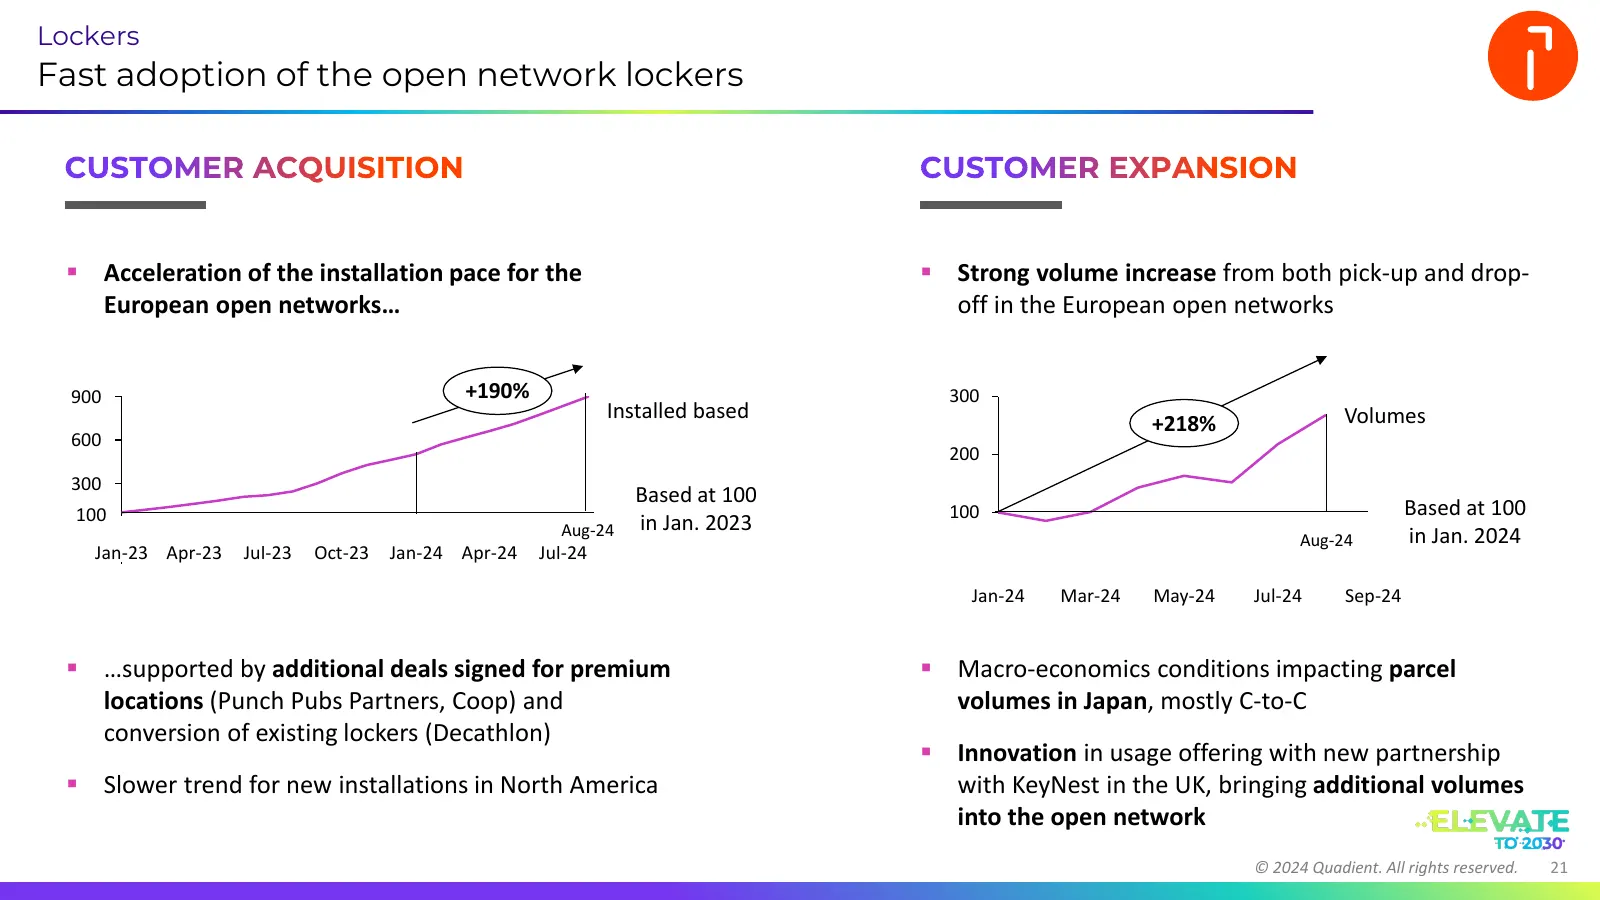
Lockers Fast adoption of the open network lockers CUSTOMER ACQUISITION CUSTOMER EXPANSION ▪ Acceleration of the installation pace for the ▪ Strong volume increase from both pick-up and drop- European open networks… off in the European open networks 900 +190% 300 Installed based Volumes +218% 600 200
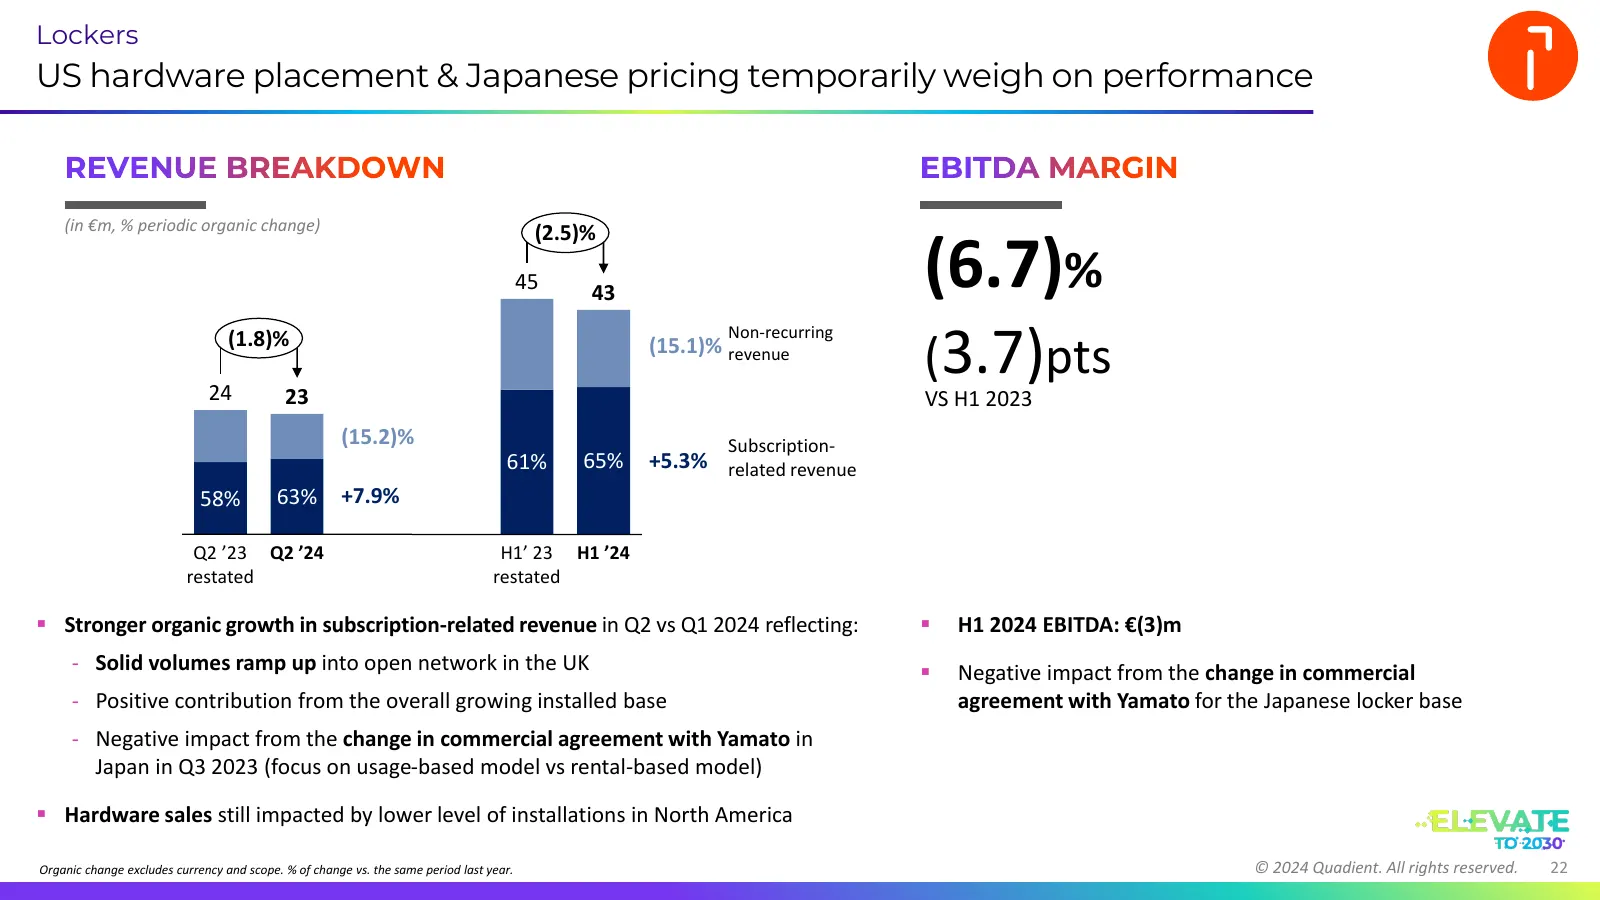
Slide 22: Lockers: US hardware placement & Japanese pricing weigh on performance
Lockers US hardware placement & Japanese pricing temporarily weigh on performance REVENUE BREAKDOWN EBITDA MARGIN (in €m, % periodic organic change) (2.5)% 45 43 (6.7)% (3.7)pts (1.8)% Non-recurring (15.1)% revenue 24 23 VS H1 2023 (15.2)% Subscription- 61% 65% +5.3% related revenue 58% 63% +7.9% Q2

Slide 23: Group financials
Laurent du PASSAGE Chief Financial Officer 04 02 H1 2024 GROUP FINANCIALS © 2024 Quadient. All rights reserved. 23
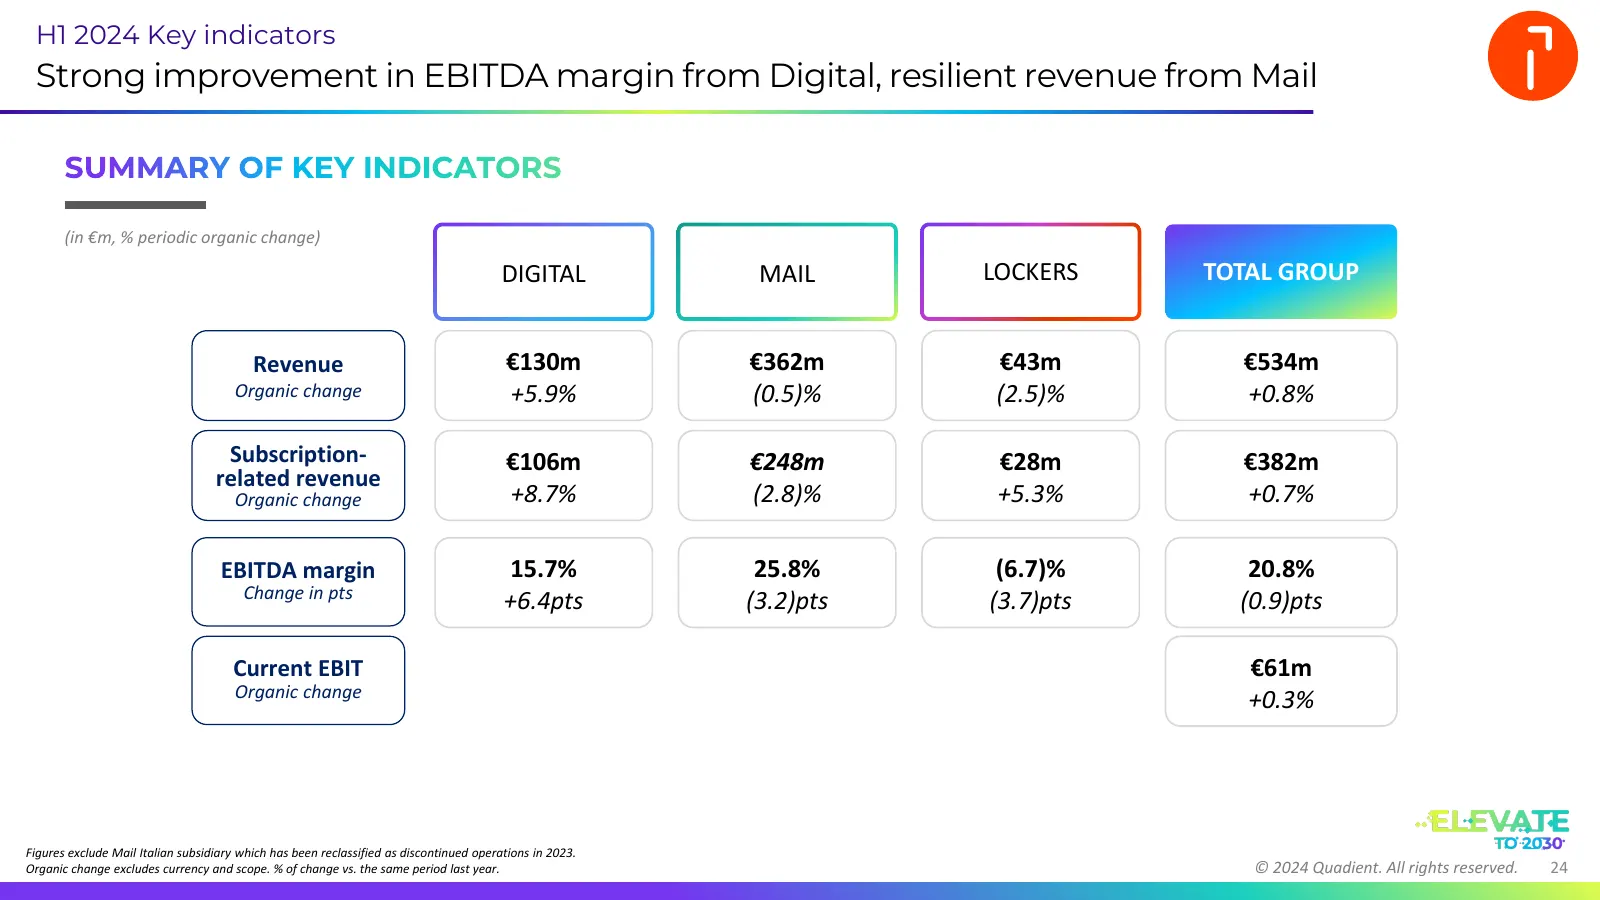
Slide 24: H1 2024 Key indicators
H1 2024 Key indicators Strong improvement in EBITDA margin from Digital, resilient revenue from Mail SUMMARY OF KEY INDICATORS (in €m, % periodic organic change) DIGITAL MAIL LOCKERS TOTAL GROUP Revenue €130m €362m €43m €534m Organic change +5.9% (0.5)% (2.5)% +0.8% Subscription- €106m €248m €28m €3
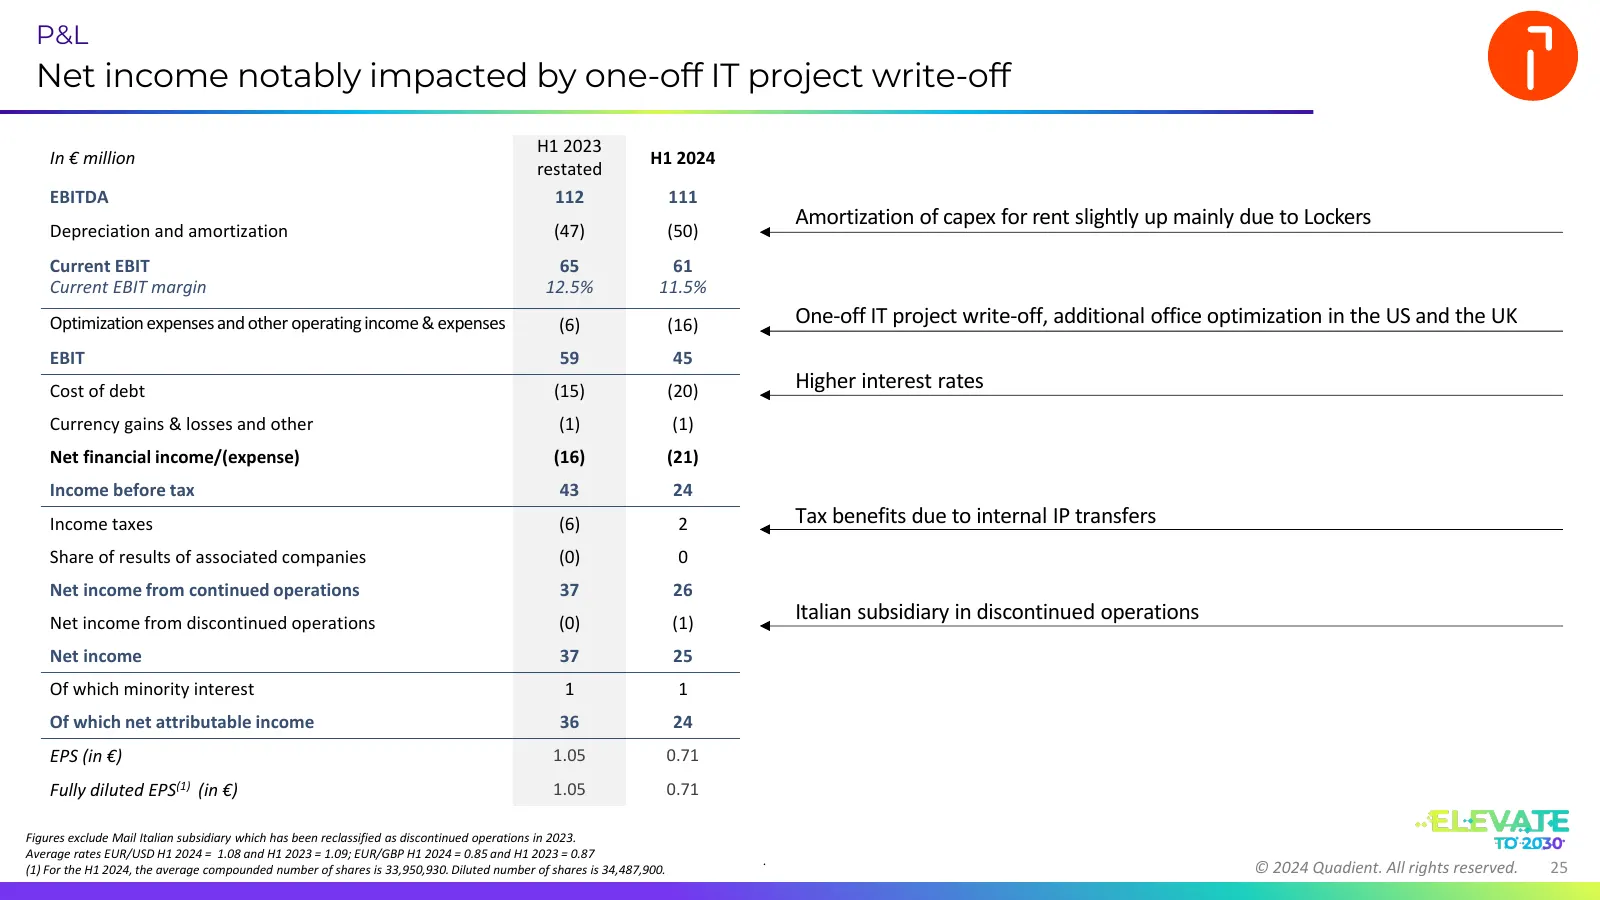
Slide 25: Net income notably impacted by one-off IT project write-off
P&L Net income notably impacted by one-off IT project write-off H1 2023 In € million H1 2024 restated EBITDA 112 111 Amortization of capex for rent slightly up mainly due to Lockers Depreciation and amortization (47) (50) Current EBIT 65 61 Current EBIT margin 12.5% 11.5% Optimization expenses and o
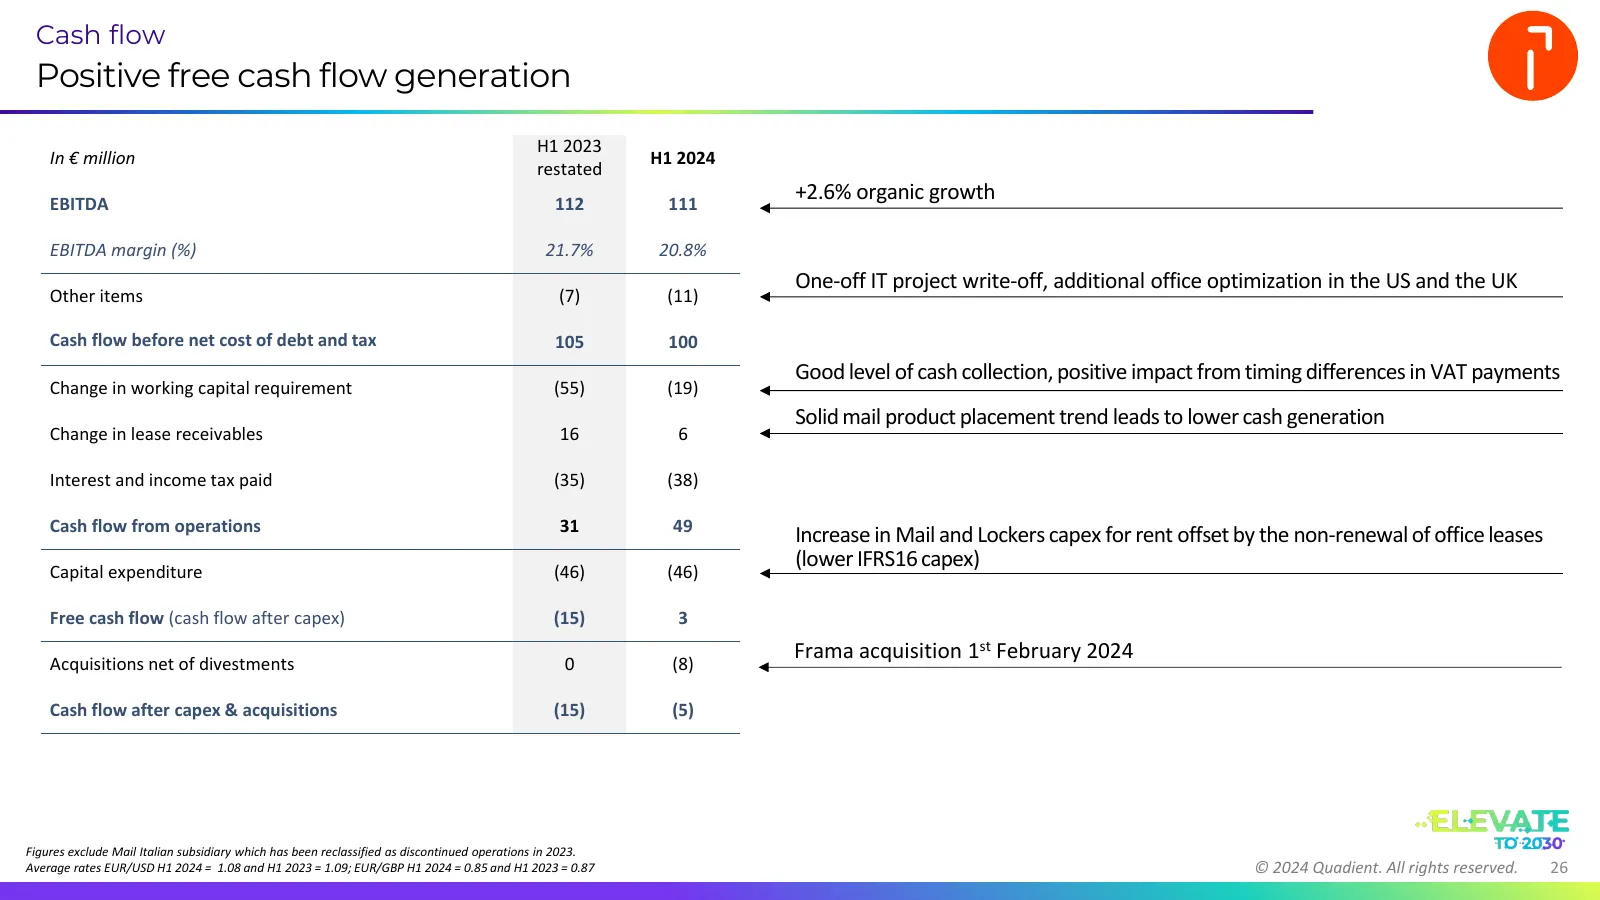
Slide 26: Positive free cash flow generation
Cash flow Positive free cash flow generation H1 2023 In € million H1 2024 restated EBITDA 112 111 +2.6% organic growth EBITDA margin (%) 21.7% 20.8% One-off IT project write-off, additional office optimization in the US and the UK Other items (7) (11) Cash flow before net cost of debt and tax 105 10
Slide 27: Stable level of capex
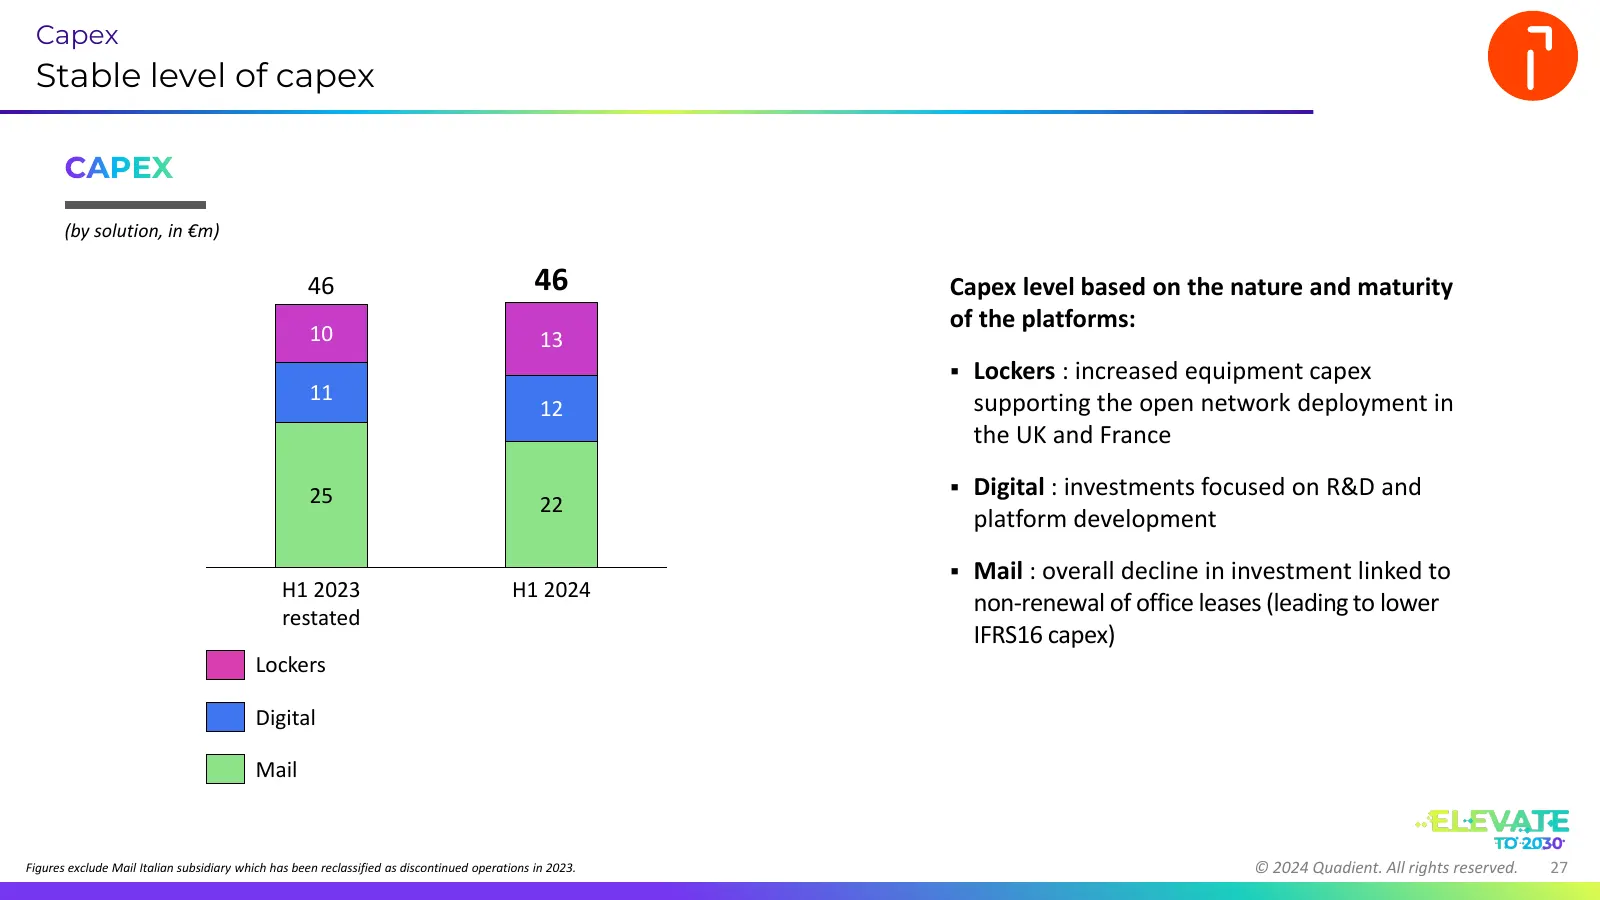
Capex Stable level of capex CAPEX (by solution, in €m) 46 46 Capex level based on the nature and maturity of the platforms: 10 13 ▪ Lockers : increased equipment capex 11 supporting the open network deployment in 12 the UK and France 25 ▪ Digital : investments focused on R&D and 22 platform developm
Slide 28: Further reduction in leverage ratio
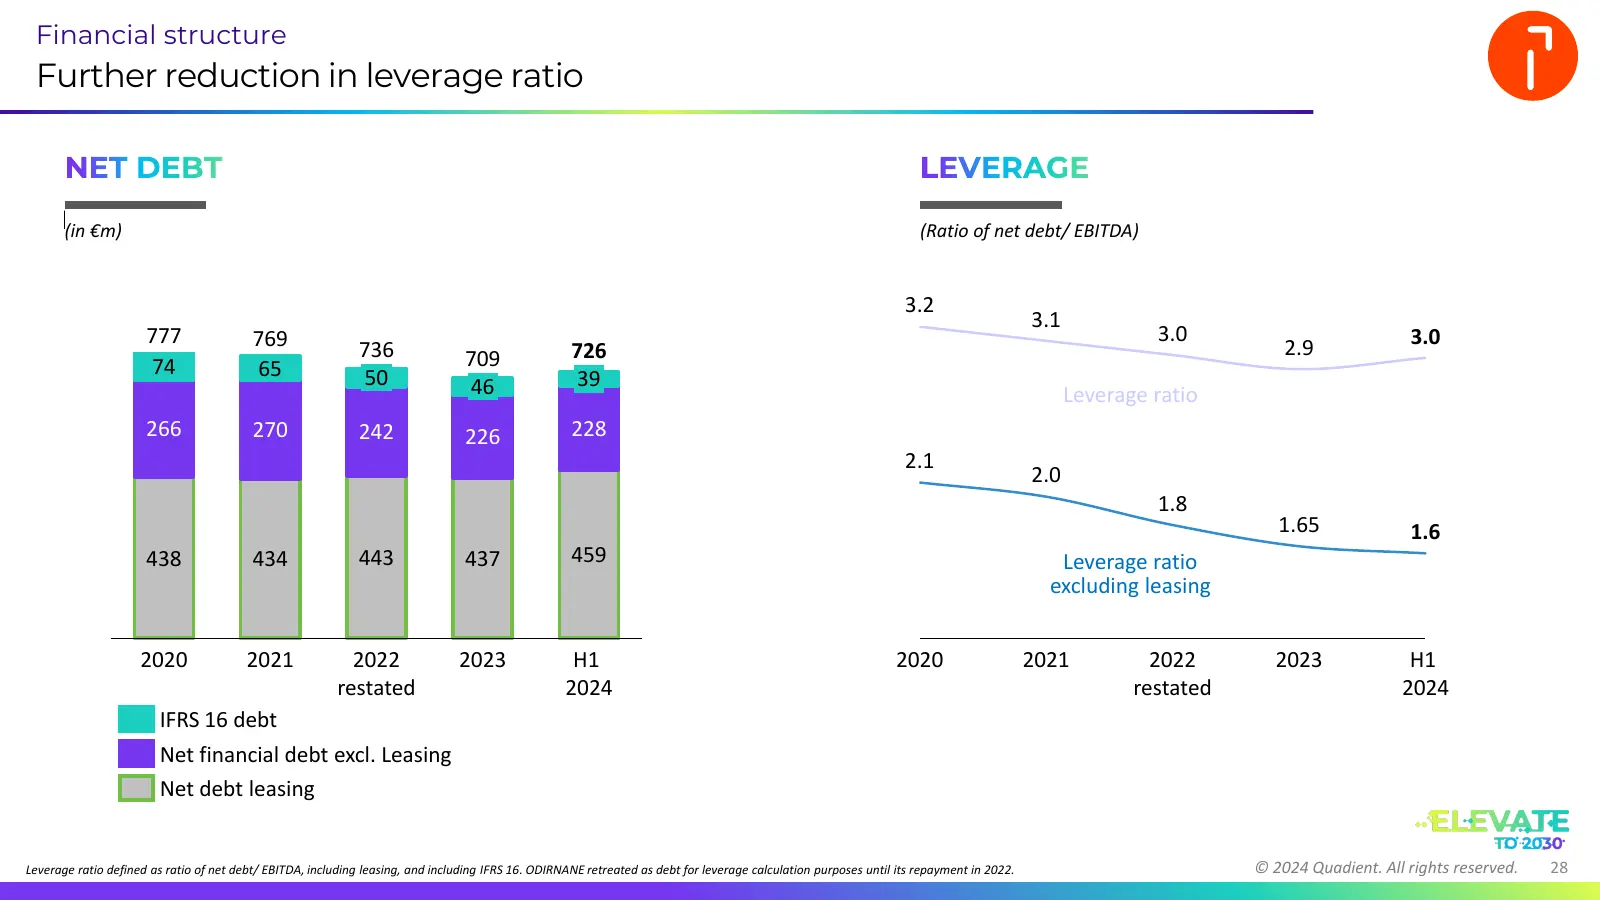
Financial structure Further reduction in leverage ratio NET DEBT LEVERAGE (in €m) (Ratio of net debt/ EBITDA) 3.2 3.1 777 769 3.0 3.0 736 709 726 2.9 74 65 50 46 39 Leverage ratio 266 270 242 226 228 2.1 2.0 1.8 1.65 1.6 438 434 443 437 459 Leverage ratio excluding leasing 2020 2021 2022 2023 H1 202
Slide 29: Well positioned to refinance the 2025 bond
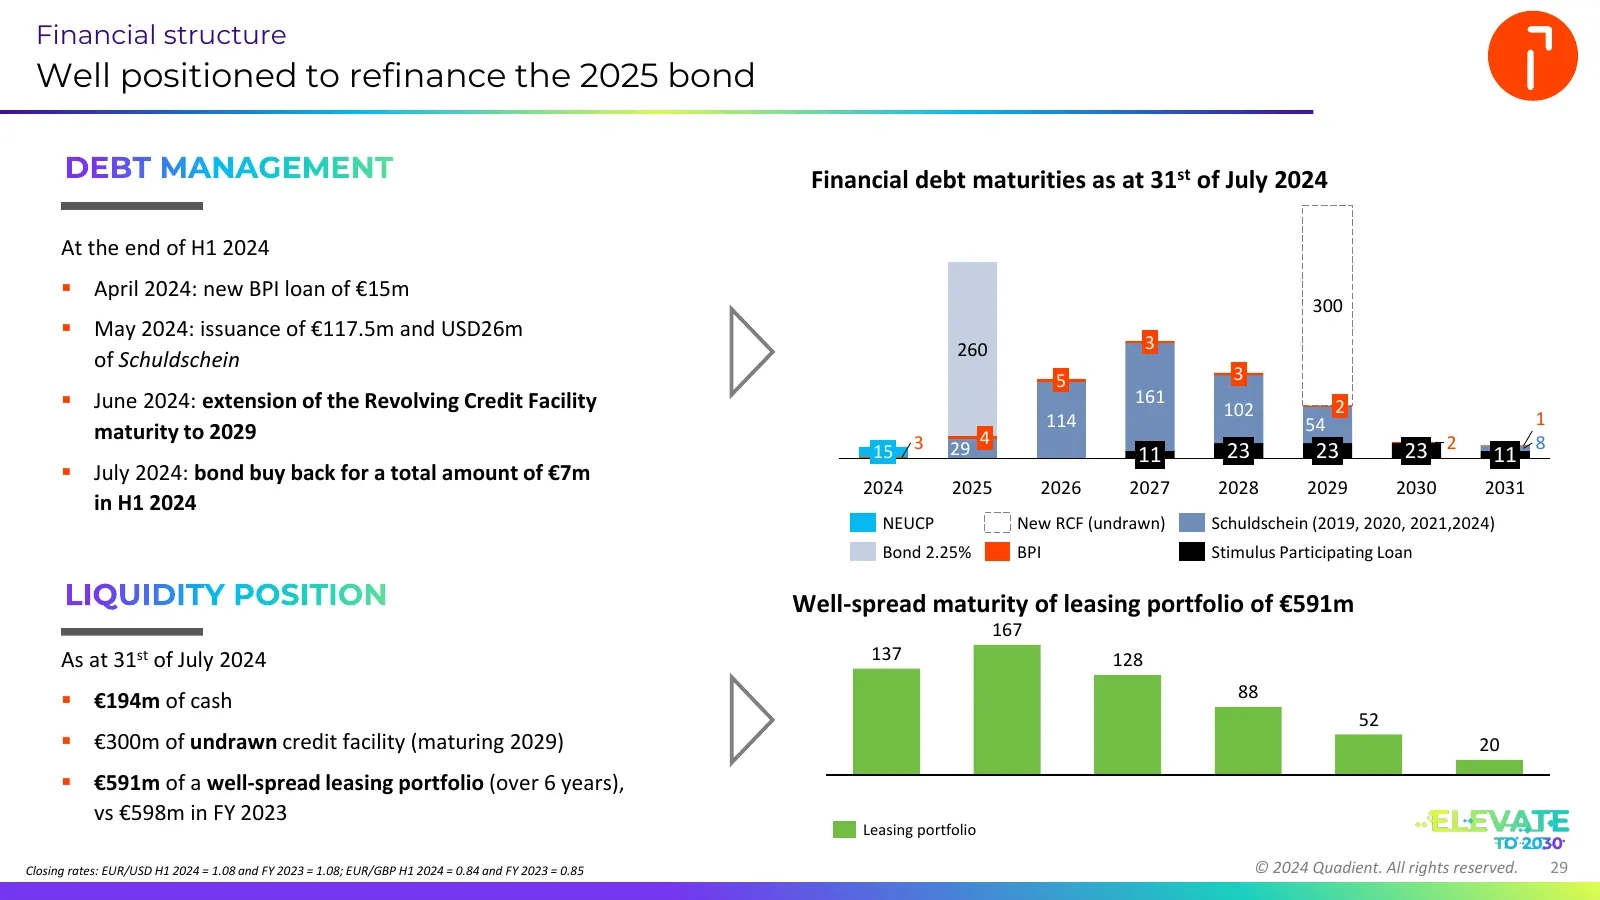
Financial structure Well positioned to refinance the 2025 bond DEBT MANAGEMENT Financial debt maturities as at 31st of July 2024 At the end of H1 2024 ▪ April 2024: new BPI loan of €15m 300 ▪ May 2024: issuance of €117.5m and USD26m 260 3 of Schuldschein 5 3 ▪ June 2024: extension of the Revolving

Slide 30: Outlook
Geoffrey Godet Chief Executive Officer 05 FY 2024 OUTLOOK © 2024 Quadient. All rights reserved. 30
Slide 31: FY 2024 guidance confirmed
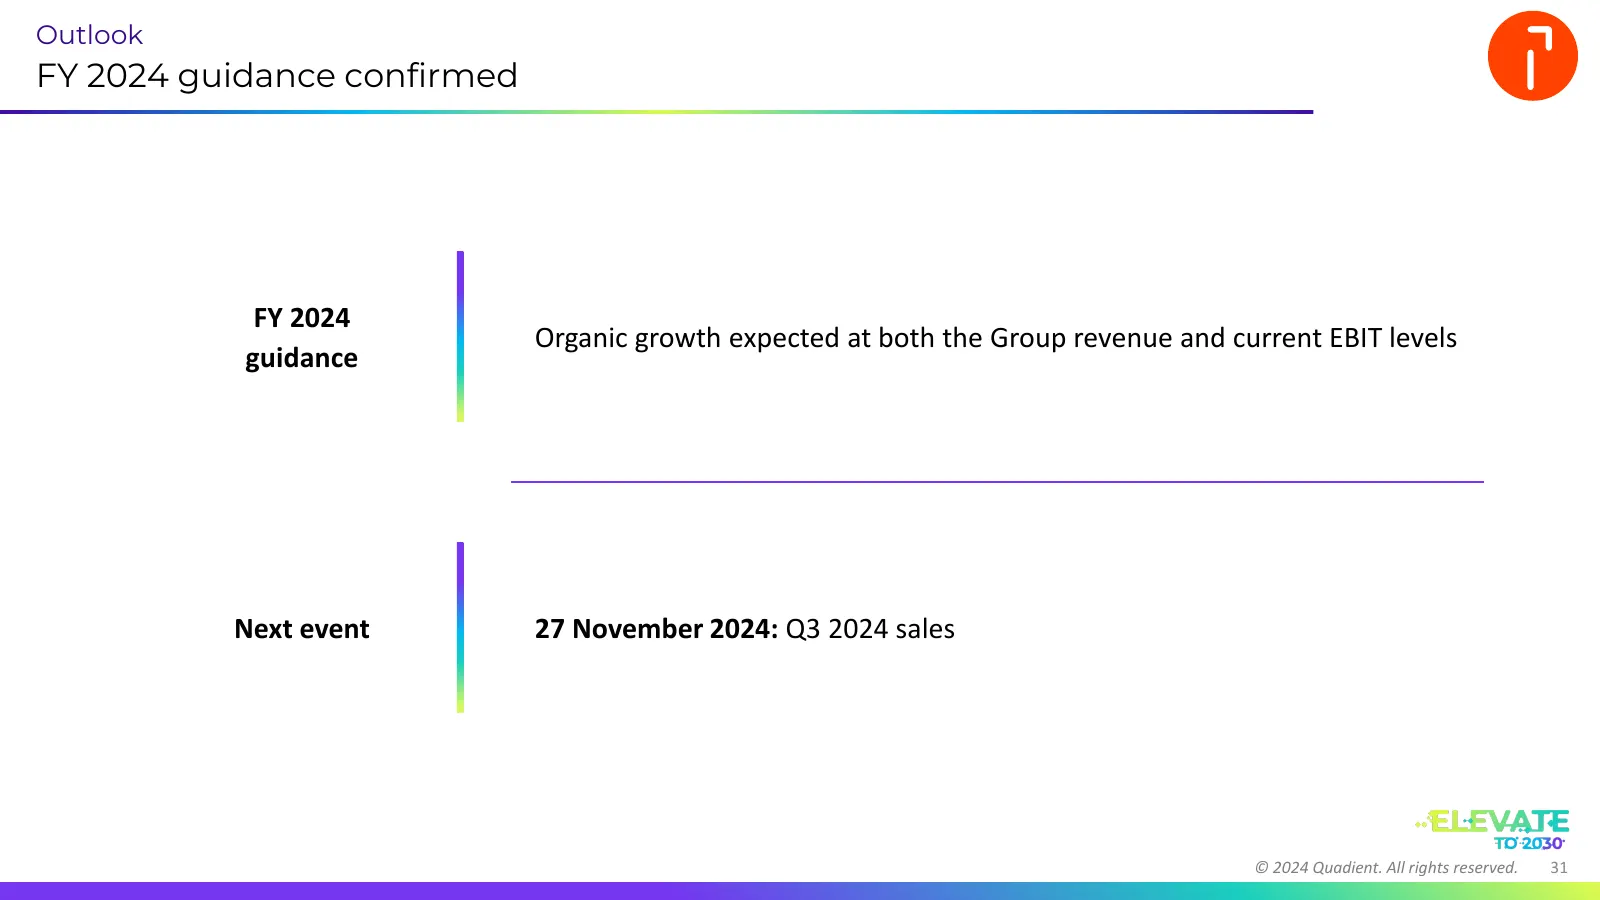
Outlook FY 2024 guidance confirmed FY 2024 Organic growth expected at both the Group revenue and current EBIT levels guidance Next event 27 November 2024: Q3 2024 sales © 2024 Quadient. All rights reserved. 31

Slide 32: Appendix
06 APPENDIX © 2024 Quadient. All rights reserved. 32
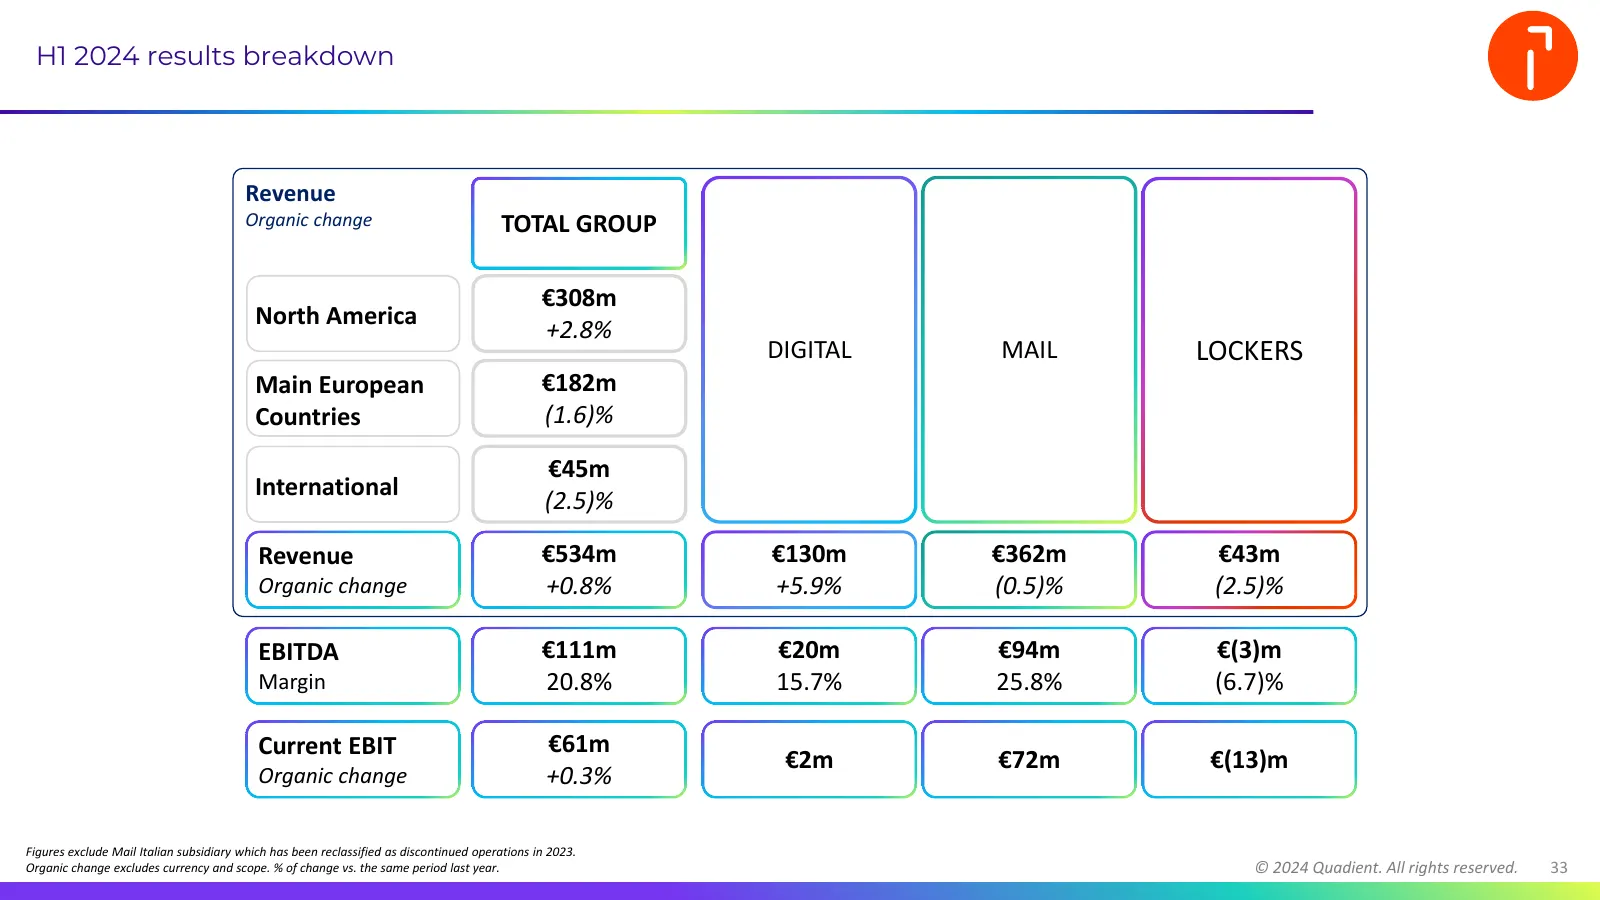
Slide 33: H1 2024 results breakdown
H1 2024 results breakdown Revenue Organic change TOTAL GROUP €308m North America +2.8% DIGITAL MAIL LOCKERS Main European €182m Countries (1.6)% €45m International (2.5)% Revenue €534m €130m €362m €43m Organic change +0.8% +5.9% (0.5)% (2.5)% EBITDA €111m €20m €94m €(3)m Margin 20.8% 15.7% 25.8% (6.
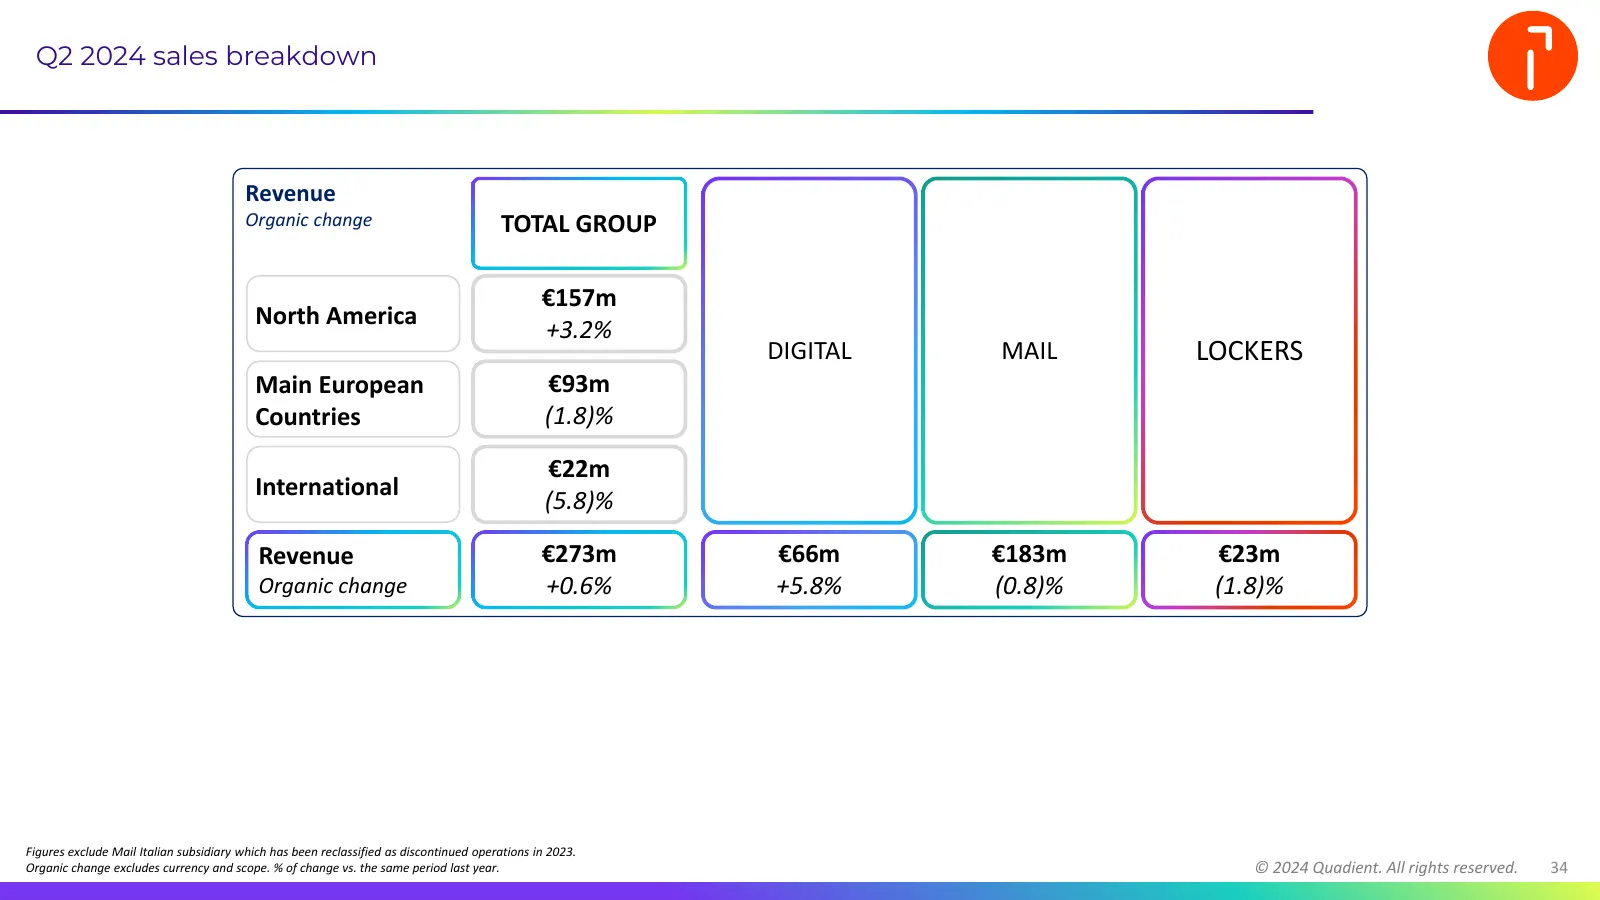
Slide 34: Q2 2024 sales breakdown
Q2 2024 sales breakdown Revenue Organic change TOTAL GROUP €157m North America +3.2% DIGITAL MAIL LOCKERS Main European €93m Countries (1.8)% €22m International (5.8)% Revenue €273m €66m €183m €23m Organic change +0.6% +5.8% (0.8)% (1.8)% Figures exclude Mail Italian subsidiary which has been reclas
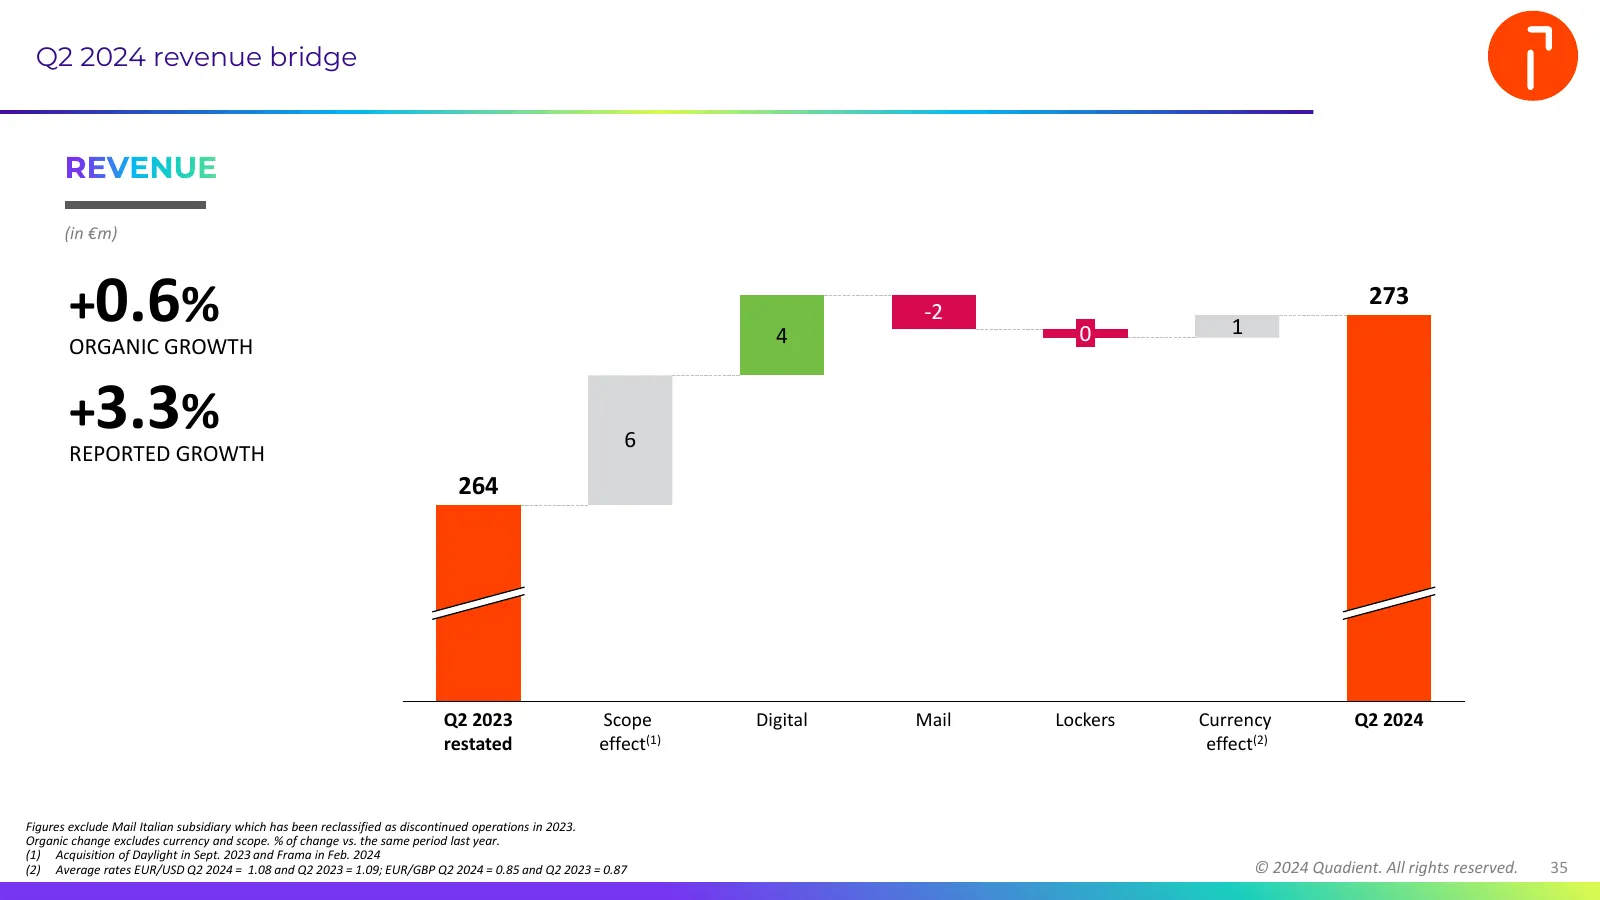
Slide 35: Q2 2024 revenue bridge
Q2 2024 revenue bridge REVENUE (in €m) +0.6% 4 -2 0 1 273 ORGANIC GROWTH +3.3% 6 REPORTED GROWTH 264 Q2 2023 Scope Digital Mail Lockers Currency Q2 2024 restated effect(1) effect(2) Figures exclude Mail Italian subsidiary which has been reclassified as discontinued operations in 2023. Organic change
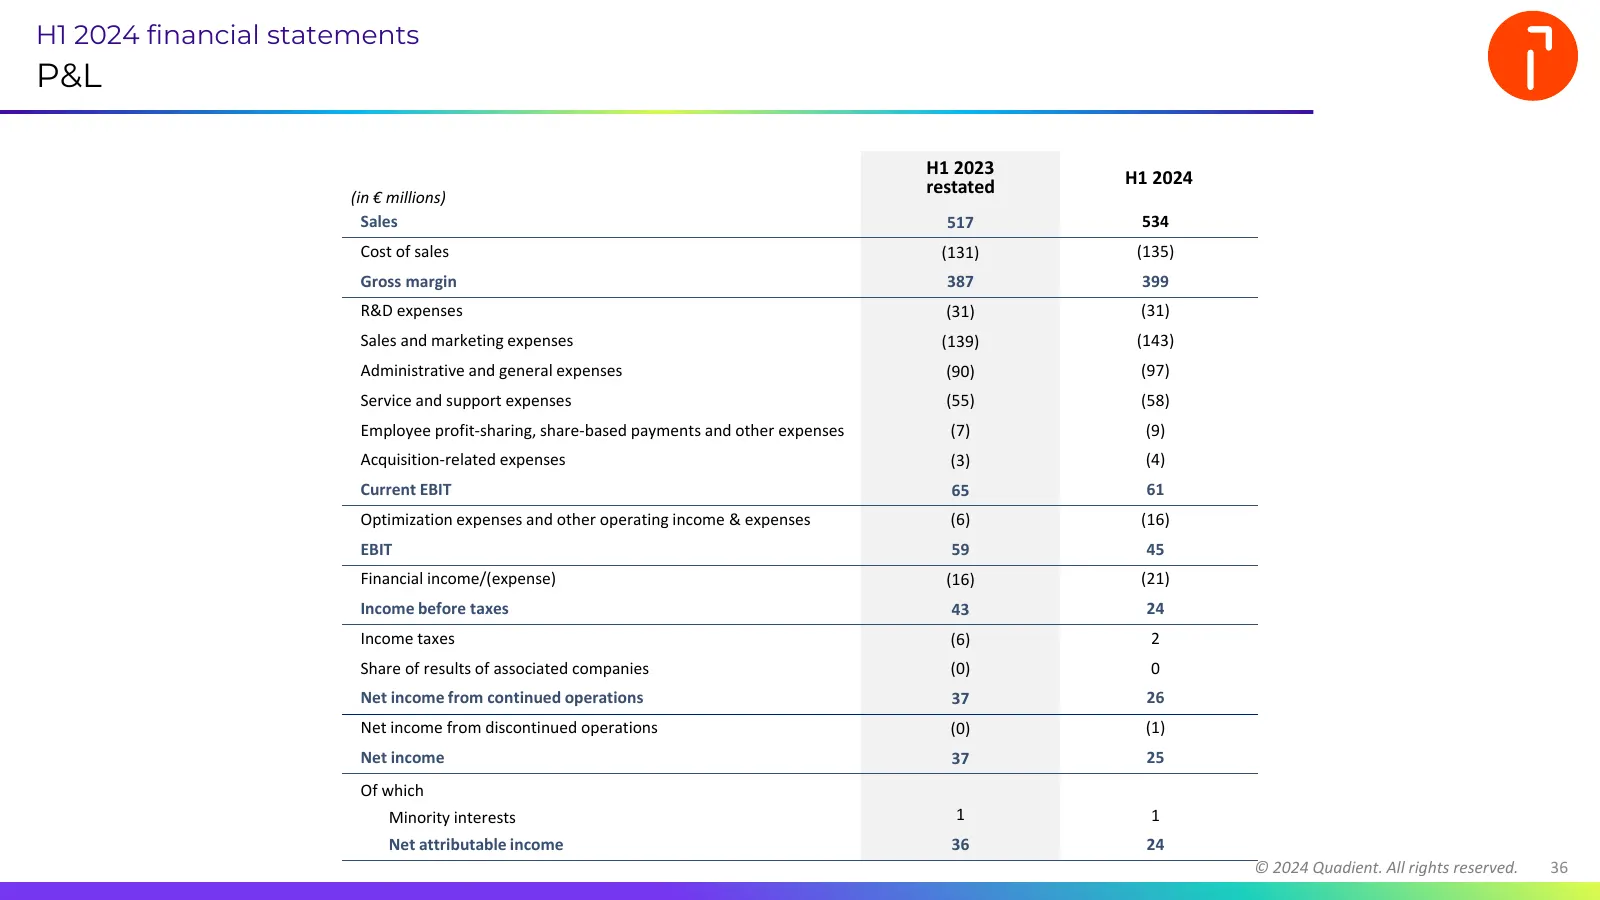
Slide 36: H1 2024 financial statements P&L
H1 2024 financial statements P&L H1 2023 H1 2024 (in € millions) restated Sales 517 534 Cost of sales (131) (135) Gross margin 387 399 R&D expenses (31) (31) Sales and marketing expenses (139) (143) Administrative and general expenses (90) (97) Service and support expenses (55) (58) Employee profit-
Slide 37: Consolidated balance sheet (1/2)
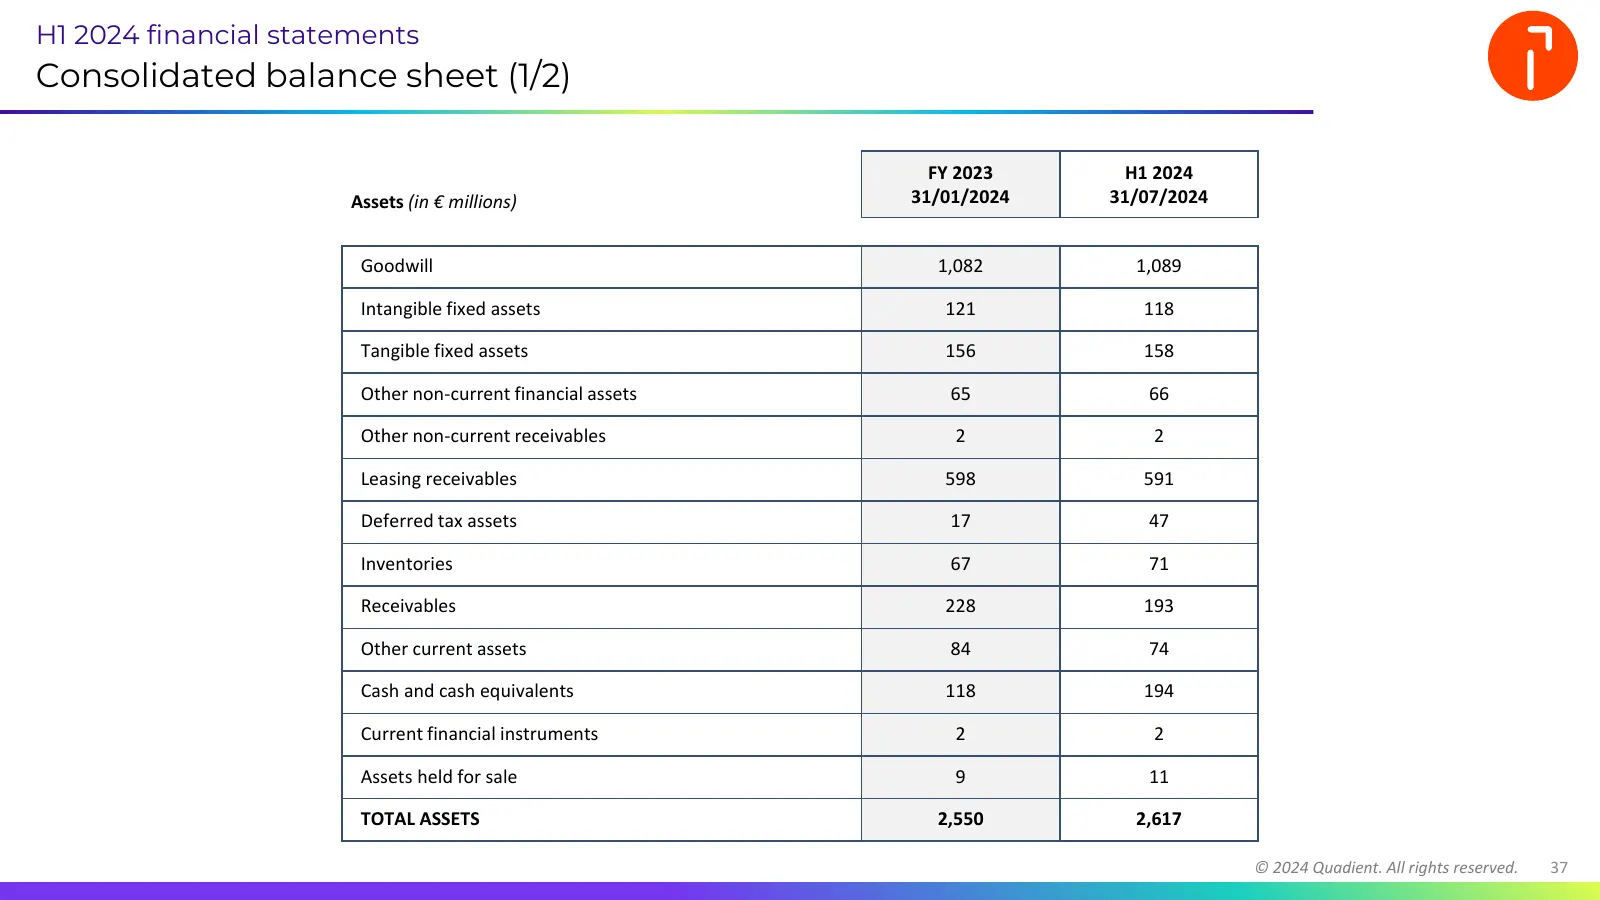
H1 2024 financial statements Consolidated balance sheet (1/2) FY 2023 H1 2024 Assets (in € millions) 31/01/2024 31/07/2024 Goodwill 1,082 1,089 Intangible fixed assets 121 118 Tangible fixed assets 156 158 Other non-current financial assets 65 66 Other non-current receivables 2 2 Leasing receivables
Slide 38: Consolidated balance sheet (2/2)
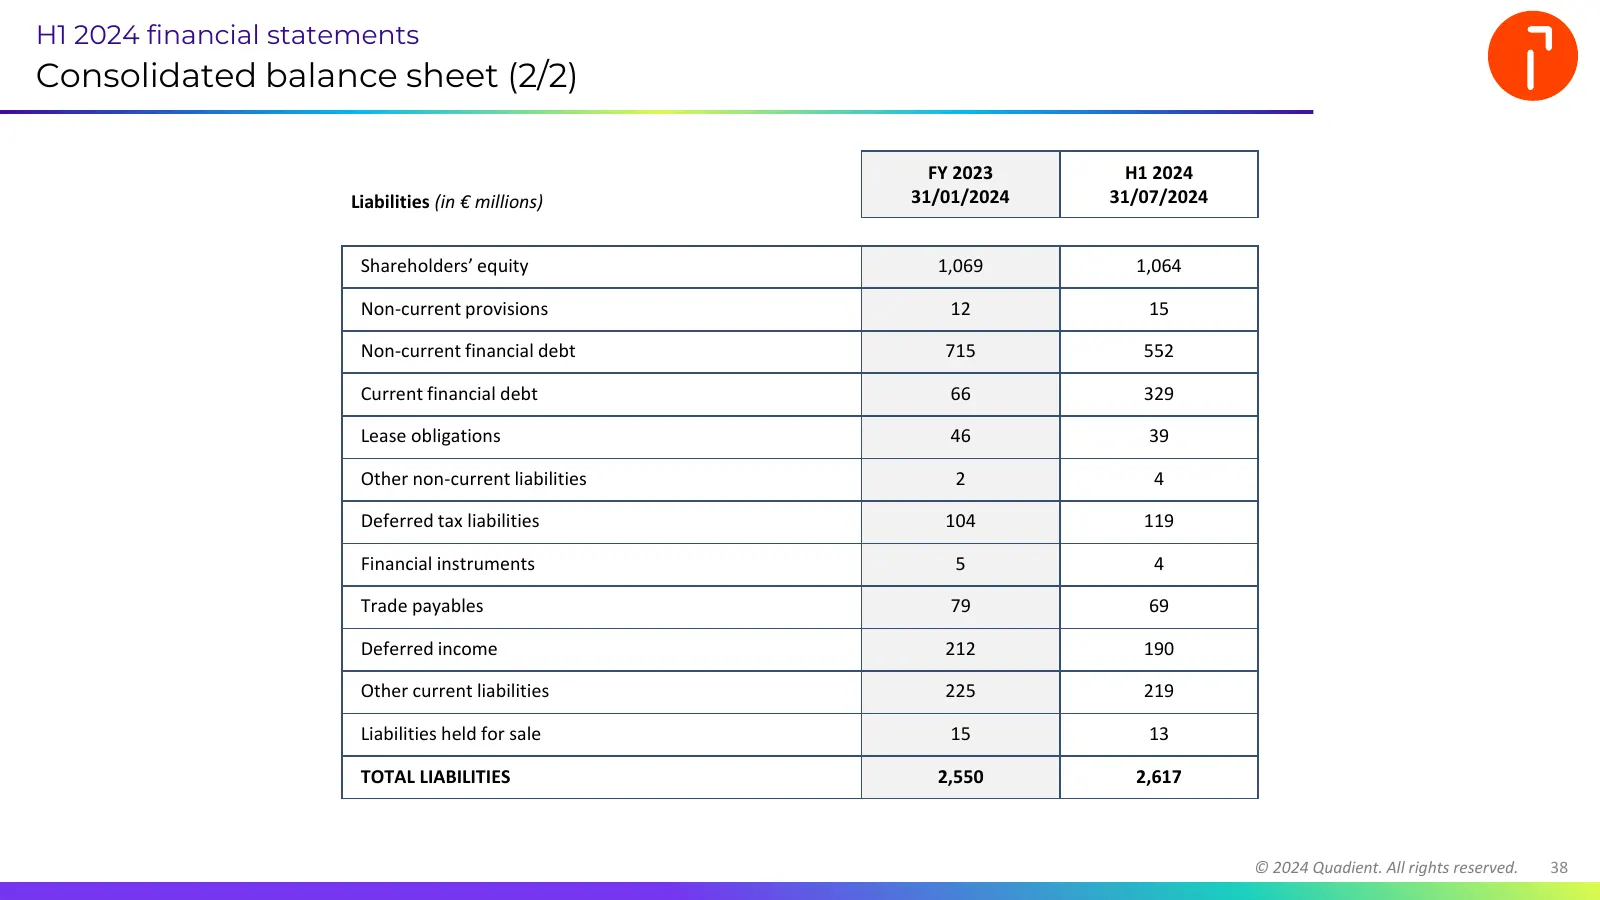
H1 2024 financial statements Consolidated balance sheet (2/2) FY 2023 H1 2024 Liabilities (in € millions) 31/01/2024 31/07/2024 Shareholders’ equity 1,069 1,064 Non-current provisions 12 15 Non-current financial debt 715 552 Current financial debt 66 329 Lease obligations 46 39 Other non-current lia
Slide 39: All financial covenants met
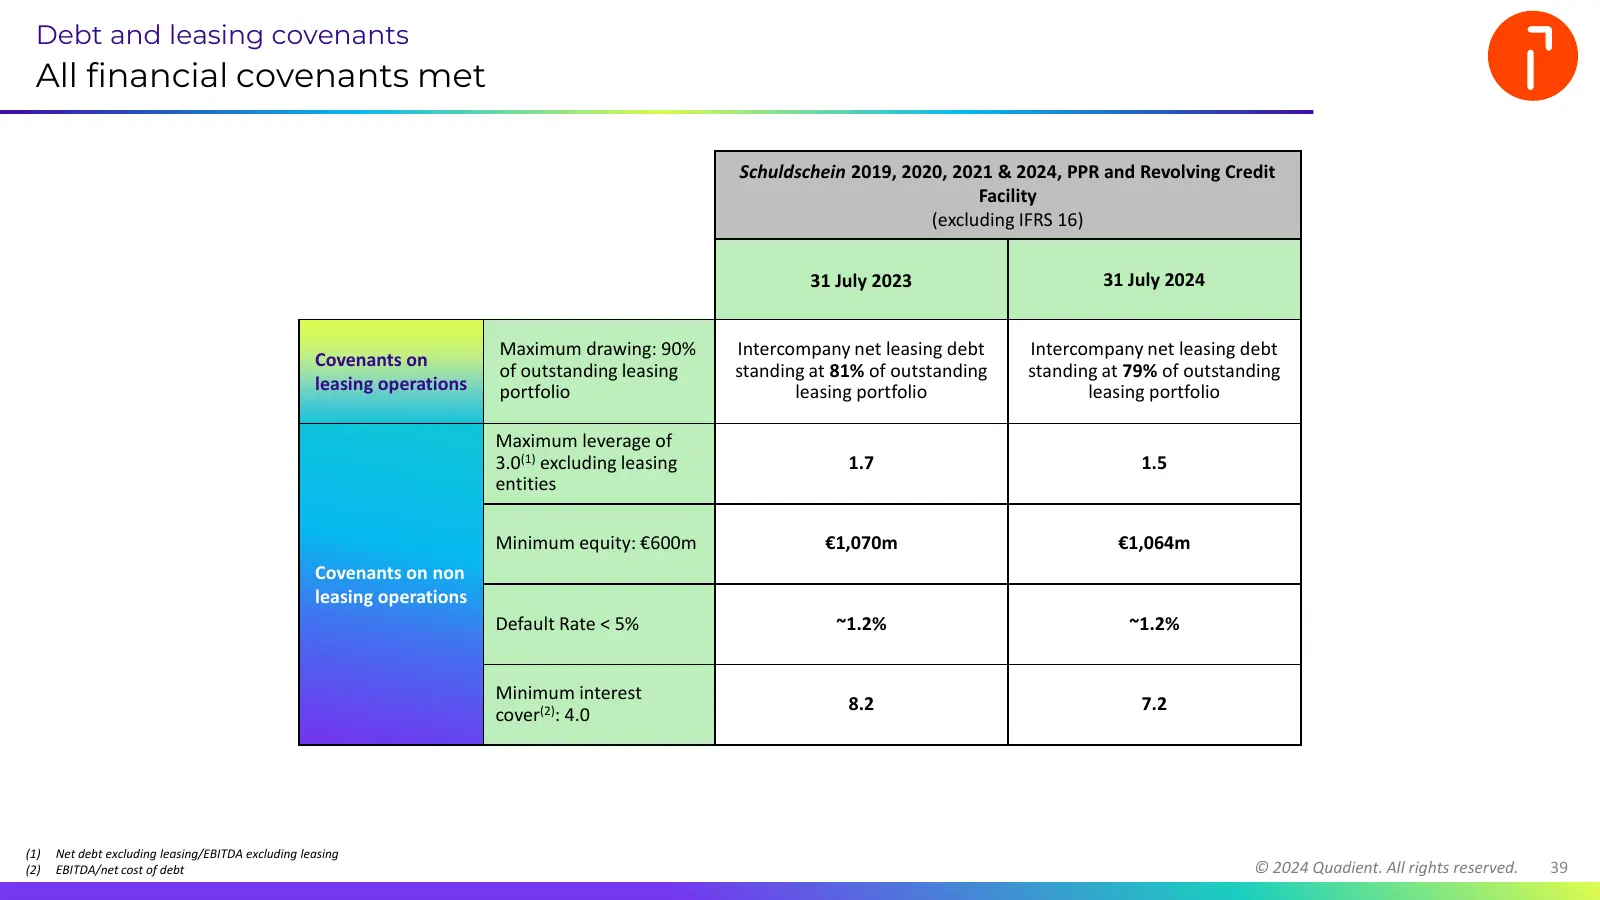
Debt and leasing covenants All financial covenants met Schuldschein 2019, 2020, 2021 & 2024, PPR and Revolving Credit Facility (excluding IFRS 16) 31 July 2023 31 July 2024 Maximum drawing: 90% Intercompany net leasing debt Intercompany net leasing debt Covenants on of outstanding leasing standing a
Slide 40: Evolution of the leasing portfolio
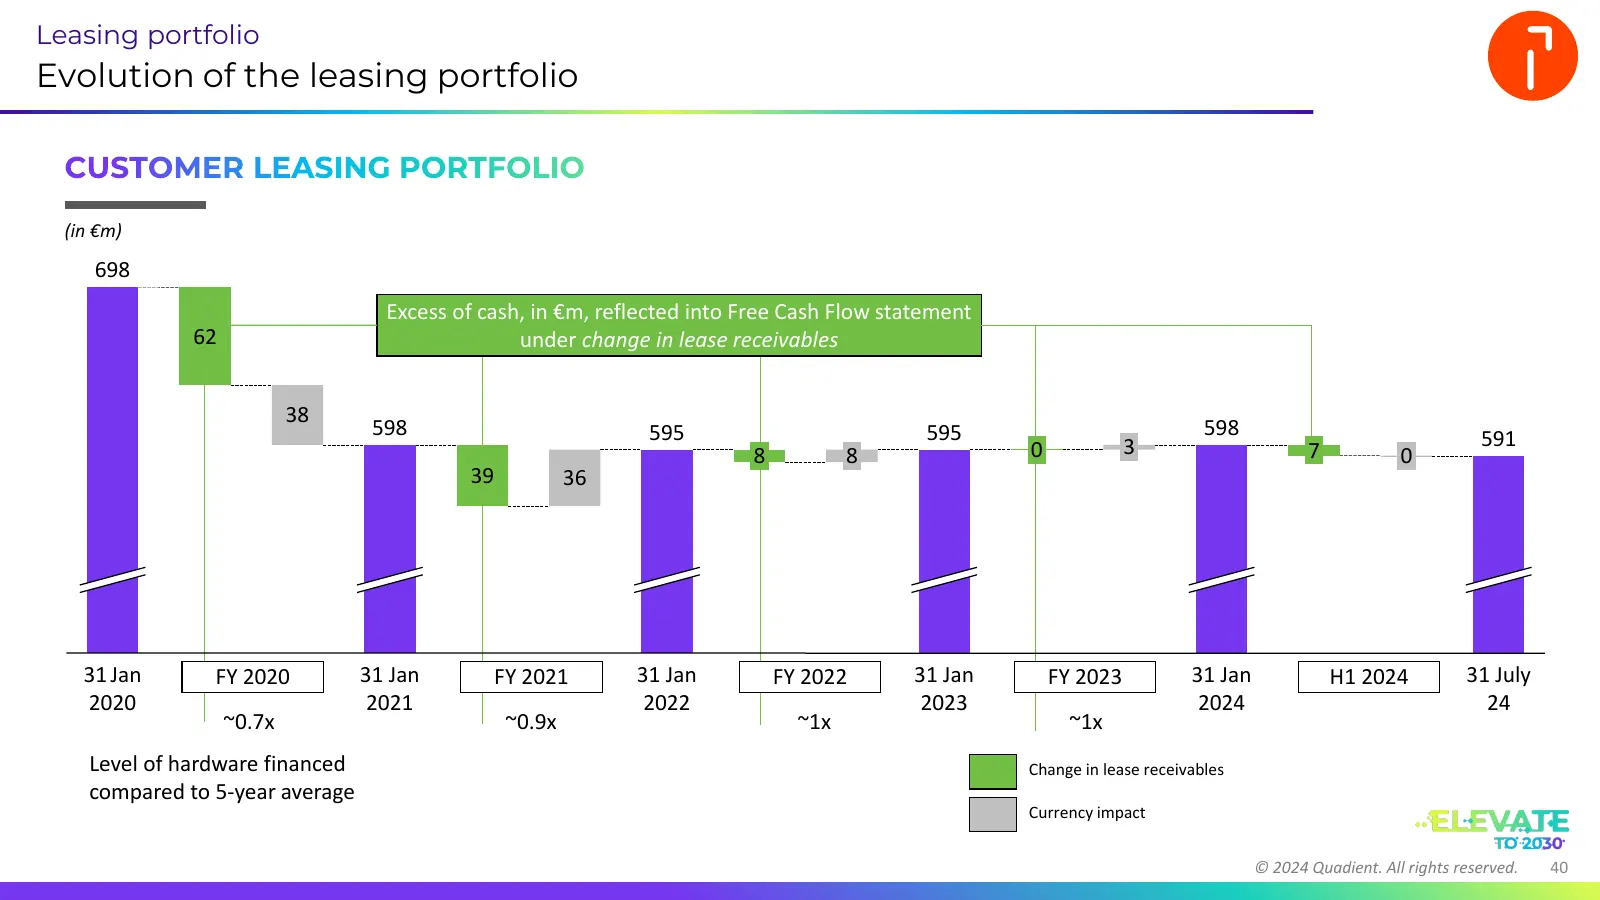
Leasing portfolio Evolution of the leasing portfolio CUSTOMER LEASING PORTFOLIO (in €m) 698 Excess of cash, in €m, reflected into Free Cash Flow statement 62 under change in lease receivables 38 598 595 595 598 591 8 8 0 3 7 0 39 36 31 Jan FY 2020 31 Jan FY 2021 31 Jan FY 2022 31 Jan FY 2023 31 Jan
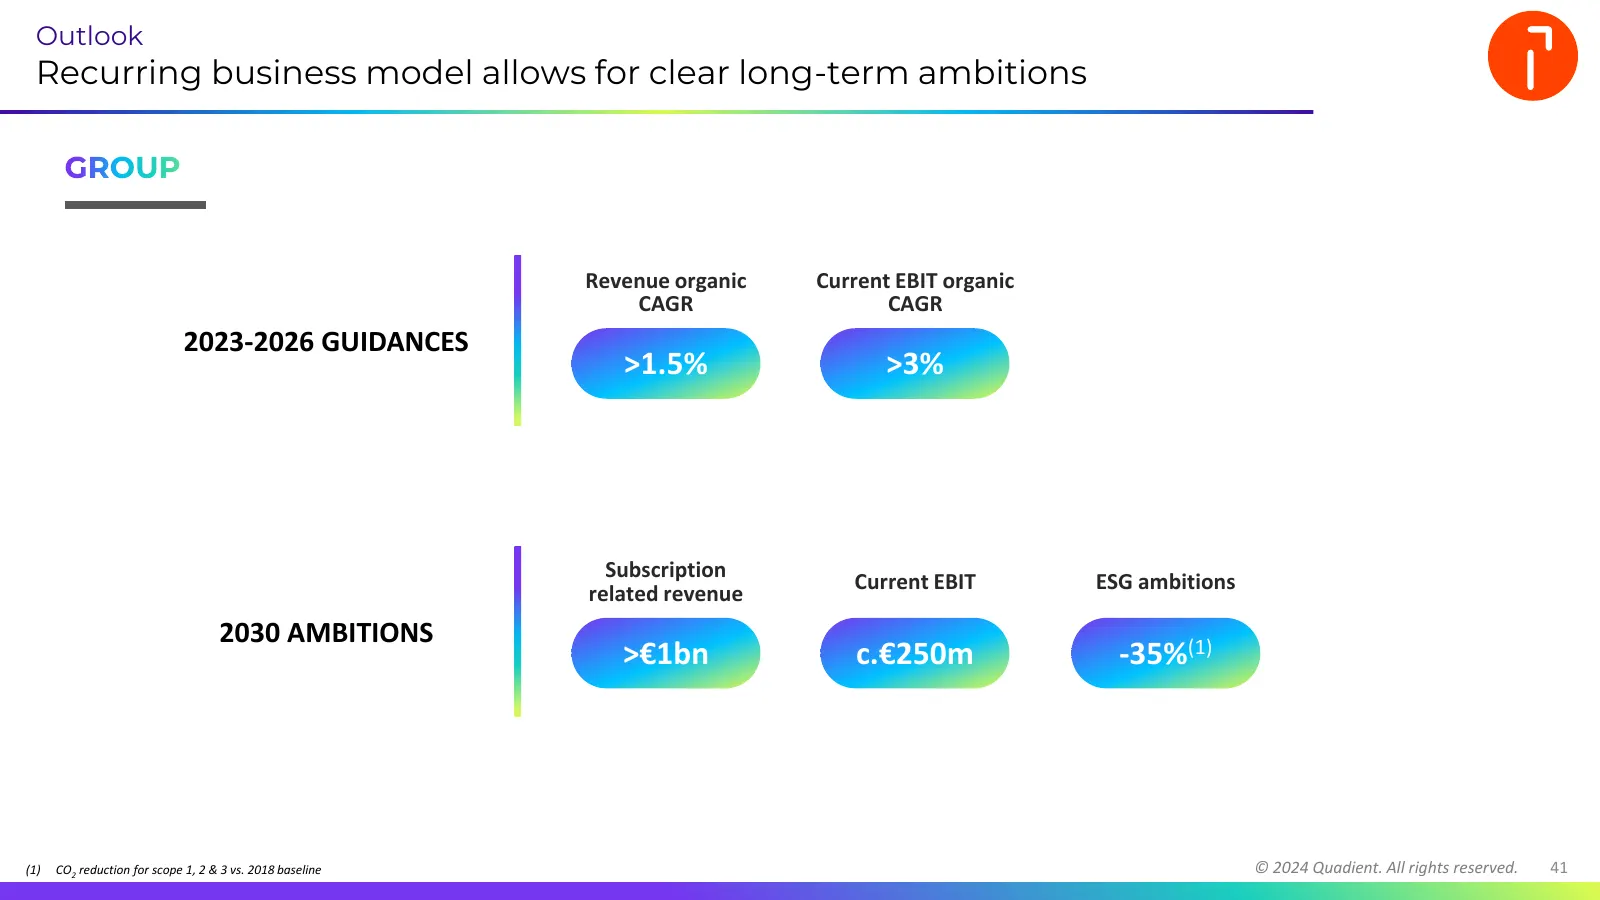
Slide 41: Recurring business model allows for clear long-term ambitions
Outlook Recurring business model allows for clear long-term ambitions GROUP Revenue organic Current EBIT organic CAGR CAGR 2023-2026 GUIDANCES >1.5% >3% Subscription Current EBIT ESG ambitions related revenue 2030 AMBITIONS >€1bn c.€250m -35%(1) (1) CO2 reduction for scope 1, 2 & 3 vs. 2018 baseline
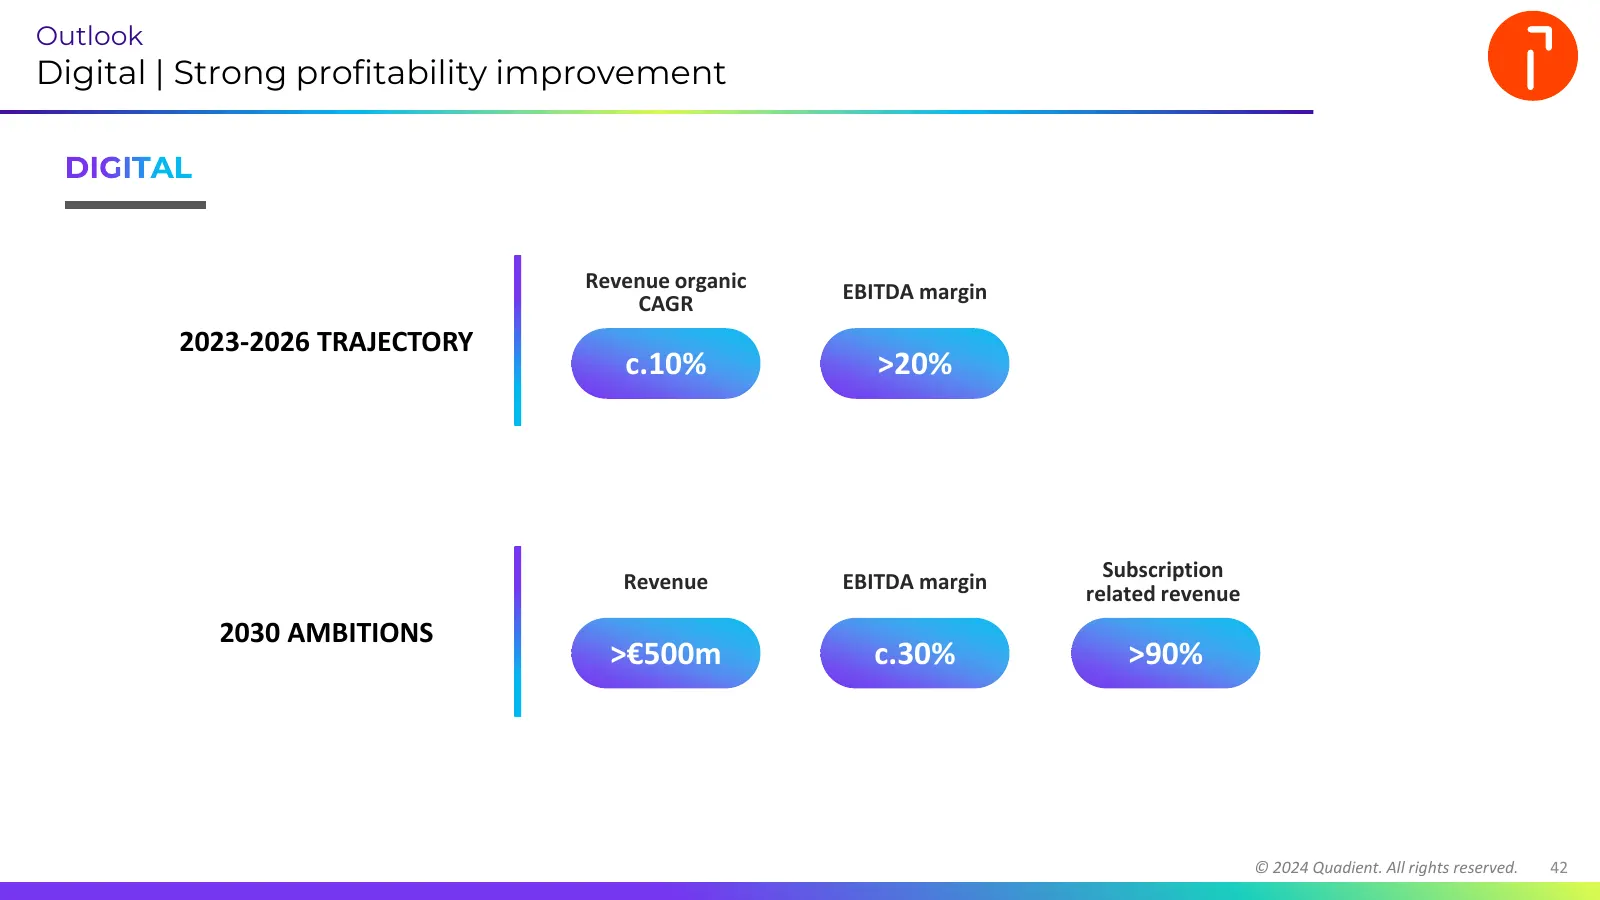
Slide 42: Digital: Strong profitability improvement
Outlook Digital | Strong profitability improvement DIGITAL Revenue organic EBITDA margin CAGR 2023-2026 TRAJECTORY c.10% >20% Subscription Revenue EBITDA margin related revenue 2030 AMBITIONS >€500m c.30% >90% © 2024 Quadient. All rights reserved. 42
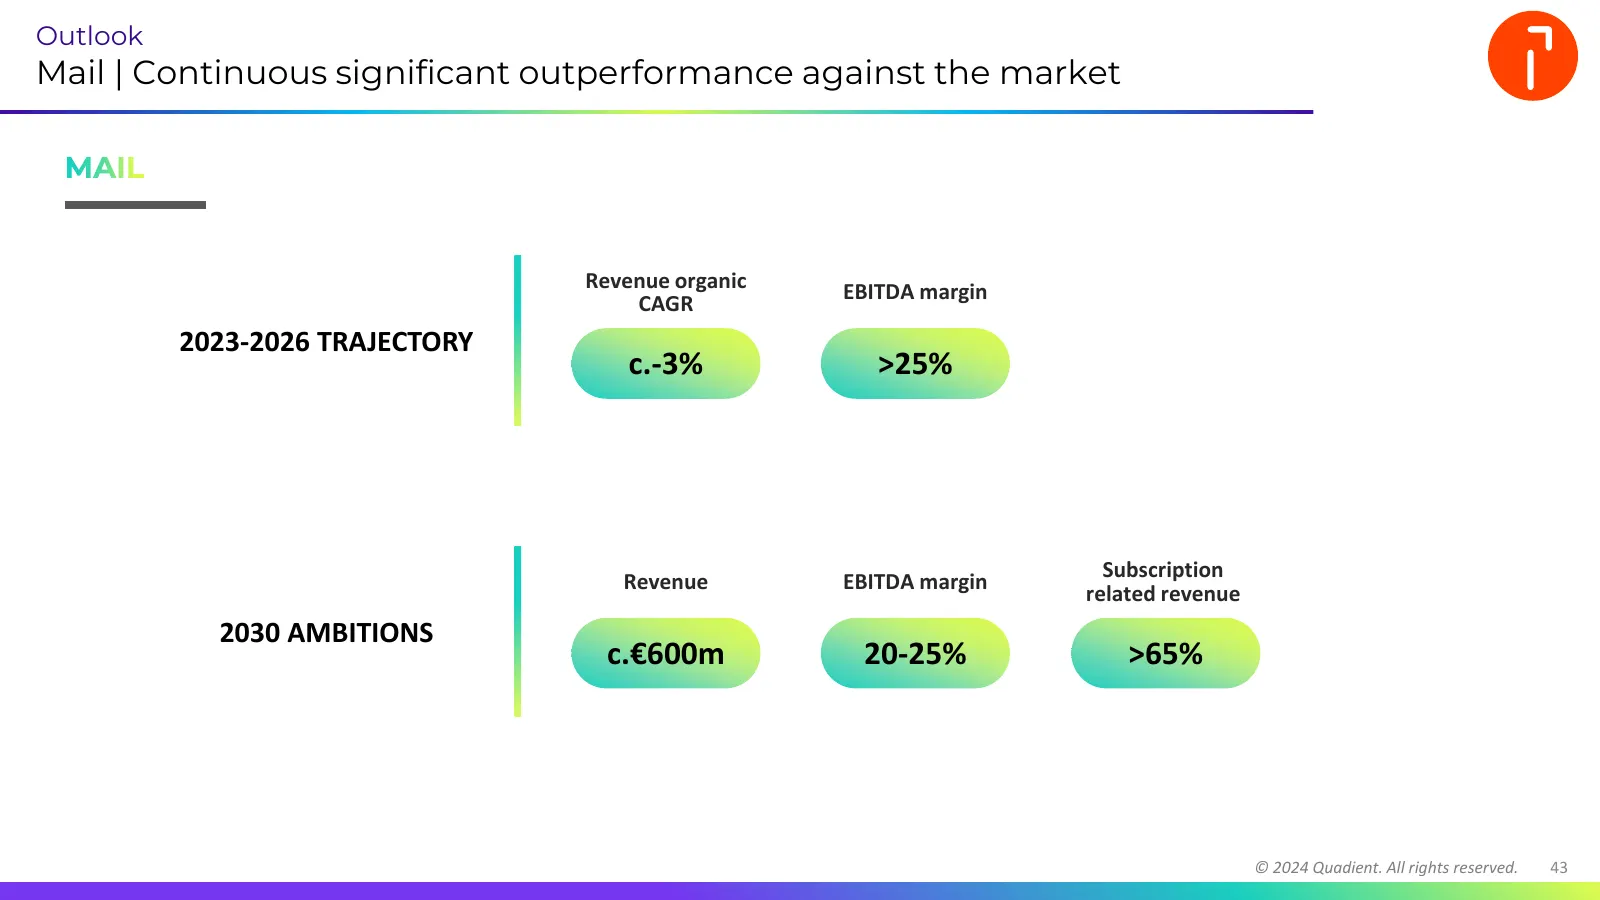
Slide 43: Mail: Continuous significant outperformance against the market
Outlook Mail | Continuous significant outperformance against the market MAIL Revenue organic EBITDA margin CAGR 2023-2026 TRAJECTORY c.-3% >25% Subscription Revenue EBITDA margin related revenue 2030 AMBITIONS c.€600m 20-25% >65% © 2024 Quadient. All rights reserved. 43
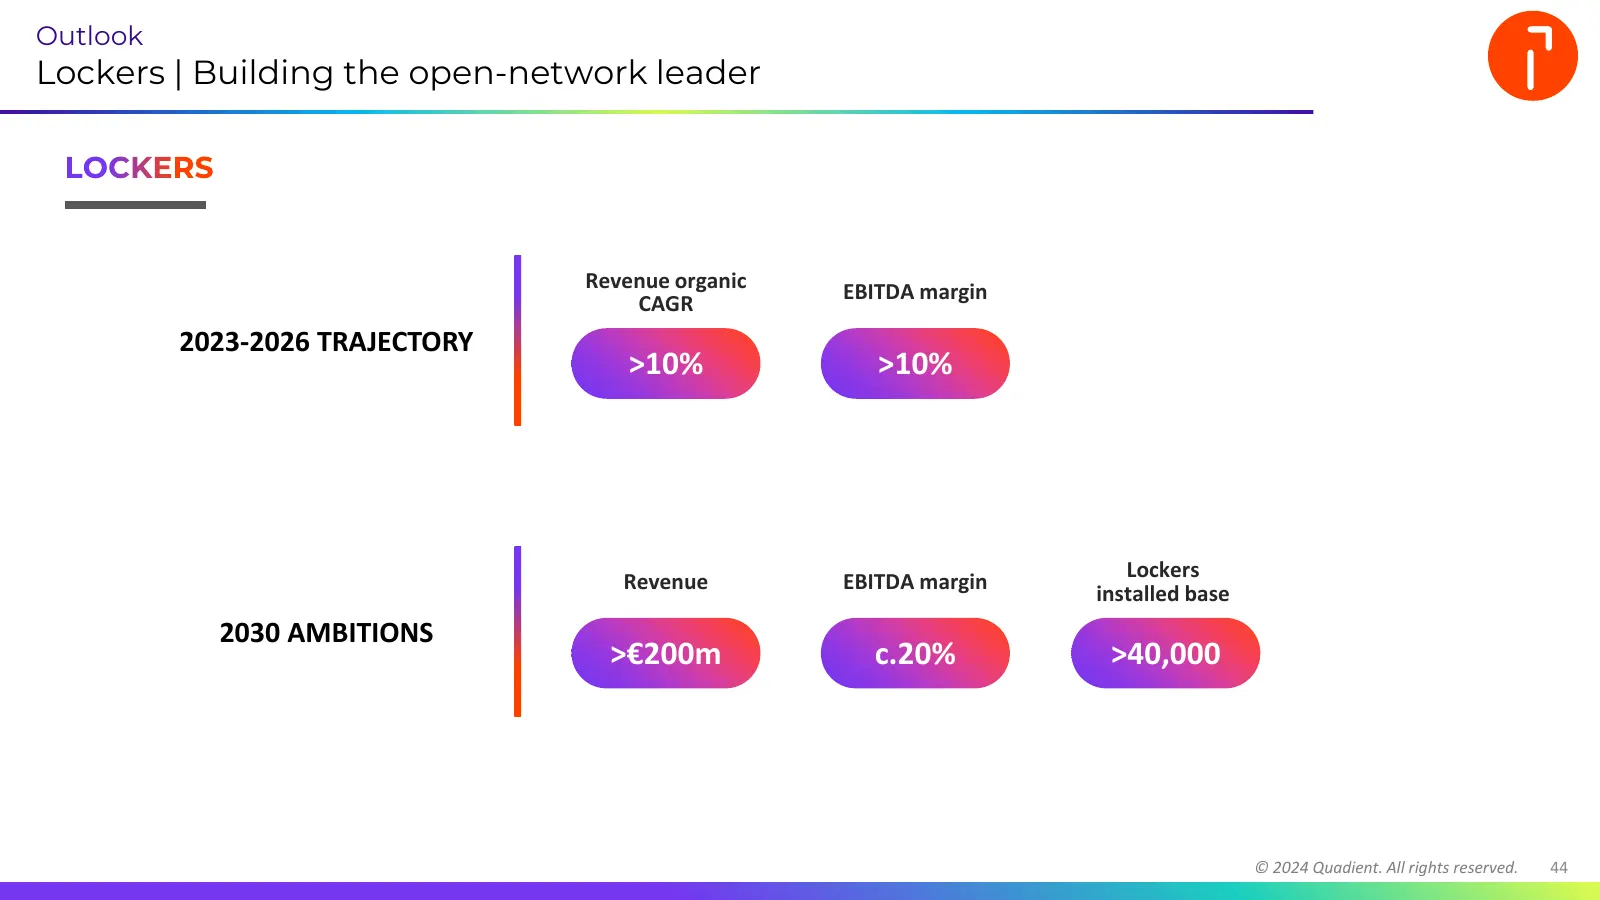
Slide 44: Lockers: Building the open-network leader
Outlook Lockers | Building the open-network leader LOCKERS Revenue organic EBITDA margin CAGR 2023-2026 TRAJECTORY >10% >10% Lockers Revenue EBITDA margin installed base 2030 AMBITIONS >€200m c.20% >40,000 © 2024 Quadient. All rights reserved. 44
Slide 45: Thank you
Thank you © 2024 Quadient. All rights reserved. 45
Source: Internet Archive copy of resources.quadient.com
More decks from Quadient SA
 H1 2026 Earnings Presentation43 slides · Sep 23, 2026
 Shareholder Meeting (June 2026)41 slides · Jun 18, 2026
 FY2025 Earnings Presentation52 slides · Mar 25, 2026
 Q3 2025 Earnings Presentation31 slides · Dec 2, 2025
 H1 2025 Earnings Presentation40 slides · Sep 24, 2025
 Shareholder Meeting (June 2025)35 slides · Jun 13, 2025