Grenergy Renovables S.A · BME:GRE
Grenergy Renovables — Investor Presentation (September 2023)
34 slides from Grenergy Renovables's investor presentation, September 2023
Slide 1: Investor Presentation September 2023
The sky is the limit INVESTOR PRESENTATION September 2023 Escuderos Solar PV - Spain
Slide 2: Disclaimer
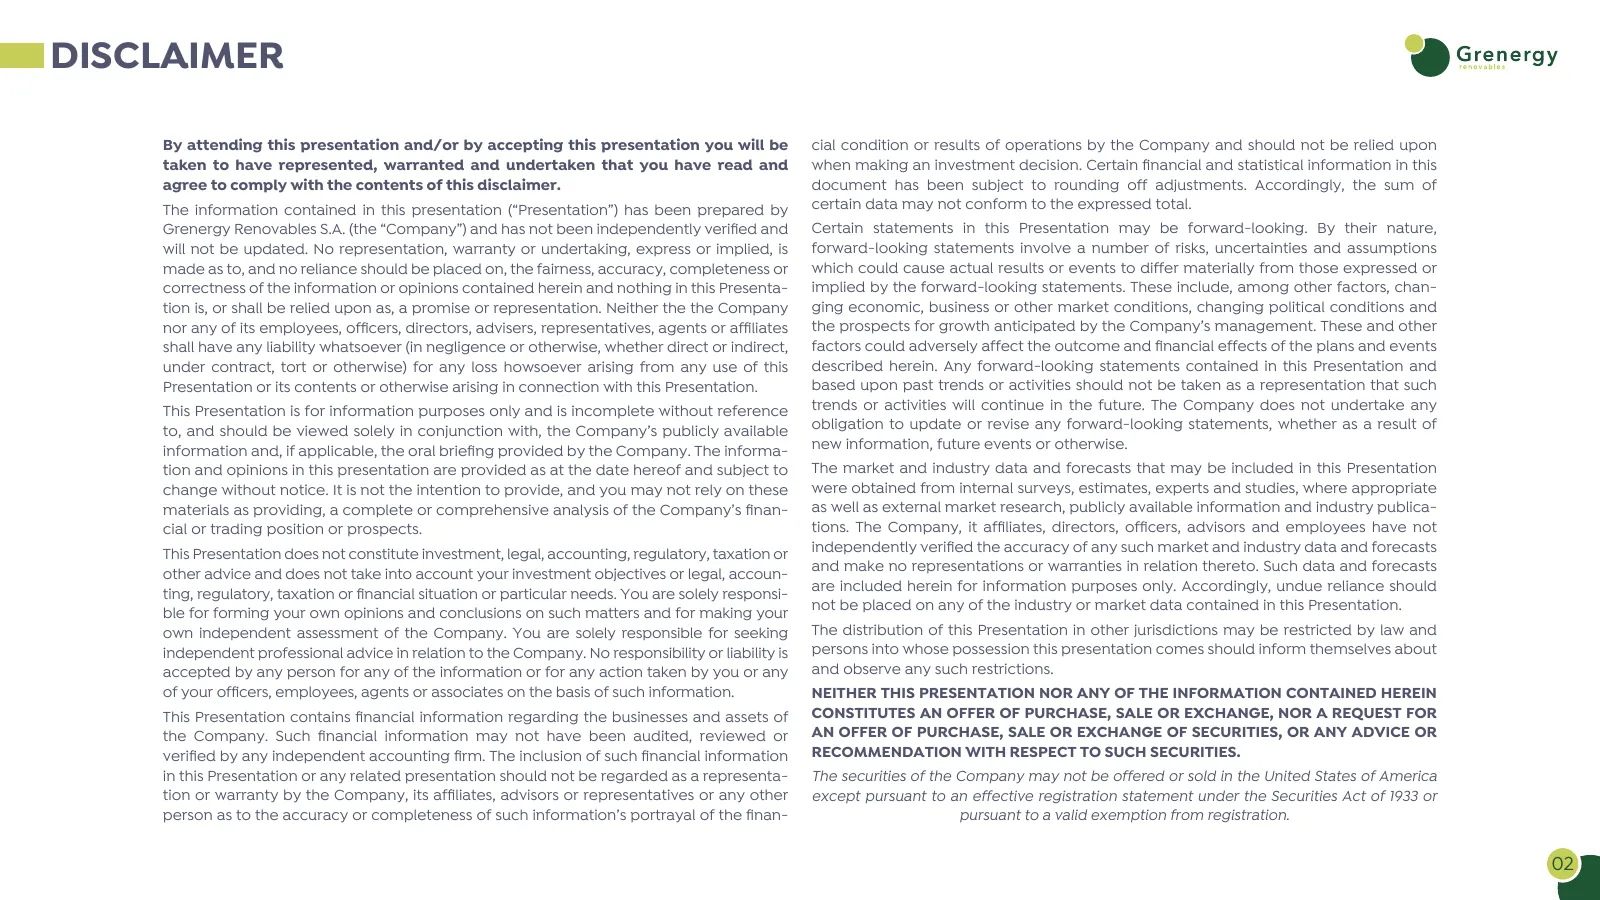
DISCLAIMER By attending this presentation and/or by accepting this presentation you will be cial condition or results of operations by the Company and should not be relied upon taken to have represented, warranted and undertaken that you have read and when making an investment decision. Certain finan
Slide 3: Equity Story & Key Figures; Platform & Pipeline; Operational Information; Governance & ESG
1 EQUITY STORY & KEY FIGURES 2 PLATFORM & PIPELINE 3 OPERATIONAL INFORMATION 4 STRONG GOVERNANCE STRUCTURE WITH FOCUS ON ESG 03
Slide 4: A growth story with a proven track record
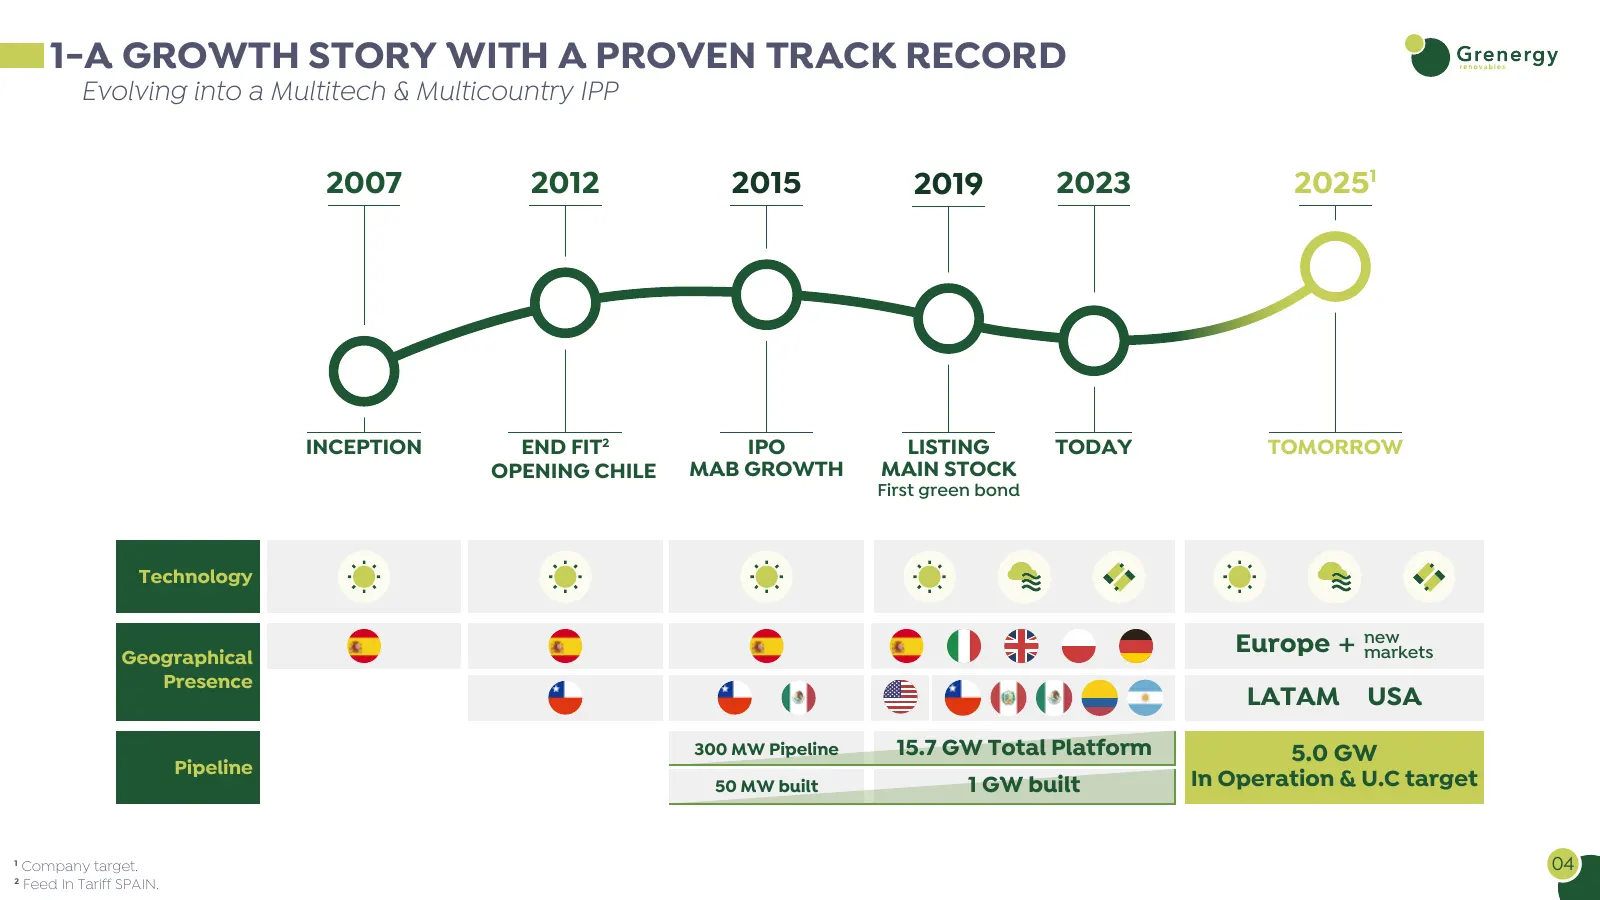
1-A GROWTH STORY WITH A PROVEN TRACK RECORD Evolving into a Multitech & Multicountry IPP 2007 2012 2015 2019 2023 20251 INCEPTION END FIT2 IPO LISTING TODAY TOMORROW OPENING CHILE MAB GROWTH MAIN STOCK First green bond Technology Geographical Europe + new markets Presence LATAM USA 300 MW Pipeline 1
Slide 5: Grenergy in a nutshell
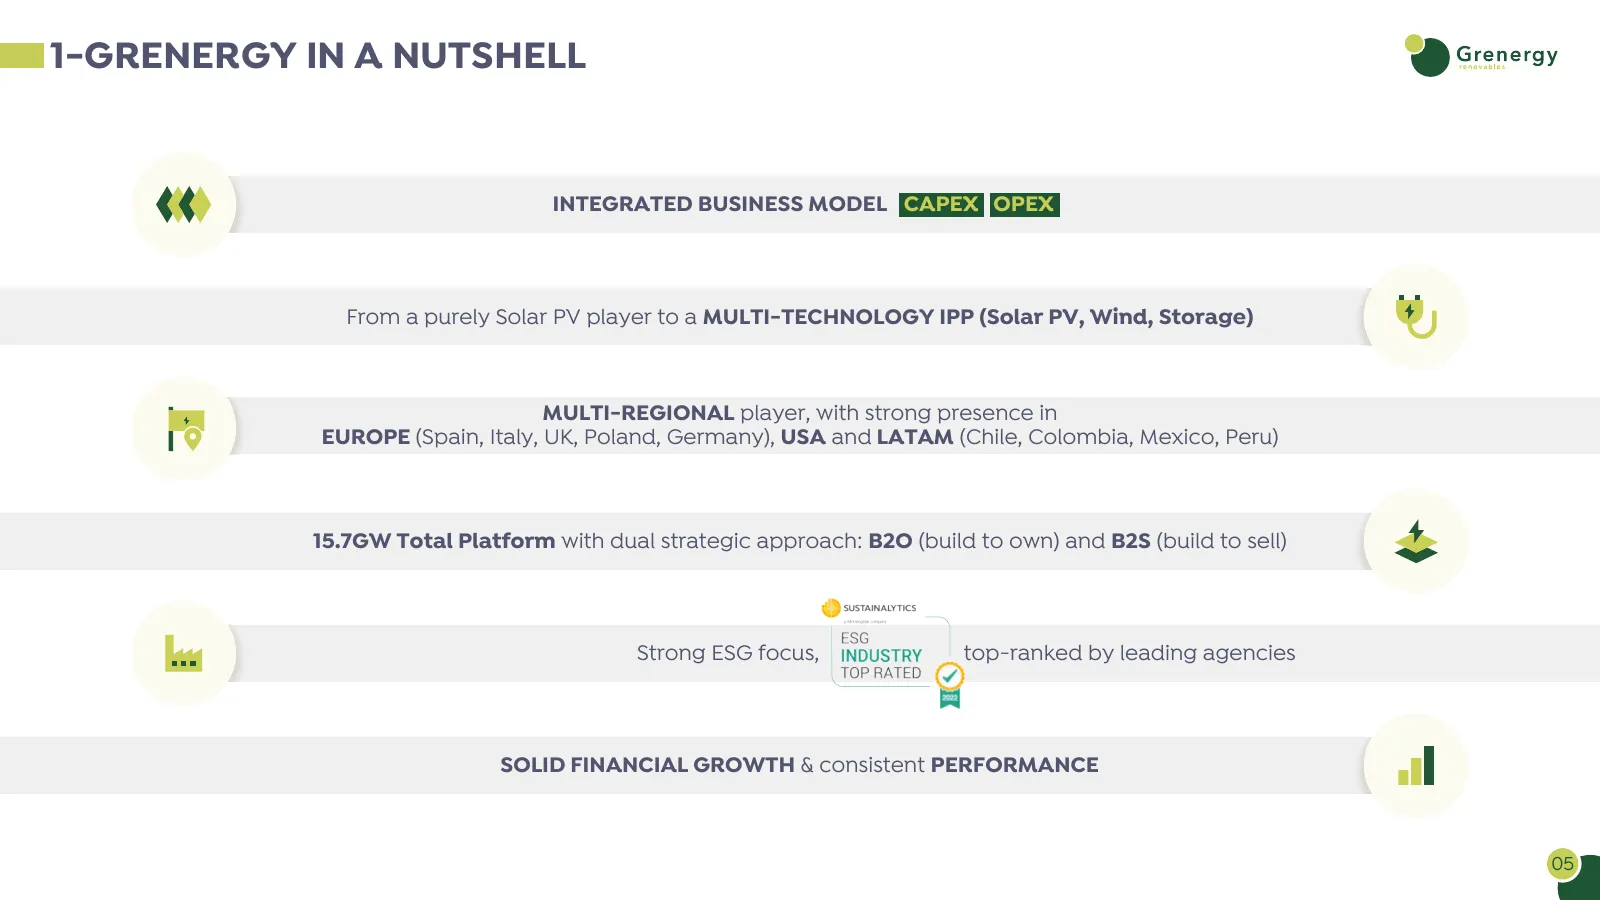
1-GRENERGY IN A NUTSHELL INTEGRATED BUSINESS MODEL CAPEX OPEX From a purely Solar PV player to a MULTI-TECHNOLOGY IPP (Solar PV, Wind, Storage) MULTI-REGIONAL player, with strong presence in EUROPE (Spain, Italy, UK, Poland, Germany), USA and LATAM (Chile, Colombia, Mexico, Peru) 15.7GW Total Platfo
Slide 6: Integrated business model
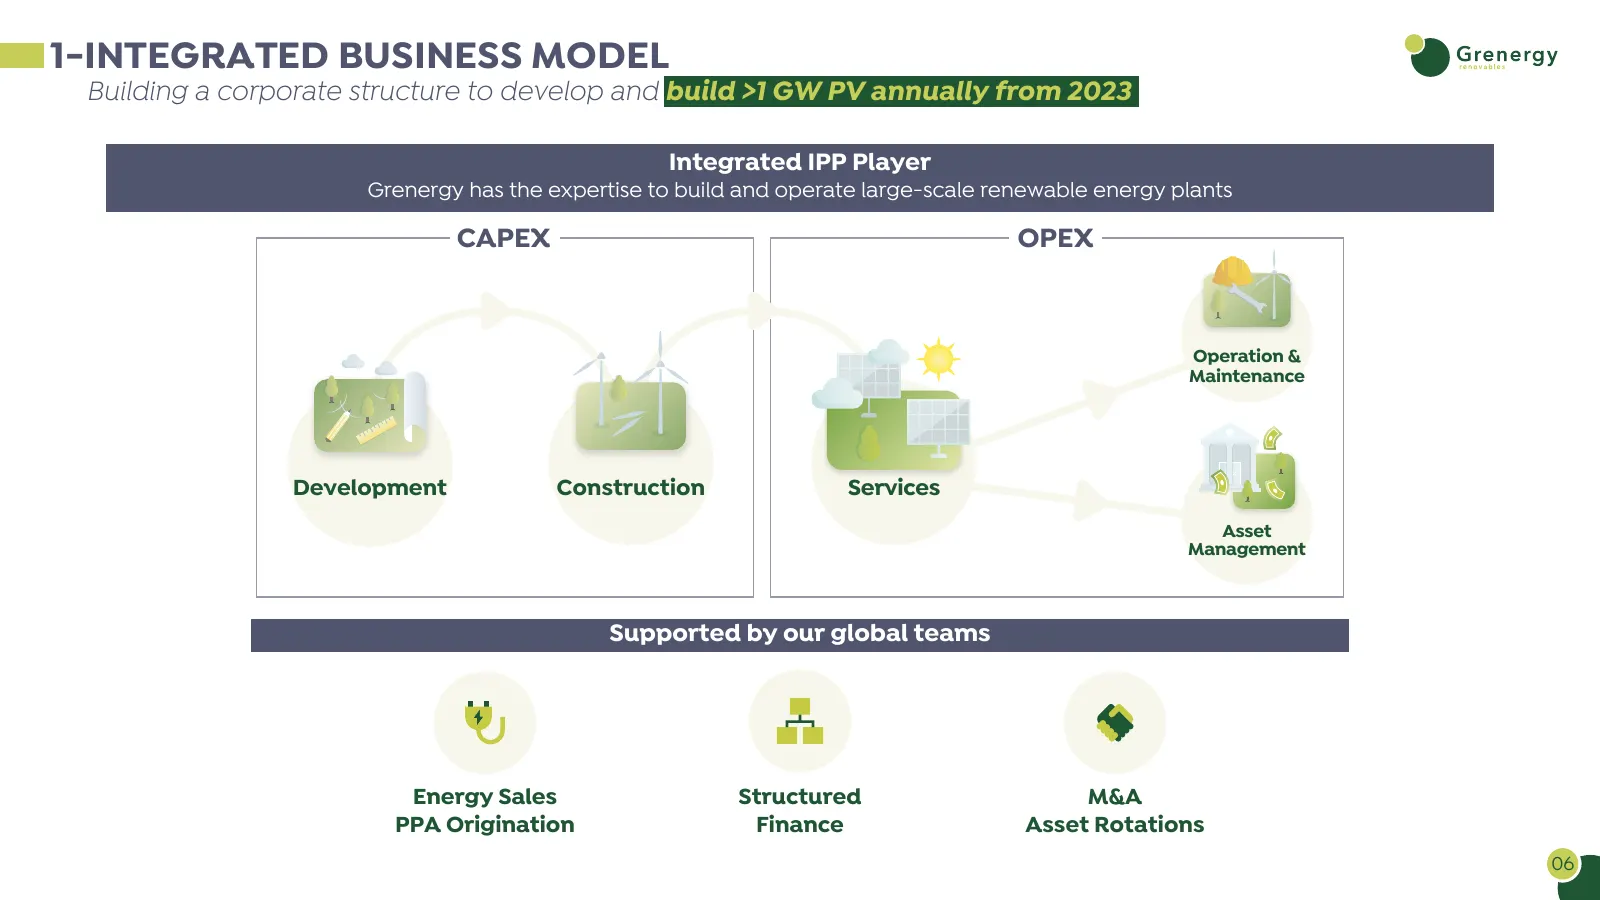
1-INTEGRATED BUSINESS MODEL Building a corporate structure to develop and build >1 GW PV annually from 2023 Integrated IPP Player Grenergy has the expertise to build and operate large-scale renewable energy plants CAPEX OPEX Operation & Maintenance Development Construction Services Asset Management
Slide 7: Key figures 1Q23
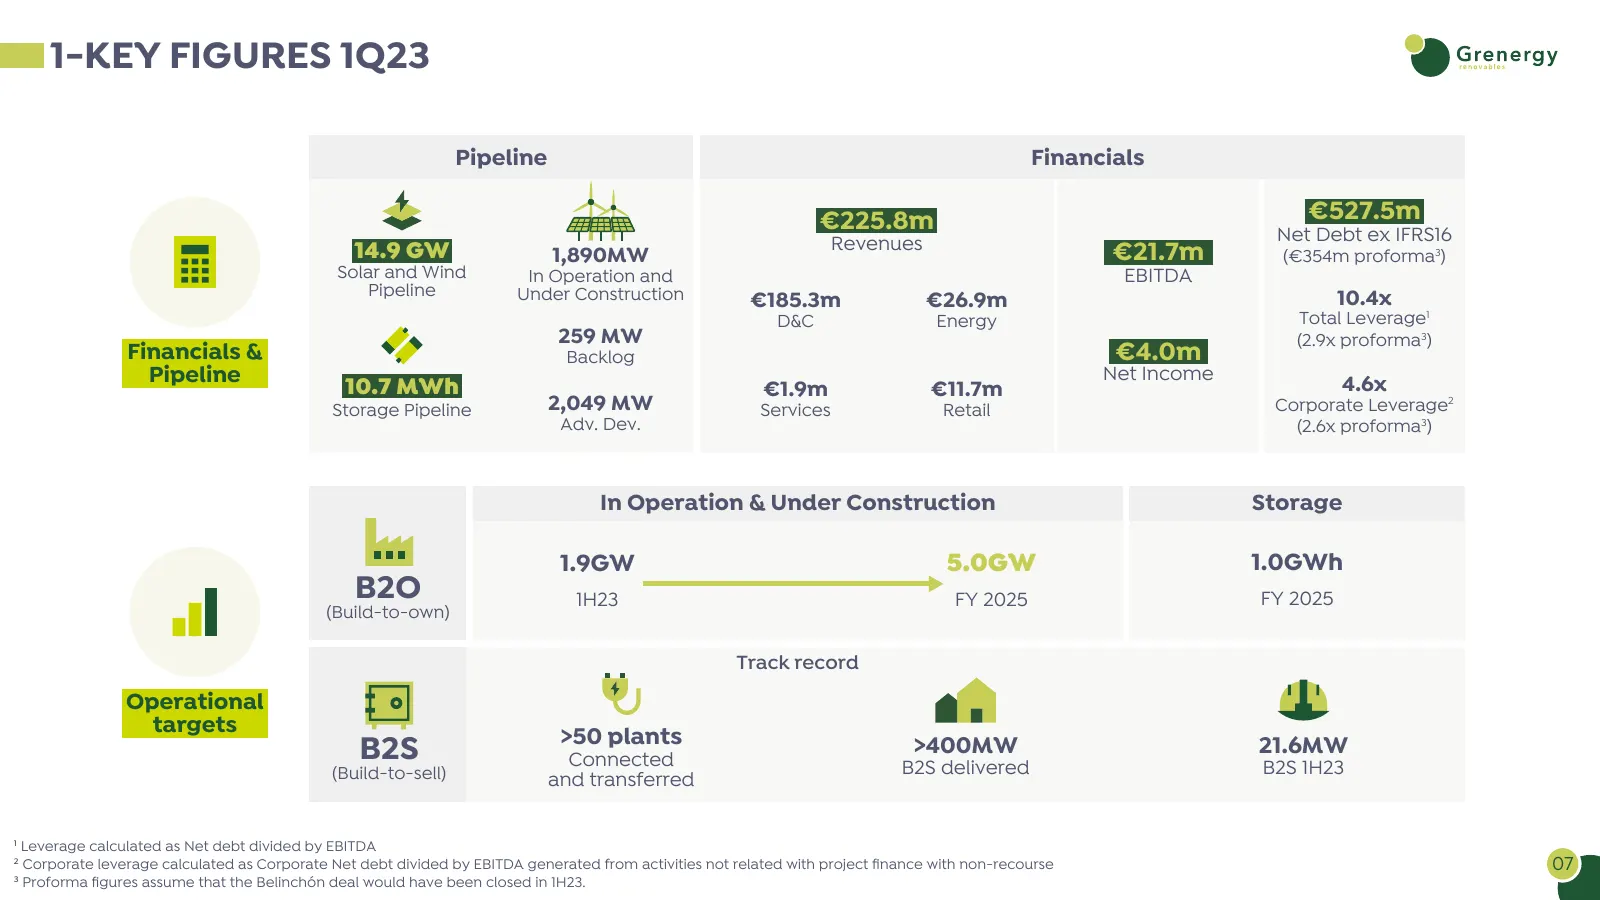
1-KEY FIGURES 1Q23 Pipeline Financials €225.8m €527.5m Revenues Net Debt ex IFRS16 14.9 GW 1,890MW €21.7m (€354m proforma3) Solar and Wind In Operation and EBITDA Pipeline Under Construction 10.4x €185.3m €26.9m D&C Energy Total Leverage1 259 MW (2.9x proforma3) Financials & Backlog €4.0m Pipeline 1
Slide 8: Platform & Pipeline
1 EQUITY STORY & KEY FIGURES 2 PLATFORM & PIPELINE 3 OPERATIONAL INFORMATION 4 STRONG GOVERNANCE STRUCTURE WITH FOCUS ON ESG 08
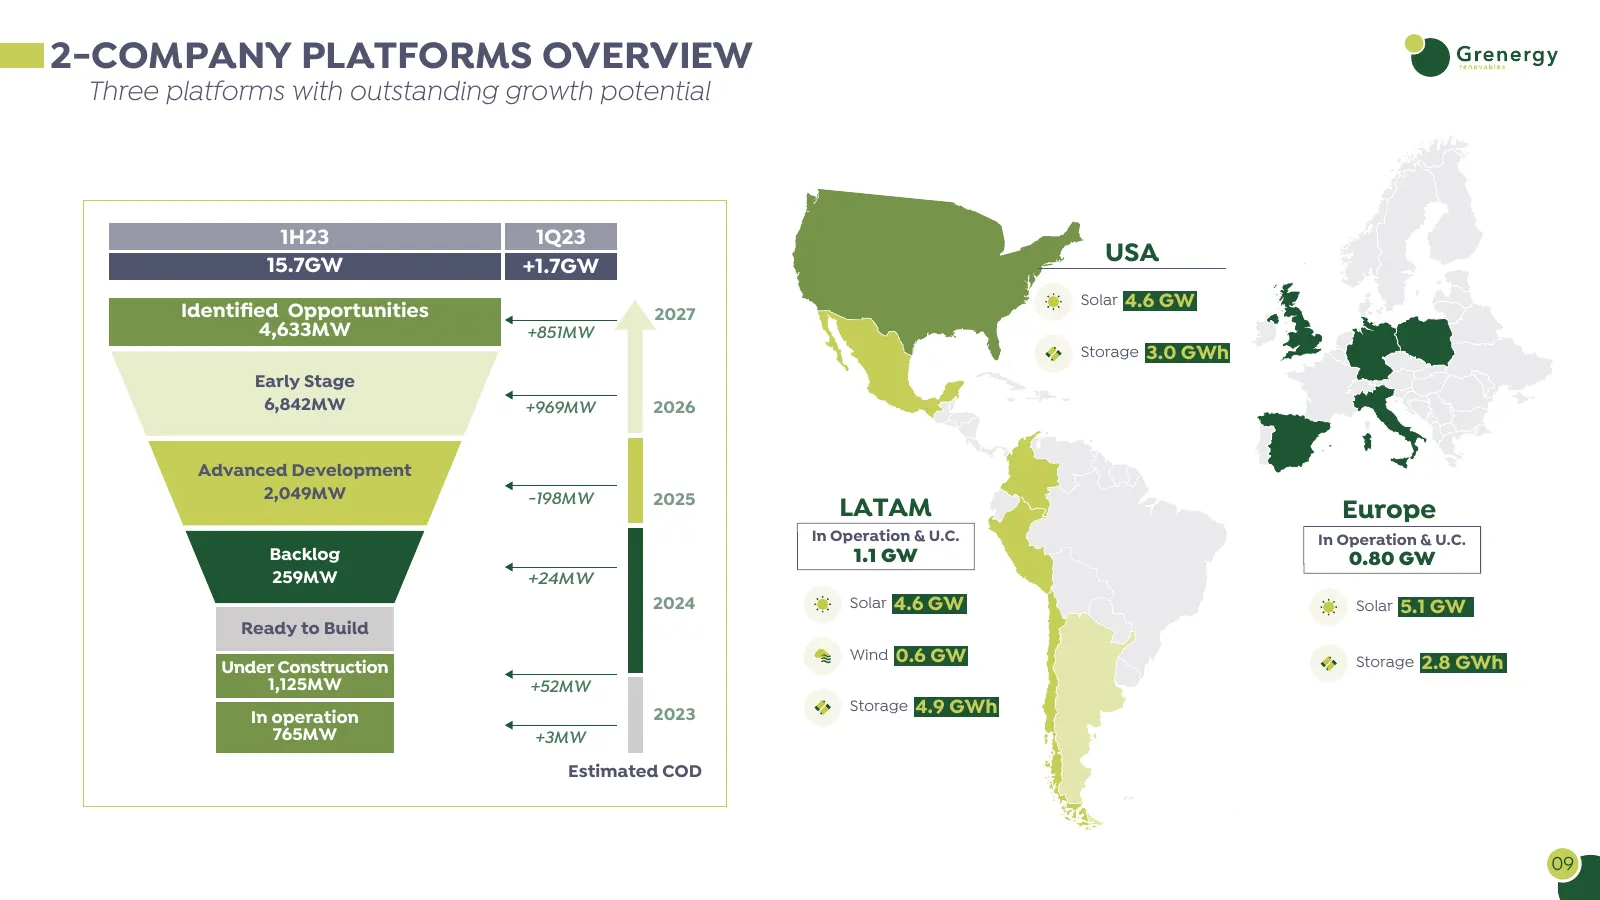
Slide 9: Company platforms overview
2-COMPANY PLATFORMS OVERVIEW Three platforms with outstanding growth potential 1H23 1Q23 15.7GW +1.7GW USA Solar 4.6 GW Identified Opportunities 2027 4,633MW +851MW Storage 3.0 GWh Early Stage 6,842MW +969MW 2026 Advanced Development 2,049MW -198MW 2025 LATAM Europe In Operation & U.C. In Operation &
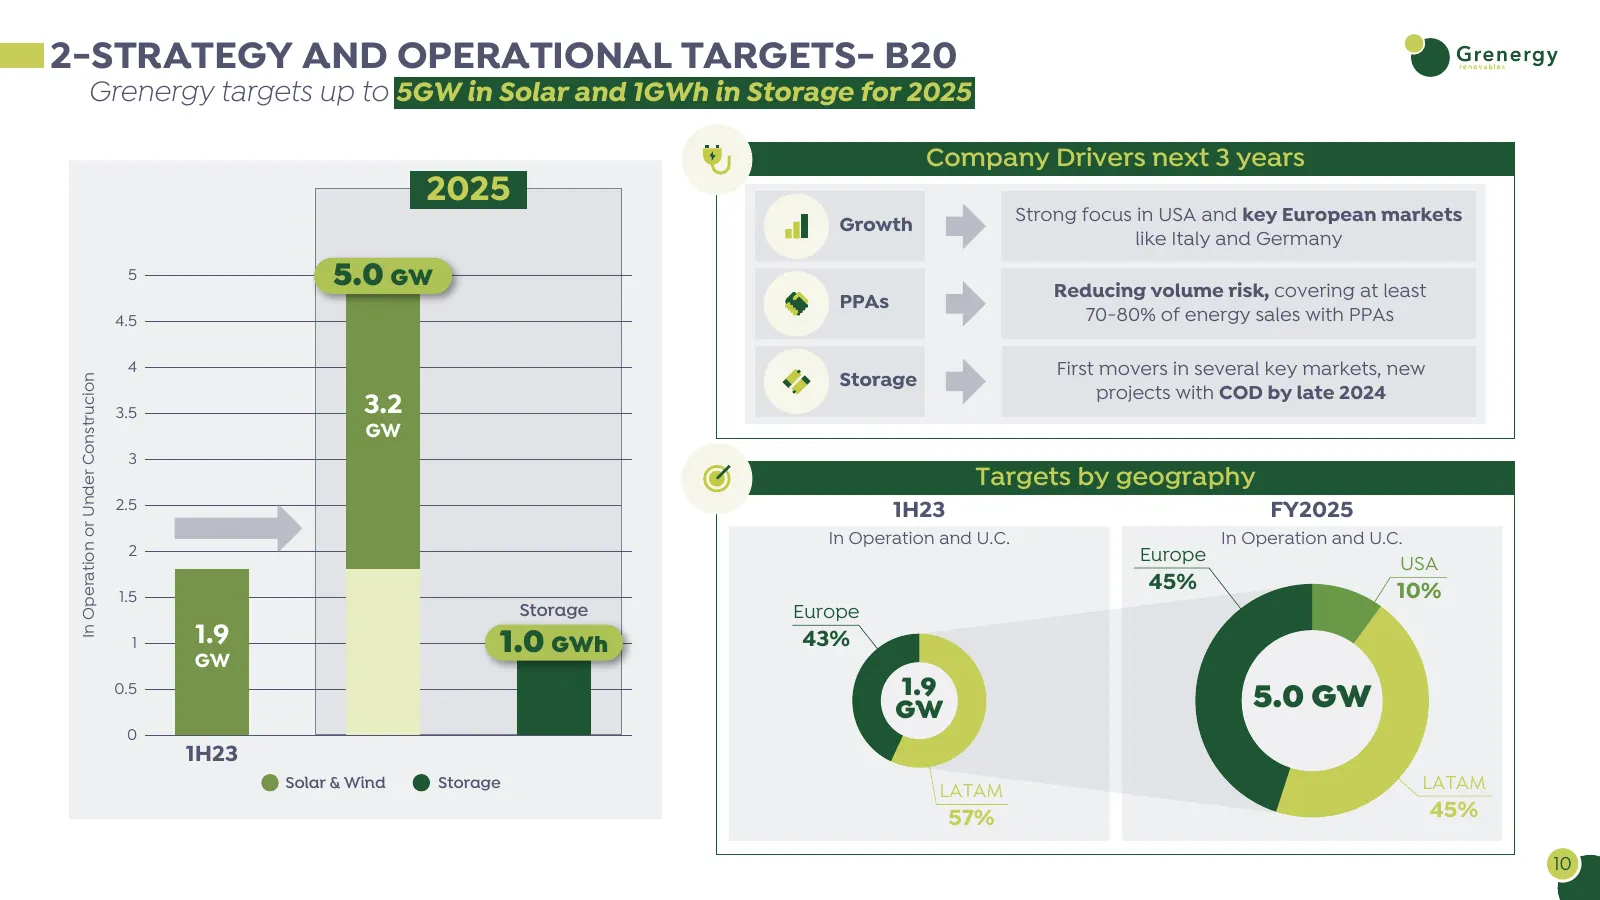
Slide 10: Strategy and operational targets - B2O
2-STRATEGY AND OPERATIONAL TARGETS- B20 Grenergy targets up to 5GW in Solar and 1GWh in Storage for 2025 Company Drivers next 3 years 2025 Strong focus in USA and key European markets Growth like Italy and Germany 5 5.0 GW Reducing volume risk, covering at least PPAs 4.5 70-80% of energy sales with
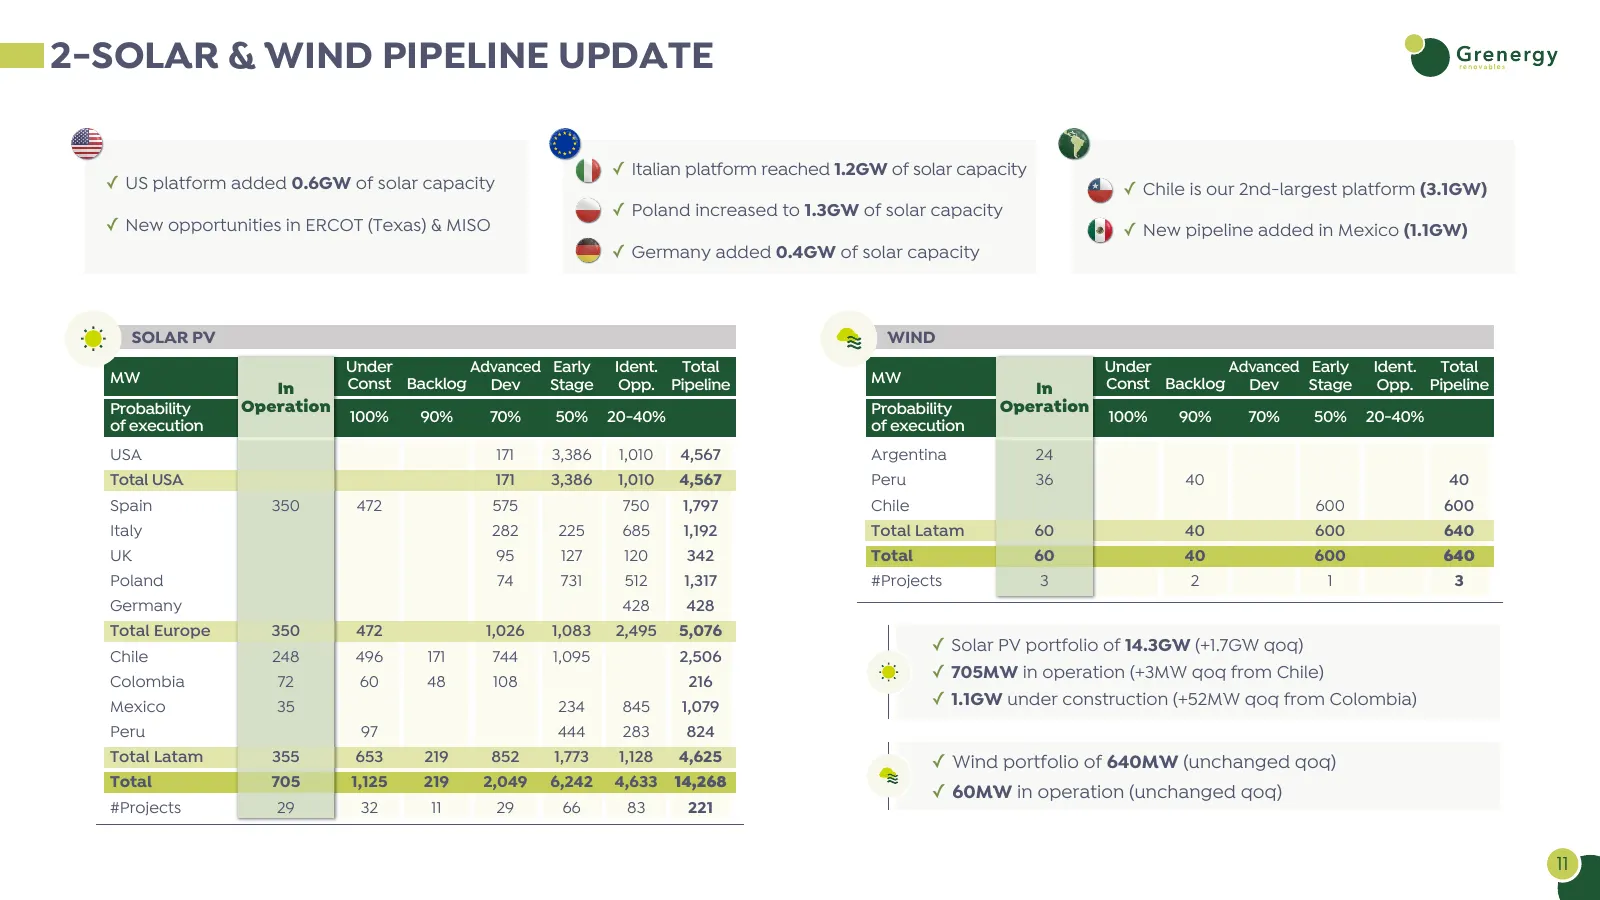
Slide 11: Solar & wind pipeline update
2-SOLAR & WIND PIPELINE UPDATE ✓ Italian platform reached 1.2GW of solar capacity ✓ US platform added 0.6GW of solar capacity ✓ Chile is our 2nd-largest platform (3.1GW) ✓ Poland increased to 1.3GW of solar capacity ✓ New opportunities in ERCOT (Texas) & MISO ✓ New pipeline added in Mexico (1.1GW) ✓
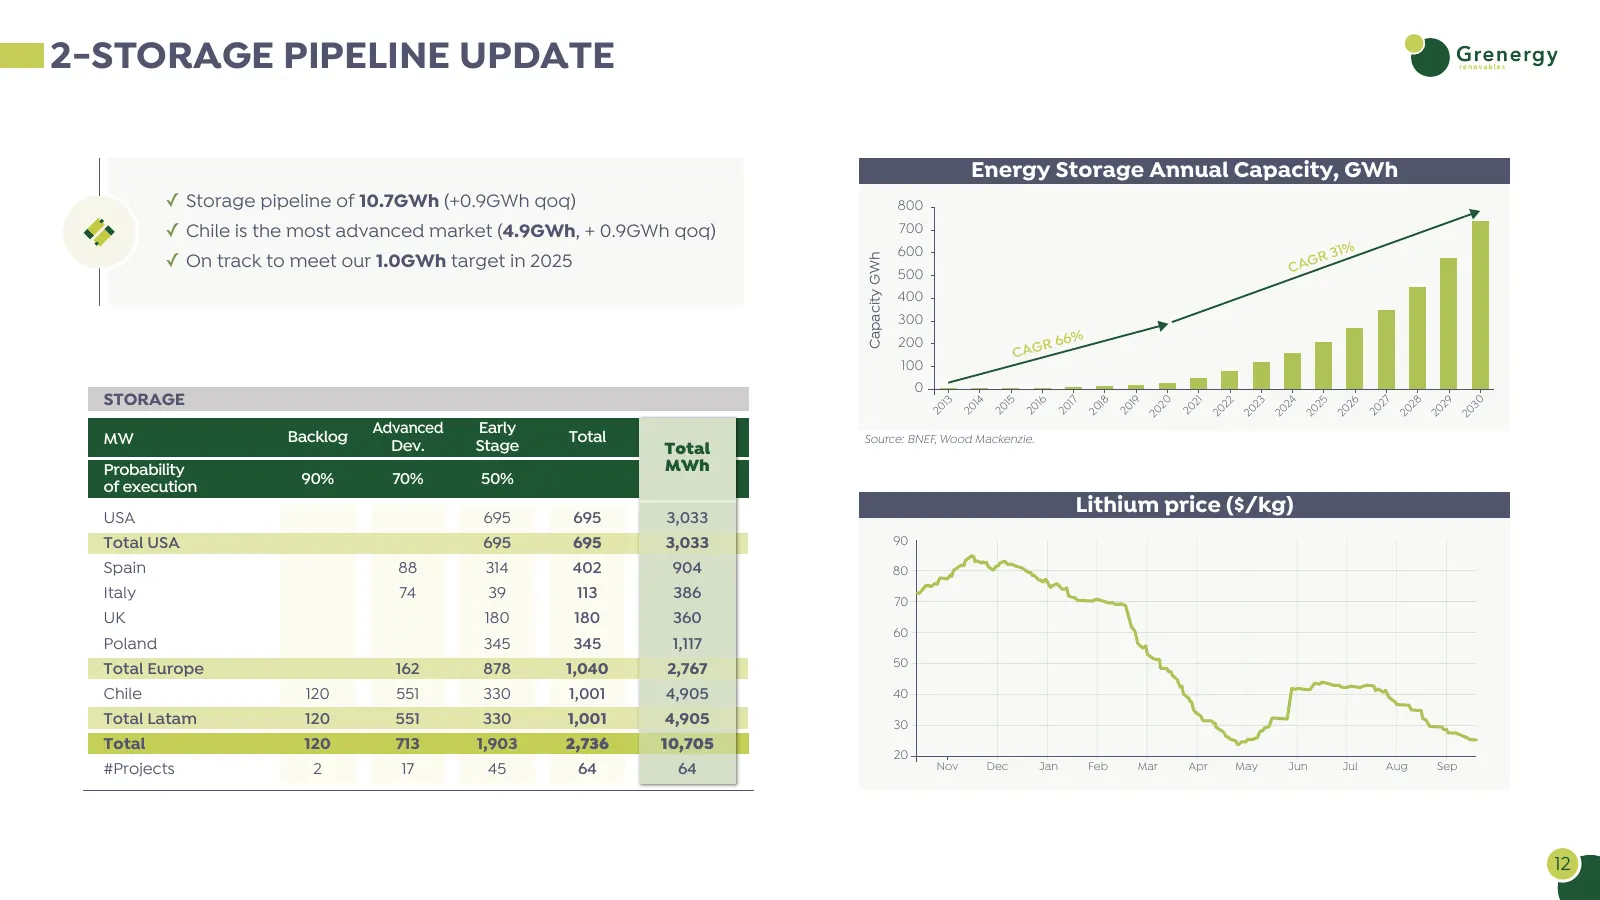
Slide 12: Storage pipeline update
2-STORAGE PIPELINE UPDATE Energy Storage Annual Capacity, GWh ✓ Storage pipeline of 10.7GWh (+0.9GWh qoq) 800 ✓ Chile is the most advanced market (4.9GWh, + 0.9GWh qoq) 700 % ✓ On track to meet our 1.0GWh target in 2025 600 R 31 Capacity GWh 500 CAG 400 300 % 200 R 66 CAG 100 0 STORAGE 13 14 15 16 1
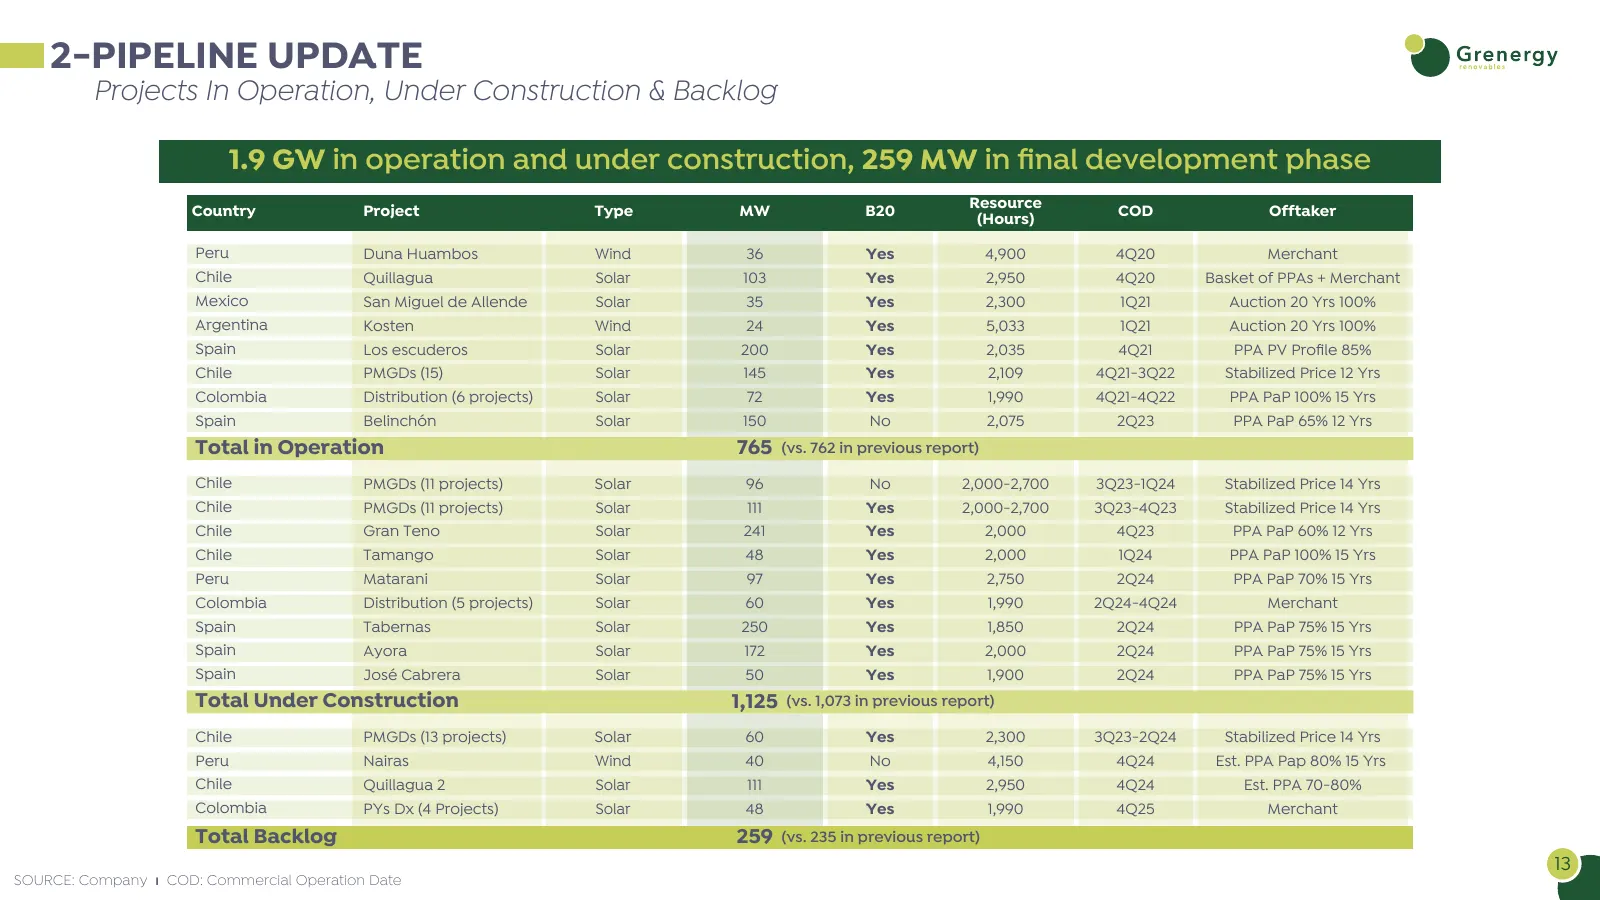
Slide 13: Pipeline update: projects in operation, under construction & backlog
2-PIPELINE UPDATE Projects In Operation, Under Construction & Backlog 1.9 GW in operation and under construction, 259 MW in final development phase Country Project Type MW B20 Resource COD Offtaker (Hours) Peru Duna Huambos Wind 36 Yes 4,900 4Q20 Merchant Chile Quillagua Solar 103 Yes 2,950 4Q20 Bas
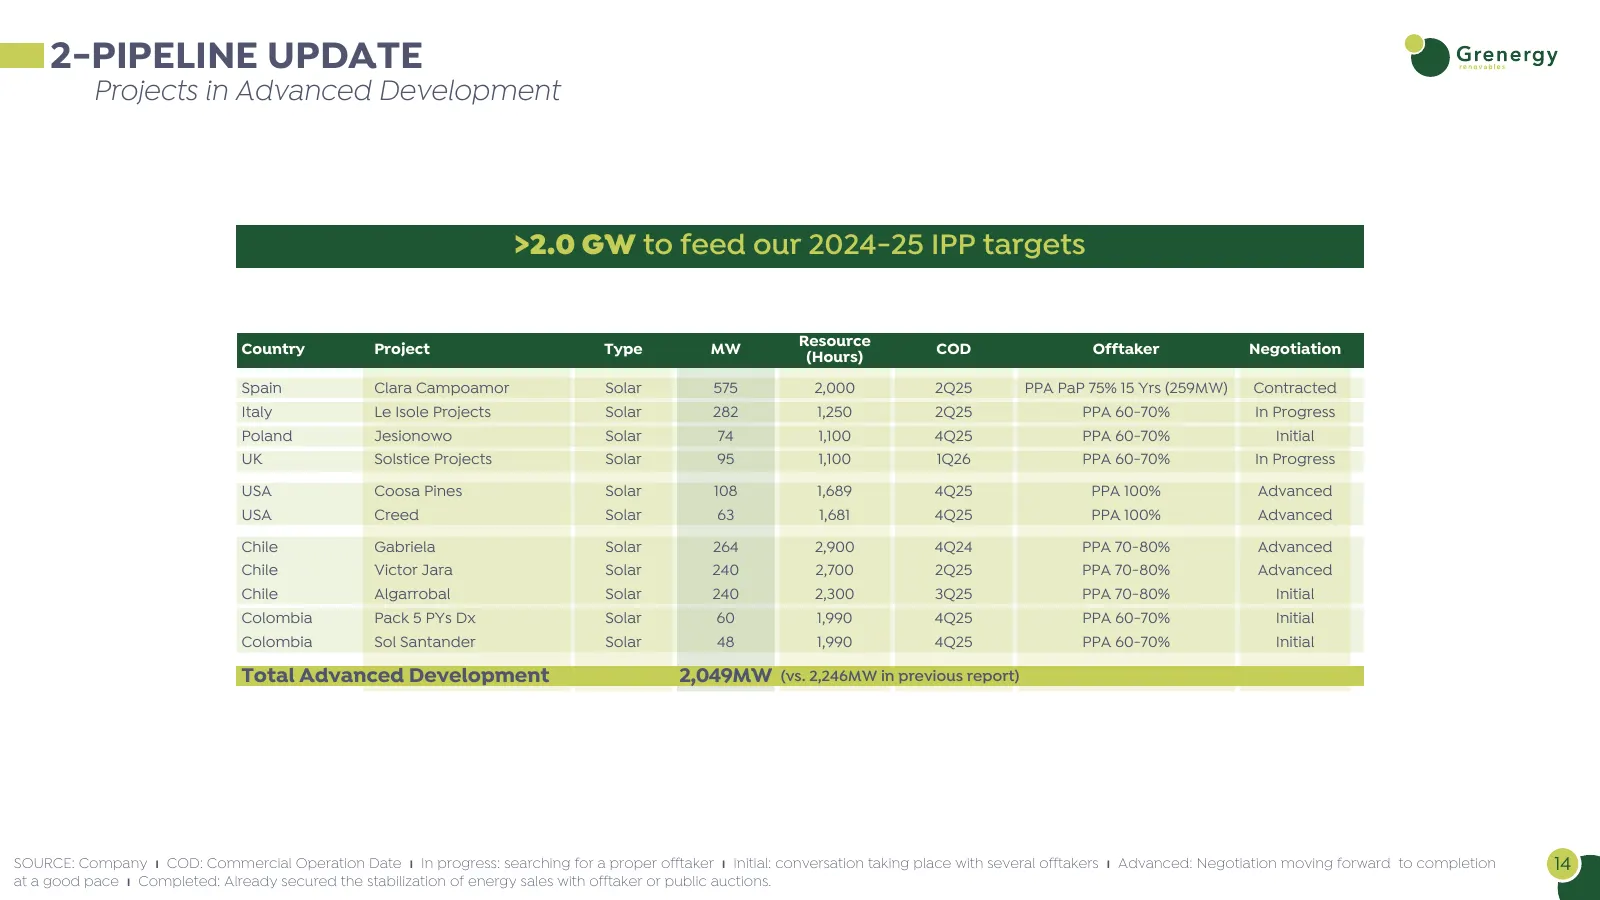
Slide 14: Projects in advanced development
2-PIPELINE UPDATE Projects in Advanced Development >2.0 GW to feed our 2024-25 IPP targets Resource Country Project Type MW COD Offtaker Negotiation (Hours) Spain Clara Campoamor Solar 575 2,000 2Q25 PPA PaP 75% 15 Yrs (259MW) Contracted Italy Le Isole Projects Solar 282 1,250 2Q25 PPA 60-70% In Pro
Slide 15: Operational Information
1 EQUITY STORY & KEY FIGURES 2 PLATFORM & PIPELINE 3 OPERATIONAL INFORMATION 4 STRONG GOVERNANCE STRUCTURE WITH FOCUS ON ESG 15
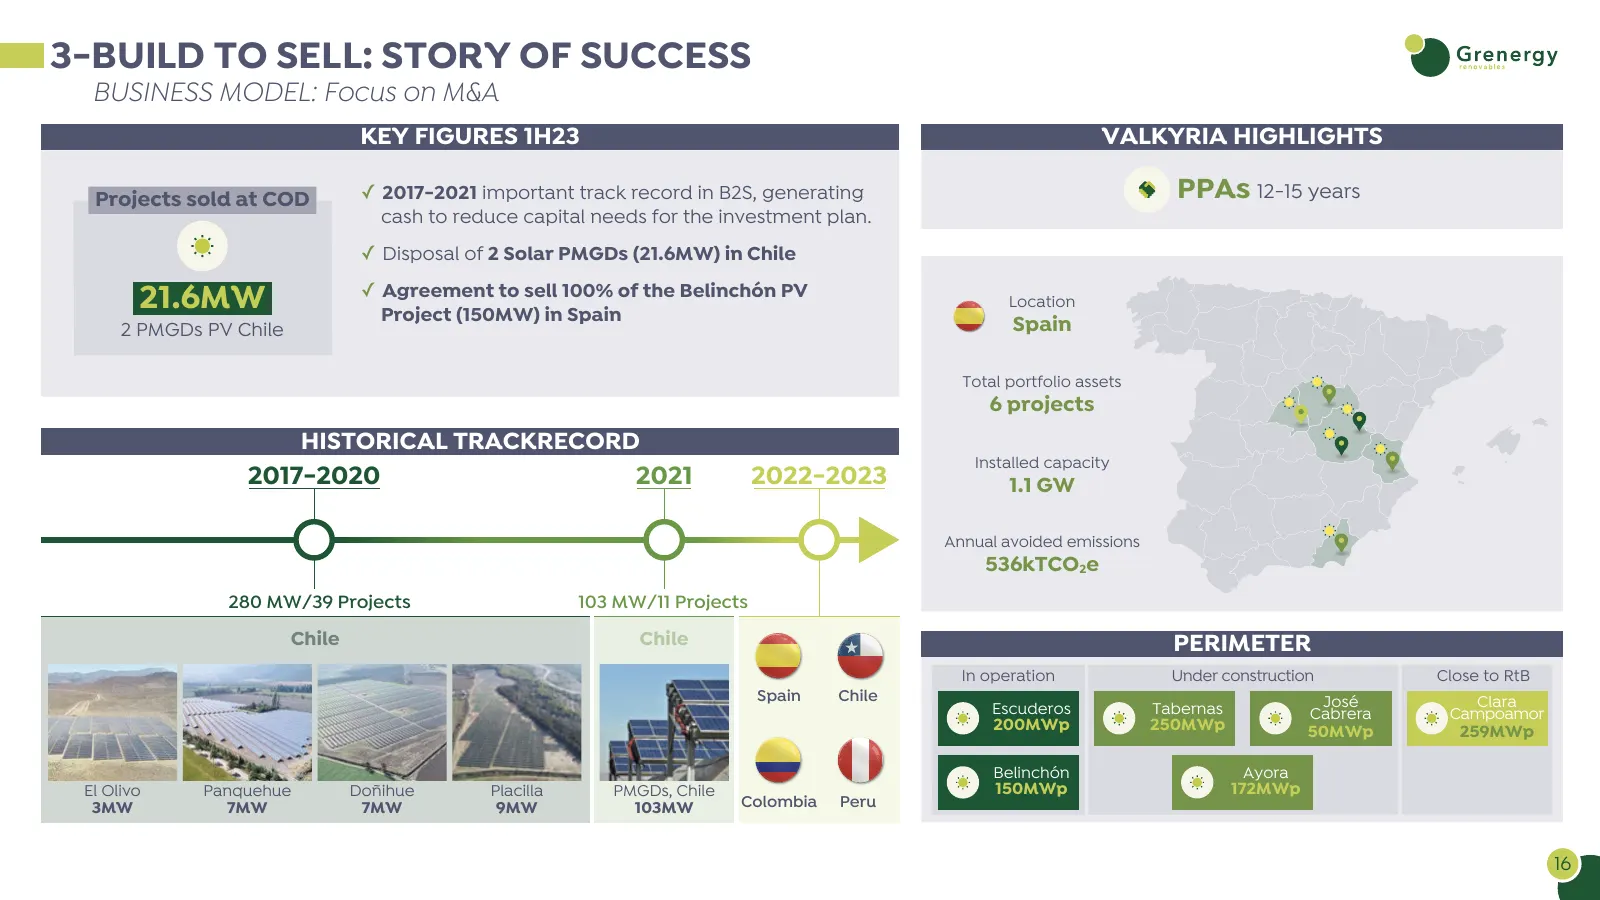
Slide 16: Build to sell: story of success
3-BUILD TO SELL: STORY OF SUCCESS BUSINESS MODEL: Focus on M&A KEY FIGURES 1H23 VALKYRIA HIGHLIGHTS Projects sold at COD ✓ 2017-2021 important track record in B2S, generating PPAs 12-15 years cash to reduce capital needs for the investment plan. ✓ Disposal of 2 Solar PMGDs (21.6MW) in Chile ✓ Agreem
Slide 17: Integrated business model - B2O (build-to-own)
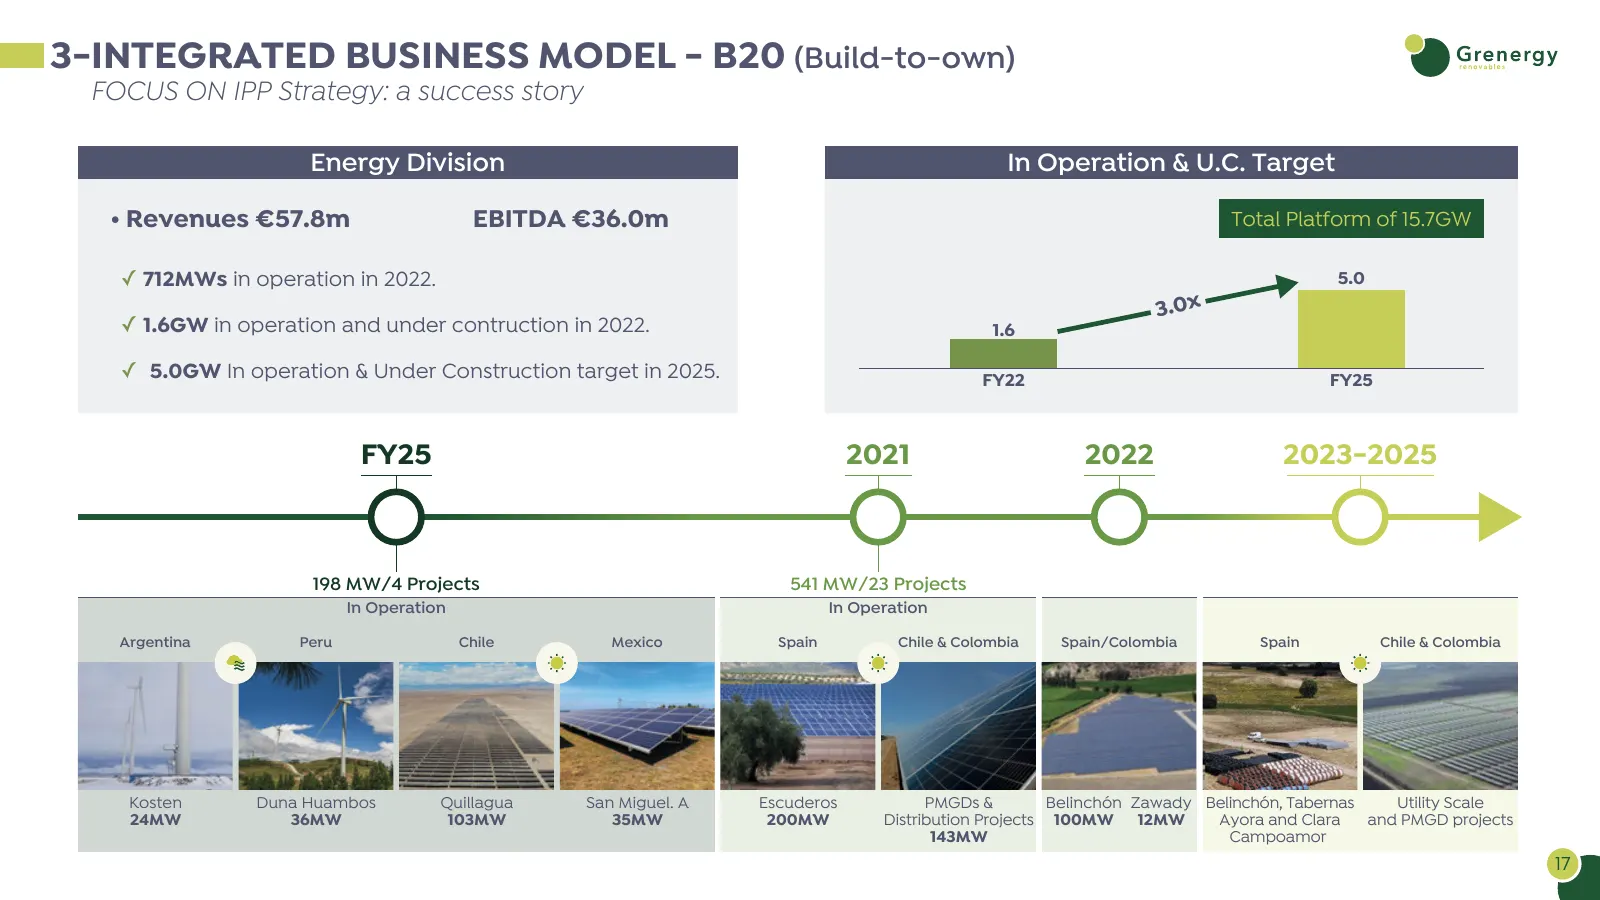
3-INTEGRATED BUSINESS MODEL - B20 (Build-to-own) FOCUS ON IPP Strategy: a success story Energy Division In Operation & U.C. Target • Revenues €57.8m EBITDA €36.0m Total Platform of 15.7GW ✓ 712MWs in operation in 2022. 5.0 3.0x ✓ 1.6GW in operation and under contruction in 2022. 1.6 ✓ 5.0GW In opera
Slide 18: Strategy, estimates & operational targets - B2O
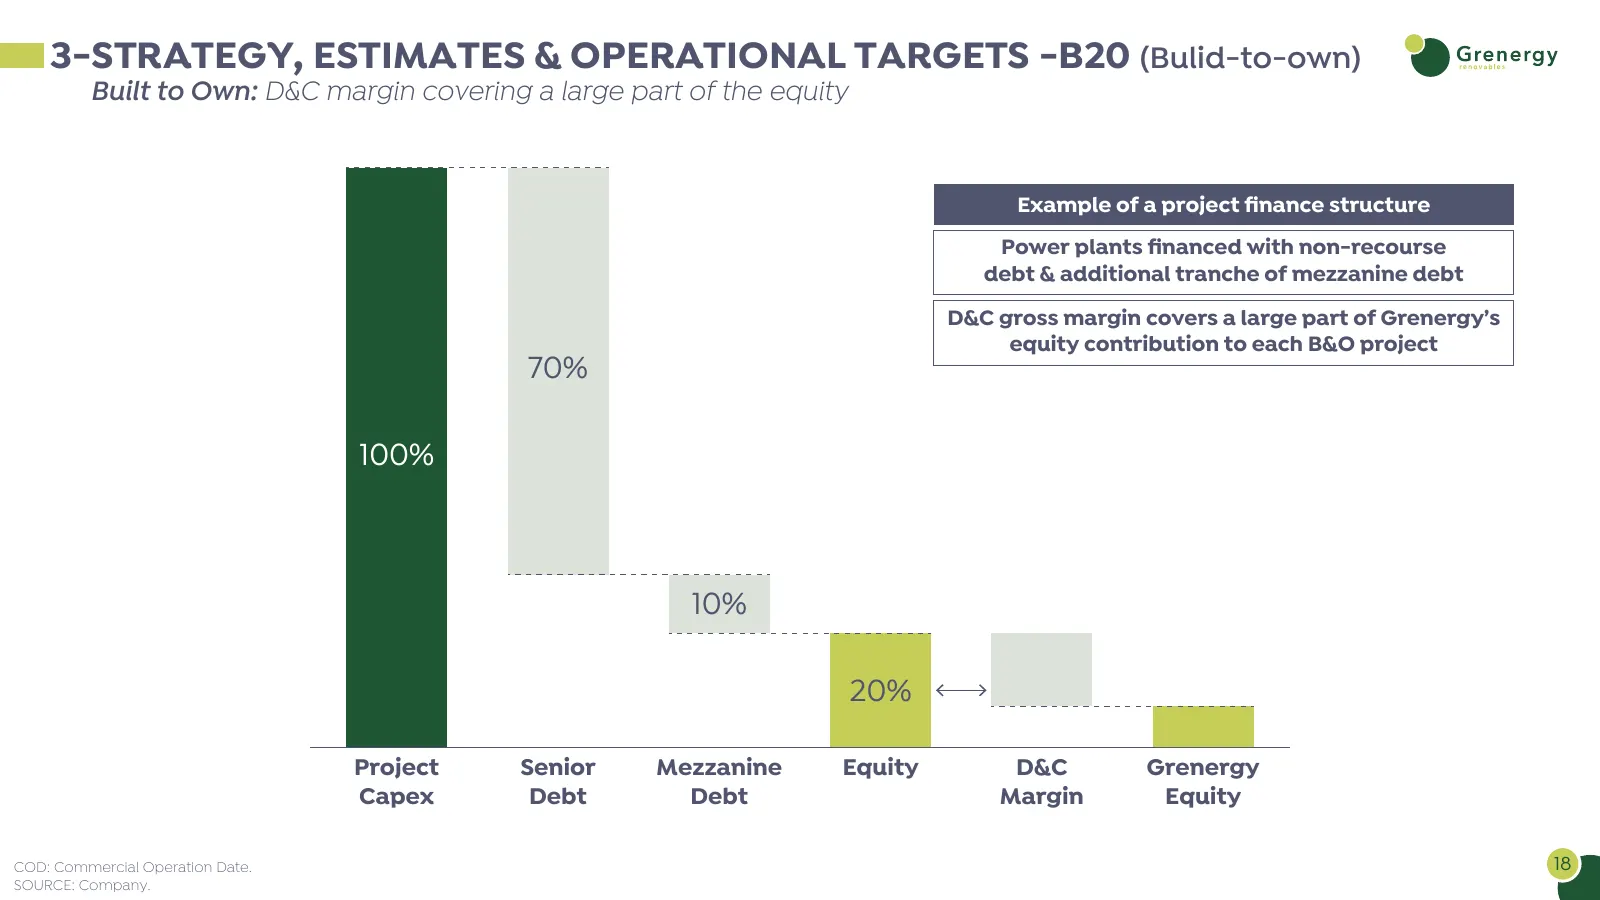
3-STRATEGY, ESTIMATES & OPERATIONAL TARGETS -B20 (Bulid-to-own) Built to Own: D&C margin covering a large part of the equity Example of a project finance structure Power plants financed with non-recourse debt & additional tranche of mezzanine debt D&C gross margin covers a large part of Grenergy’s equ
Slide 19: PPAs - 825MW signed YTD up to 1.5GW
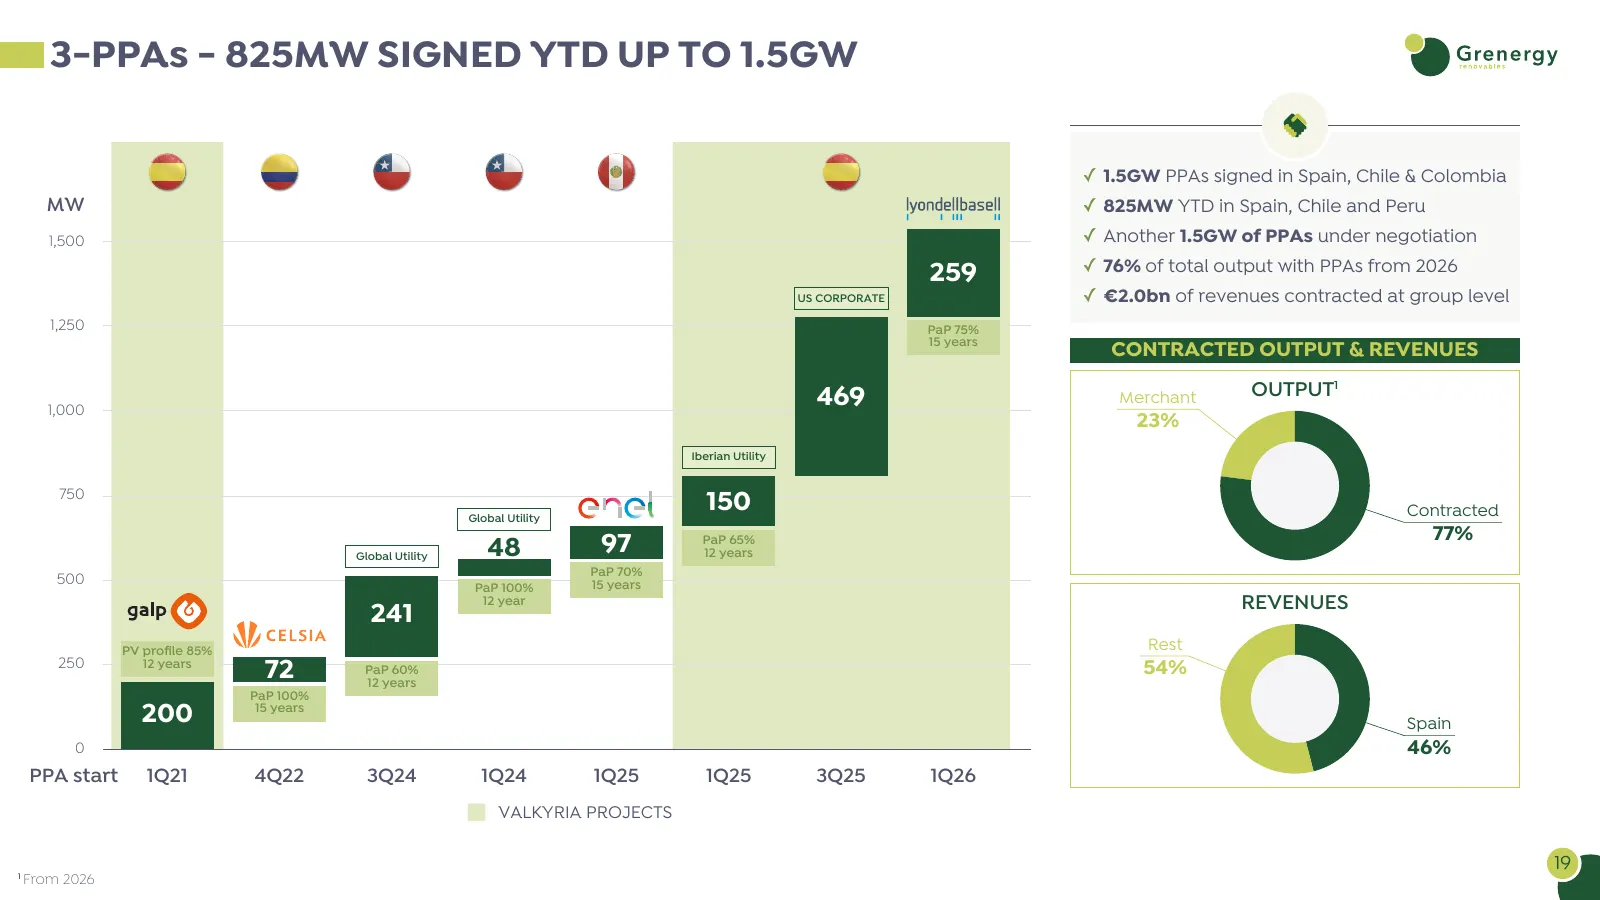
3-PPAs - 825MW SIGNED YTD UP TO 1.5GW ✓ 1.5GW PPAs signed in Spain, Chile & Colombia MW ✓ 825MW YTD in Spain, Chile and Peru 1,500 ✓ Another 1.5GW of PPAs under negotiation ✓ 76% of total output with PPAs from 2026 259 US CORPORATE ✓ €2.0bn of revenues contracted at group level 1,250 PaP 75% 15 year
Slide 20: Key operating & financial data
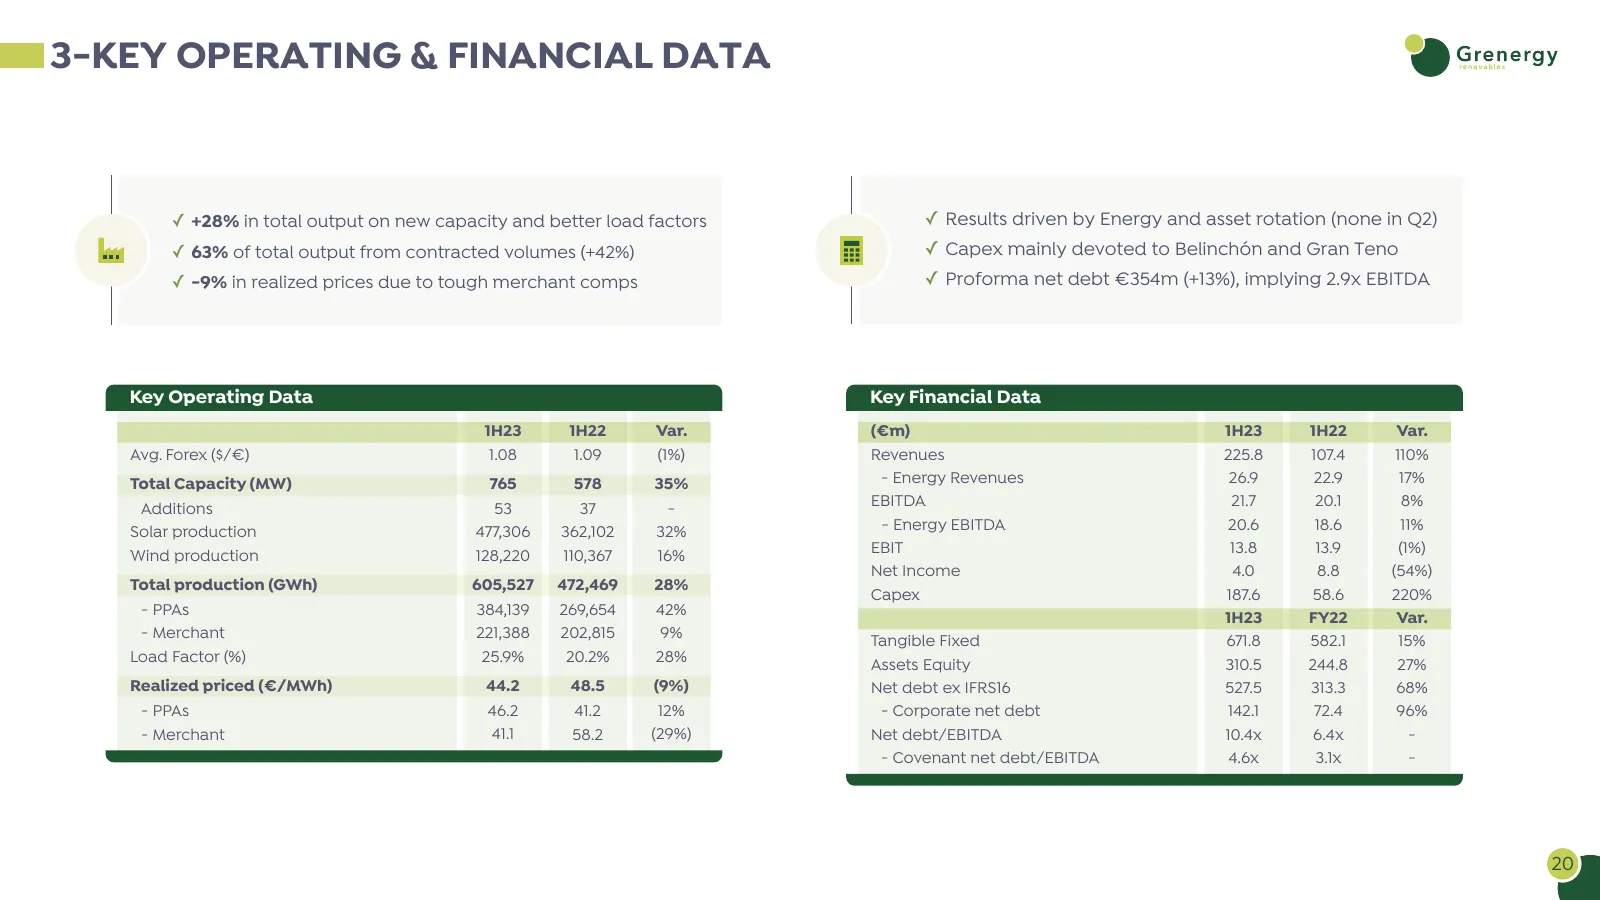
3-KEY OPERATING & FINANCIAL DATA ✓ +28% in total output on new capacity and better load factors ✓ Results driven by Energy and asset rotation (none in Q2) ✓ 63% of total output from contracted volumes (+42%) ✓ Capex mainly devoted to Belinchón and Gran Teno ✓ -9% in realized prices due to tough merc
Slide 21: Solar PV capex
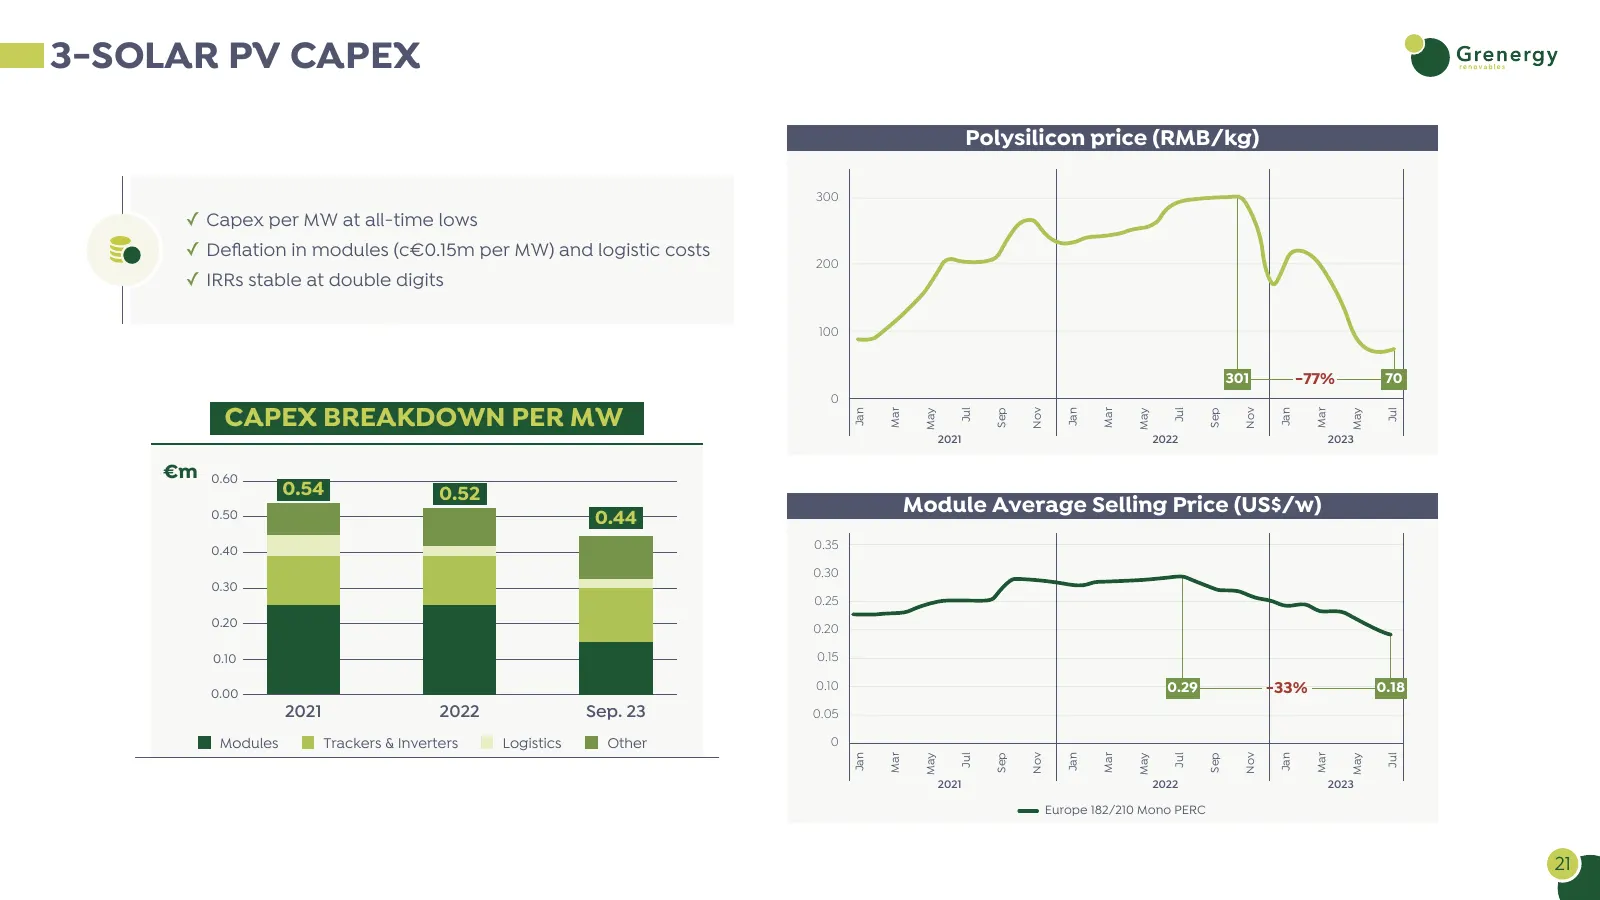
3-SOLAR PV CAPEX Polysilicon price (RMB/kg) 300 ✓ Capex per MW at all-time lows ✓ Deflation in modules (c€0.15m per MW) and logistic costs 200 ✓ IRRs stable at double digits 100 301 -77% 70 0 CAPEX BREAKDOWN PER MW Jan Mar May Jul Sep Nov Jan Mar May Jul Sep Nov Jan Mar May Jul 2021 2022 2023 €m 0.6
Slide 22: Strong governance structure with focus on ESG
1 EQUITY STORY & KEY FIGURES 2 PLATFORM & PIPELINE 3 OPERATIONAL INFORMATION 4 STRONG GOVERNANCE STRUCTURE WITH FOCUS ON ESG 22
Slide 23: ESG roadmap 2021-2023
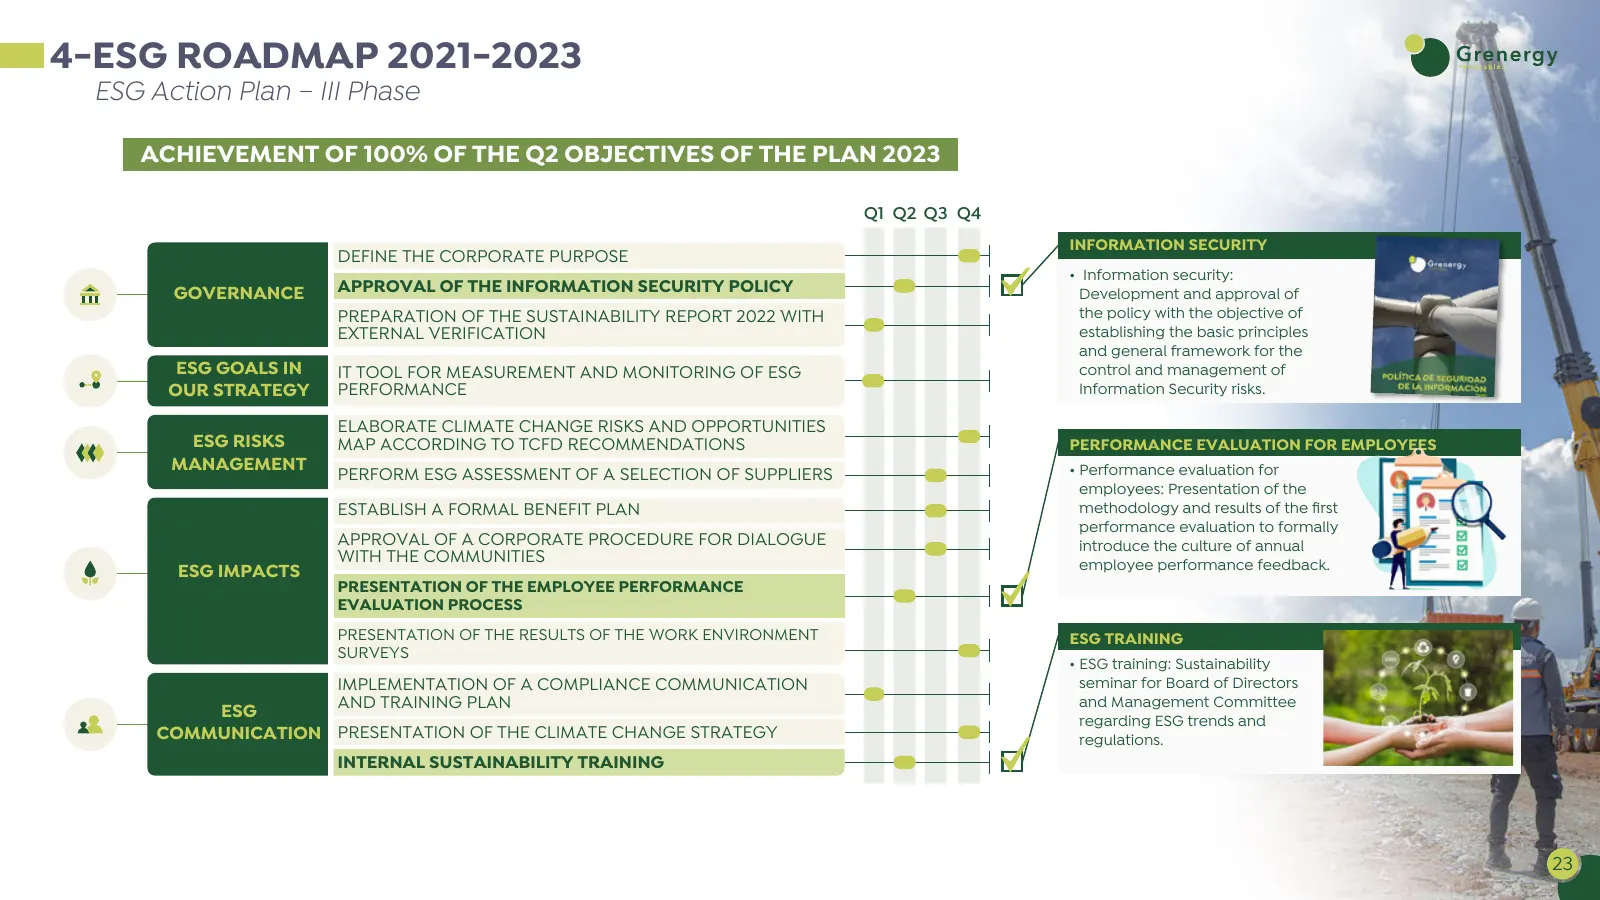
4-ESG ROADMAP 2021-2023 ESG Action Plan – III Phase ACHIEVEMENT OF 100% OF THE Q2 OBJECTIVES OF THE PLAN 2023 Q1 Q2 Q3 Q4 INFORMATION SECURITY DEFINE THE CORPORATE PURPOSE • Information security: GOVERNANCE APPROVAL OF THE INFORMATION SECURITY POLICY Development and approval of PREPARATION OF THE SU
Slide 24: Expansion and improve positioning in ESG ratings
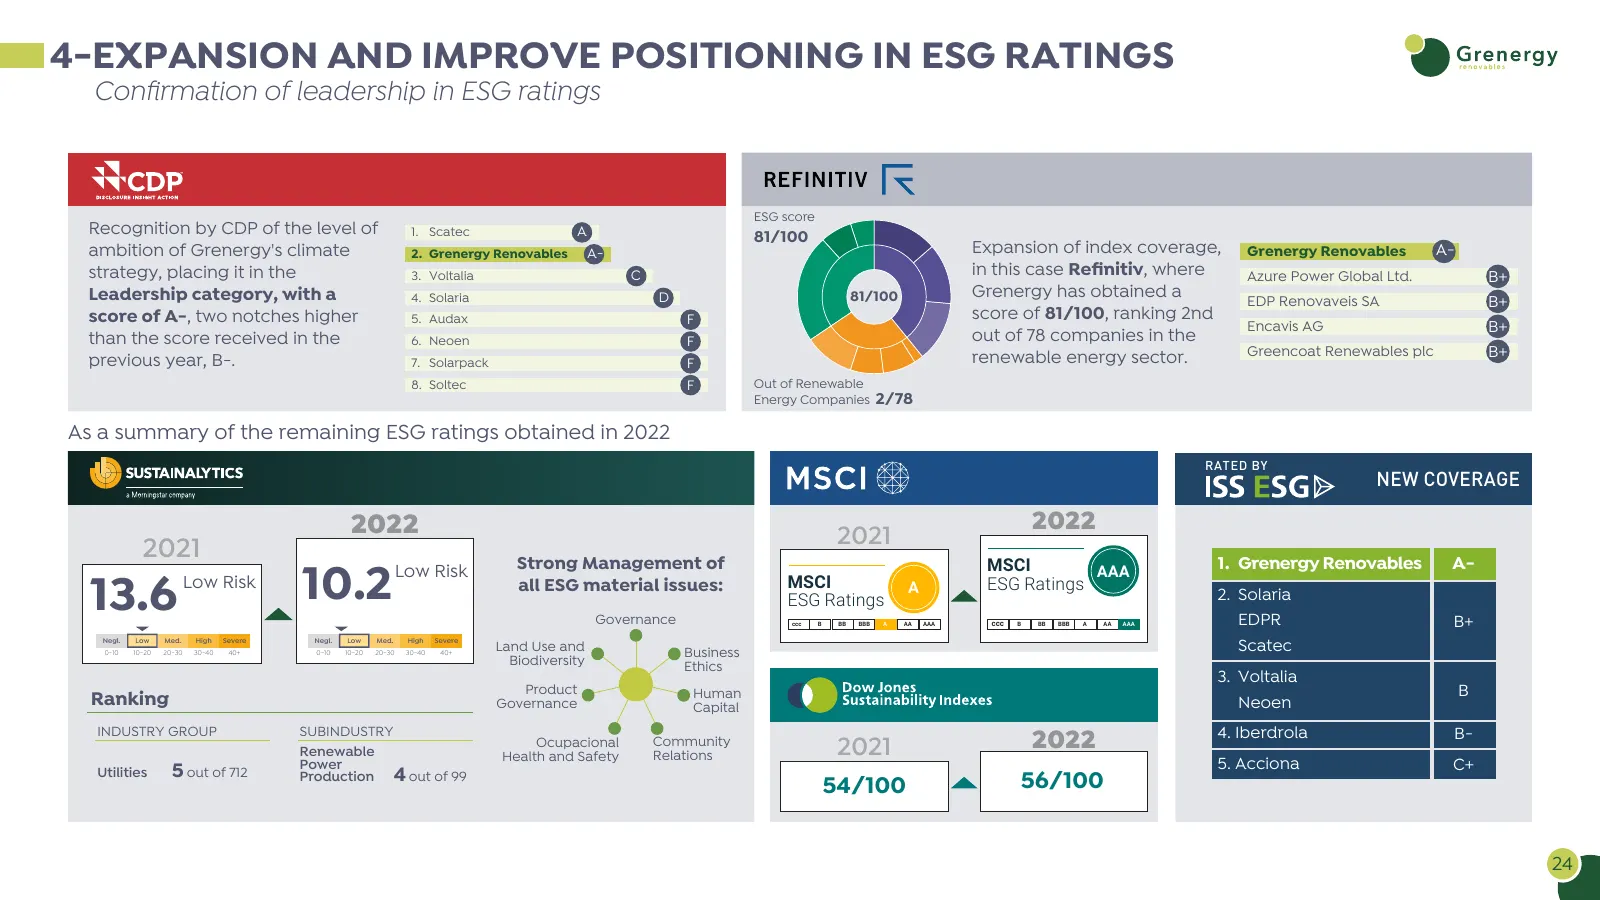
4-EXPANSION AND IMPROVE POSITIONING IN ESG RATINGS Confirmation of leadership in ESG ratings ESG score Recognition by CDP of the level of 1. Scatec A 81/100 ambition of Grenergy's climate 2. Grenergy Renovables A- Expansion of index coverage, Grenergy Renovables A- strategy, placing it in the 3. Vol
Slide 25: Strong governance with focus on ESG
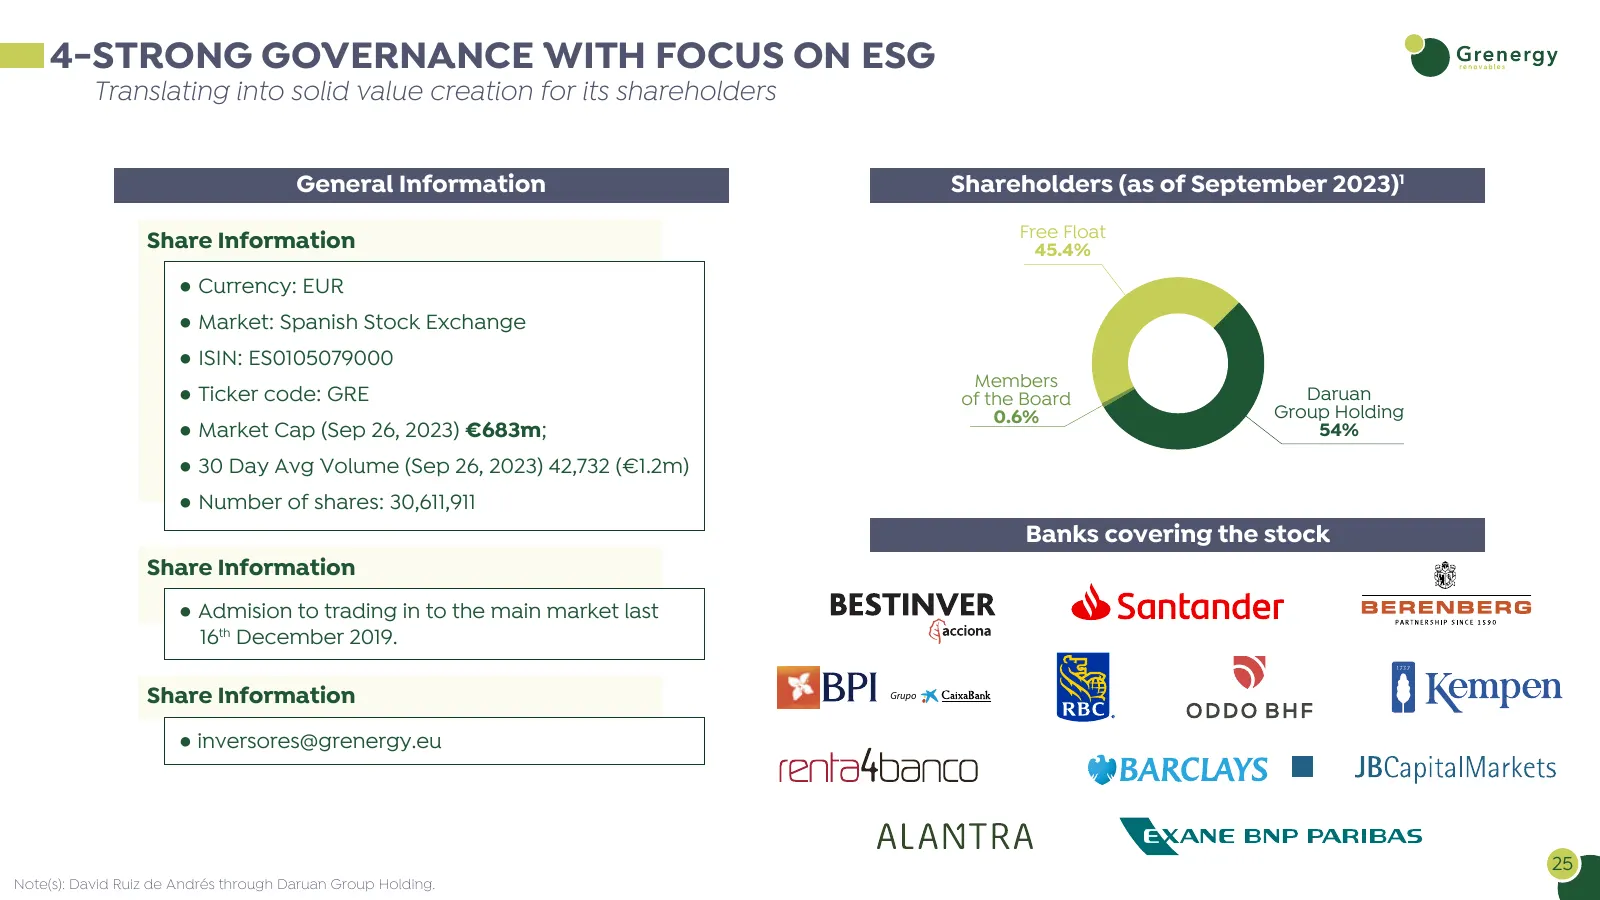
4-STRONG GOVERNANCE WITH FOCUS ON ESG Translating into solid value creation for its shareholders General Information Shareholders (as of September 2023)1 Free Float Share Information 45.4% ● Currency: EUR ● Market: Spanish Stock Exchange ● ISIN: ES0105079000 Members ● Ticker code: GRE of the Board D
Slide 26: Appendices
APPENDICES
Slide 27: Platform with relevant growth potential
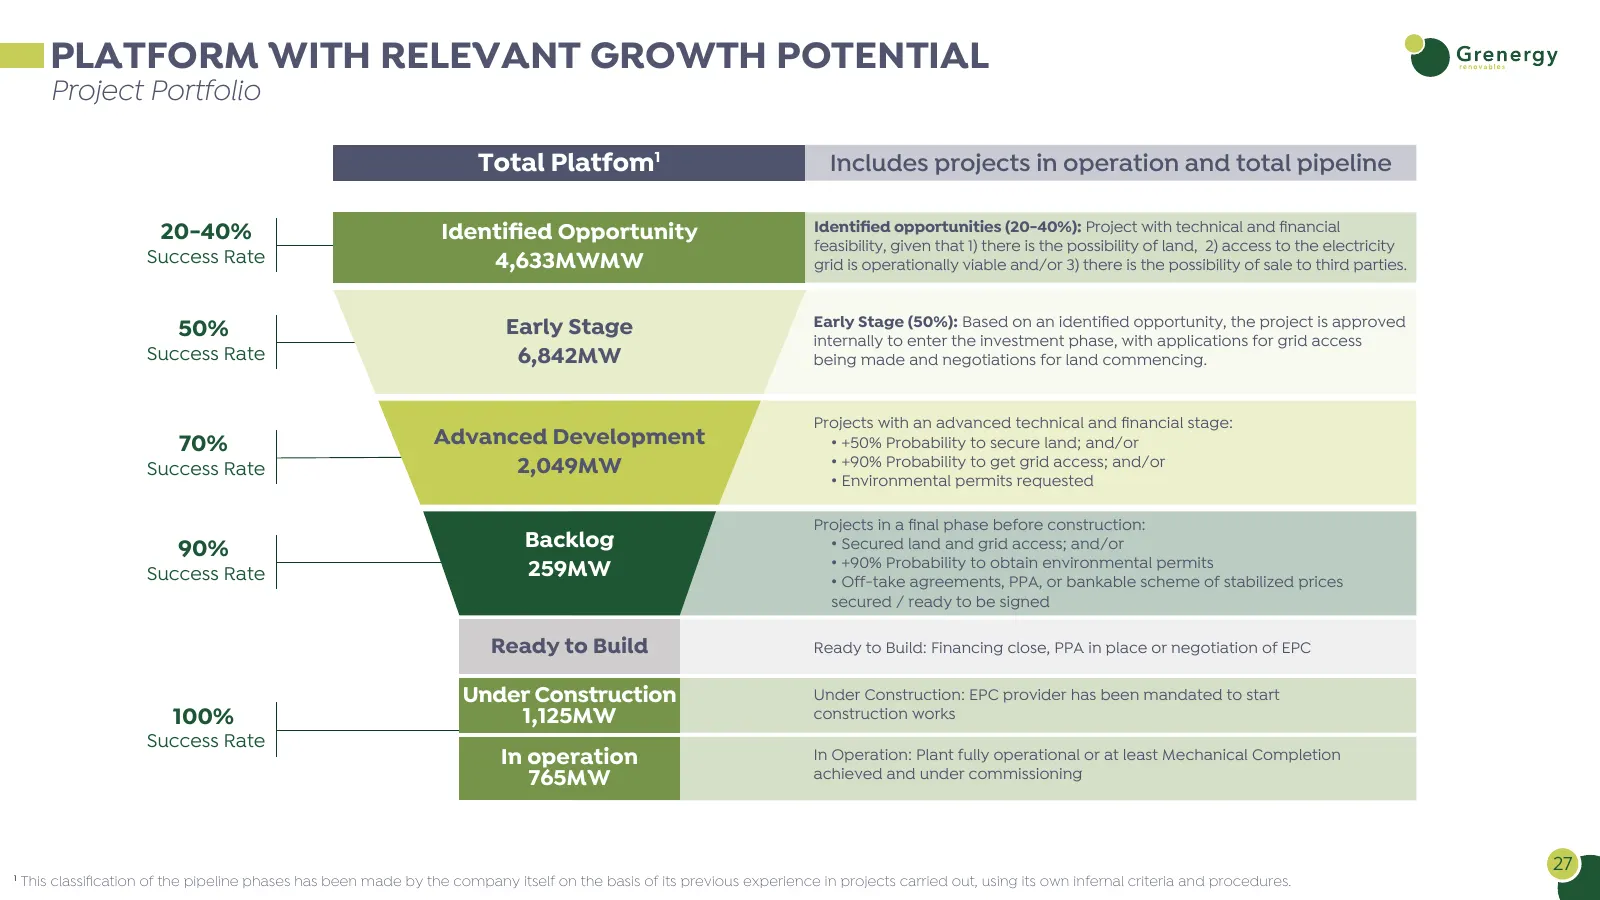
PLATFORM WITH RELEVANT GROWTH POTENTIAL Project Portfolio Total Platfom1 Includes projects in operation and total pipeline 20-40% Identified Opportunity Identified opportunities (20-40%): Project with technical and financial feasibility, given that 1) there is the possibility of land, 2) access to the
Slide 28: 1H23 results: revenue & EBITDA breakdown
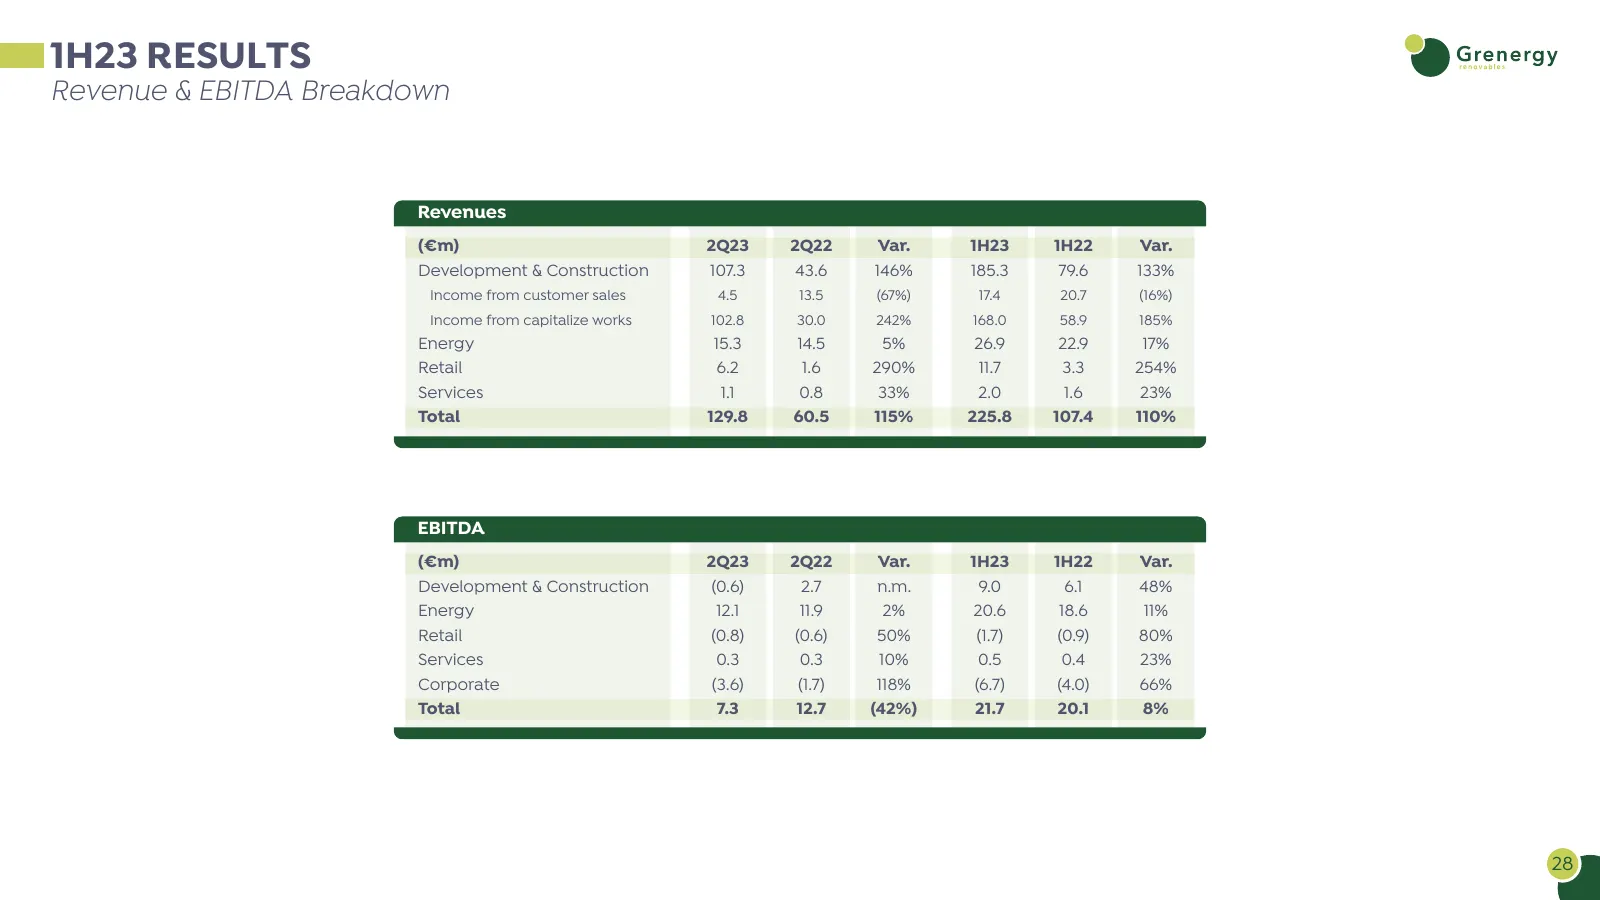
1H23 RESULTS Revenue & EBITDA Breakdown Revenues (€m) 2Q23 2Q22 Var. 1H23 1H22 Var. Development & Construction 107.3 43.6 146% 185.3 79.6 133% Income from customer sales 4.5 13.5 (67%) 17.4 20.7 (16%) Income from capitalize works 102.8 30.0 242% 168.0 58.9 185% Energy 15.3 14.5 5% 26.9 22.9 17% Reta
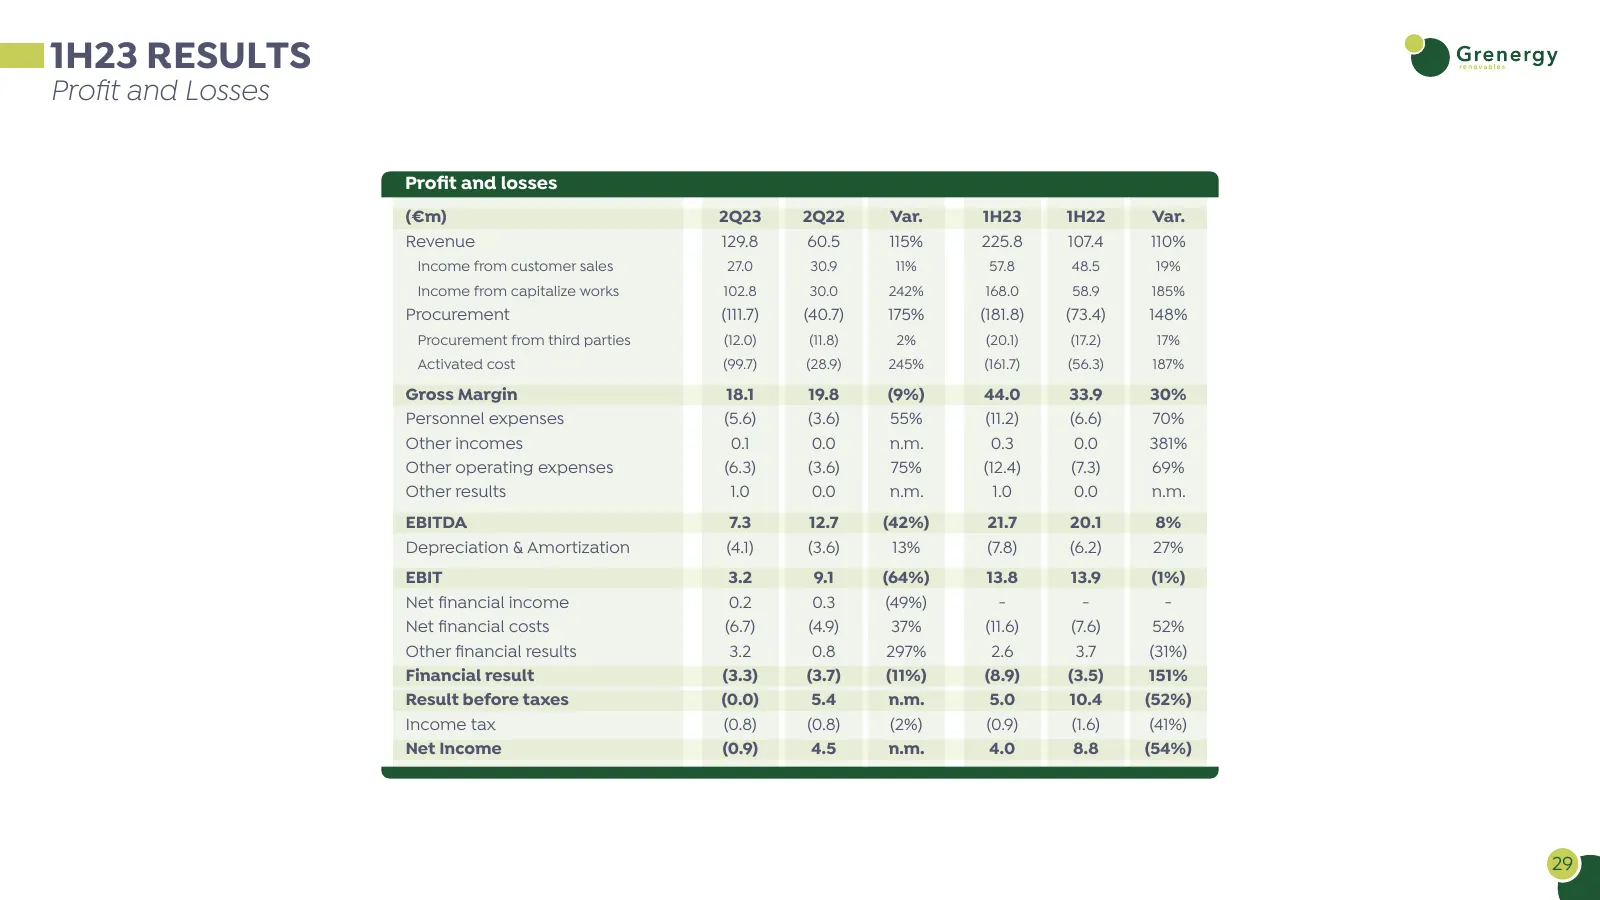
Slide 29: 1H23 results: profit and losses
1H23 RESULTS Profit and Losses Profit and losses (€m) 2Q23 2Q22 Var. 1H23 1H22 Var. Revenue 129.8 60.5 115% 225.8 107.4 110% Income from customer sales 27.0 30.9 11% 57.8 48.5 19% Income from capitalize works 102.8 30.0 242% 168.0 58.9 185% Procurement (111.7) (40.7) 175% (181.8) (73.4) 148% Procurem
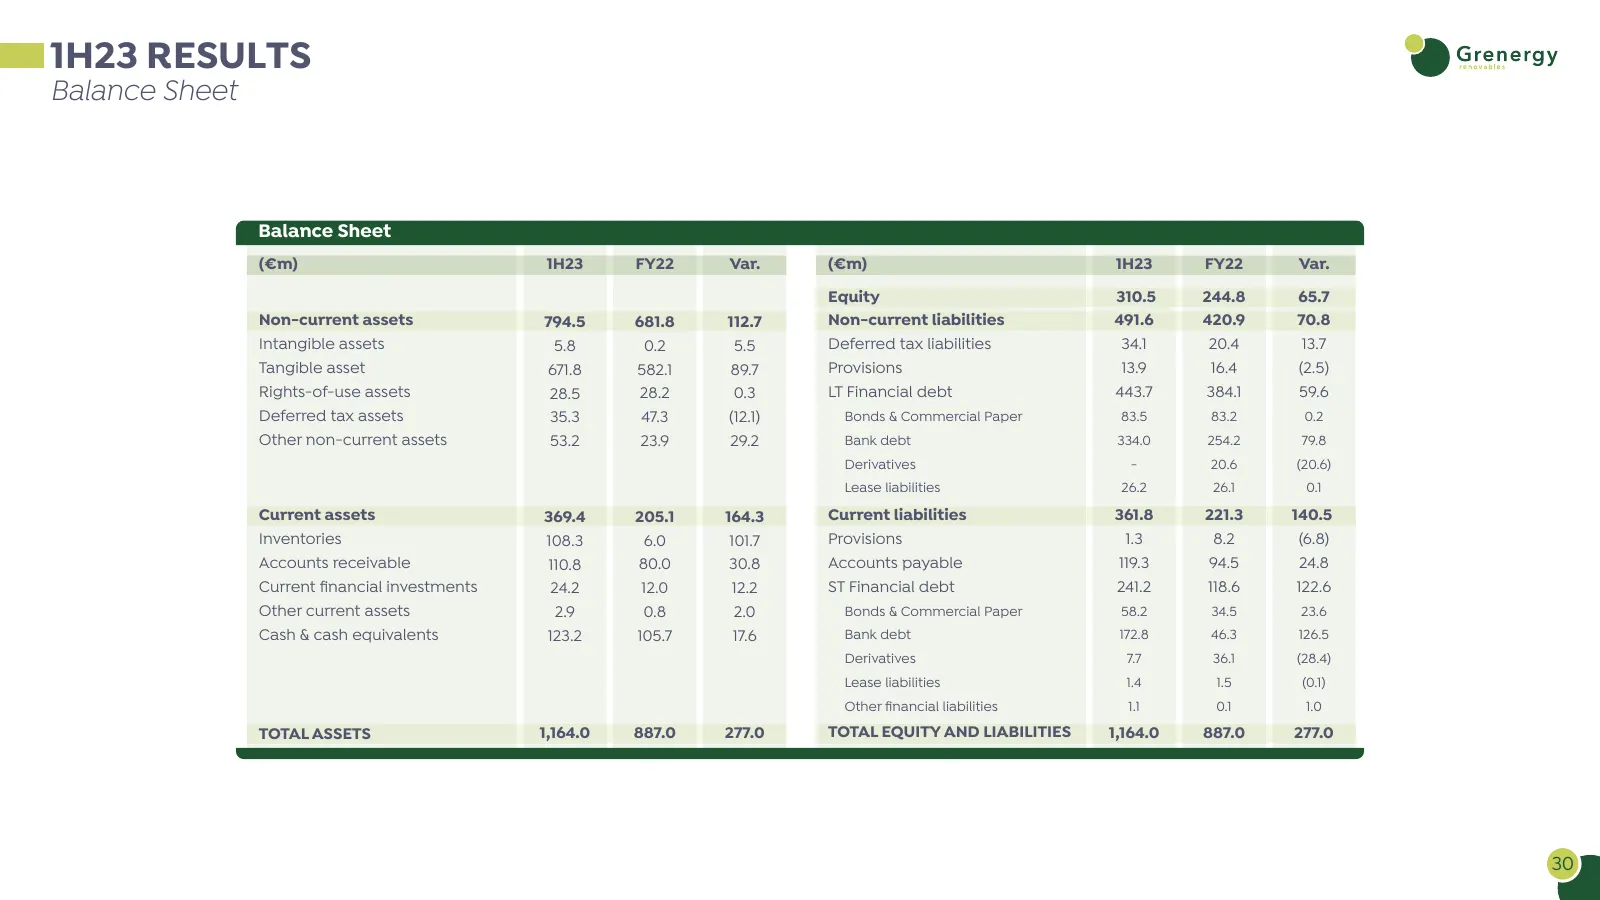
Slide 30: 1H23 results: balance sheet
1H23 RESULTS Balance Sheet Balance Sheet (€m) 1H23 FY22 Var. (€m) 1H23 FY22 Var. Equity 310.5 244.8 65.7 Non-current assets 794.5 681.8 112.7 Non-current liabilities 491.6 420.9 70.8 Intangible assets 5.8 0.2 5.5 Deferred tax liabilities 34.1 20.4 13.7 Tangible asset 671.8 582.1 89.7 Provisions 13.9
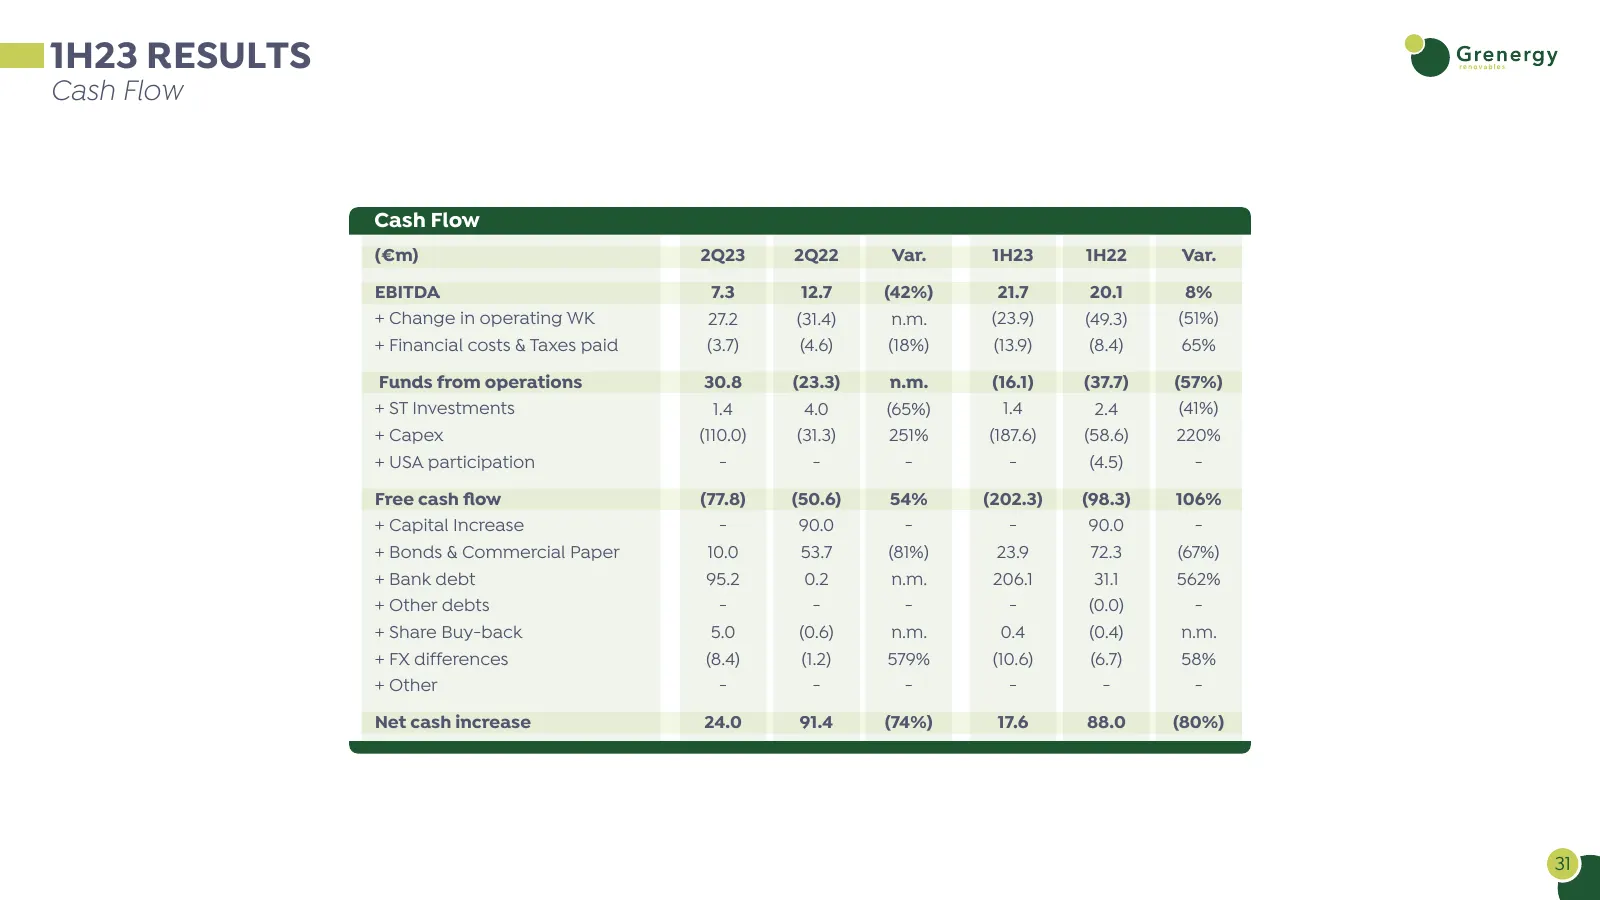
Slide 31: 1H23 results: cash flow
1H23 RESULTS Cash Flow Cash Flow (€m) 2Q23 2Q22 Var. 1H23 1H22 Var. EBITDA 7.3 12.7 (42%) 21.7 20.1 8% + Change in operating WK 27.2 (31.4) n.m. (23.9) (49.3) (51%) + Financial costs & Taxes paid (3.7) (4.6) (18%) (13.9) (8.4) 65% Funds from operations 30.8 (23.3) n.m. (16.1) (37.7) (57%) + ST Inves
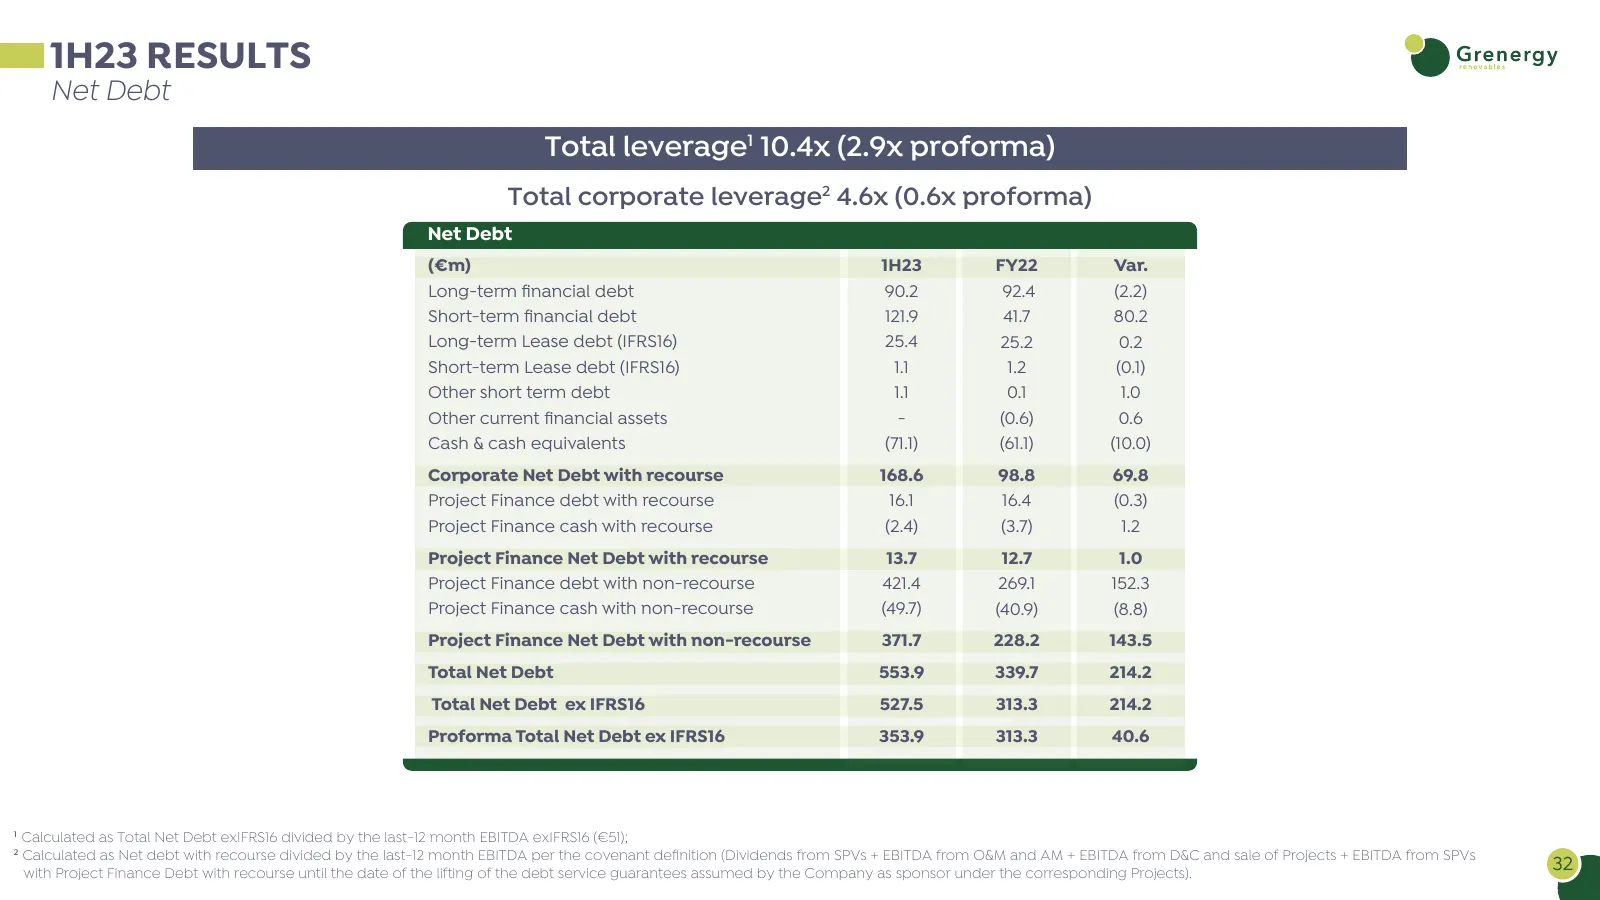
Slide 32: 1H23 results: net debt
1H23 RESULTS Net Debt Total leverage1 10.4x (2.9x proforma) Total corporate leverage2 4.6x (0.6x proforma) Net Debt (€m) 1H23 FY22 Var. Long-term financial debt 90.2 92.4 (2.2) Short-term financial debt 121.9 41.7 80.2 Long-term Lease debt (IFRS16) 25.4 25.2 0.2 Short-term Lease debt (IFRS16) 1.1 1.
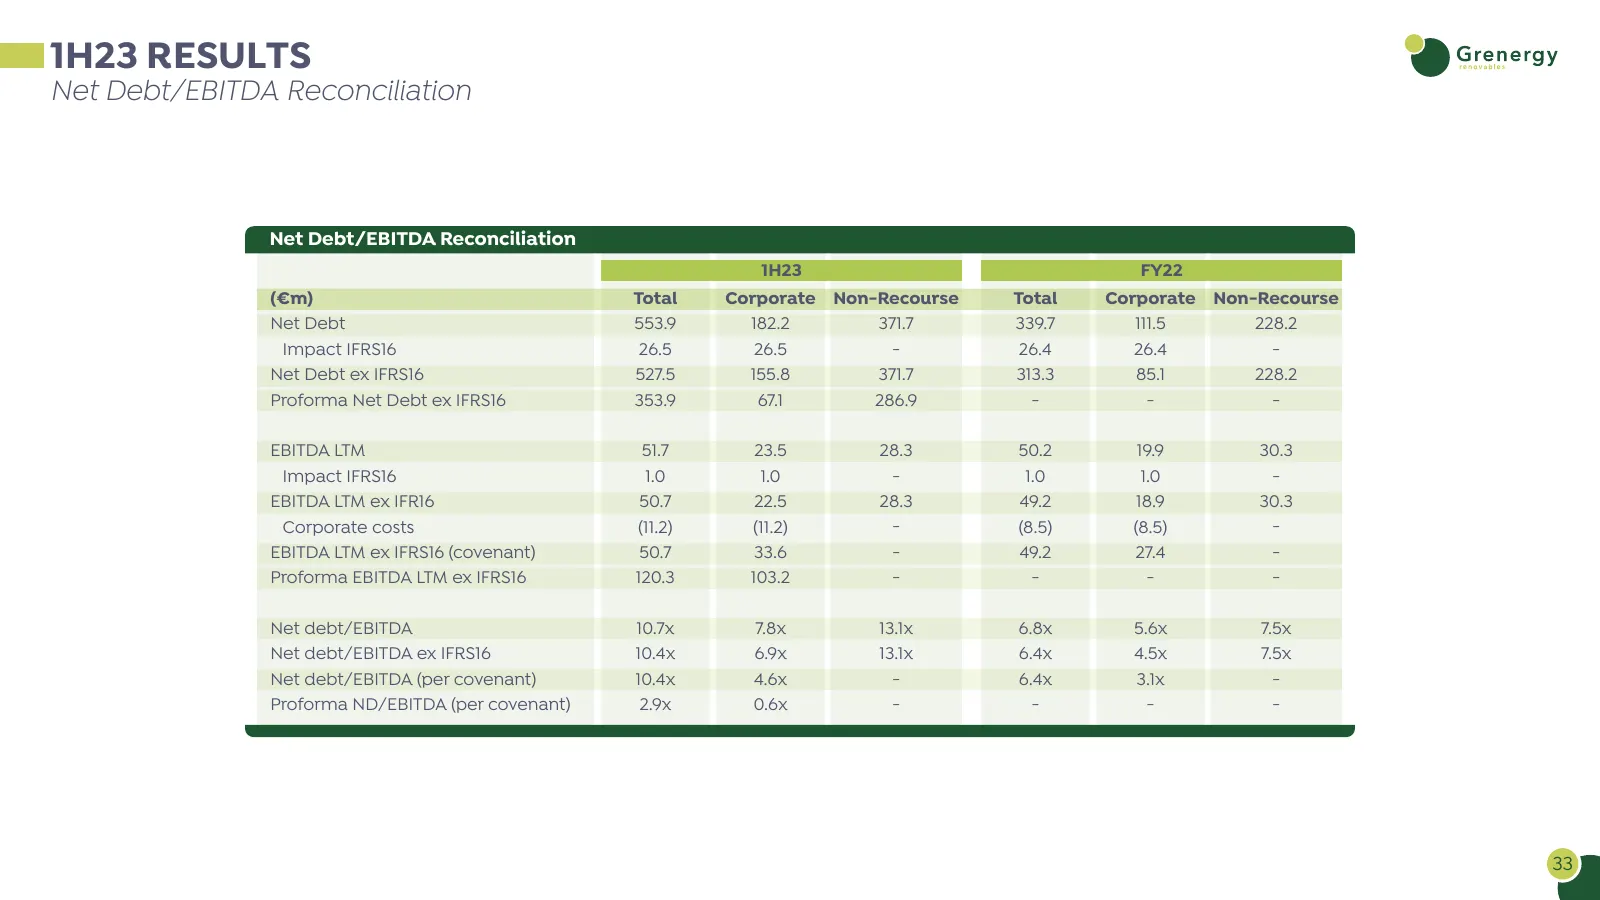
Slide 33: Net debt/EBITDA reconciliation
1H23 RESULTS Net Debt/EBITDA Reconciliation Net Debt/EBITDA Reconciliation 1H23 FY22 (€m) Total Corporate Non-Recourse Total Corporate Non-Recourse Net Debt 553.9 182.2 371.7 339.7 111.5 228.2 Impact IFRS16 26.5 26.5 - 26.4 26.4 - Net Debt ex IFRS16 527.5 155.8 371.7 313.3 85.1 228.2 Proforma Net De
Slide 34: Developers & IPP of solar PV, wind, storage projects
Developers & IPP of SOLAR PV - WIND - STORAGE PROJECTS Europe - USA - LATAM
Source: Internet Archive copy of grenergy.eu
More decks from Grenergy Renovables S.A
 H1 2026 Earnings Presentation38 slides · Sep 16, 2026
 Investor Presentation (September 2026)55 slides · September 2026
 Investor Presentation (July 2026)46 slides · July 2026
 Q1 2026 Earnings Presentation50 slides · May 27, 2026
 9M 2025 Earnings Presentation36 slides · Nov 27, 2025
 Investor Day (May 2025)50 slides · May 28, 2025