Axiall — Goldman Sachs Chemical Intensity Day March 2015
22 slides from Axiall's conference presentation, Mar 24, 2015
Slide 1: Goldman Sachs Chemical Intensity Day March 2015
Goldman Sachs Chemical Intensity Day March 2015
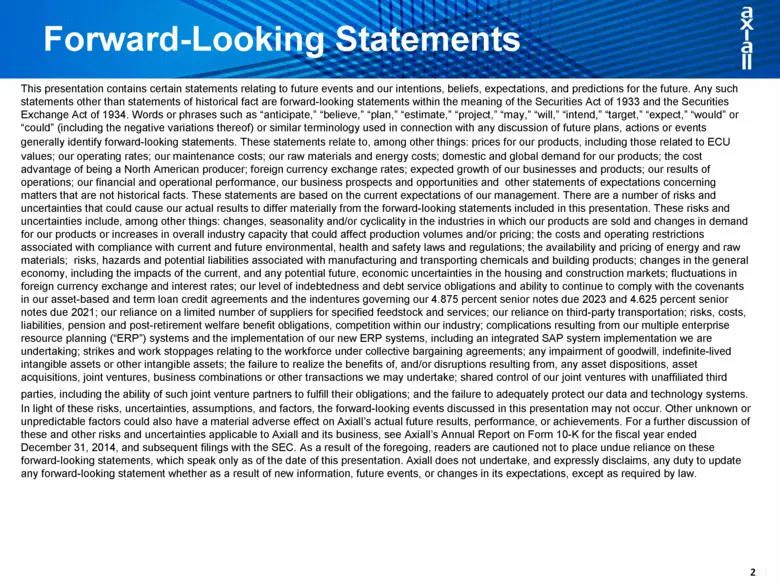
Slide 2: Forward-Looking Statements
Forward-Looking Statements This presentation contains certain statements relating to future events and our intentions, beliefs, expectations, and predictions for the future. Any such statements other than statements of historical fact are forward-looking statements within the meaning of the Securiti
Slide 3: Agenda
Agenda Axiall Overview Global Chlor-alkali and Vinyls Summary

Slide 4: Axiall Overview
- xo Axiall Overview
Slide 5: Scale + Integration + Global Cost Advantage = Opportunity for Axiall
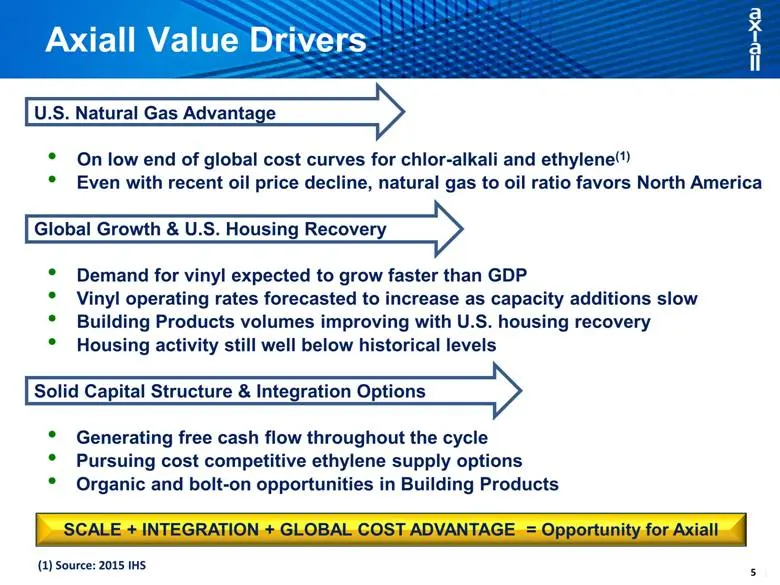
SCALE + INTEGRATION + GLOBAL COST ADVANTAGE = Opportunity for Axiall Axiall Value Drivers U.S. Natural Gas Advantage On low end of global cost curves for chlor-alkali and ethylene(1) Even with recent oil price decline, natural gas to oil ratio favors North America Global Growth & U.S. Housing Recove
Slide 6: Axiall 2014 Sales
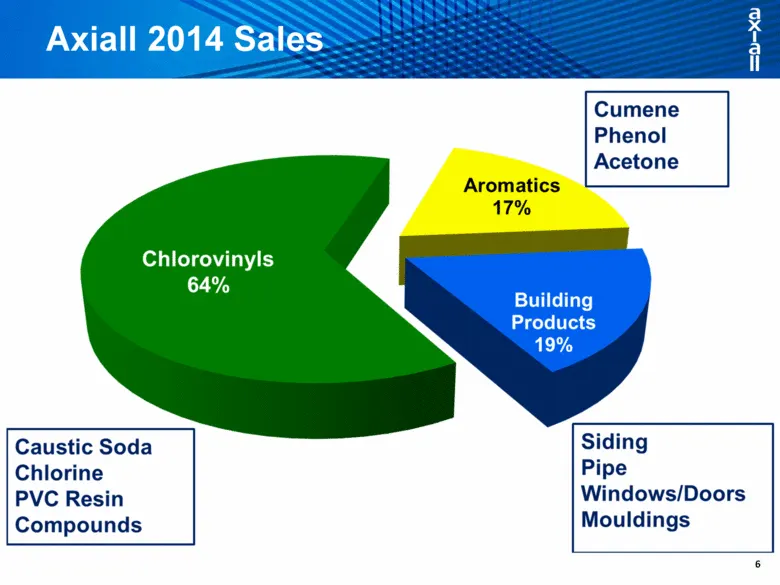
Axiall 2014 Sales Cumene Phenol Acetone Caustic Soda Chlorine PVC Resin Compounds Siding Pipe Windows/Doors Mouldings
Slide 7: Chlorovinyls – Building Products Integration
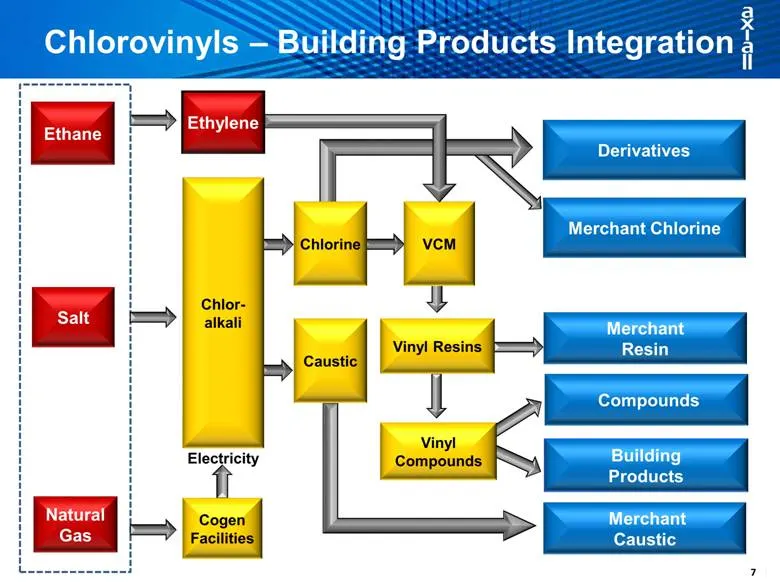
Chlorine Merchant Resin VCM Electricity Building Products Chlorovinyls – Building Products Integration Merchant Chlorine Merchant Caustic Salt Natural Gas Ethane Derivatives Compounds Caustic Chlor-alkali Ethylene Vinyl Resins Vinyl Compounds Cogen Facilities
Slide 8: North American Competitors and Capacity
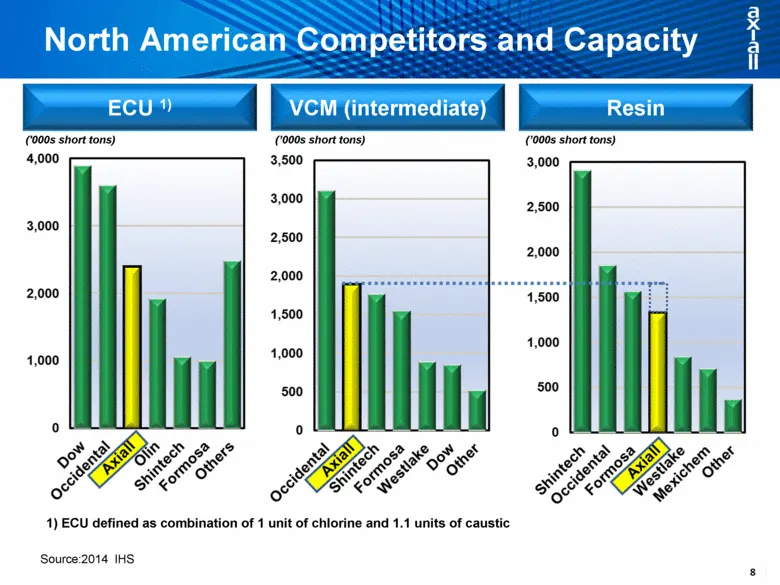
North American Competitors and Capacity ('000s short tons) ECU 1) VCM (intermediate) Resin (’000s short tons) (’000s short tons) Source:2014 IHS 1) ECU defined as combination of 1 unit of chlorine and 1.1 units of caustic
Slide 9: Diverse Product Portfolio Creates Optionality
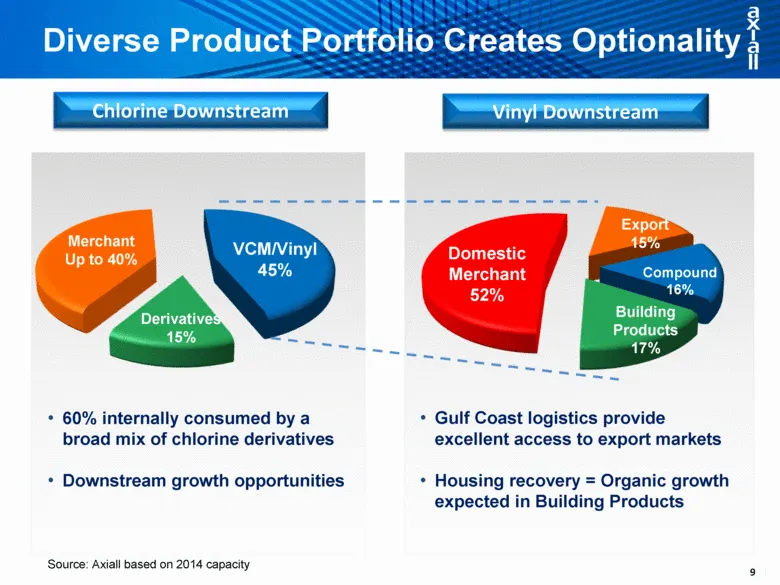
Diverse Product Portfolio Creates Optionality Chlorine Downstream Vinyl Downstream 60% internally consumed by a broad mix of chlorine derivatives Downstream growth opportunities Gulf Coast logistics provide excellent access to export markets Housing recovery = Organic growth expected in Building Pro
Slide 10: Building Products Sales Mix & Drivers
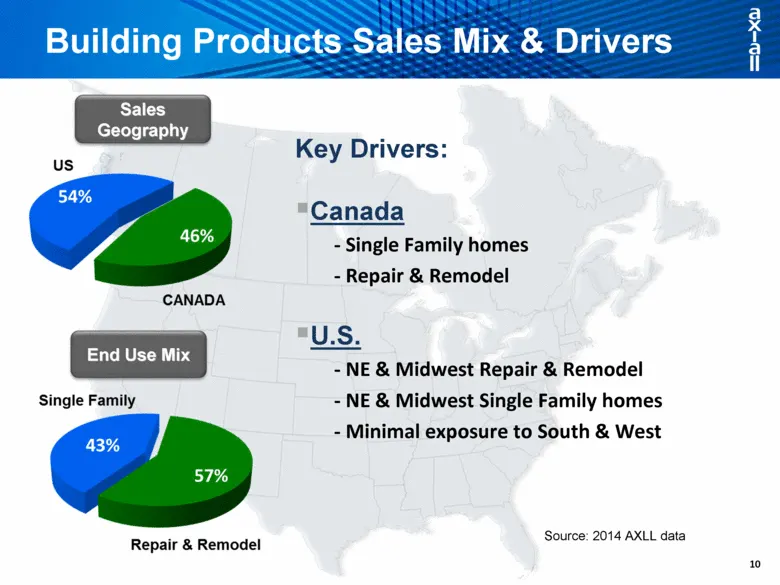
Building Products Sales Mix & Drivers Key Drivers: Canada - Single Family homes - Repair & Remodel U.S. - NE & Midwest Repair & Remodel - NE & Midwest Single Family homes - Minimal exposure to South & West End Use Mix Sales Geography Source: 2014 AXLL data
Slide 11: Building Products Portfolio
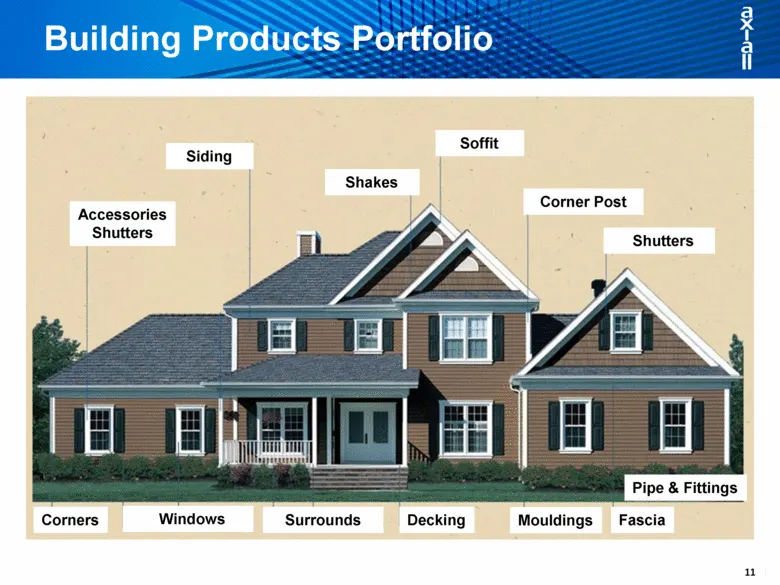
Accessories Shutters Columns Siding Shakes Soffit Corner Post Shutters Corners Windows Surrounds Decking Mouldings Fascia Building Products Portfolio Pipe & Fittings
Slide 12: Aromatics
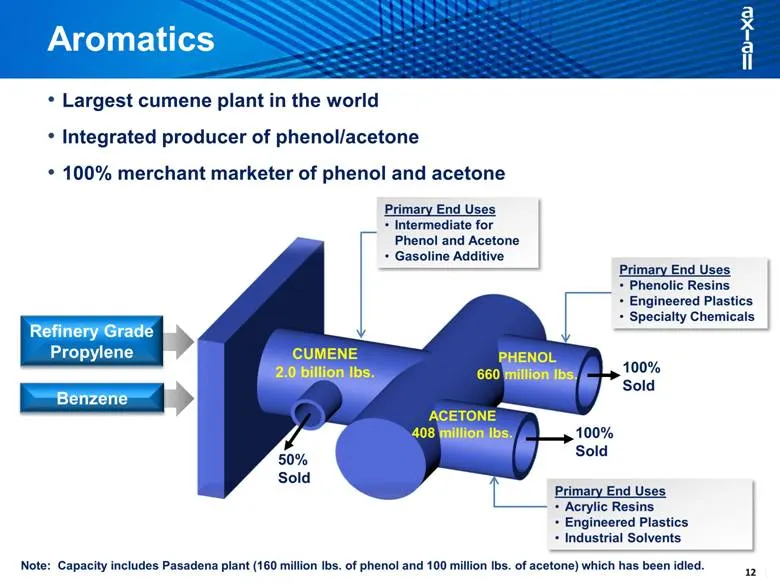
CUMENE 2.0 billion lbs. PHENOL 660 million lbs. ACETONE 408 million lbs. 100% Sold 50% Sold 100% Sold Largest cumene plant in the world Integrated producer of phenol/acetone 100% merchant marketer of phenol and acetone Note: Capacity includes Pasadena plant (160 million lbs. of phenol and 100 millio
Slide 13: Global Chlor-alkali and Vinyls
Global Chlor-alkali and Vinyls
Slide 14: Axiall 3rd Largest Global ECU Player
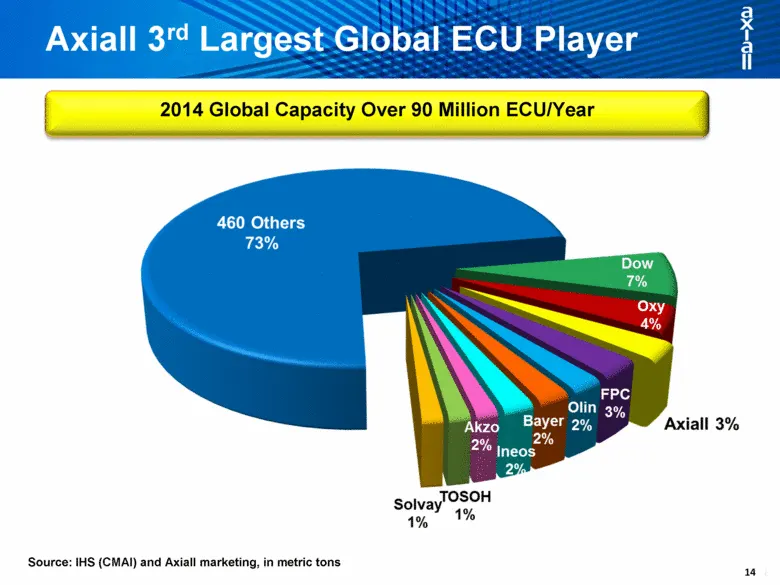
Axiall 3rd Largest Global ECU Player 2014 Global Capacity Over 90 Million ECU/Year Source: IHS (CMAI) and Axiall marketing, in metric tons
Slide 15: Global Chlor-Alkali Manufacturing Costs
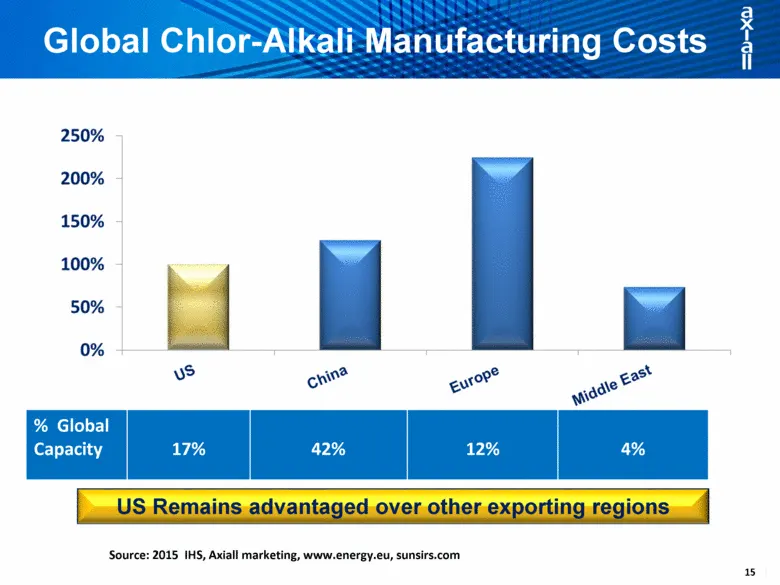
Global Chlor-Alkali Manufacturing Costs Source: 2015 IHS, Axiall marketing, www.energy.eu, sunsirs.com % Global Capacity 17% 42% 12% 4% US Remains advantaged over other exporting regions
Slide 16: Chlor-alkali Capacity Growth < Demand
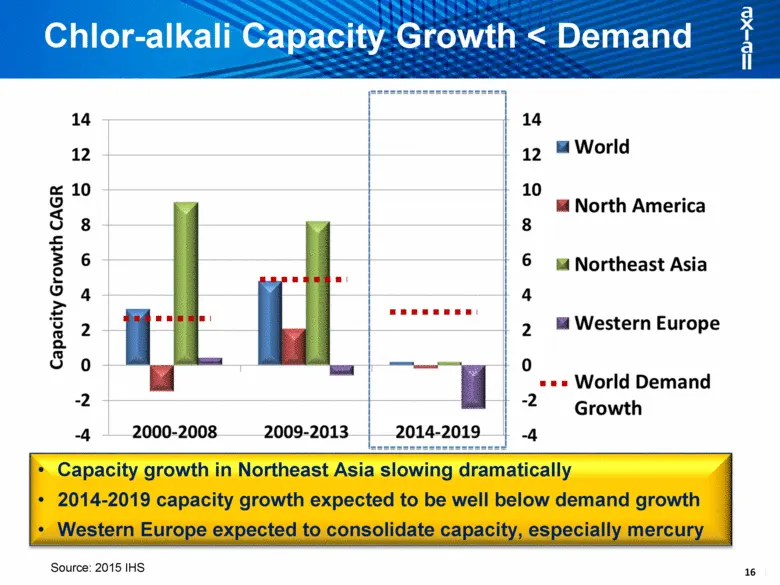
Chlor-alkali Capacity Growth < Demand Capacity growth in Northeast Asia slowing dramatically 2014-2019 capacity growth expected to be well below demand growth Western Europe expected to consolidate capacity, especially mercury Source: 2015 IHS
Slide 17: Chlorine Operating Rates Have Bottomed
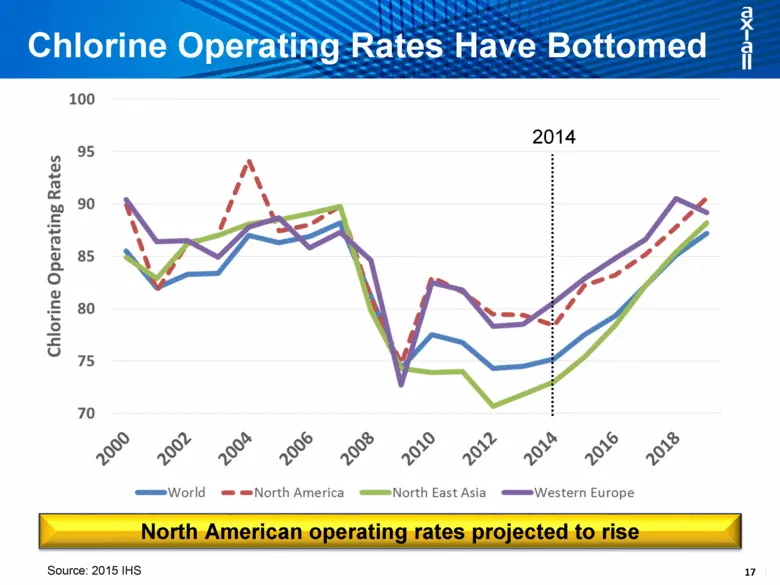
Chlorine Operating Rates Have Bottomed Source: 2015 IHS 2014 North American operating rates projected to rise
Slide 18: PVC Per Capita Consumption
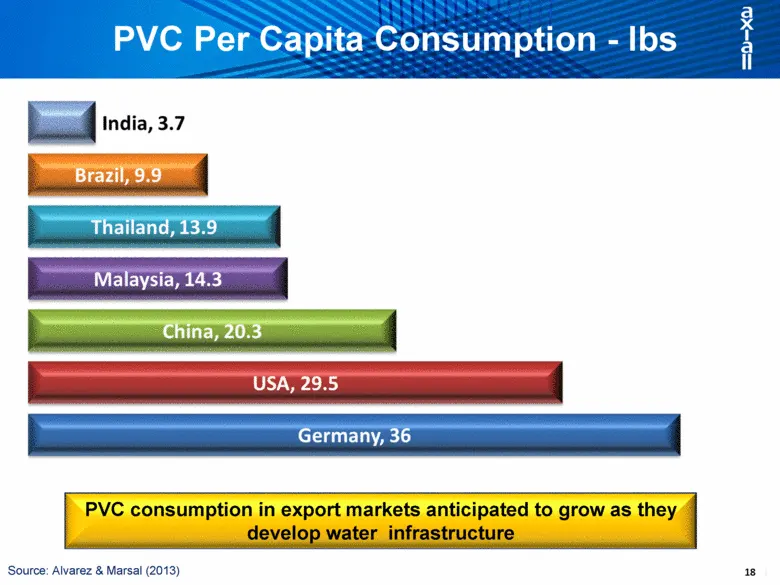
Source: Alvarez & Marsal (2013) PVC Per Capita Consumption - lbs PVC consumption in export markets anticipated to grow as they develop water infrastructure
Slide 19: PVC Capacity Growth Now < Demand
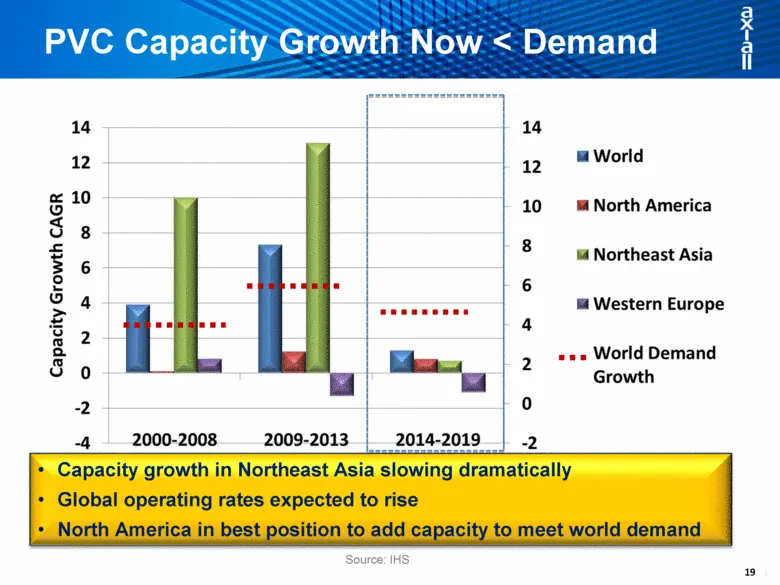
PVC Capacity Growth Now < Demand Capacity growth in Northeast Asia slowing dramatically Global operating rates expected to rise North America in best position to add capacity to meet world demand Source: IHS
Slide 20: PVC Operating Rates Have also Bottomed
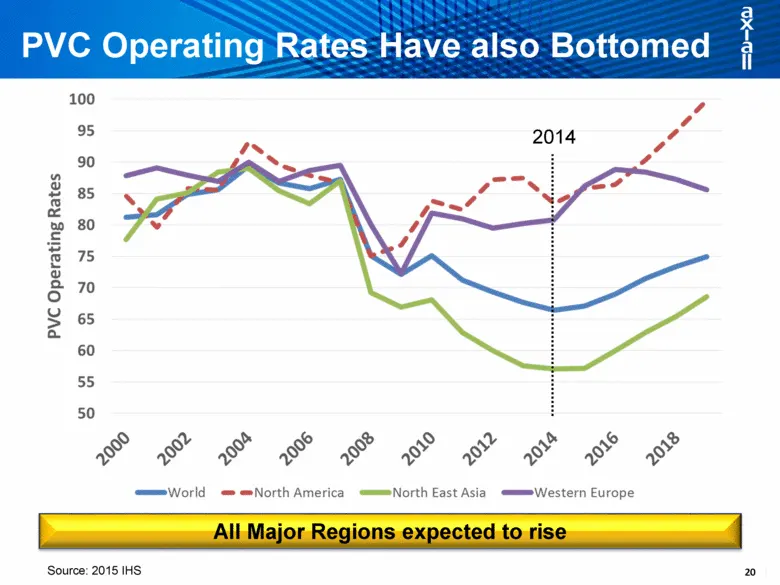
PVC Operating Rates Have also Bottomed Source: 2015 IHS 2014 All Major Regions expected to rise
Slide 21: Scale + Integration + Global Cost Advantage = Opportunity for Axiall
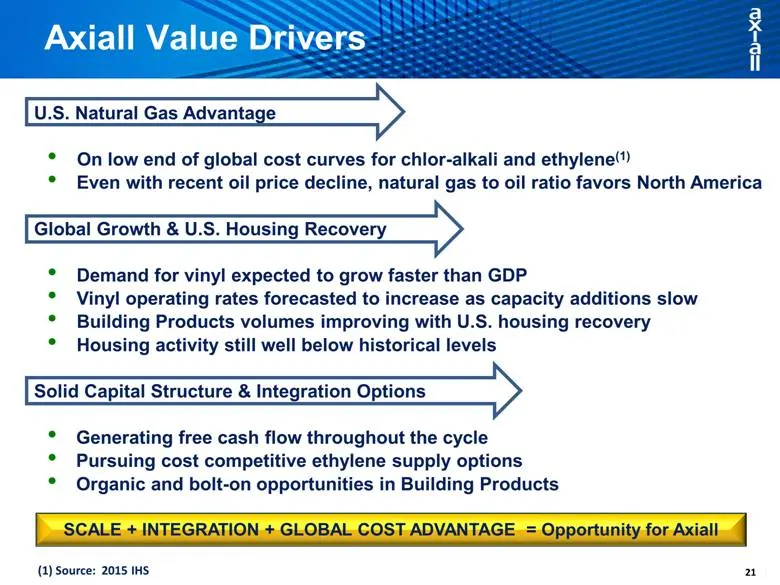
SCALE + INTEGRATION + GLOBAL COST ADVANTAGE = Opportunity for Axiall Axiall Value Drivers U.S. Natural Gas Advantage On low end of global cost curves for chlor-alkali and ethylene(1) Even with recent oil price decline, natural gas to oil ratio favors North America Global Growth & U.S. Housing Recove

Slide 22: Q&A
ox-0= Q&A
Source: SEC EDGAR · 8-K filed Mar 24, 2015