Burlington Resources — A.G. Edwards' Energy Conference (March 2006)
52 slides from Burlington Resources's conference presentation, Mar 14, 2006
Slide 1: A.G. Edwards' Energy Conference
A.G. Edwards' Energy Conference Boston, Massachusetts John Carrig EVP, Finance and CFO March 14, 2006 CAUTIONARY STATEMENT Statement Regarding Potential Acquisition Business Environment WTI Oil Price Henry Hub Natural Gas Price Gulf Coast Crack Spread Refining Capacity Utilization General Energy Mar
Slide 2: Cautionary Statement
CAUTIONARY STATEMENT FOR THE PURPOSES OF THE "SAFE HARBOR" PROVISIONS OF THE PRIVATE SECURITIES LITIGATION REFORM ACT OF 1995 The following presentation includes forward-looking statements within the meaning of Section 27A of the Securities Act of 1933, as amended, and Section 21E of the Securities
Slide 3: Statement Regarding Potential Acquisition of Burlington Resources
Statement Regarding Potential Acquisition of Burlington Resources Inc. ConocoPhillips has filed a Form S-4, Burlington Resources has filed a proxy statement and both companies will file other relevant documents concerning the proposed merger transaction with the Securities and Exchange Commission (S
Slide 4: Business Environment
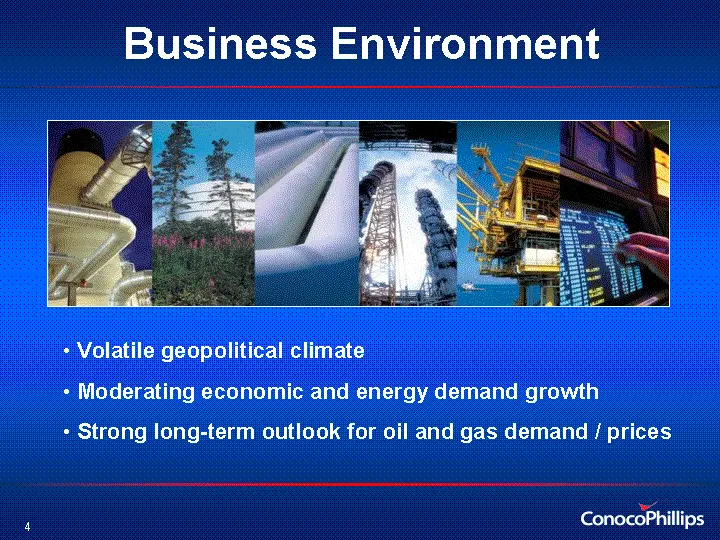
Business Environment Volatile geopolitical climate Moderating economic and energy demand growth Strong long-term outlook for oil and gas demand / prices Strong long-term outlook for oil and gas demand / prices Strong long-term outlook for oil and gas demand / prices Strong long-term outlook for oil
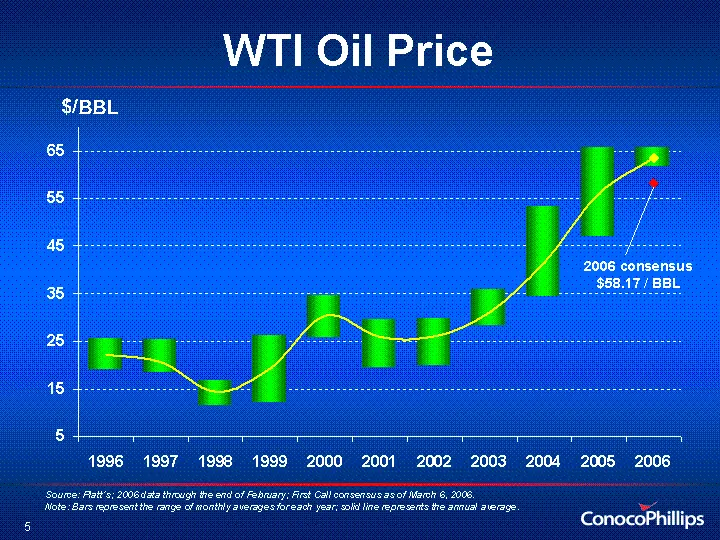
Slide 5: WTI Oil Price
1995 1996 1997 1998 1999 2000 2001 2002 2003 2004 2005 2006 Low Avg 17.3003 18.8012 18.2998 11.2945 11.9982 25.7837 19.2705 19.6795 28.1429 34.2403 46.829 61.5708 Hi Avg 19.8832 25.4076 25.1295 16.6885 26.1074 34.3968 29.5624 29.705 35.7526 53.239 65.5164 65.4645 float 2.5829 6.6064 6.8297 5.394 14.
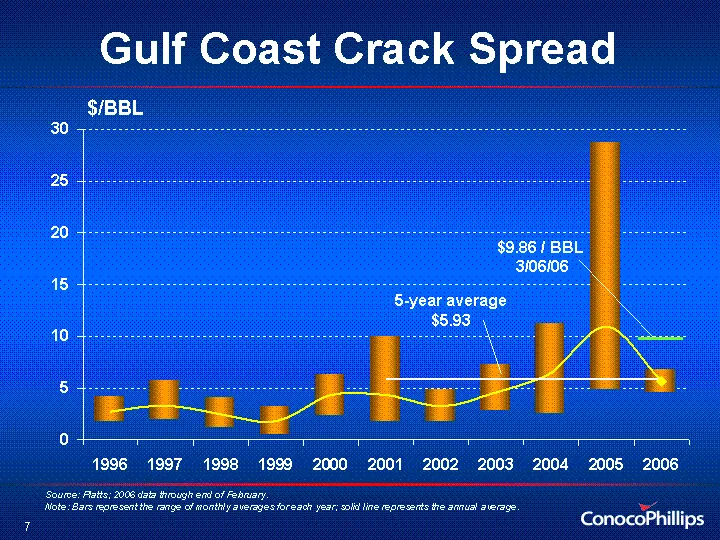
Slide 6: Gulf Coast Crack Spread
Gulf Coast Crack Spread 1995 1996 1997 1998 1999 2000 2001 2002 2003 2004 2005 2006 Low Avg 1.337934 1.665932 1.931404 1.126524 0.482058 2.273954 1.6998 1.66434 2.793094 2.511088 4.81632 4.527246 Hi Avg 4.882824 4.097088 5.596254 4.0527 3.099088 6.20875 9.908264 4.764028 7.23531 11.10595 28.705602 6
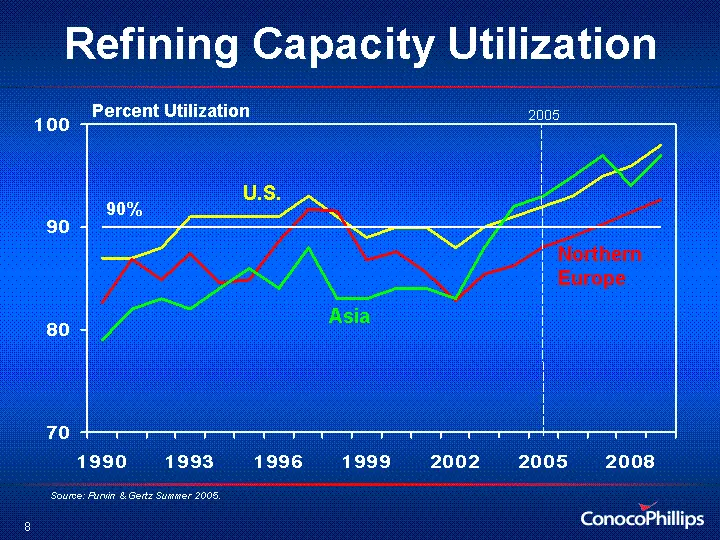
Slide 7: Refining Capacity Utilization
Refining Capacity Utilization Source: Purvin & Gertz Summer 2005. 1985 1986 1987 1988 1989 1990 1991 1992 1993 1994 1995 1996 1997 1998 1999 2000 2001 2002 2003 2004 2005 2006 2007 2008 2009 2010 2011 2012 2013 2014 2015 2016 2017 2018 2019 2020 US 81 82 83 86 87 87 87 88 91 91 91 91 93 91 89 90 90
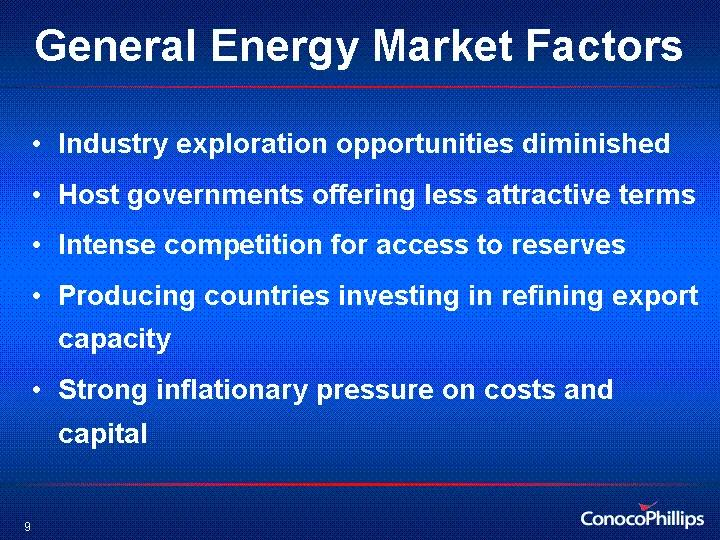
Slide 8: General Energy Market Factors
General Energy Market Factors Industry exploration opportunities diminished Host governments offering less attractive terms Intense competition for access to reserves Producing countries investing in refining export capacity Strong inflationary pressure on costs and capital
Slide 9: Meeting the Energy Challenge
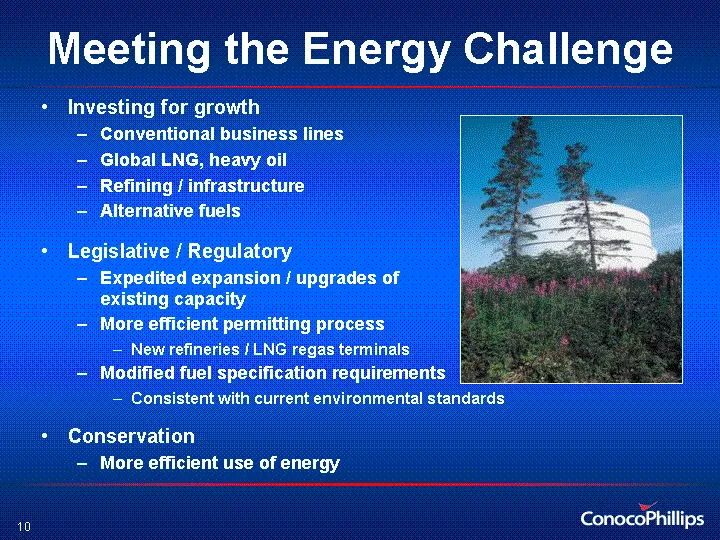
Meeting the Energy Challenge Investing for growth Conventional business lines Global LNG, heavy oil Refining / infrastructure Alternative fuels Legislative / Regulatory Expedited expansion / upgrades of existing capacity More efficient permitting process New refineries / LNG regas terminals Modified
Slide 10: 2005 Highlights
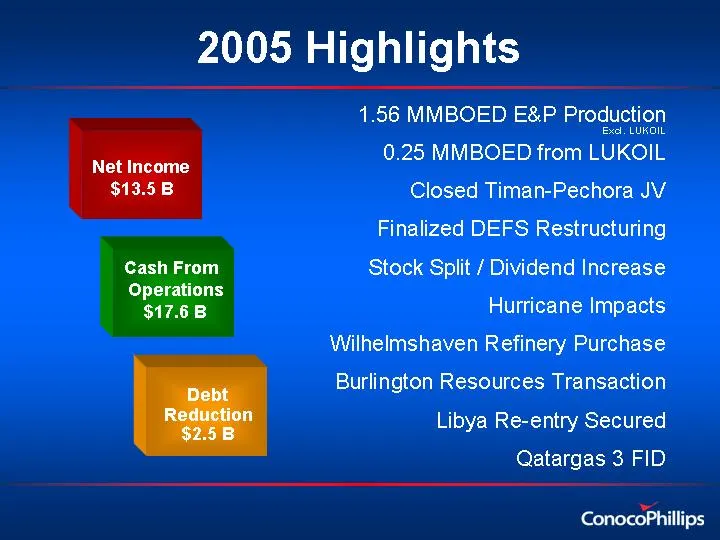
2005 Highlights Cash From Operations $17.6 B Debt Reduction $2.5 B 1.56 MMBOED E&P Production 0.25 MMBOED from LUKOIL Closed Timan-Pechora JV Finalized DEFS Restructuring Stock Split / Dividend Increase Hurricane Impacts Wilhelmshaven Refinery Purchase Burlington Resources Transaction Libya Re-entry
Slide 11: Return on Capital Employed
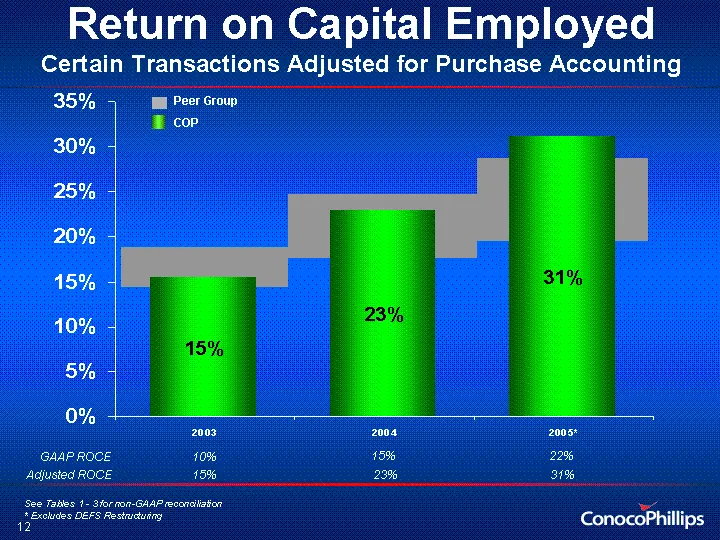
Return on Capital Employed Certain Transactions Adjusted for Purchase Accounting See Tables 1 - 3 for non-GAAP reconciliation * Excludes DEFS Restructuring GAAP ROCE Adjusted ROCE 10% 15% 15% 23% Peer Group COP 22% 31% 2003 2004 2005* East West 0.154 0.229 0.311
Slide 12: Cash Use Comparison
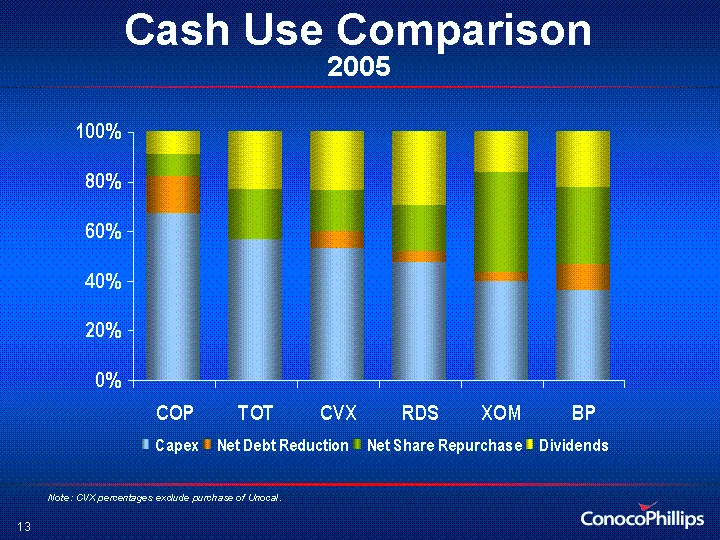
Cash Use Comparison 2005 COP TOT CVX RDS XOM BP Capex 11620 11356 8701 17121 17699 13085 Net Debt Reduction 2550 1055 1555 1502 3802 Net Share Repurchase 1522 4037 2737 6639 17961 11315 Dividends 1639 4662 3876 10849 7478 8186 Note: CVX percentages exclude purchase of Unocal.
Slide 13: Burlington Update
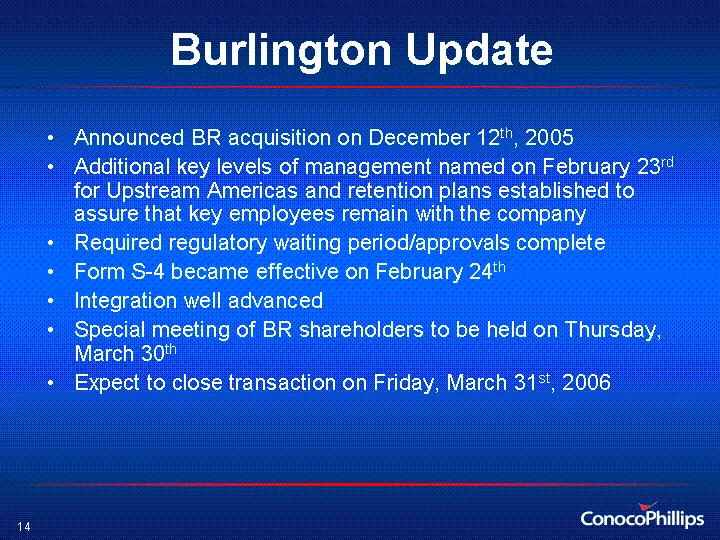
Burlington Update Announced BR acquisition on December 12th, 2005 Additional key levels of management named on February 23rd for Upstream Americas and retention plans established to assure that key employees remain with the company Required regulatory waiting period/approvals complete Form S-4 becam
Slide 14: Corporate Strategy
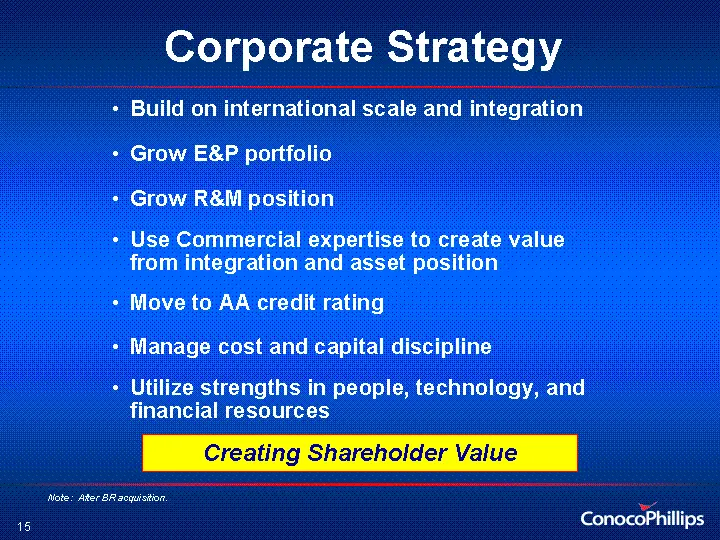
Corporate Strategy Build on international scale and integration Grow E&P portfolio Grow R&M position Use Commercial expertise to create value from integration and asset position Move to AA credit rating Manage cost and capital discipline Utilize strengths in people, technology, and financial resourc
Slide 15: Strategic Objectives
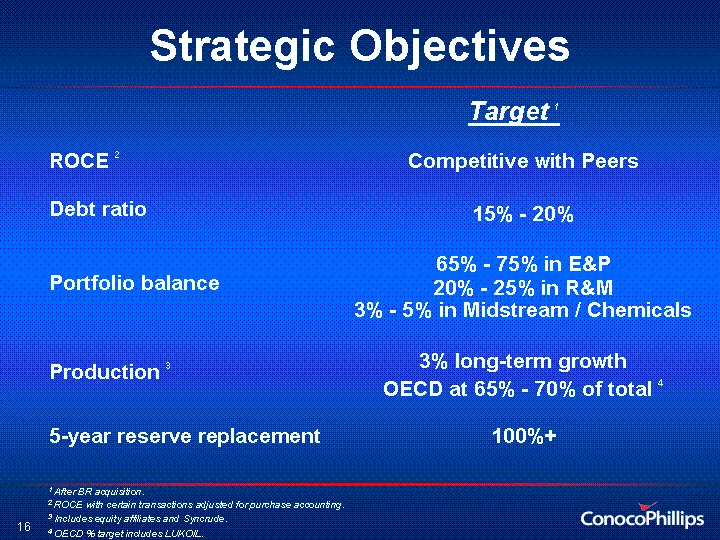
Strategic Objectives Target 1 Target 1 ROCE 2 ROCE 2 Competitive with Peers Debt ratio Debt ratio 15% - 20% Portfolio balance Portfolio balance 65% - 75% in E&P 20% - 25% in R&M 3% - 5% in Midstream / Chemicals Production 3 Production 3 3% long-term growth OECD at 65% - 70% of total 4 5-year reserve
Slide 16: E&P Strategy and Objectives
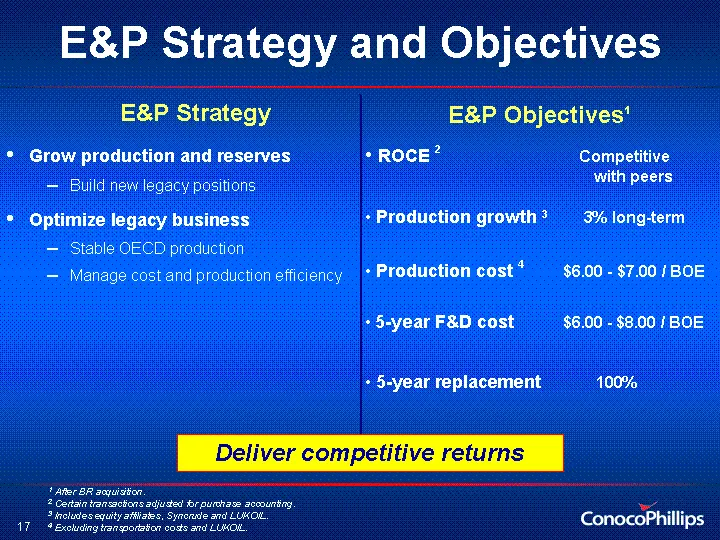
E&P Strategy and Objectives E&P Objectives1 ROCE 2 Competitive with peers Production growth 3 3% long-term Production cost 4 $6.00 - $7.00 / BOE 5-year F&D cost $6.00 - $8.00 / BOE 5-year replacement 100% Grow production and reserves Build new legacy positions Optimize legacy business Stable OECD pr
Slide 17: E&P ROCE
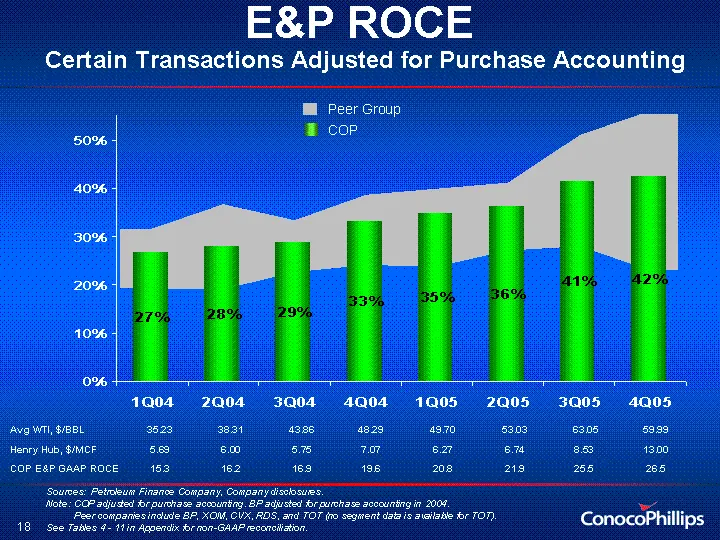
E&P ROCE Certain Transactions Adjusted for Purchase Accounting Sources: Petroleum Finance Company, Company disclosures. Note: COP adjusted for purchase accounting. BP adjusted for purchase accounting in 2004. Peer companies include BP, XOM, CVX, RDS, and TOT (no segment data is available for TOT). S
Slide 18: Near-Term Capital Cost Pressures
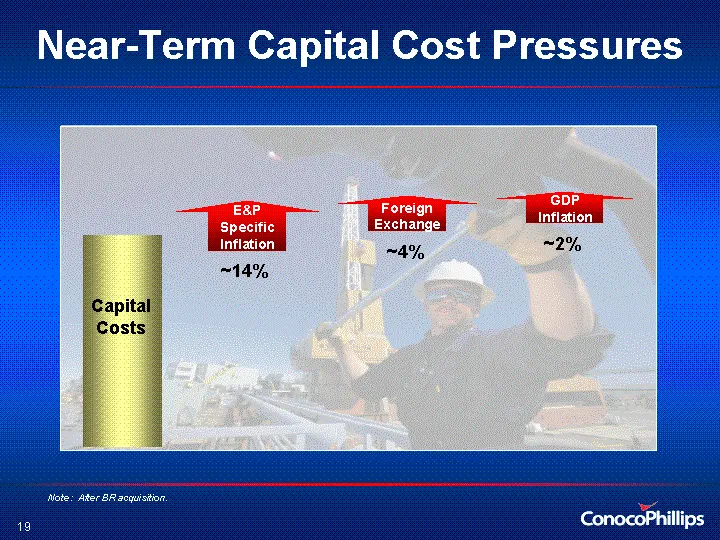
GDP Inflation Near-Term Capital Cost Pressures Foreign Exchange E&P Specific Inflation ~14% ~4% ~2% Capital Costs Note: After BR acquisition.
Slide 19: Investing in Growth
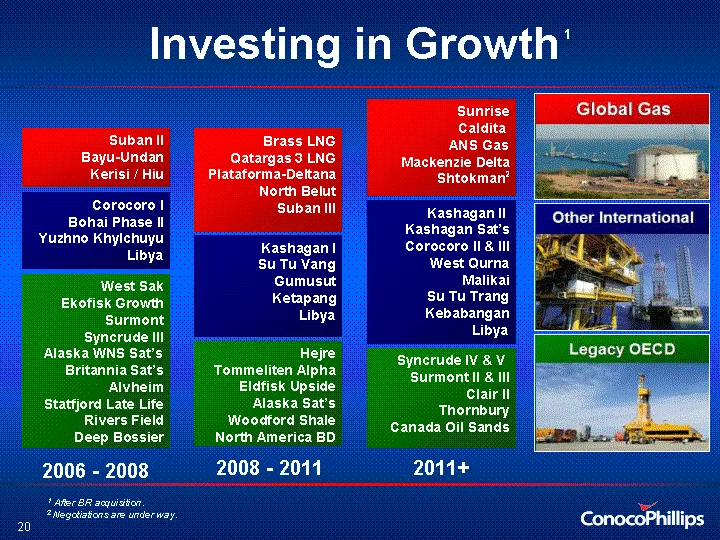
Investing in Growth 1 Investing in Growth 1 Investing in Growth 1 Investing in Growth 1 West Sak Ekofisk Growth Surmont Syncrude III Alaska WNS Sat's Britannia Sat's Alvheim Statfjord Late Life Rivers Field Deep Bossier Corocoro I Bohai Phase II Yuzhno Khylchuyu Libya Suban II Bayu-Undan Kerisi / Hi
Slide 20: Major U.S. Gas Supplier
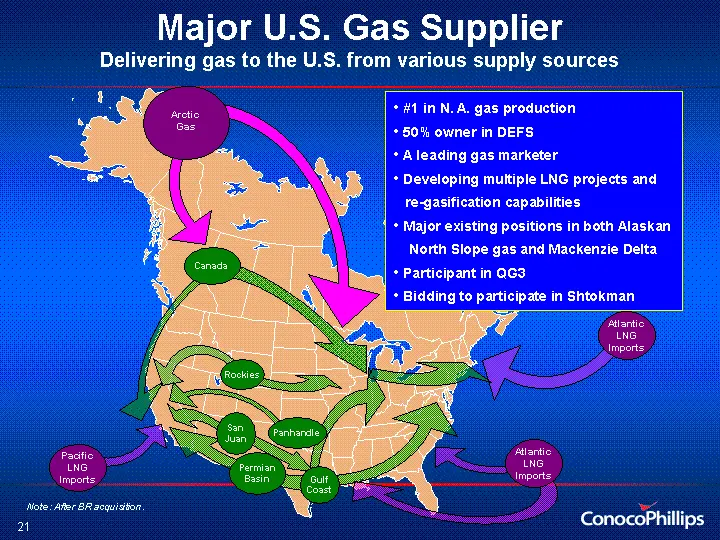
Major U.S. Gas Supplier Delivering gas to the U.S. from various supply sources Canada Permian Basin Rockies Pacific LNG Imports Atlantic LNG Imports Atlantic LNG Imports #1 in N. A. gas production 50% owner in DEFS A leading gas marketer Developing multiple LNG projects and re-gasification capabilit
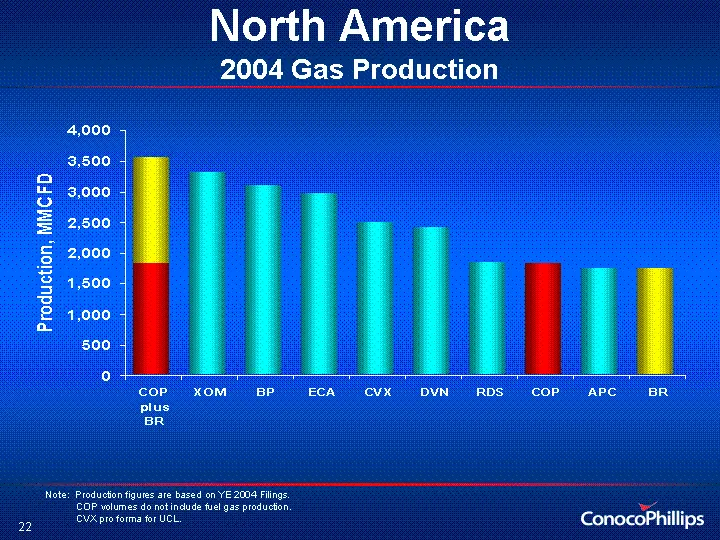
Slide 21: North America 2004 Gas Production
COP plus BR XOM BP ECA CVX DVN RDS COP APC BR U.S. 1821 2214 2749 869 2350 1649 1331 1388 1363 908 Canada 1727 1093 349 2099 130 764 500 433 378 819 Total 1821 3307 3098 2968 2480 2413 1831 1821 1741 1727 1727 Note: Production figures are based on YE 2004 Filings. COP volumes do not include fuel gas
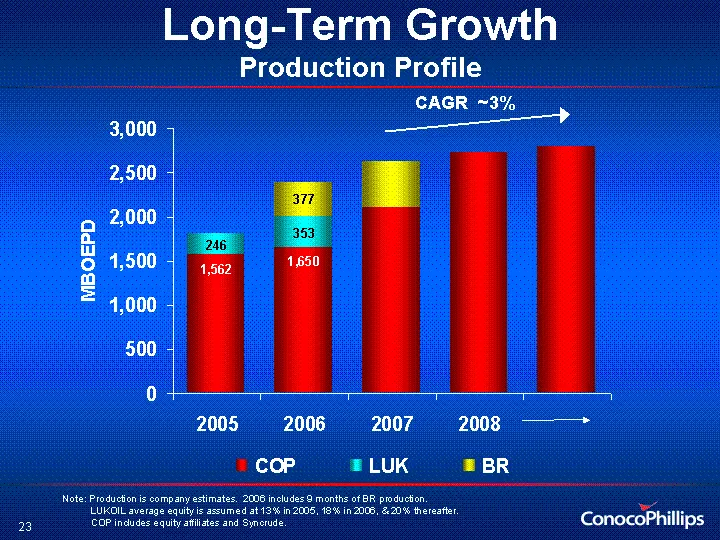
Slide 22: Long-Term Growth Production Profile
2005 2006 2007 2008 COP 1562 1650 2105 2718 2800 LUK 246 353 0 BR 0 377 515 GR Long-Term Growth Production Profile CAGR ~3% Note: Production is company estimates. 2006 includes 9 months of BR production. LUKOIL average equity is assumed at 13% in 2005, 18% in 2006, & 20% thereafter. COP includes equ
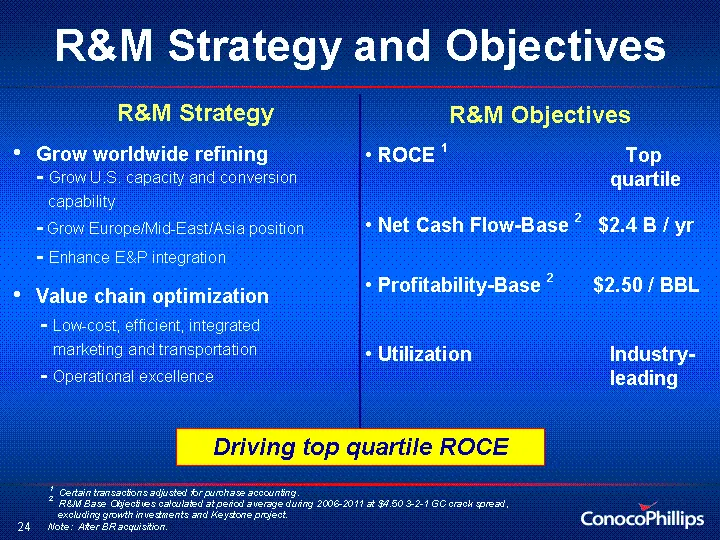
Slide 23: R&M Strategy and Objectives
R&M Strategy and Objectives 1 Certain transactions adjusted for purchase accounting. 2 R&M Base Objectives calculated at period average during 2006-2011 at $4.50 3-2-1 GC crack spread, excluding growth investments and Keystone project. R&M Objectives ROCE 1 Top quartile Net Cash Flow-Base 2 $2.4 B /
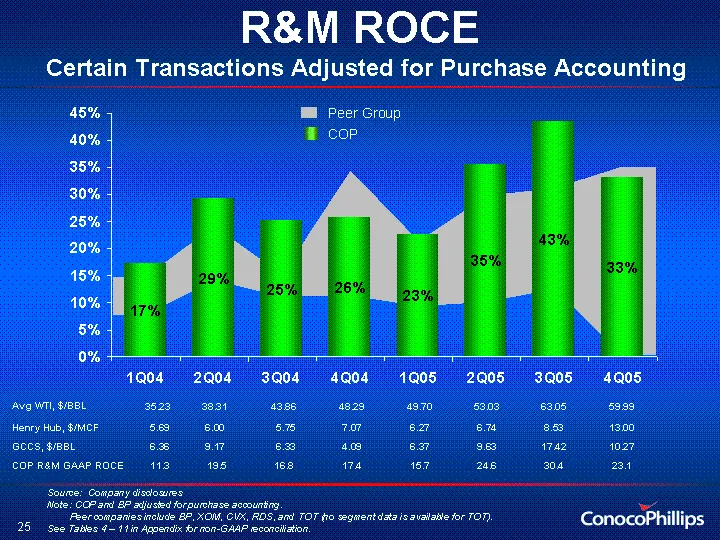
Slide 24: R&M ROCE
Peer Group COP Avg WTI, $/BBL 35.23 38.31 43.86 48.29 49.70 53.03 63.05 59.99 Henry Hub, $/MCF 5.69 6.00 5.75 7.07 6.27 6.74 8.53 13.00 GCCS, $/BBL 6.36 9.17 6.33 4.09 6.37 9.63 17.42 10.27 COP R&M GAAP ROCE 11.3 19.5 16.8 17.4 15.7 24.6 30.4 23.1 Source: Company disclosures Note: COP and BP adjuste
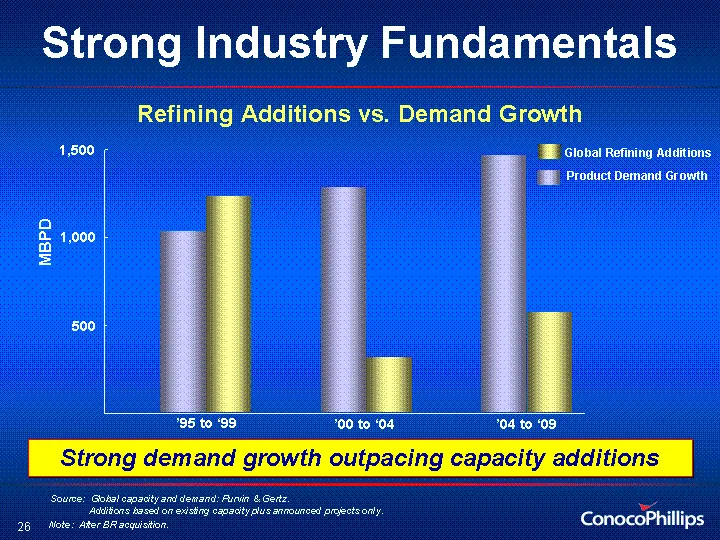
Slide 25: Strong Industry Fundamentals
Average Annual Growth in '000s bpd '95 to '99 '00 to '04 '05 to '09 Demand Growth (000's bpd) 1032 1285 1464 Capacity Growth (000's bpd) 1233 312 573 Strong Industry Fundamentals Source: Global capacity and demand: Purvin & Gertz. Additions based on existing capacity plus announced projects only. MB
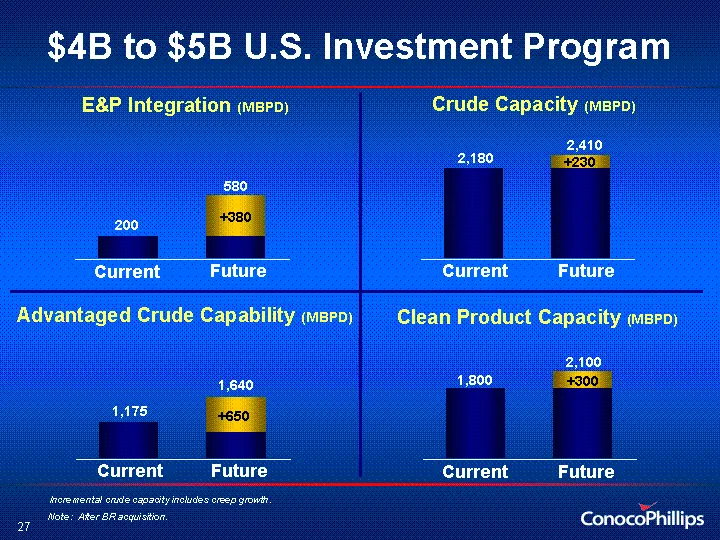
Slide 26: $4B to $5B U.S. Investment Program
$4B to $5B U.S. Investment Program 2005 2011 Crude Capacity 2182 2182 LRP Growth 230 2,410 Crude Capacity (MBPD) Current Future Clean Product Capacity (MBPD) Advantaged Crude Capability (MBPD) 2005 2011 Crude Capacity 1175 990 LRP Growth 650 +650 Current Future 2005 2011 Clean Product 1800 1800 LRP
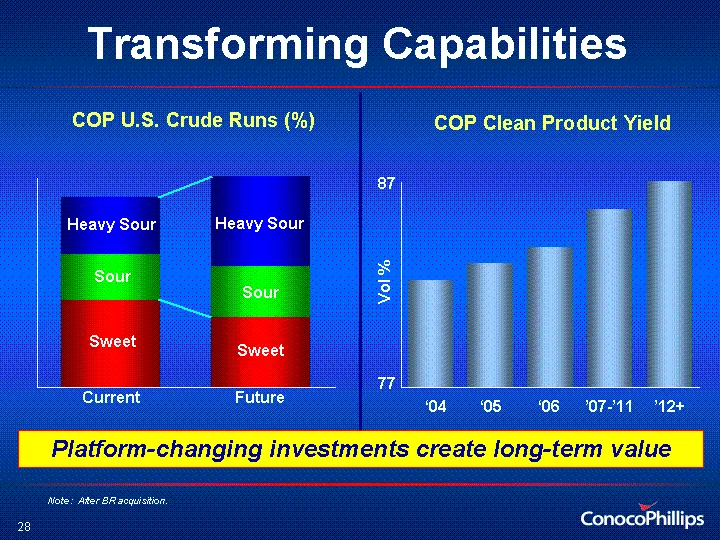
Slide 27: Transforming Capabilities
Current Future Sweet 995.2 0.4 798.6 0.33 Heavy Sour Sweet Sweet Current Future Heavy Sour Sour Sour Transforming Capabilities COP U.S. Crude Runs (%) COP Clean Product Yield '04 '05 '06 '07 to '11 '12 82.2 83 83.8 85.68 87 Vol % '04 '05 '07-'11 '06 77 87 Platform-changing investments create long-te
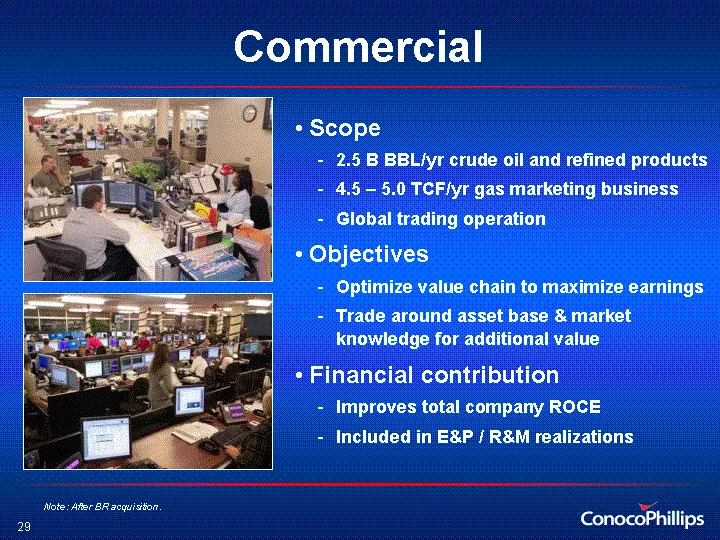
Slide 28: Commercial
Commercial Commercial Scope 2.5 B BBL/yr crude oil and refined products 4.5 - 5.0 TCF/yr gas marketing business Global trading operation Objectives Optimize value chain to maximize earnings Trade around asset base & market knowledge for additional value Financial contribution Improves total company
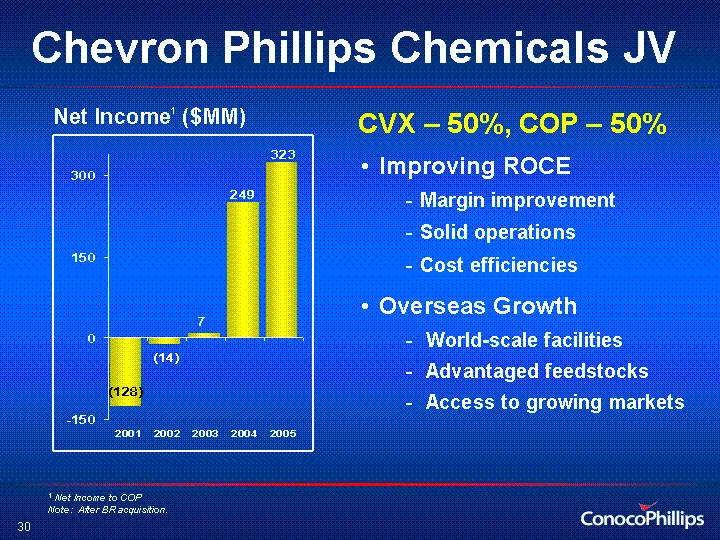
Slide 29: Chevron Phillips Chemicals JV
Chevron Phillips Chemicals JV CVX - 50%, COP - 50% Improving ROCE Margin improvement Solid operations Cost efficiencies Overseas Growth World-scale facilities Advantaged feedstocks Access to growing markets 2001 2002 2003 2004 2005 Net Operating Income -128 -14 7 249 323 196 Net Income1 ($MM) 1 Net
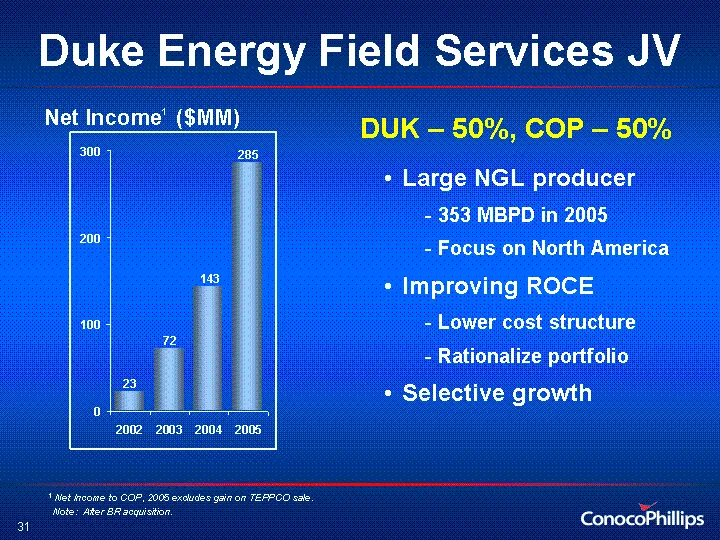
Slide 30: Duke Energy Field Services JV
2001 2002 2003 2004 2005 Net Operating Income 101.3 22.8 71.6 143.2 285 104 Duke Energy Field Services JV Net Income1 ($MM) DUK - 50%, COP - 50% 1 Net Income to COP, 2005 excludes gain on TEPPCO sale. Large NGL producer 353 MBPD in 2005 Focus on North America Improving ROCE Lower cost structure Rati
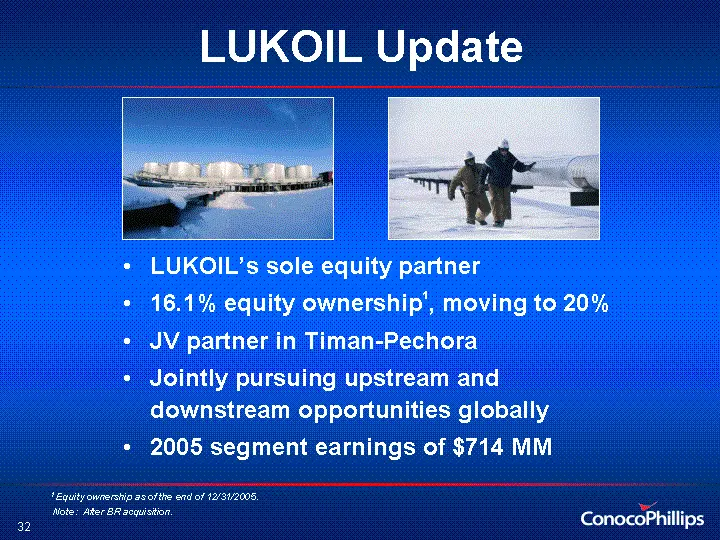
Slide 31: LUKOIL Update
LUKOIL's sole equity partner 16.1% equity ownership1, moving to 20% JV partner in Timan-Pechora Jointly pursuing upstream and downstream opportunities globally 2005 segment earnings of $714 MM LUKOIL Update LUKOIL Update 1 Equity ownership as of the end of 12/31/2005. 1 Equity ownership as of the en
Slide 32: Financial Strategy
Financial Strategy Fund Growth Program Move to AA credit rating Debt reduction Equity improvement Target debt/capital ratio of 15-20% Annual dividend increases Share repurchases 65 Note: After BR acquisition.
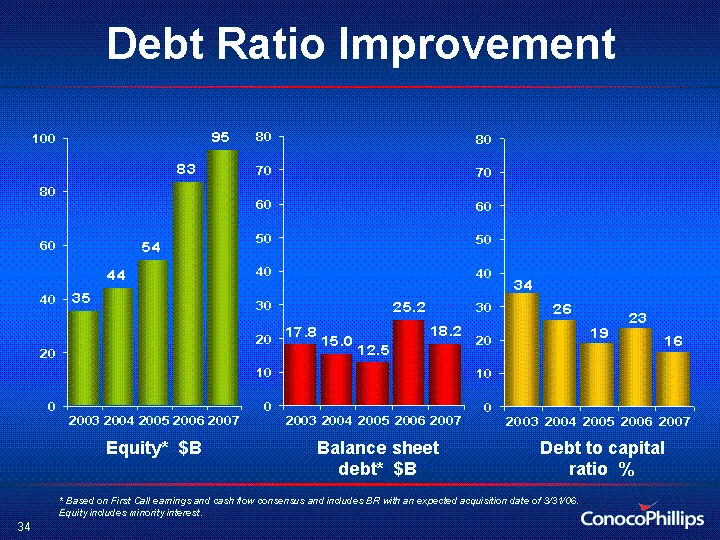
Slide 33: Debt Ratio Improvement
2002 2003 2004 2005 2006 2007 Equity 30.74 35.2 43.8 53.9 83.1 95.3 Debt Debt / Cap Ratio 0.39 Debt Ratio Improvement 2003 2004 2005 2006 2007 Debt 17.8 15 12.5 25.2 18.2 Equity* $B Balance sheet debt* $B 2002 2003 2004 2005 2006 2007 Debt / Cap Ratio 39 33.6 25.5 18.8 23.2 16 Debt to capital ratio
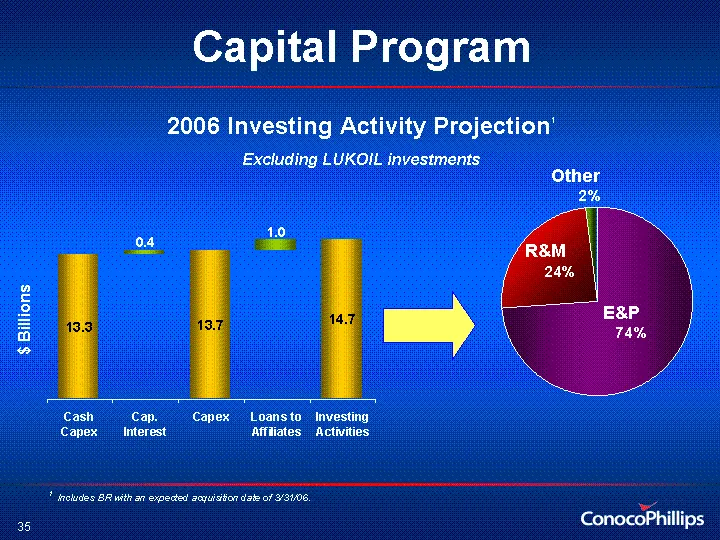
Slide 34: Capital Program
E&P* R&M Other 2005 74 24 2 Capital Program 2006 Investing Activity Projection1 Excluding LUKOIL investments E&P R&M Other $ Billions Cash Capex Cap. Interest Capex Loans to Affiliates Investing Activities East 13.3 13.7 14.7 West 13.3 13.7 North 0.4 1 1 Includes BR with an expected acquisition date
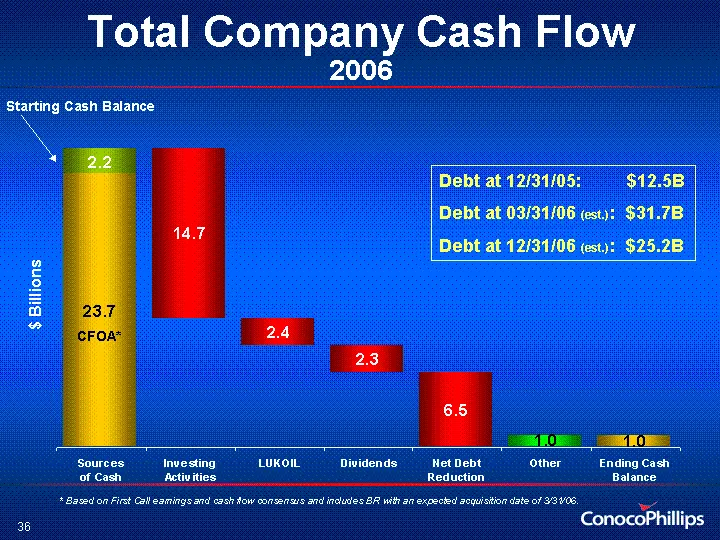
Slide 35: Total Company Cash Flow
Sources of Cash Investing Activities LUKOIL Dividends Net Debt Reduction Other Ending Cash Balance Cash from Operations 23.7 11.2 8.8 6.5 0 0 Working Capital Asset Sales 1 Higher Receivables Capex 14.7 2.4 Other 2.2 2.3 6.5 Debt Reduction 1 Total Company Cash Flow 2006 Debt at 12/31/05: $12.5B Debt
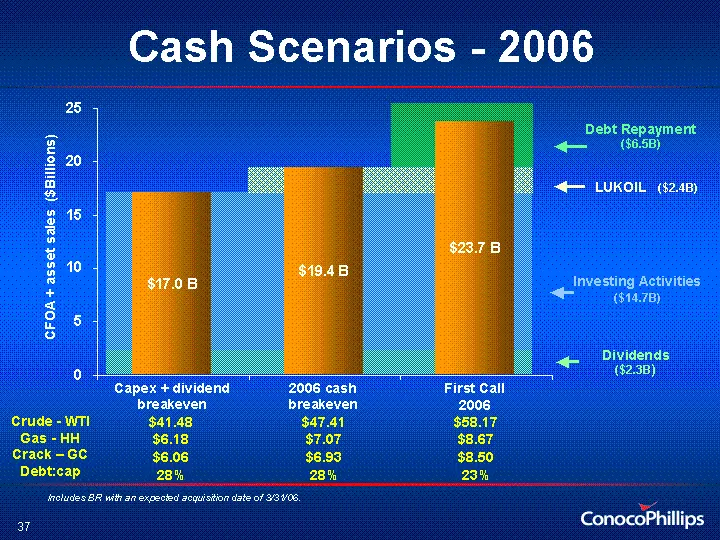
Slide 36: Cash Scenarios - 2006
Cash Scenarios - 2006 Capex + dividend breakeven Crude - WTI Gas - HH Crack - GC Debt:cap $41.48 $6.18 $6.06 28% CFOA + asset sales ($Billions) $47.41 $7.07 $6.93 28% 2006 cash breakeven $58.17 $8.67 $8.50 23% First Call 2006 Dividends ($2.3B) Investing Activities ($14.7B) Debt Repayment ($6.5B) LUK
Slide 37: Outlook
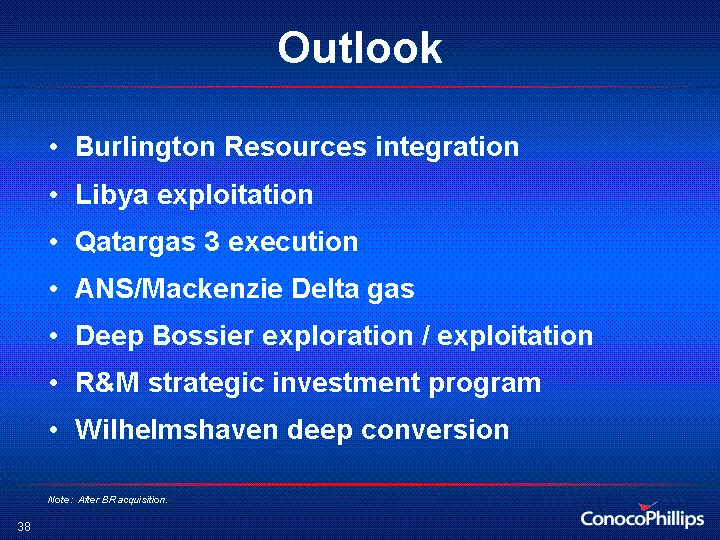
Outlook Burlington Resources integration Libya exploitation Qatargas 3 execution ANS/Mackenzie Delta gas Deep Bossier exploration / exploitation R&M strategic investment program Wilhelmshaven deep conversion Note: After BR acquisition.
Slide 38: Rising to the Challenge
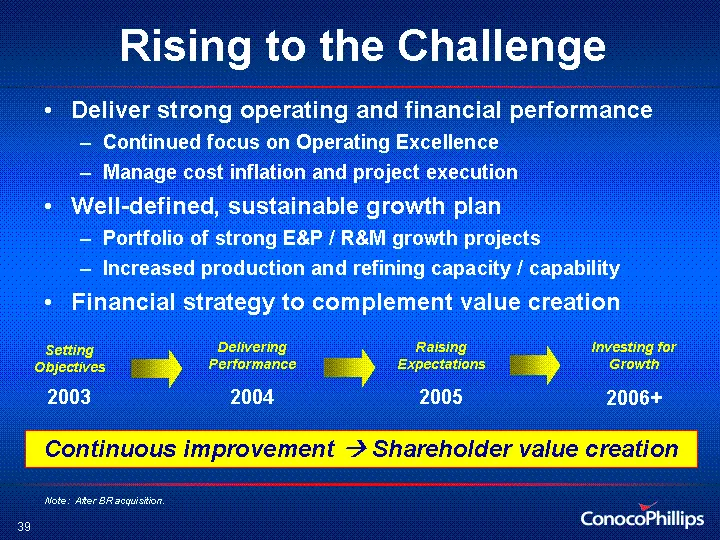
Rising to the Challenge Deliver strong operating and financial performance Continued focus on Operating Excellence Manage cost inflation and project execution Well-defined, sustainable growth plan Portfolio of strong E&P / R&M growth projects Increased production and refining capacity / capability F
Slide 39: A.G. Edwards' Energy Conference
A.G. Edwards' Energy Conference Boston, Massachusetts John Carrig EVP, Finance and CFO March 14, 2006 40
Slide 40: Appendix
Appendix A.G. Edwards' Energy Conference March 14, 2006 41
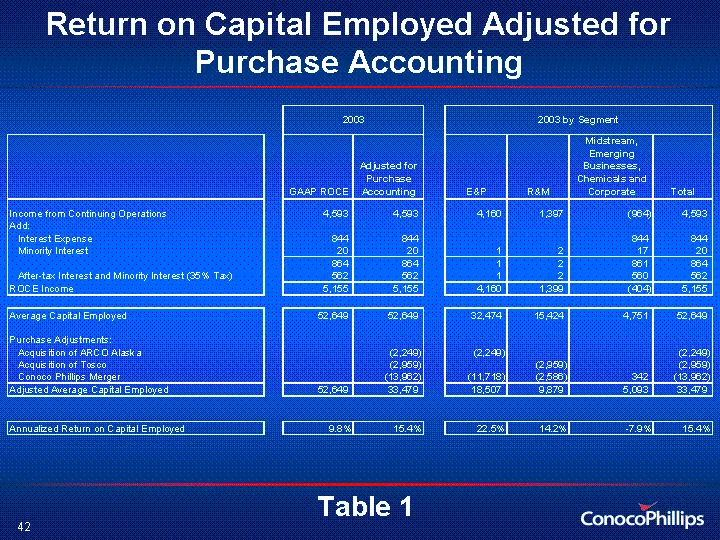
Slide 41: Return on Capital Employed Adjusted for Purchase Accounting Table 1
Return on Capital Employed Adjusted for Purchase Accounting Table 1
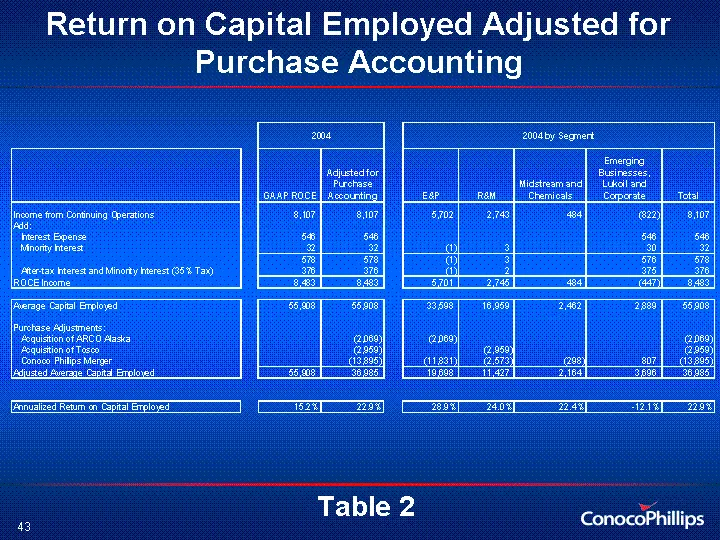
Slide 42: Return on Capital Employed Adjusted for Purchase Accounting Table 2
Return on Capital Employed Adjusted for Purchase Accounting Table 2
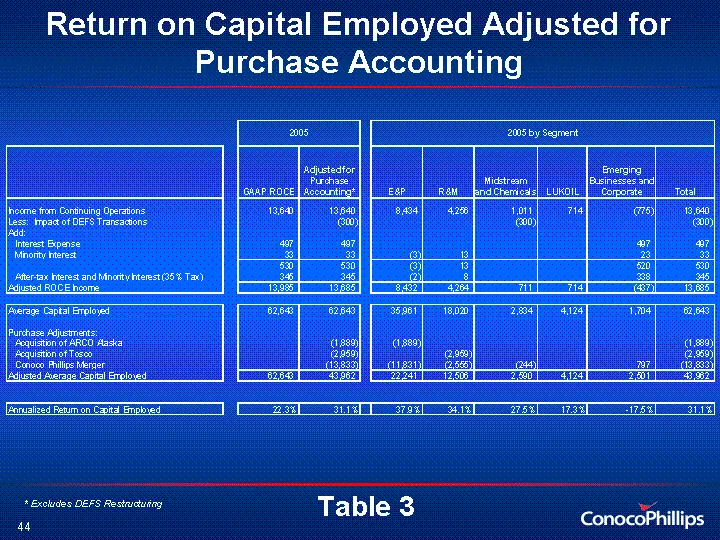
Slide 43: Return on Capital Employed Adjusted for Purchase Accounting Table 3
Return on Capital Employed Adjusted for Purchase Accounting Table 3 * Excludes DEFS Restructuring
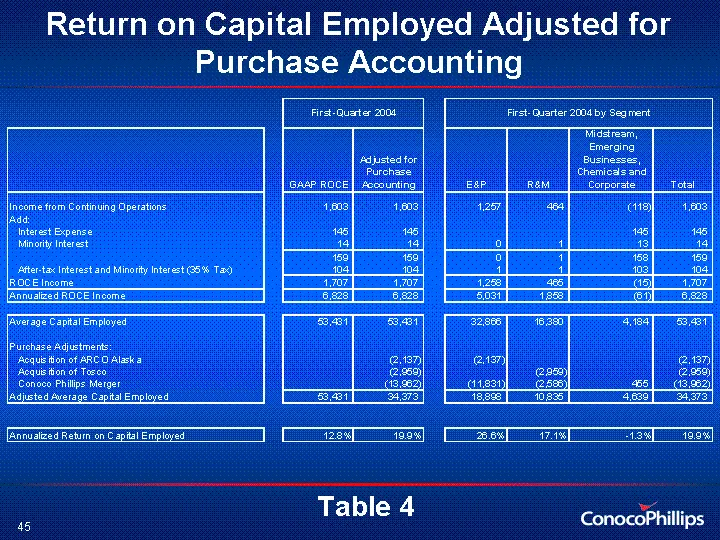
Slide 44: Return on Capital Employed Adjusted for Purchase Accounting Table 4
Return on Capital Employed Adjusted for Purchase Accounting Table 4
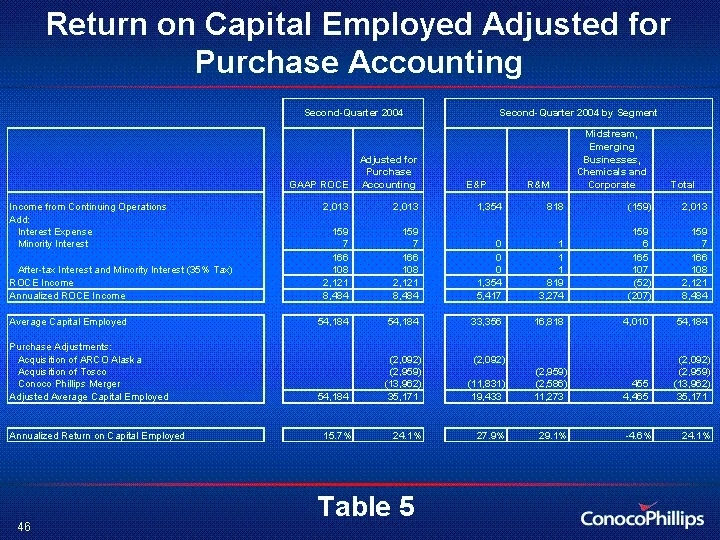
Slide 45: Return on Capital Employed Adjusted for Purchase Accounting Table 5
Return on Capital Employed Adjusted for Purchase Accounting Table 5
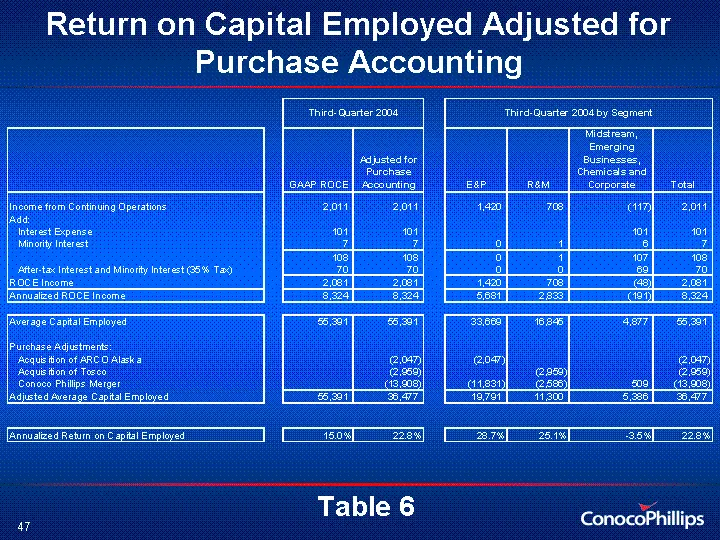
Slide 46: Return on Capital Employed Adjusted for Purchase Accounting Table 6
Return on Capital Employed Adjusted for Purchase Accounting Table 6
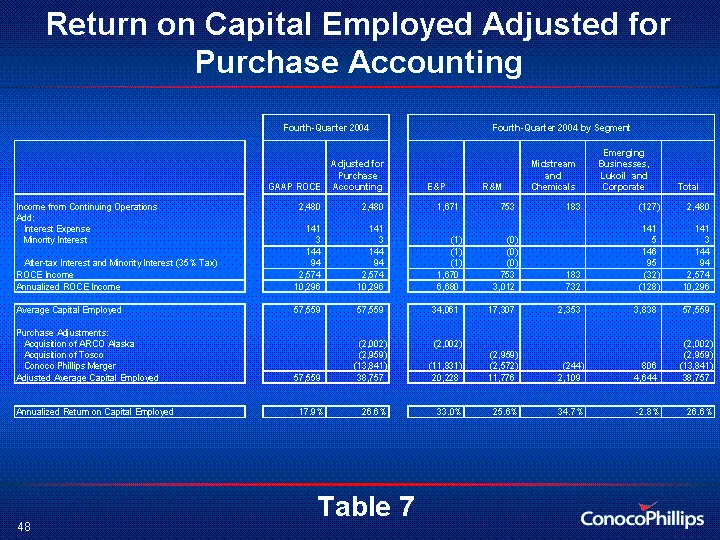
Slide 47: Return on Capital Employed Adjusted for Purchase Accounting Table 7
Return on Capital Employed Adjusted for Purchase Accounting Table 7
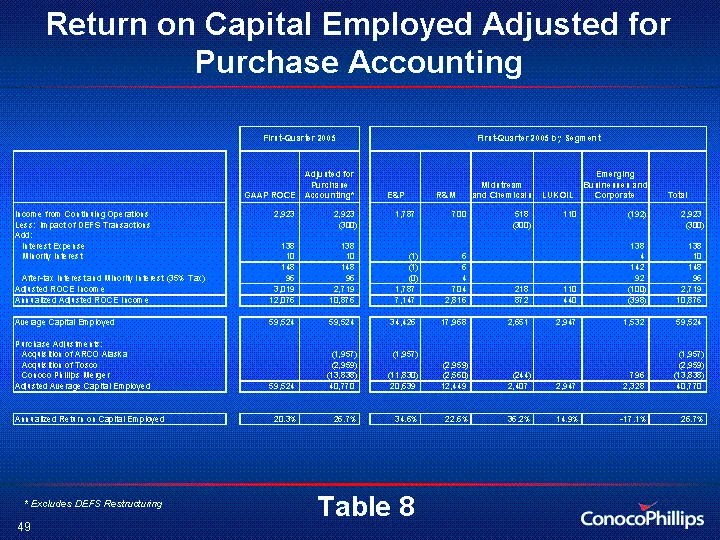
Slide 48: Return on Capital Employed Adjusted for Purchase Accounting Table 8
Return on Capital Employed Adjusted for Purchase Accounting Table 8 * Excludes DEFS Restructuring
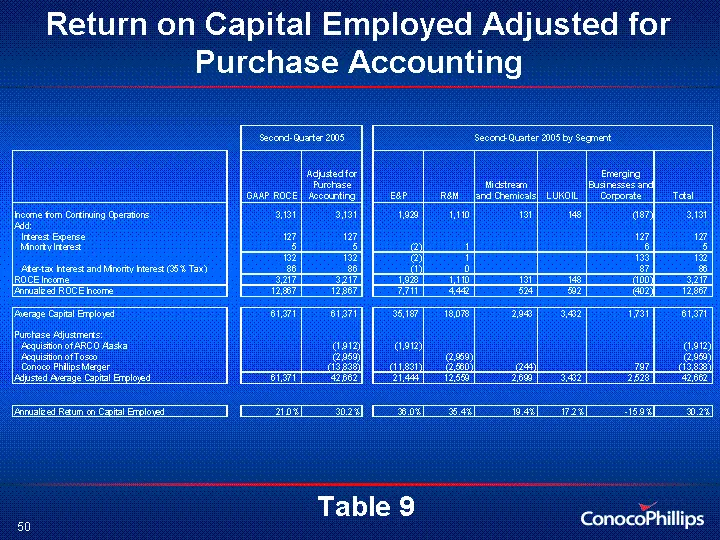
Slide 49: Return on Capital Employed Adjusted for Purchase Accounting Table 9
Return on Capital Employed Adjusted for Purchase Accounting Table 9
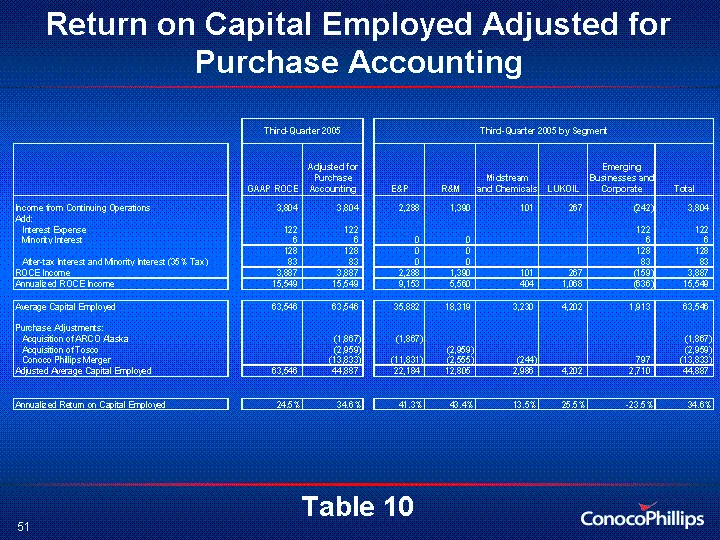
Slide 50: Return on Capital Employed Adjusted for Purchase Accounting Table 10
Return on Capital Employed Adjusted for Purchase Accounting Table 10
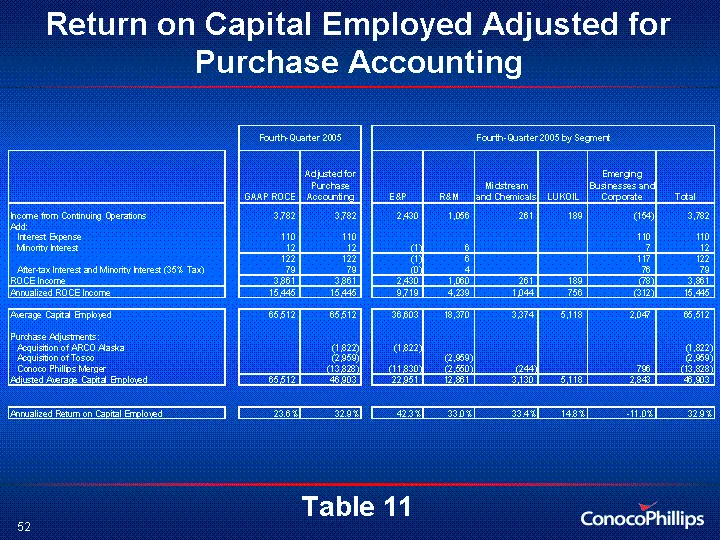
Slide 51: Return on Capital Employed Adjusted for Purchase Accounting Table 11
Return on Capital Employed Adjusted for Purchase Accounting Table 11
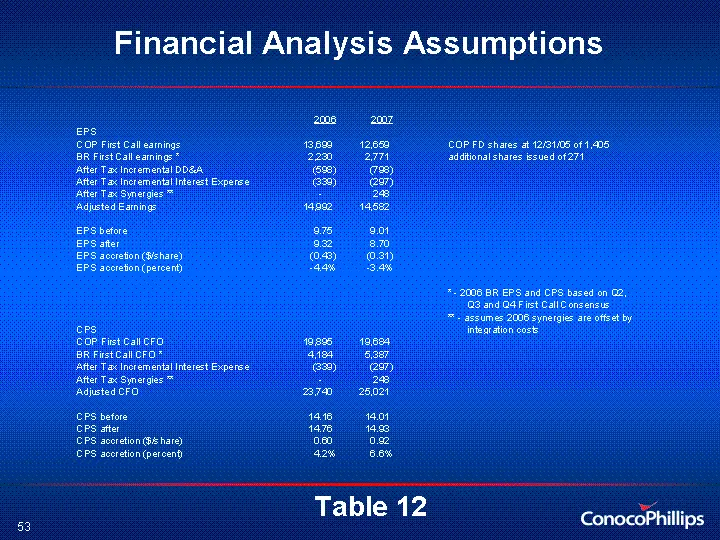
Slide 52: Financial Analysis Assumptions Table
Financial Analysis Assumptions Table 12
Source: SEC EDGAR · 425 filed Mar 14, 2006
More decks from Burlington Resources Inc
 Merger or Acquisition (January 2006)54 slides · Jan 17, 2006
 Burlington Resources — Merger or Acquisition (January 2006)15 slides · Jan 17, 2006
 Burlington Resources — Merger or Acquisition (January 2006)34 slides · Jan 11, 2006
 Merger or Acquisition (December 2005)12 slides · Dec 14, 2005
 Merger or Acquisition (December 2005)32 slides · Dec 13, 2005