C&J Energy Services — Credit Suisse Energy Summit 2015
29 slides from C&J Energy Services's conference presentation, Feb 25, 2015

Slide 1: Credit Suisse Energy Summit
Exhibit 99.1 Credit Suisse Energy Summit February 25, 2015
Slide 2: Disclaimer: Important Information for Investors and Stockholders
Disclaimer Important Information for Investors and Stockholders In connection with the proposed combination of C&J Energy Services, Inc. (“C&J”) with the completion and production services business of Nabors Industries Ltd. (“Nabors”), a wholly owned subsidiary of Nabors, Nabors Red Lion Limited (wh
Slide 3: Cautionary Statement Regarding Forward-Looking Statements
Disclaimer Cautionary Statement Regarding Forward-Looking Statements This communication contains “forward-looking statements” within the meaning of Section 27A of the Securities Act of 1933 and Section 21E of the Securities and Exchange Act of 1934. These include statements regarding the effects of
Slide 4: Overview and Key Takeaways
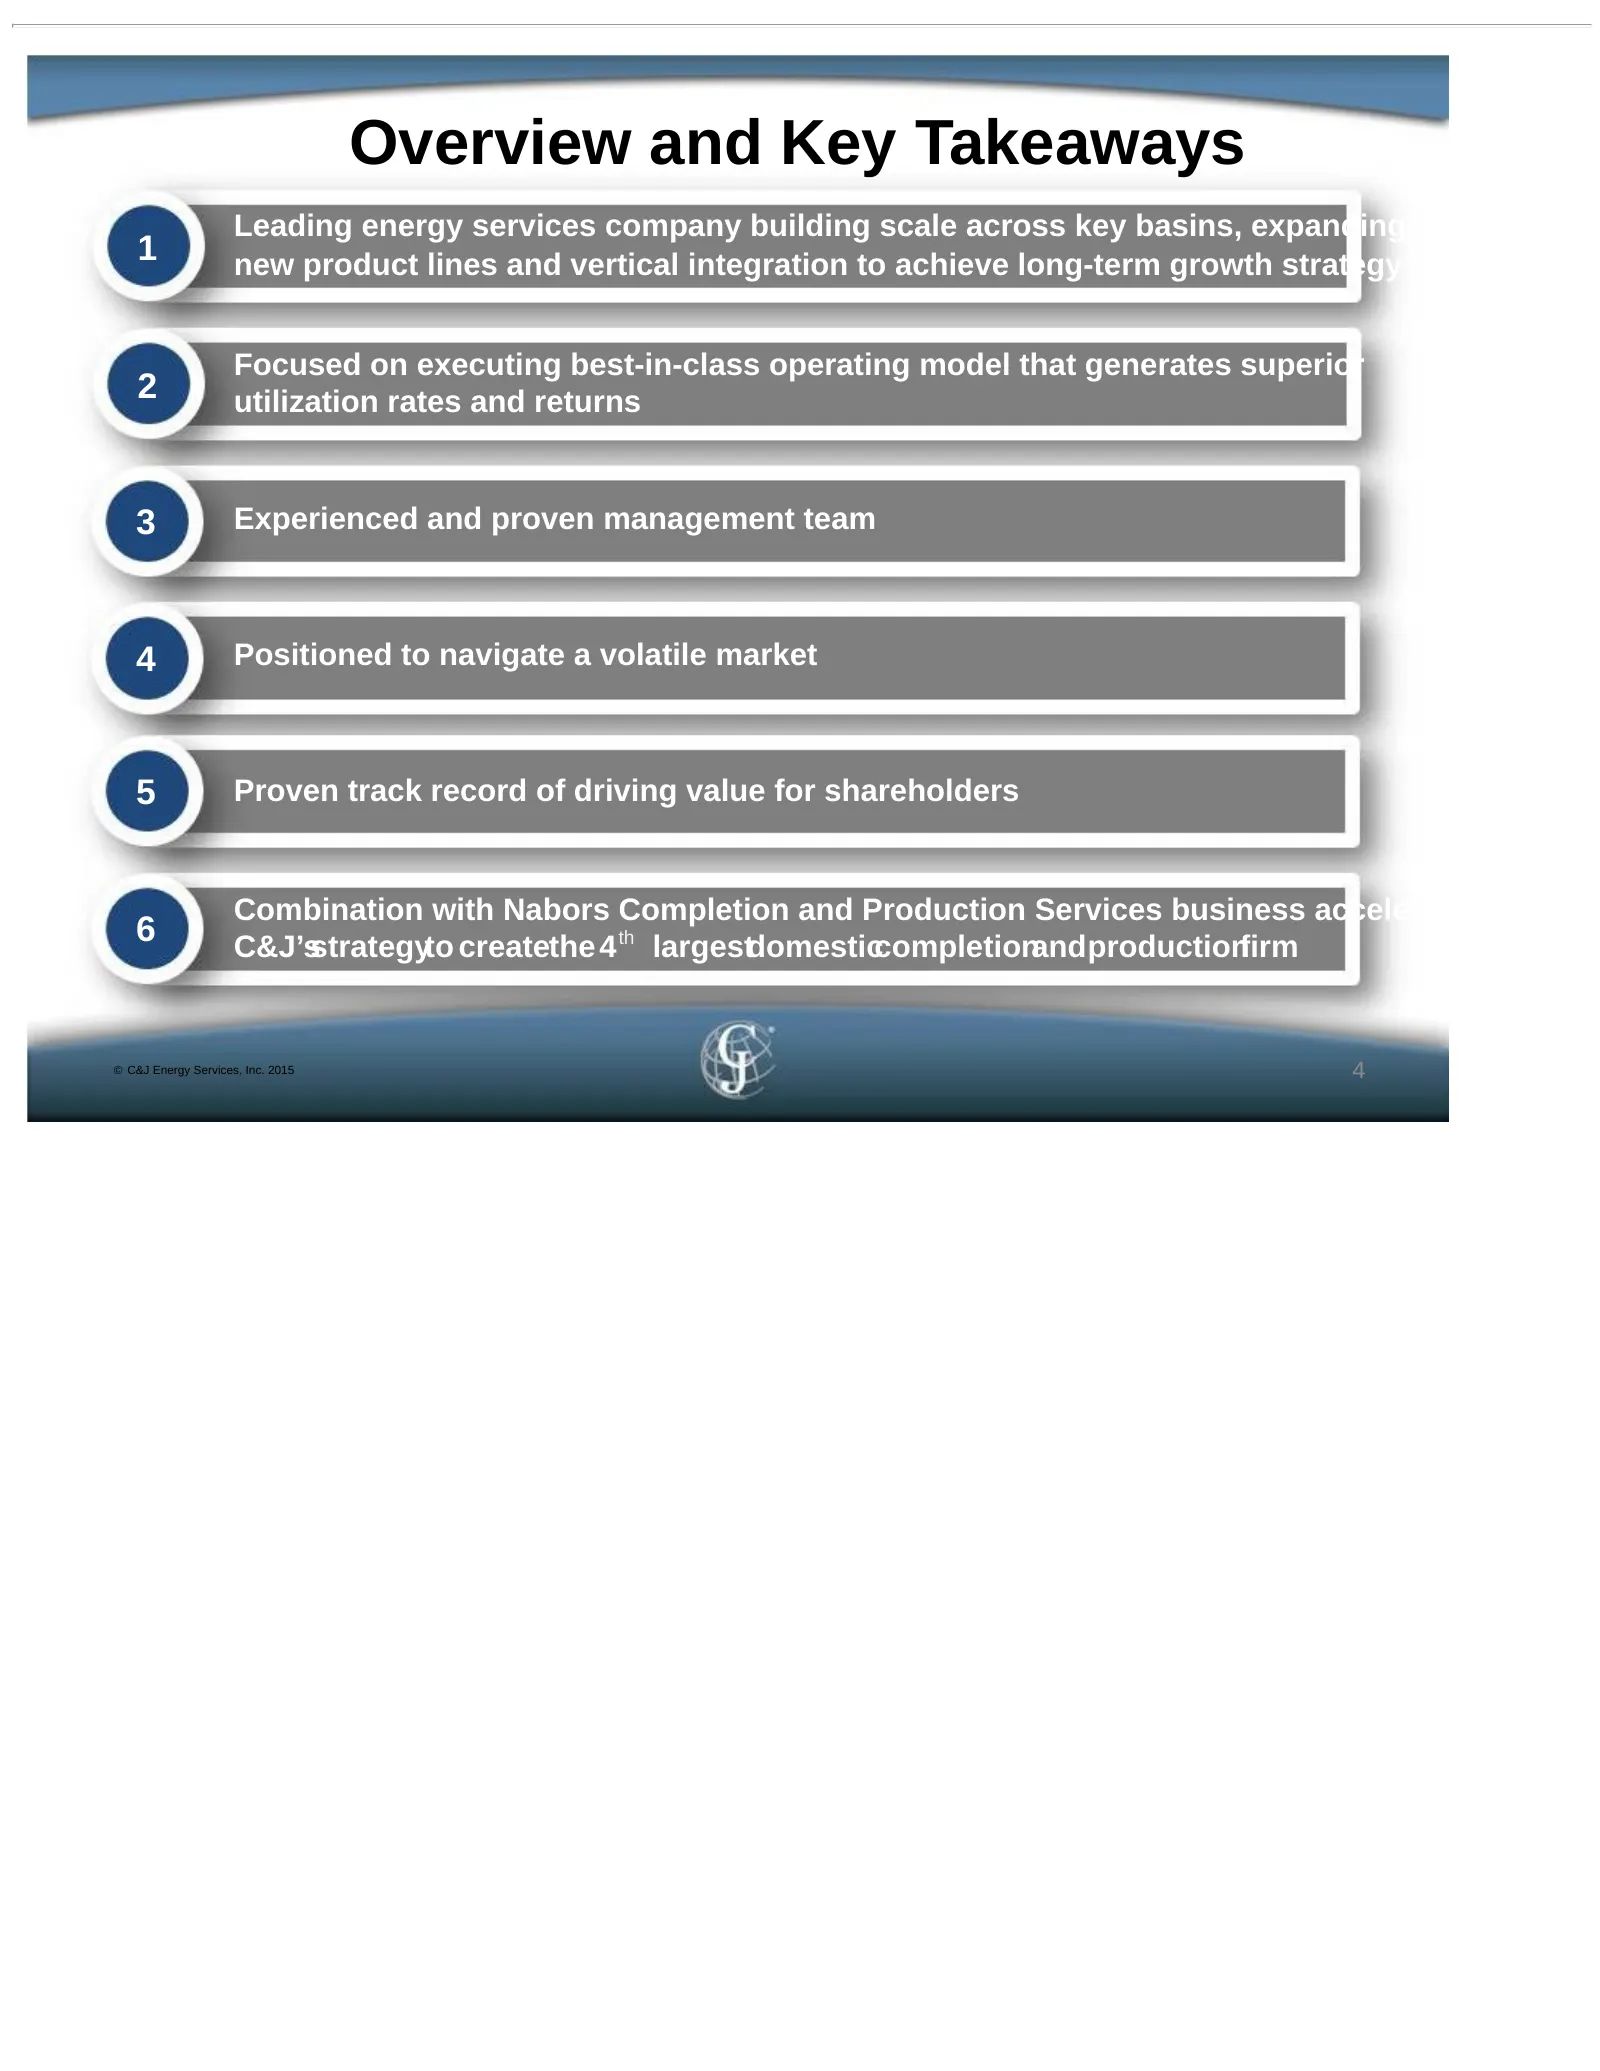
Overview and Key Takeaways Leading energy services company building scale across key basins, expanding with 1 new product lines and vertical integration to achieve long-term growth strategy Focused on executing best-in-class operating model that generates superior 2 utilization rates and returns 3 E
Slide 5: C&J Energy Services Strategic Overview
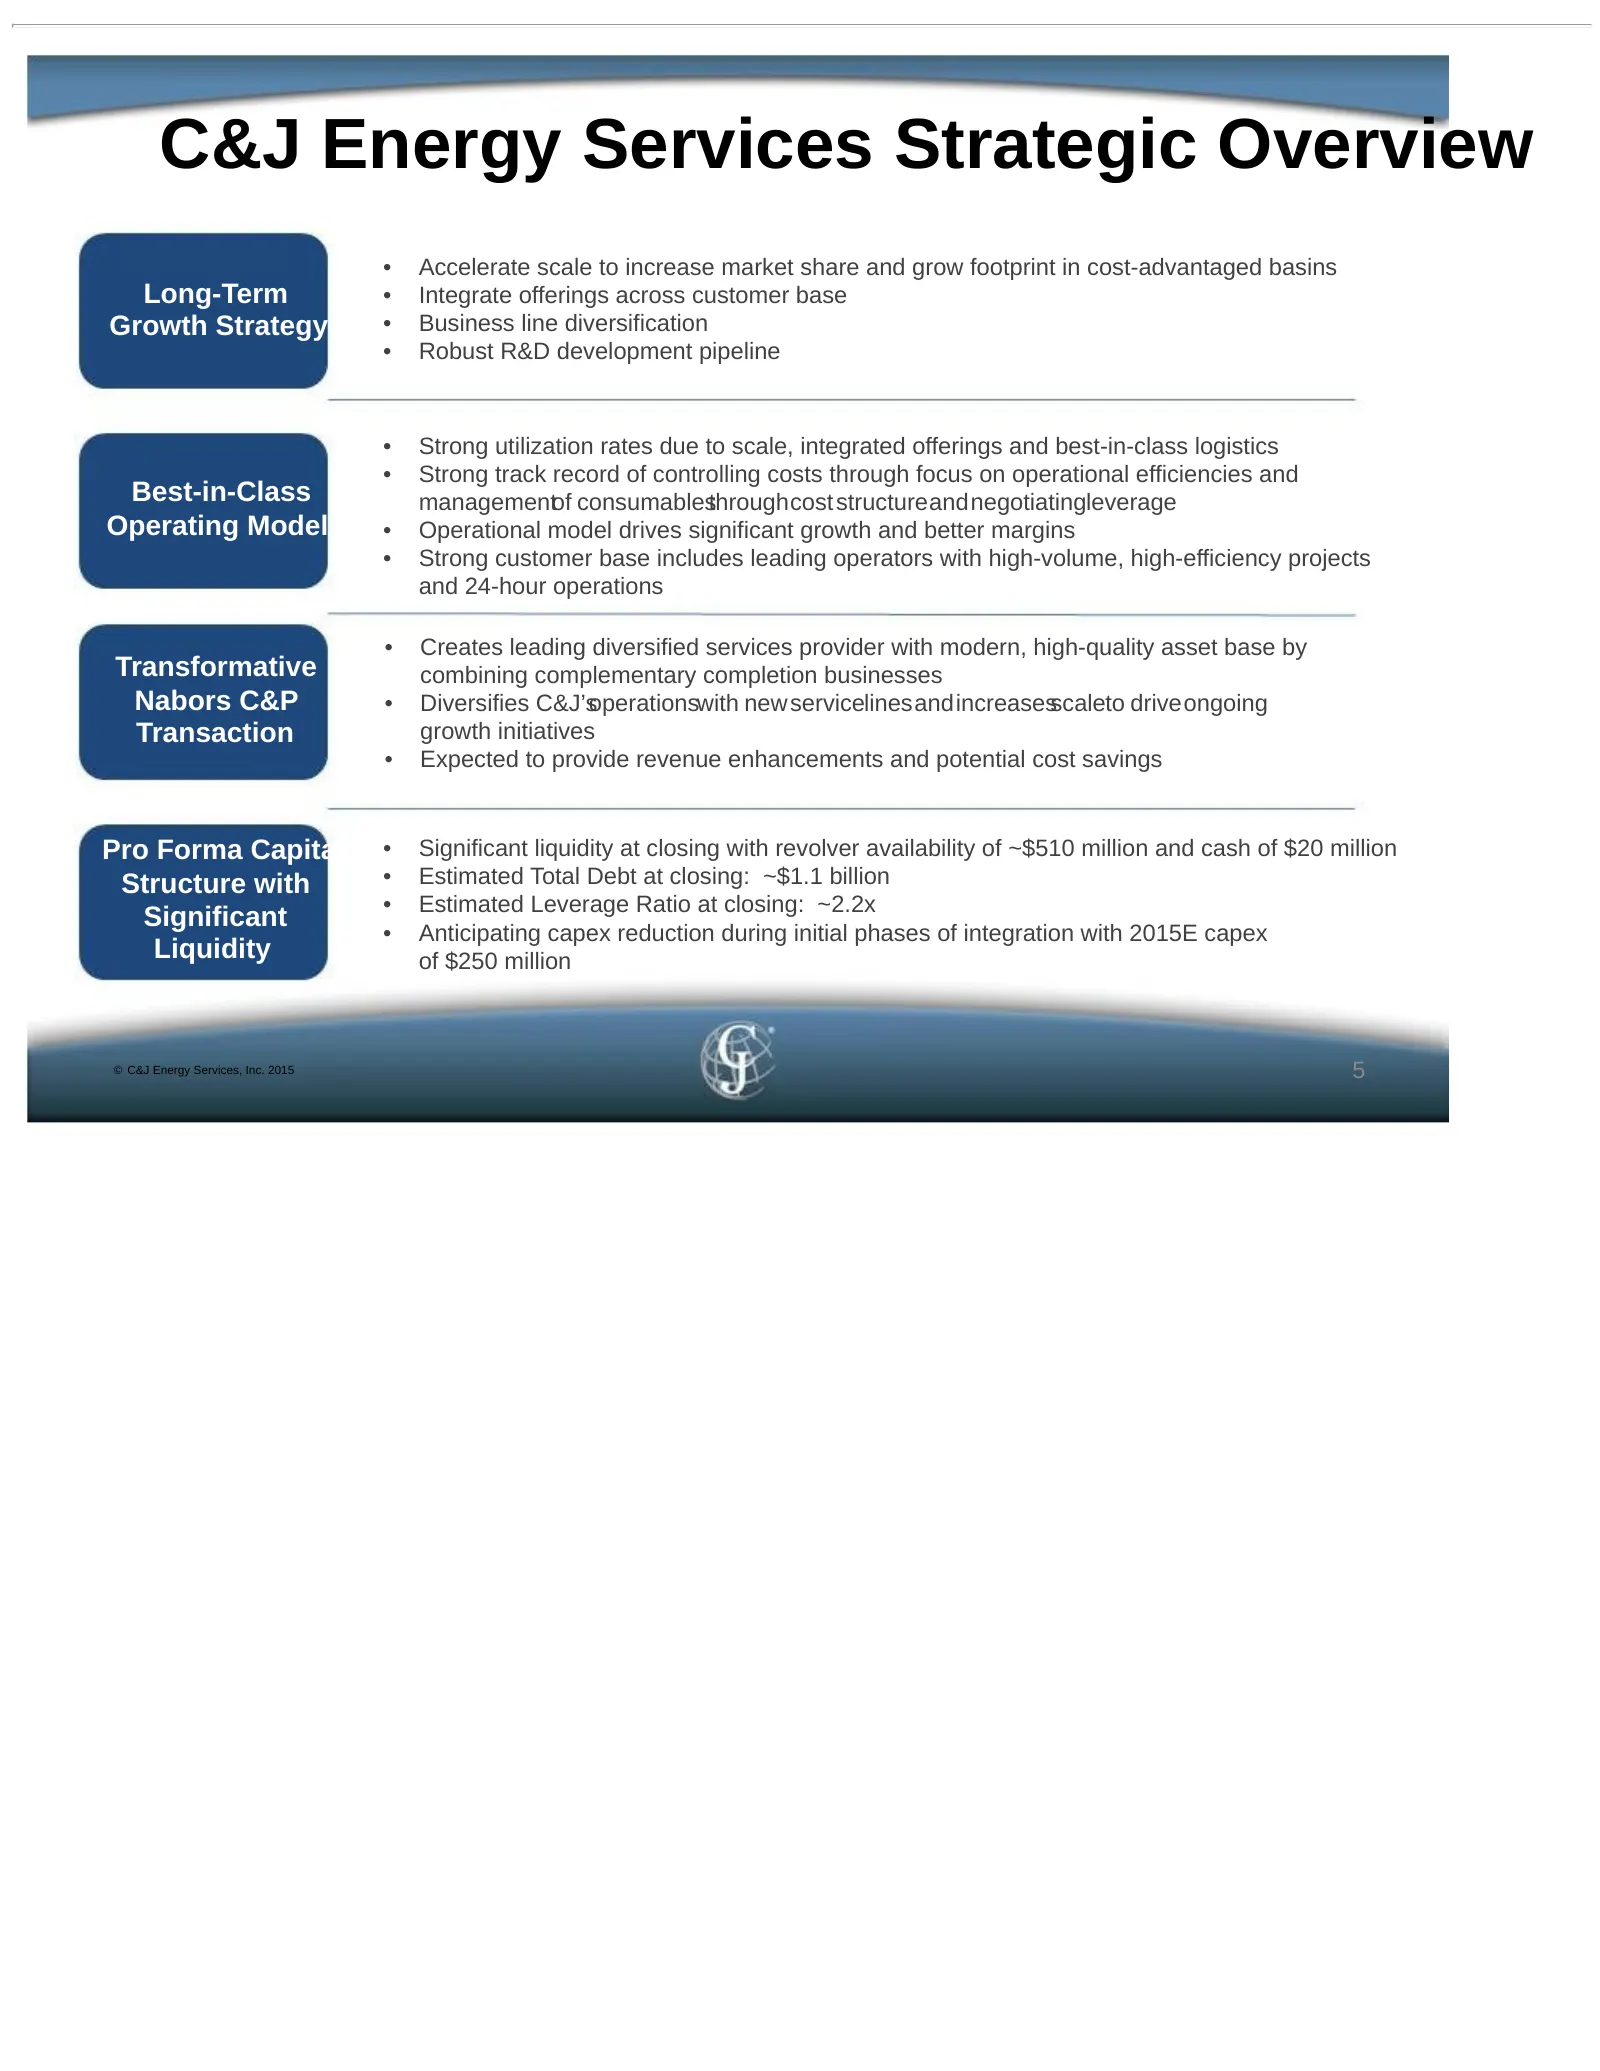
C&J Energy Services Strategic Overview • Accelerate scale to increase market share and grow footprint in cost-advantaged basins Long-Term • Integrate offerings across customer base Growth Strategy • Business line diversification • Robust R&D development pipeline • Strong utilization rates due to sca
Slide 6: C&J Energy Services Today
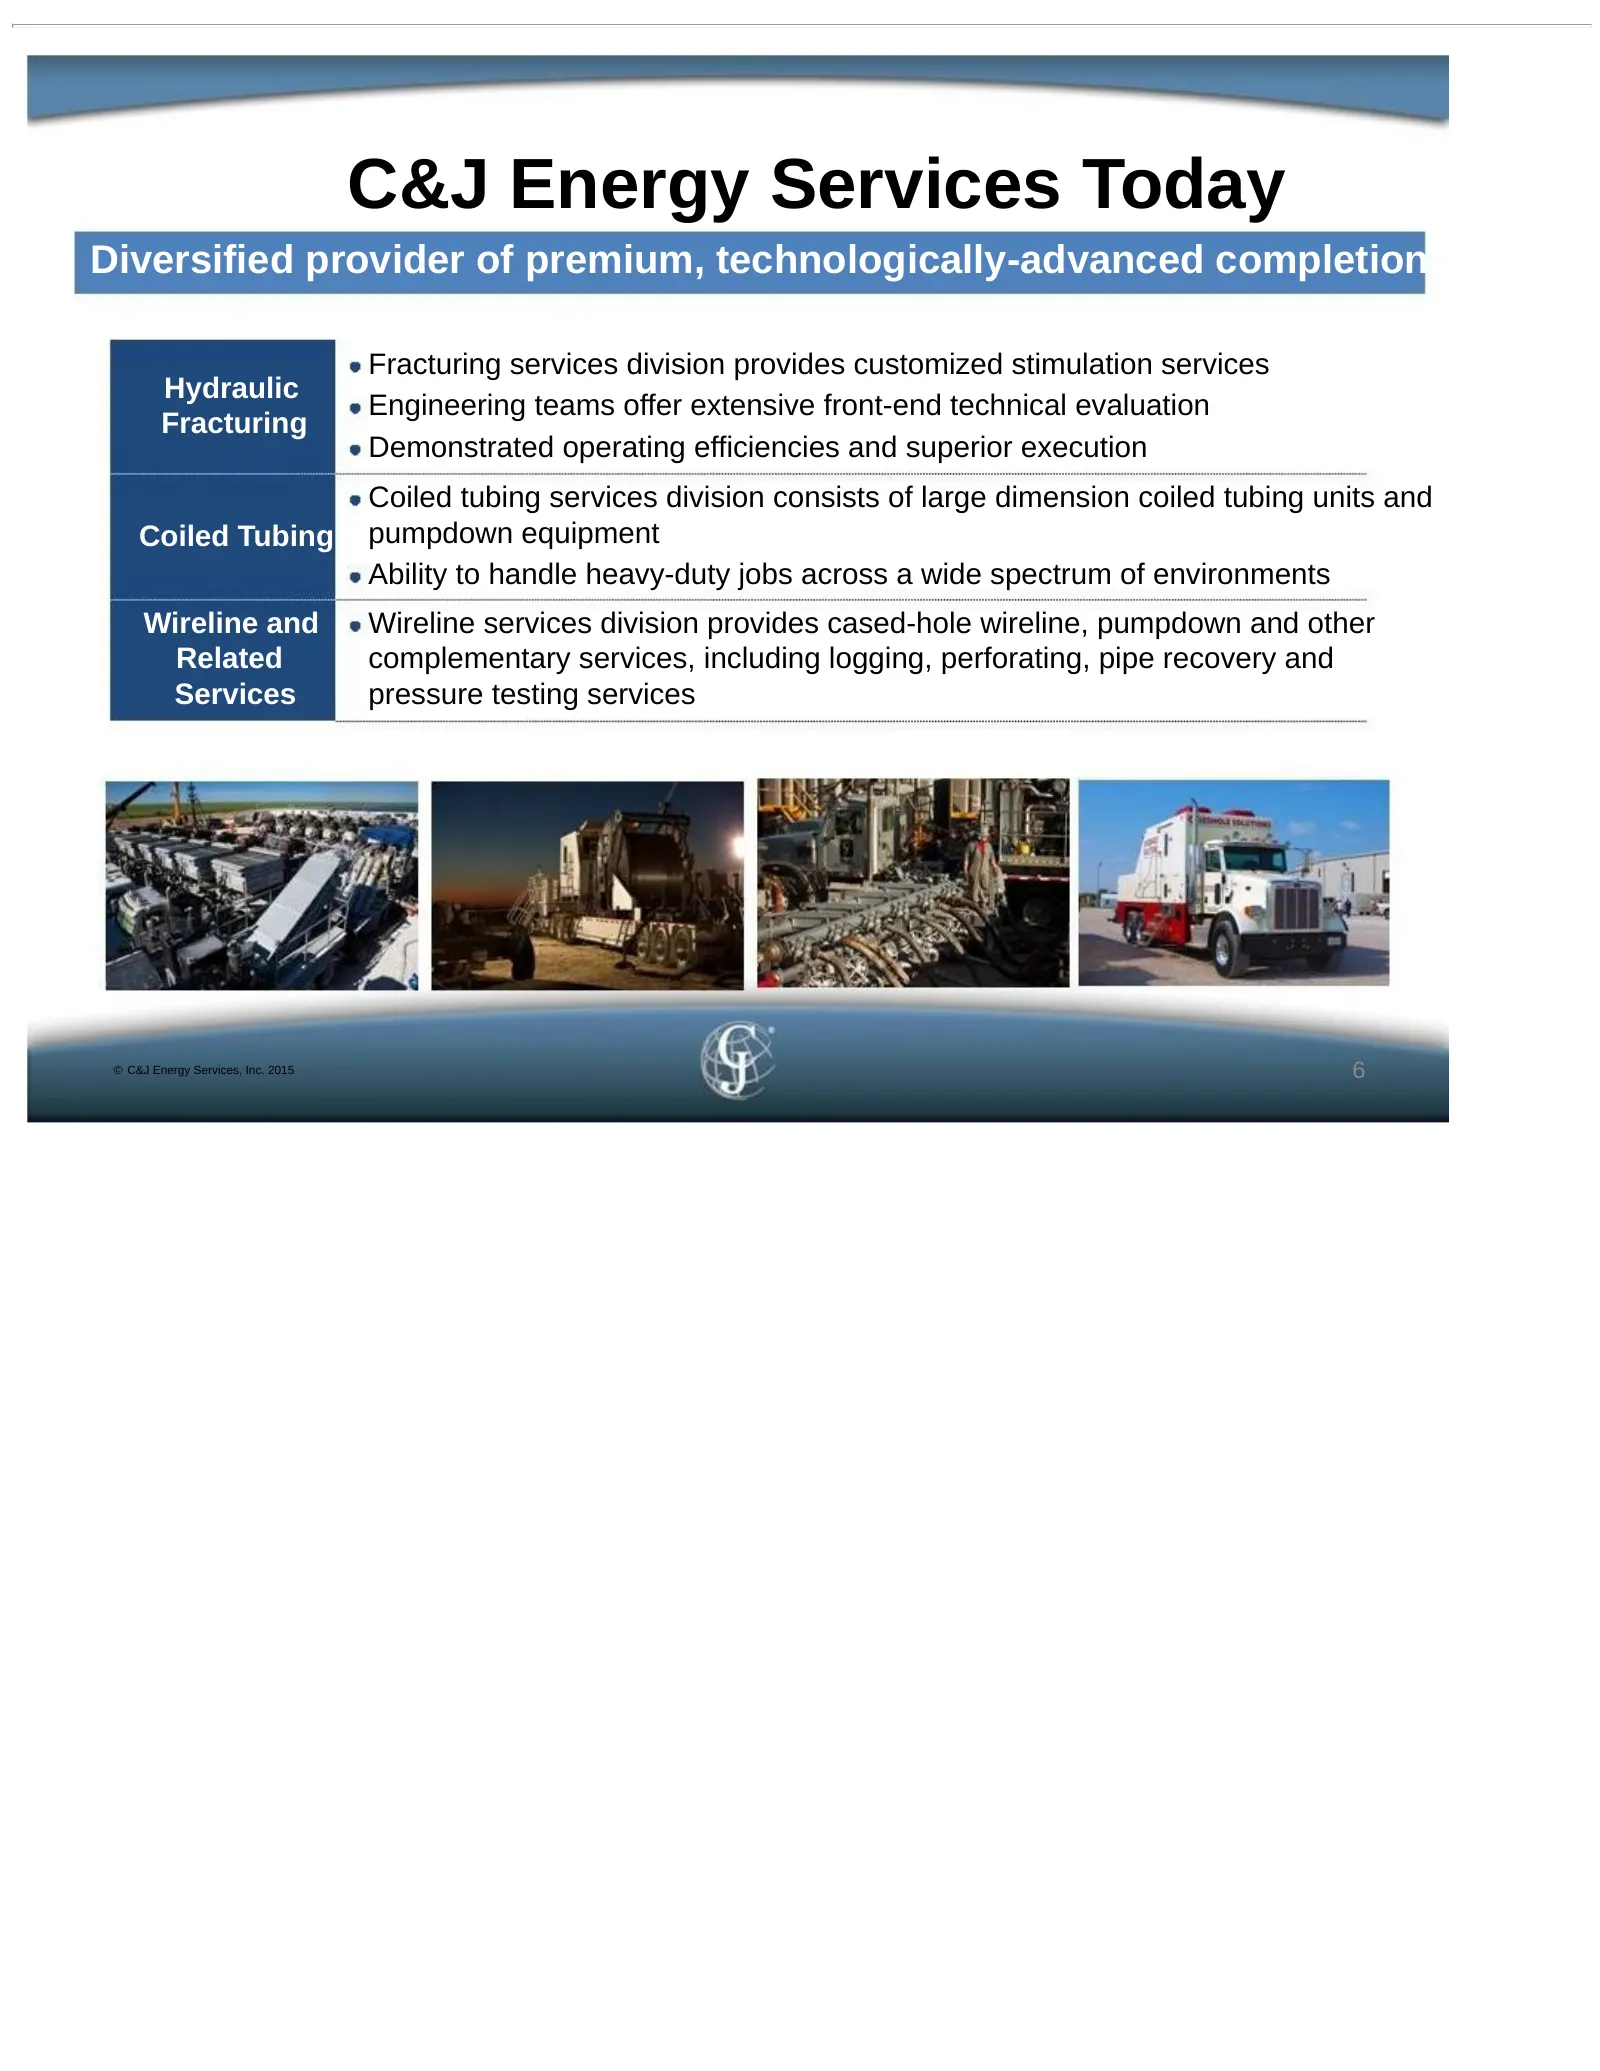
C&J Energy Services Today Diversified provider of premium, technologically-advanced completion services Fracturing services division provides customized stimulation services Hydraulic Engineering teams offer extensive front-end technical evaluation Fracturing Demonstrated operating efficiencies and
Slide 7: Operational Model Drives Best-In-Class Performance
Operational Model Drives Best-In-Class Performance Operatingefficienciescapitalizeontargetedopportunities • Target high volume, high efficiency customers who recognizethe thatvalue C&J provides through efficiency gains results in significant cost savings to them • Focus on complex, service-intensive
Slide 8: Operational Model Drives Best-In-Class Performance
Operational Model Drives Best-In-Class Performance Targeted markets and customer base lead to better competitive positioning • Well-positioned to capitalize on high service intensity and high efficiency work – Targeting active, well-hedged customer base that recognizes the value of maximizing equipm
Slide 9: Operational Model Driving Significant Growth
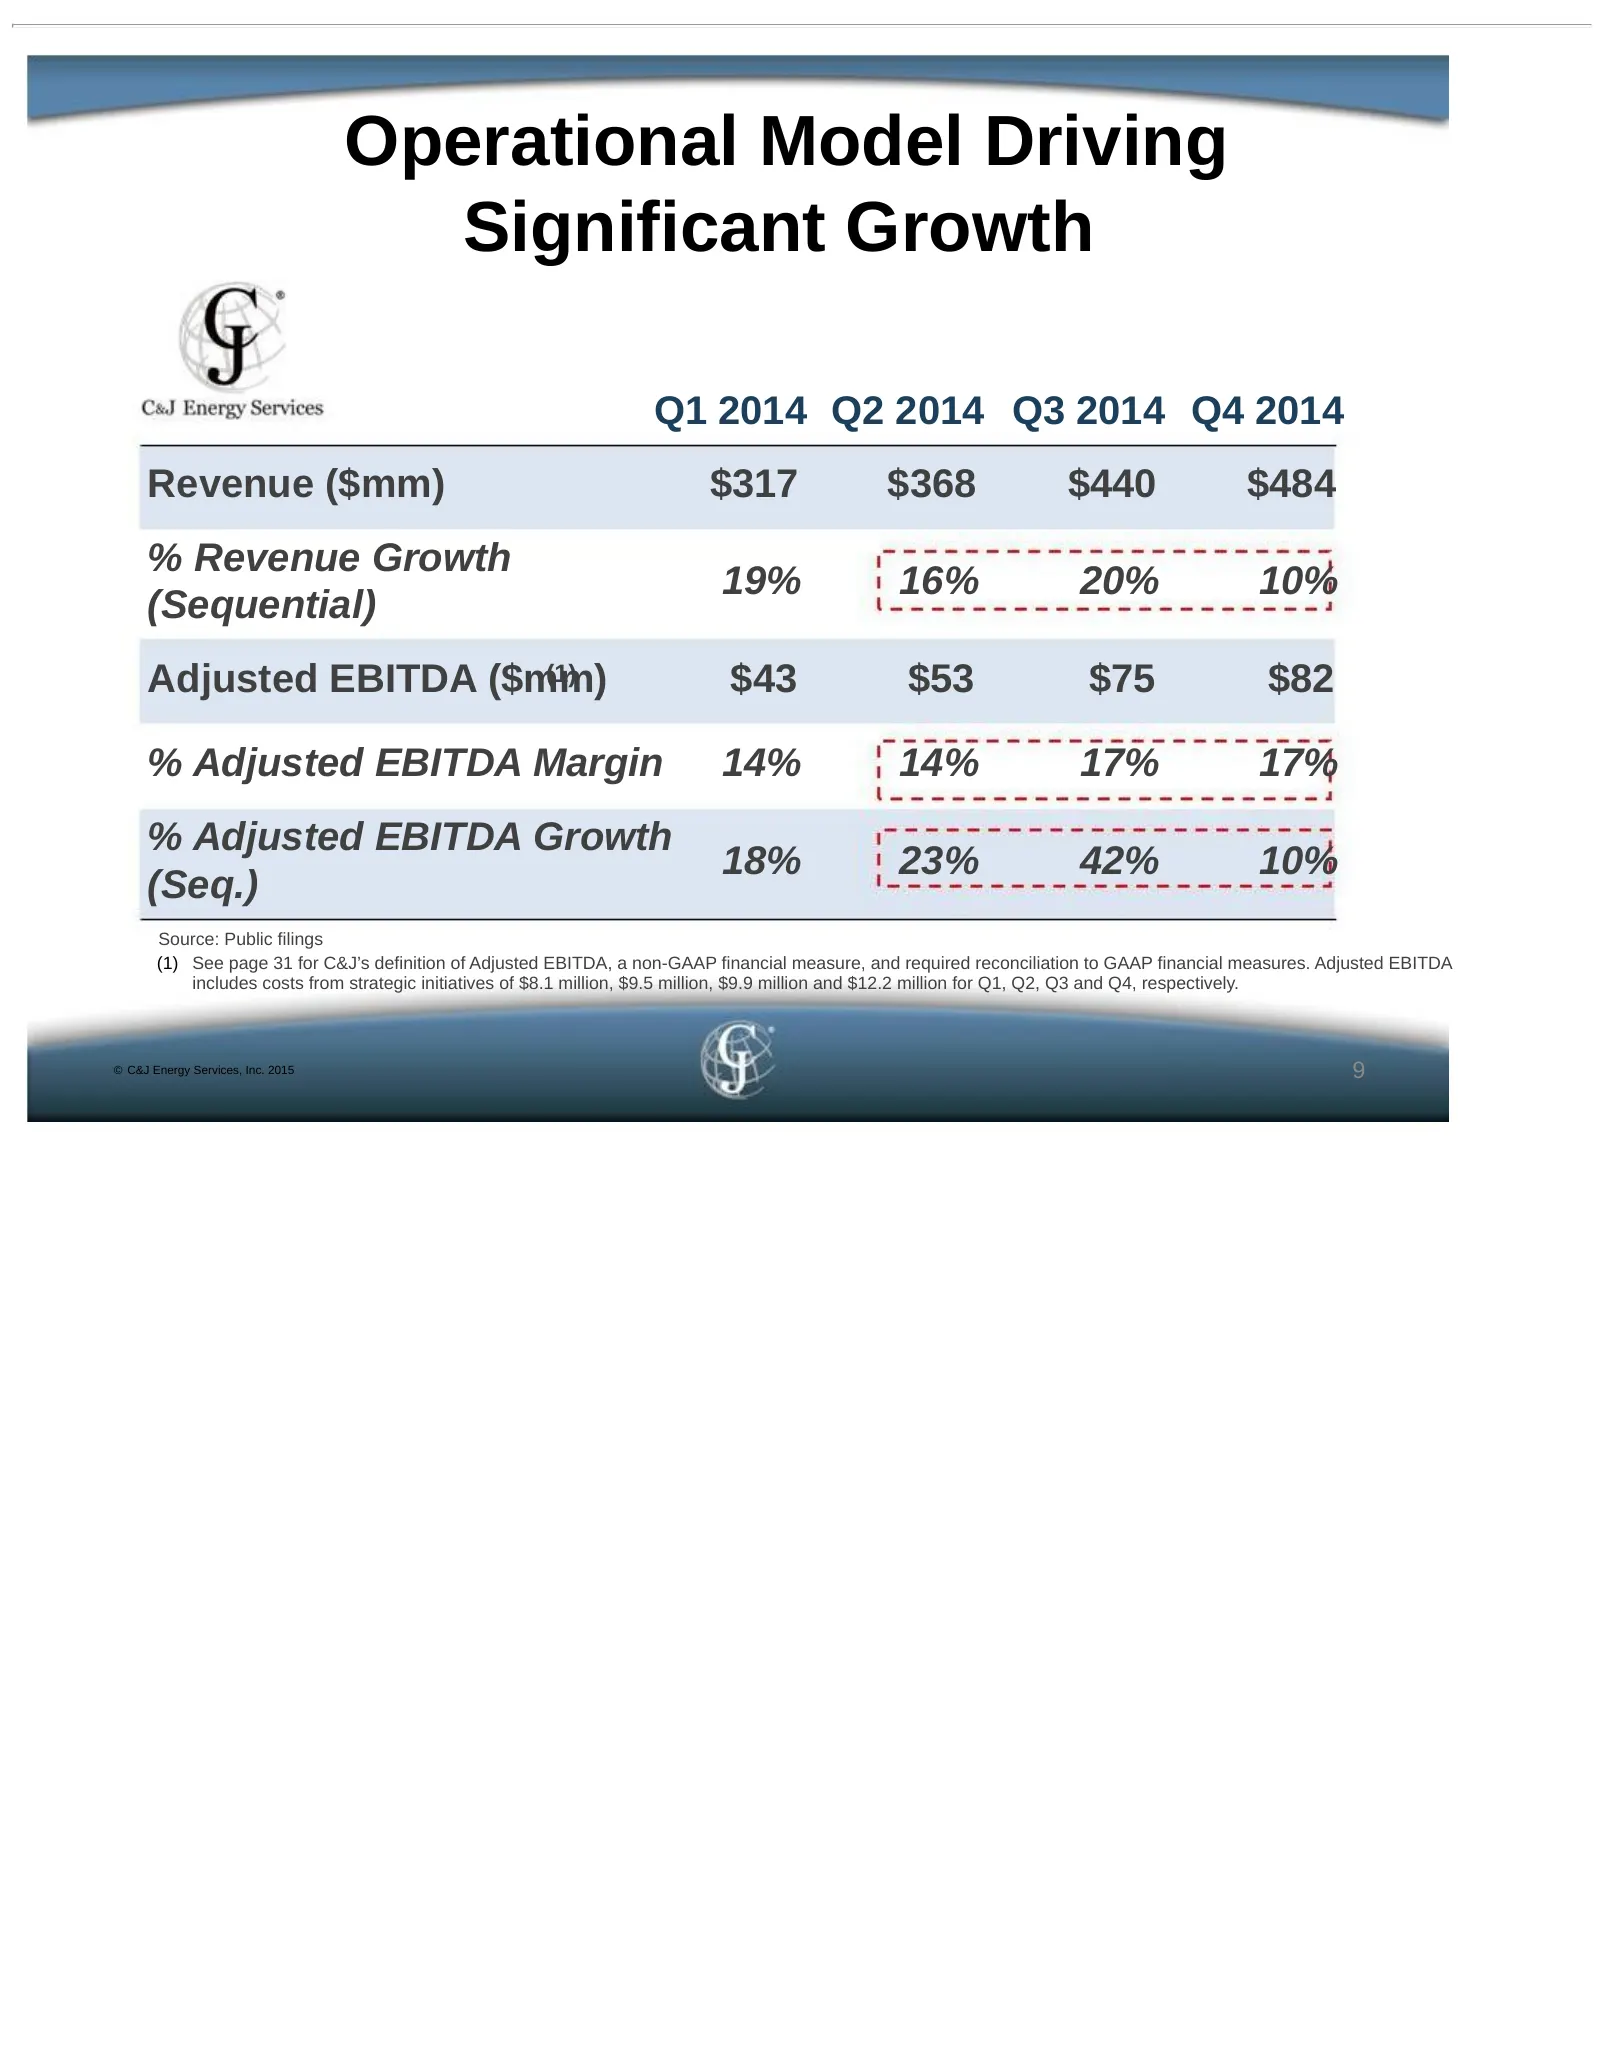
Operational Model Driving Significant Growth Q1 2014 Q2 2014 Q3 2014 Q4 2014 Revenue ($mm) $317 $368 $440 $484 % Revenue Growth 19% 16% 20% 10% (Sequential) Adjusted EBITDA ($mm) (1) $43 $53 $75 $82 % Adjusted EBITDA Margin 14% 14% 17% 17% % Adjusted EBITDA Growth 18% 23% 42% 10% (Seq.) Source: Publ
Slide 10: Current Industry Outlook
Current Industry Outlook • The steep decline in commodity prices will result in reduced operator spending, with the level of budget cuts expected to vary between basins – High cost basins and speculative acreage will face elevated levels risk – Core operations in Eagle Ford and Permian are better po
Slide 11: Overview of Nabors C&P Transaction
Overview of Nabors C&P Transaction
Slide 12: Key Deal Facts
Key Deal Facts • Purchase price declined from $2.86 billion at June announcement to $1.5 billion(1) due to $250million reductionin cashanddeclinesin C&Jstockprice • Createsa leadingdiversifiedcompletionand productionservicesprovider and accelerates C&J’s growth strategy to expand domestically and in
Slide 13: Combination Creates Provider of Choice with Operations in Key Basins
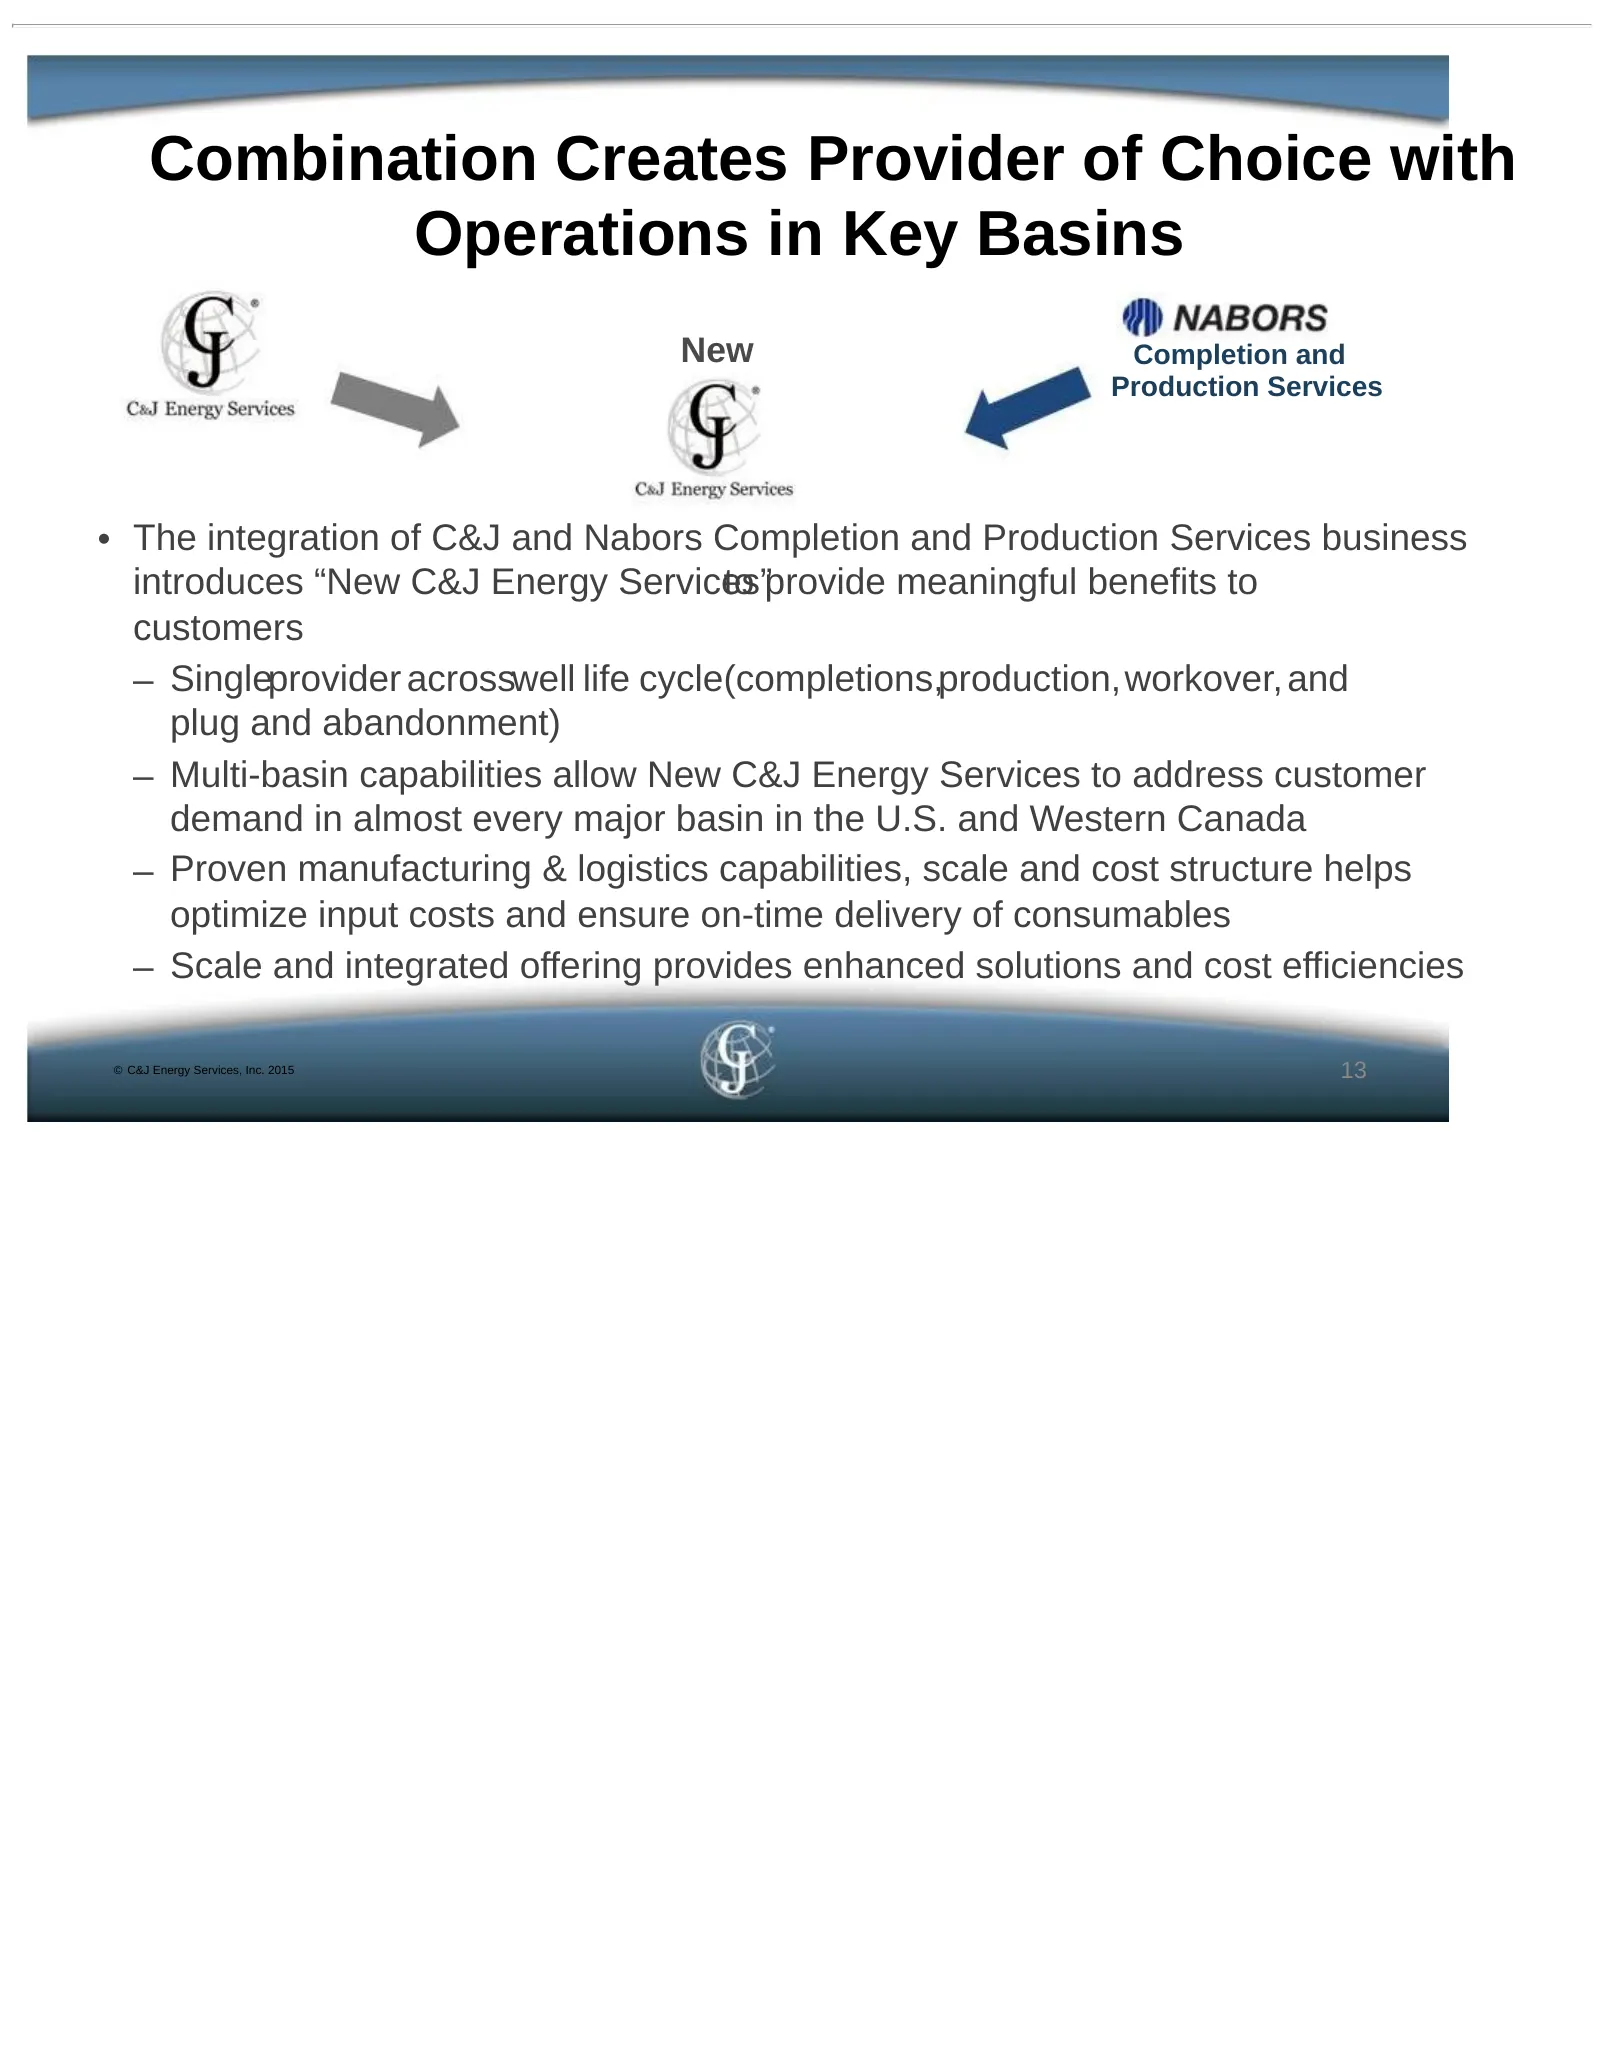
Combination Creates Provider of Choice with Operations in Key Basins New Completion and Production Services • The integration of C&J and Nabors Completion and Production Services business introduces “New C&J Energy Services” to provide meaningful benefits to customers – Singleprovider acrosswell lif
Slide 14: Combined Company At-A-Glance
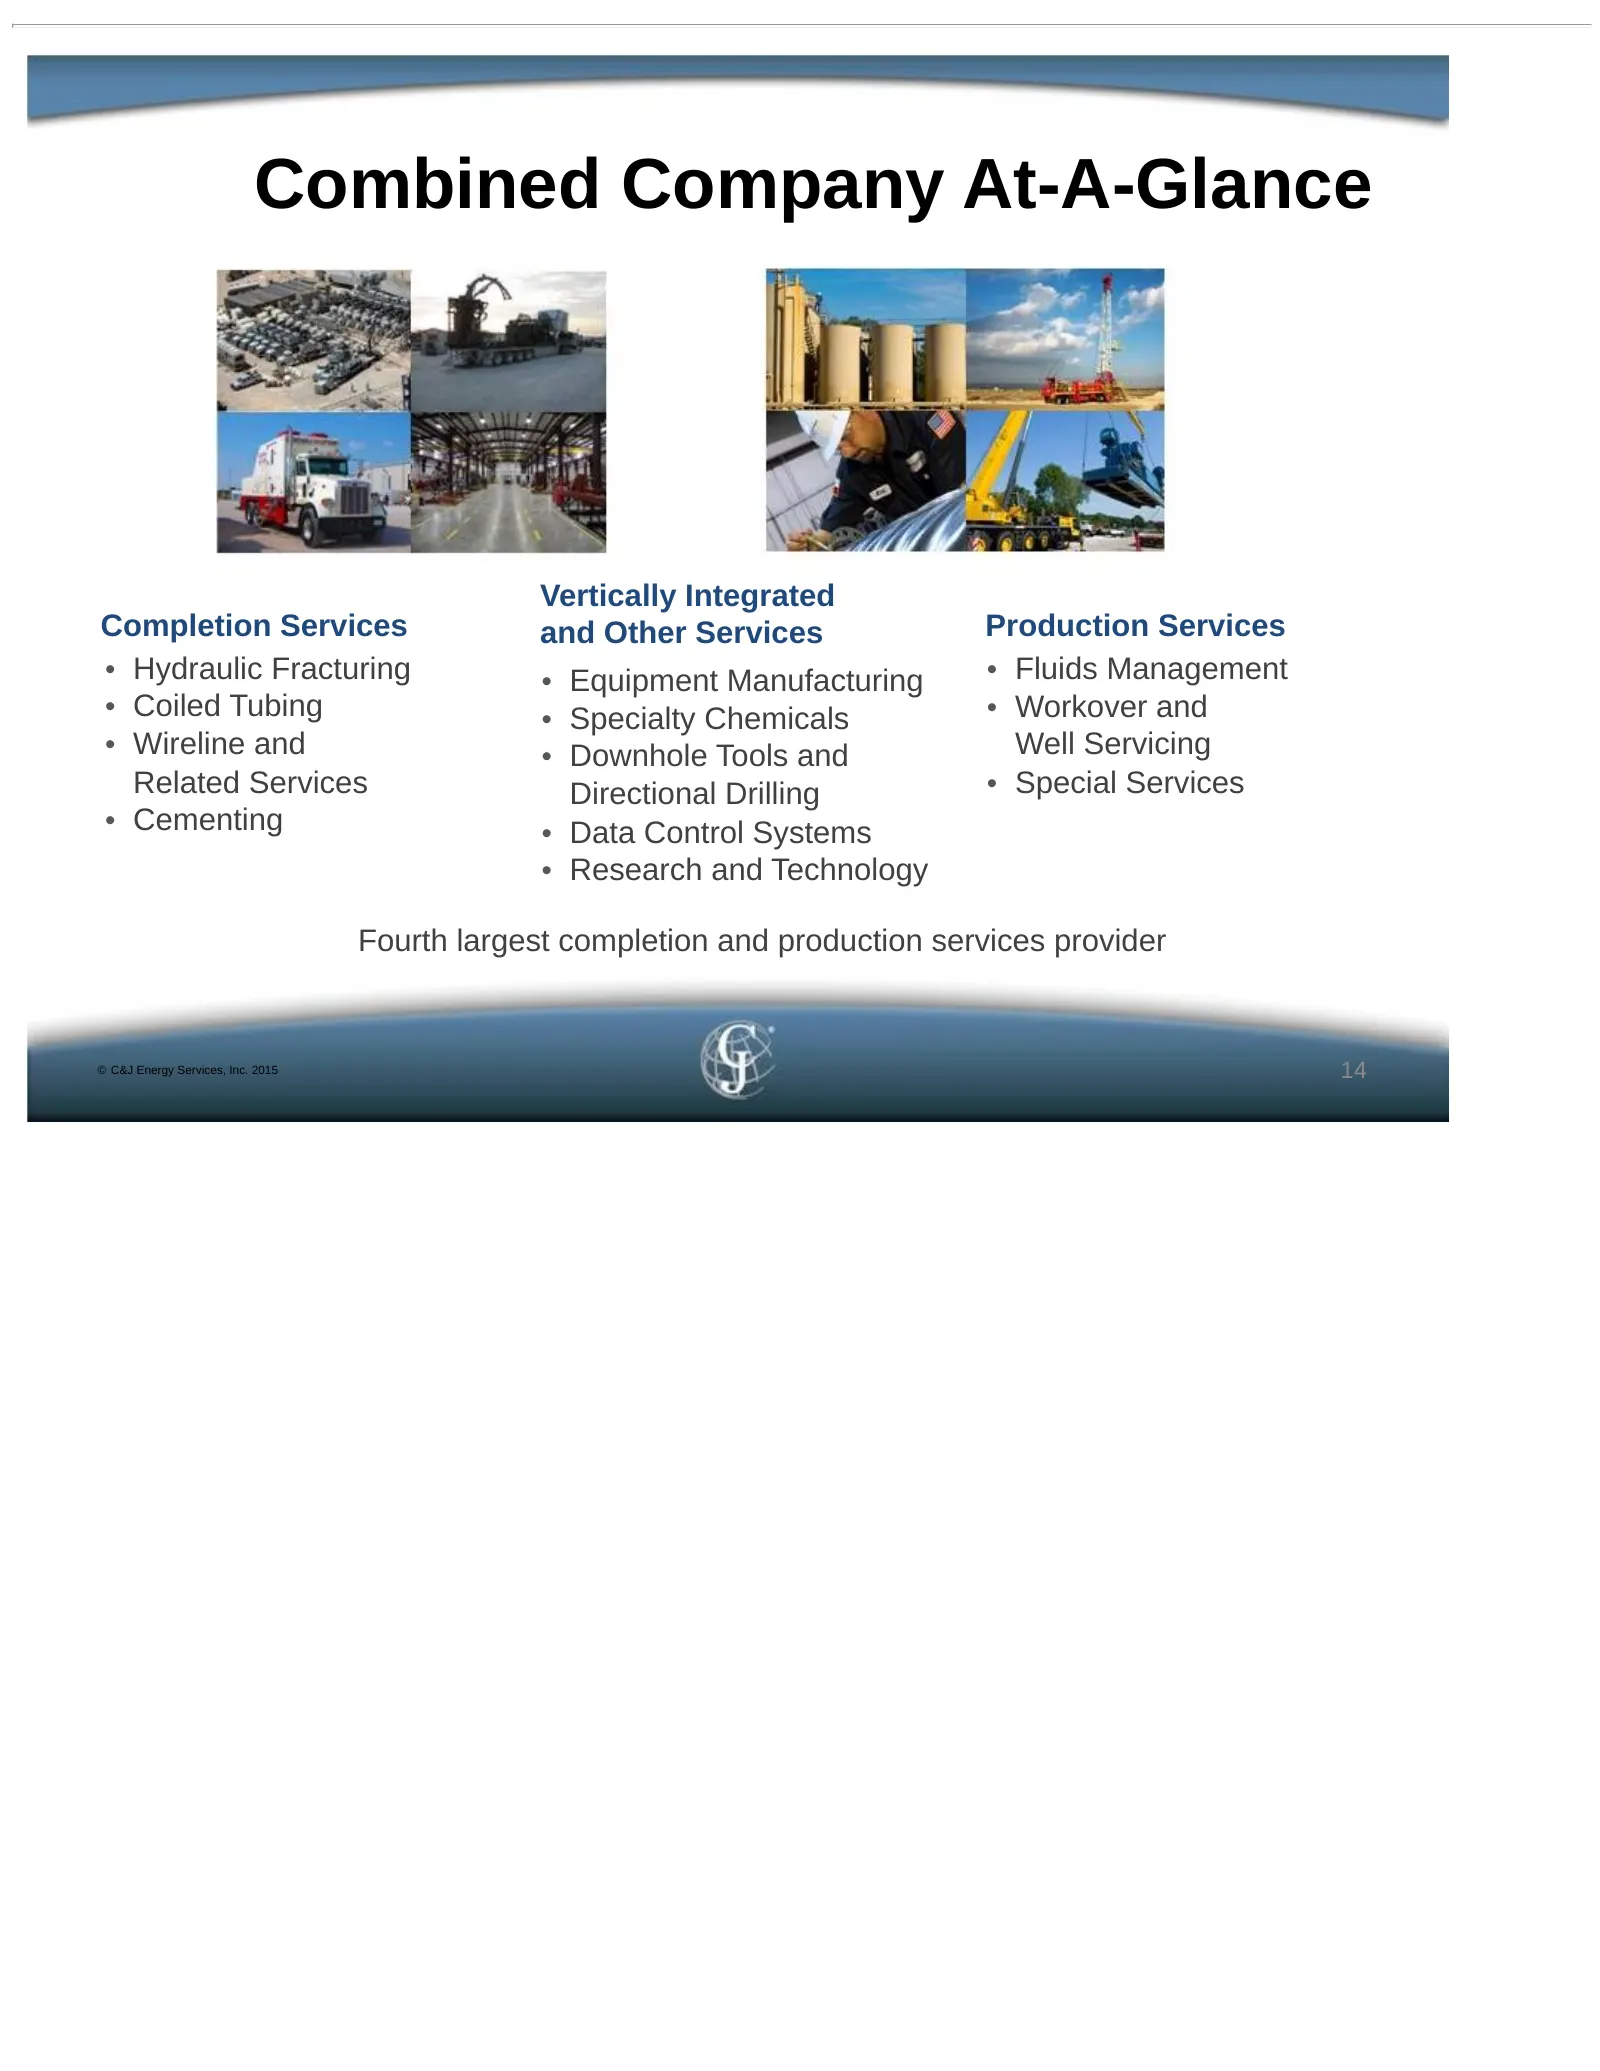
Combined Company At-A-Glance Vertically Integrated Completion Services and Other Services Production Services • Hydraulic Fracturing • Equipment Manufacturing • Fluids Management • Coiled Tubing • Specialty Chemicals • Workover and • Wireline and • Downhole Tools and Well Servicing Related Services
Slide 15: Strategic Rationale
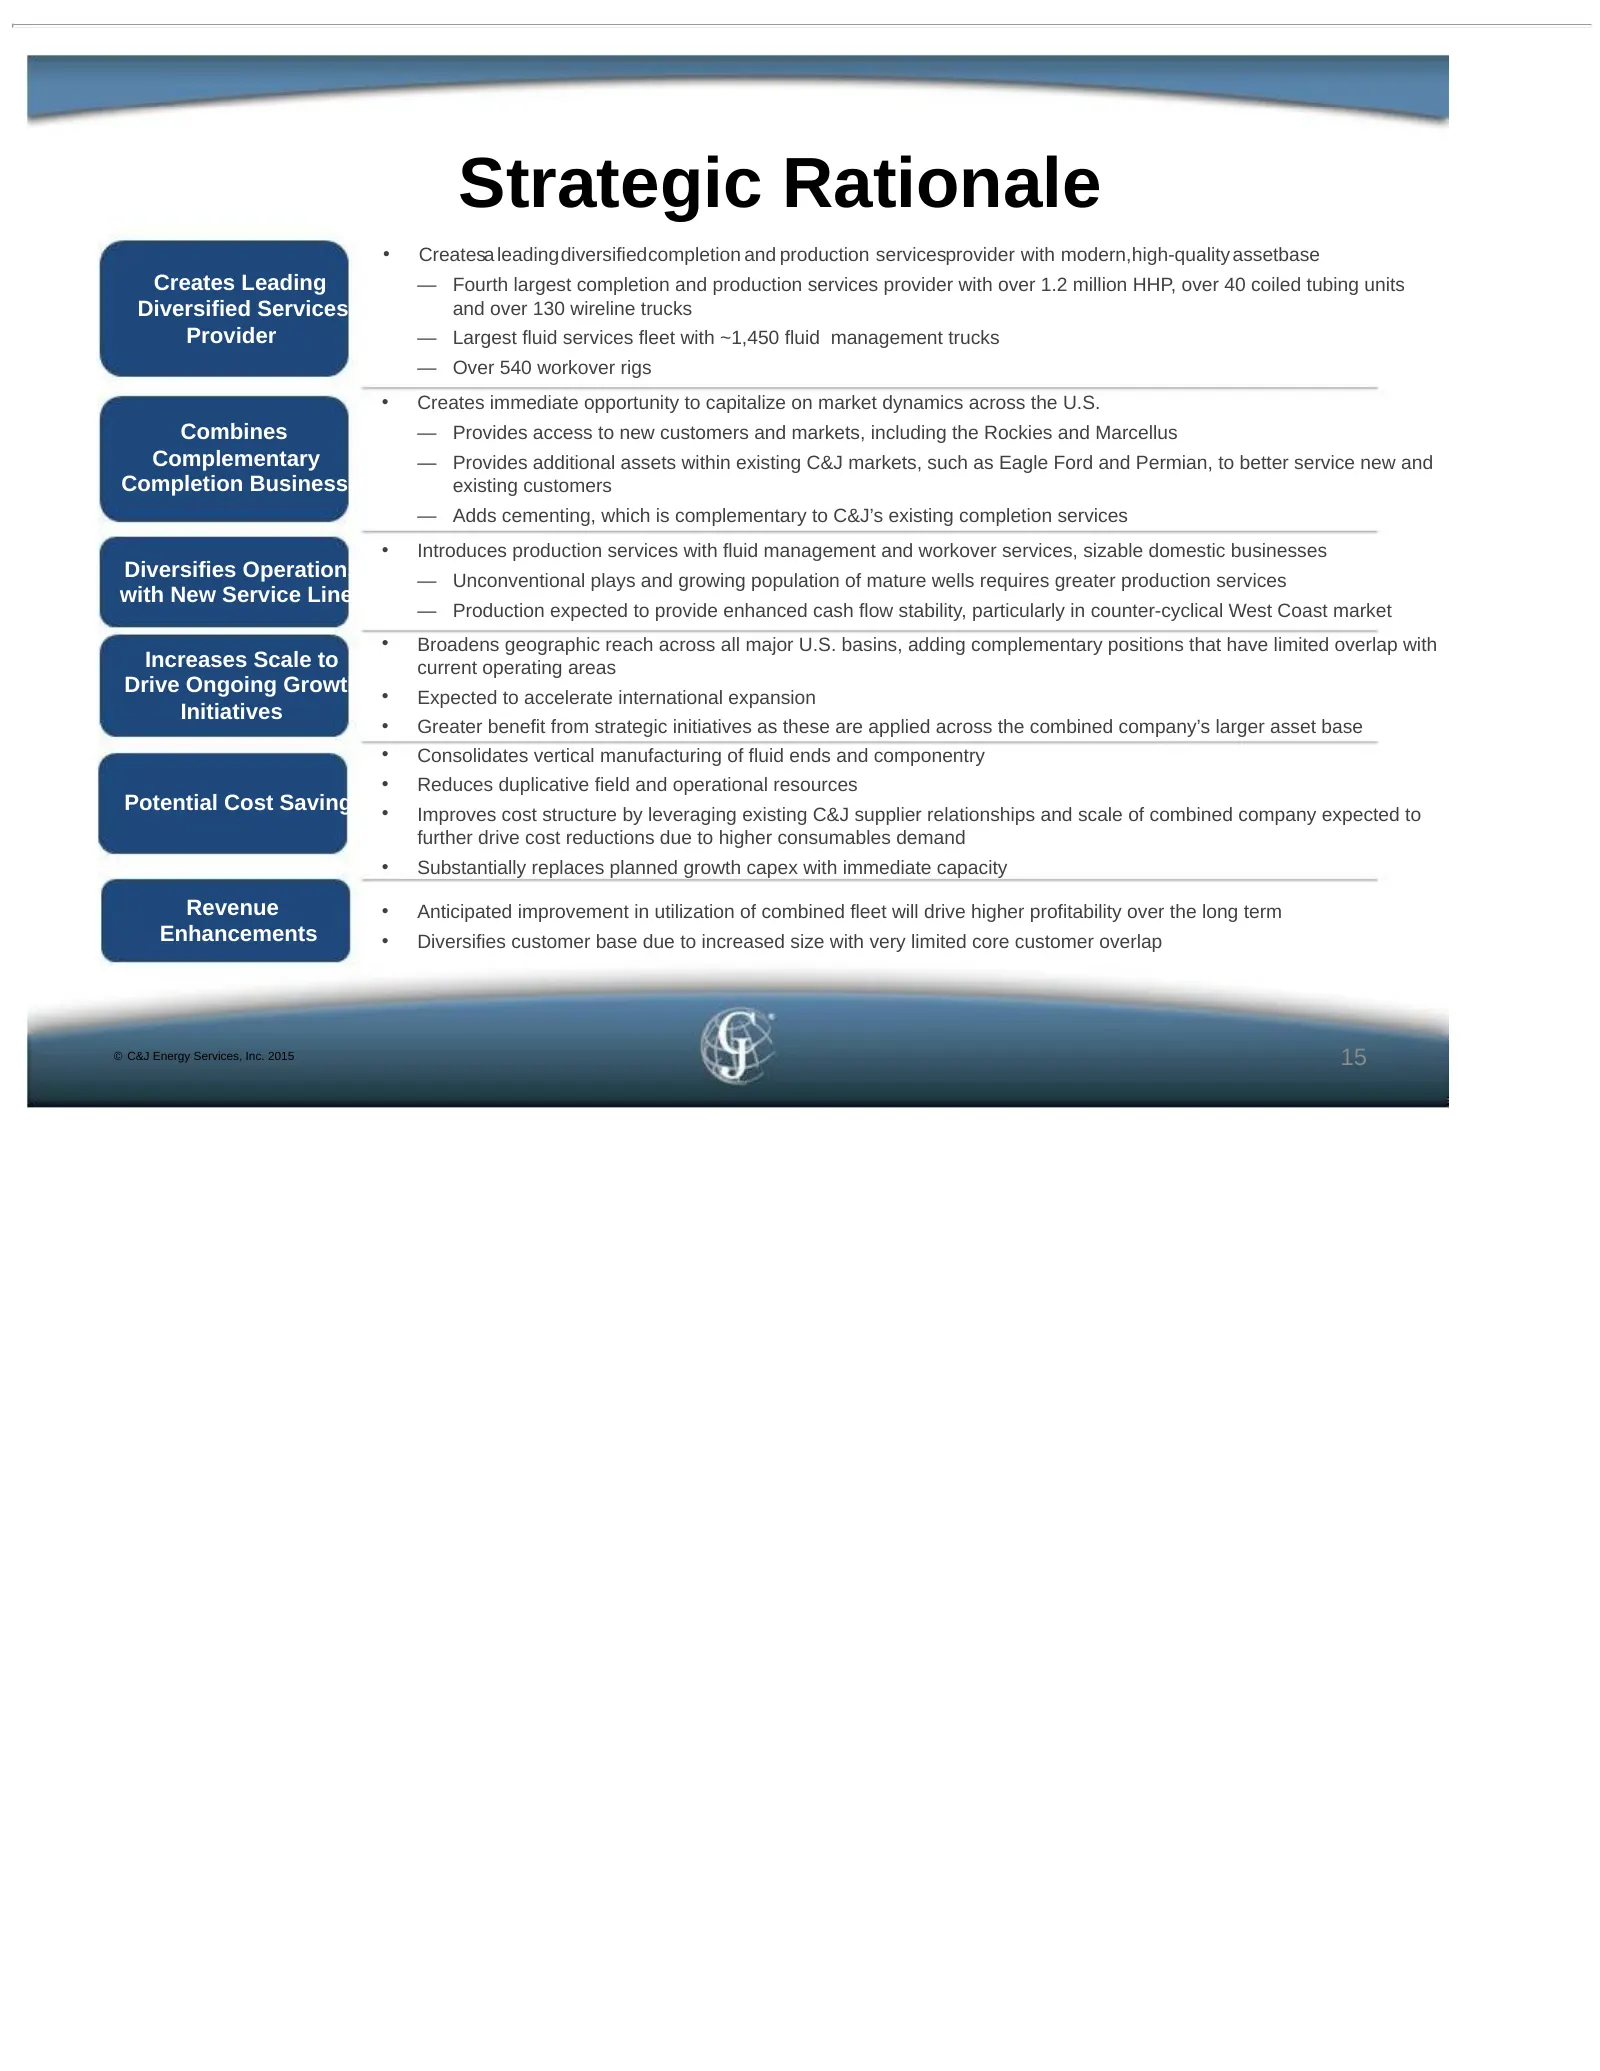
Strategic Rationale • Createsa leadingdiversifiedcompletion and production servicesprovider with modern,high-quality assetbase Creates Leading — Fourth largest completion and production services provider with over 1.2 million HHP, over 40 coiled tubing units Diversified Services and over 130 wirelin
Slide 16: New C&J – Completion Services
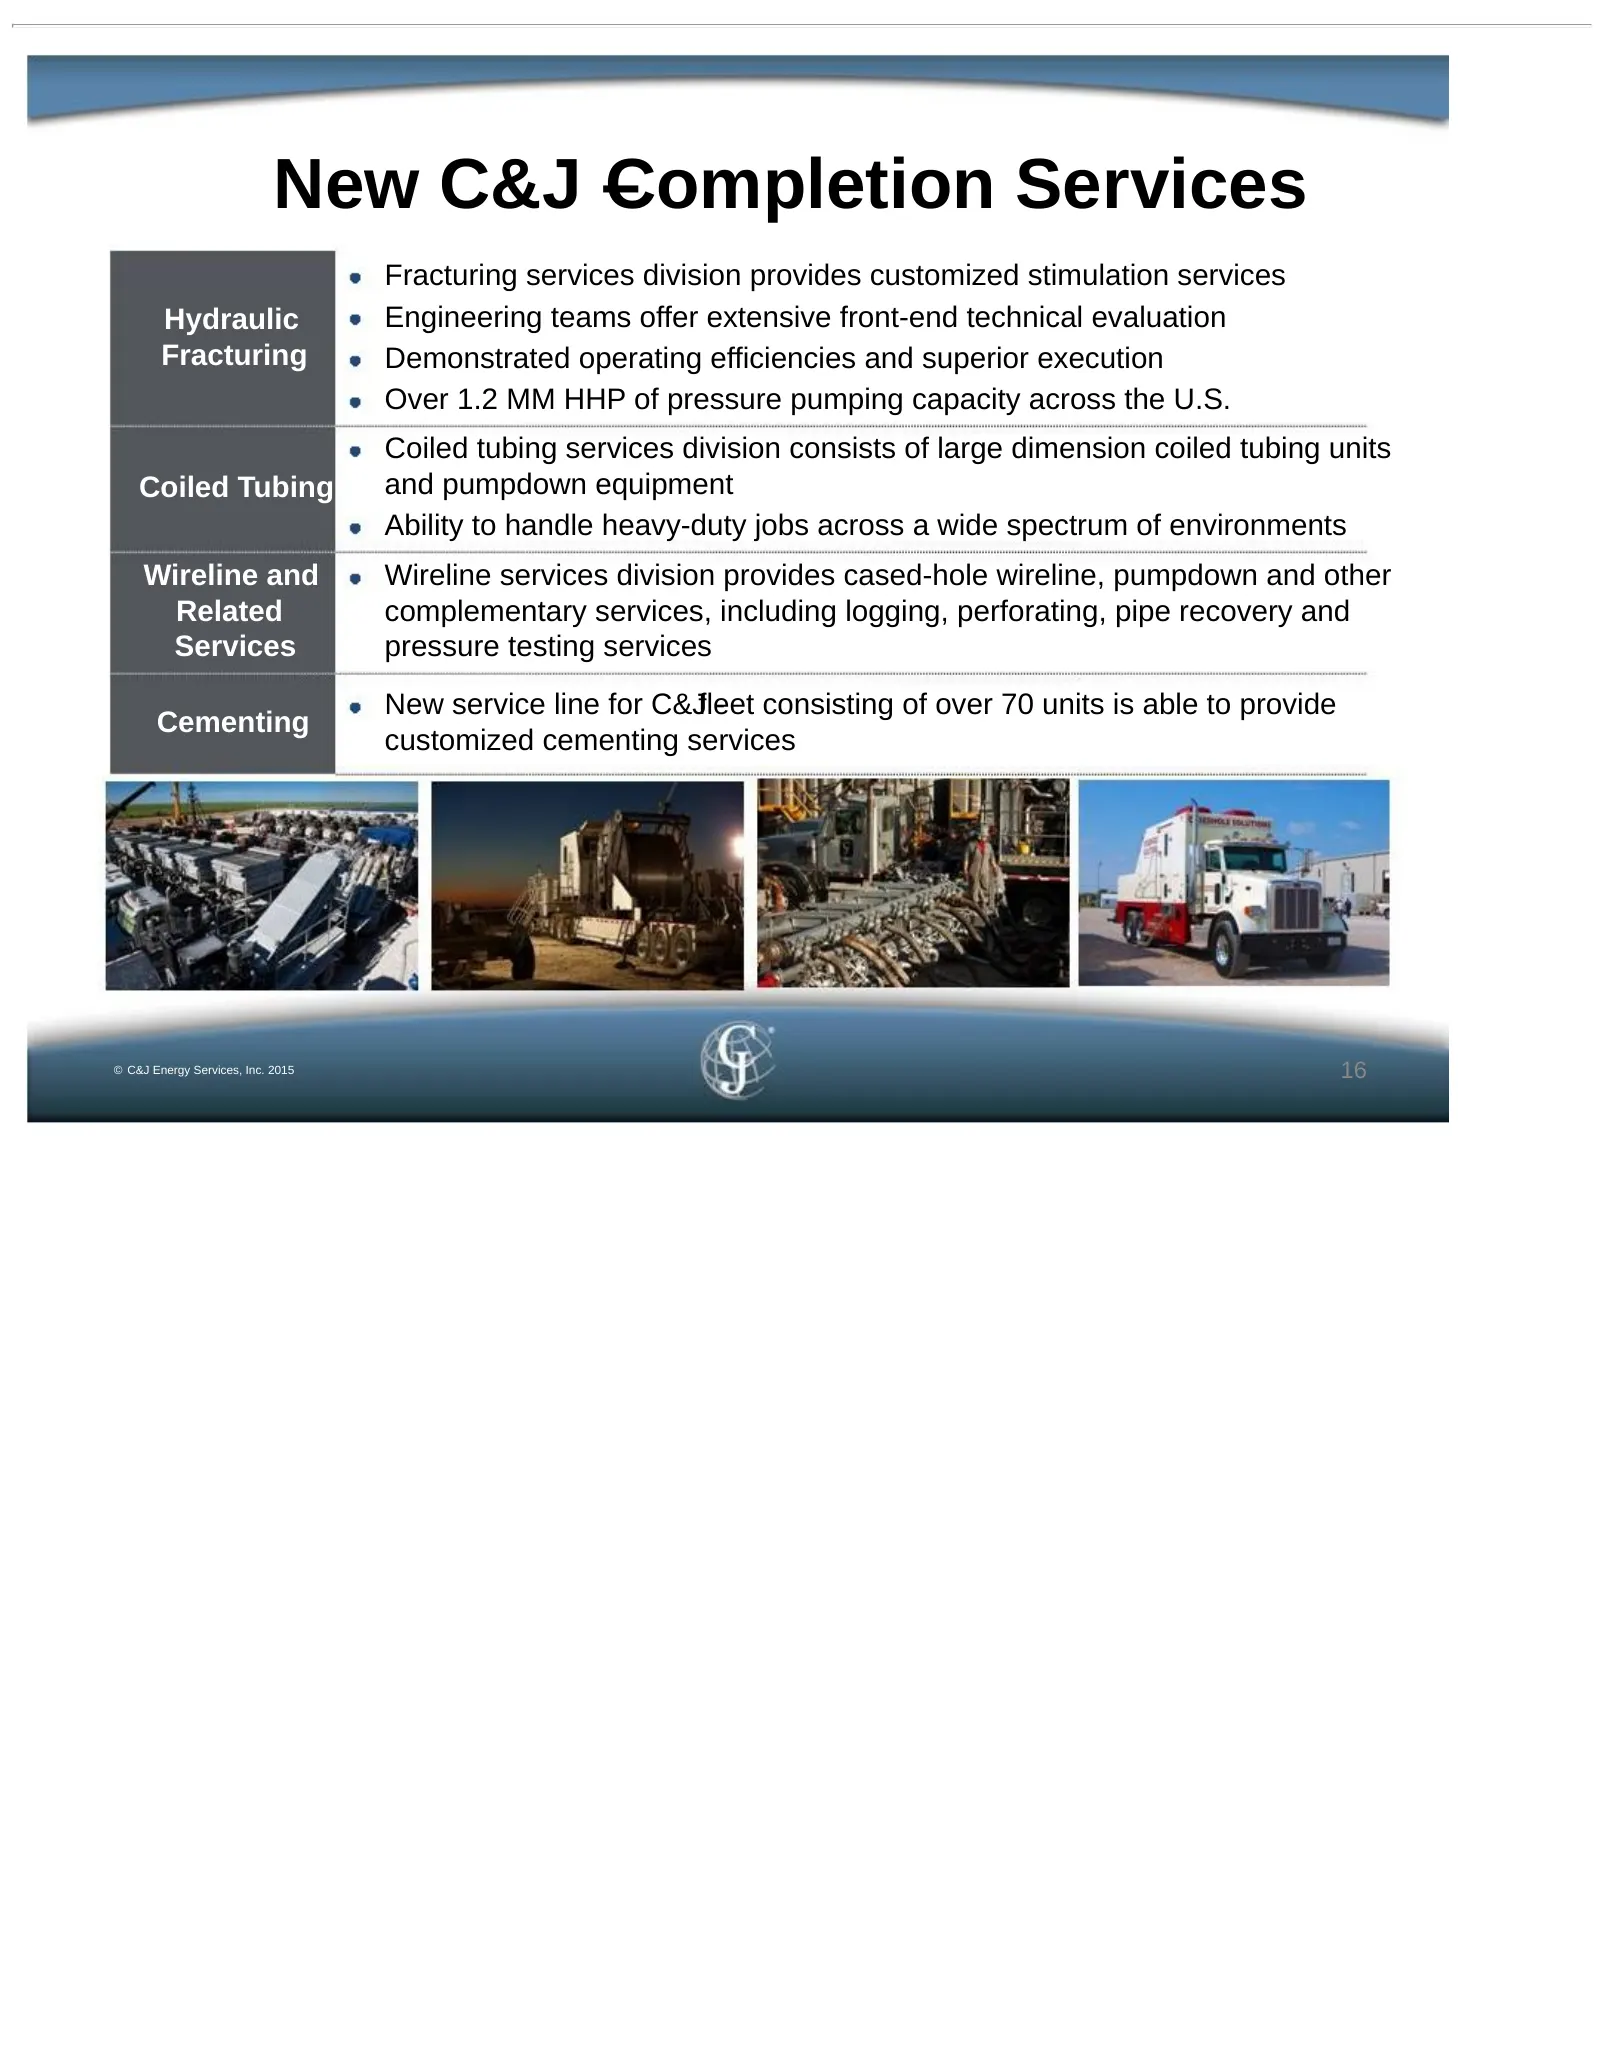
New C&J – Completion Services Fracturing services division provides customized stimulation services Hydraulic Engineering teams offer extensive front-end technical evaluation Fracturing Demonstrated operating efficiencies and superior execution Over 1.2 MM HHP of pressure pumping capacity across the
Slide 17: New C&J – Production Services
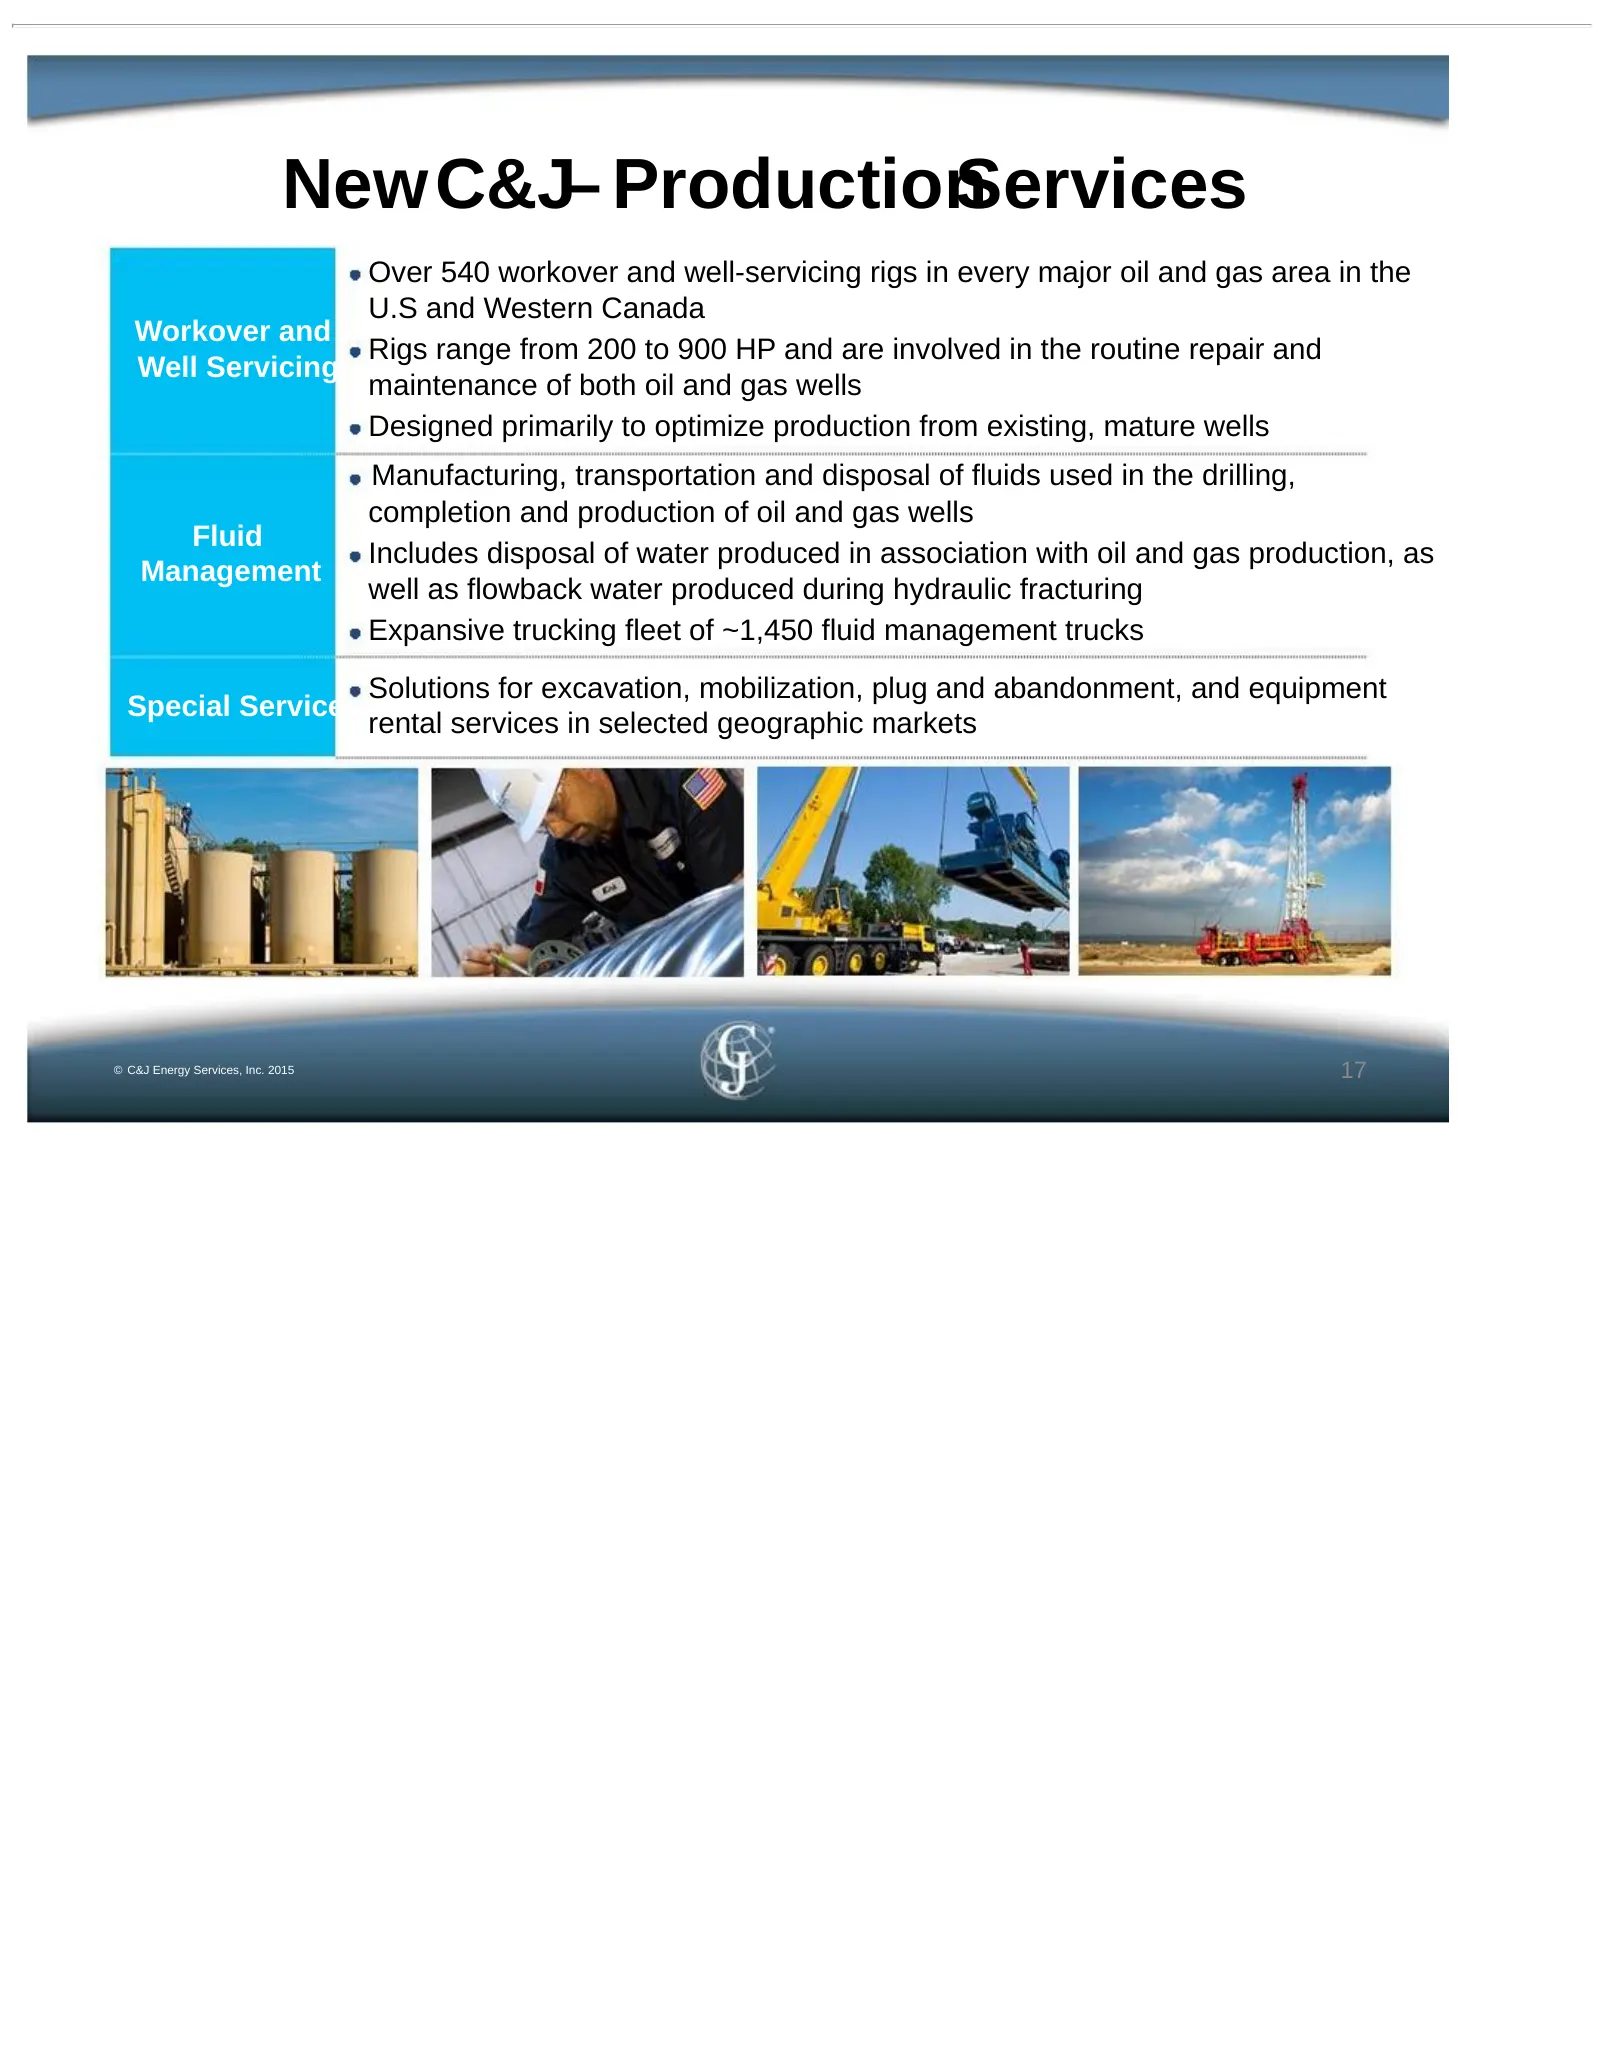
NewC&J– ProductionServices Over 540 workover and well-servicing rigs in every major oil and gas area in the U.S and Western Canada Workover and Rigs range from 200 to 900 HP and are involved in the routine repair and Well Servicing maintenance of both oil and gas wells Designed primarily to optimize
Slide 18: New C&J – Capital Structure and Liquidity
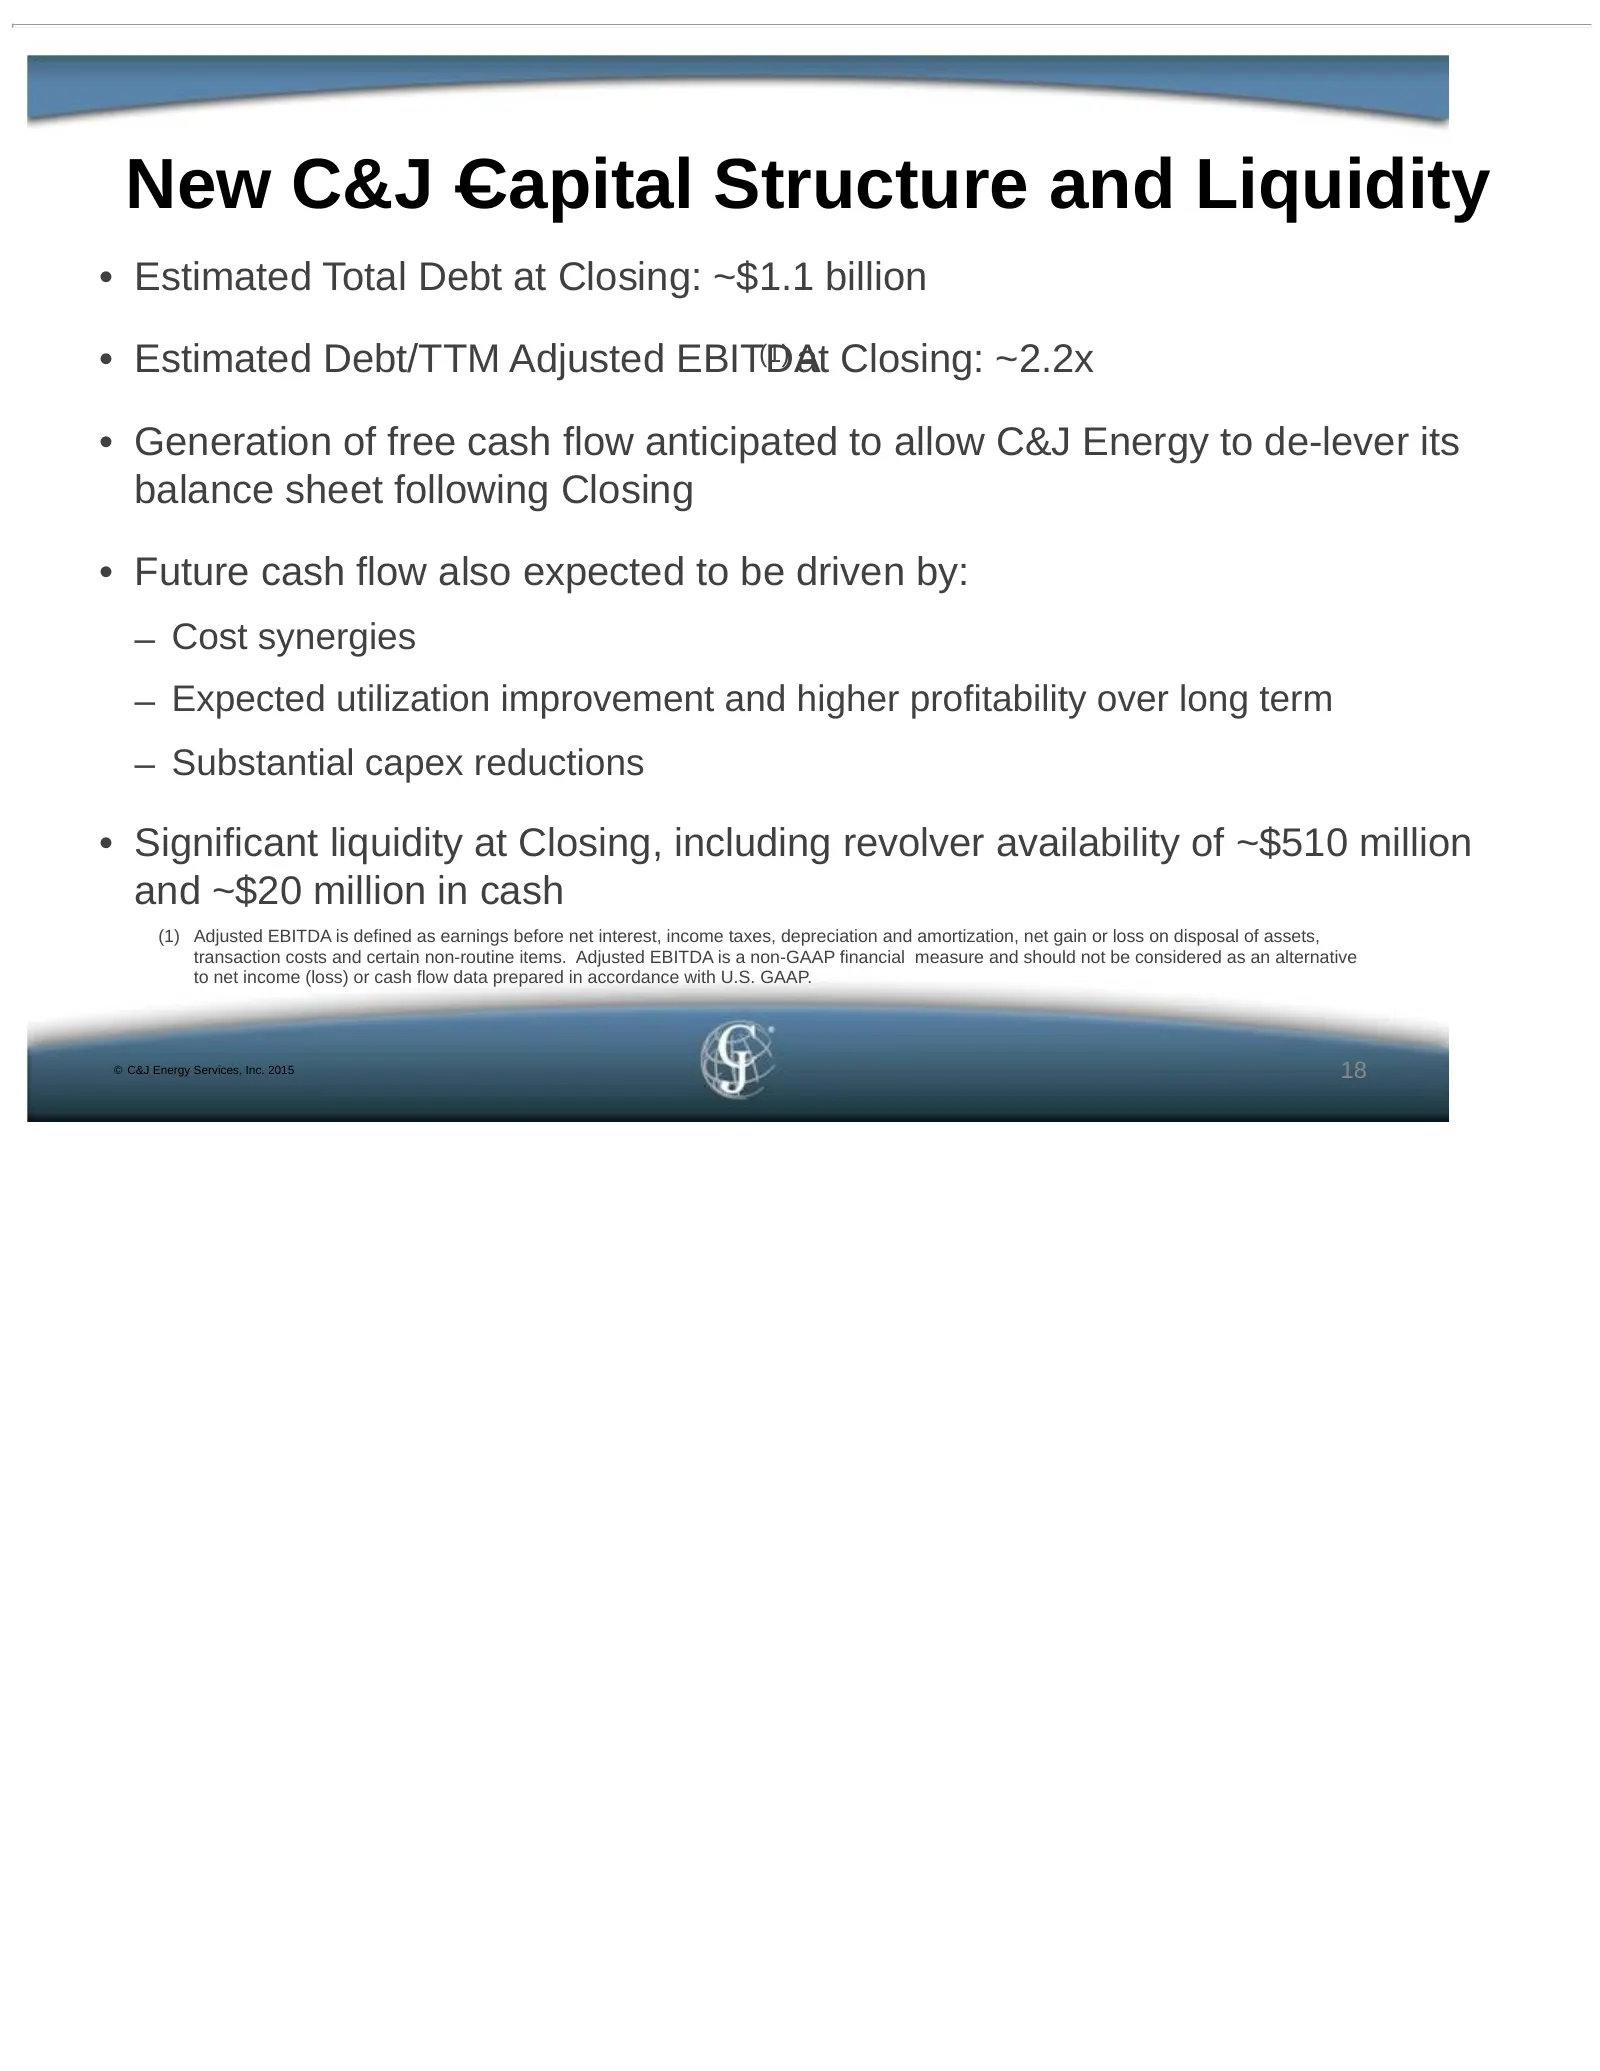
New C&J – Capital Structure and Liquidity • Estimated Total Debt at Closing: ~$1.1 billion • Estimated Debt/TTM Adjusted EBITDA (1) at Closing: ~2.2x • Generation of free cash flow anticipated to allow C&J Energy to de-lever its balance sheet following Closing • Future cash flow also expected to be
Slide 19: Experienced and Proven Leadership
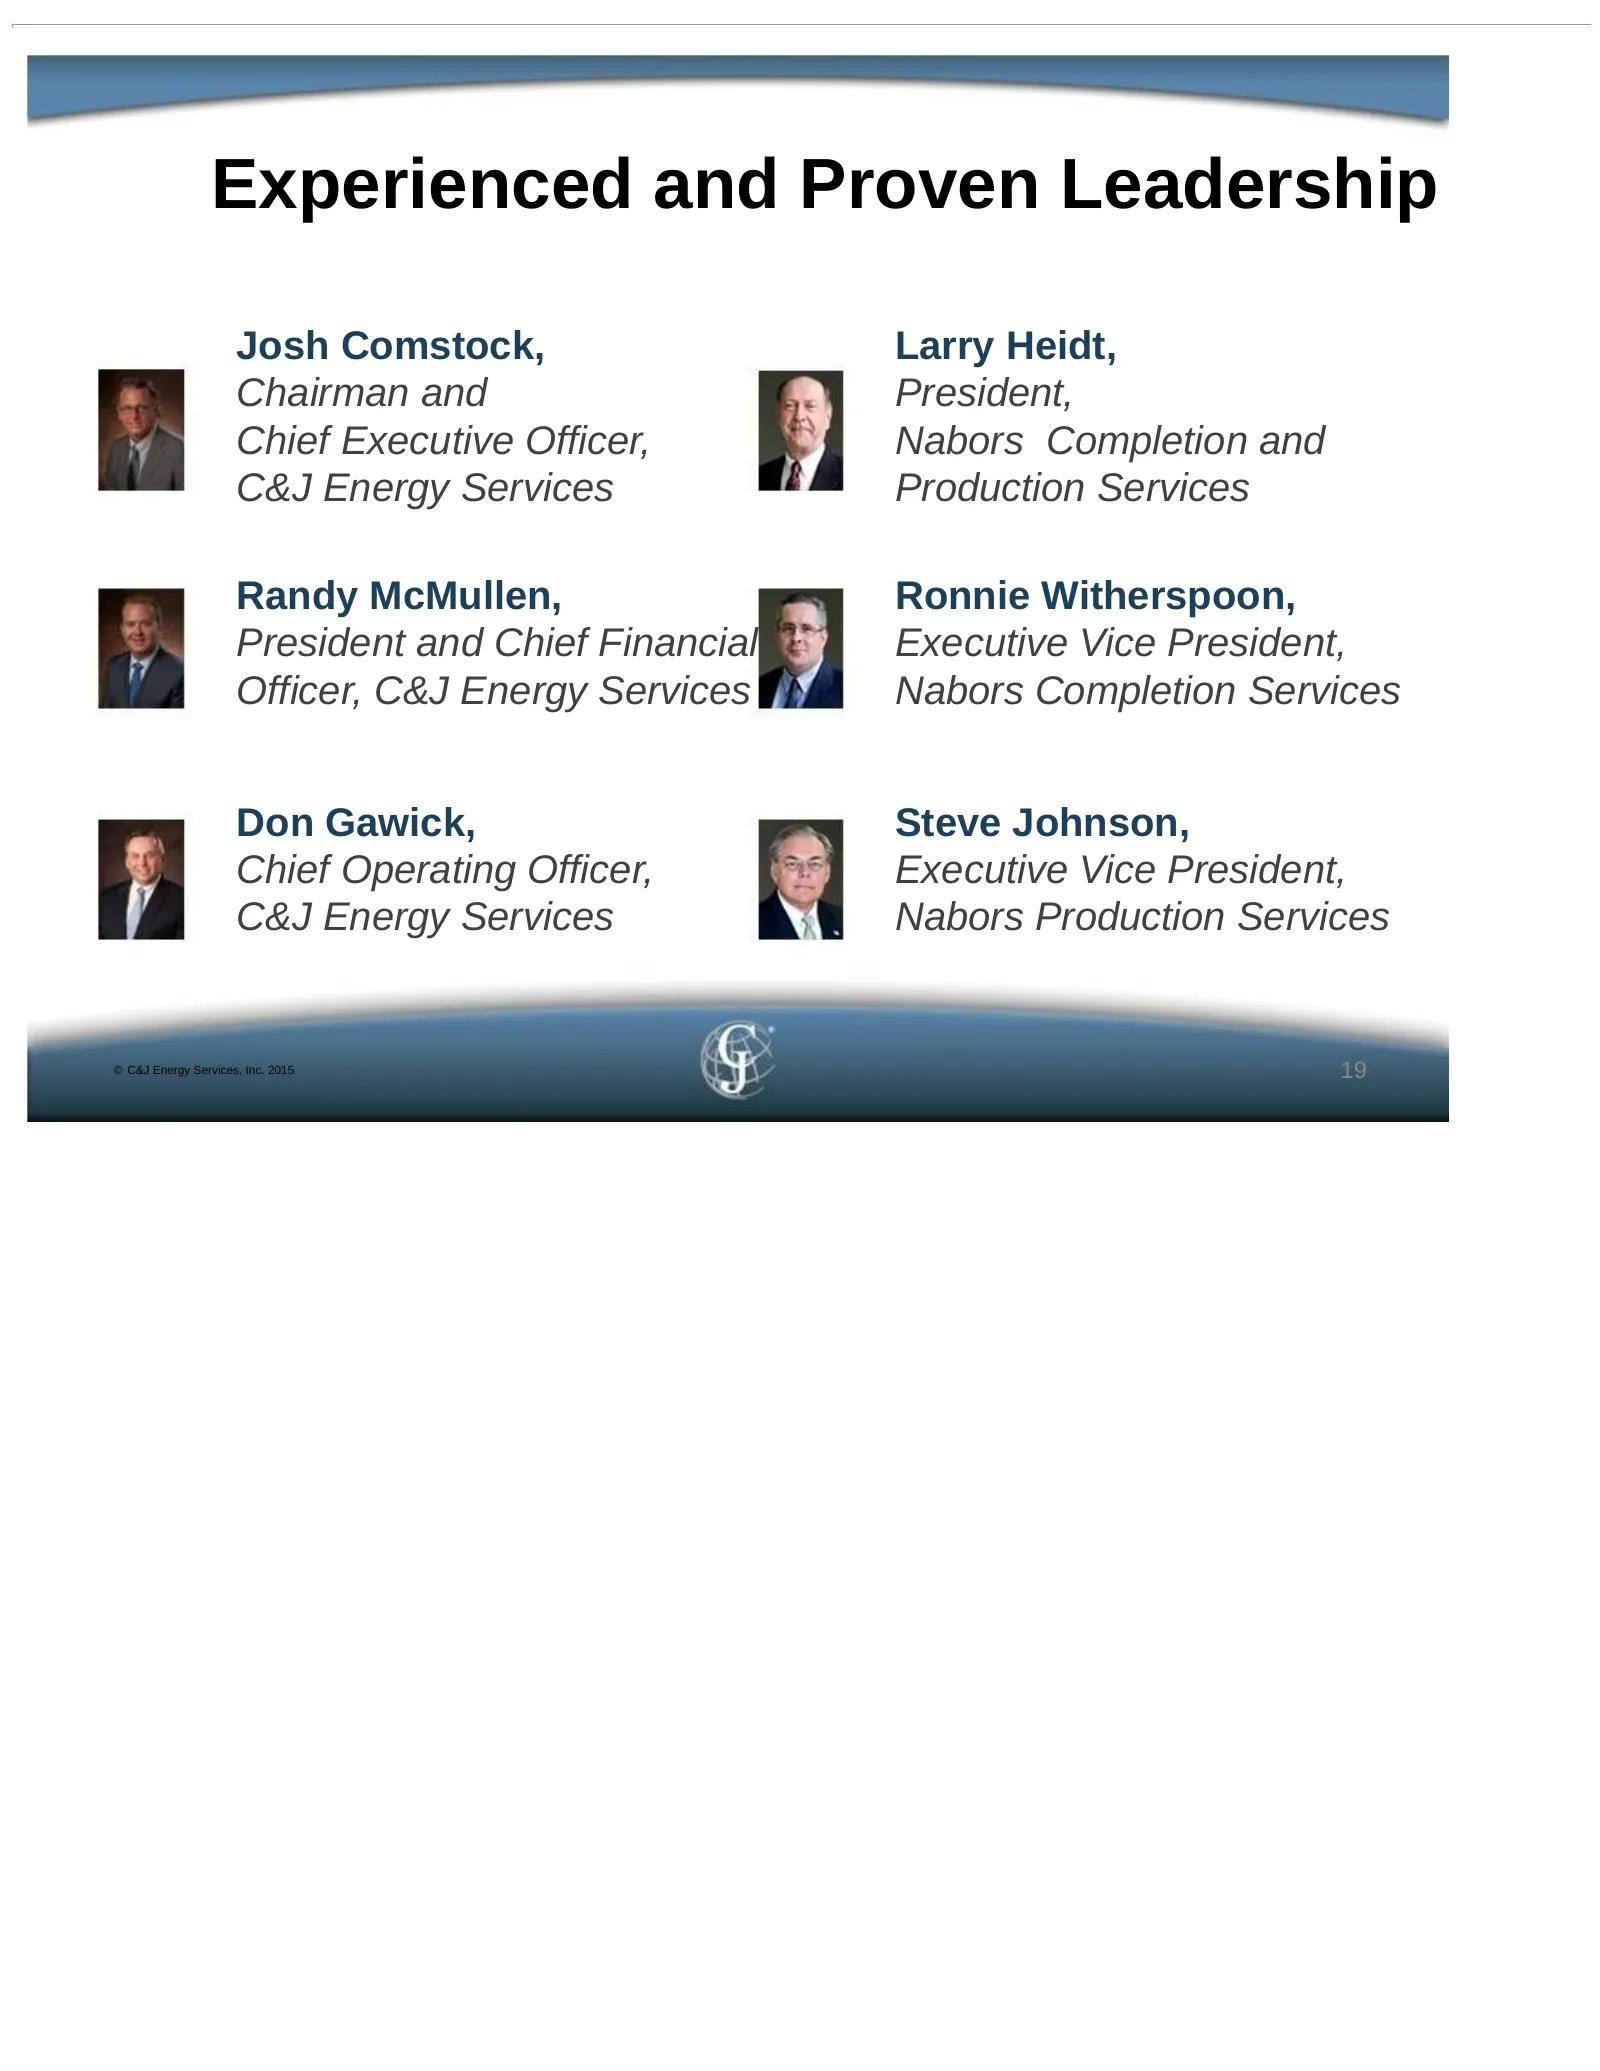
Experienced and Proven Leadership Josh Comstock, Larry Heidt, Chairman and President, Chief Executive Officer, Nabors Completion and C&J Energy Services Production Services Randy McMullen, Ronnie Witherspoon, President and Chief Financial Executive Vice President, Officer, C&J Energy Services Nabors
Slide 20: Appendix
Appendix
Slide 21: Nabors C&P Transaction Overview
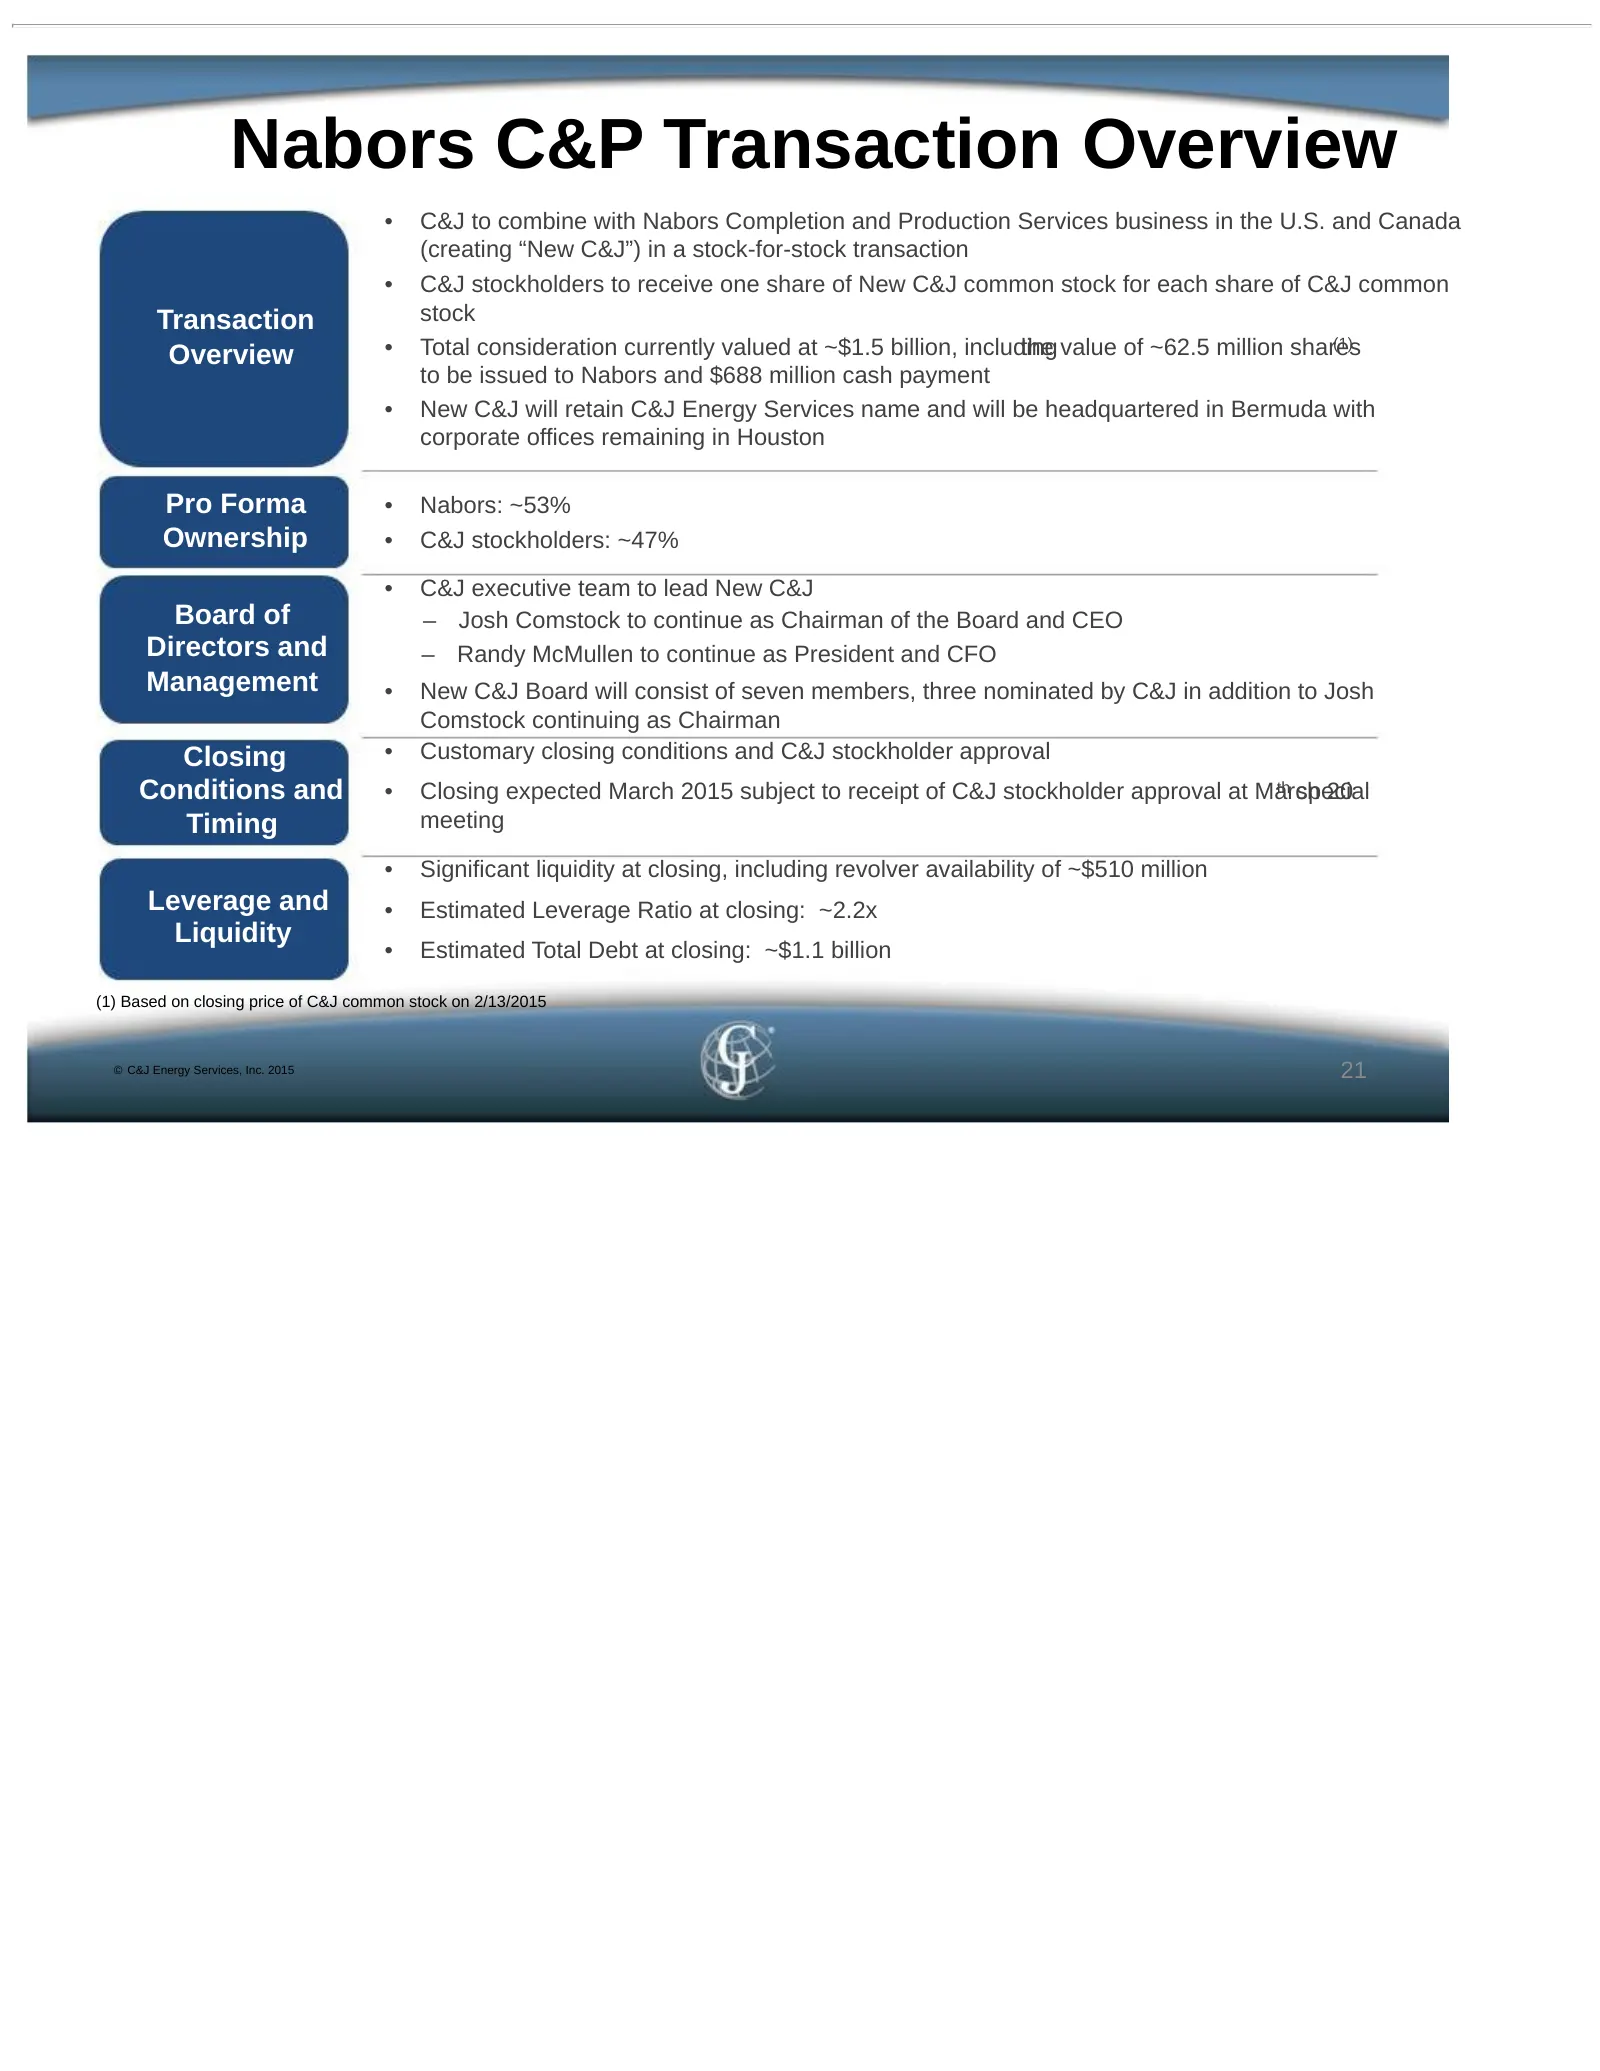
Nabors C&P Transaction Overview • C&J to combine with Nabors Completion and Production Services business in the U.S. and Canada (creating “New C&J”) in a stock-for-stock transaction • C&J stockholders to receive one share of New C&J common stock for each share of C&J common Transaction stock Overvie
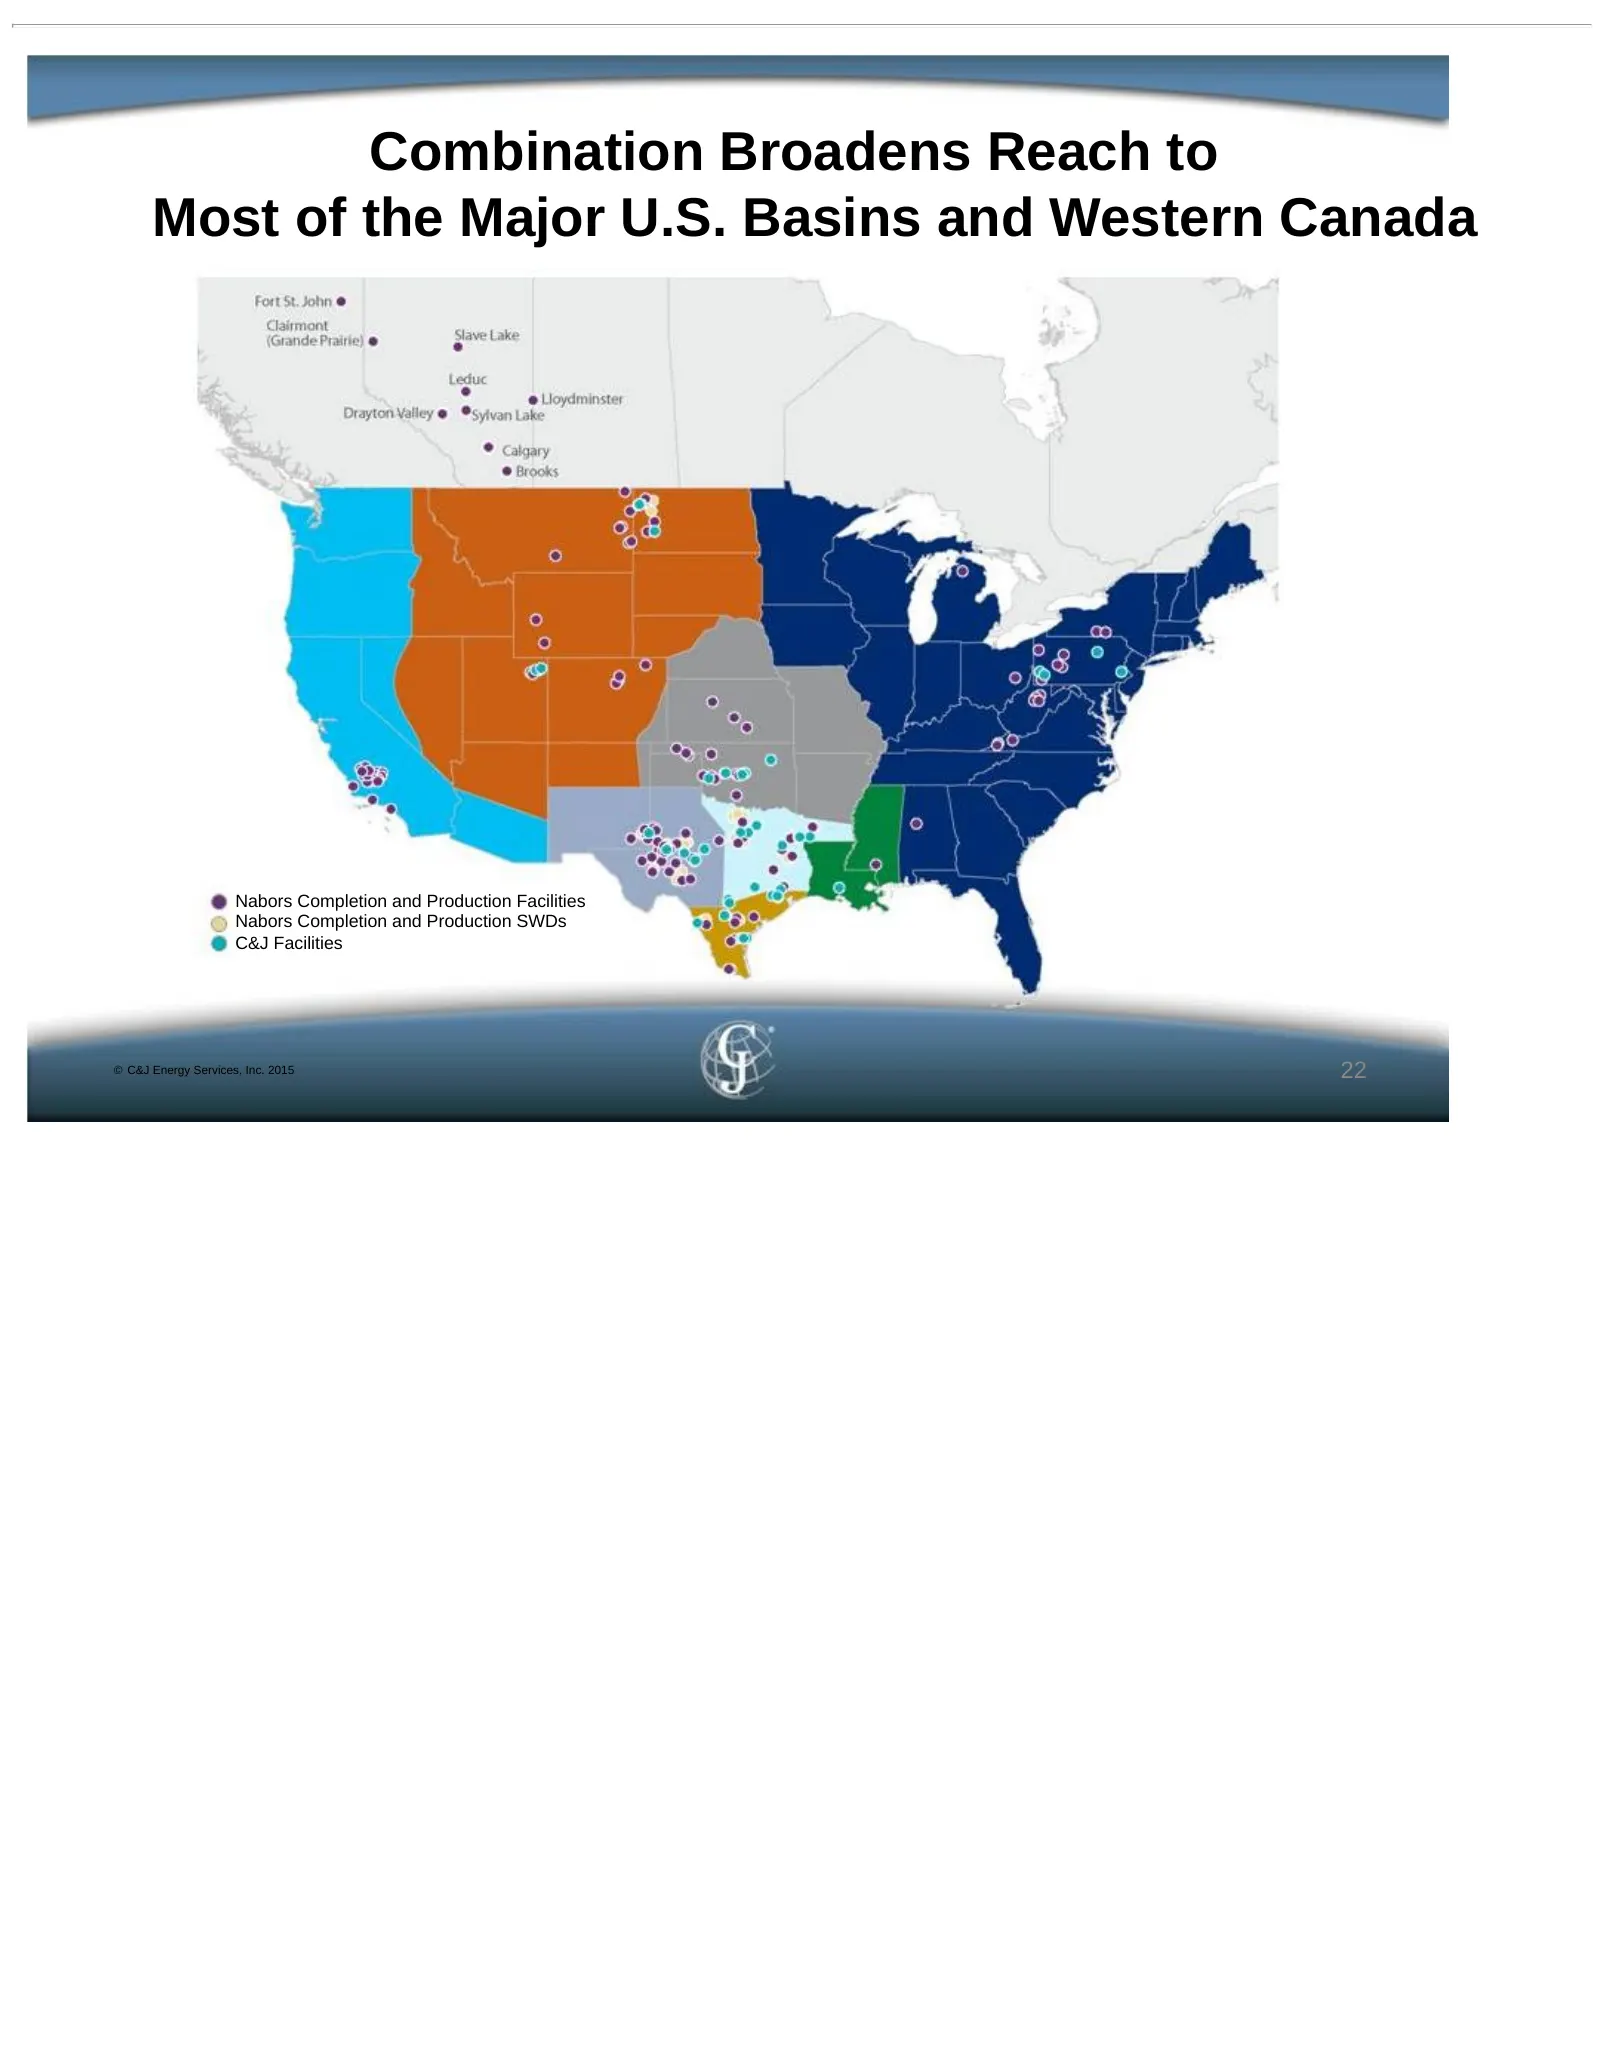
Slide 22: Combination Broadens Reach to Most of the Major U.S. Basins and Western Canada
Combination Broadens Reach to Most of the Major U.S. Basins and Western Canada Nabors Completion and Production Facilities Nabors Completion and Production SWDs C&J Facilities © C&J Energy Services, Inc. 2015 22
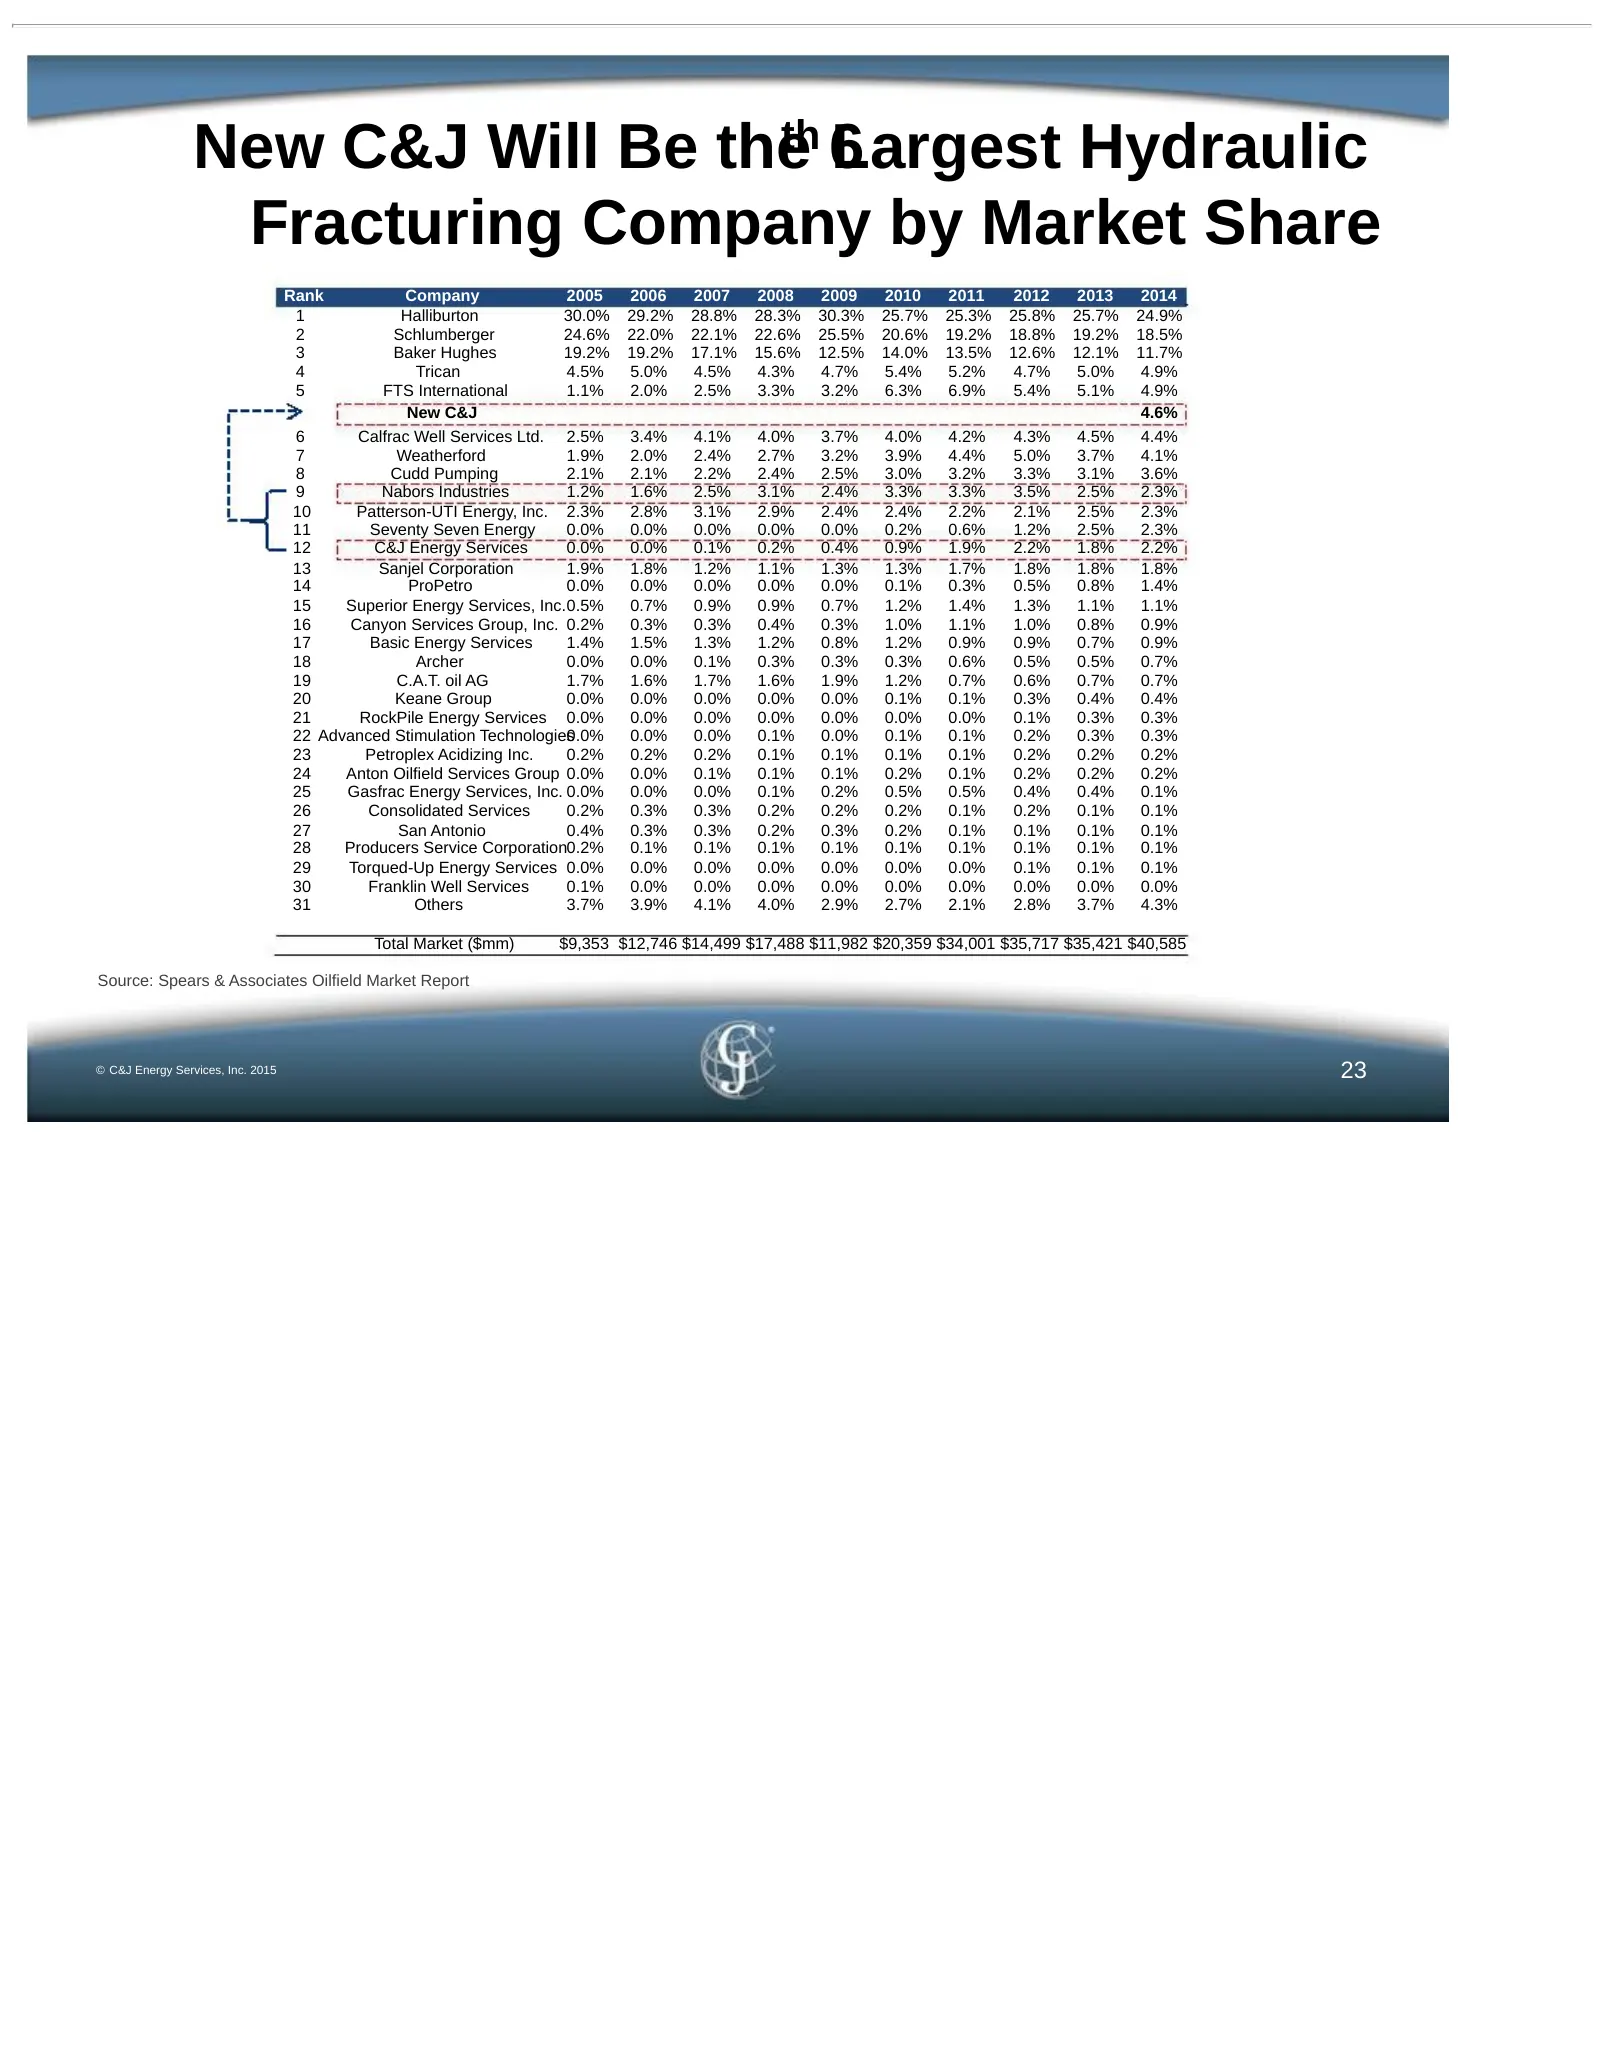
Slide 23: New C&J Will Be the 6th Largest Hydraulic Fracturing Company by Market Share
New C&J Will Be theth 6 Largest Hydraulic Fracturing Company by Market Share Rank Company 2005 2006 2007 2008 2009 2010 2011 2012 2013 2014 1 Halliburton 30.0% 29.2% 28.8% 28.3% 30.3% 25.7% 25.3% 25.8% 25.7% 24.9% 2 Schlumberger 24.6% 22.0% 22.1% 22.6% 25.5% 20.6% 19.2% 18.8% 19.2% 18.5% 3 Baker Hug
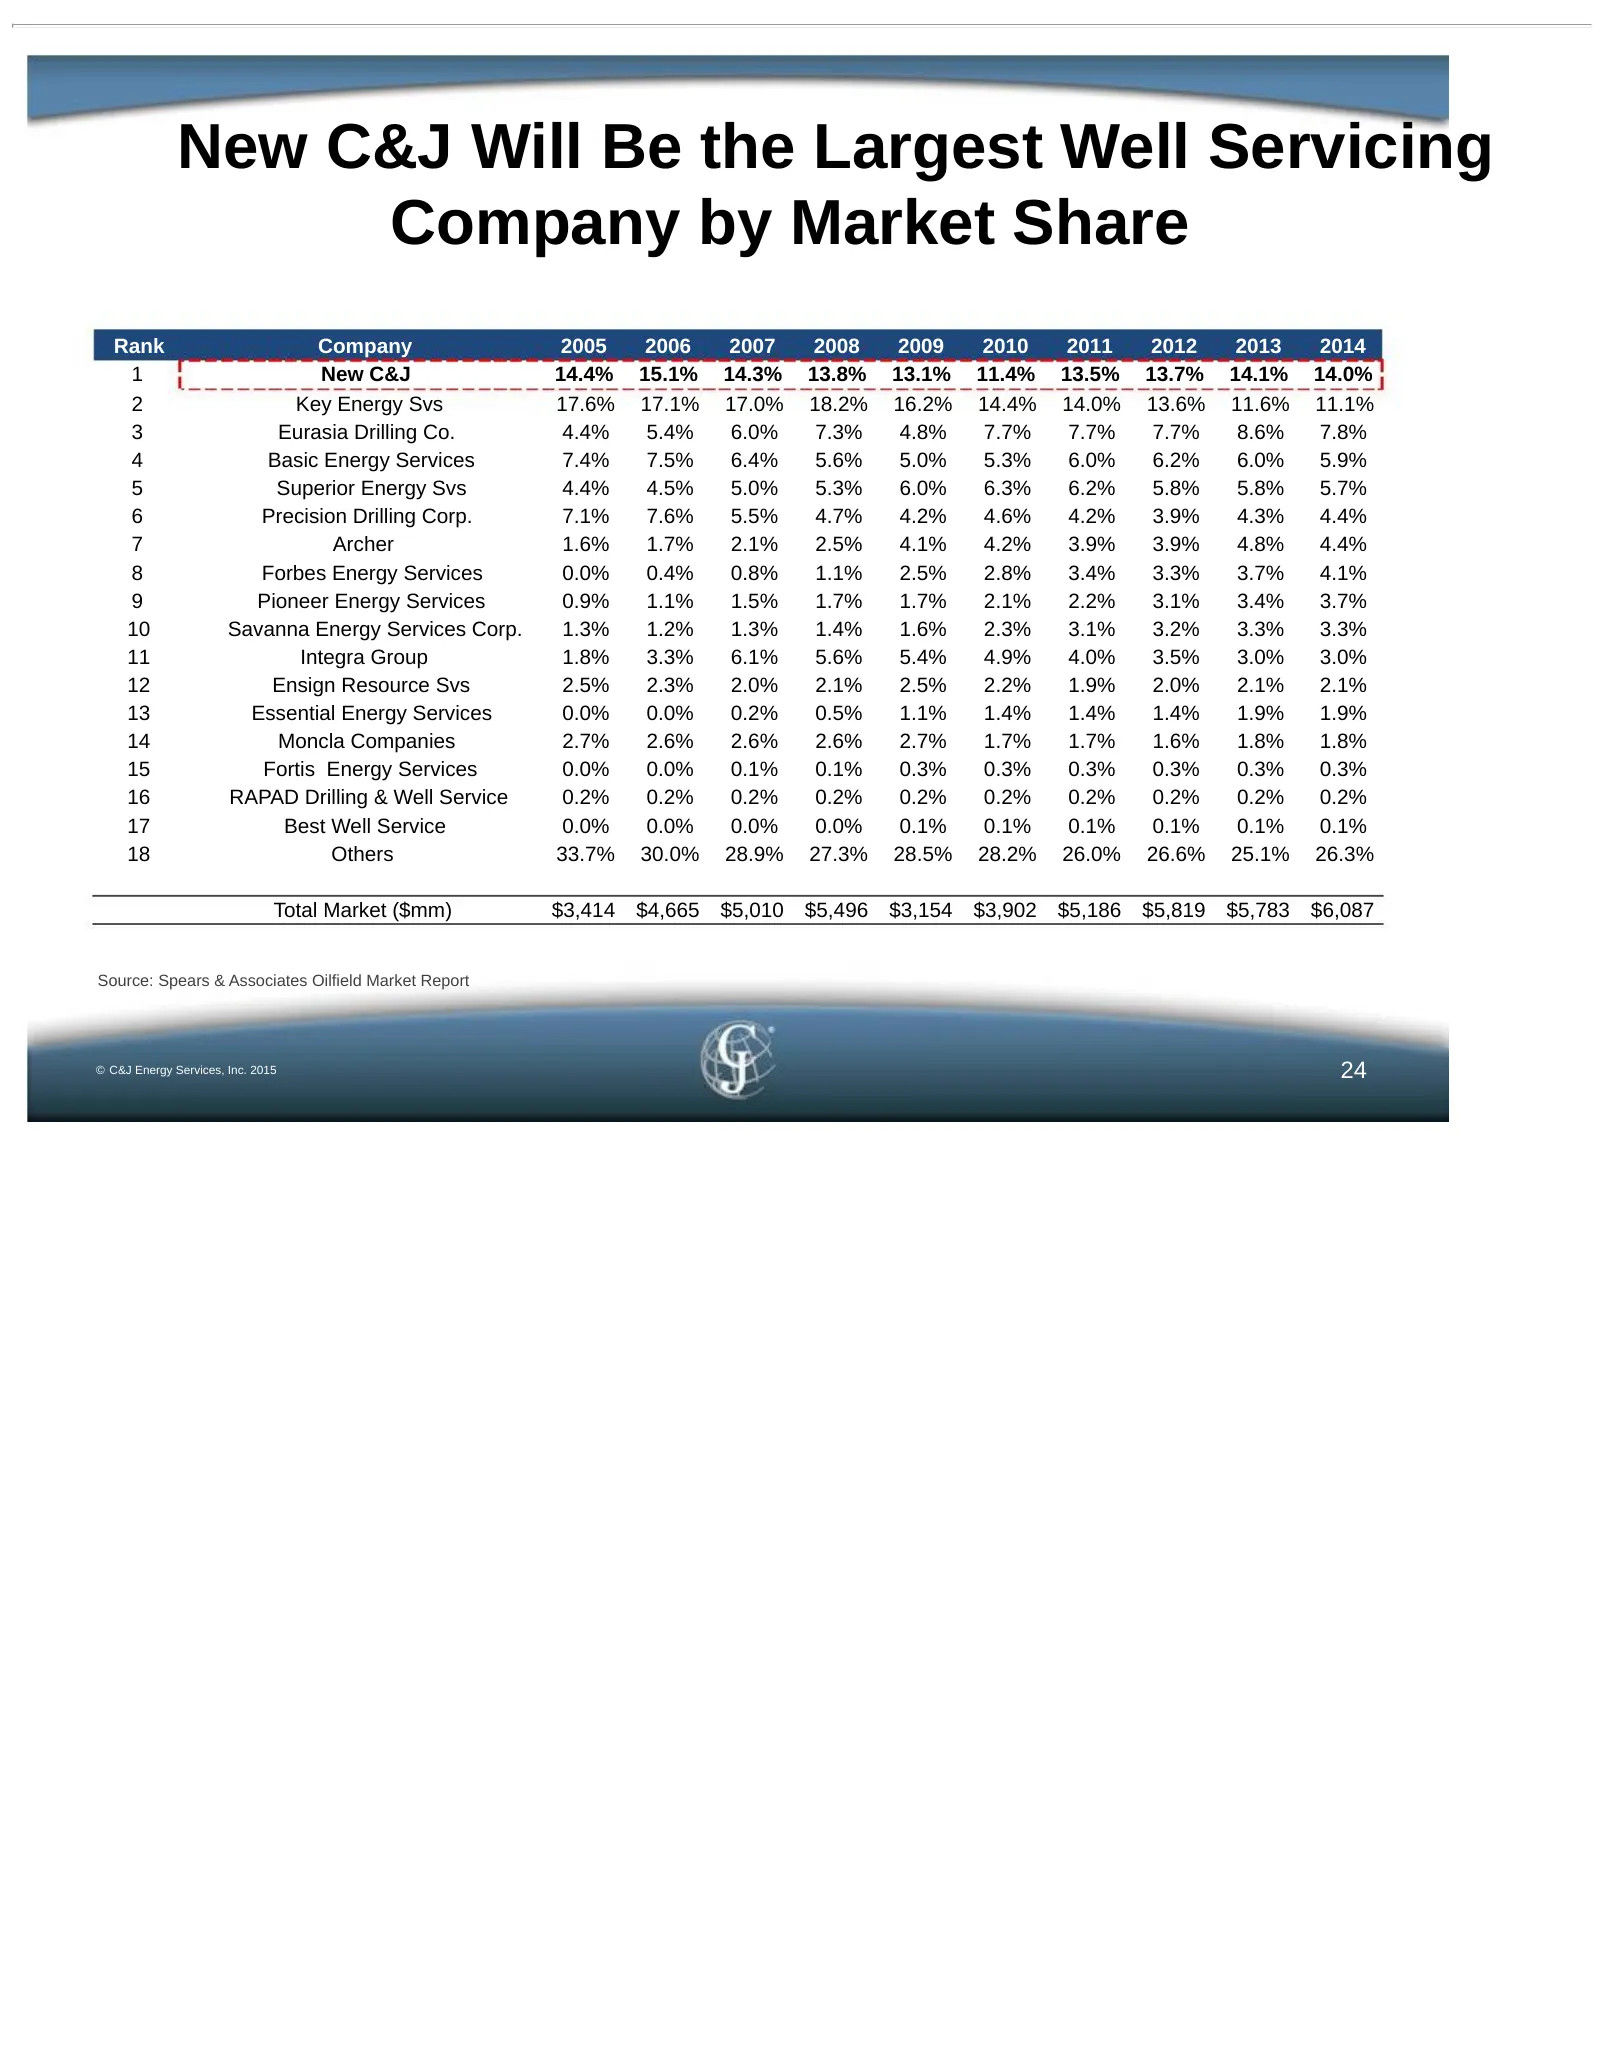
Slide 24: New C&J Will Be the Largest Well Servicing Company by Market Share
New C&J Will Be the Largest Well Servicing Company by Market Share Rank Company 2005 2006 2007 2008 2009 2010 2011 2012 2013 2014 1 New C&J 14.4% 15.1% 14.3% 13.8% 13.1% 11.4% 13.5% 13.7% 14.1% 14.0% 2 Key Energy Svs 17.6% 17.1% 17.0% 18.2% 16.2% 14.4% 14.0% 13.6% 11.6% 11.1% 3 Eurasia Drilling Co.
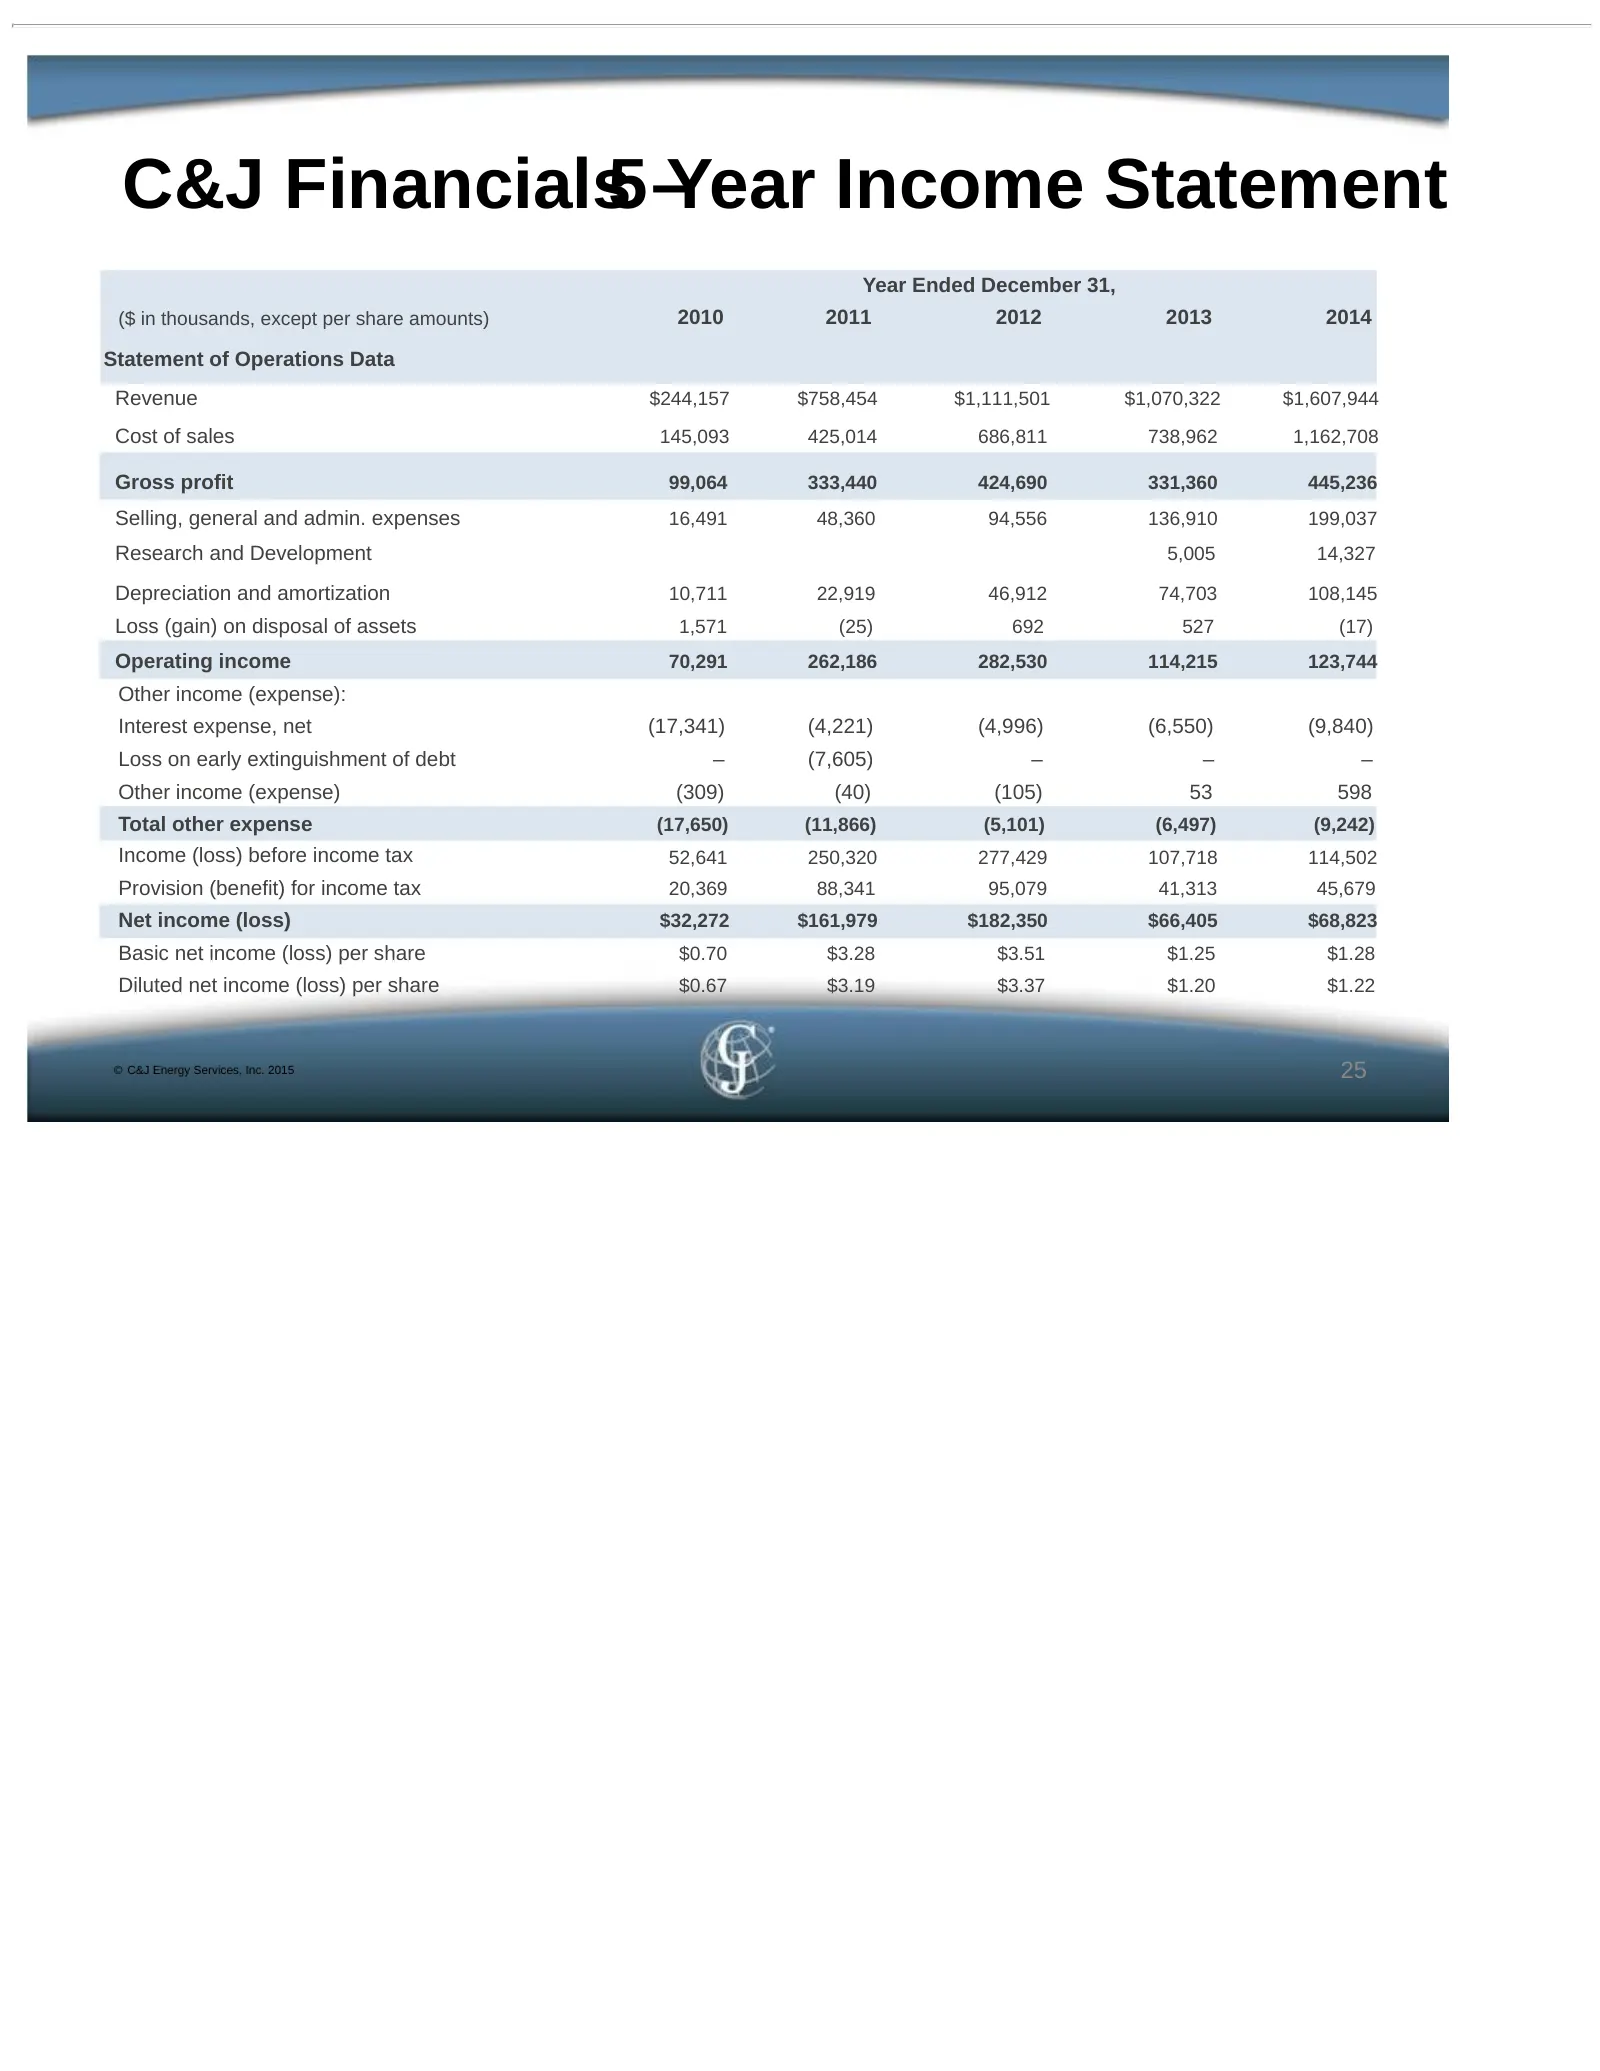
Slide 25: C&J Financials 5-Year Income Statement
C&J Financials5 –Year Income Statement Year Ended December 31, ($ in thousands, except per share amounts) 2010 2011 2012 2013 2014 Statement of Operations Data Revenue $244,157 $758,454 $1,111,501 $1,070,322 $1,607,944 Cost of sales 145,093 425,014 686,811 738,962 1,162,708 Gross profit 99,064 333,4
Slide 26: C&J Financials 5-Year Cash Flow Statement
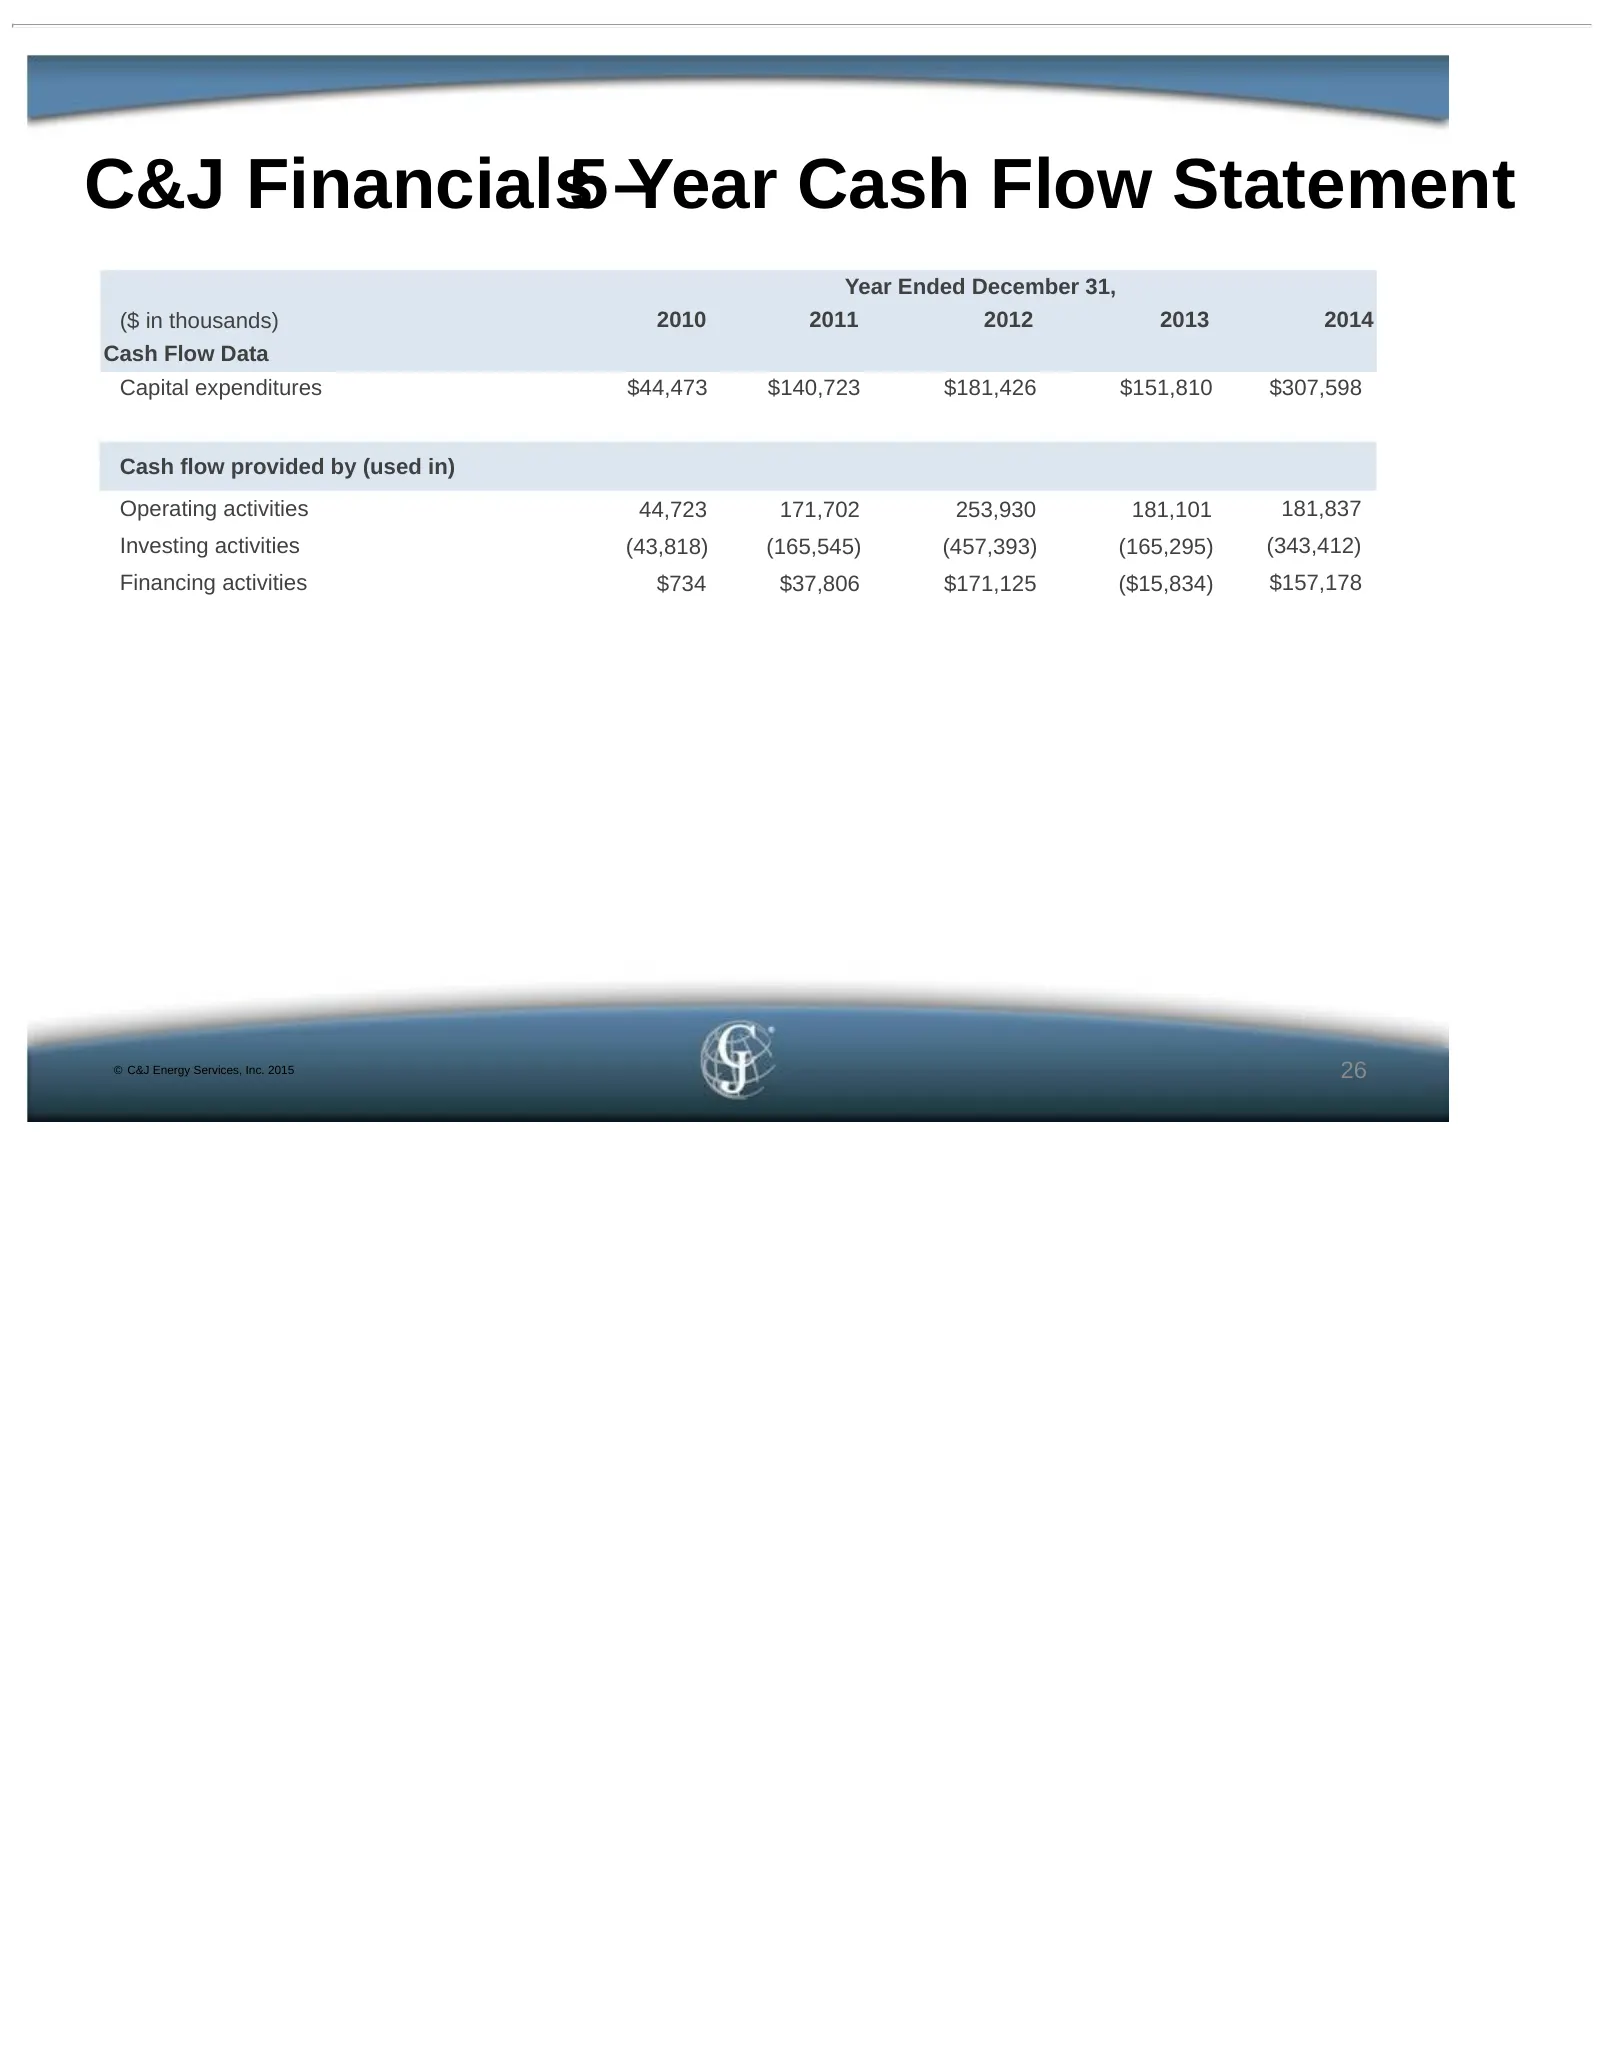
C&J Financials5 –Year Cash Flow Statement Year Ended December 31, ($ in thousands) 2010 2011 2012 2013 2014 Cash Flow Data Capital expenditures $44,473 $140,723 $181,426 $151,810 $307,598 Cash flow provided by (used in) Operating activities 44,723 171,702 253,930 181,101 181,837 Investing activities
Slide 27: C&J Financials 5-Year Balance Sheet
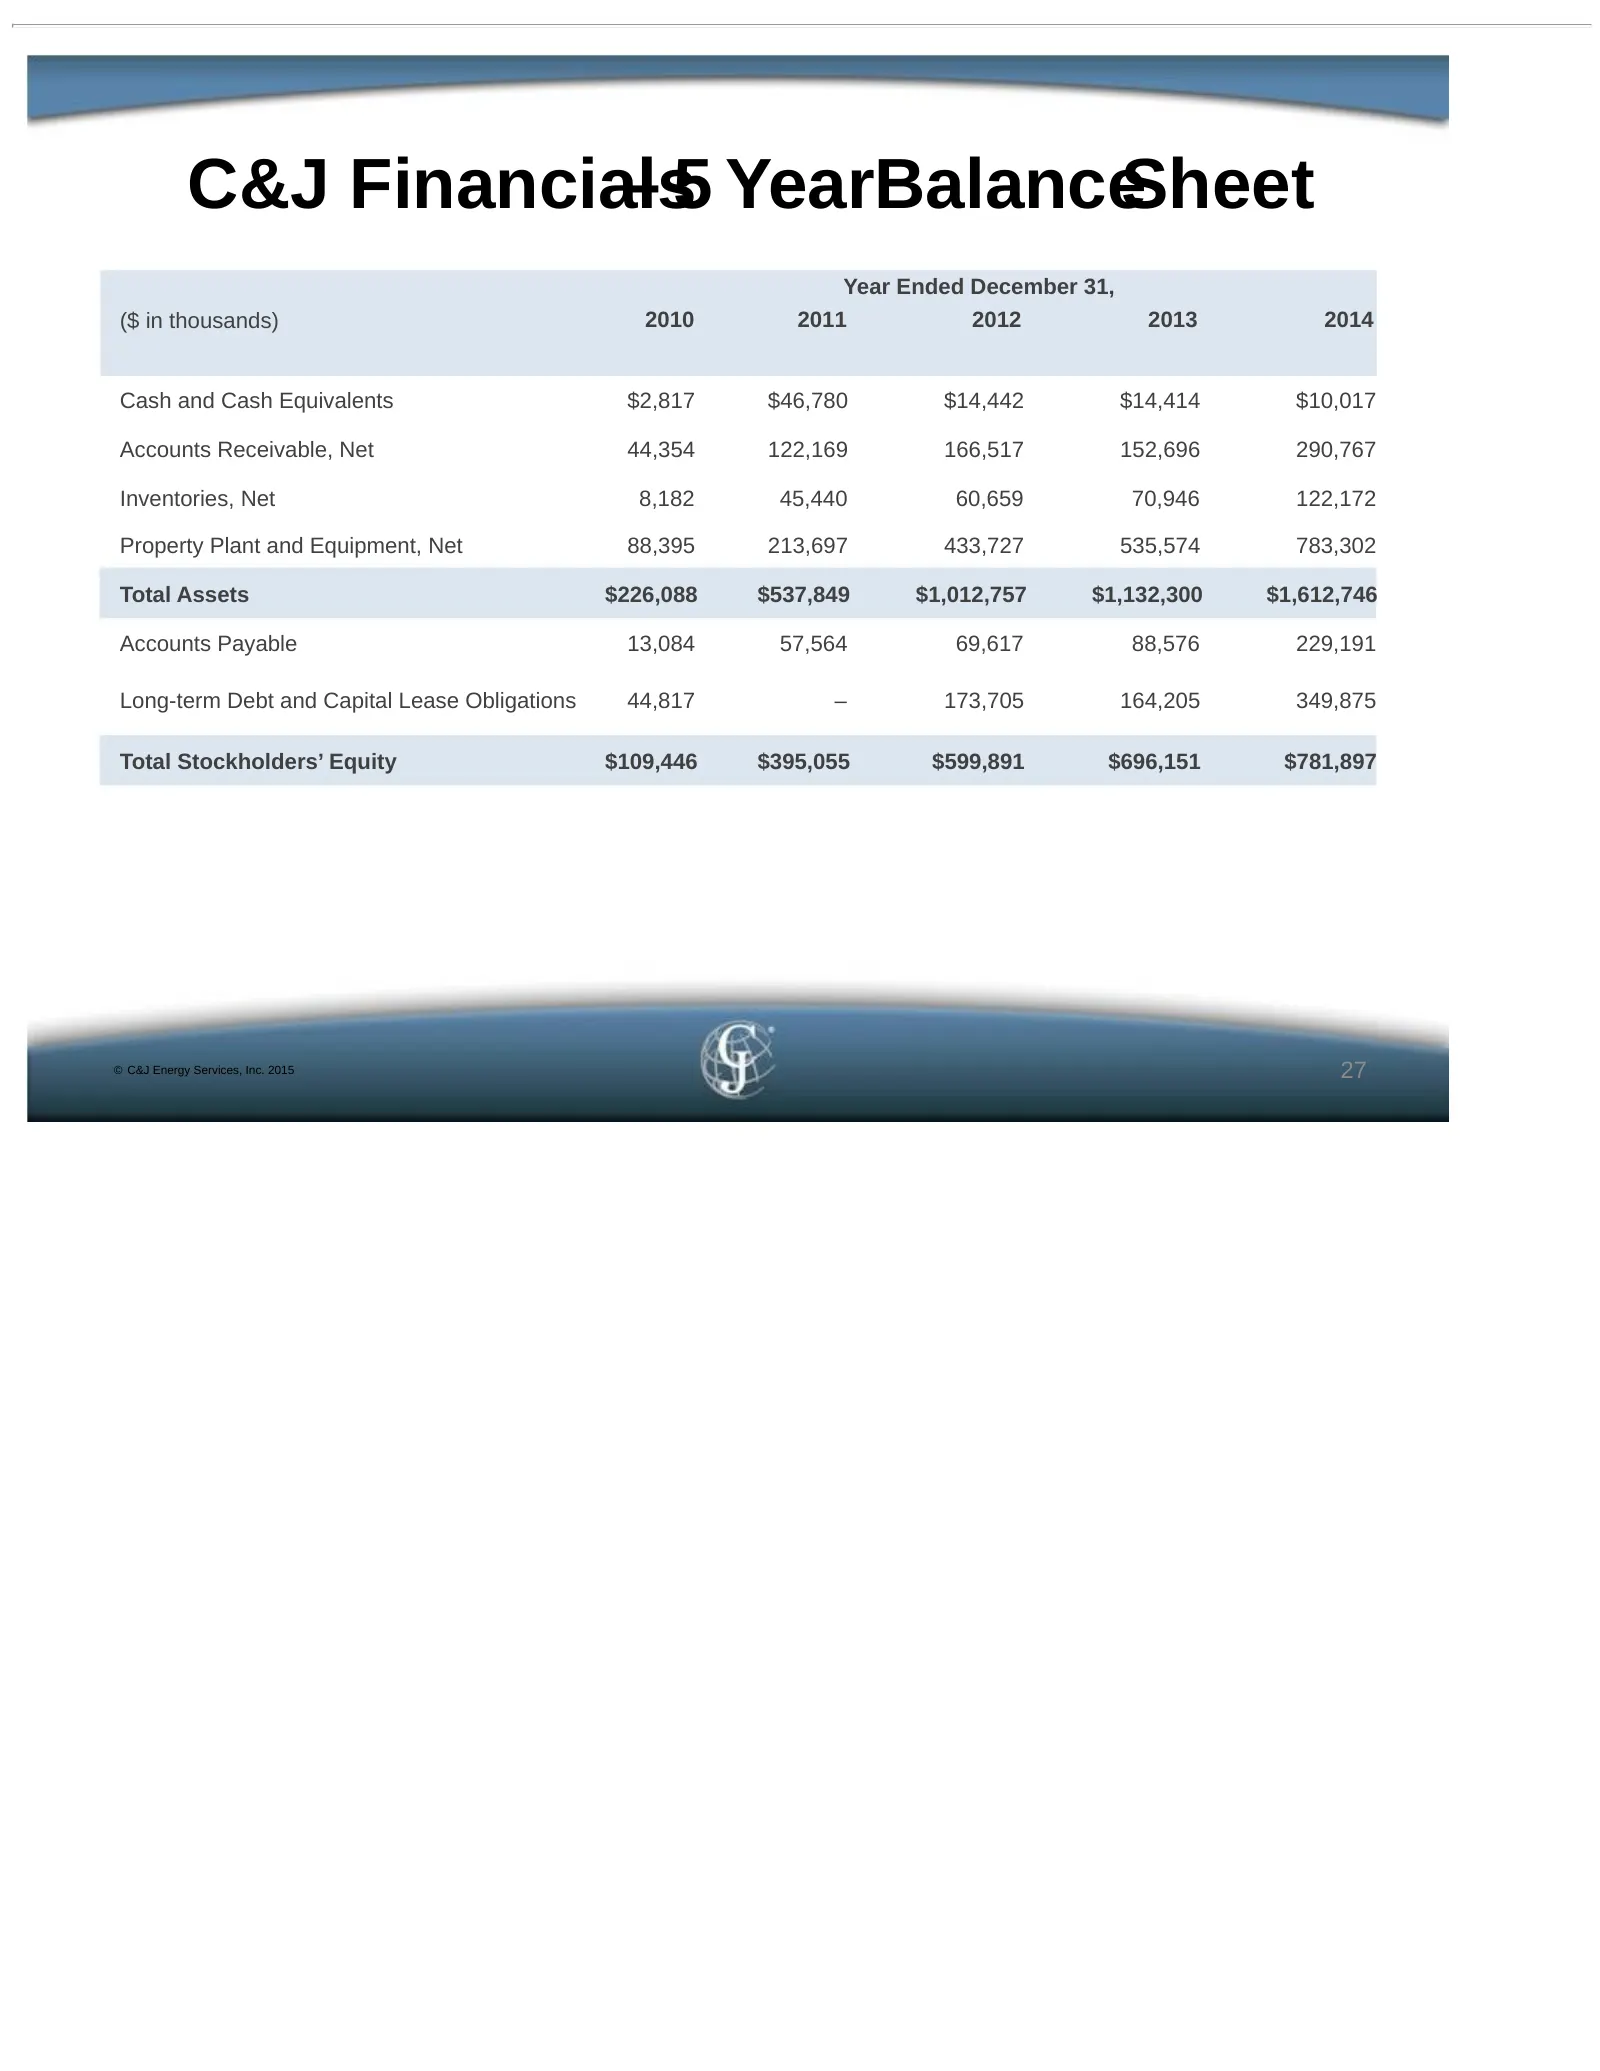
C&J Financials – 5 YearBalanceSheet Year Ended December 31, ($ in thousands) 2010 2011 2012 2013 2014 Cash and Cash Equivalents $2,817 $46,780 $14,442 $14,414 $10,017 Accounts Receivable, Net 44,354 122,169 166,517 152,696 290,767 Inventories, Net 8,182 45,440 60,659 70,946 122,172 Property Plant an
Slide 28: C&J Financials EBITDA and Adjusted EBITDA Reconciliation
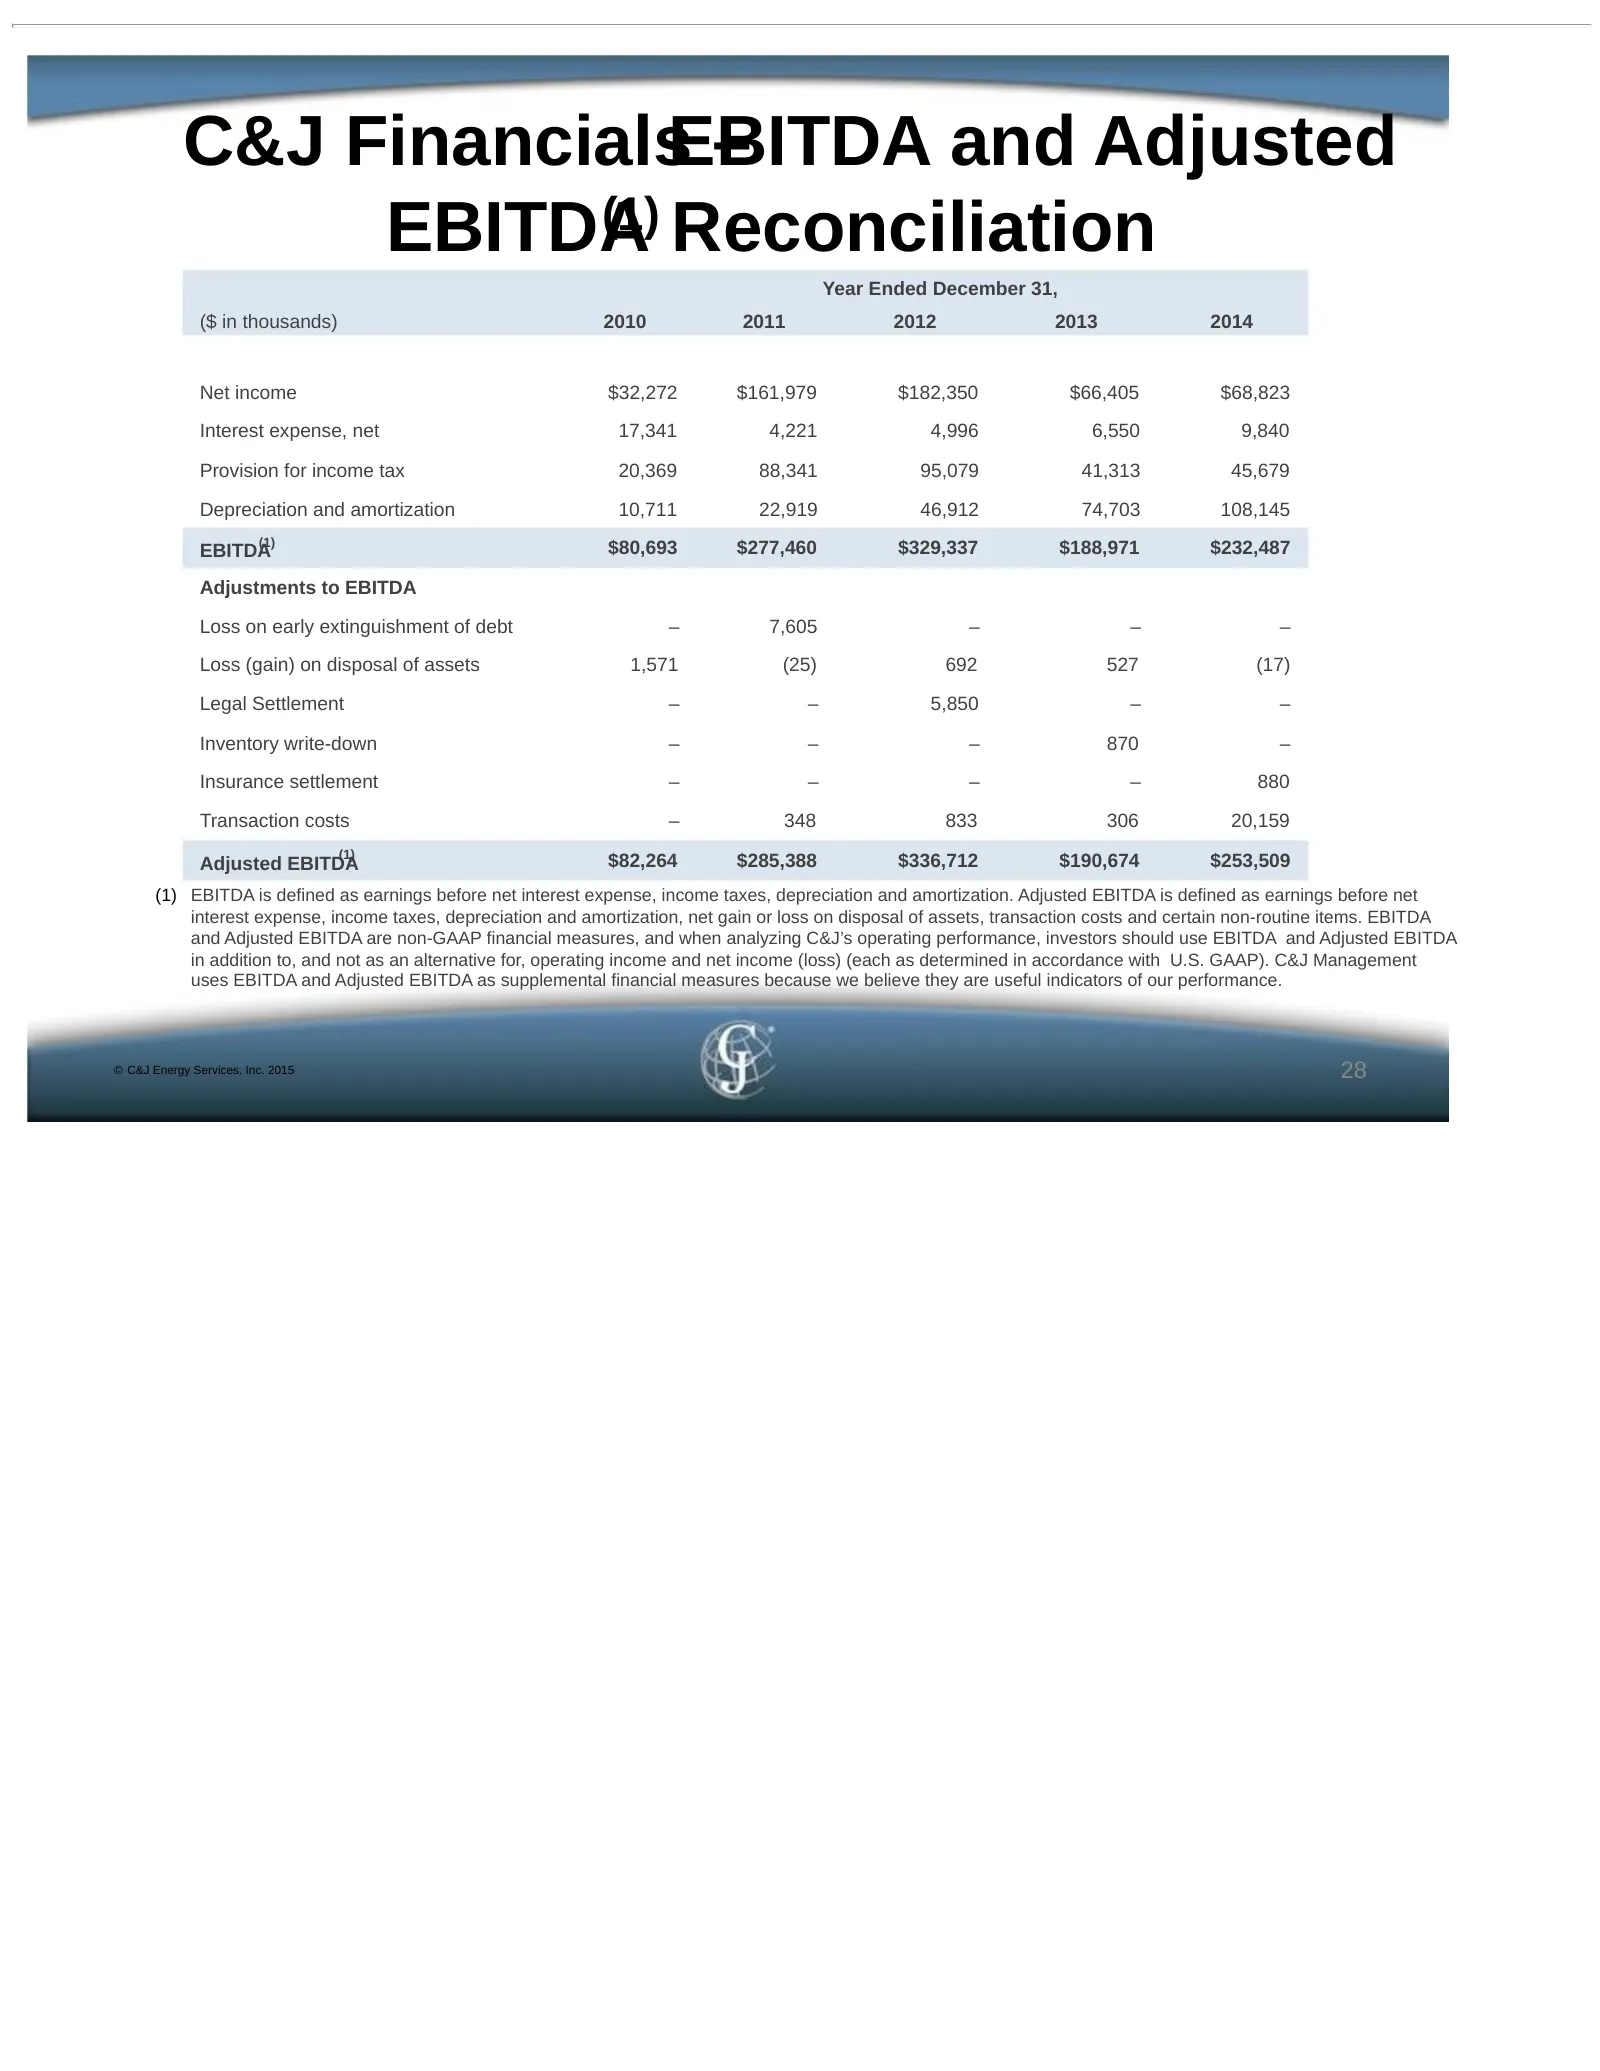
C&J FinancialsEBITDA – and Adjusted EBITDA(1) Reconciliation Year Ended December 31, ($ in thousands) 2010 2011 2012 2013 2014 Net income $32,272 $161,979 $182,350 $66,405 $68,823 Interest expense, net 17,341 4,221 4,996 6,550 9,840 Provision for income tax 20,369 88,341 95,079 41,313 45,679 Depreci
Slide 29: C&J Financials EBITDA and Adjusted EBITDA Reconciliation Quarterly
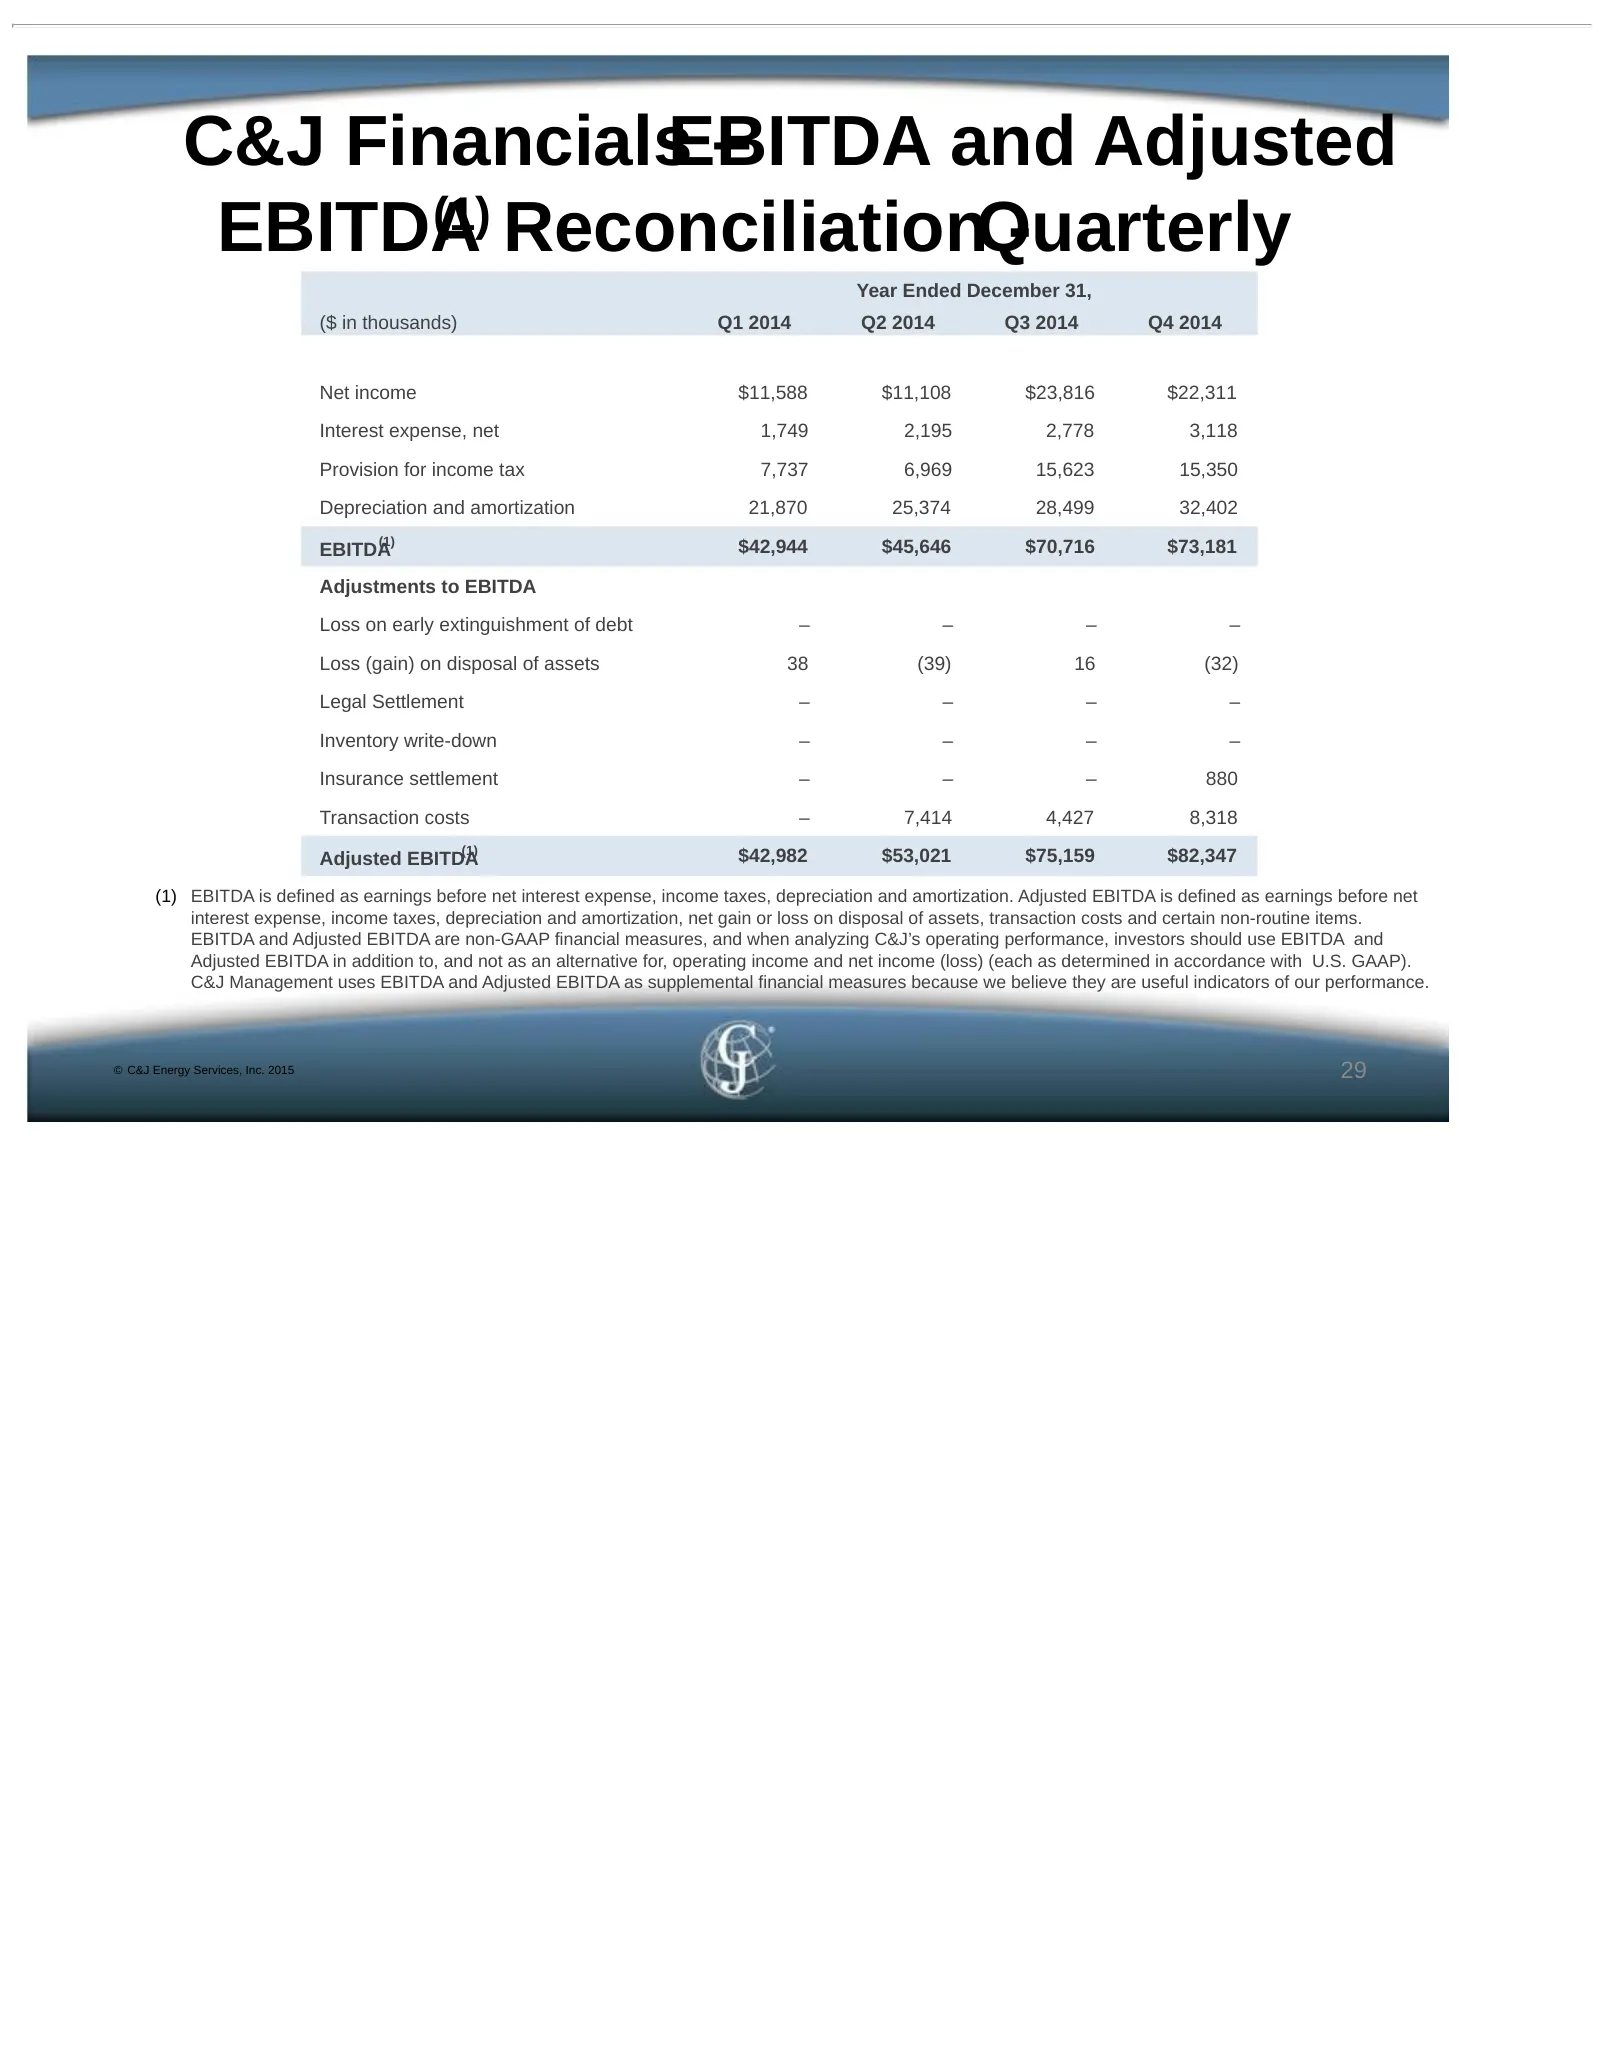
C&J FinancialsEBITDA – and Adjusted EBITDA(1) ReconciliationQuarterly - Year Ended December 31, ($ in thousands) Q1 2014 Q2 2014 Q3 2014 Q4 2014 Net income $11,588 $11,108 $23,816 $22,311 Interest expense, net 1,749 2,195 2,778 3,118 Provision for income tax 7,737 6,969 15,623 15,350 Depreciation an
Source: SEC EDGAR · 425 filed Feb 25, 2015
More decks from C&J Energy Services Inc
 Barclays CEO Energy-Power Conference 201933 slides · Sep 3, 2019
 Q2 2019 Earnings Presentation42 slides · Aug 6, 2019
 Q2 2019 Earnings Presentation22 slides · Aug 6, 2019
 Merger or Acquisition (June 2019)20 slides · Jun 17, 2019
 Investor Presentation (May 2019)42 slides · May 14, 2019
 Q1 2019 Earnings Presentation21 slides · May 7, 2019