ACS, Actividades de Construccion y Servicios SA · BME:ACS
ACS, Actividades de Construccion y Servicios SA — H1 2023 Earnings Presentation
14 slides from ACS, Actividades de Construccion y Servicios SA's earnings presentation, Jun 27, 2023
Slide 1: H1 2023 Results Presentation
H1 2023 Results Presentation June 27th, 2023
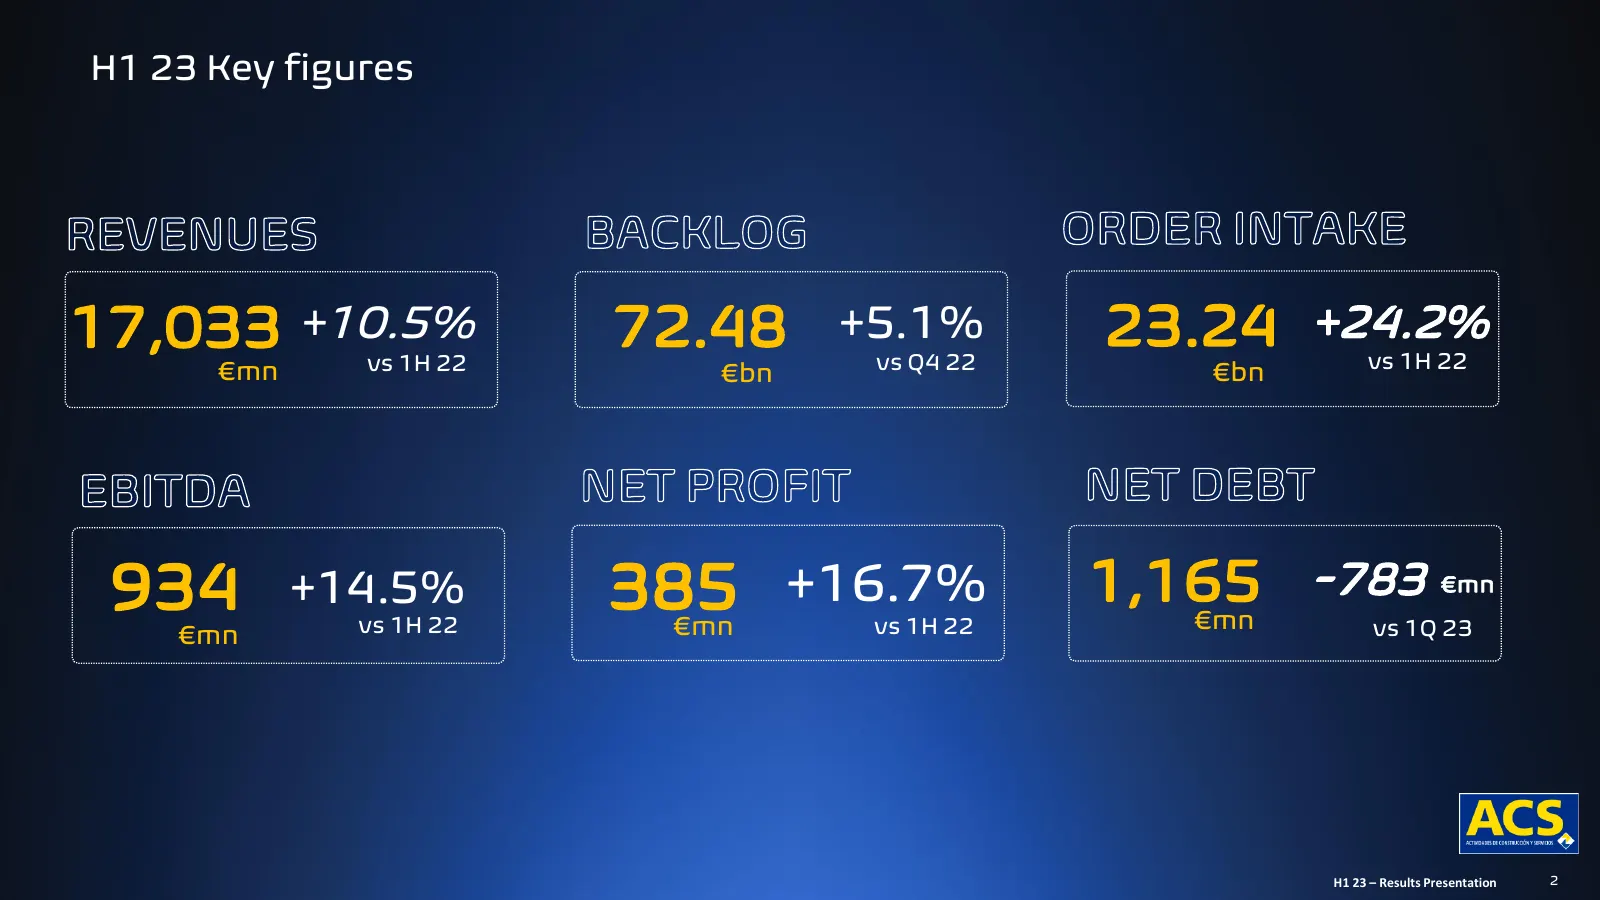
Slide 2: H1 Key figures
H1 23 Key figures 17,033 +10.5% vs 1H 22 72.48 +5.1% vs Q4 22 23.24 +24.2% vs 1H 22 €mn €bn €bn 934 +14.5% 385 +16.7% 1,165 €mn -783 €mn €mn vs 1H 22 €mn vs 1H 22 vs 1Q 23 H1 23 – Results Presentation 2
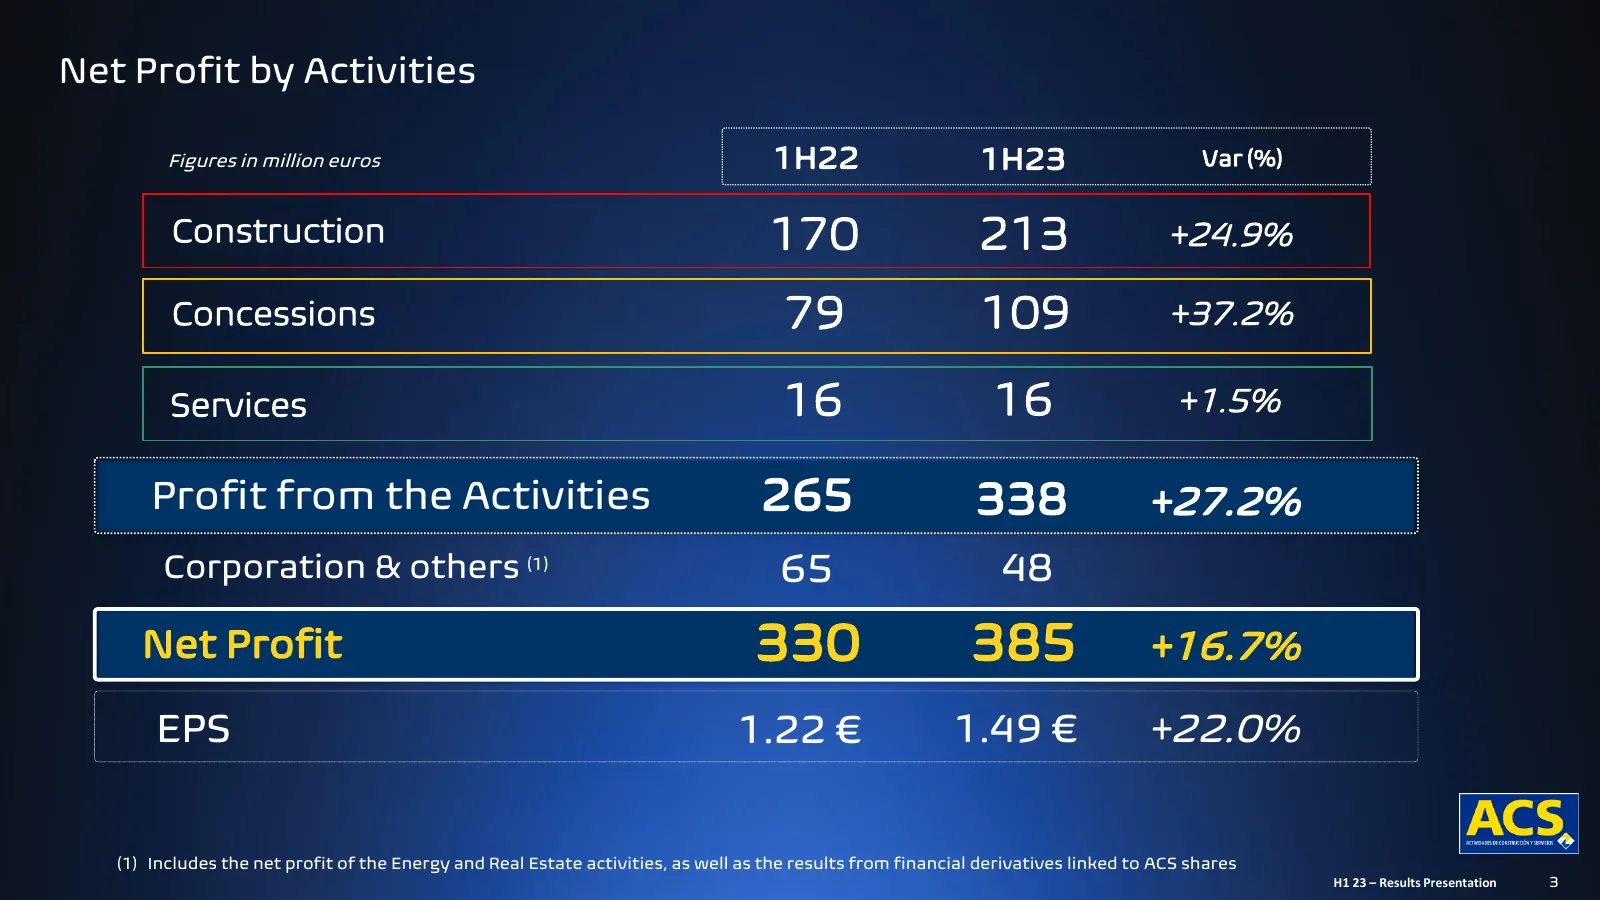
Slide 3: Net Profit by Activities
Net Profit by Activities Figures in million euros 1H22 1H23 Var (%) Construction 170 213 +24.9% Concessions 79 109 +37.2% Services 16 16 +1.5% Profit from the Activities 265 338 +27.2% Corporation & others (1) 65 48 Net Profit 330 385 +16.7% EPS 1.22 € 1.49 € +22.0% (1) Includes the net profit of th
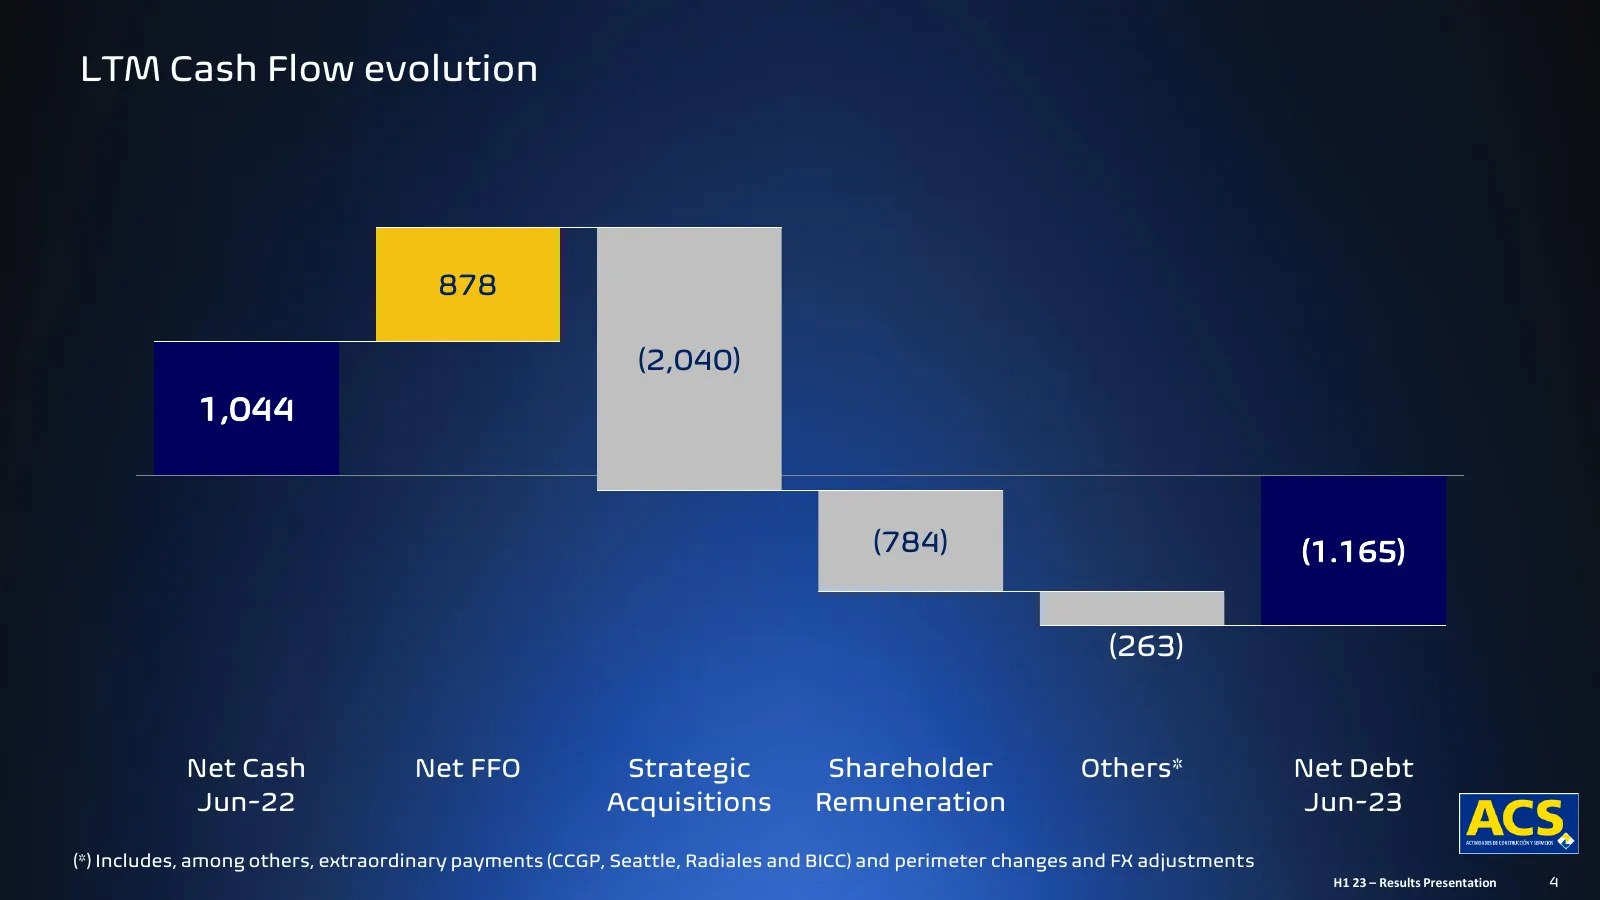
Slide 4: LTM Cash Flow evolution
LTM Cash Flow evolution 878 (2,040) 1,044 (784) (1.165) (263) Net Cash Net FFO Strategic Shareholder Others* Net Debt Jun-22 Acquisitions Remuneration Jun-23 (*) Includes, among others, extraordinary payments (CCGP, Seattle, Radiales and BICC) and perimeter changes and FX adjustments H1 23 – Results
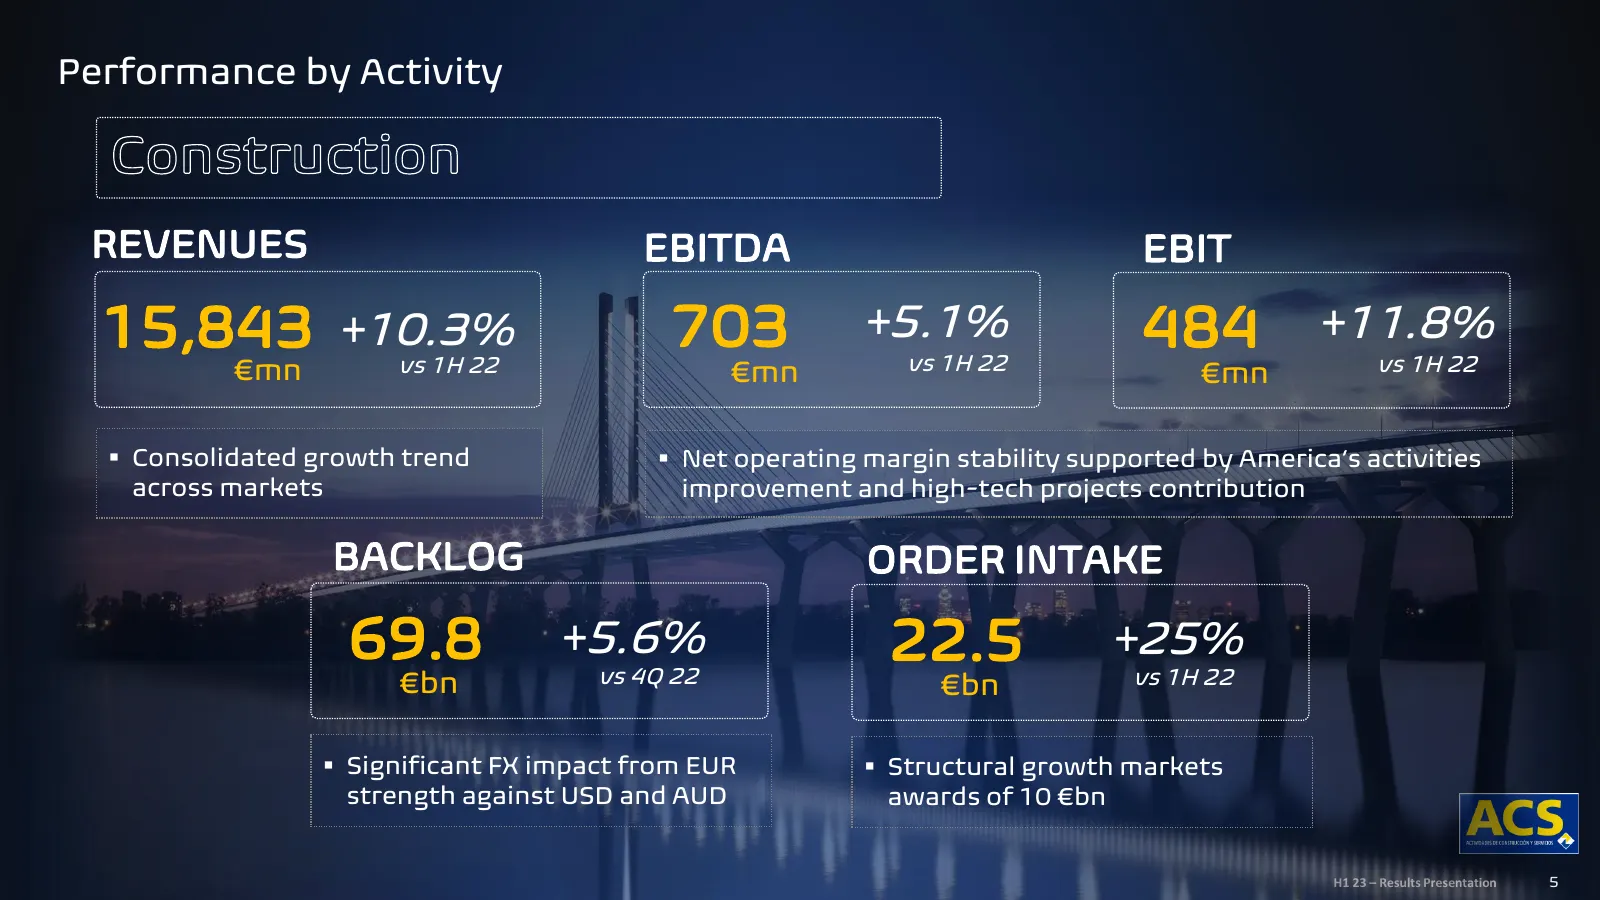
Slide 5: Performance by Activity
Performance by Activity REVENUES EBITDA EBIT 15,843 +10.3% vs 1H 22 703 +5.1% vs 1H 22 484 +11.8% vs 1H 22 €mn €mn €mn ▪ Consolidated growth trend ▪ Net operating margin stability supported by America’s activities across markets improvement and high-tech projects contribution BACKLOG ORDER INTAKE 69
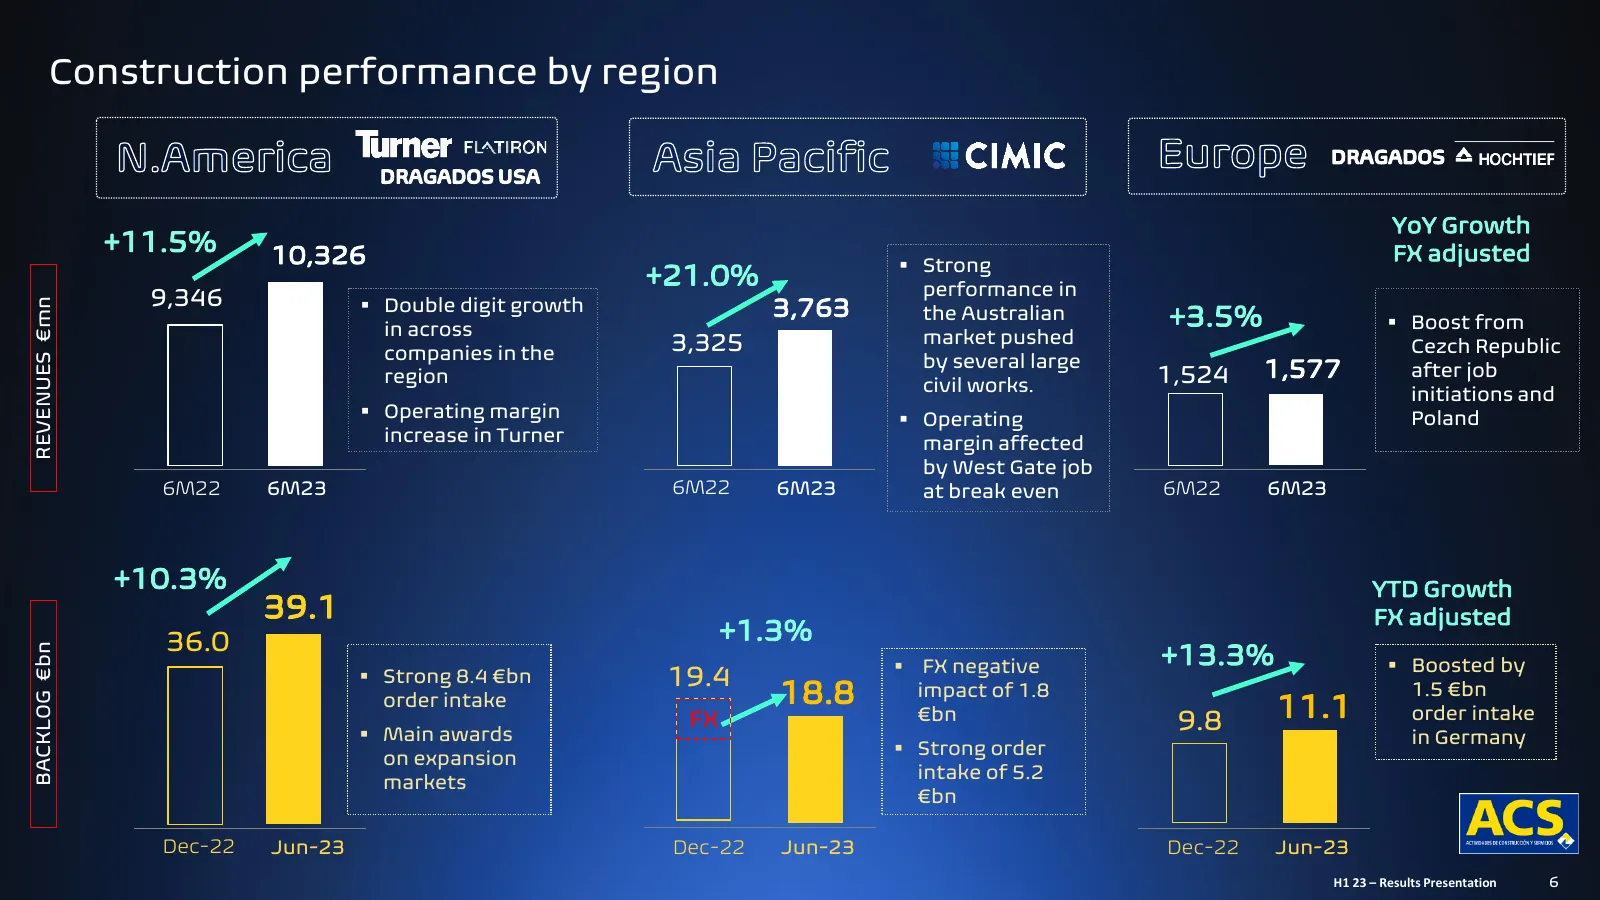
Slide 6: Construction performance by region
Construction performance by region YoY Growth +11.5% 10,326 FX adjusted ▪ Strong +21.0% performance in 9,346 ▪ Double digit growth 3,763 REVENUES €mn in across the Australian +3.5% ▪ Boost from 3,325 market pushed Cezch Republic companies in the by several large region 1,524 1,577 after job civil wo
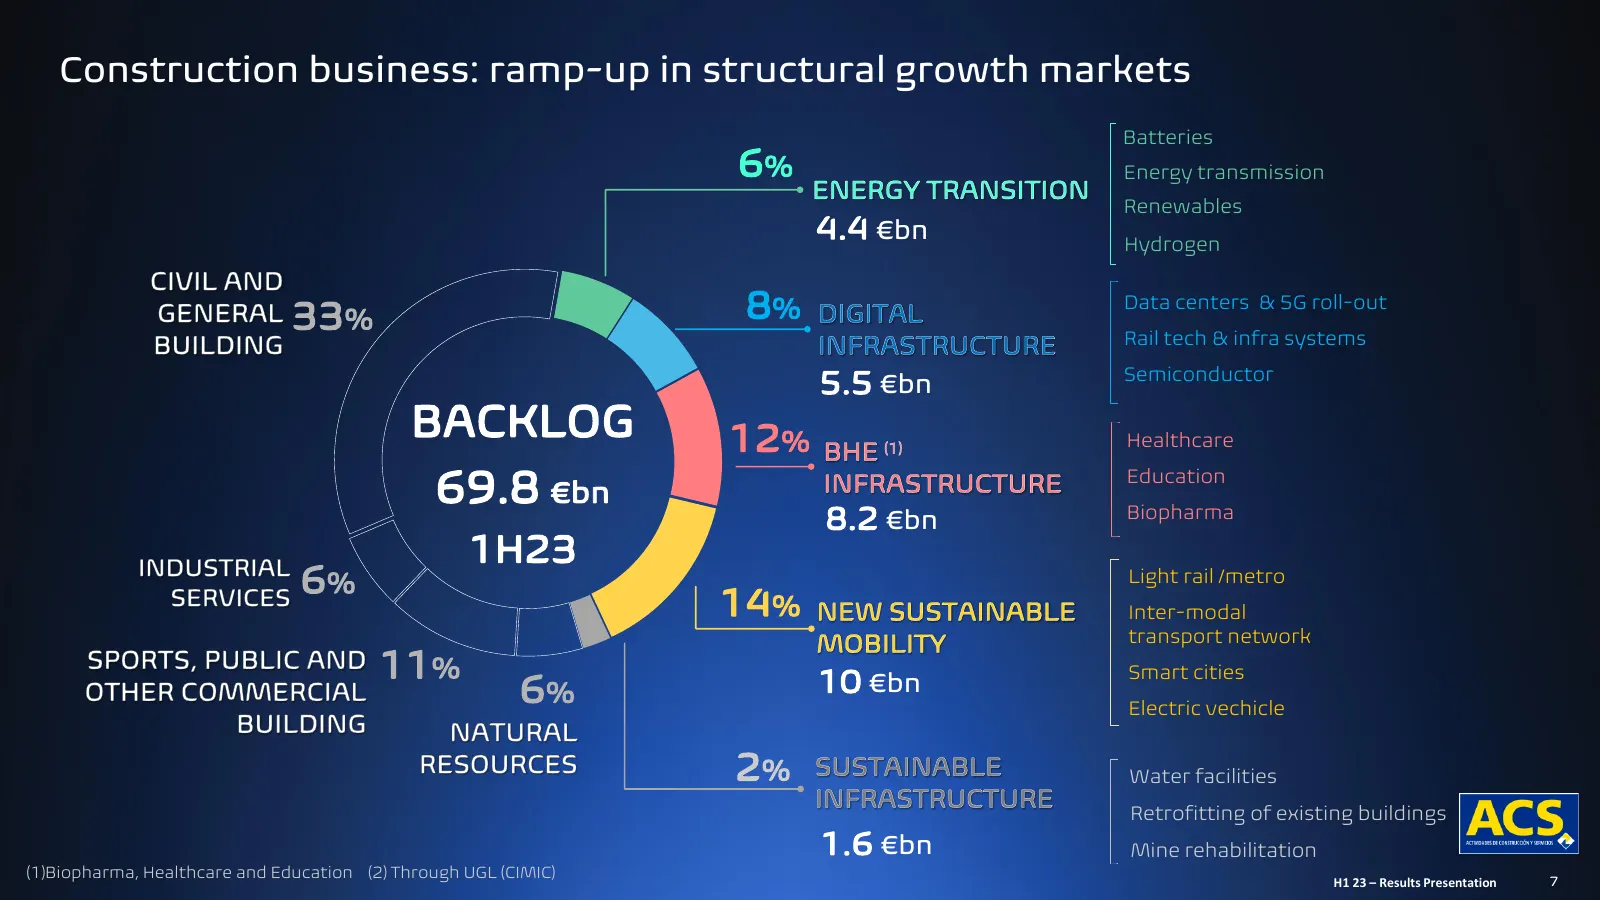
Slide 7: Construction business: ramp-up in structural growth markets
Construction business: ramp-up in structural growth markets Batteries 6% Energy transmission Renewables 4.4 €bn Hydrogen 33% 8% Data centers & 5G roll-out Rail tech & infra systems 5.5 €bn Semiconductor BACKLOG 12% Healthcare 69.8 €bn Education 8.2 €bn Biopharma 1H23 6% Light rail /metro 14% Inter-m
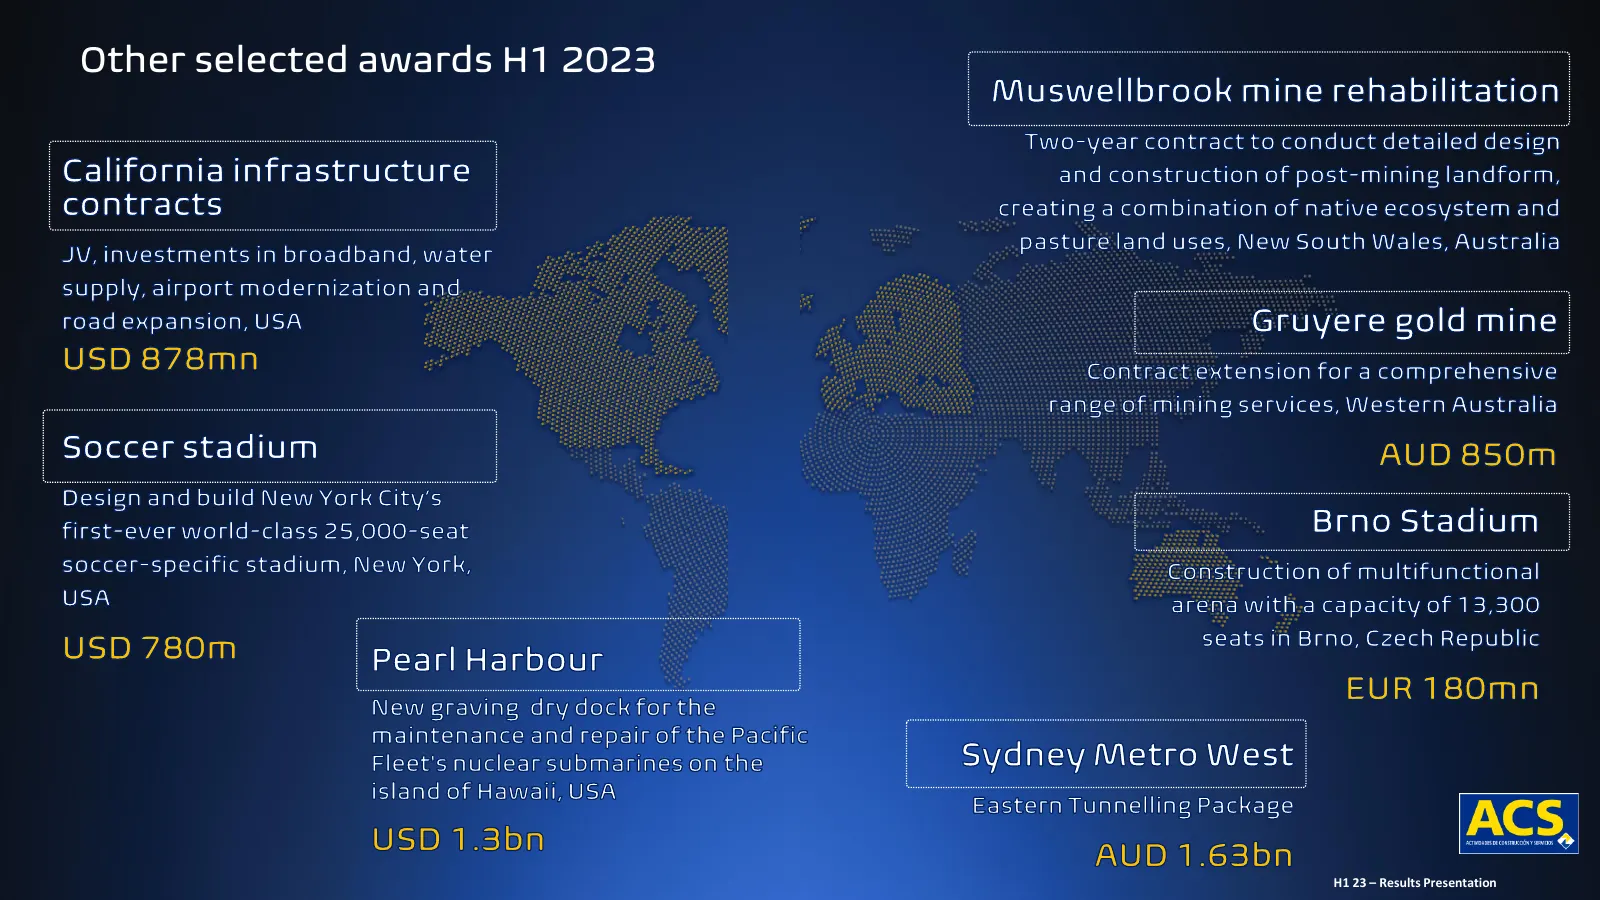
Slide 8: Other selected awards H1 2023
Other selected awards H1 2023 H1 23 – Results Presentation
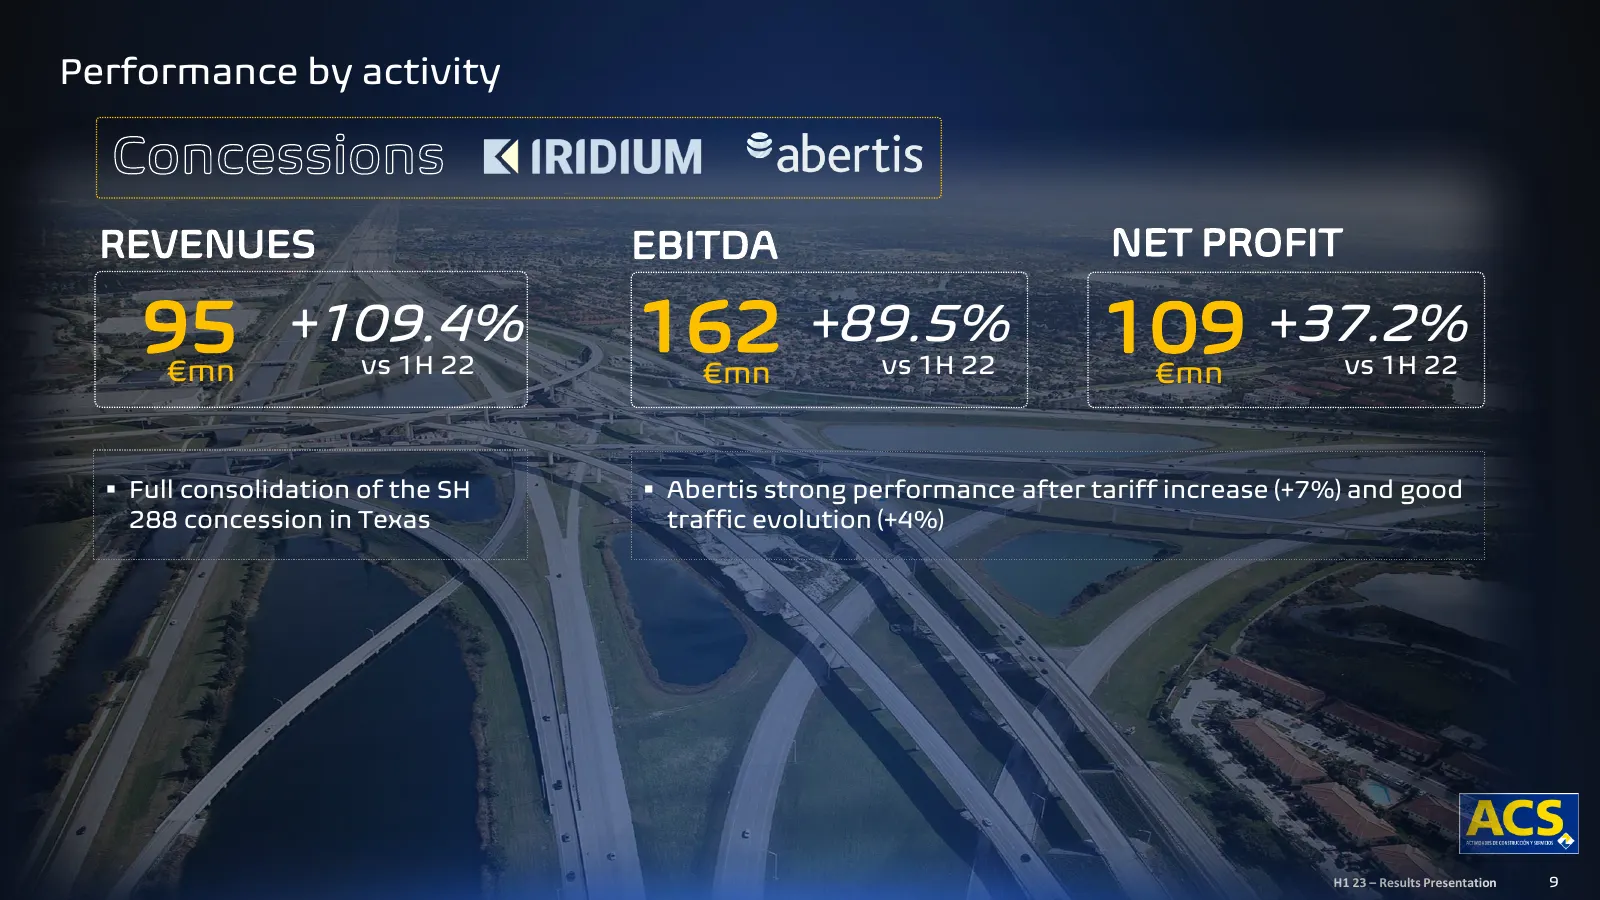
Slide 9: Performance by activity
Performance by activity REVENUES EBITDA NET PROFIT 95 €mn +109.4% vs 1H 22 162 €mn +89.5% vs 1H 22 109 €mn +37.2% vs 1H 22 ▪ Full consolidation of the SH ▪ Abertis strong performance after tariff increase (+7%) and good 288 concession in Texas traffic evolution (+4%) H1 23 – Results Presentation 9
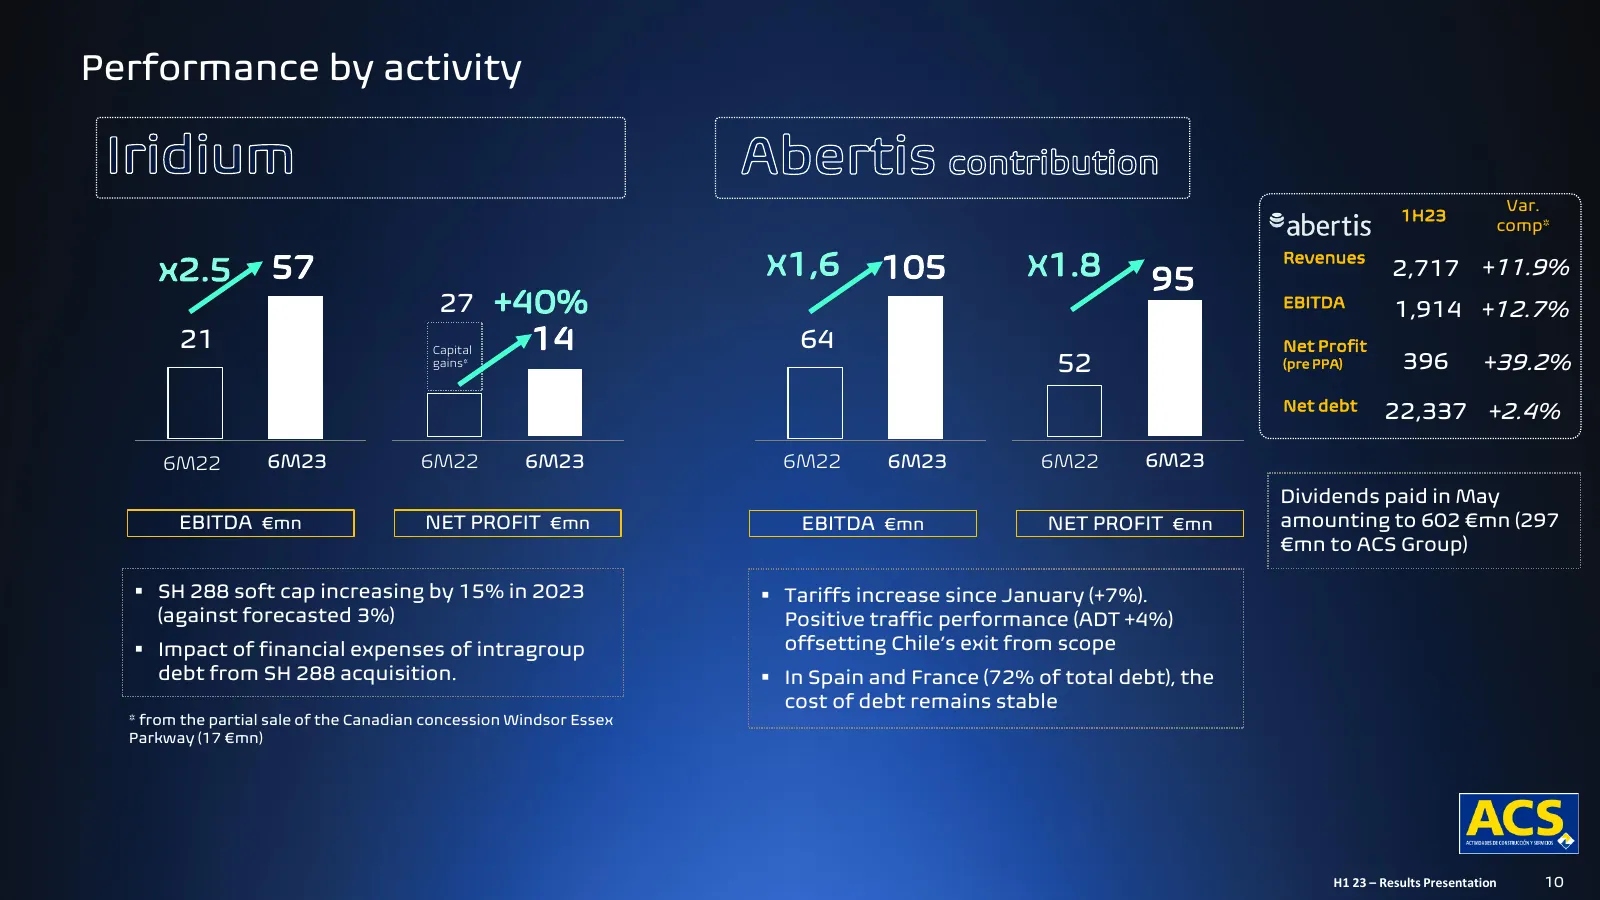
Slide 10: Performance by activity
Performance by activity Var. 1H23 comp* x2.5 57 X1,6 105 X1.8 95 Revenues 2,717 +11.9% 27 +40% EBITDA 1,914 +12.7% 21 Capital 14 64 Net Profit gains* 52 (pre PPA) 396 +39.2% Net debt 22,337 +2.4% 6M22 6M23 6M22 6M23 6M22 6M23 6M22 6M23 Dividends paid in May EBITDA €mn NET PROFIT €mn EBITDA €mn NET P
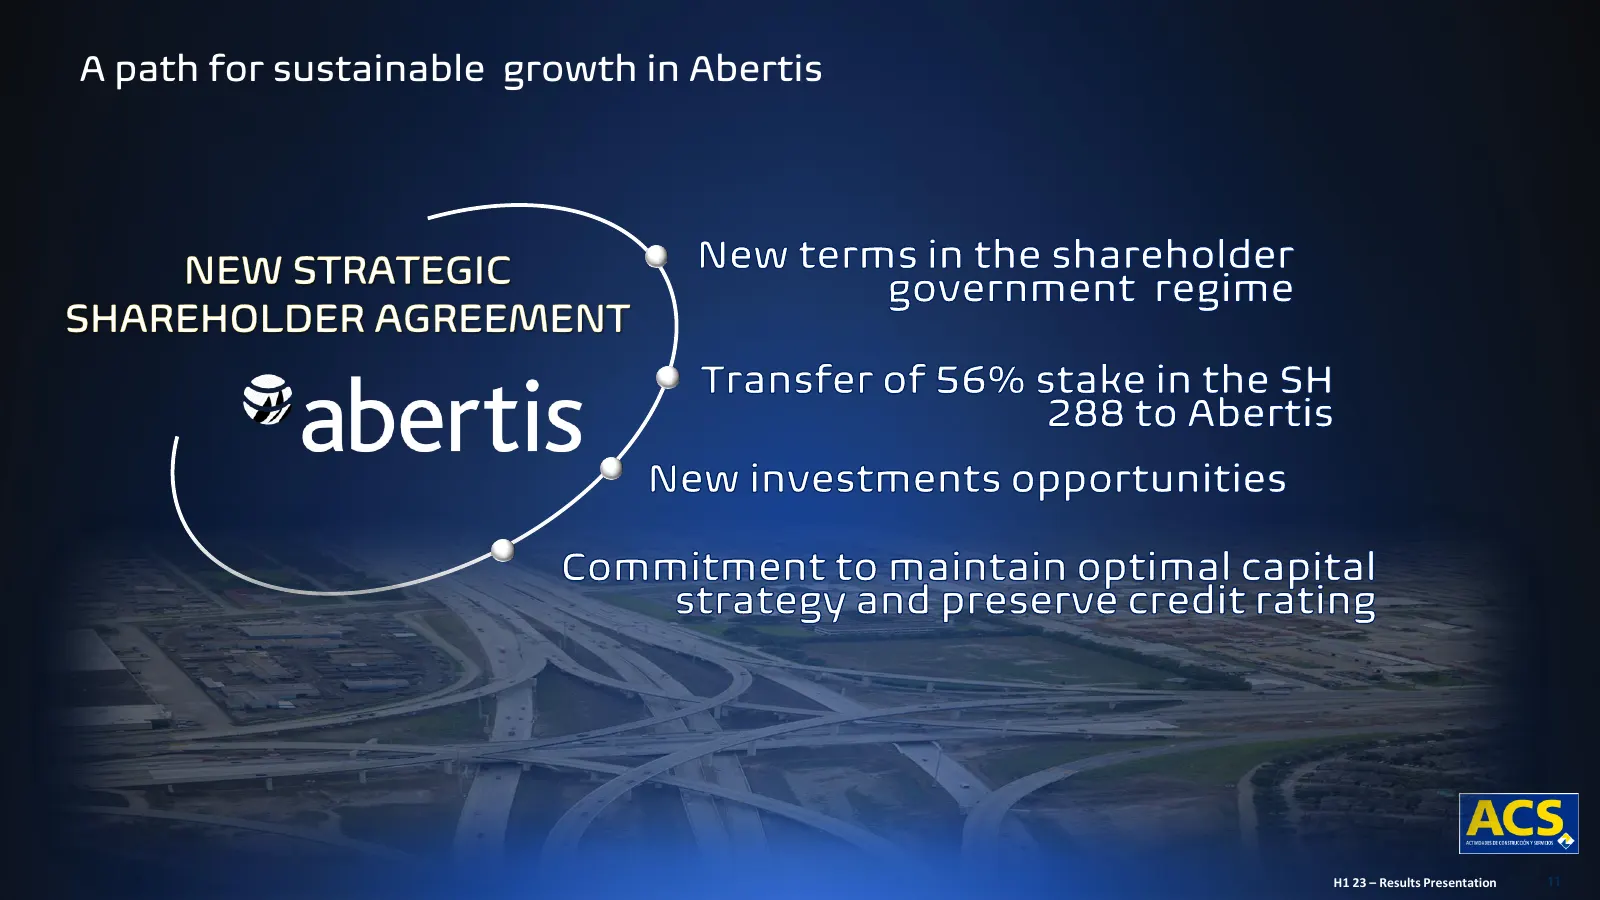
Slide 11: A path for sustainable growth in Abertis
A path for sustainable growth in Abertis H1 23 – Results Presentation 11
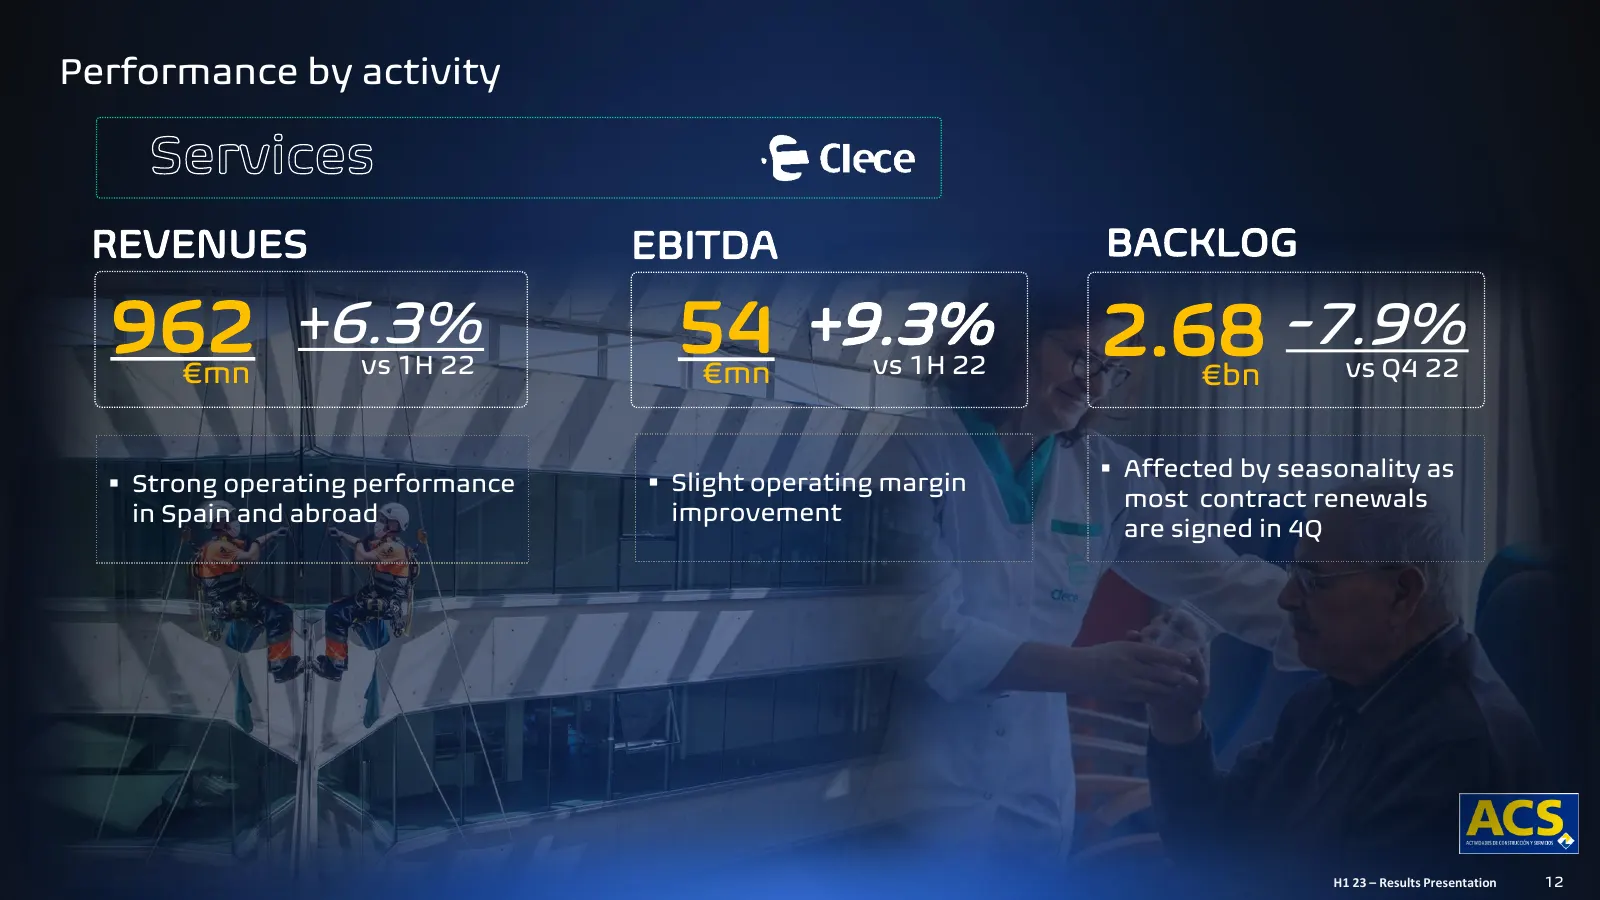
Slide 12: Performance by activity
Performance by activity REVENUES EBITDA BACKLOG 962 €mn +6.3% vs 1H 22 54 €mn +9.3% vs 1H 22 2.68 €bn -7.9% vs Q4 22 ▪ Affected by seasonality as ▪ Strong operating performance ▪ Slight operating margin most contract renewals in Spain and abroad improvement are signed in 4Q H1 23 – Results Presentat
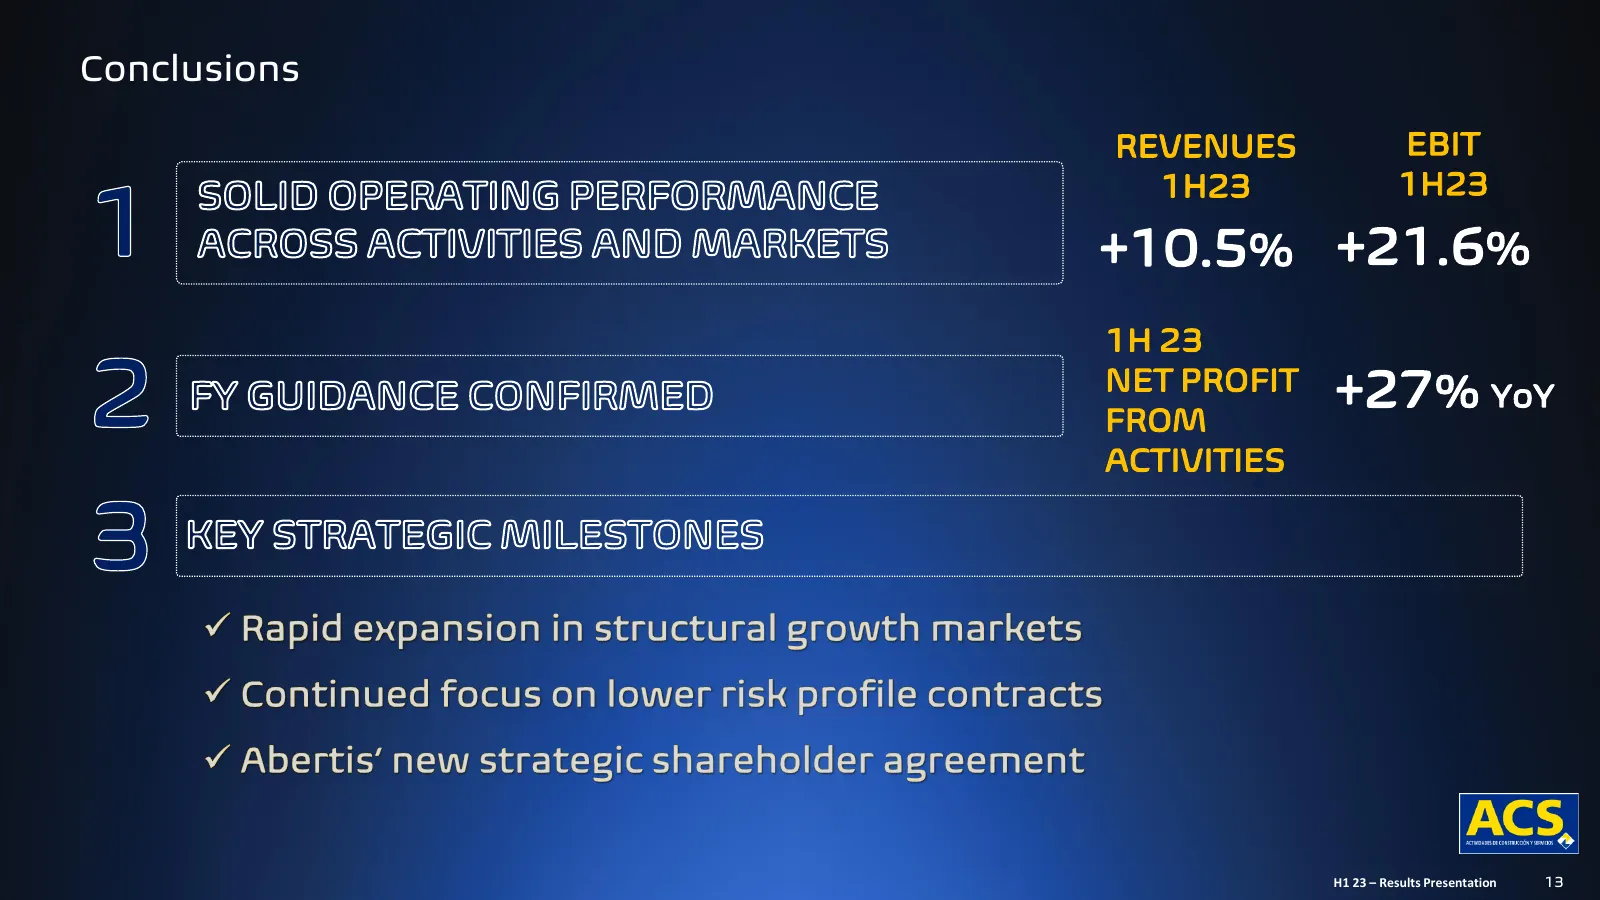
Slide 13: Conclusions
Conclusions REVENUES EBIT 1H23 1H23 +10.5% +21.6% 1H 23 NET PROFIT FROM +27% YoY ACTIVITIES H1 23 – Results Presentation 13
Slide 14: Legal Disclaimer
WIP Legal Disclaimer This document contains forward-looking statements on the intentions. expectations or forecasts of Grupo ACS or its management at the time the document was drawn up and in reference to various matters including. among others. its customer base. its performance. the foreseeable gr
Source: Internet Archive copy of grupoacs.com
More decks from ACS, Actividades de Construccion y Servicios SA
 Investor Day (November 2026)177 slides · Nov 12, 2026
 Investor Day (November 2026)104 slides · Nov 12, 2026
 Investor Day (November 2026)14 slides · Nov 12, 2026
 Investor Day (November 2026)17 slides · Nov 12, 2026
 Investor Day (November 2026)13 slides · Nov 12, 2026
 Investor Day (November 2026)17 slides · Nov 12, 2026
All 139 ACS, Actividades de Construccion y Servicios SA decks