Hypercom — Q3 2010 Earnings Presentation
17 slides from Hypercom's earnings presentation, Nov 2, 2010

Slide 1: 2010 Q3 Earnings Call
HYPERCOM 2010 Q3 Earnings Call trusted TRANSACTIONS . trusted SOLUTIONS . trusted PARTNERSHIPS AR ¢\ a 1G NORTH AMERICA | CENTRAL AMERICA | LATIN AMERICA | ASIA/PACIFIC | EUROPE | MIDDLE EAST | AFRICA
Slide 2: Forward-looking Statements
Forward-looking Statements Today’s discussion may include “forward-looking statements” within the meaning of the Private Securities Litigation Reform Act of 1995. Such statements relate to future events and expectations and involve known and unknown risks and uncertainties. Hypercom’s actual results
Slide 3: Revenue Growth
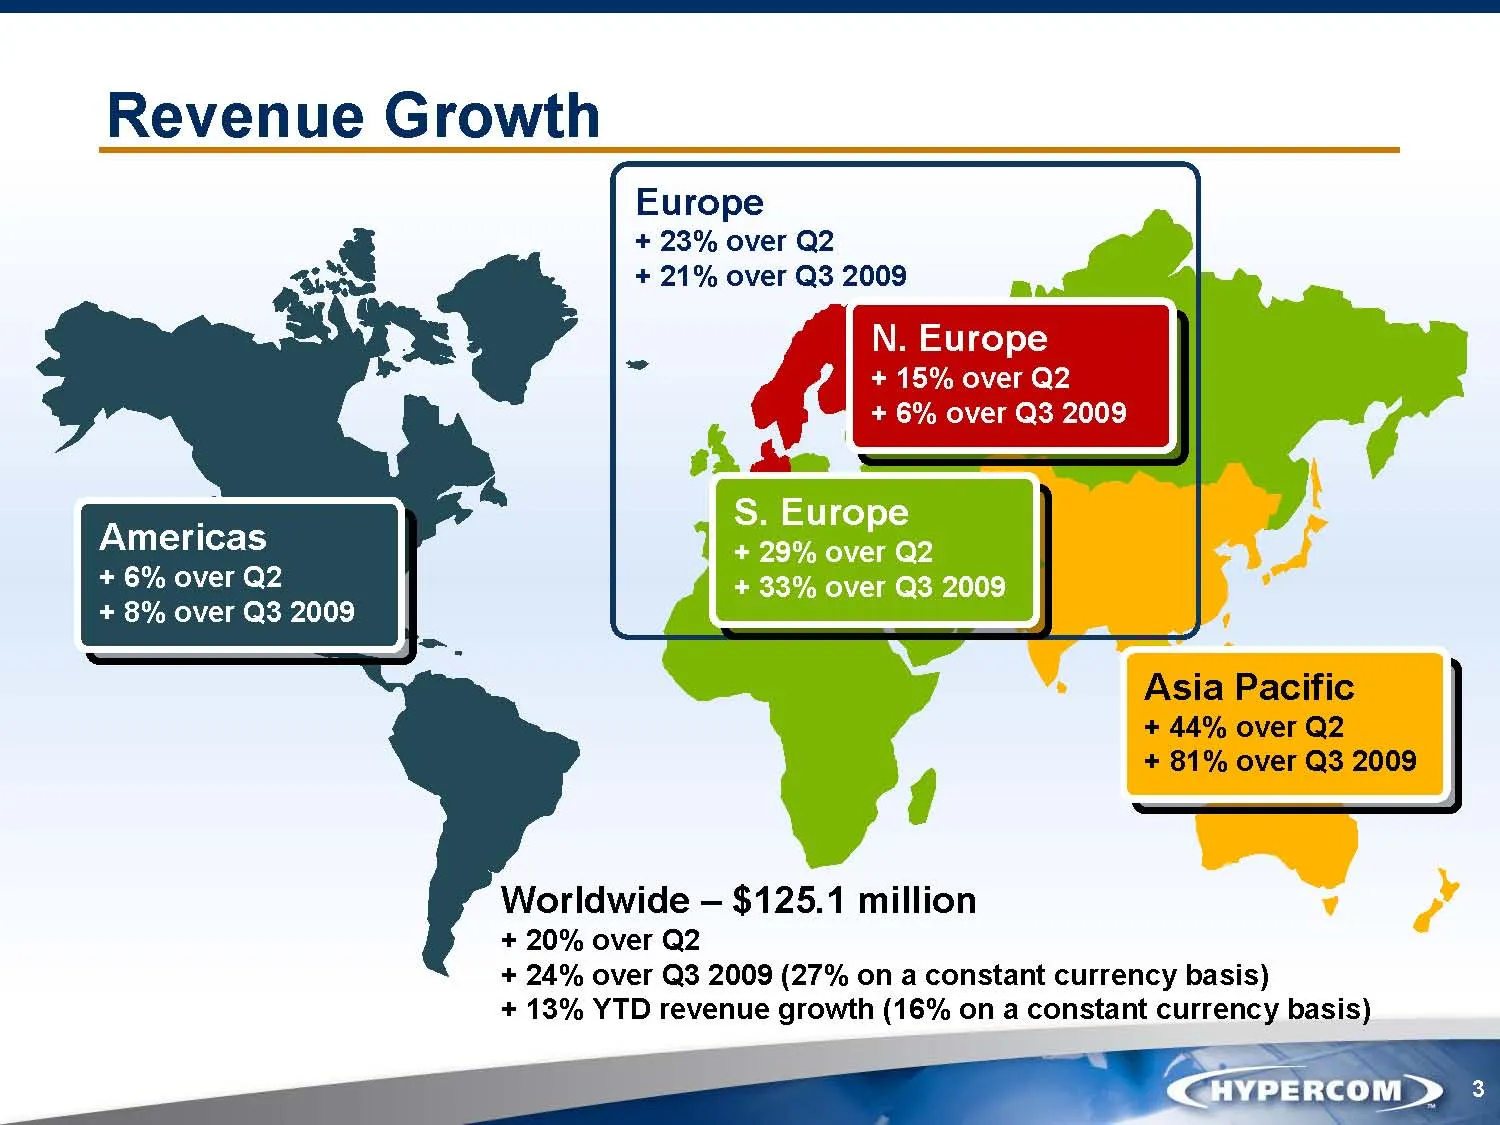
Revenue Growth f ‘ Europe + 23% over Q2 x : a xh + 21% over Q3 2009 N. Europe + 15% over Q2 + 6% over Q3 2009 Americas + 6% over Q2 + 8% over Q3 2009 Asia Pacific + 44% over Q2 + 81% over Q3 2009 Worldwide — $125.1 million + 20% over Q2 + 24% over Q3 2009 (27% on a constant currency basis) + 13% YTD
Slide 4: EMEA Growth
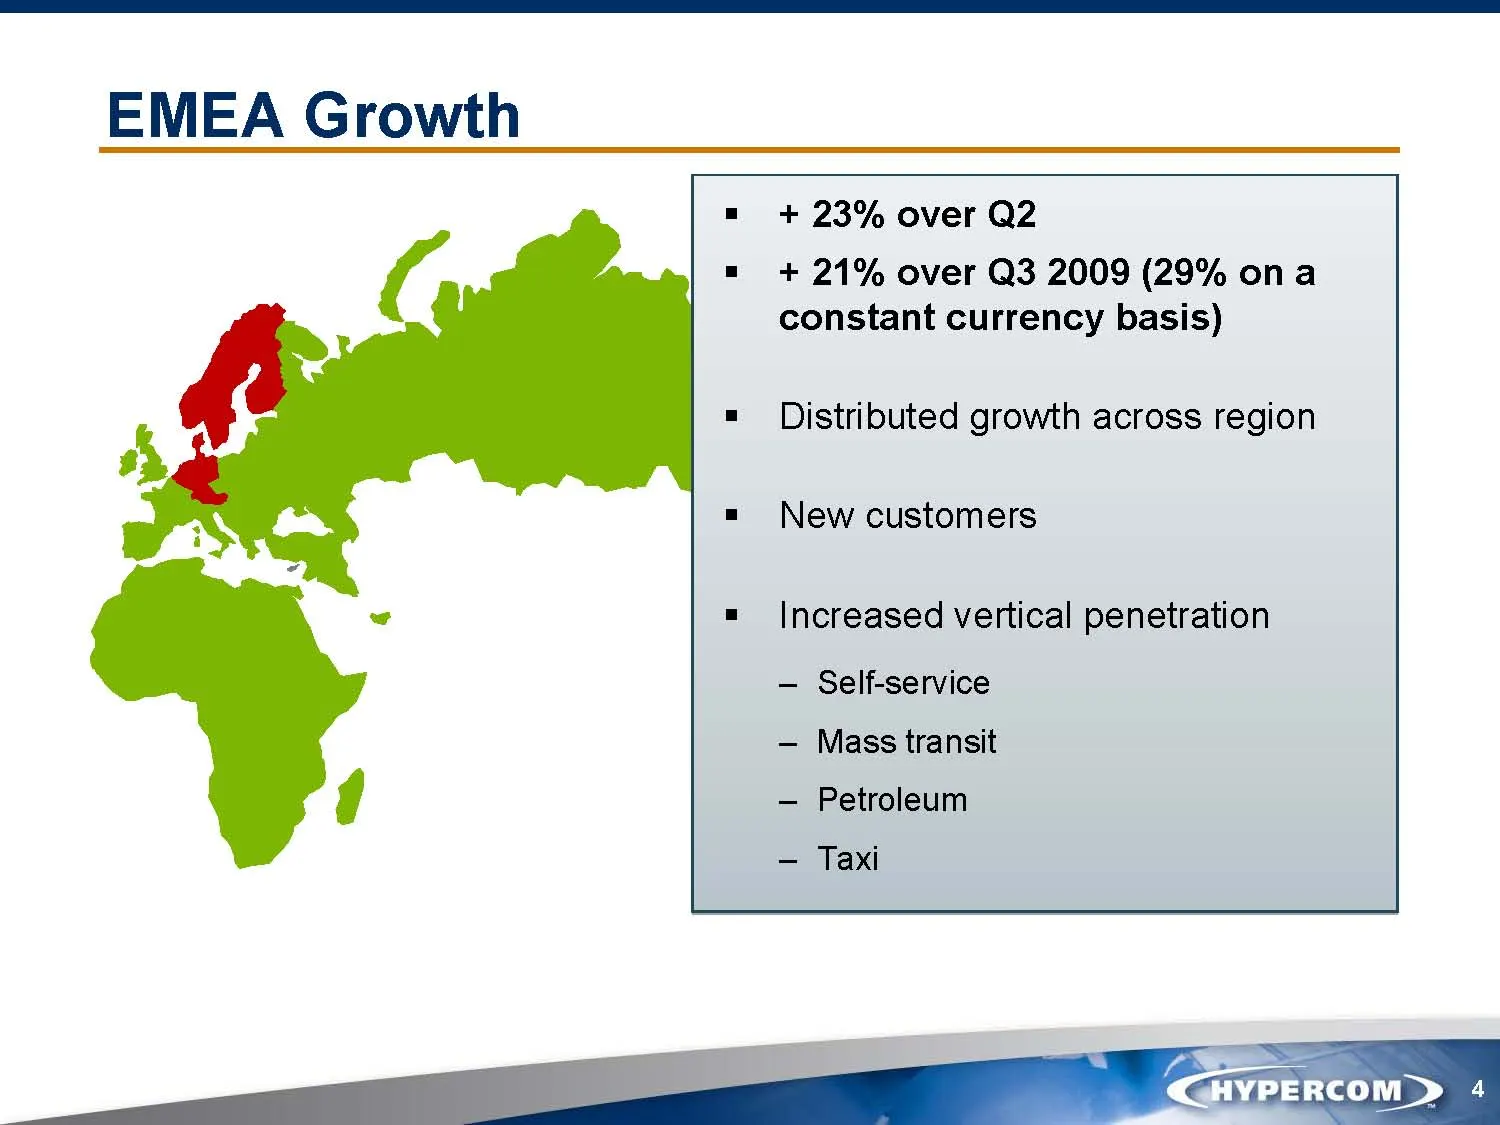
EMEA Growth + 23% over Q2 + 21% over Q3 2009 (29% ona constant currency basis) Distributed growth across region New customers Increased vertical penetration — Self-service Mass transit Petroleum — Taxi 4
Slide 5: Asia Pacific Growth
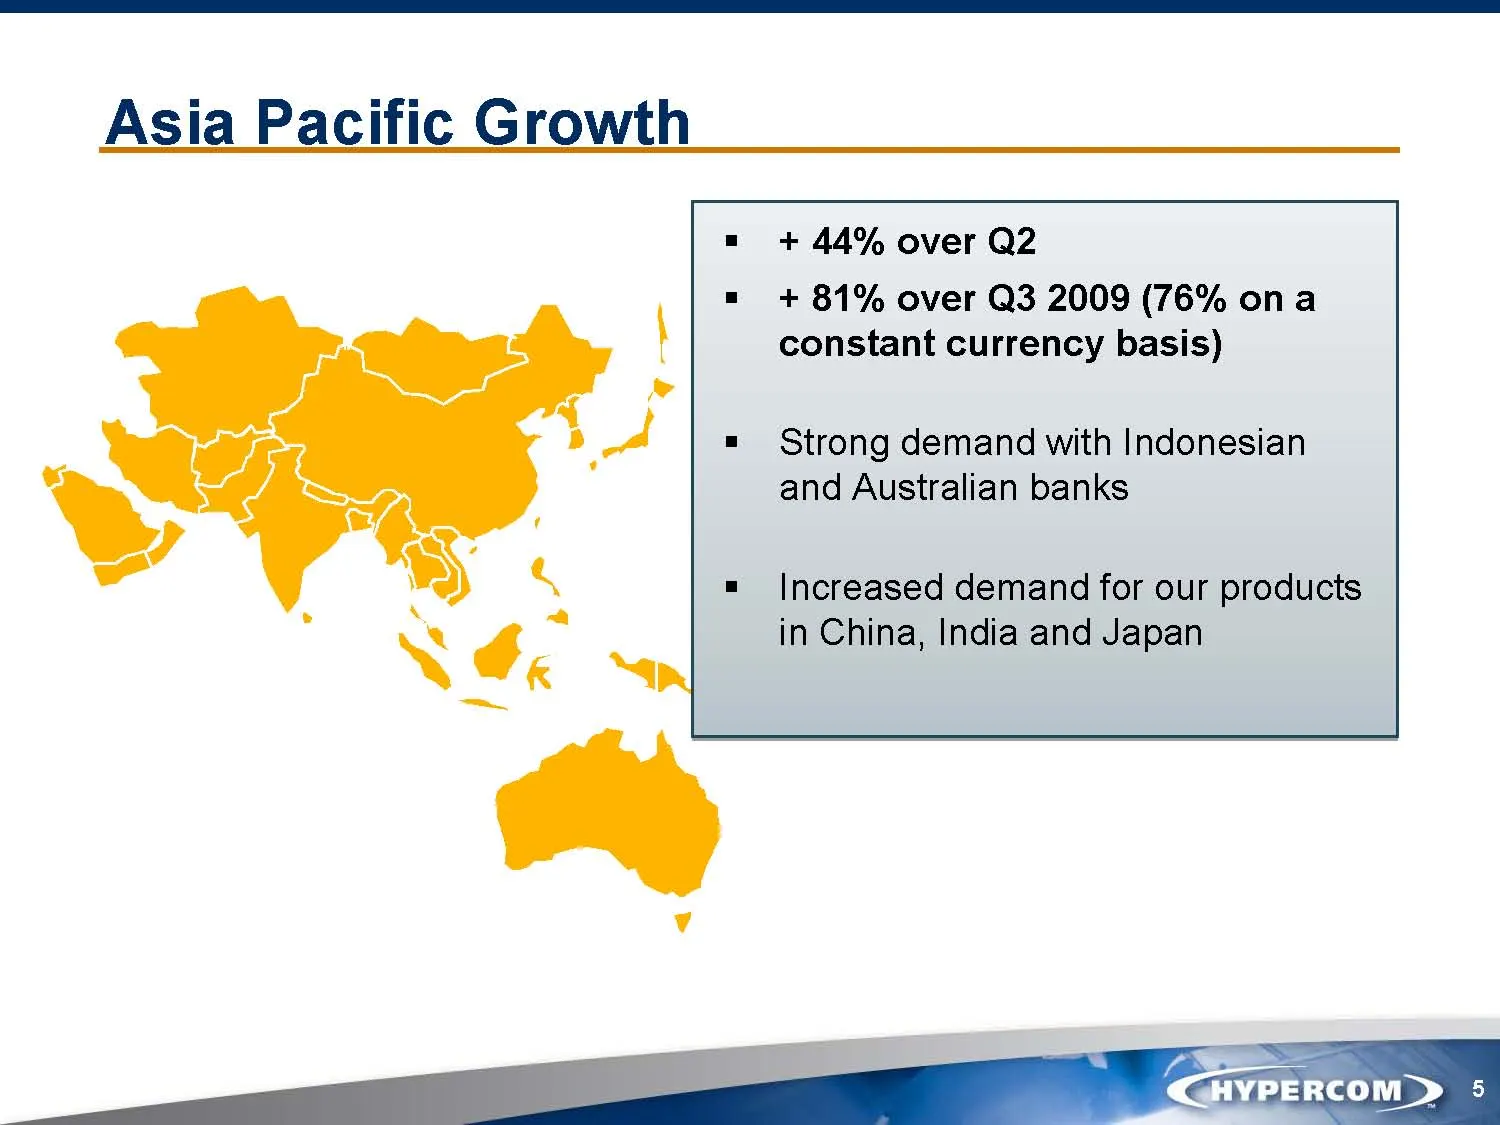
Asia Pacific Growth + 44% over Q2 + 81% over Q3 2009 (76% ona constant currency basis) Strong demand with Indonesian and Australian banks Increased demand for our products in China, India and Japan
Slide 6: Americas Growth
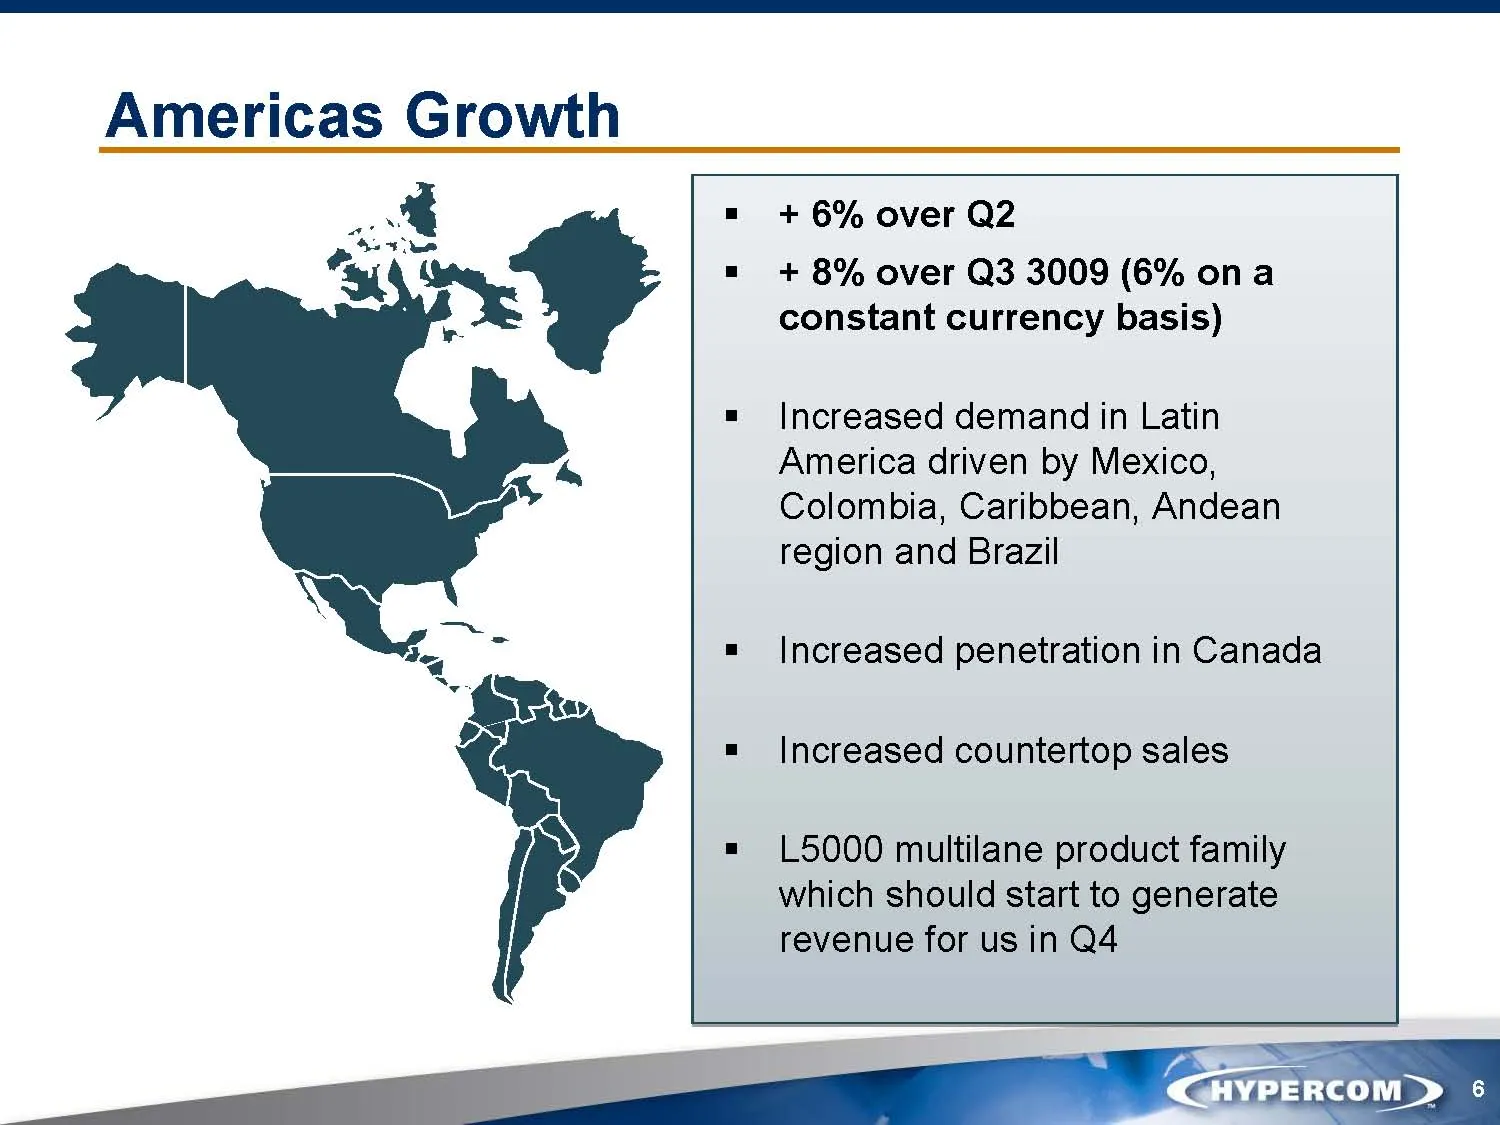
Americas Growth = + 6% over Q2 = + 8% over Q3 3009 (6% ona constant currency basis) = Increased demand in Latin America driven by Mexico, Colombia, Caribbean, Andean region and Brazil = Increased penetration in Canada = Increased countertop sales = L5000 multilane product family which should start t
Slide 7: Move to JDM Model Next Generation Products
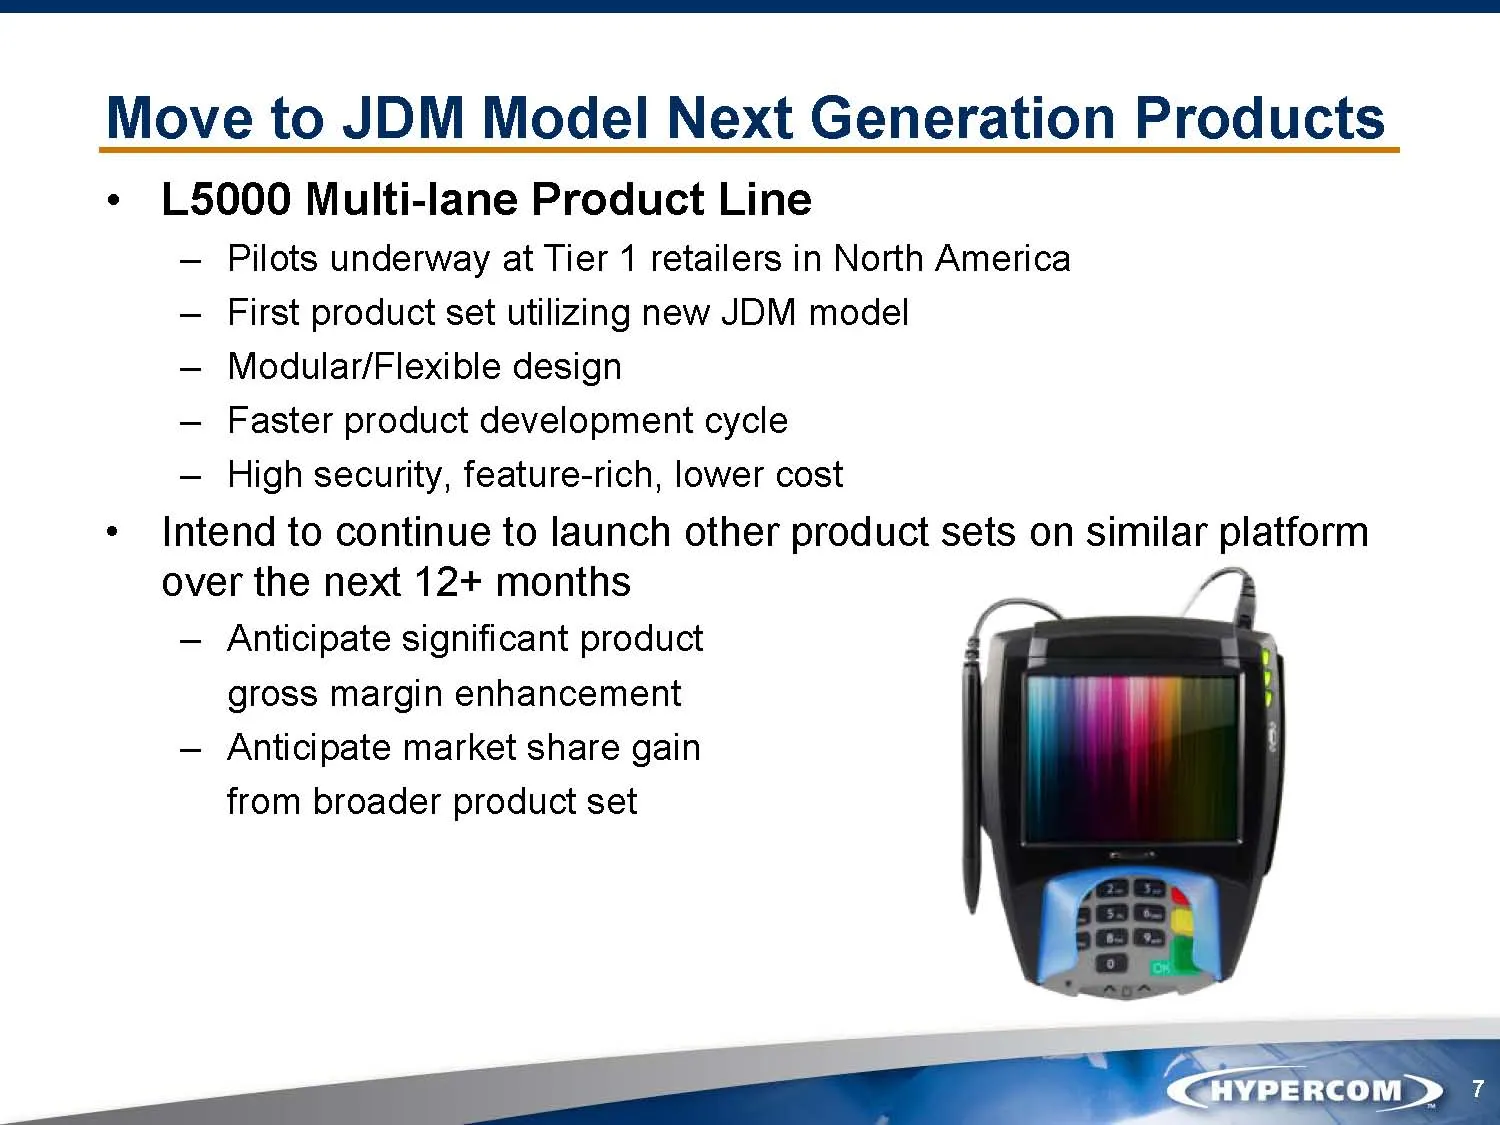
Move to JDM Model Next Generation Products ¢ L5000 Multi-lane Product Line — Pilots underway at Tier 1 retailers in North America — First product set utilizing new JDM model — Modular/Flexible design — Faster product development cycle — High security, feature-rich, lower cost « Intend to continue to
Slide 8: Regional Revenue
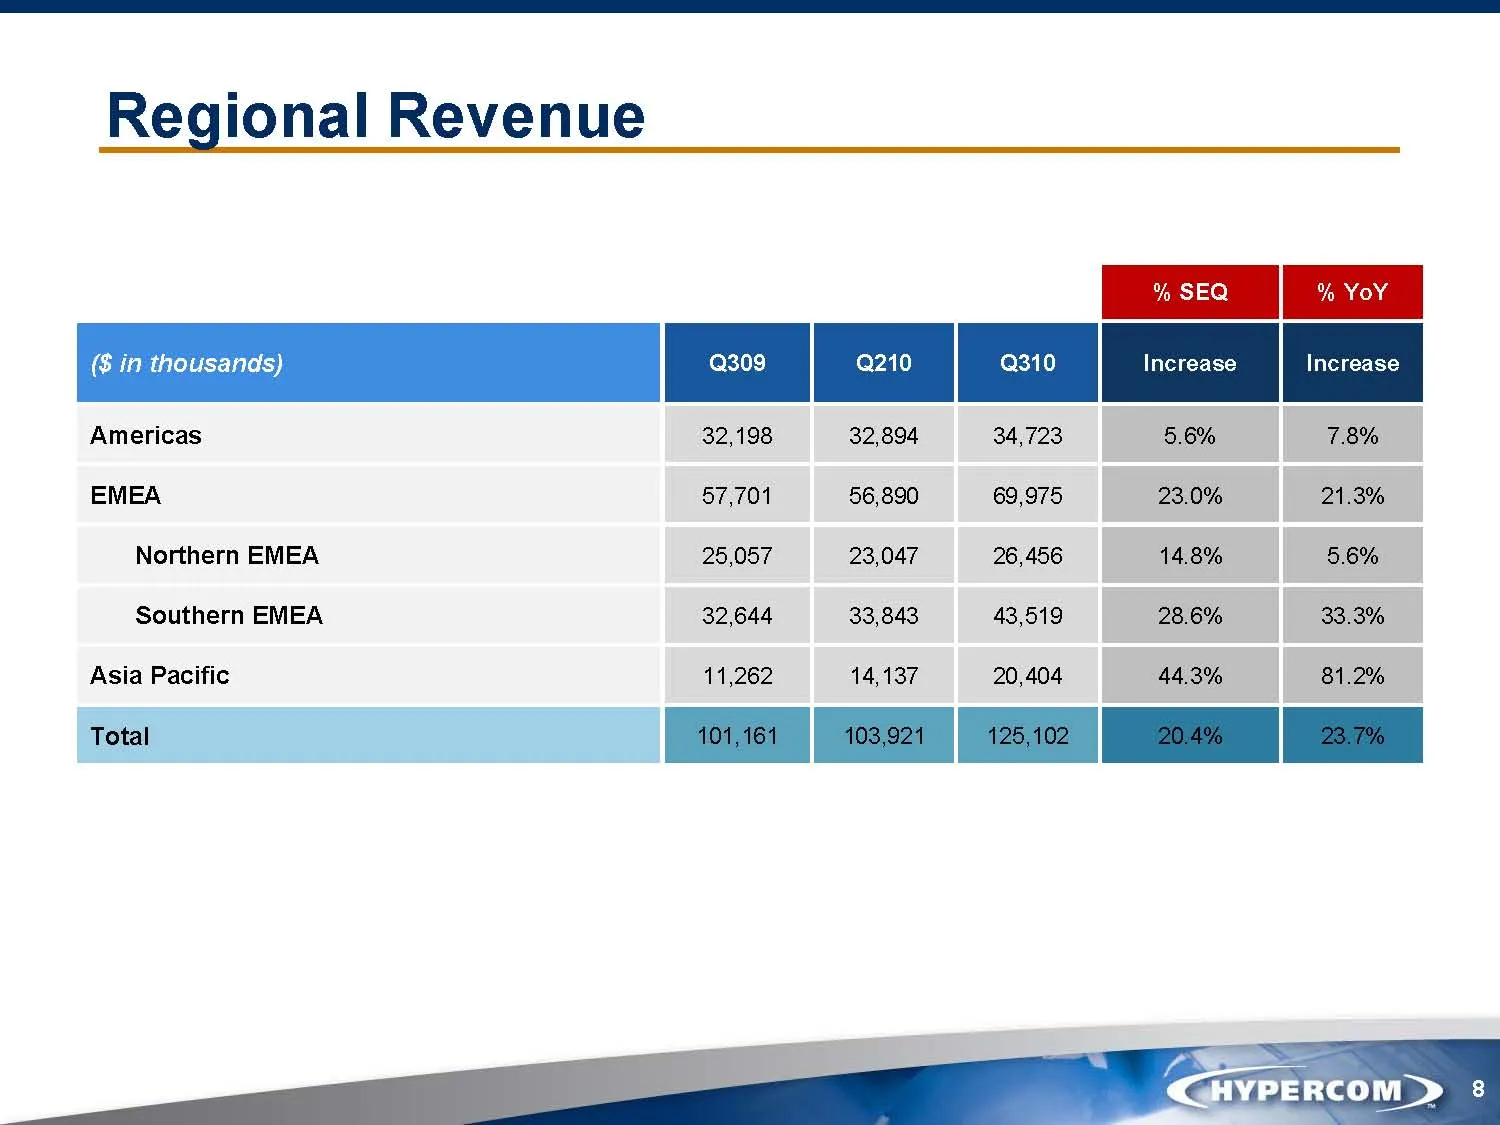
Regional Revenue Y aaa, } ase | azo | ano | tea | ine | Americas 32,198 32,894 34,723 5.6% 78% EMEA 57,701 56,890 69,975 23.0% 21.3% Northern EMEA 25,057 23,047 26,456 14.8% 5.6% Southern EMEA 32,644 33,843 43,519 28.6% 33.3% Asia Pacific 11,262 14,137 20,404 44.3% Tota Soom | en | oe
Slide 9: Non-GAAP Profit & Loss
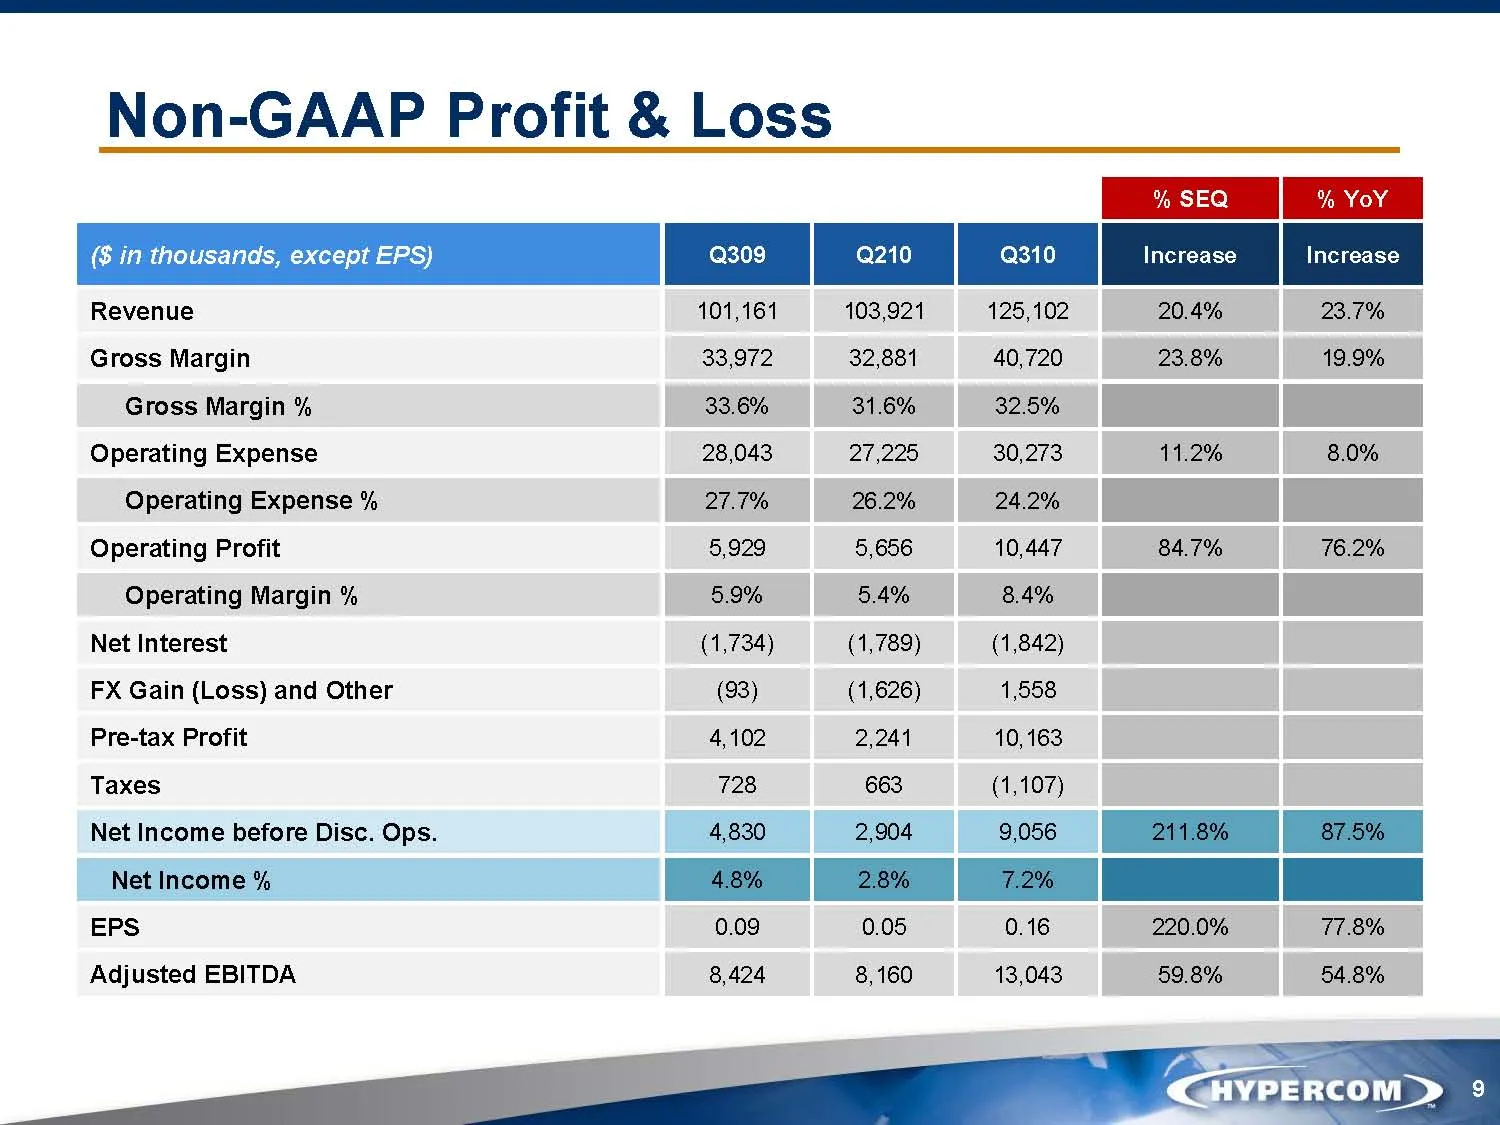
Non-GAAP Profit & Loss % SEQ % Revenue 101,161 103,921 125,102 20.4% 23.7% Gross Margin 33,972 32,881 40,720 23.8% 19.9% Gross Margin % 33.6% 31.6% 32.5% Operating Expense 28,043 27,225 30,273 11.2% 8.0% Operating Expense % 27.7% 26.2% 24.2% Operating Profit 8,929 5,656 10,447 84.7% 76.2% Operating
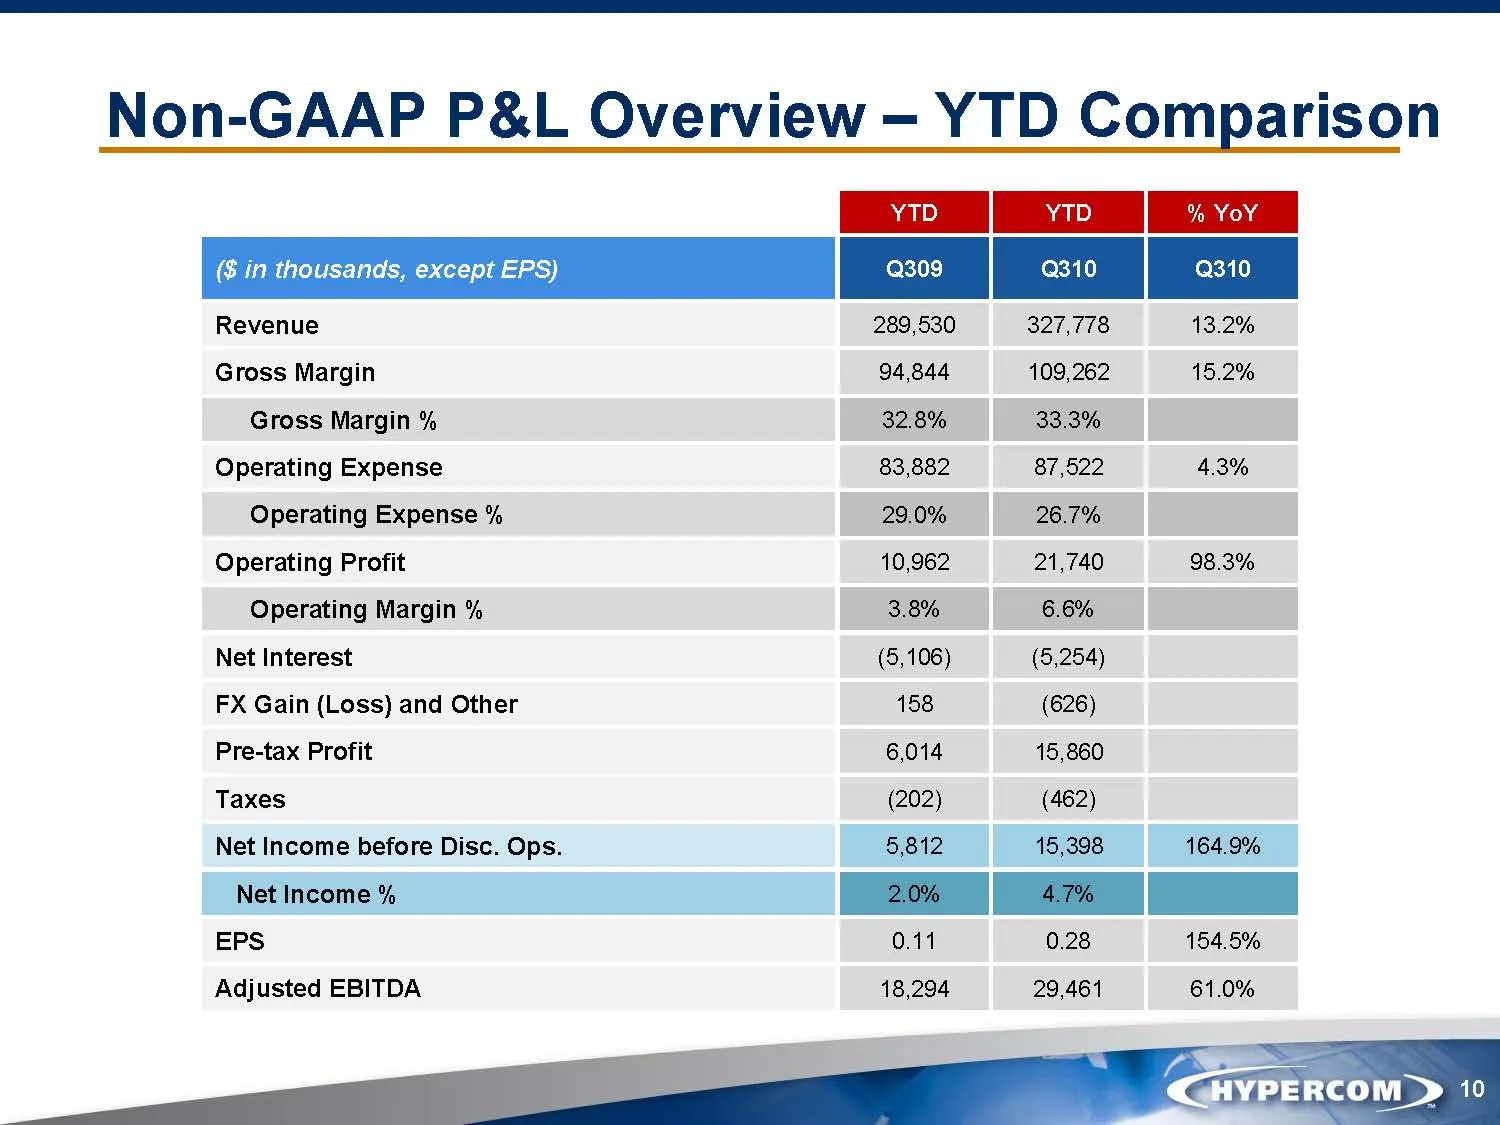
Slide 10: Non-GAAP P&L Overview — YTD Comparison
Non-GAAP P&L Overview — YTD Comparison Revenue 289,530 327,778 13.2% Gross Margin 94,844 109,262 15.2% Gross Margin % 32.8% 33.3% Operating Expense 83,882 87,522 4.3% Operating Expense % 29.0% 26.7% Operating Profit 10,962 21,740 98.3% Operating Margin % 3.8% 6.6% Net Interest (5,106) (5,254) FX Gai
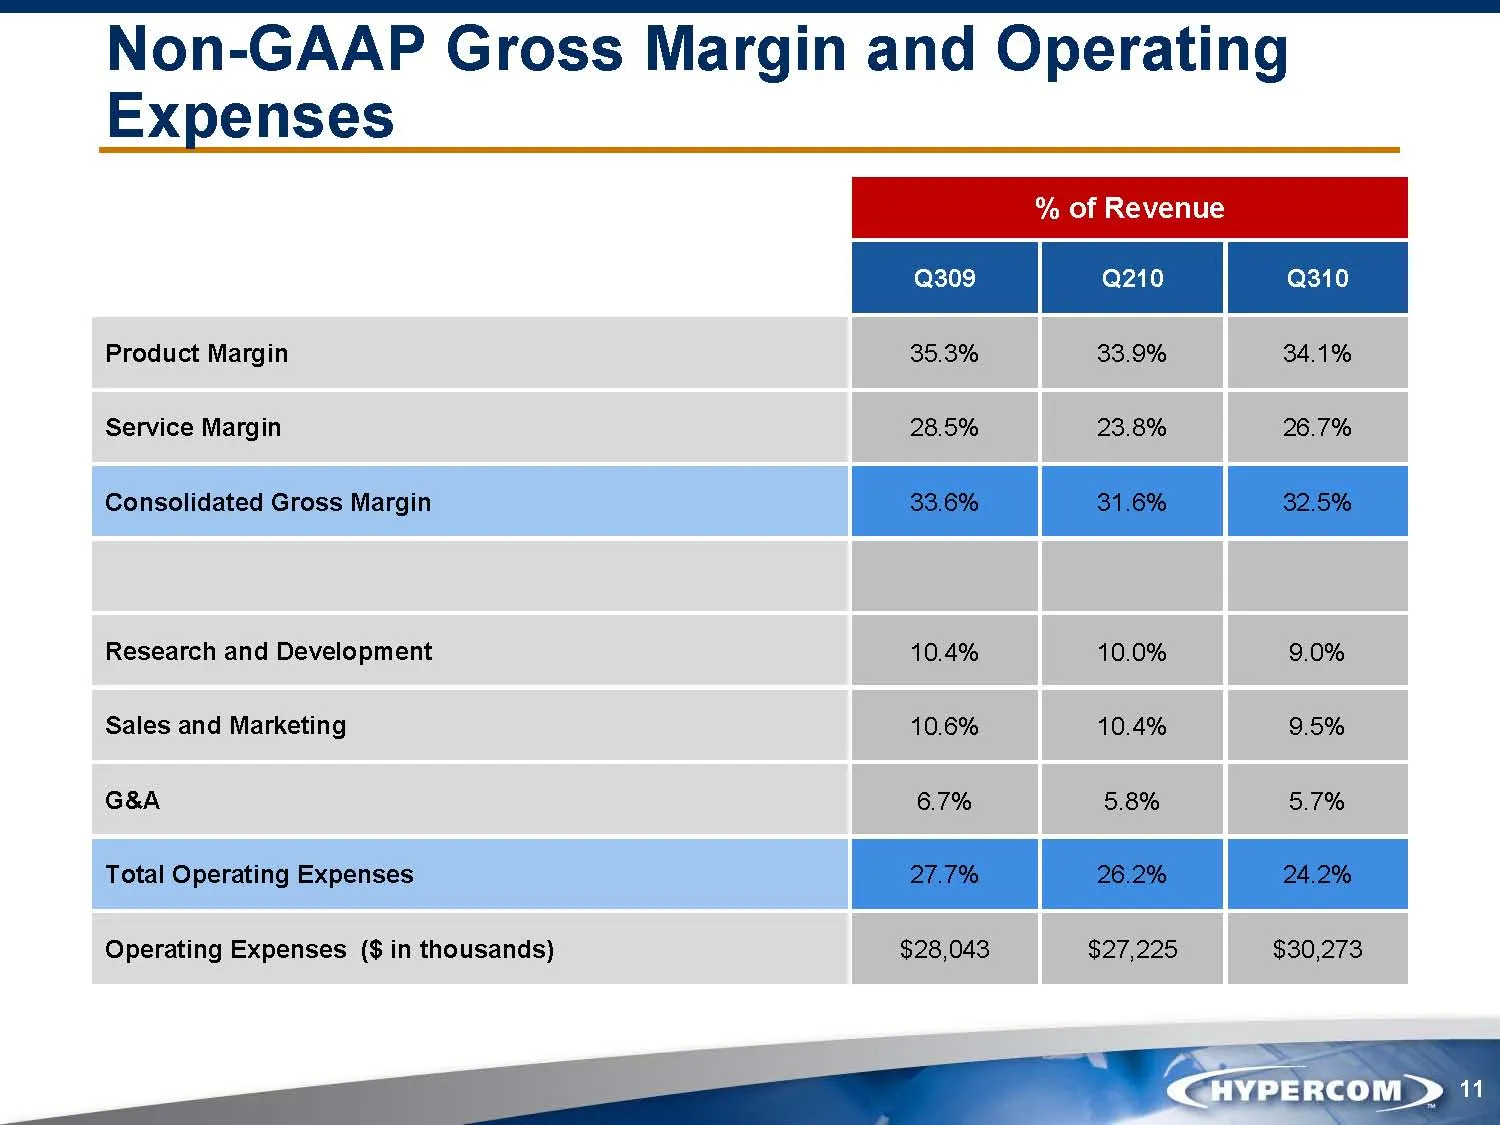
Slide 11: Non-GAAP Gross Margin and Operating Expenses
Non-GAAP Gross Margin and Operating Product Margin 35.3% 33.9% 34.1% Service Margin 28.5% 23.8% 26.7% Consolidated Gross nBEL ee ee Research and Development 10.4% 10.0% 9.0% Sales and Marketing 10.6% 10.4% 9.5% G&A 6.7% 5.8% 5.7% ss ae ce ee Operating Expenses ($ in thousands) $28,043 $27,225 $30,27
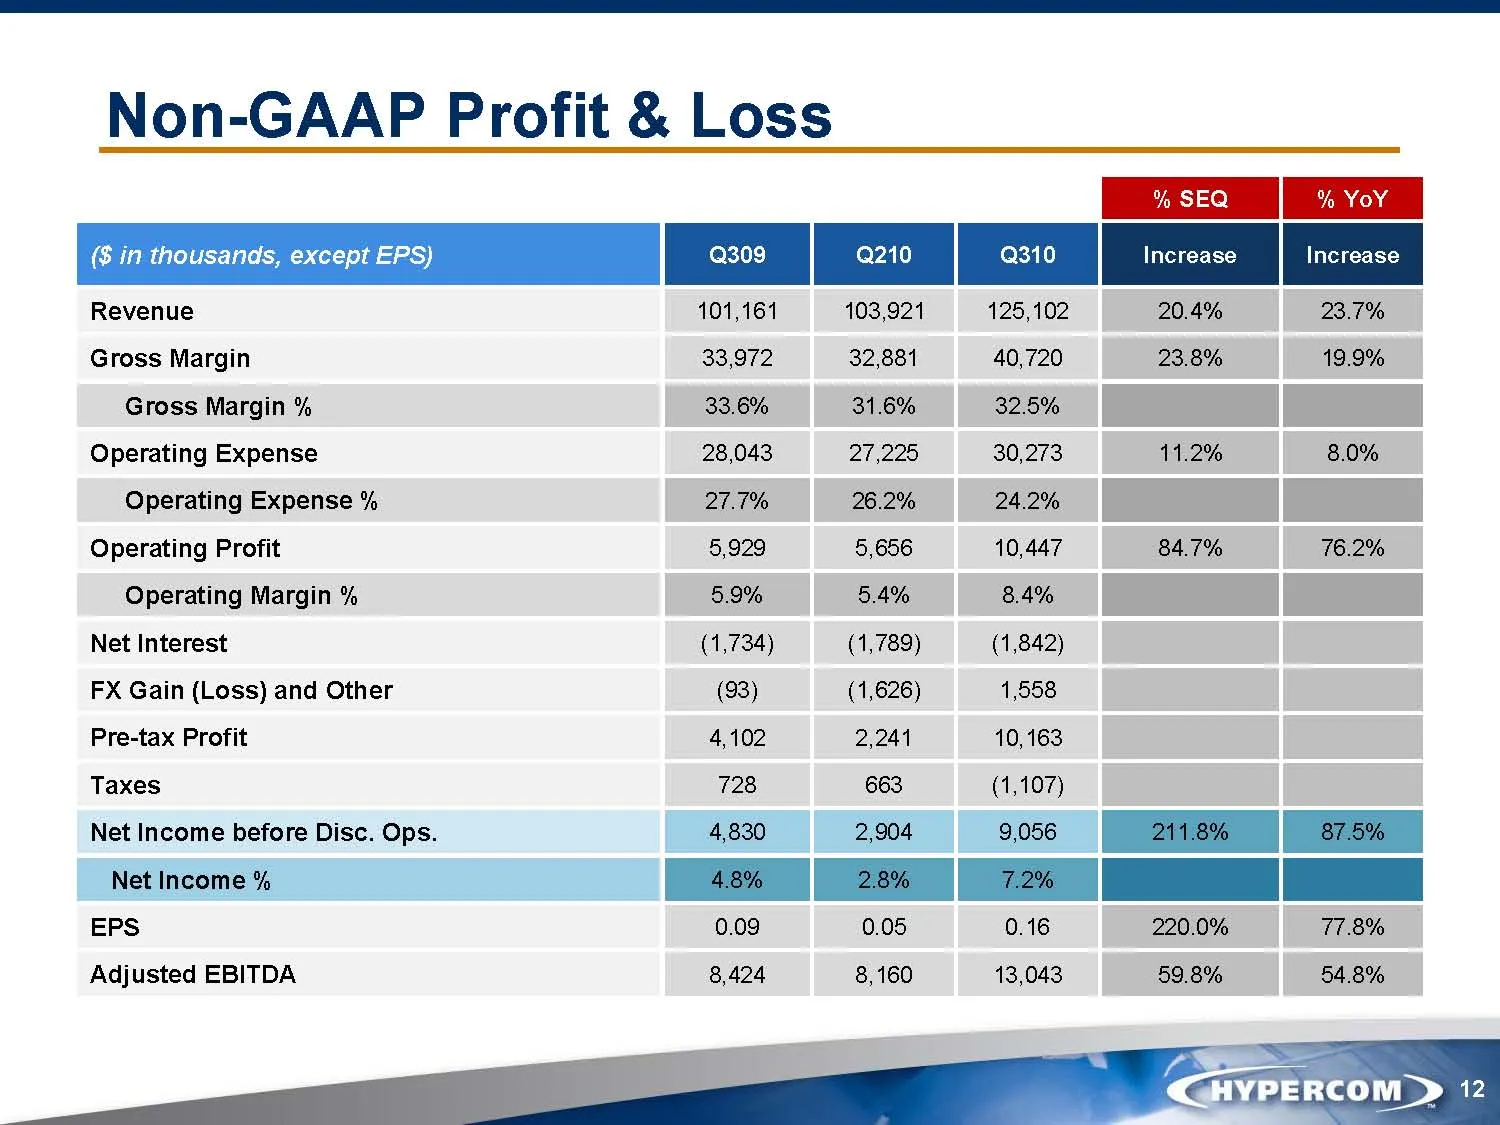
Slide 12: Non-GAAP Profit & Loss
Non-GAAP Profit & Loss % SEQ % Revenue 101,161 103,921 125,102 20.4% 23.7% Gross Margin 33,972 32,881 40,720 23.8% 19.9% Gross Margin % 33.6% 31.6% 32.5% Operating Expense 28,043 27,225 30,273 11.2% 8.0% Operating Expense % 27.7% 26.2% 24.2% Operating Profit 8,929 5,656 10,447 84.7% 76.2% Operating
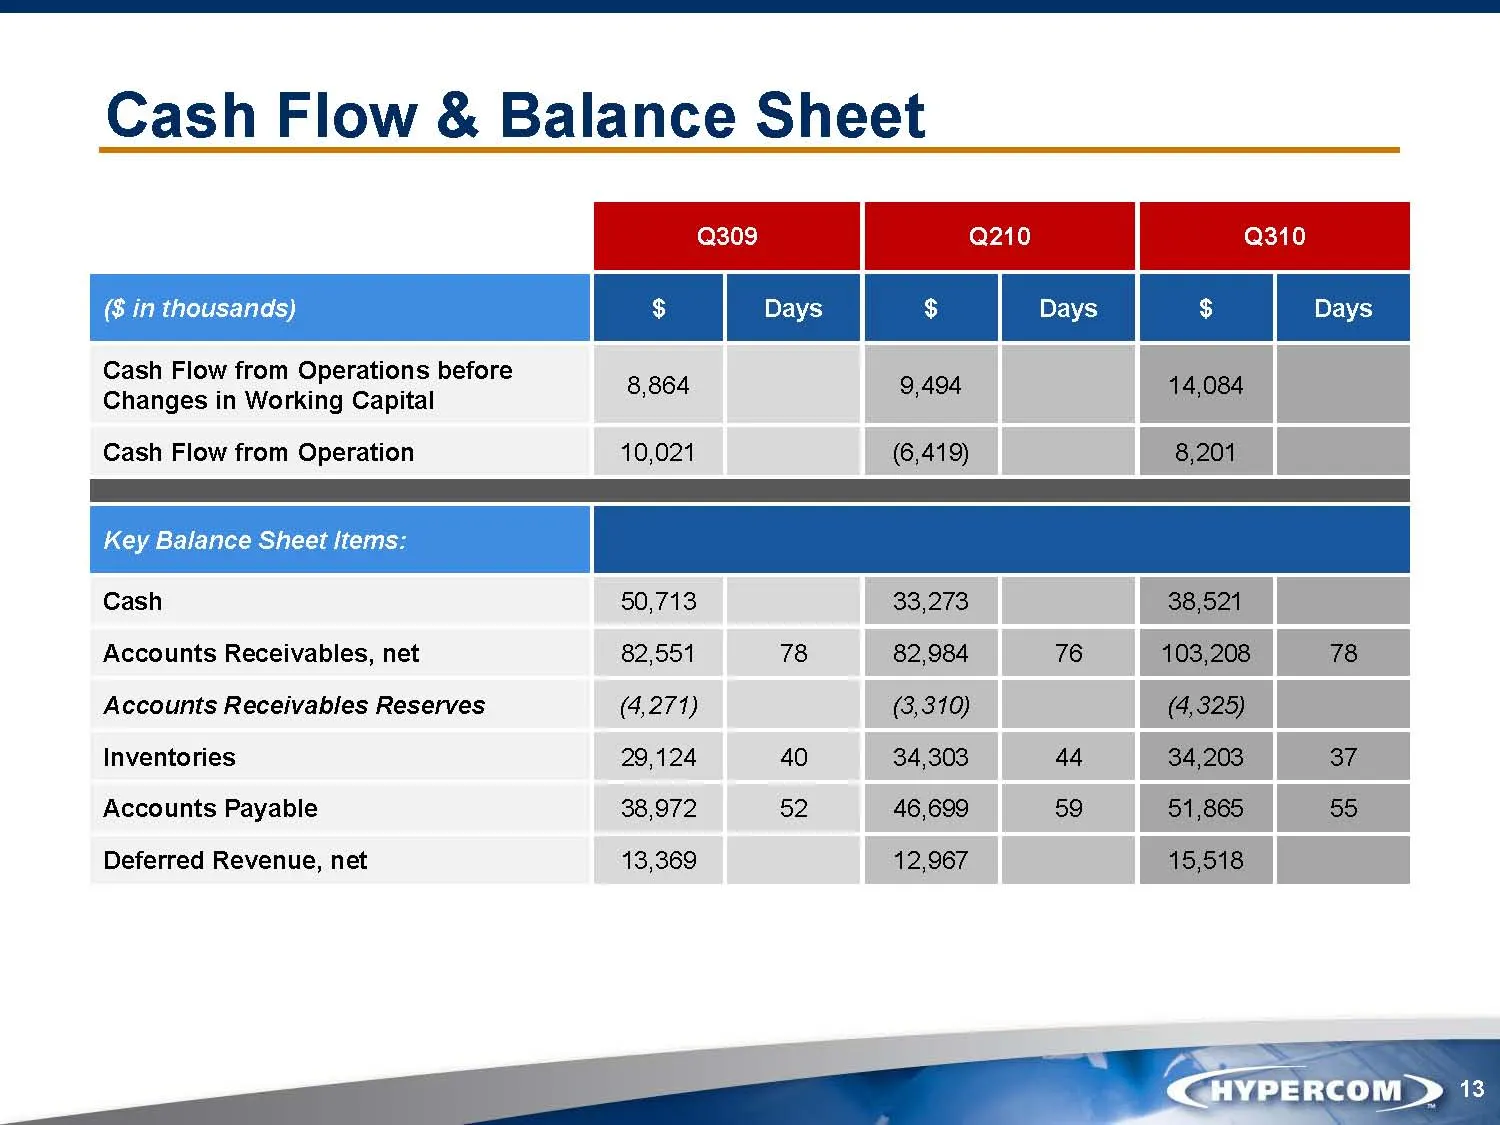
Slide 13: Cash Flow & Balance Sheet
Cash Flow & Balance Sheet enna CT Tom Cash Flow from Operations before Changes in Working Capital , Cash Flow from Operation Key Balance Sheet items: Cash Accounts Receivables, net Accounts Receivables Reserves (4,277) (3,310) Inventories 29,124 40 34,303 44 37 Accounts Payable 38,972 52 46,699 59 5
Slide 14: Growth Drivers — Geographic Expansion
Growth Drivers — Geographic Expansion » New customers worldwide = Tier 1 retail North America « Investments in key countries — India: local presence resulting in first contract — Russia: additional engagement — Turkey: new offices — China: sales demand growing
Slide 15: Growth Drivers - Verticals & Technology
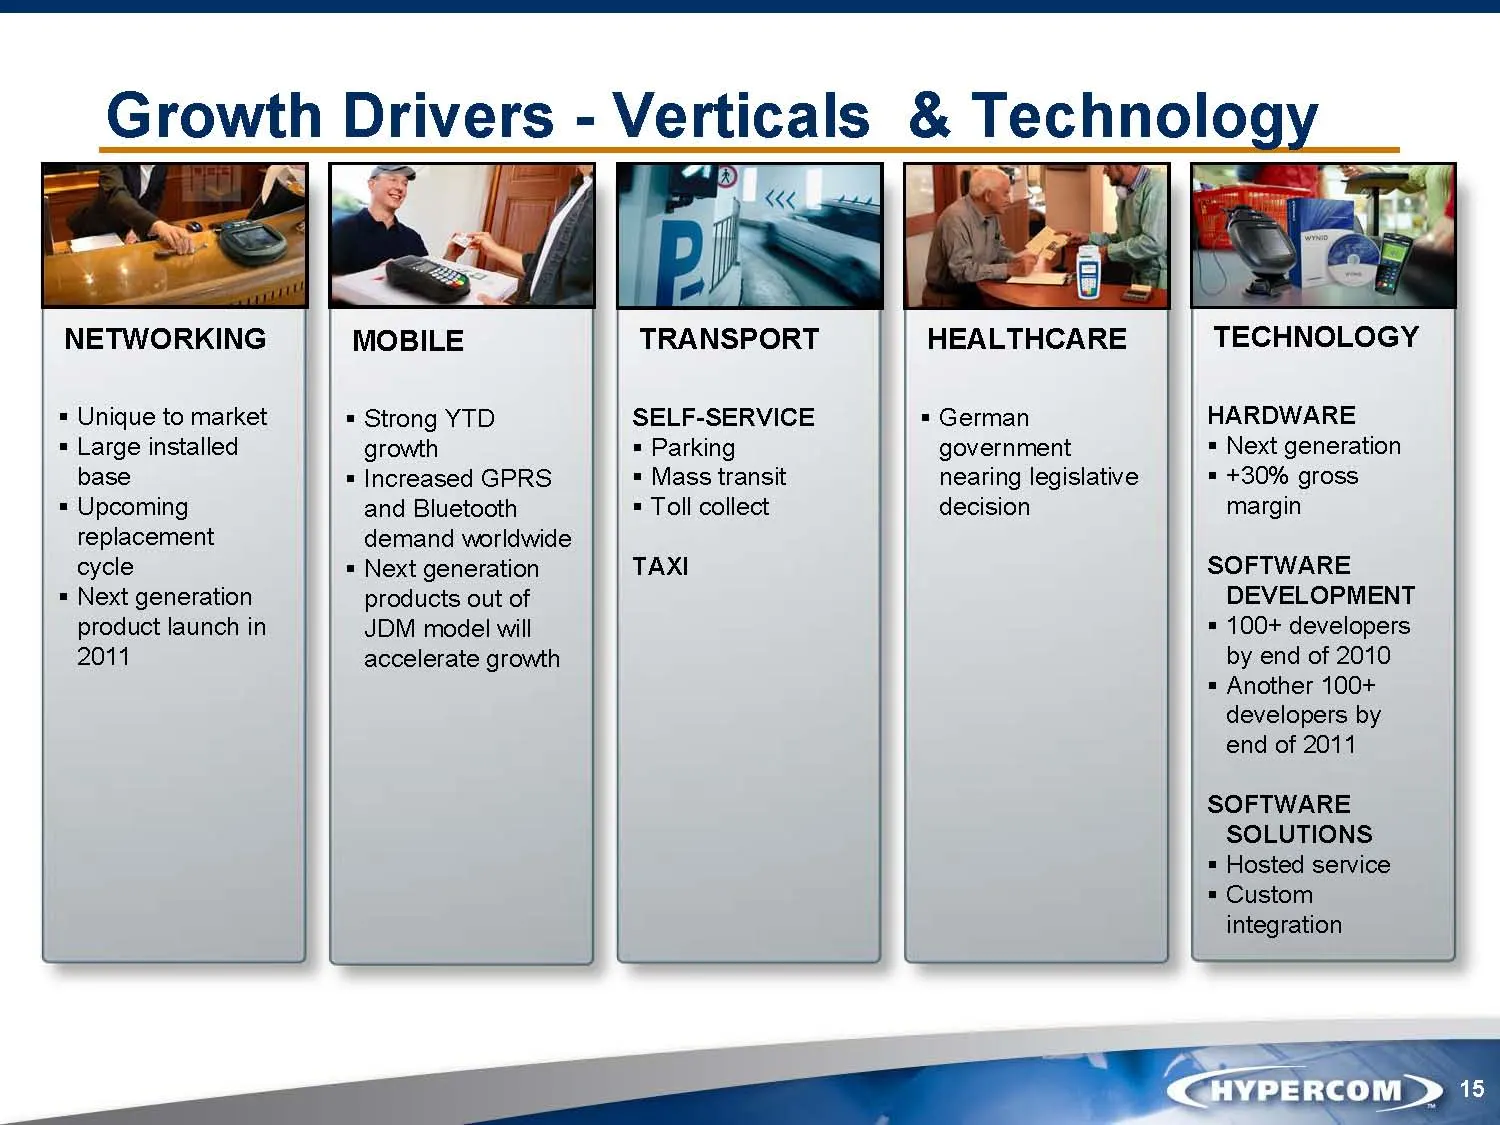
Growth Bivens - Verticals & Technology NETWORKING = Unique to market = Large installed base = Upcoming replacement cycle = Next generation product launch in 2011 MOBILE Strong YTD growth = Increased GPRS and Bluetooth demand worldwide = Next generation products out of JDM model will accelerate growt

Slide 16: Q&A
Q&A Hypercom Corporation Our Products Handle 2010 Q3 Eamings Call é Moreyeaymer t Transactions eunanany Other Company —aAw In The World. @ — y | 1 [TUSt€d TRANSACTIONS \ HYPERCOM

Slide 17: END
END Hypercom Corporation Our Products Handle 2010 Q3 Eamings Call é Moreyeaymer t Transactions eunanany Other Company —aAw In The World. @ — y | 1 [TUSt€d TRANSACTIONS \ HYPERCOM
Source: SEC EDGAR · 8-K filed Nov 2, 2010