Rumo SA · BMFBOVESPA:RAIL3
Rumo SA — ALL - América Latina Logística — FY2014 Earnings Presentation
14 slides from Rumo SA's earnings presentation, 2015

Slide 1: Conference Call 2014 Results
CONFERENCE CALL 2014 RESULTS 1
Slide 2: Disclaimer
DISCLAIMER This presentation contains estimates and forward-looking statements regarding our strategy and opportunities for future growth. Such information is mainly based on our current expectations and estimates or projections of future events and trends, which affect or may affect our business an
Slide 3: Business Units
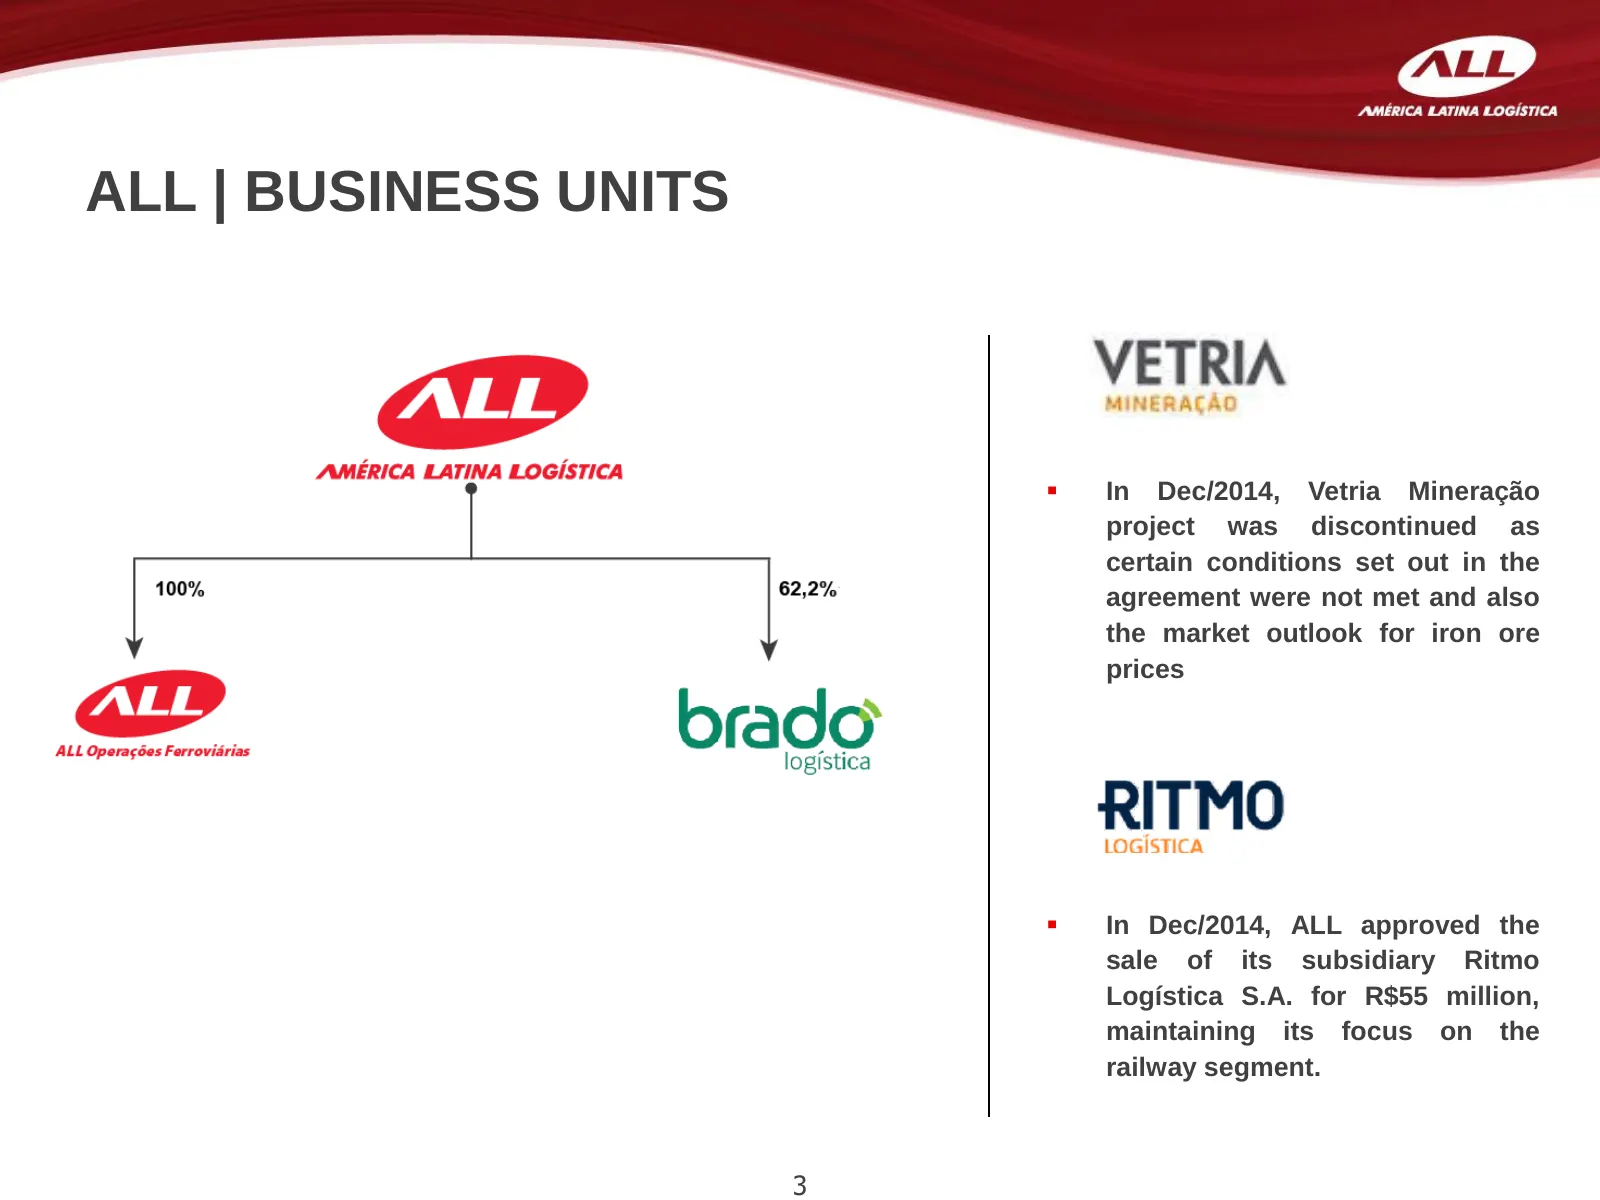
ALL | BUSINESS UNITS In Dec/2014, Vetria Mineração project was discontinued as certain conditions set out in the agreement were not met and also the market outlook for iron ore prices In Dec/2014, ALL approved the sale of its subsidiary Ritmo Logística S.A. for R$55 million, maintaining its focu
Slide 4: Consolidated Results Highlights 2014
ALL | Consolidated Results Highlights 2014 • ALL consolidated EBITDA of R$1.1 billion in 2014 • 3.3% growth in Rail Operations volume, reaching 42.9 million RTK • Impairment of R$1.1 billion in assets, change in accounting practice of Rumo’s contract and adjustments of previous periods • Waiver for
Slide 5: Consolidated Results
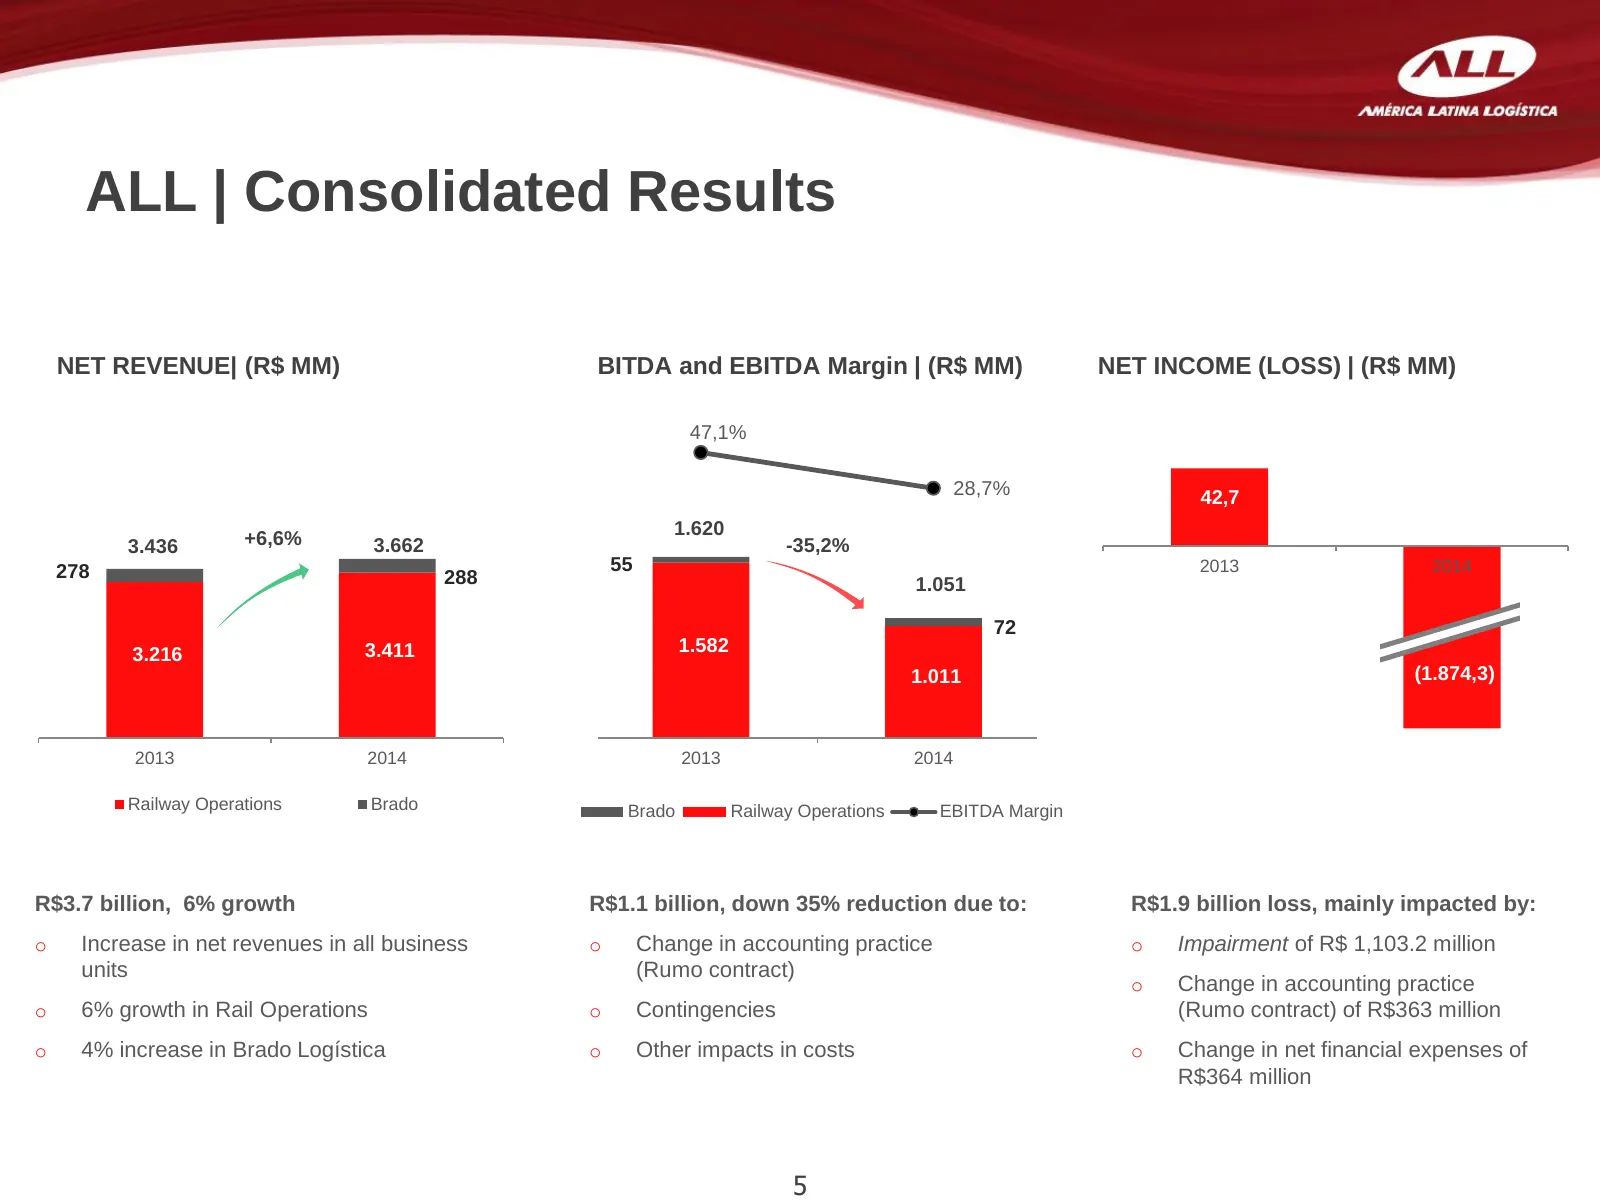
ALL | Consolidated Results NET REVENUE| (R$ MM) EBITDA and EBITDA Margin | (R$ MM) NET INCOME (LOSS) | (R$ MM) 47,1% 28,7% 42,7 1.620 3.436 +6,6% 3.662 -35,2% 278 55 2013 2014 288 1.051 72 3.216 3.411 1.582 1.011 (1.874,3) 2013 2014 2013 2014 Railway Operations Brado Brado Railway Operations EBITDA
Slide 6: Rail Operations Market Outlook
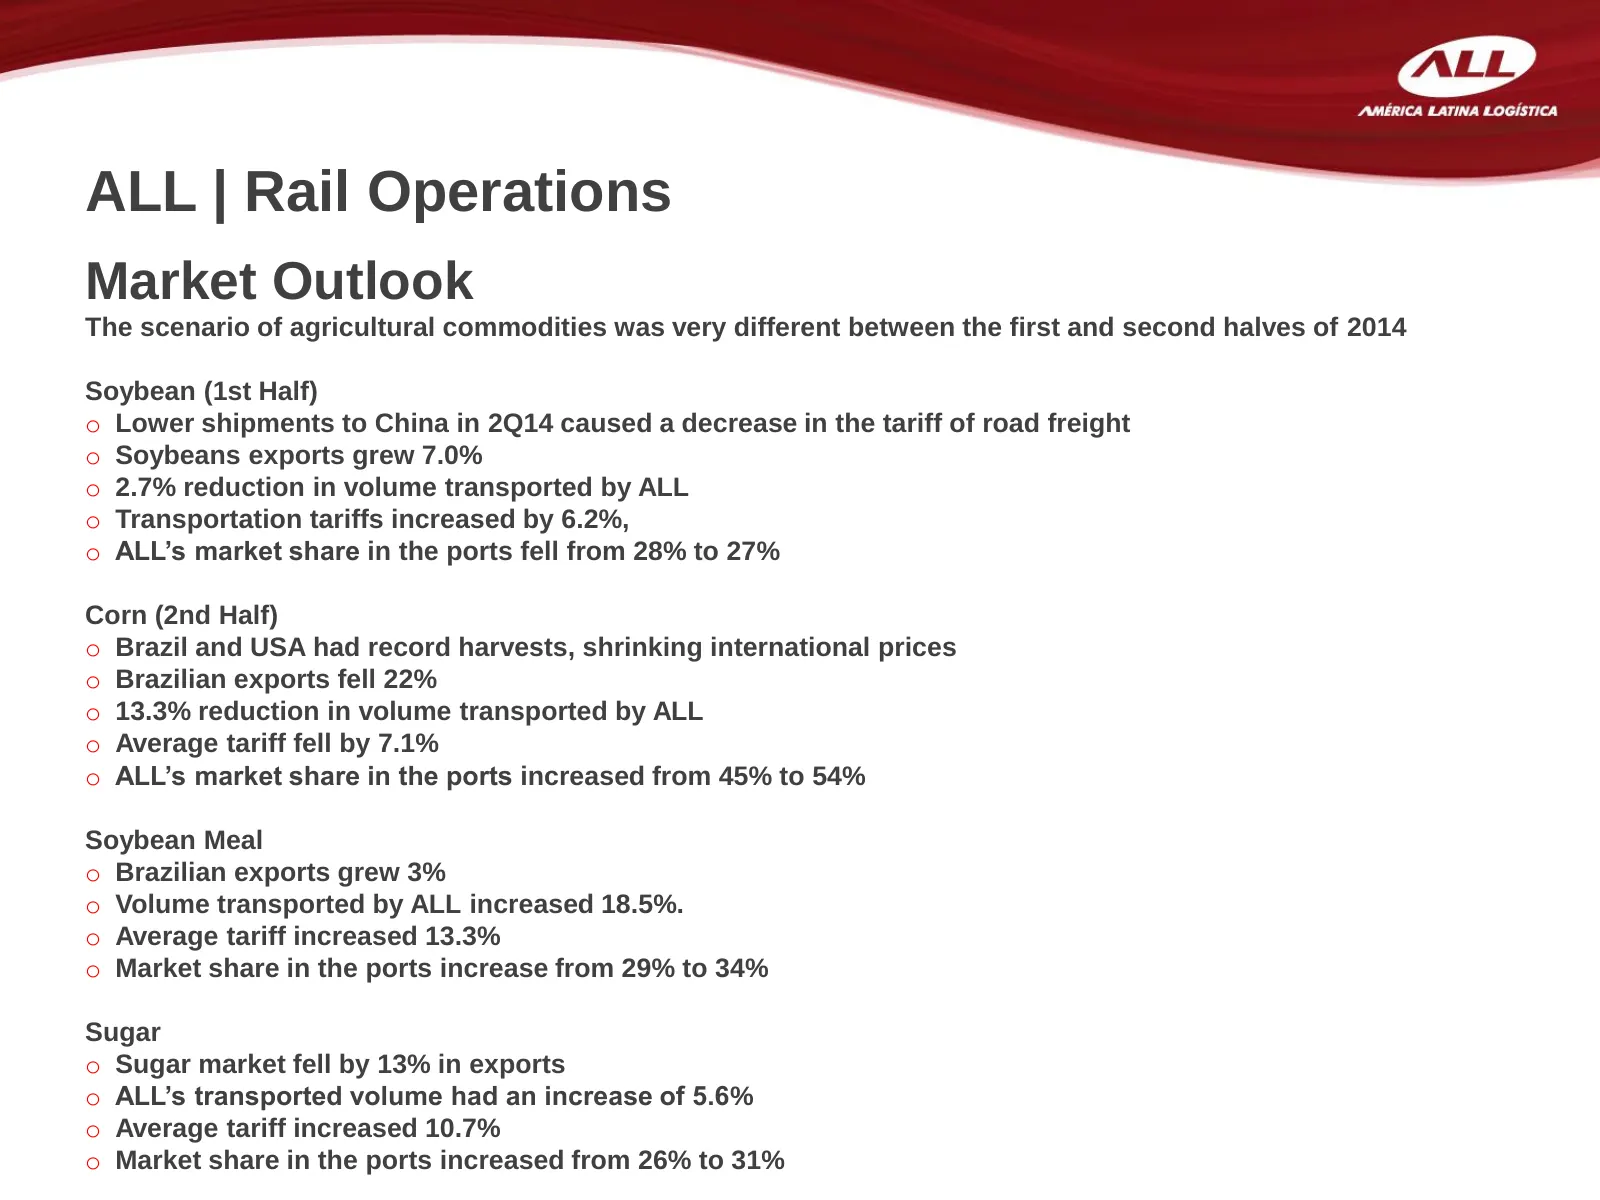
ALL | Rail Operations Market Outlook The scenario of agricultural commodities was very different between the first and second halves of 2014 Soybean (1st Half) o Lower shipments to China in 2Q14 caused a decrease in the tariff of road freight o Soybeans exports grew 7.0% o 2.7% reduction in volume t
Slide 7: Railway Operations
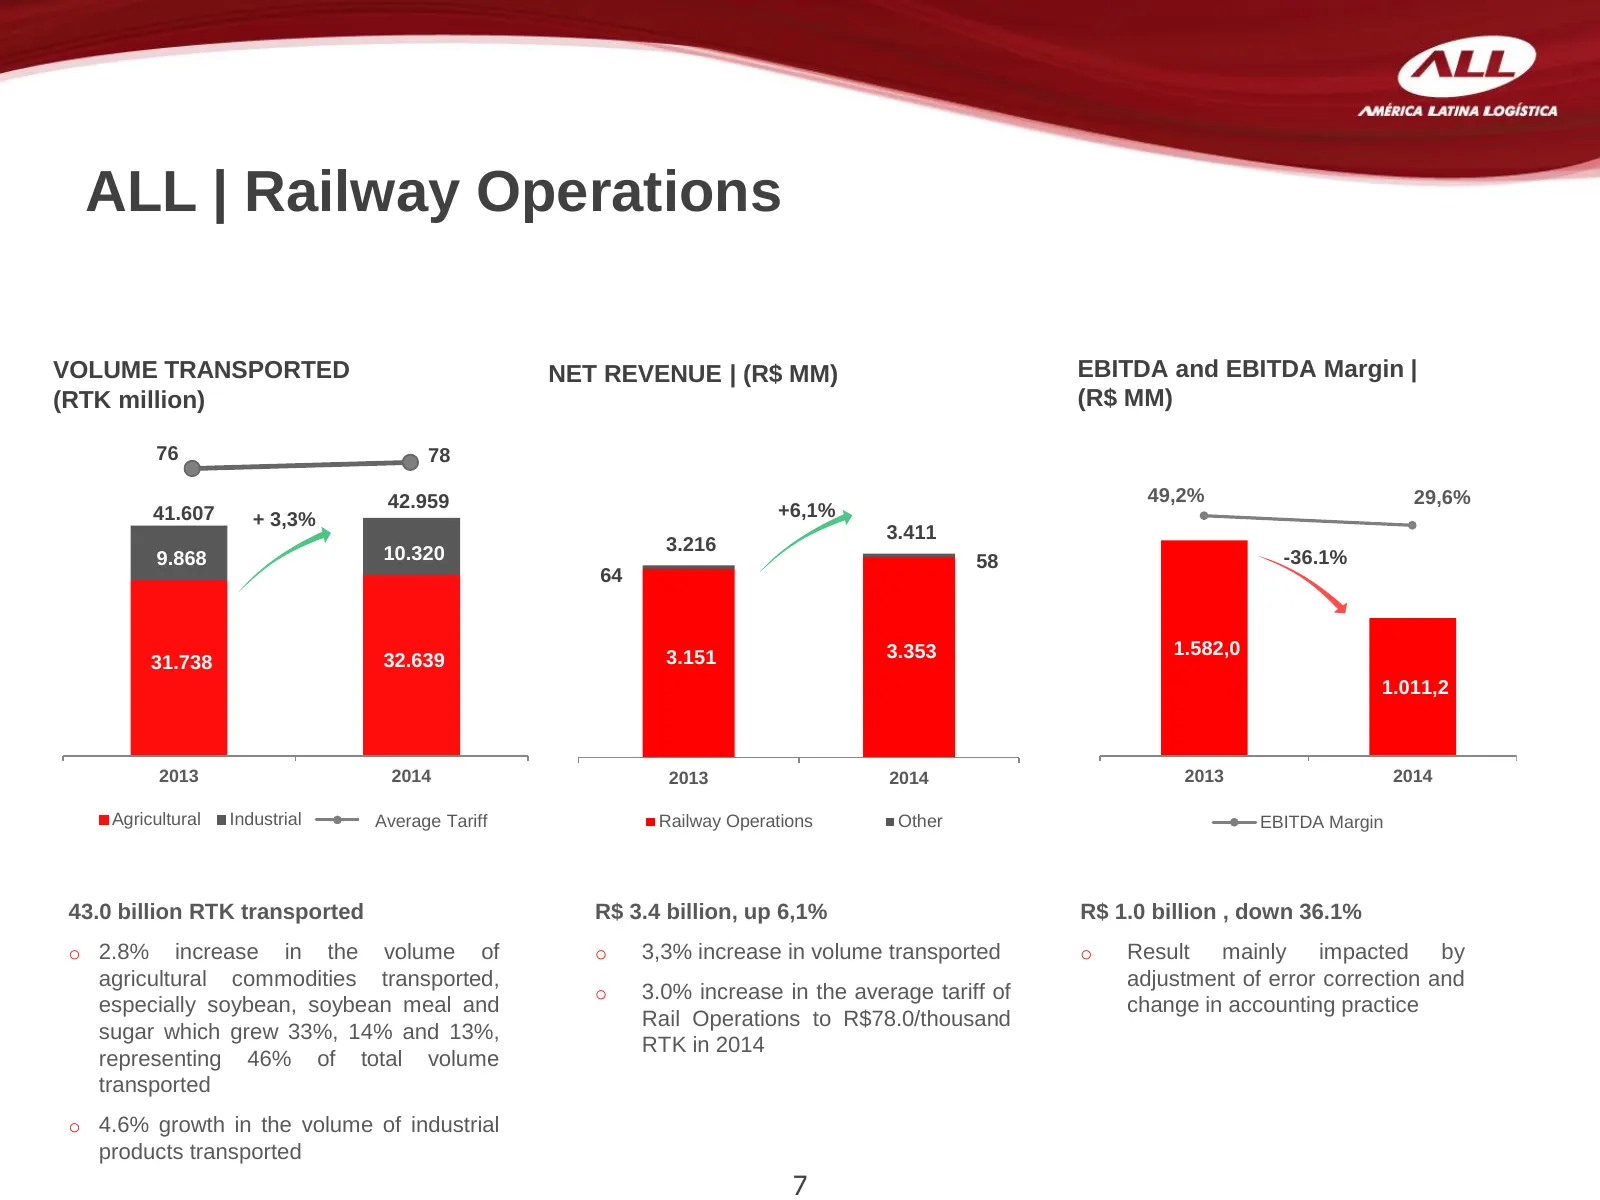
ALL | Railway Operations VOLUME TRANSPORTED NET REVENUE | (R$ MM) EBITDA and EBITDA Margin | EBITDA e Margem EBITDA| (R$ MM) (RTK million) (R$ MM) 76 78 42.959 27,6% 49,2% 29,6% 41.607 32,9% +6,1% + 3,3% 3.411 10.320 3.216 9.868 58 -36.1% -11,5% 64 1.064,2 3.151 3.353 1.582,0 31.738 32.639 1.011,2 9
Slide 8: Brado Logística
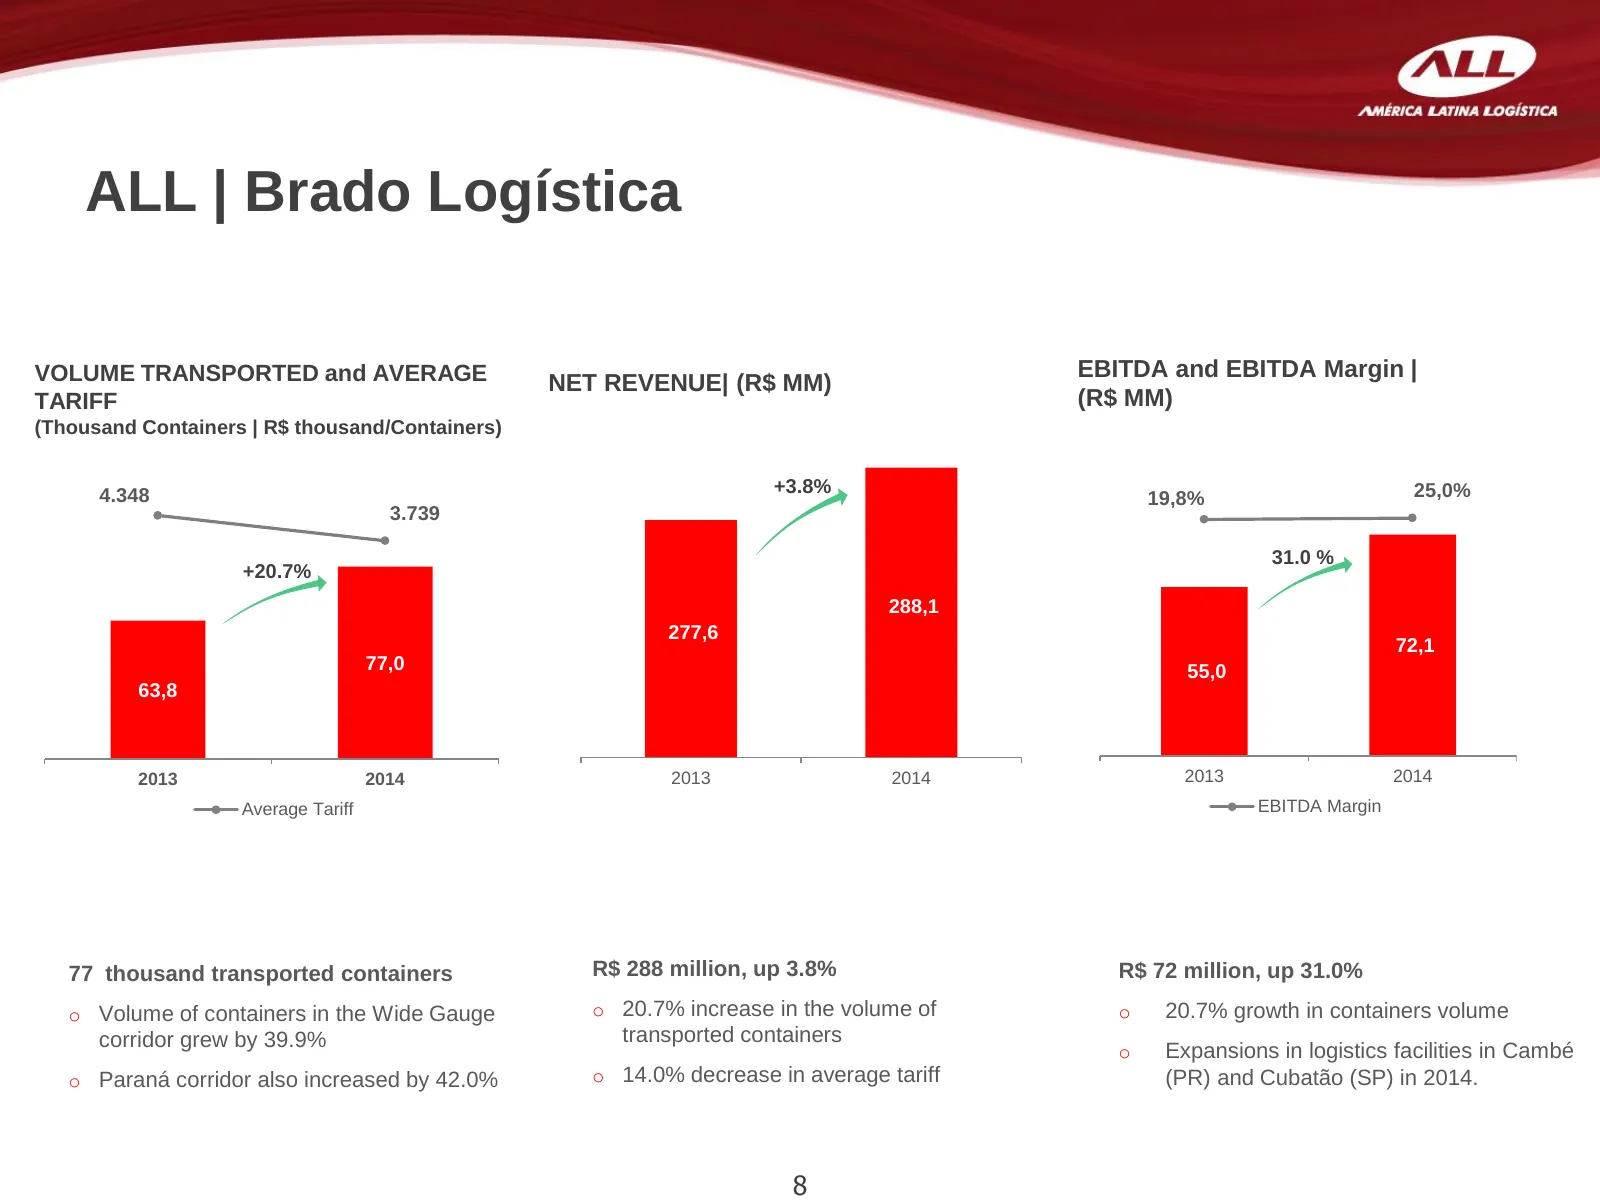
ALL | Brado Logística VOLUME TRANSPORTED and AVERAGE EBITDA and EBITDA Margin | NET REVENUE| (R$ MM) TARIFF (R$ MM) (Thousand Containers | R$ thousand/Containers) 4.348 +3.8% 25,0% 19,8% 3.739 31.0 % +20.7% 288,1 277,6 72,1 77,0 55,0 63,8 2013 2014 2013 2014 2013 2014 Average Tariff EBITDA Margin 77
Slide 9: Accounting Adjustments
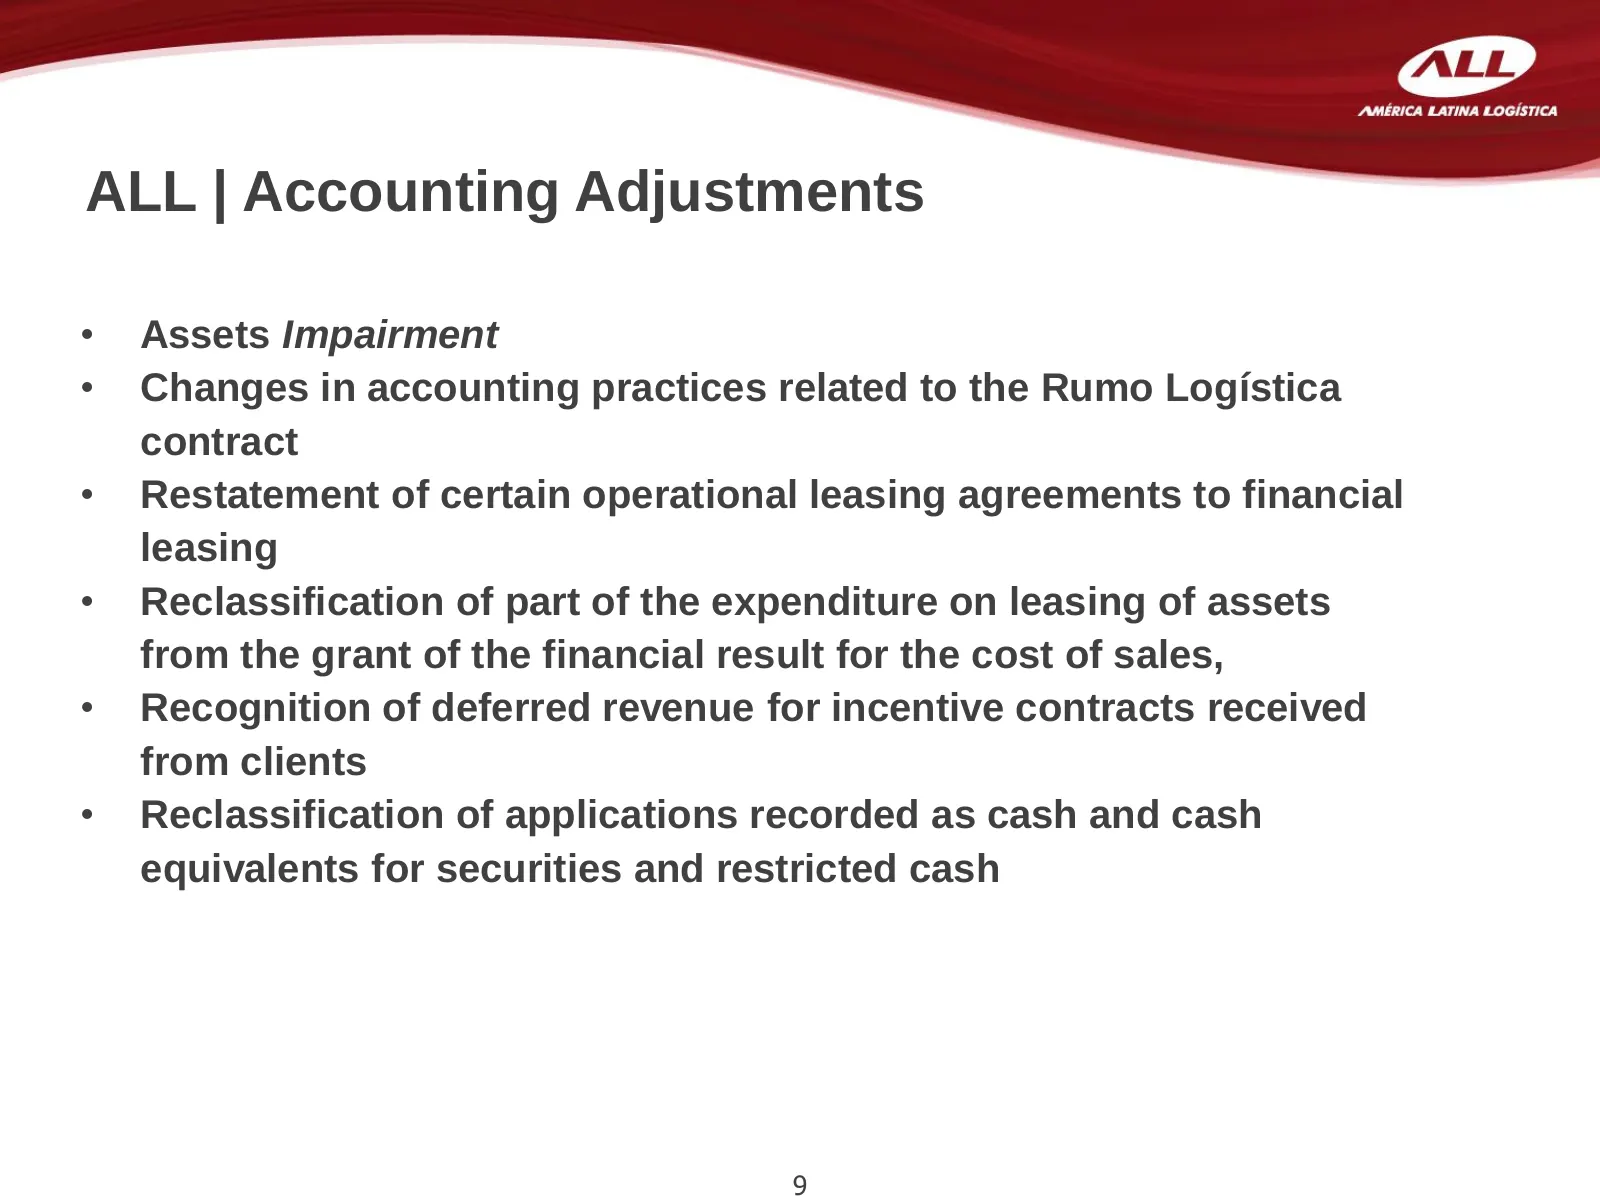
ALL | Accounting Adjustments • Assets Impairment • Changes in accounting practices related to the Rumo Logística contract • Restatement of certain operational leasing agreements to financial leasing • Reclassification of part of the expenditure on leasing of assets from the grant of the financial re
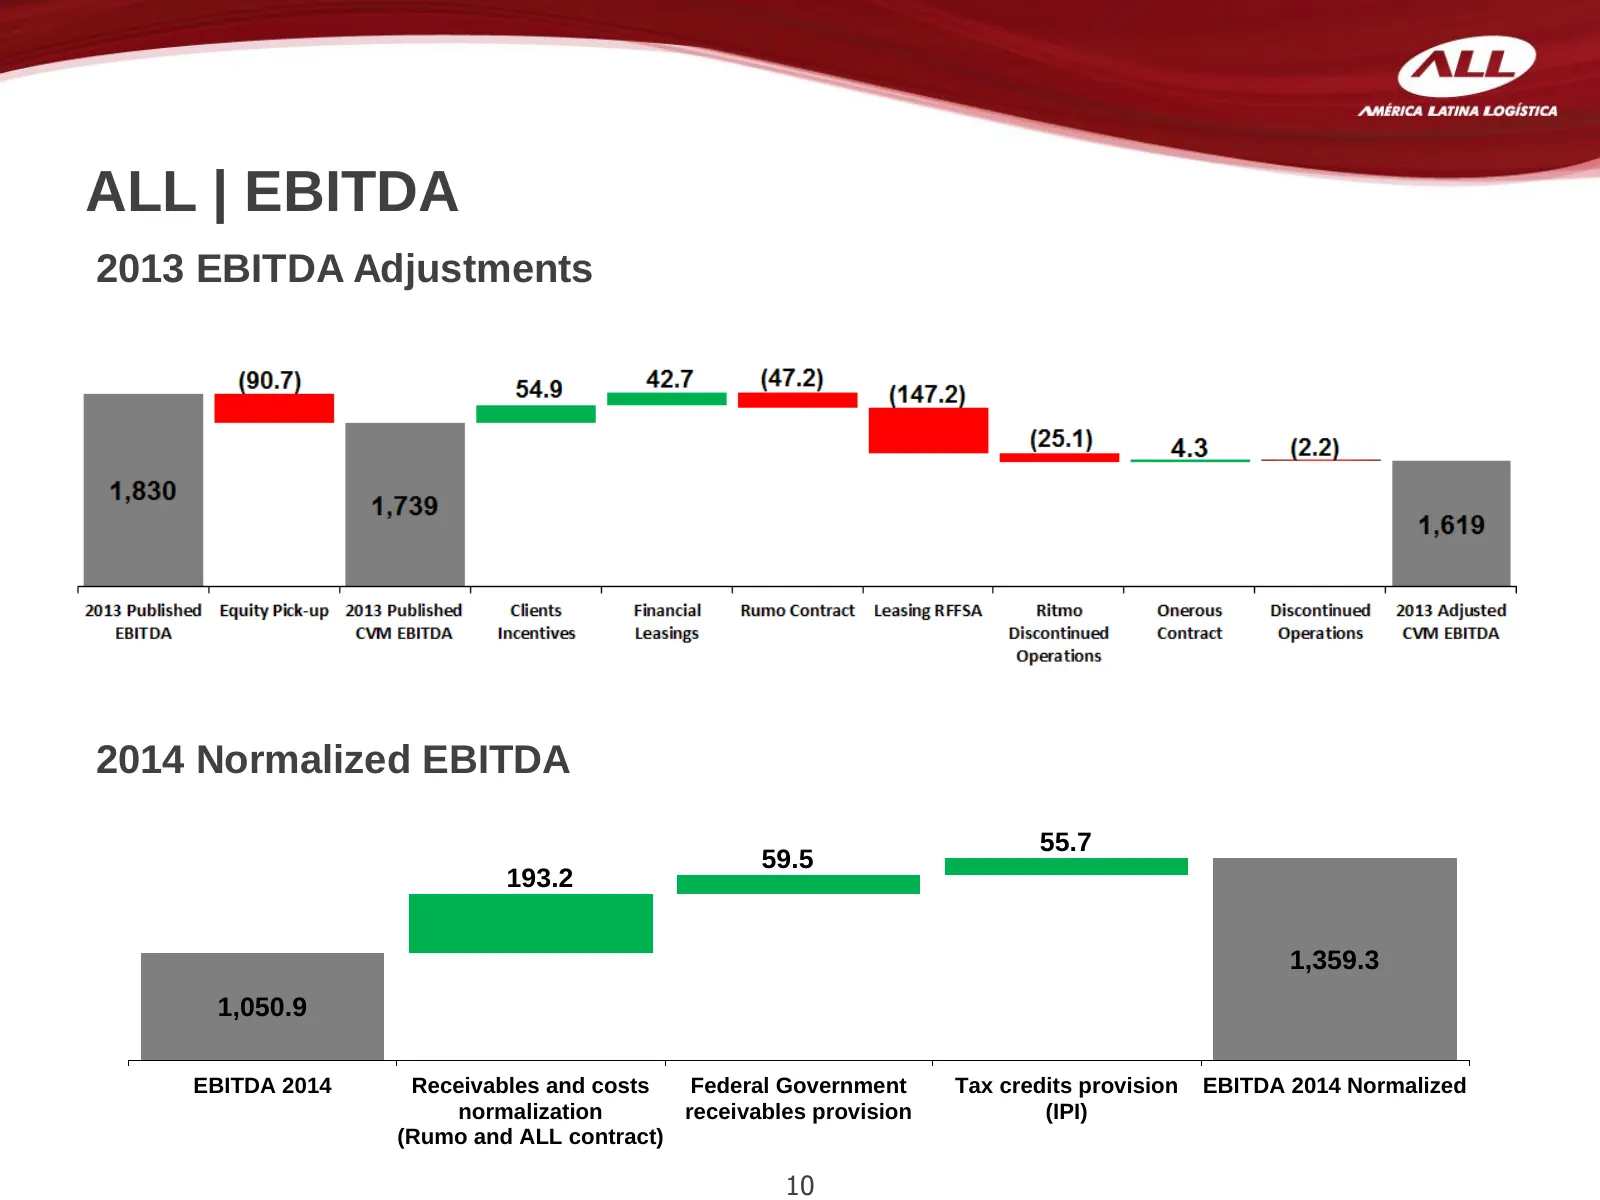
Slide 10: EBITDA
ALL | EBITDA 2013 EBITDA Adjustments 2014 Normalized EBITDA 55.7 59.5 193.2 1,359.3 1,050.9 EBITDA 2014 Receivables and costs Federal Government Tax credits provision EBITDA 2014 Normalized normalization receivables provision (IPI) (Rumo and ALL contract) 10
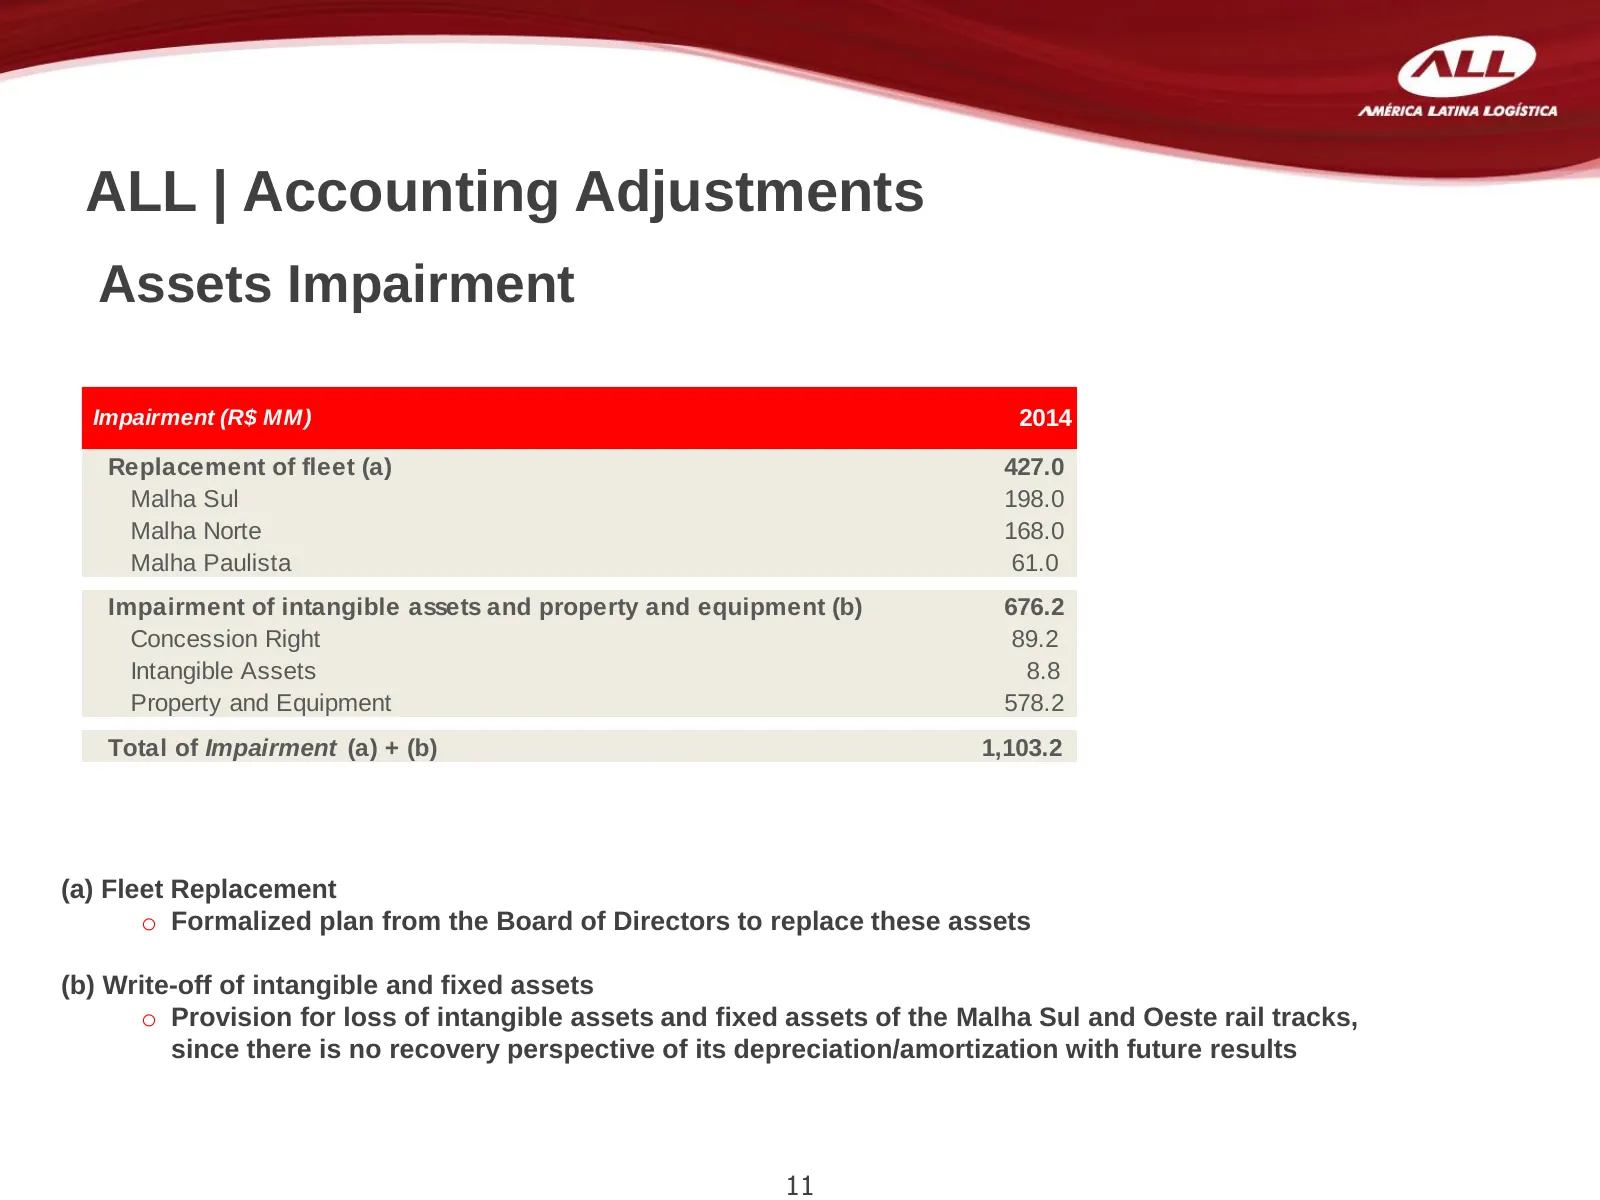
Slide 11: Accounting Adjustments Assets Impairment
ALL | Accounting Adjustments Assets Impairment Impairment (R$ MM) 2014 Replacement of fleet (a) 427.0 Malha Sul 198.0 Malha Norte 168.0 Malha Paulista 61.0 Impairment of intangible assets and property and equipment (b) 676.2 Concession Right 89.2 Intangible Assets 8.8 Property and Equipment 578.2 To
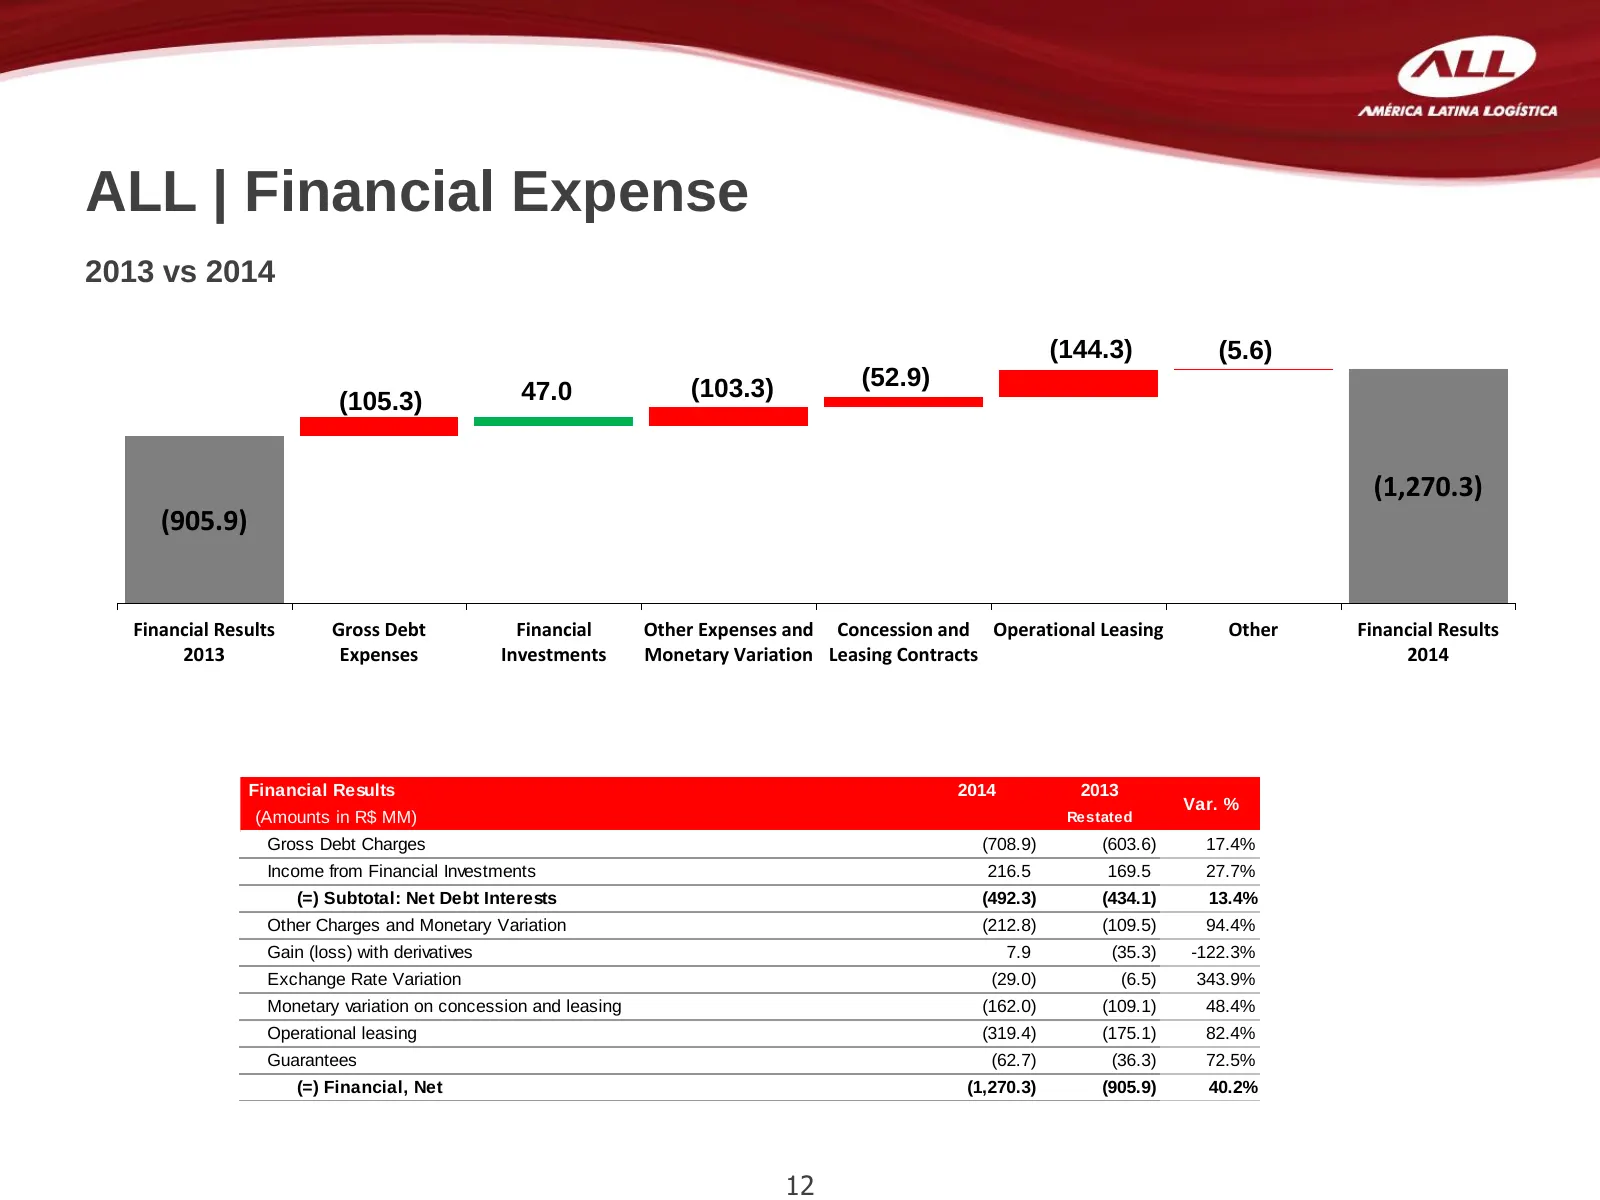
Slide 12: Financial Expense
ALL | Financial Expense 2013 vs 2014 (144.3) (5.6) (103.3) (52.9) (105.3) 47.0 (1,270.3) (905.9) Financial Results Gross Debt Financial Other Expenses and Concession and Operational Leasing Other Financial Results 2013 Expenses Investments Monetary Variation Leasing Contracts 2014 Financial Results
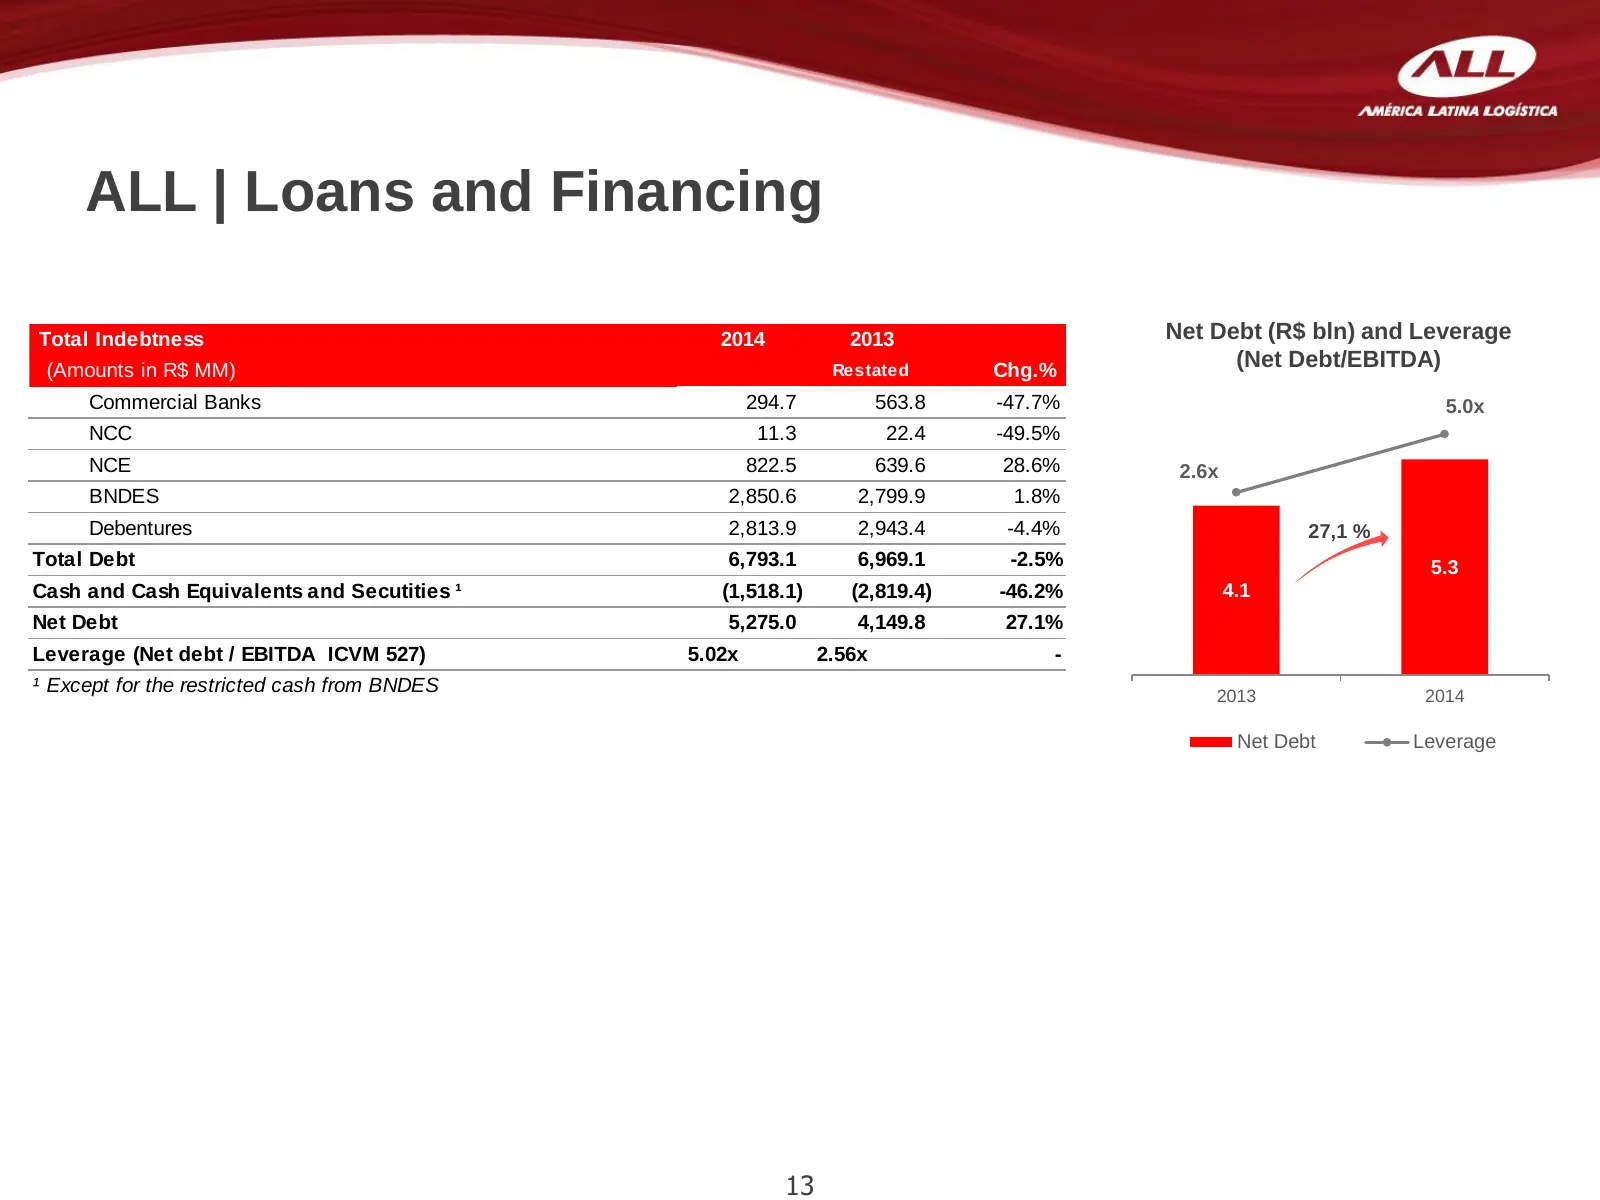
Slide 13: Loans and Financing
ALL | Loans and Financing Total Indebtness 2014 2013 Net Debt (R$ bln) and Leverage (Amounts in R$ MM) Restated Chg.% (Net Debt/EBITDA) Commercial Banks 294.7 563.8 -47.7% 5.0x NCC 11.3 22.4 -49.5% NCE 822.5 639.6 28.6% 2.6x BNDES 2,850.6 2,799.9 1.8% Debentures 2,813.9 2,943.4 -4.4% 27,1 % Total De

Slide 14: Investor Relations Contacts
José Cezário Menezes de Barros Sobrinho CFO and Investor Relations Officer Guilherme Machado Investor Relations Manager www.all-logistica.com.br/ri ir@all-logistica.com +55 (41) 2141-7459 14
Source: Internet Archive copy of ri.rumolog.com
More decks from Rumo SA
 Q2 2026 Earnings Presentation14 slides · Aug 13, 2026
 Q4 2025 Earnings Presentation15 slides · Mar 5, 2026
 Q3 2025 Earnings Presentation15 slides · Nov 17, 2025
 Investor Presentation (October 2017)26 slides · October 2017
 Investor Presentation (August 2017)27 slides · August 2017
 Investor Presentation (March 2017)24 slides · March 2017