SunCoke Energy Partners L.P — Investor Day (March 2014)
72 slides from SunCoke Energy Partners L.P's investor day presentation, Mar 11, 2014
Slide 1: Investor Day 2014
Exhibit 99.2 Investor day 2014
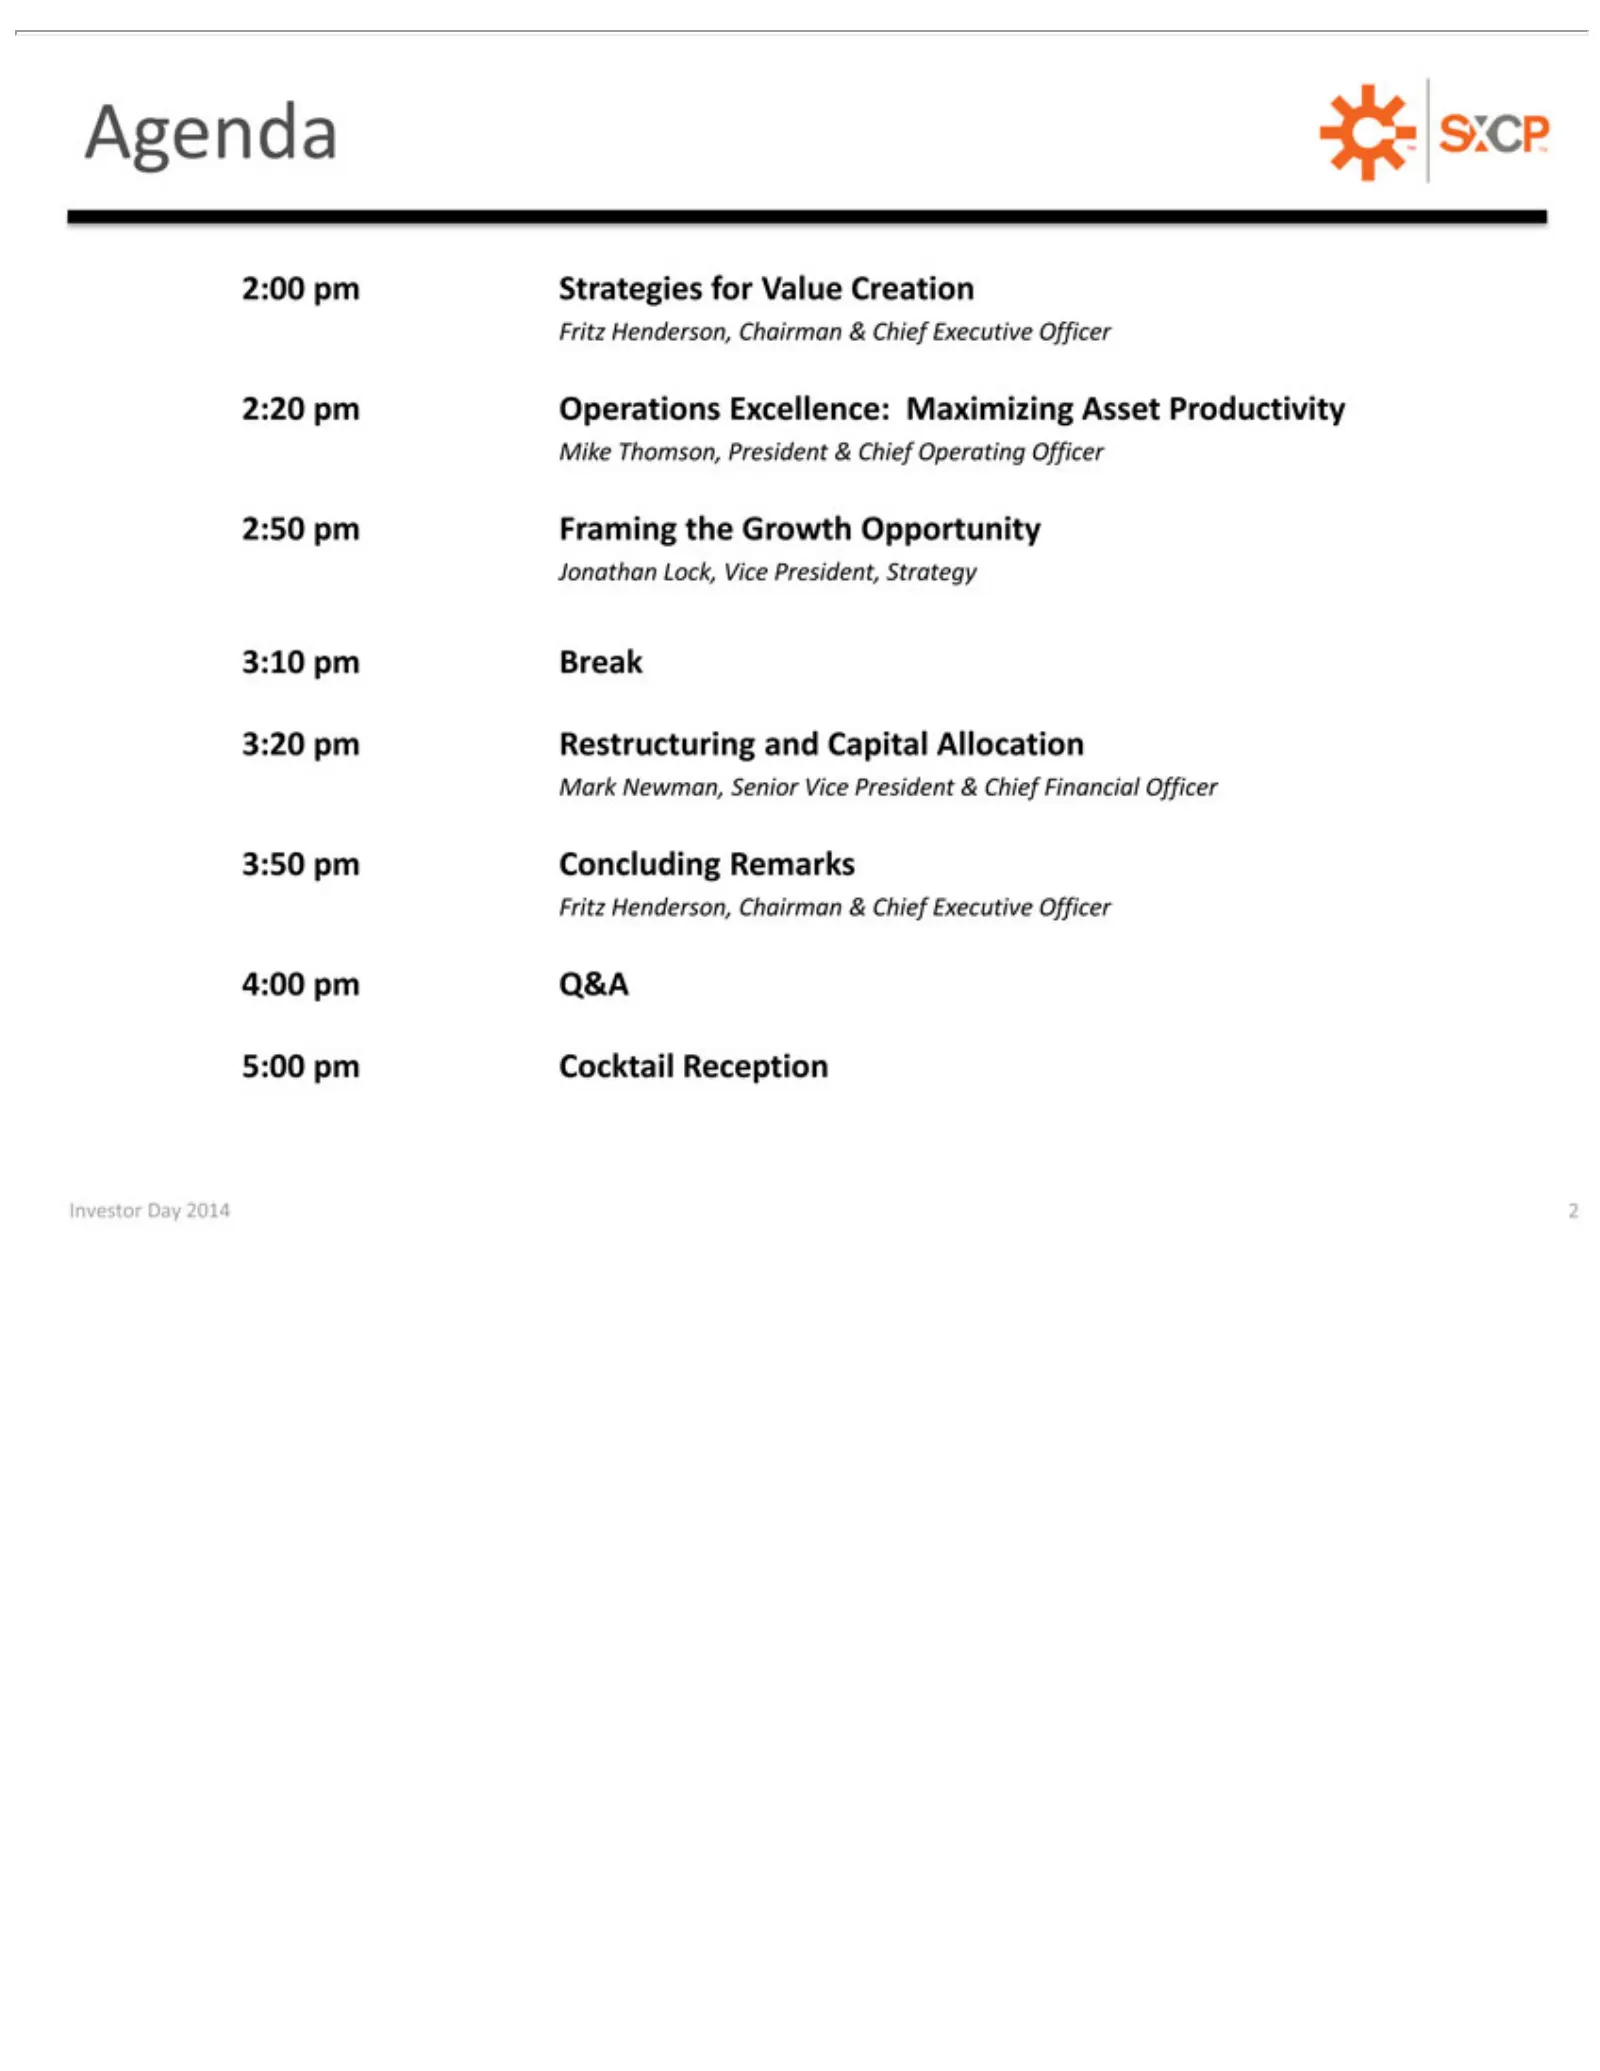
Slide 2: Agenda
2:00 pm Agenda 2:20 Mike 2:50 Jonathan 3:10 3:20 Mark 3:50 Fritz 4:00 5:00 Investor Henderson, Thomson, Newman, Day Strategies Operations Framing Break Restructuring Concluding Q&A Cocktail Lock,2014 Vice Senior President Chairman Reception the 2for Excellence: President, Remarks Growth Value and Vi
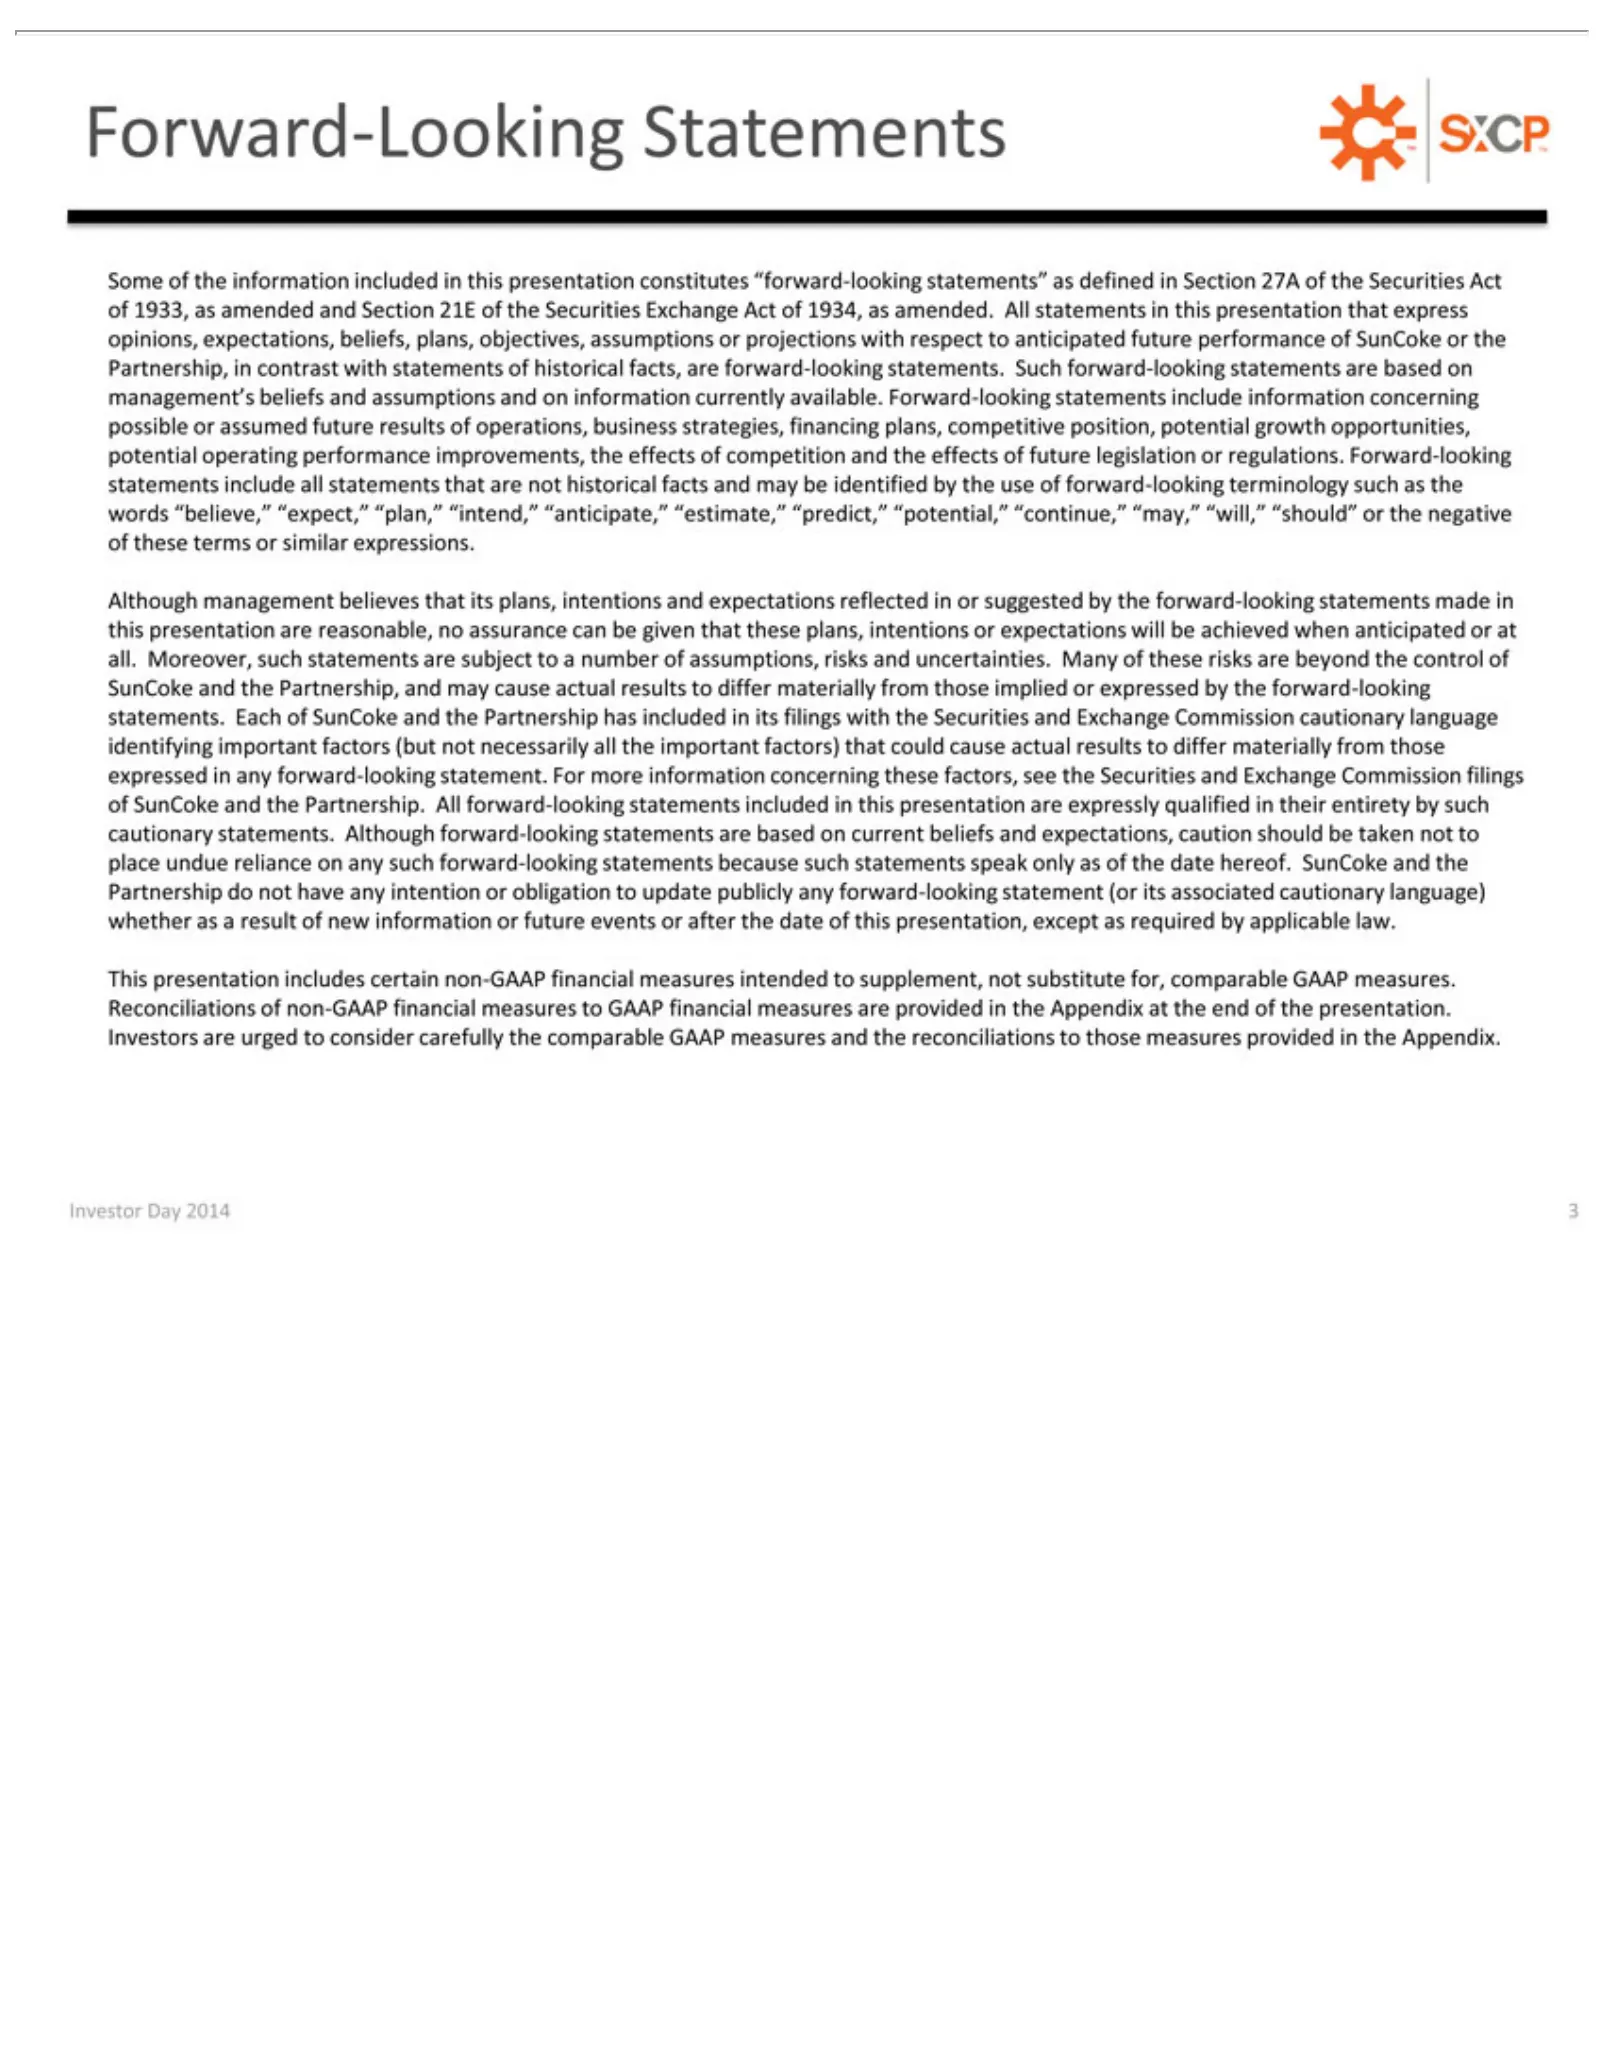
Slide 3: Forward-Looking Statements
Forward-Looking Some Exchange of information potential that “continue,” Although these the included materially forward-looking expectations, any presentation, This measures Investor Appendix. SunCoke control intention are presentation plans, ofnot Day the in growth are management Act from of its his
Slide 4: Fritz Henderson, Chairman and Chief Executive Officer
Fritz Henderson Chairman Chief Executive and Officer
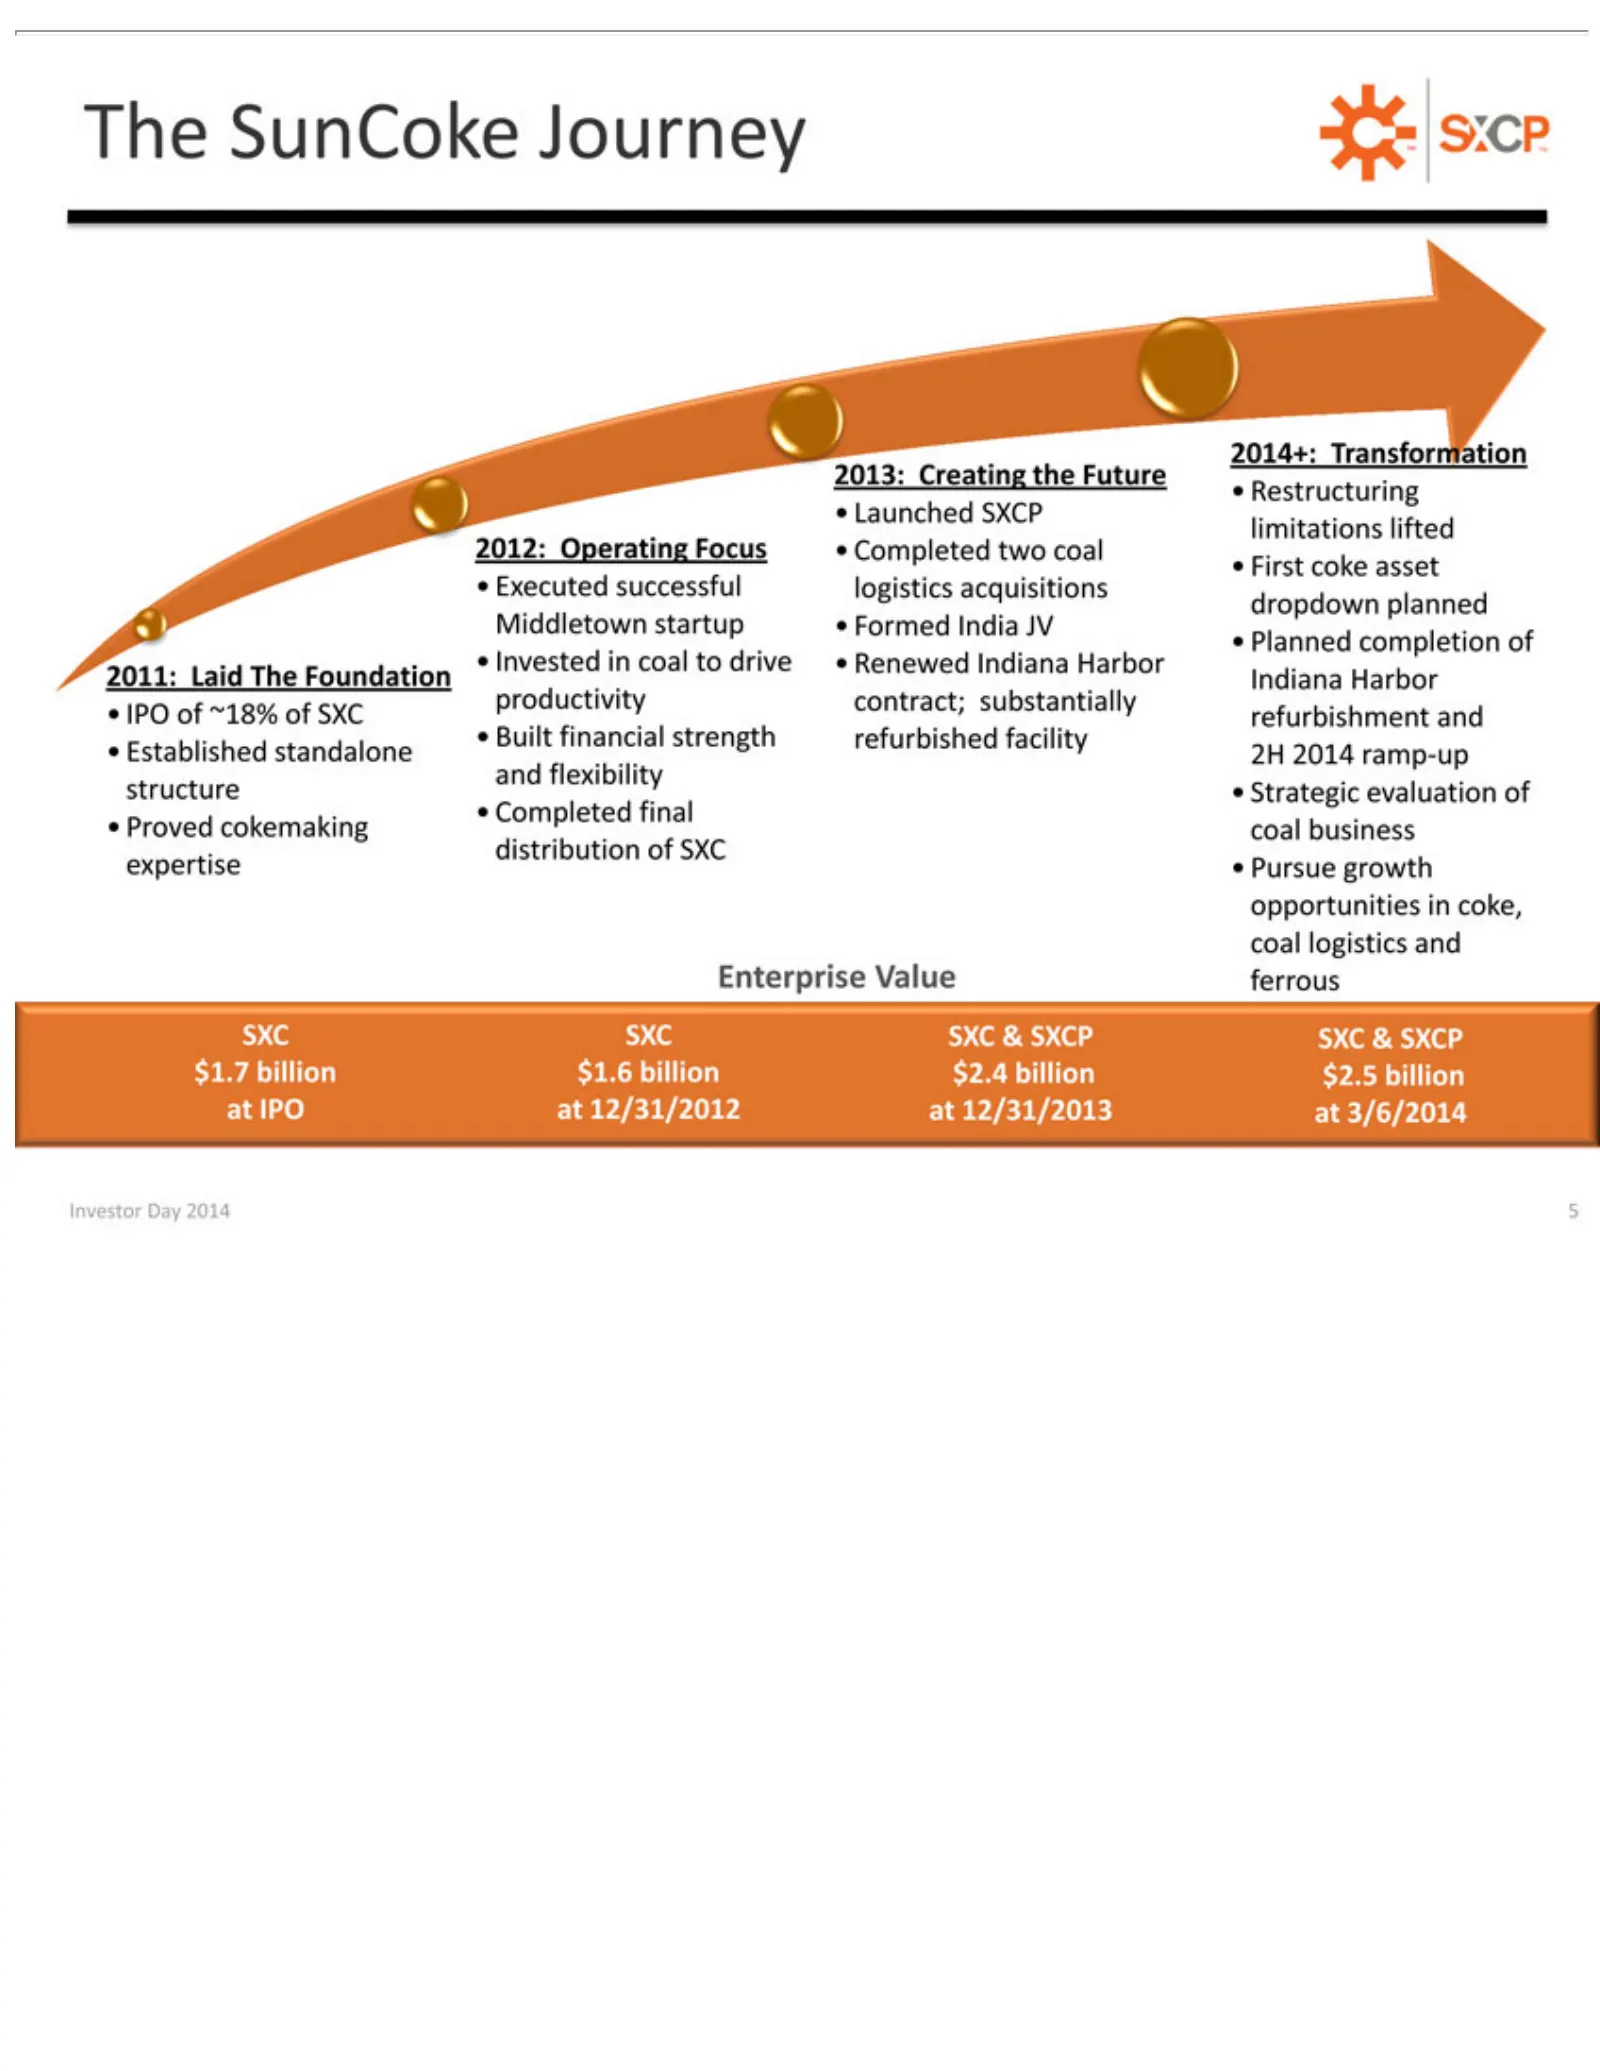
Slide 5: The Journey: IPO to restructuring and future growth
The2014 2011: IPO Established Proved 2012: Executed Invested Built 2013: Launched Completed Formed Renewed 2014+: Restructuring First Planned 2H Strategic Pursue Enterprise SXC 5Investor SunCoke of coke SXC financial Laid Operating Creating ~18% growth Transformation cokemaking India completion Day
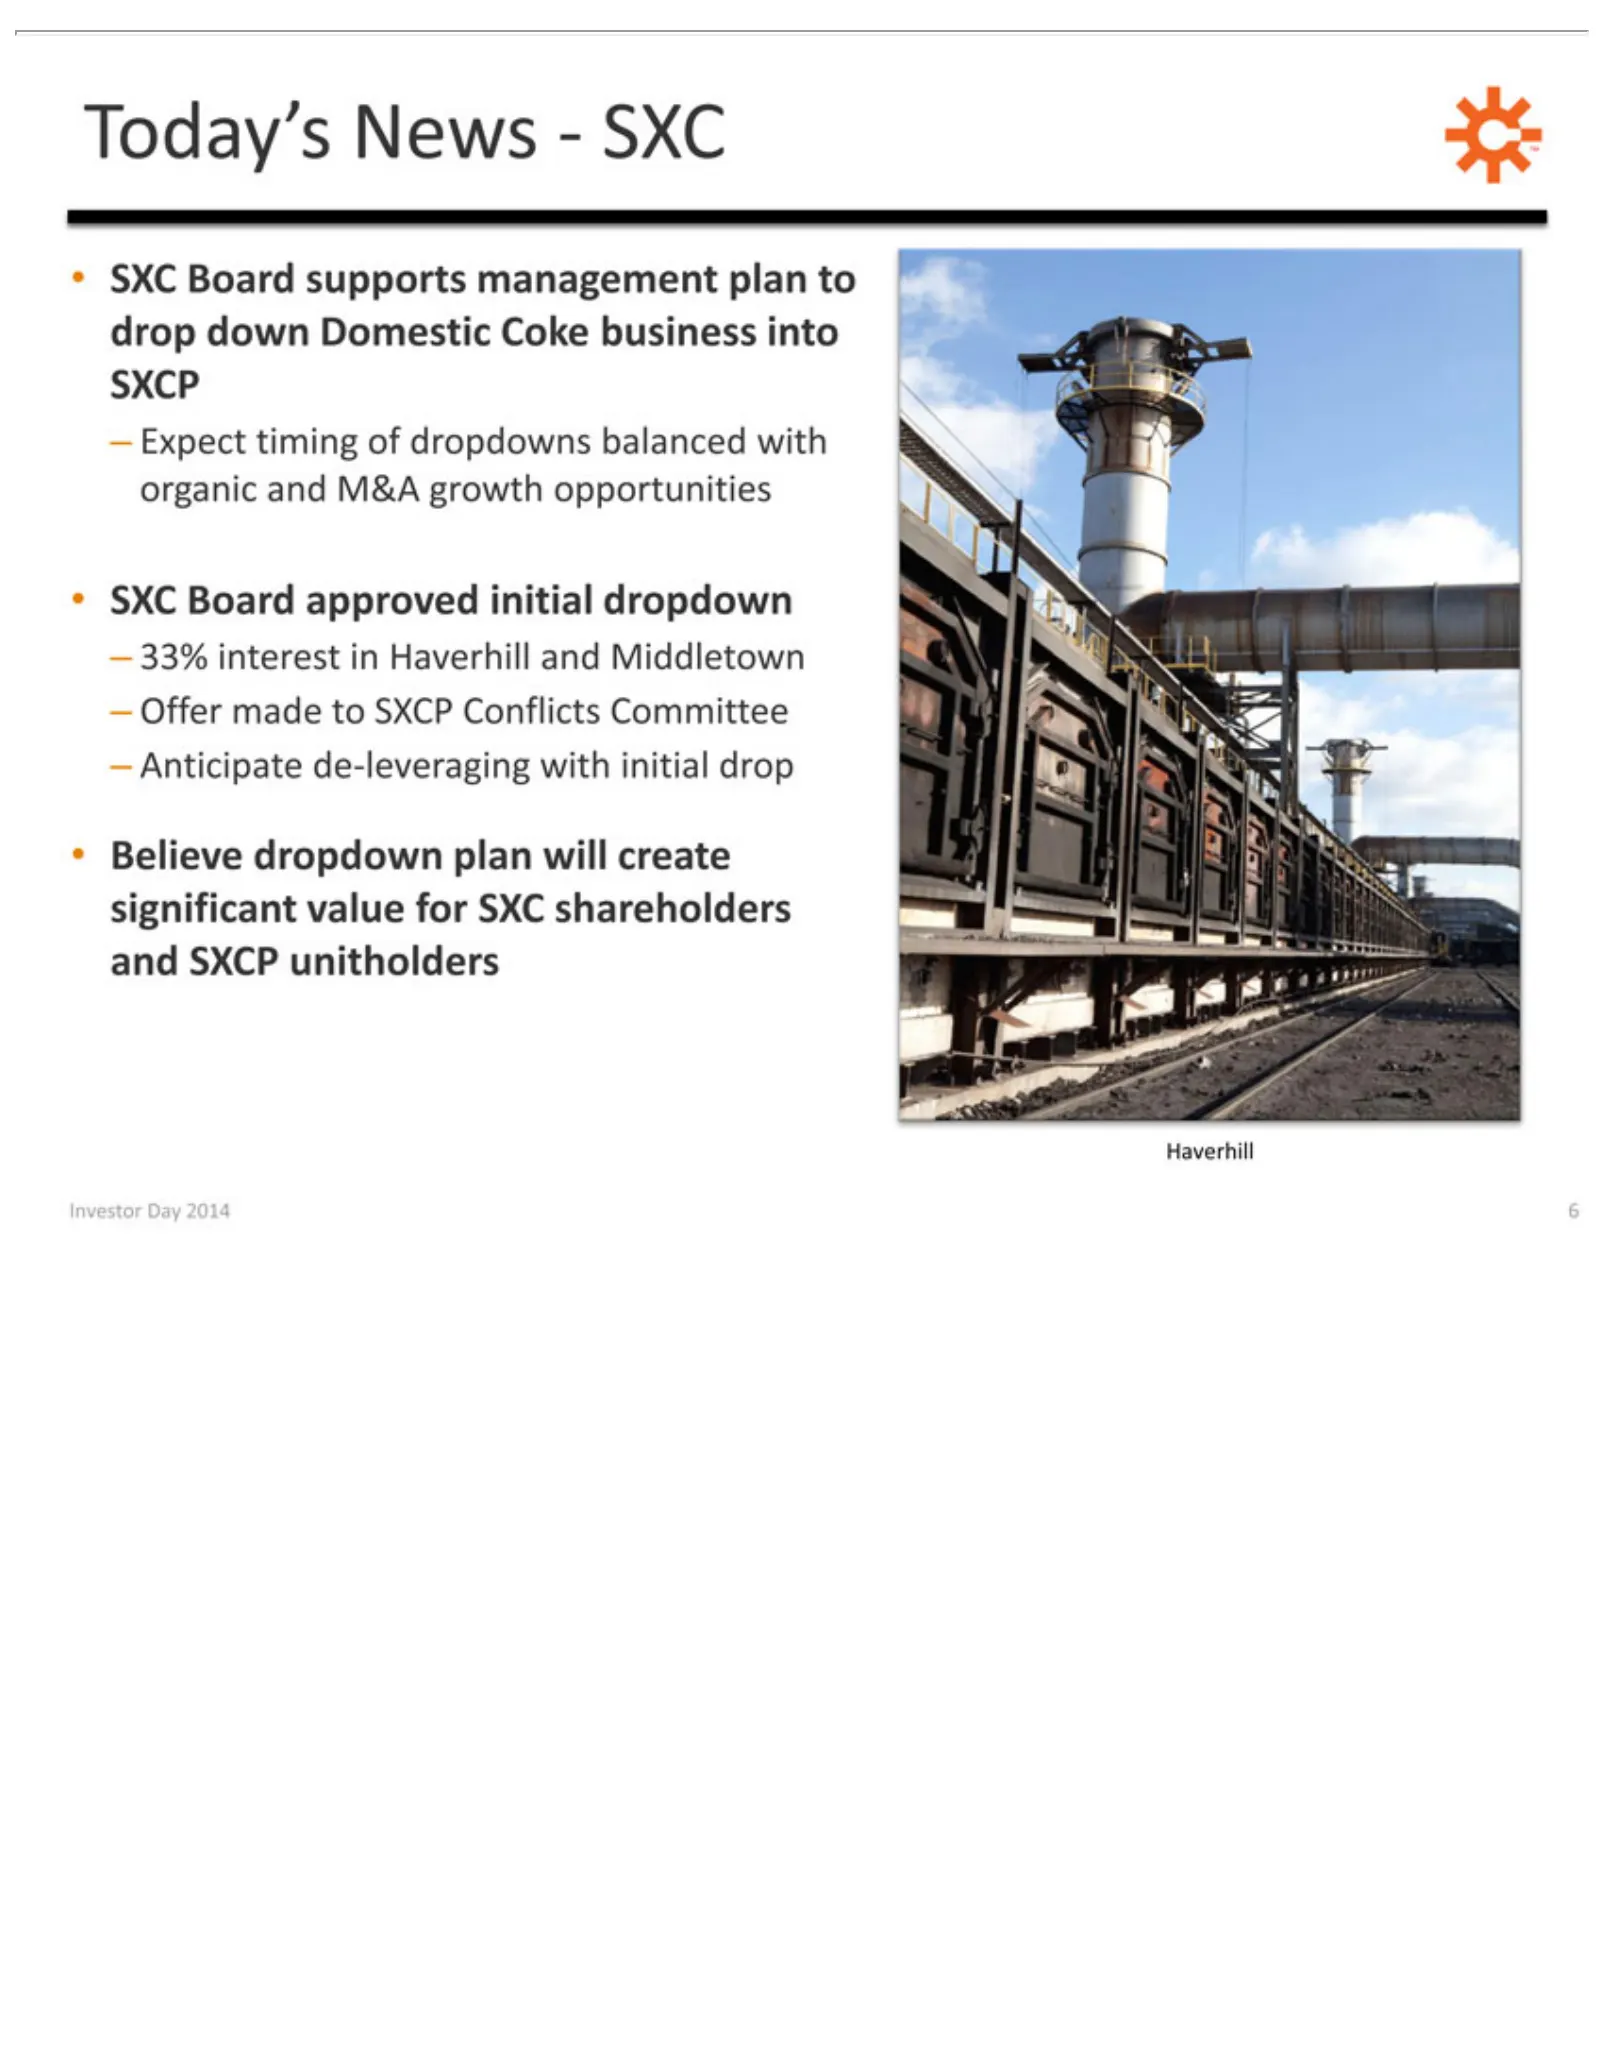
Slide 6: Today's News: SXC and Haverhill/Middletown dropdown
•–Today’s Investor Haverhill SXC Believe Anticipate Expect 33% OfferBoard interest made News—SXC Day timing dropdown de-leveraging 2014 supports approved toinSXCP ofHaverhill 6dropdowns plan management Conflicts initial will with andcreate dropdown balanced Middletown initial Committee plan signific
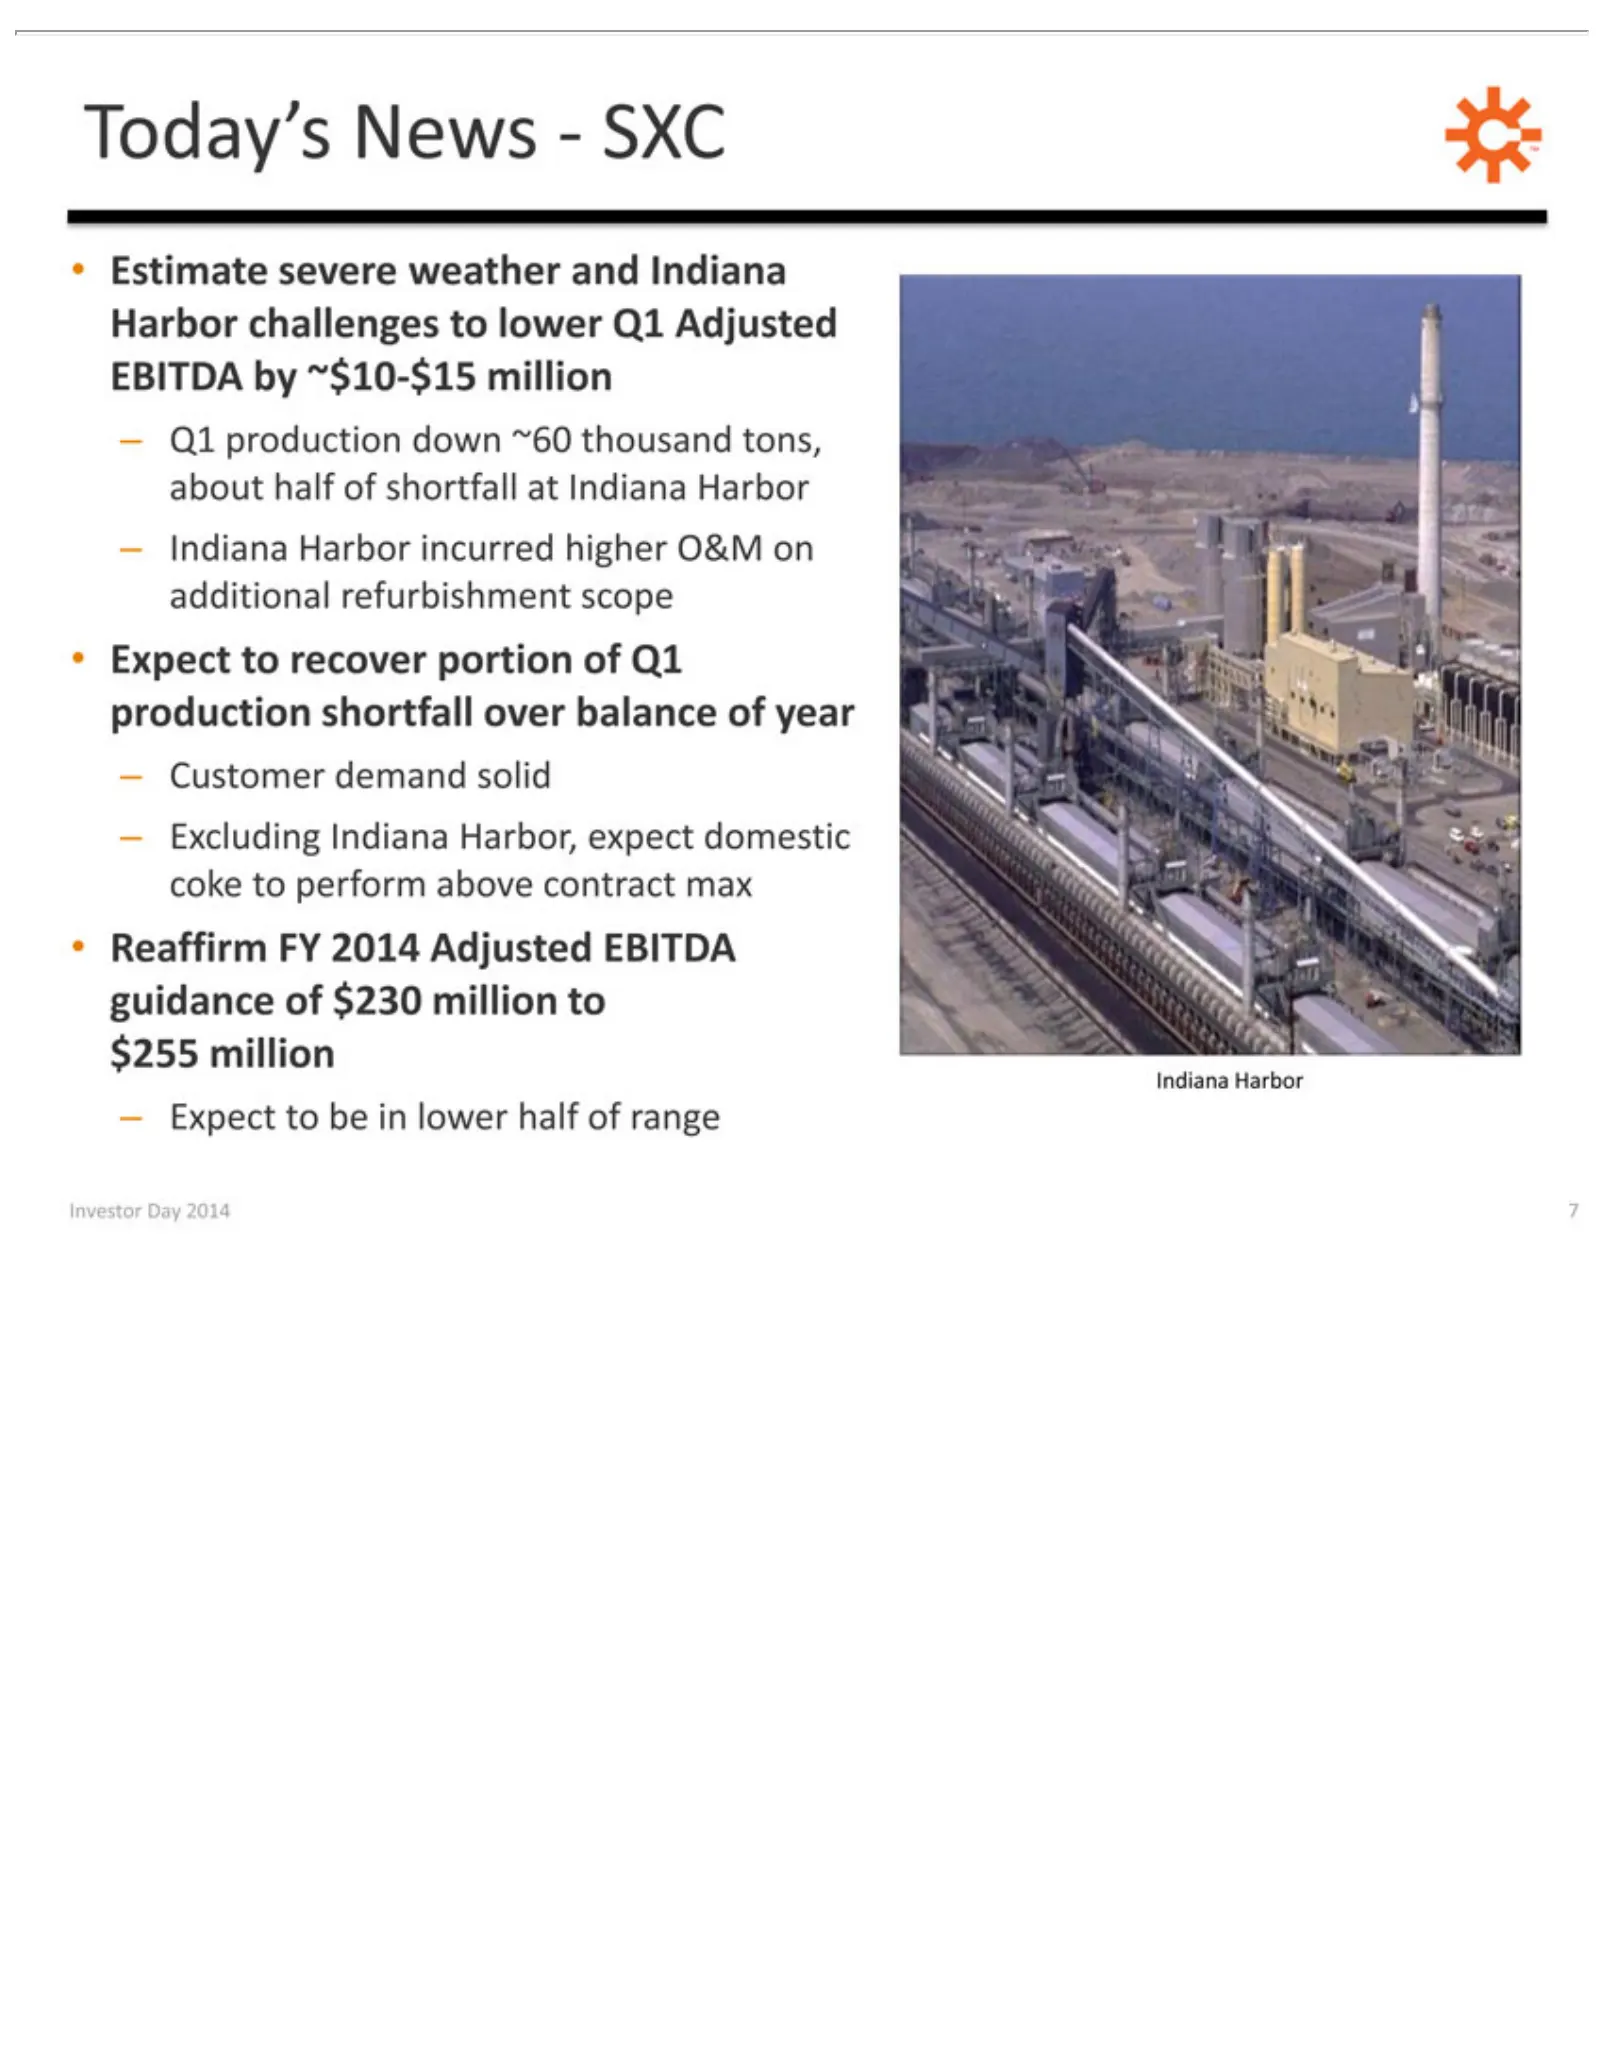
Slide 7: Today's News: Indiana Harbor
–•Today’s Indiana Investor Estimate Expect Reaffirm Q1 production Indiana Customer Excluding Expect Harbor News—SXC Day to to Harbor severe FY recover be demand Indiana 2014 2014 indown lower incurred weather 7portion Adjusted solid Harbor, ~60 half and higher of thousand of expect EBITDA Q1 Indiana
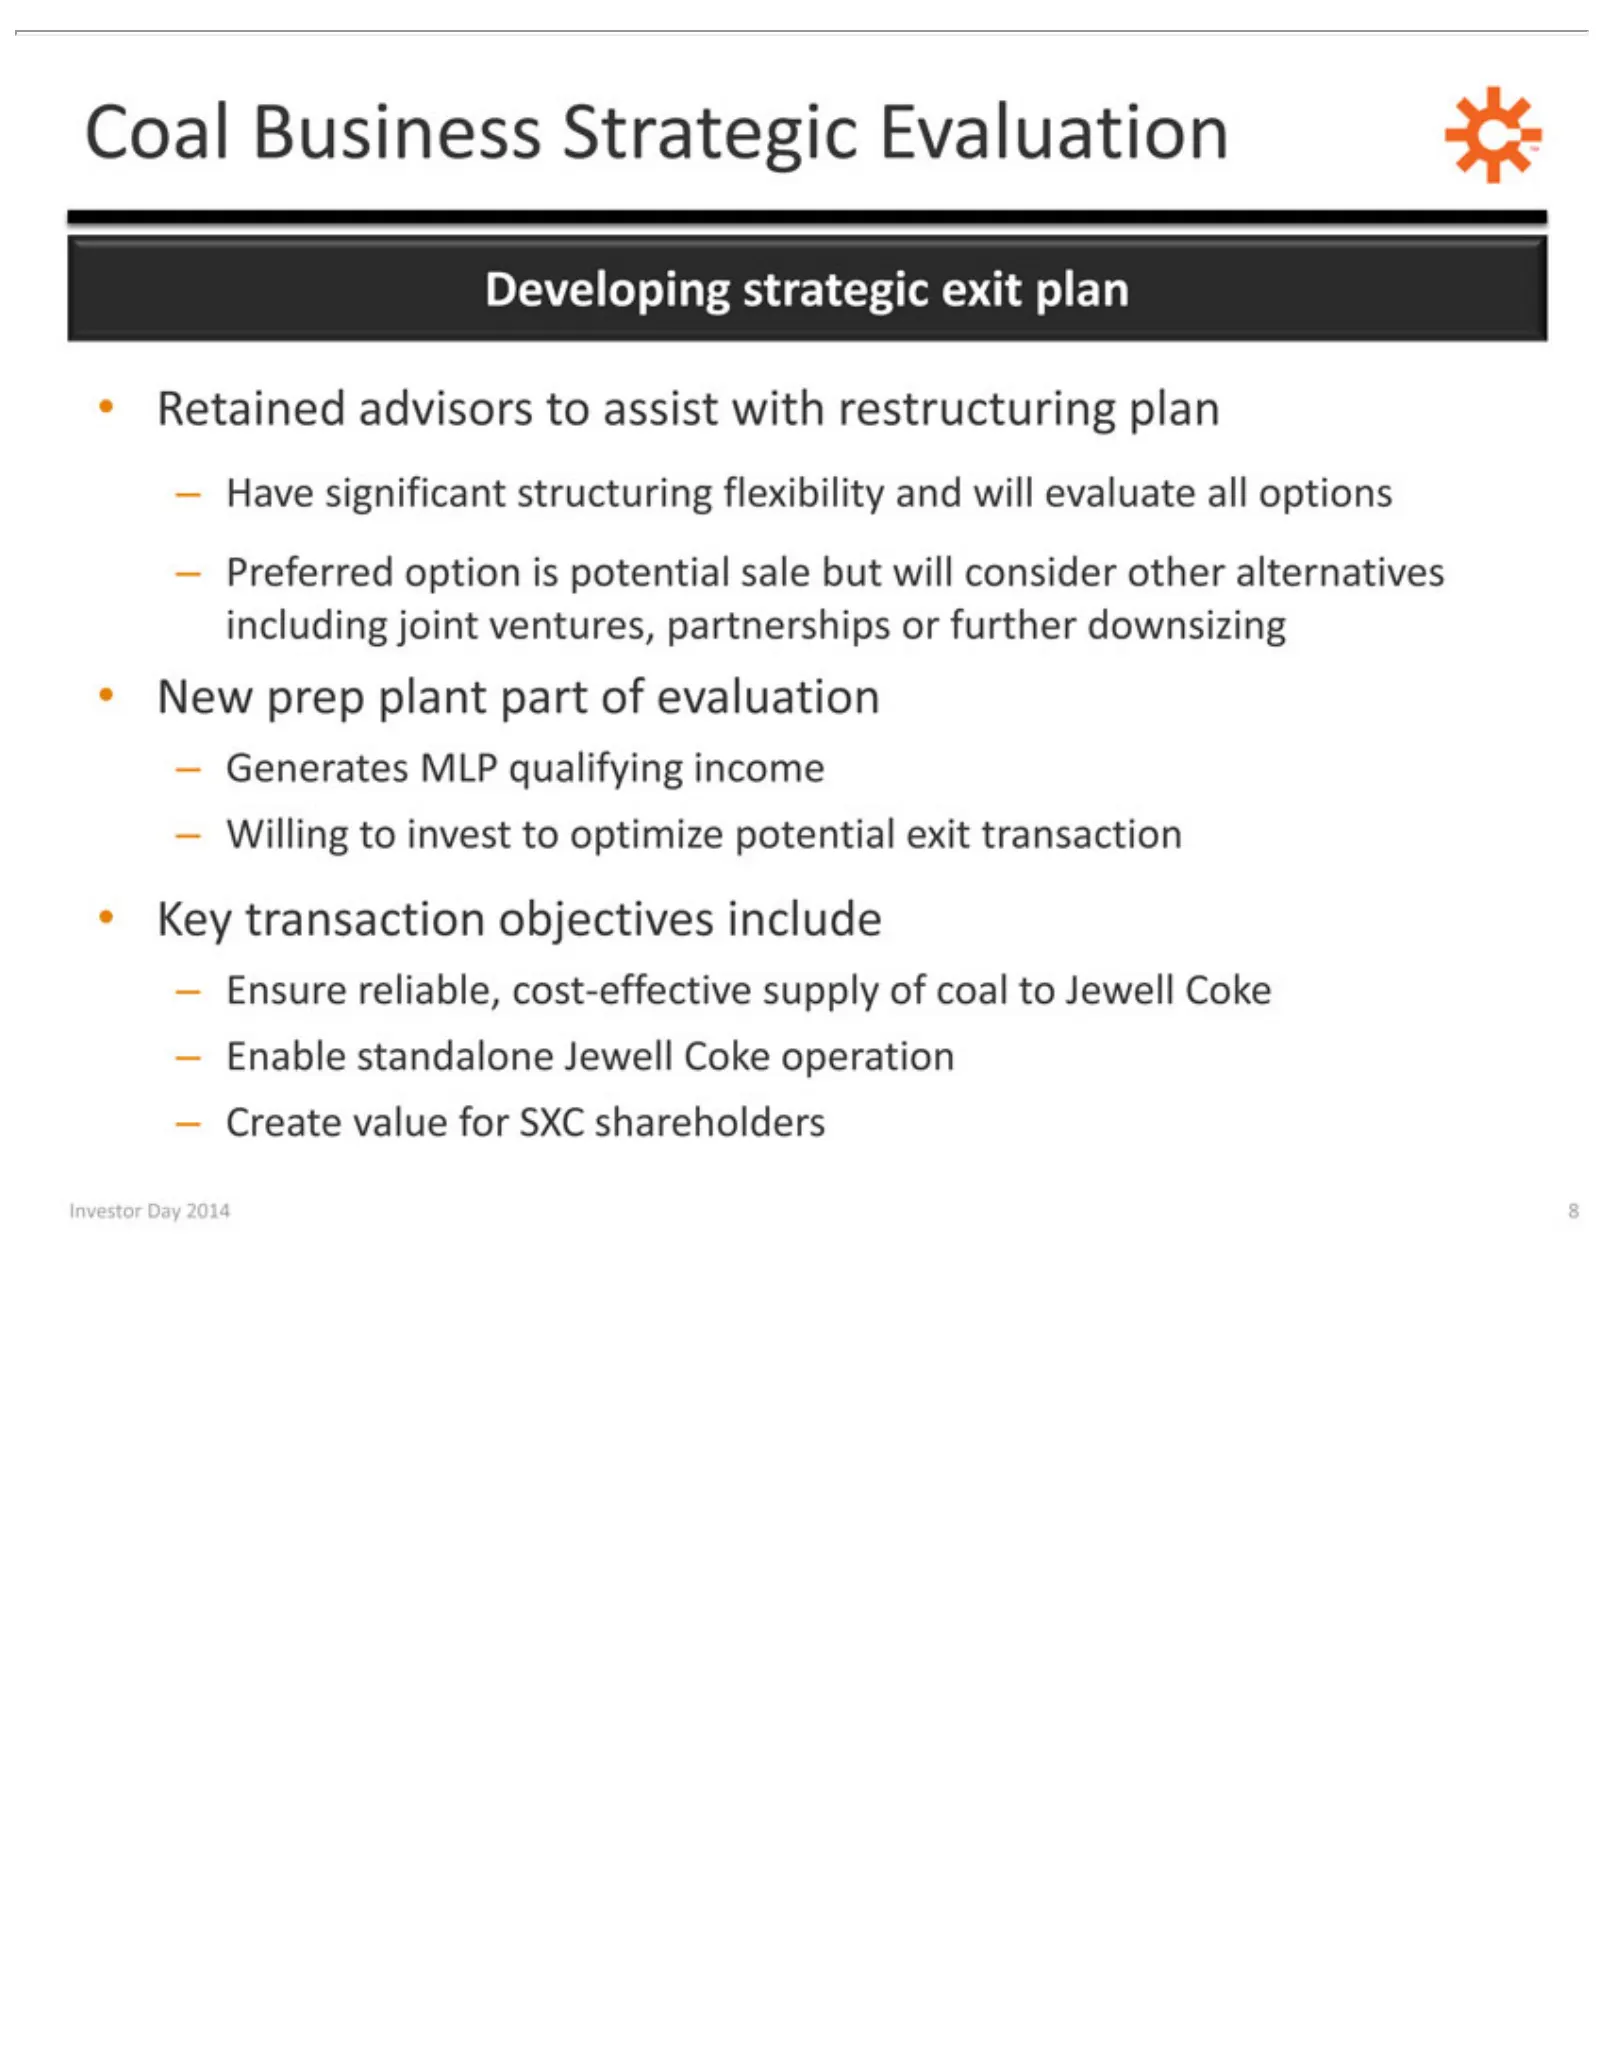
Slide 8: Coal Business Strategic Evaluation
Coal Developing Retained New –Key Investor Willing Have Preferred Generates Ensure Enable Create transaction prep Business significant Day value standalone reliable, advisors to plant option strategic MLP invest 2014 Strategic for part objectives qualifying cost-effective to SXC is structuring to 8o
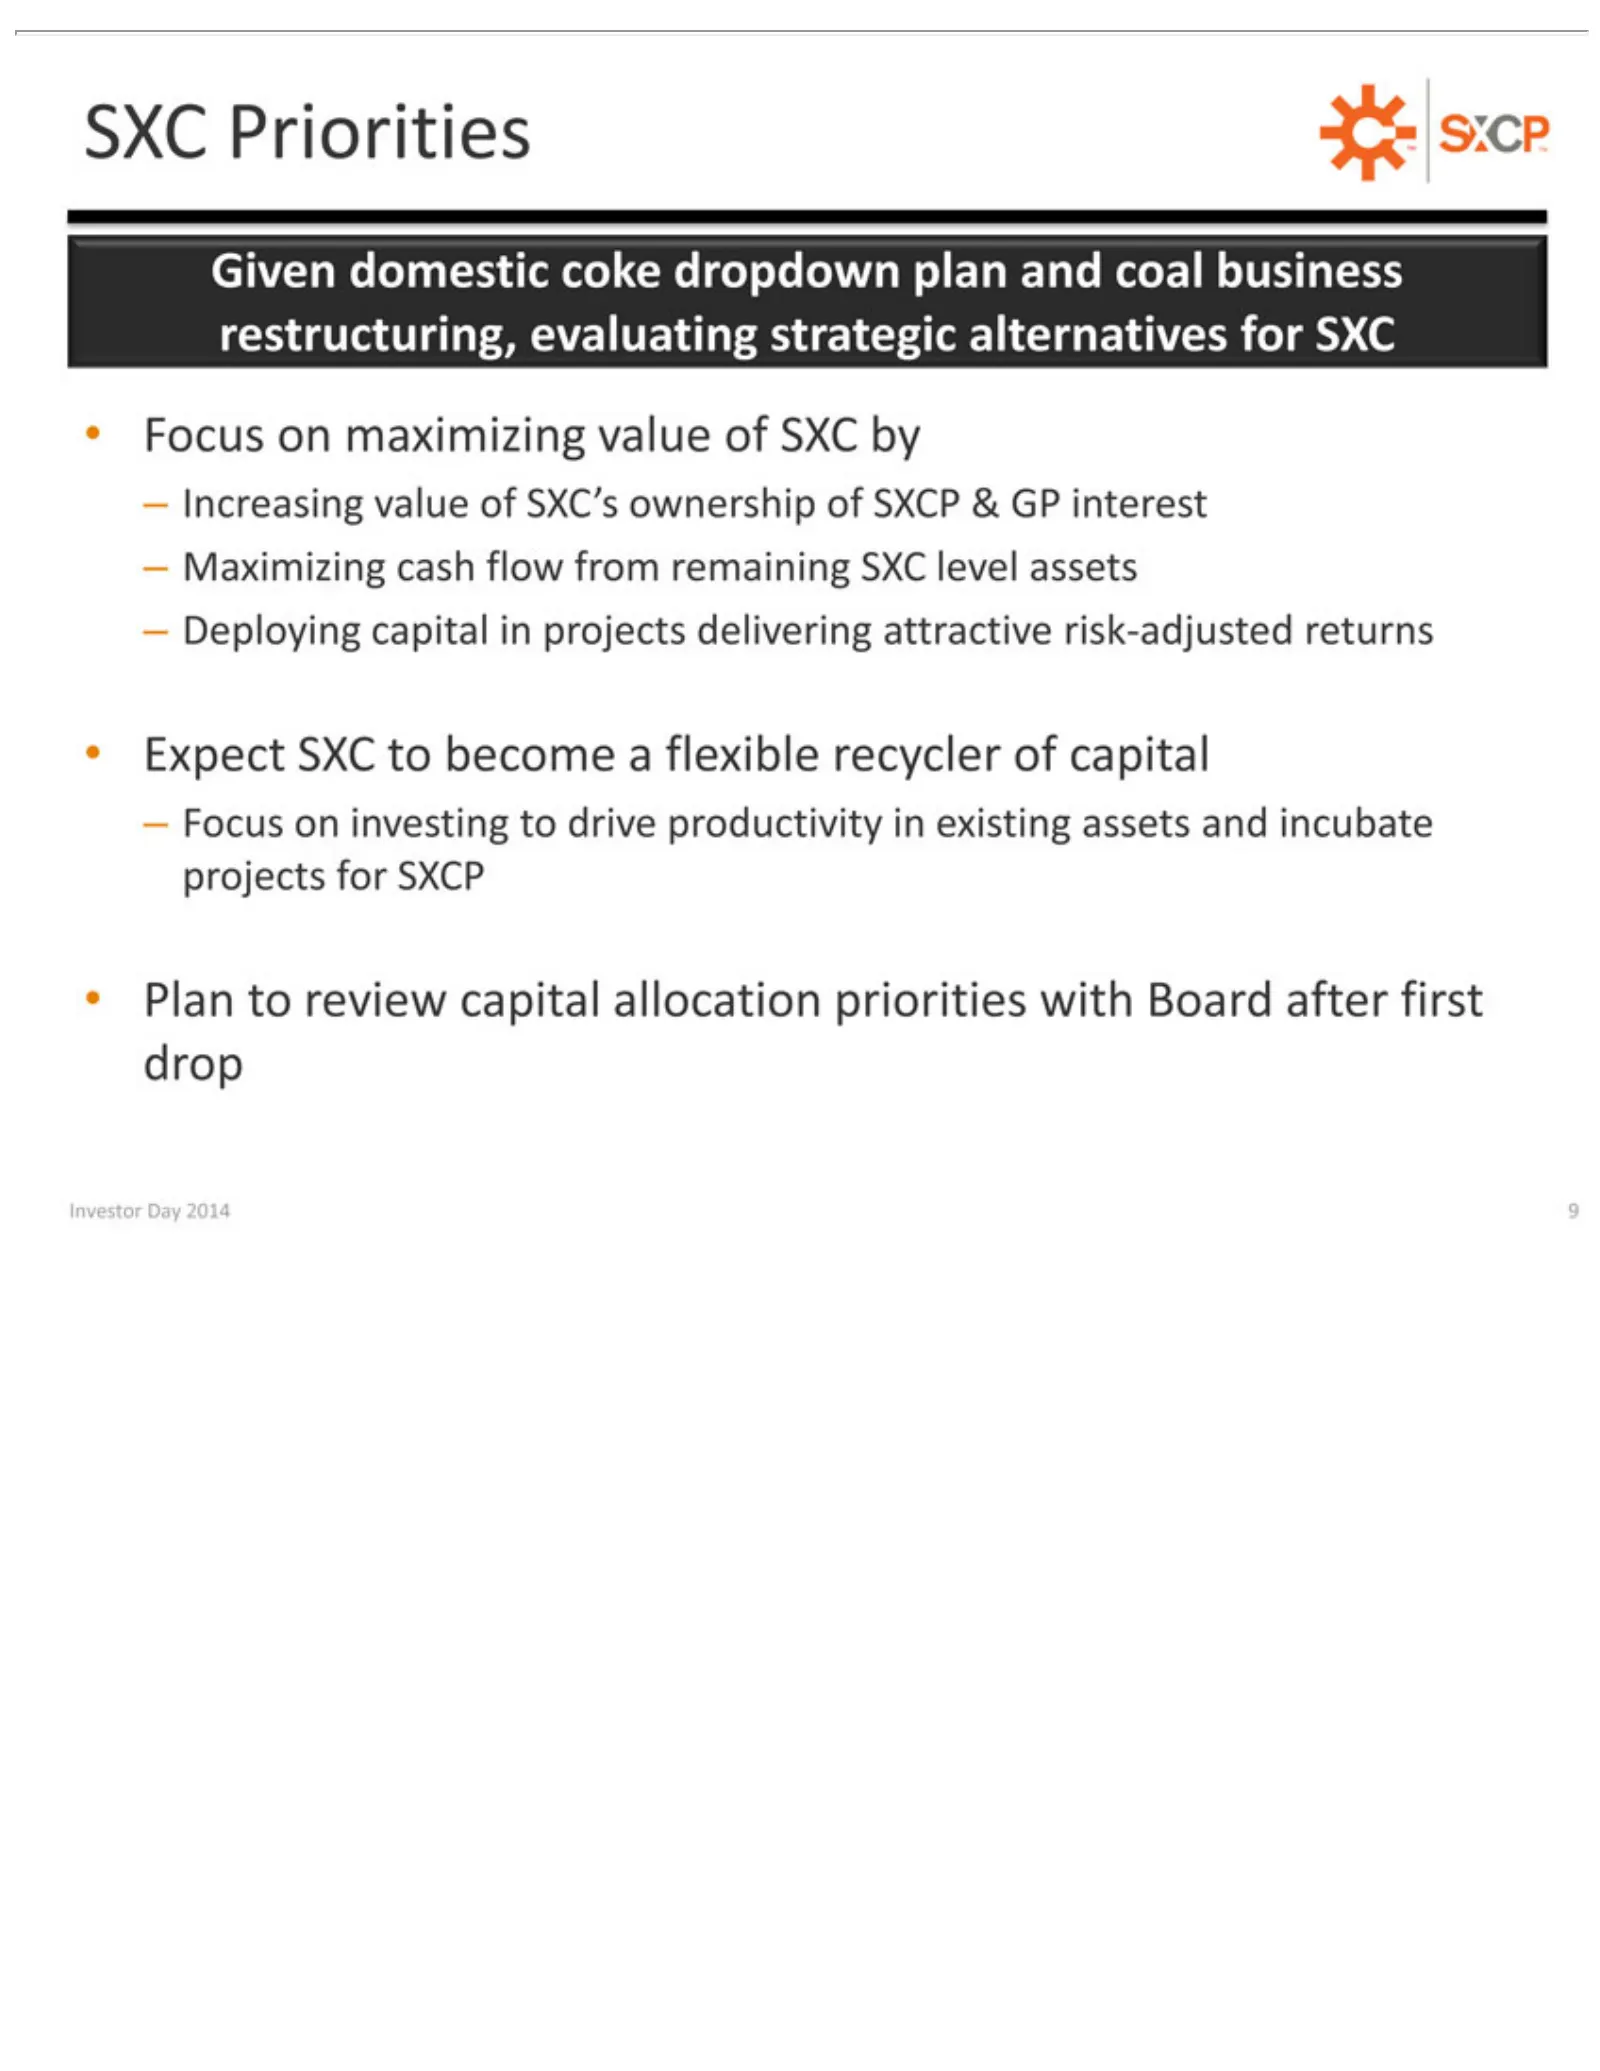
Slide 9: SXC Given Focus: Capital Allocation Priorities
SXC Given Focus –Expect Plan Investor Increasing Maximizing Deploying Focus to Priorities on domestic SXC review on Day maximizing investing value capital to 2014 cash capital become coke of 9flow into SXC’s dropdown value allocation projects drive afrom flexible of ownership productivity remaining
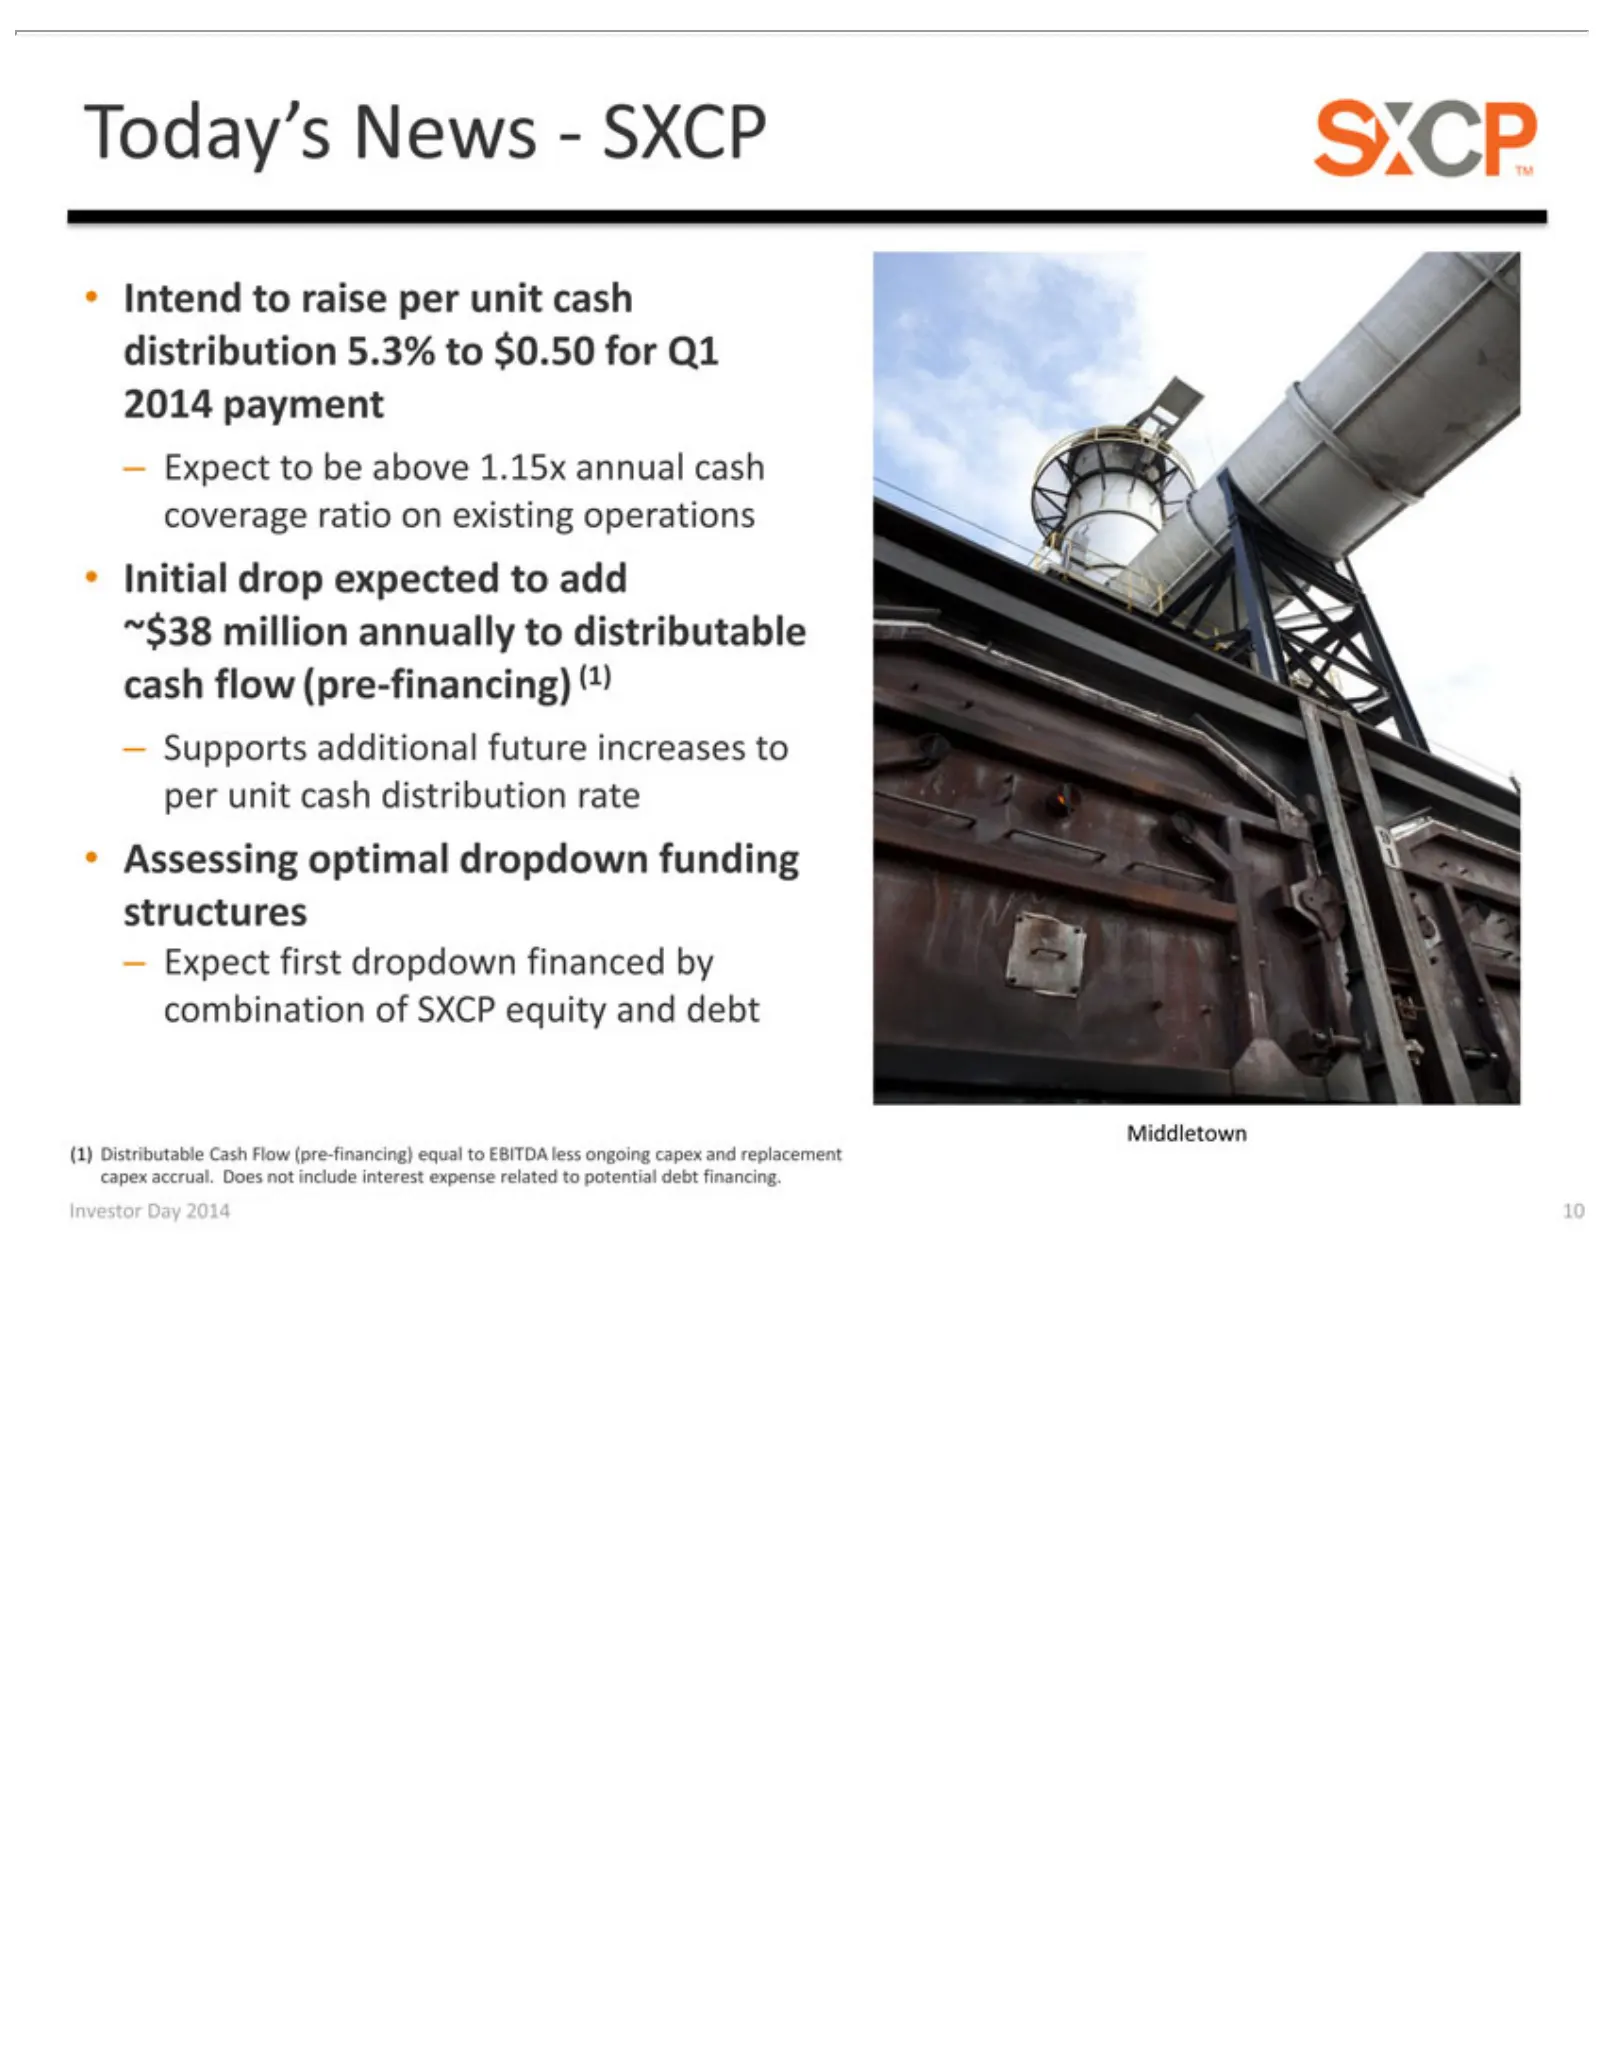
Slide 10: Today's News: SXCP Middletown Dropdown
Today’s –•~$38 (1) Middletown Investor Assessing Intend Initial Supports Expect Distributable million drop News—SXCP to Day toraise first additional optimal beexpected annually 2014 dropdown above per Cash 10 unit dropdown 1.15x future to Flow cash financed distributable addannual increases (pre-fin
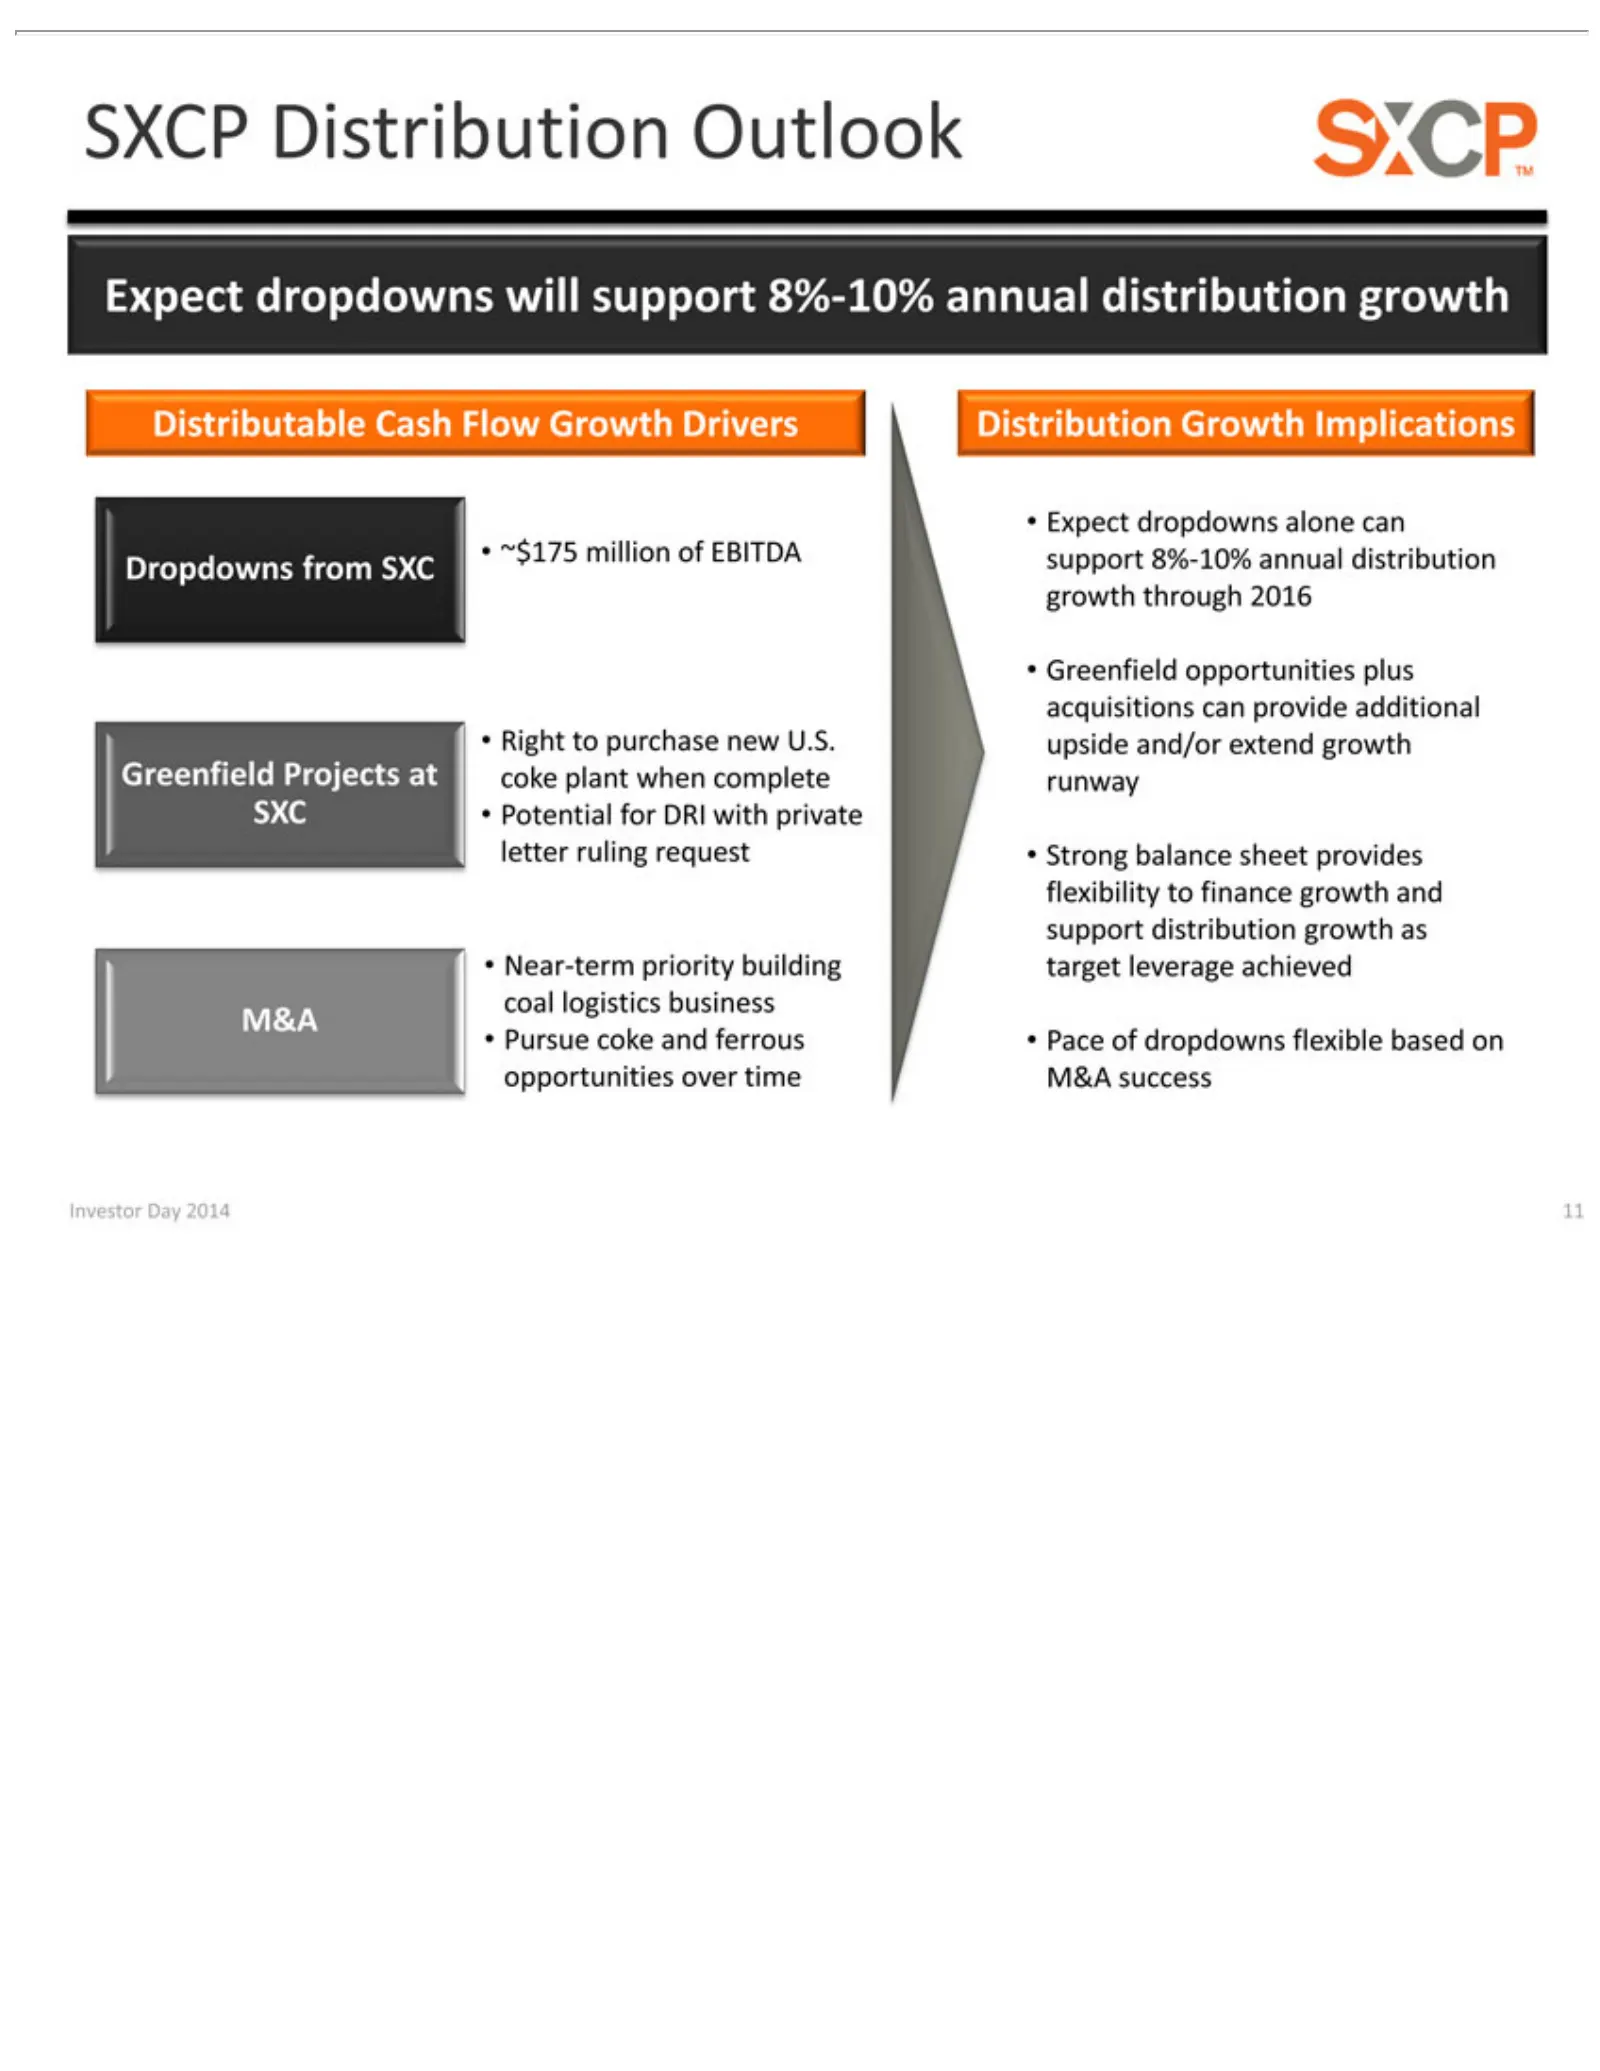
Slide 11: SXCP Distribution Growth Outlook
SXCPofto Distributable Dropdowns ~$175 Right Potential Near-term M&A Pursue Distribution Expect Greenfield Strong Pace Investor Distribution million balance coke dropdowns dropdowns purchase Day for priority Projects opportunities from Growth and DRI 2014 Cash of sheet ferrous EBITDA SXC with new bu
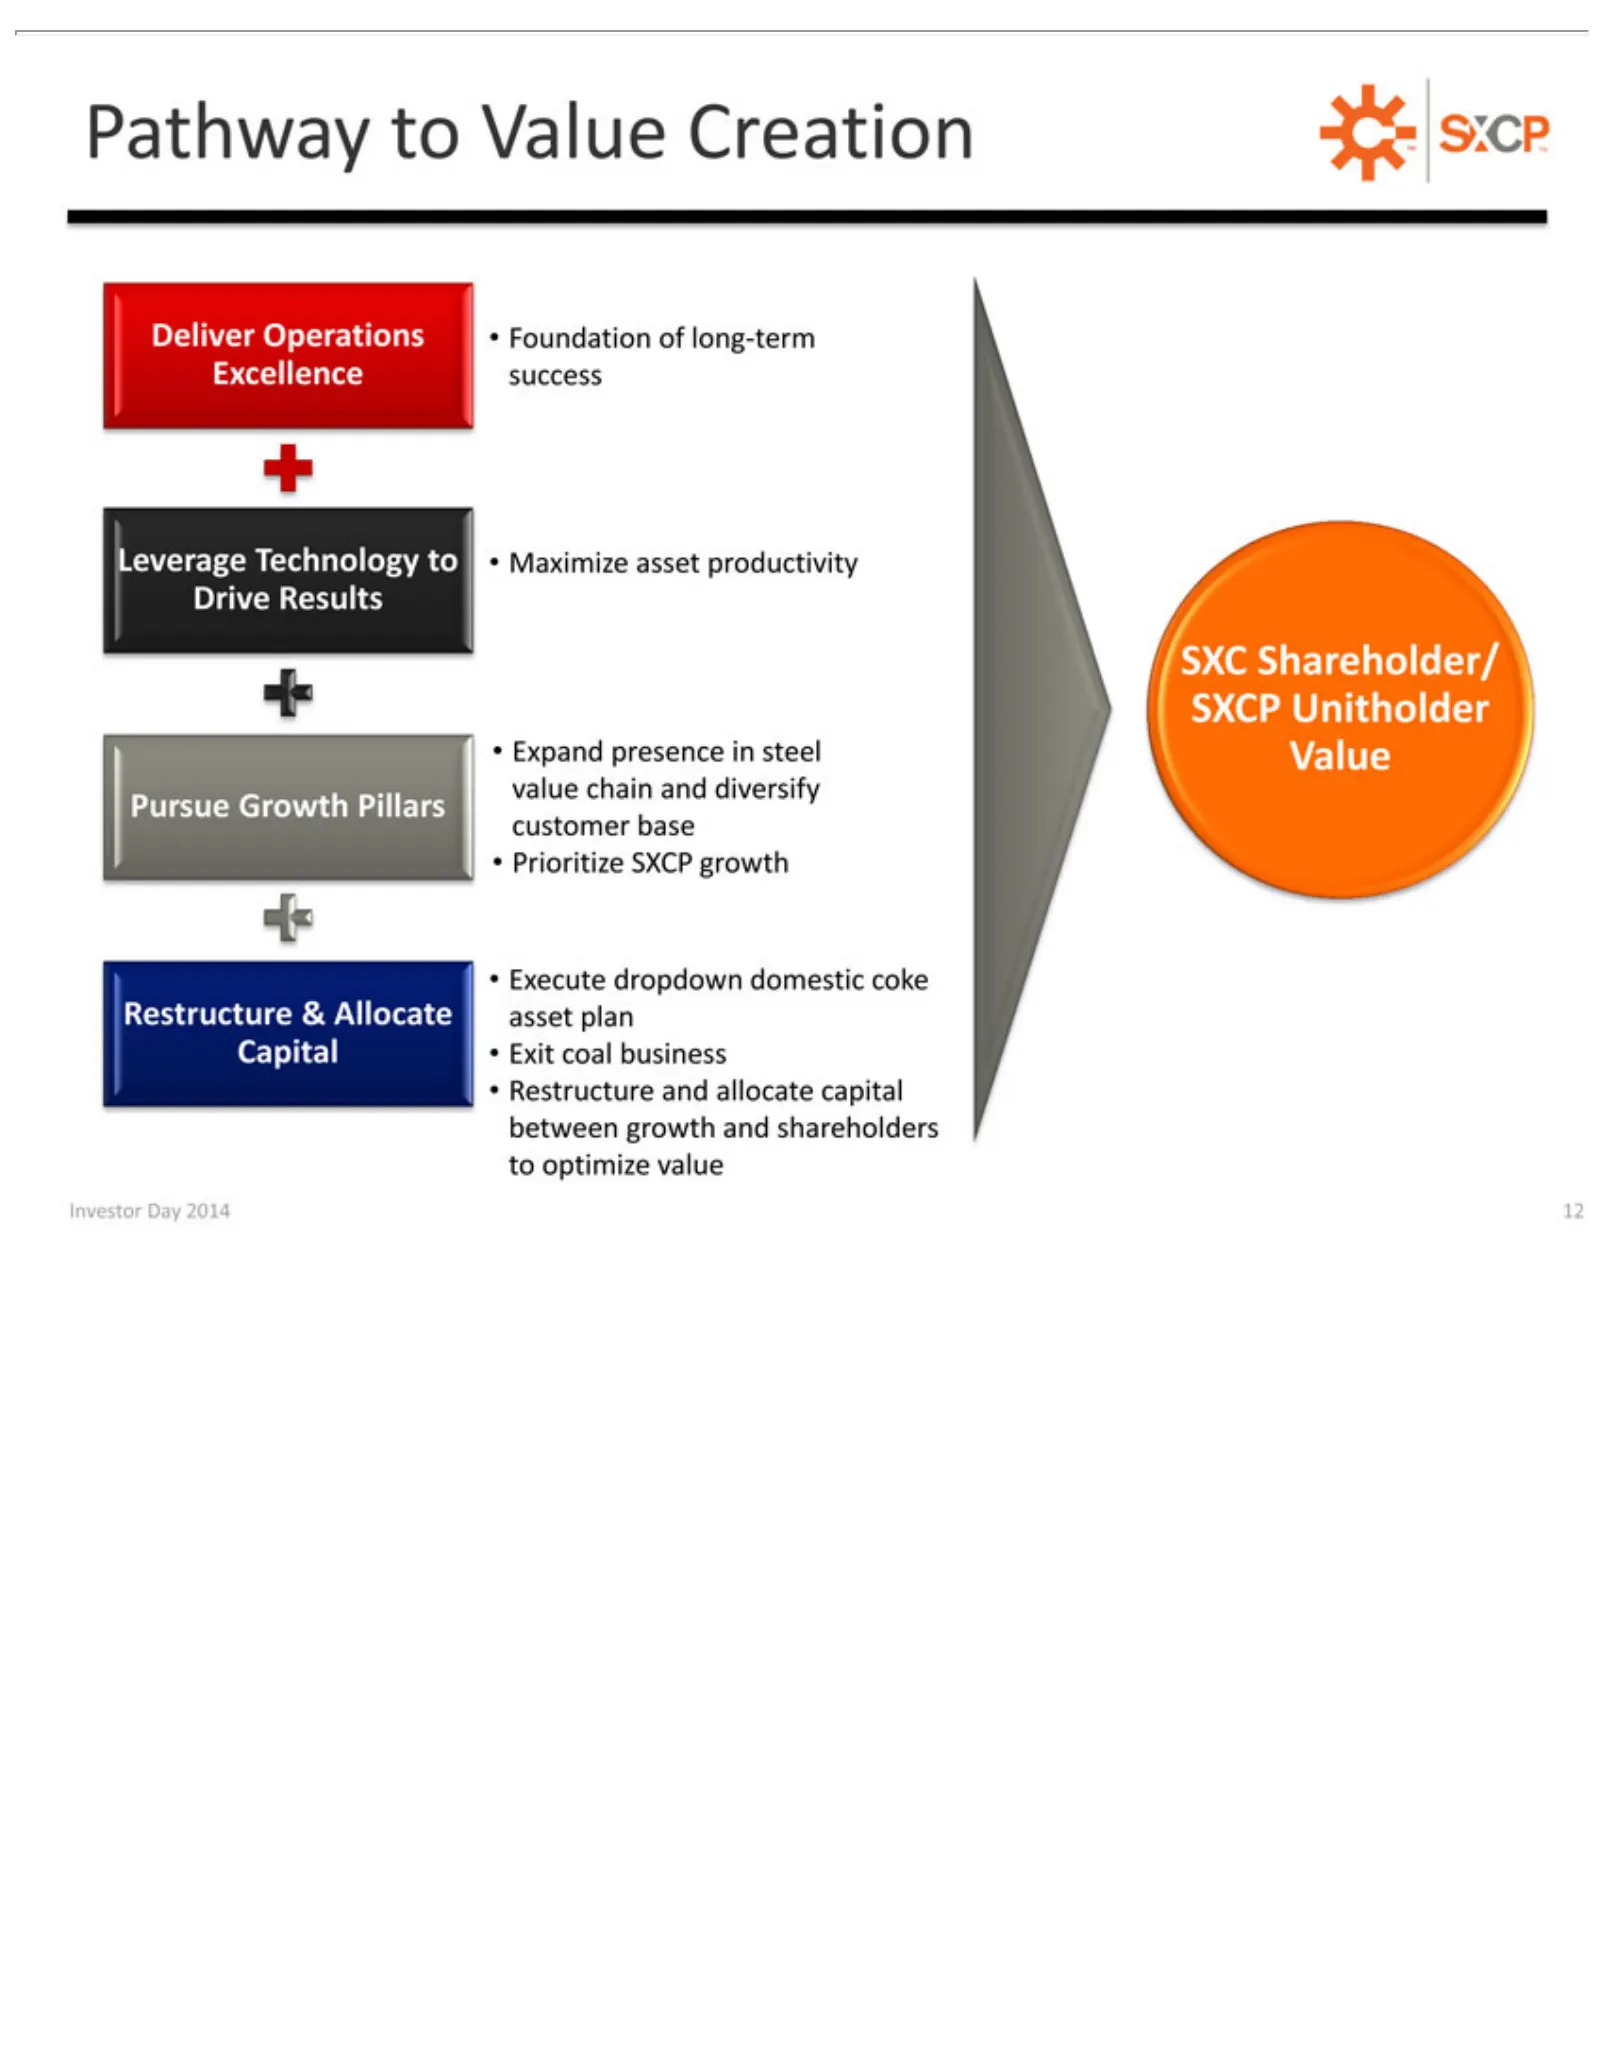
Slide 12: Pathway to Shareholder/Unitholder Value Creation
Pathway Deliver Foundation Leverage Maximize Pursue Expand Prioritize Execute Exit Restructure SXC Investor coal Shareholder/ Growth Operations presence dropdown Day to business Technology SXCP asset Value of &2014 andAllocate long-term Pillars productivity allocate growth in Creation SXCP 12 domest
Slide 13: Mike Thomson, President and Chief Operating Officer
Mike Thomson President Chief Operating and Officer
Slide 14: Pathway Pillars: Deliver Operations Excellence
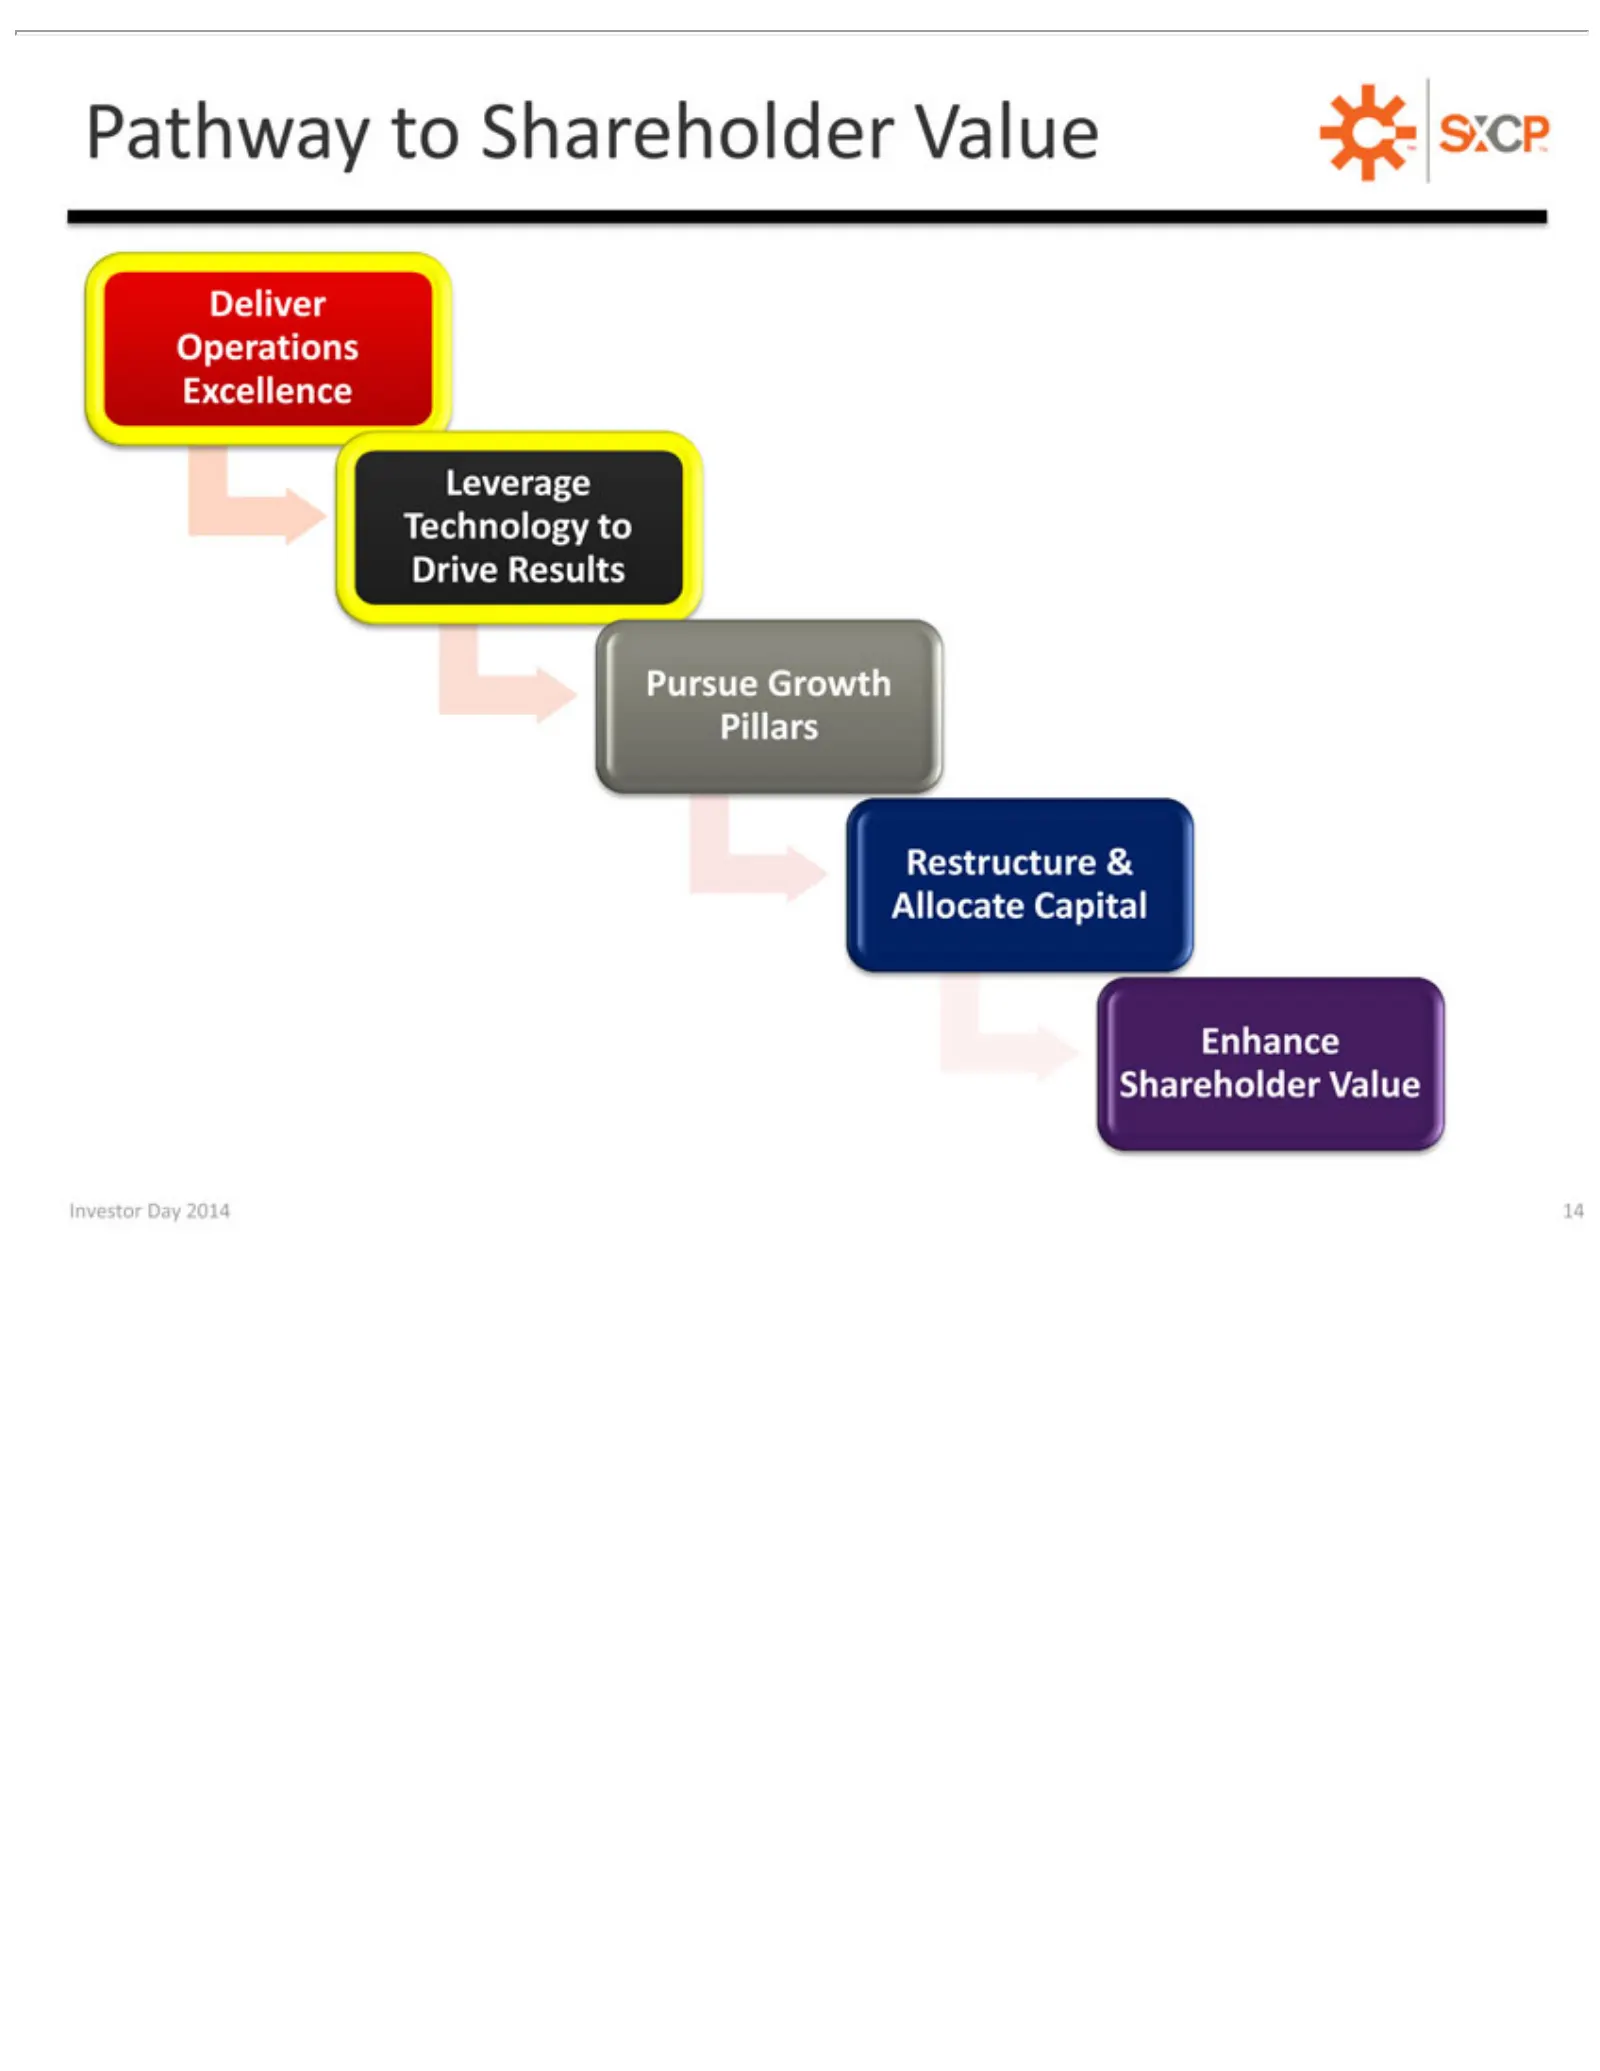
PathwayGrowth Deliver Technology Leverage Pursue Restructure Pillars Shareholder Enhance InvestorOperations Day to Shareholder & to Value 2014 Allocate Drive 14 Excellence Results Capital Value
Slide 15: Deliver Operations Excellence
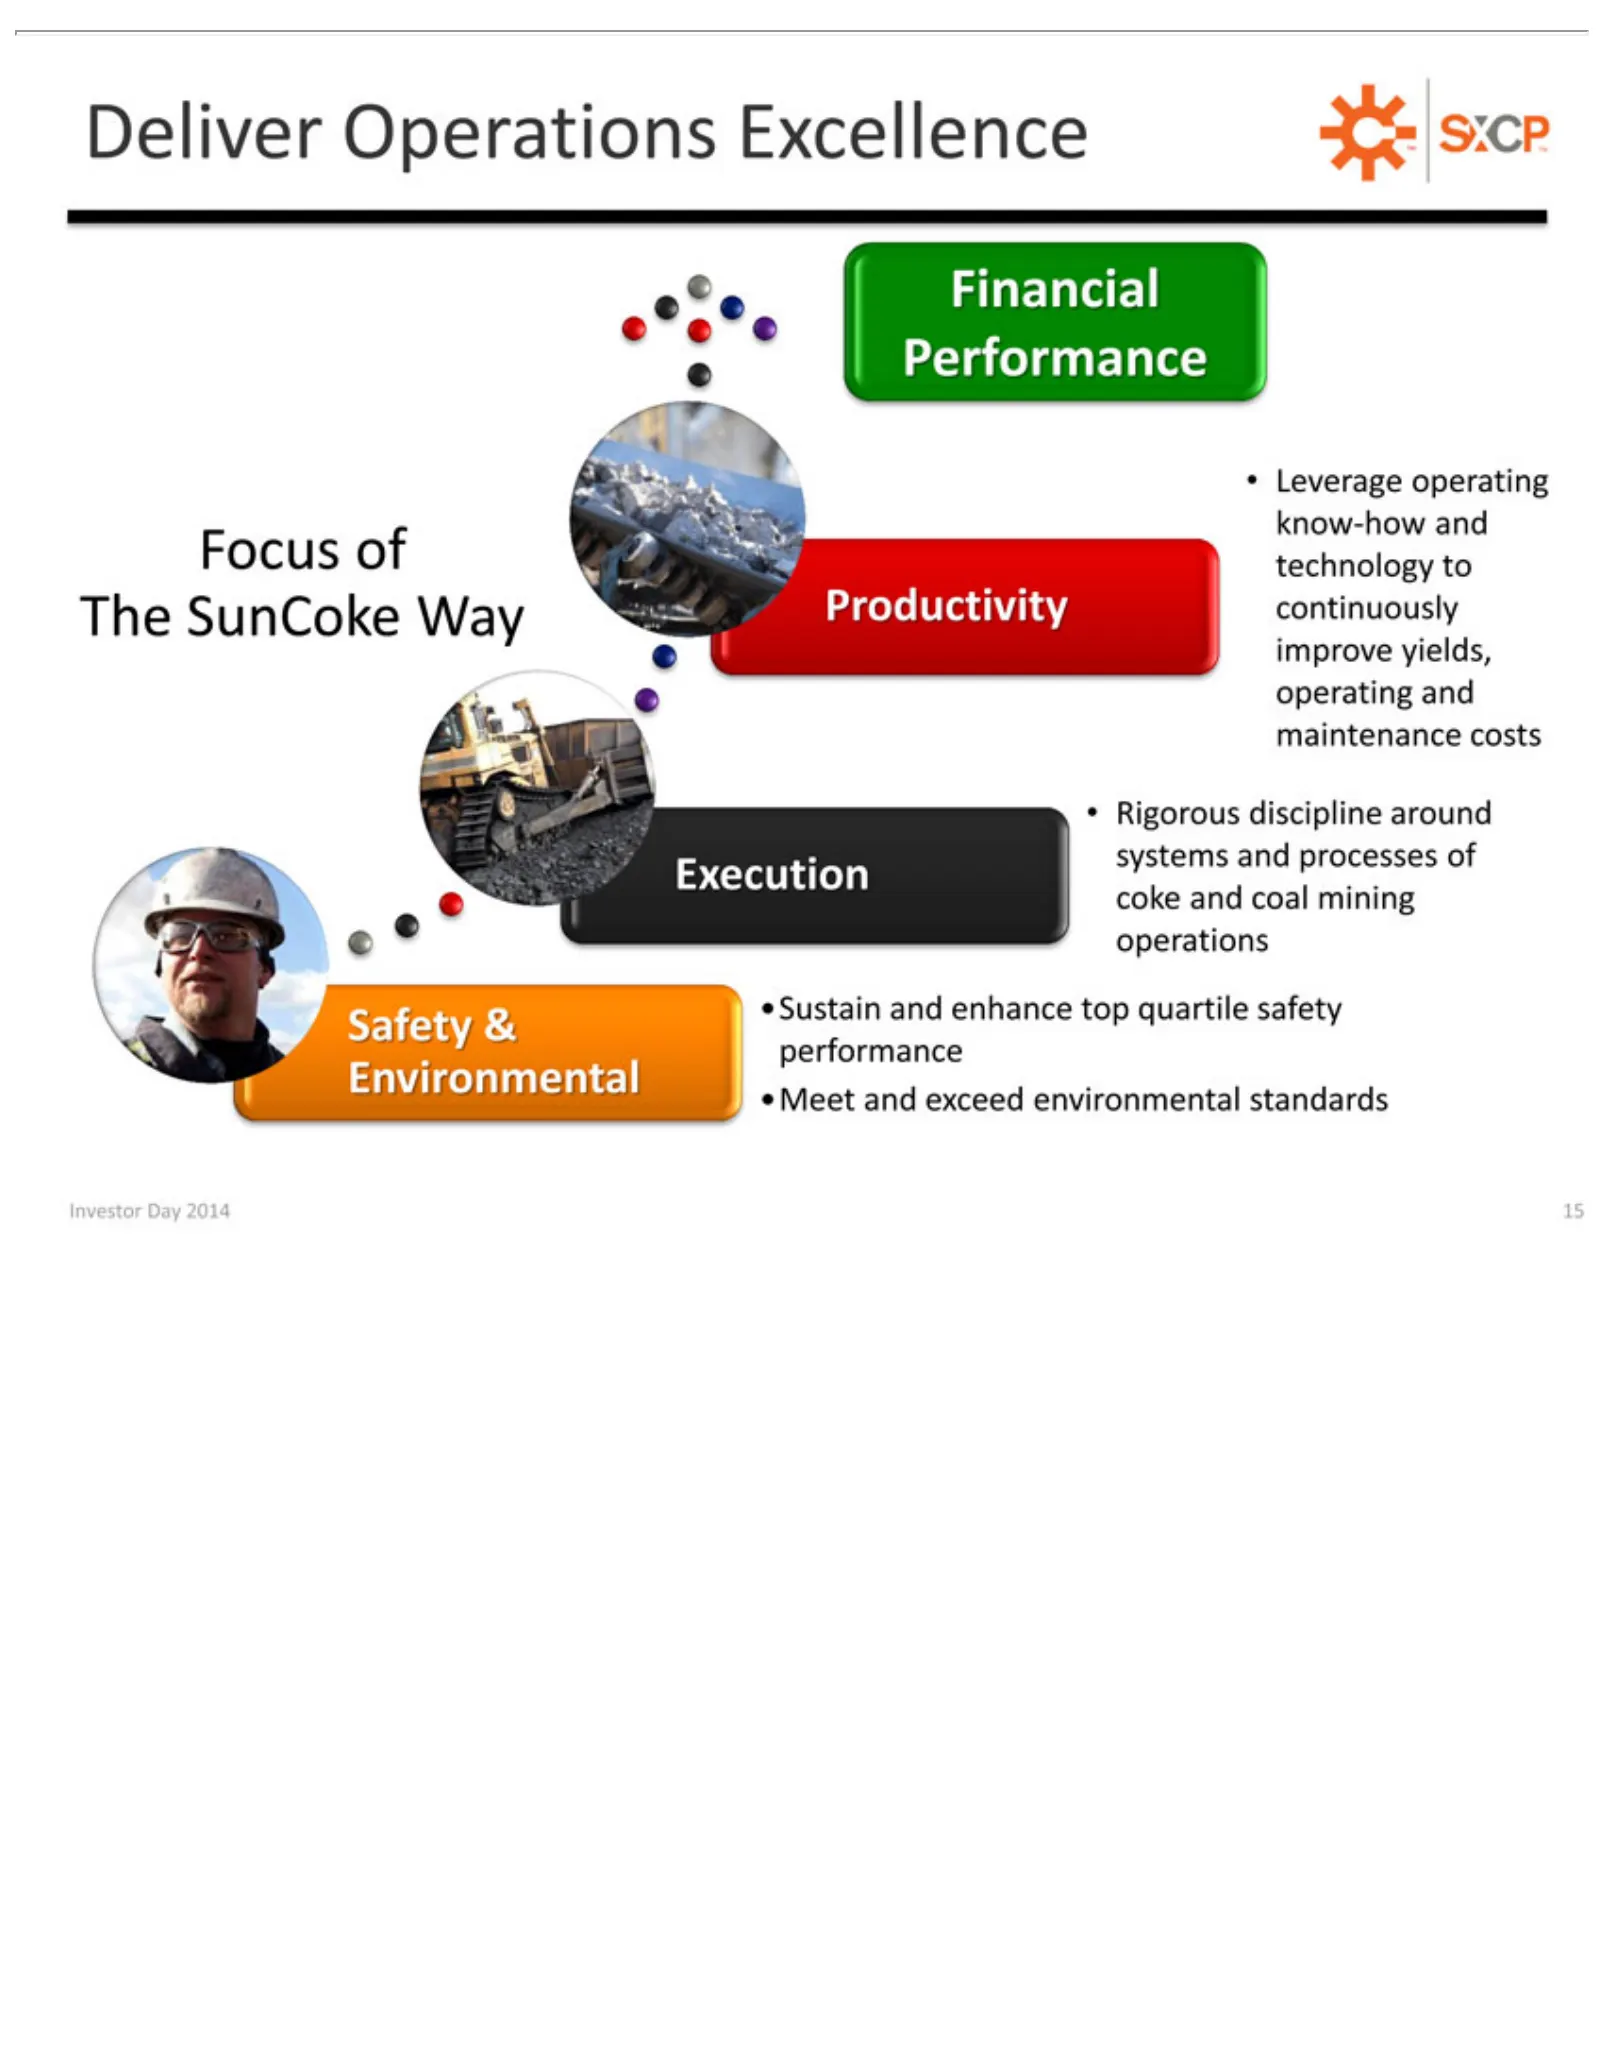
Deliver Focus Financial Safety Execution Productivity Leverage Rigorous Sustain Meet Investor and of &and Operations Day The Environmental discipline operating Performance exceed enhance 2014 SunCoke environmental 15 Excellence know-how around topWay quartile systems and standards safety technology
Slide 16: The SunCoke Way: Productivity and Yield
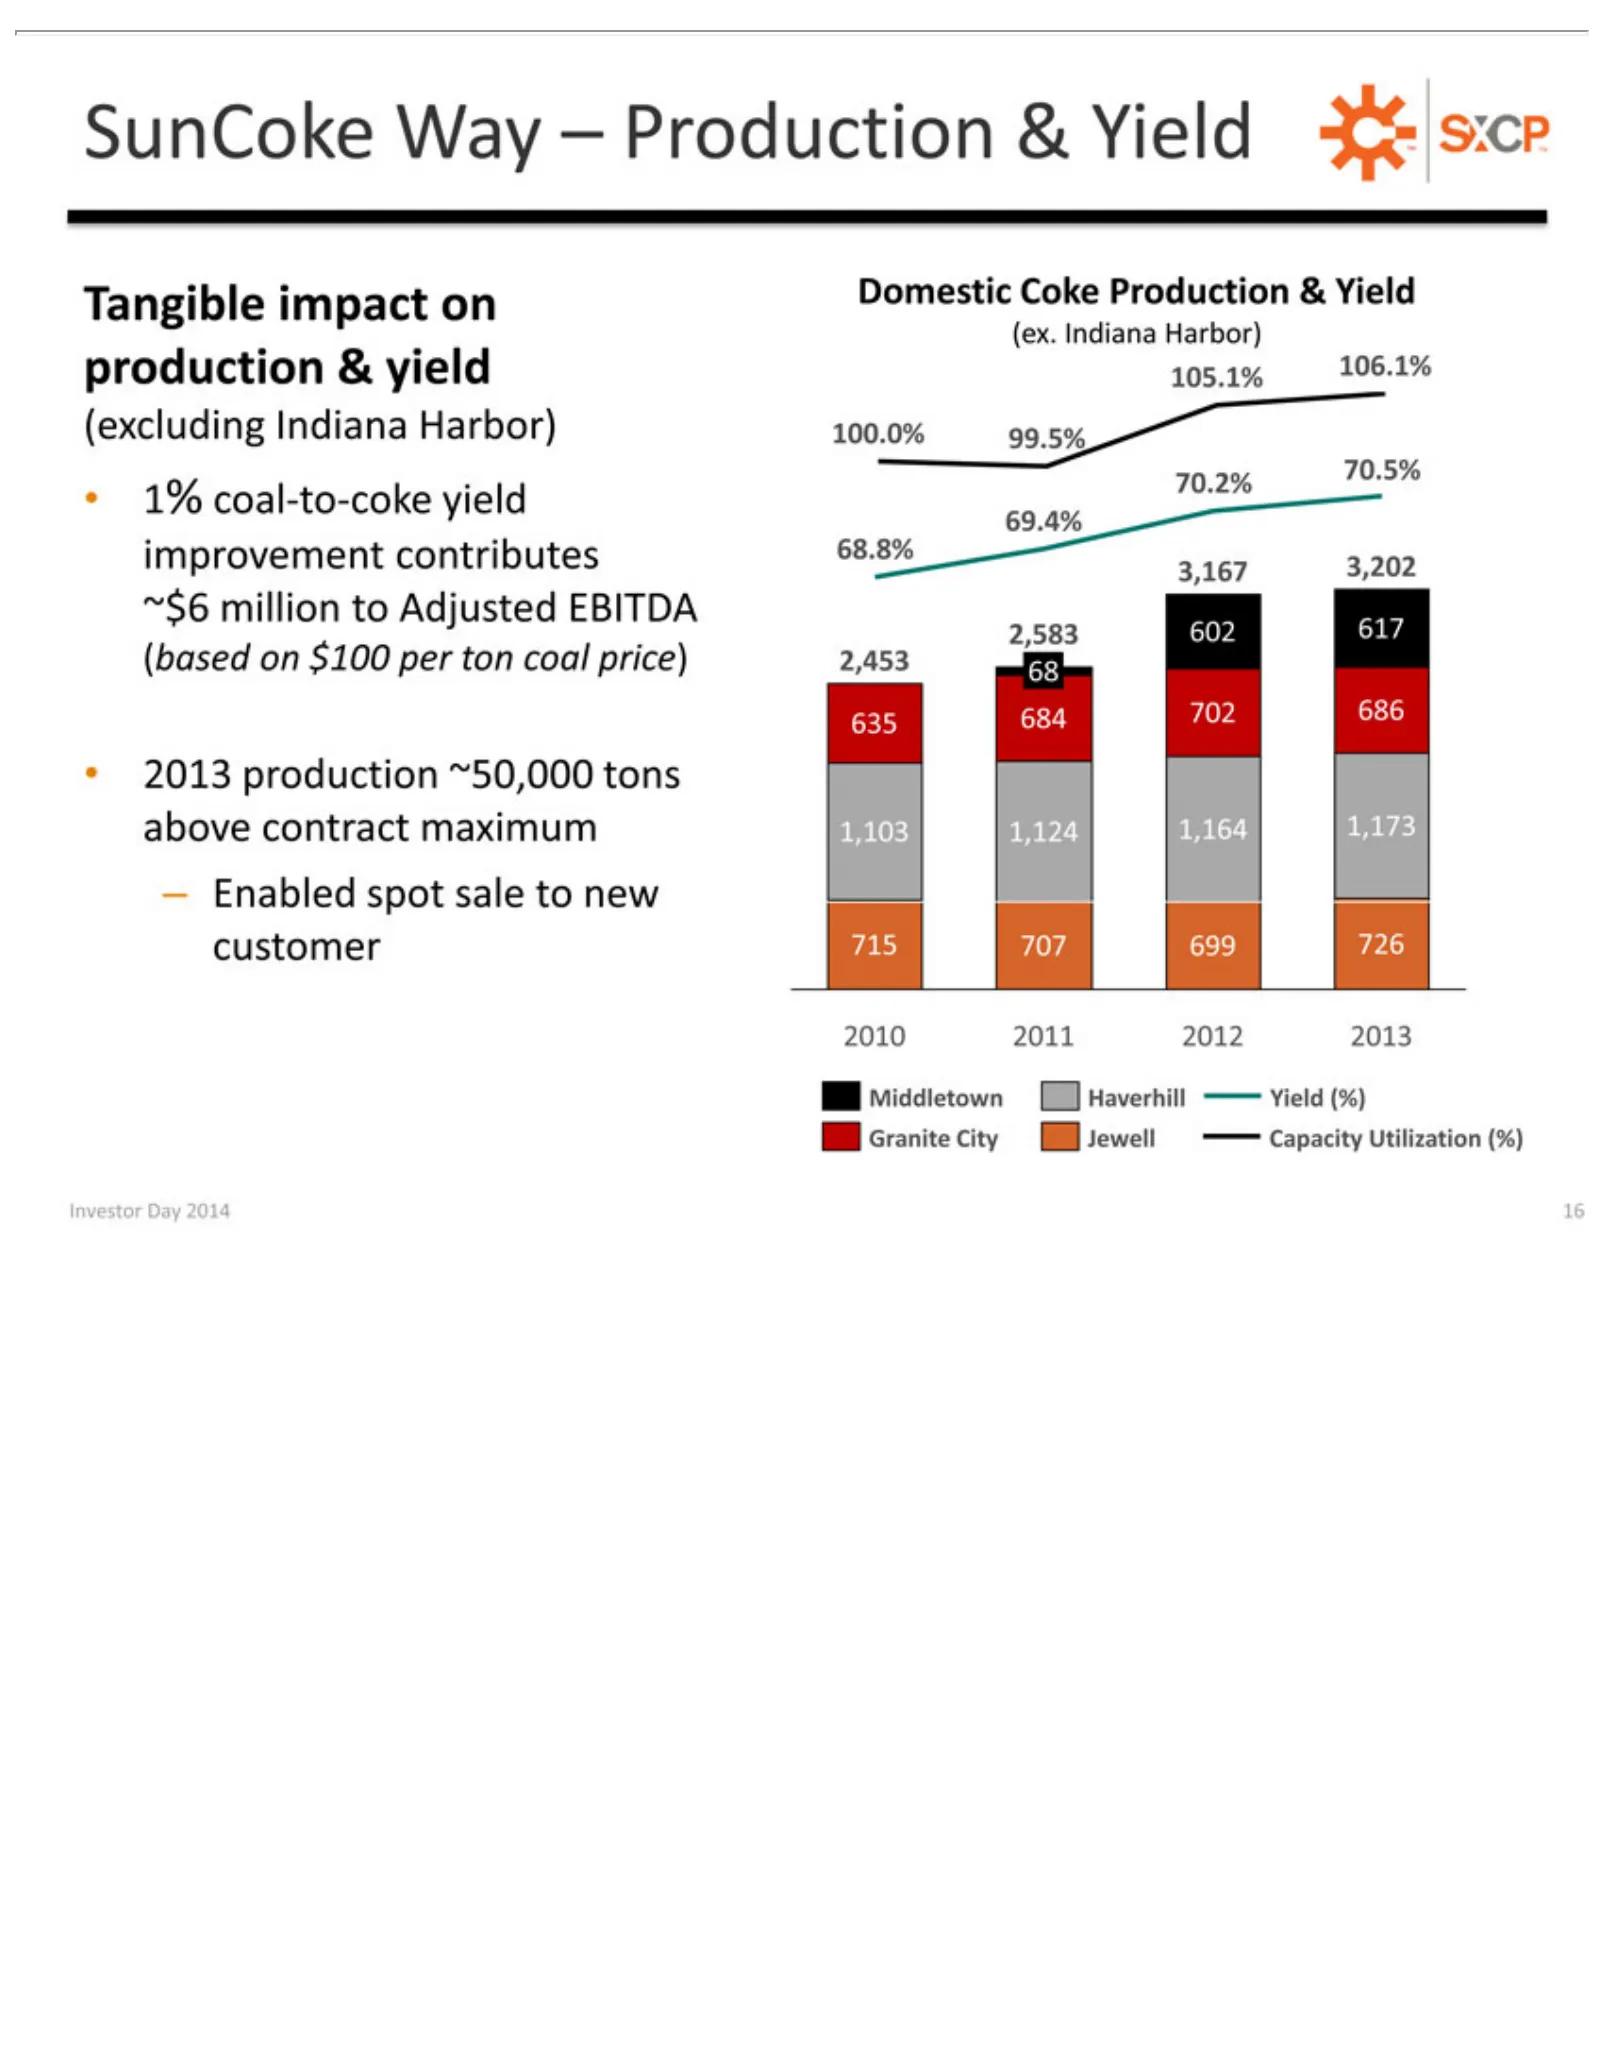
(ex. SunCoke Tangible (excluding 1% ~$6 (based –2013 Domestic Enabled coal-to-coke Indiana million 105.1% 2,583 2,453 684 1,103 715 2010 production on Middletown Granite Investor 702 707 2011 602 68 impact Way Coke $100 1,124spot CityIndiana to Harbor) 106.1% 686 699 Day 617 2012 Adjusted –sale per
Slide 17: SunCoke Safety Performance
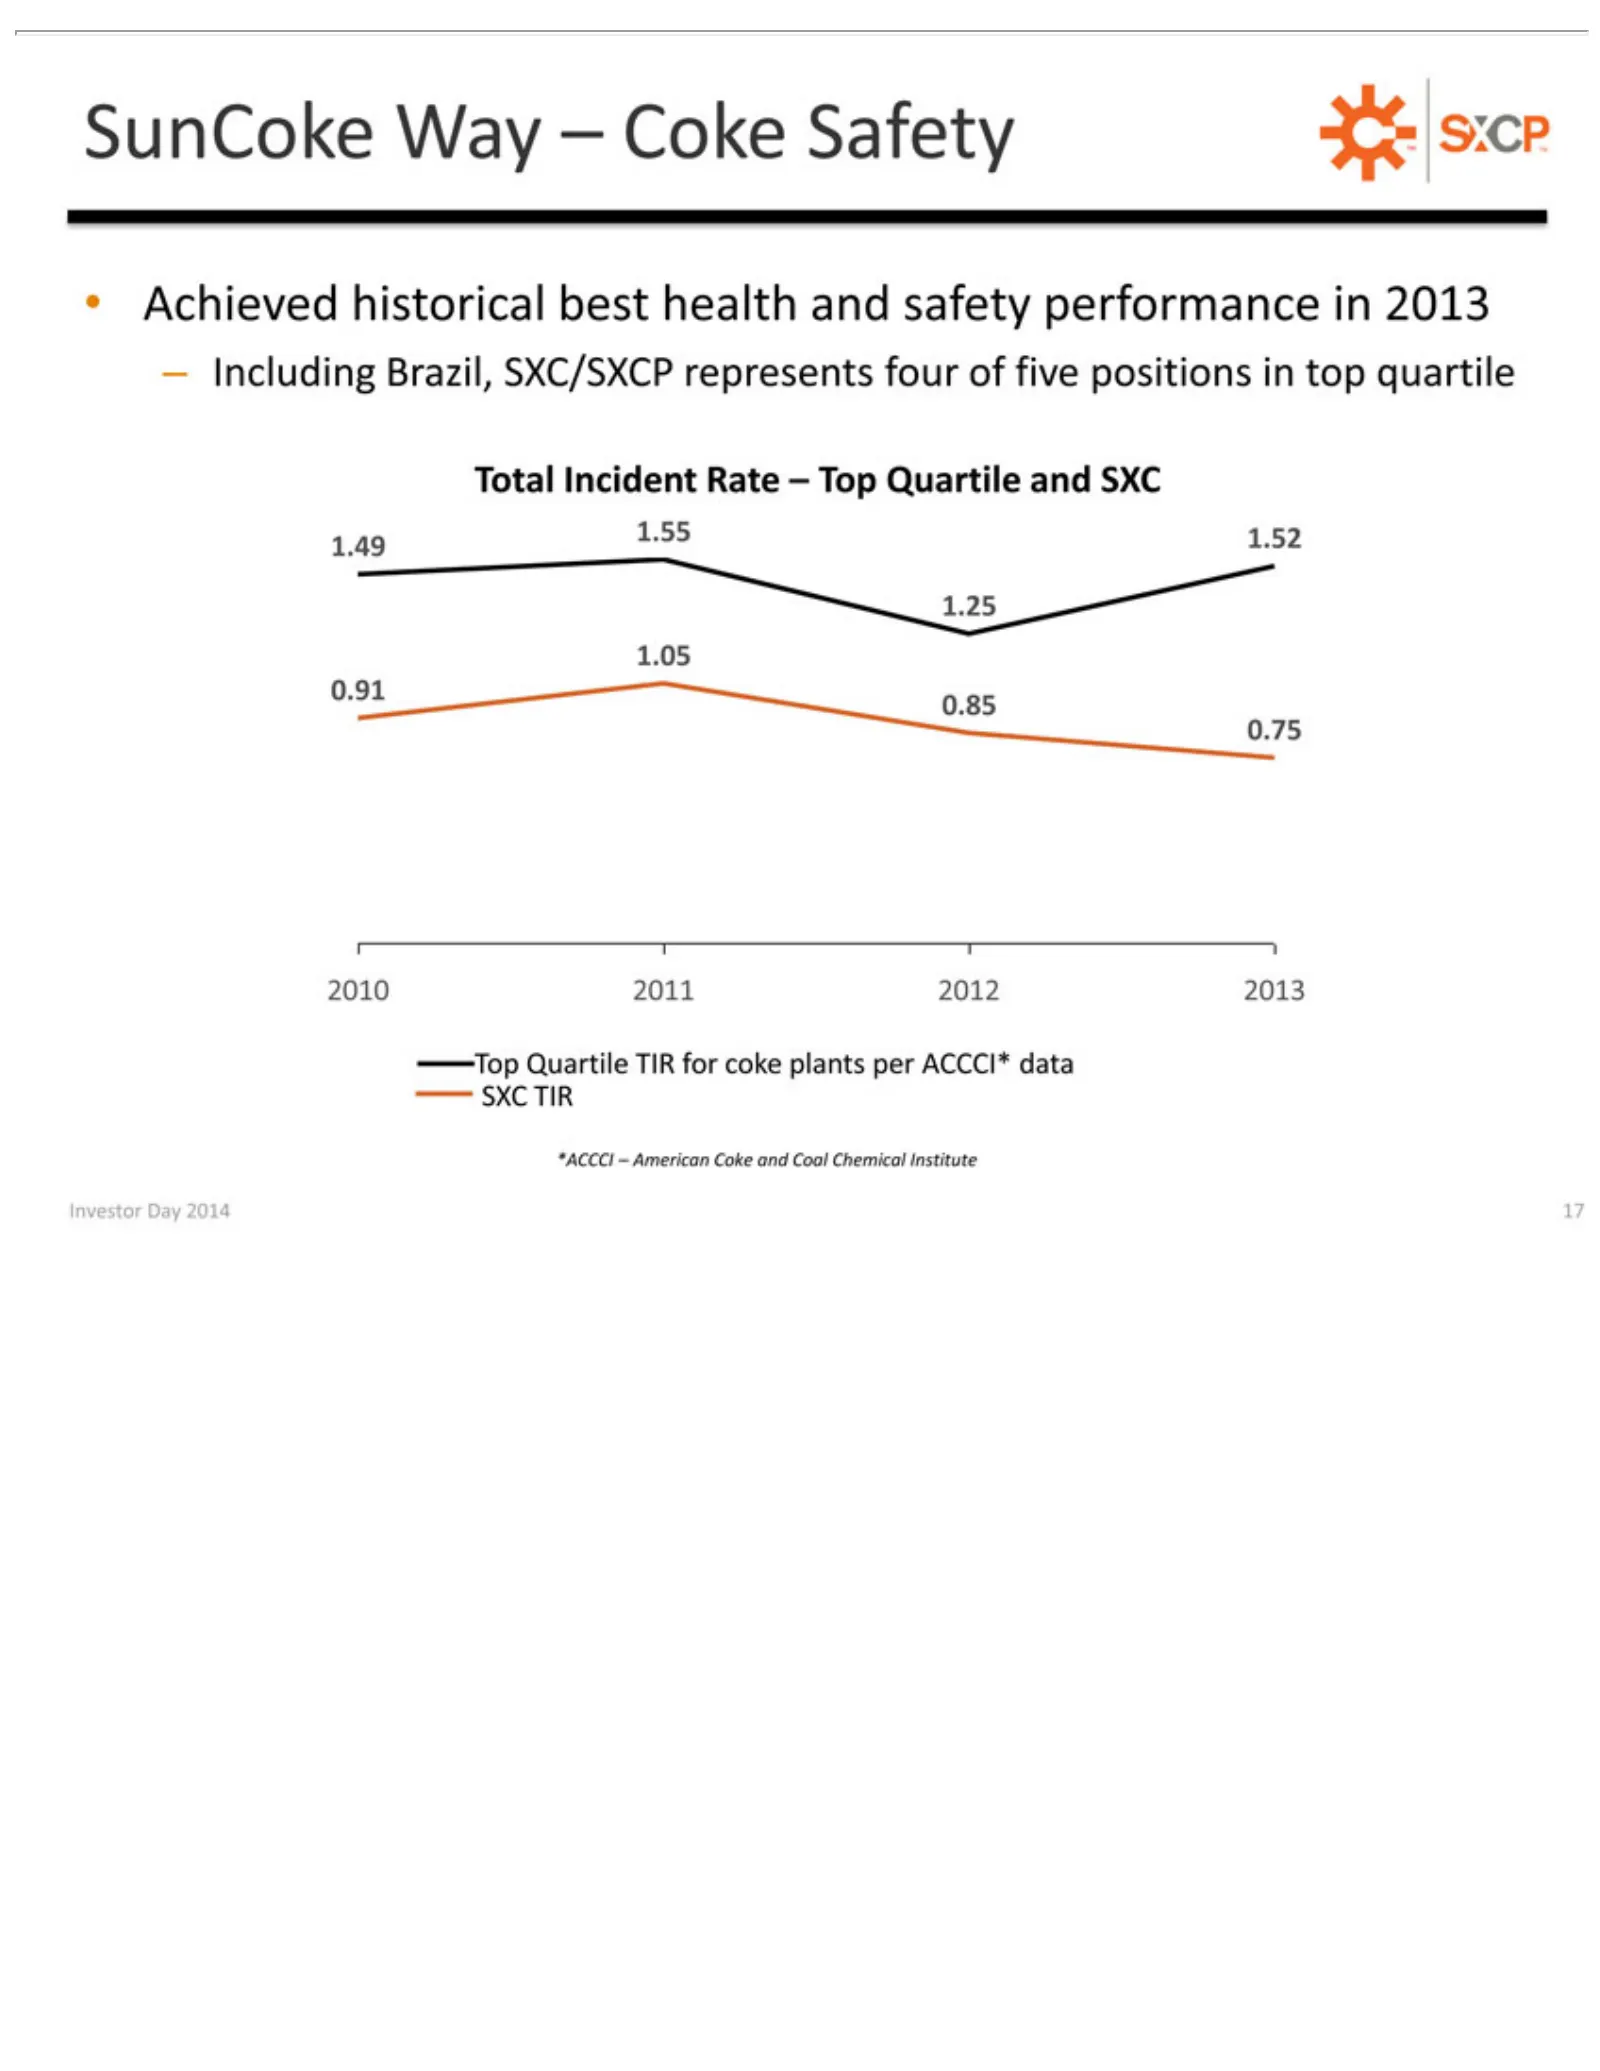
SunCoke –Achieved Total 1.55 2010 0.75 0.85 0.91 1.05 1.25 1.49 Top *ACCCI Investor Including Quartile 1.52 2011 Incident Day –Way historical 2012 American Brazil, TIR 2014 Rate – Coke 2013 for 17 SXC/SXCP –best coke Top Coke Safety health Quartile plants and and represents Coal per and safety ACCCI
Slide 18: International Coke Operations
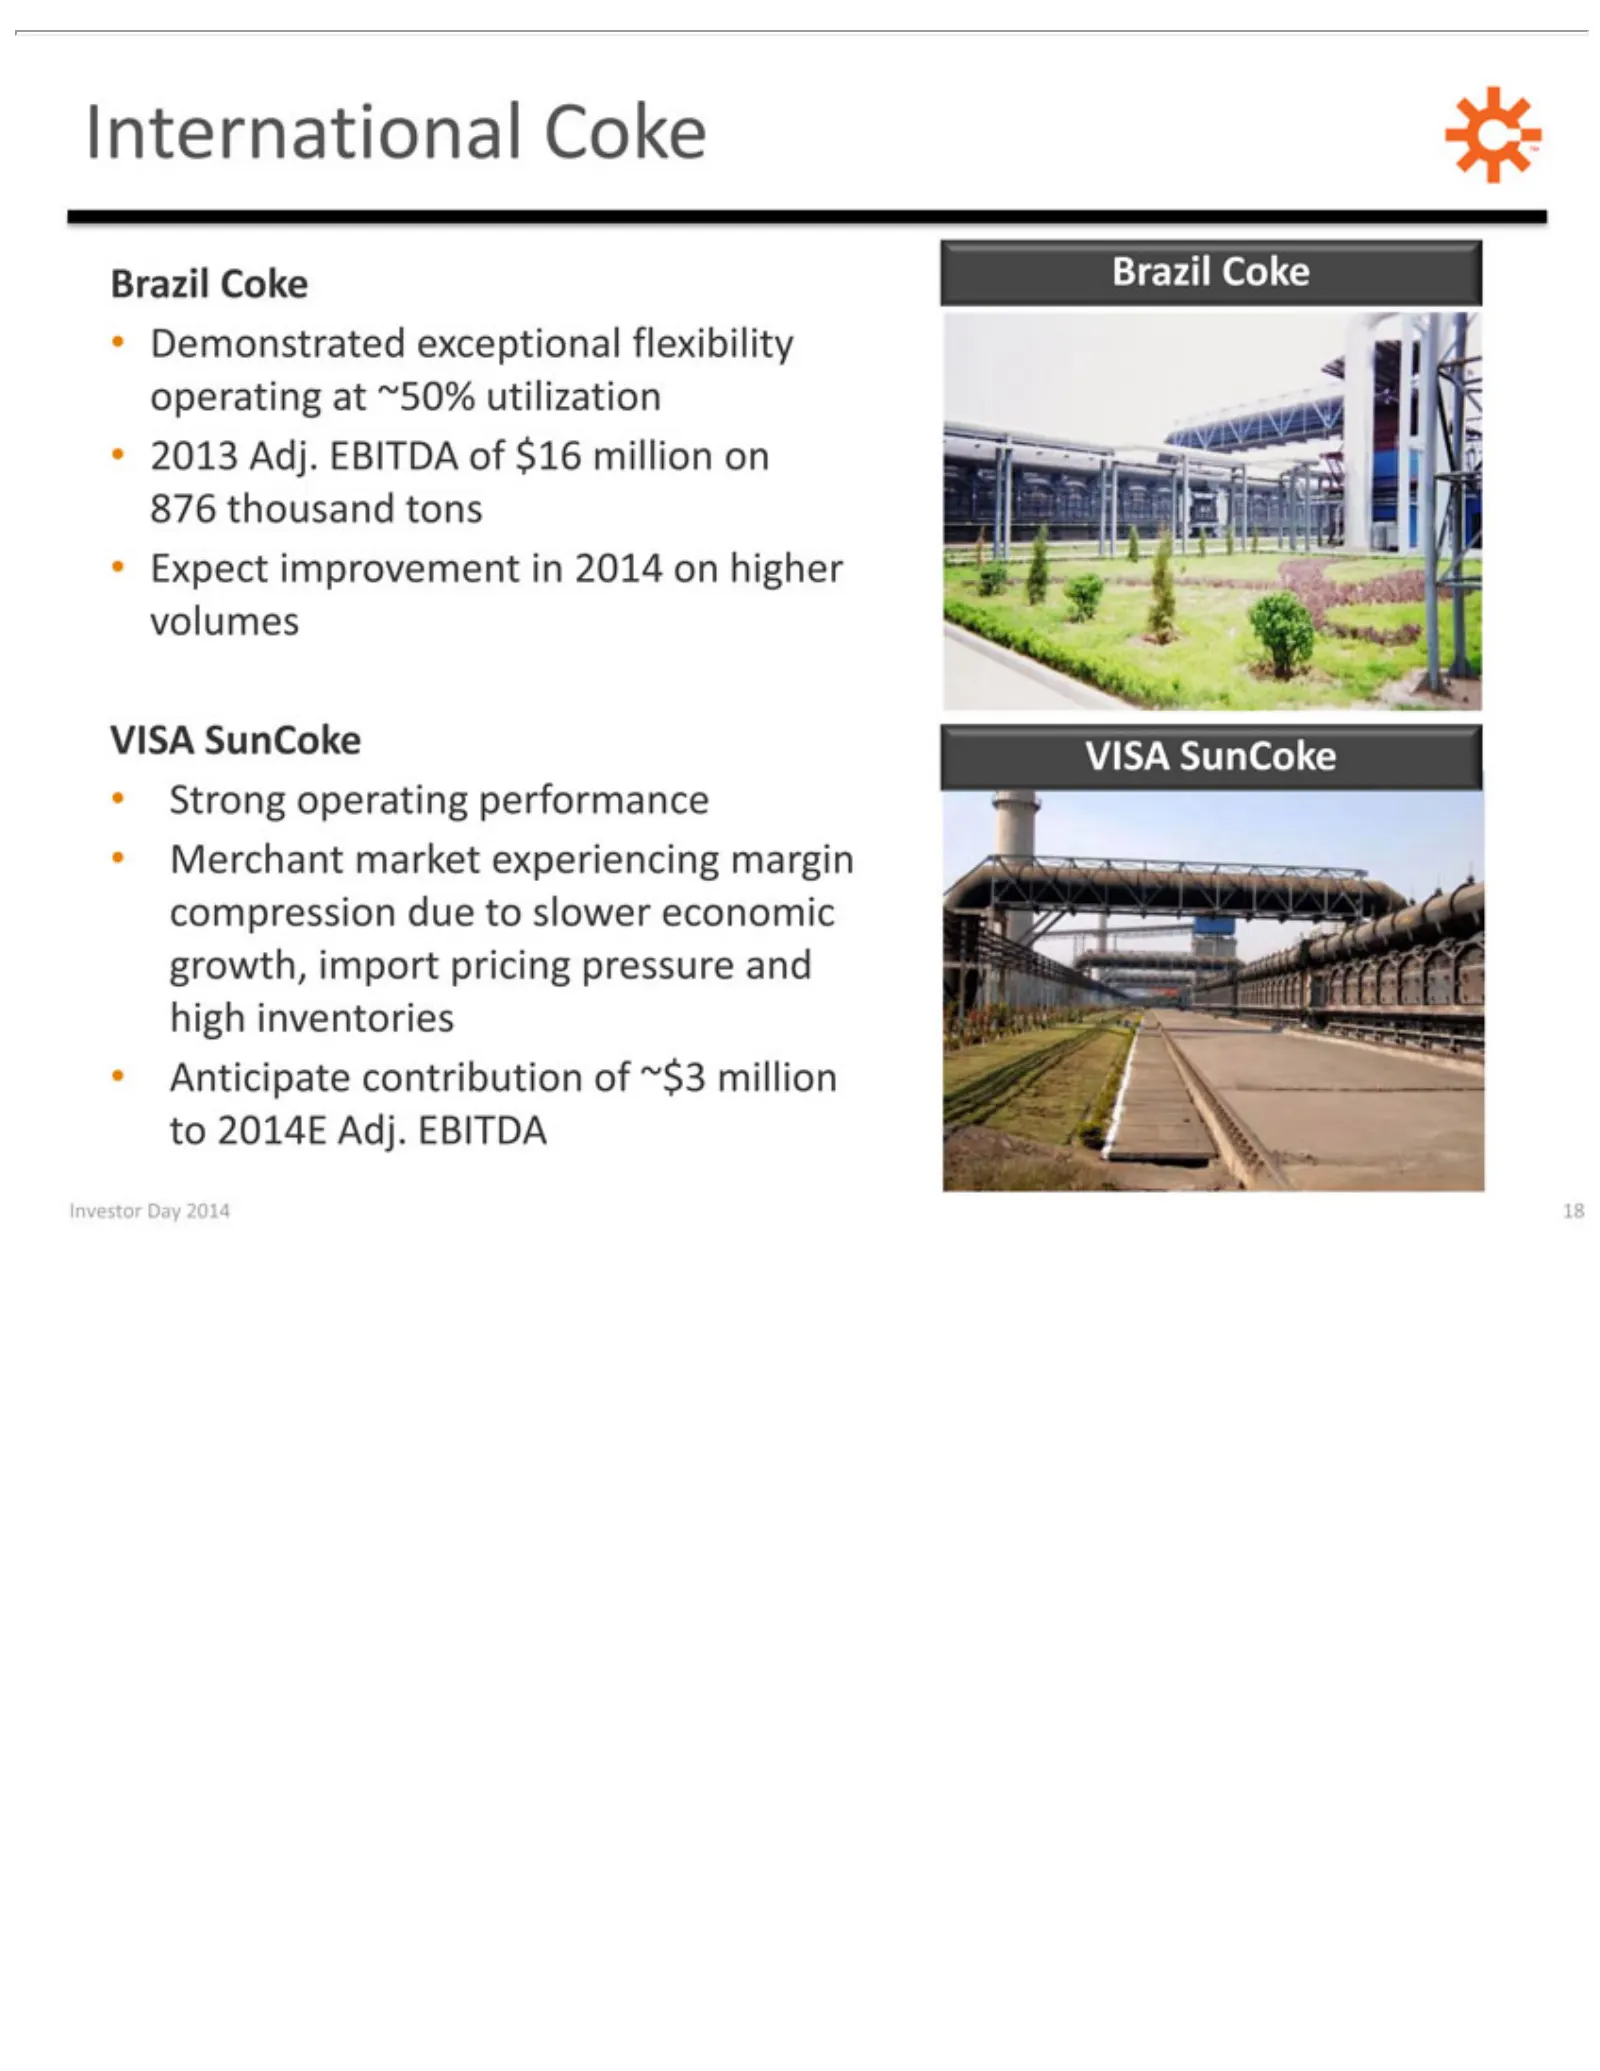
International Demonstrated 2013 Expect Strong Merchant Anticipate Brazil VISA Investor Adj. SunCoke Coke operating improvement Day market EBITDA contribution Coke 2014 exceptional performance experiencing 18 ofin$16 of 2014 ~$3 flexibility million onmillion margin higher onoperating 876 to compressi
Slide 19: Coal Mining
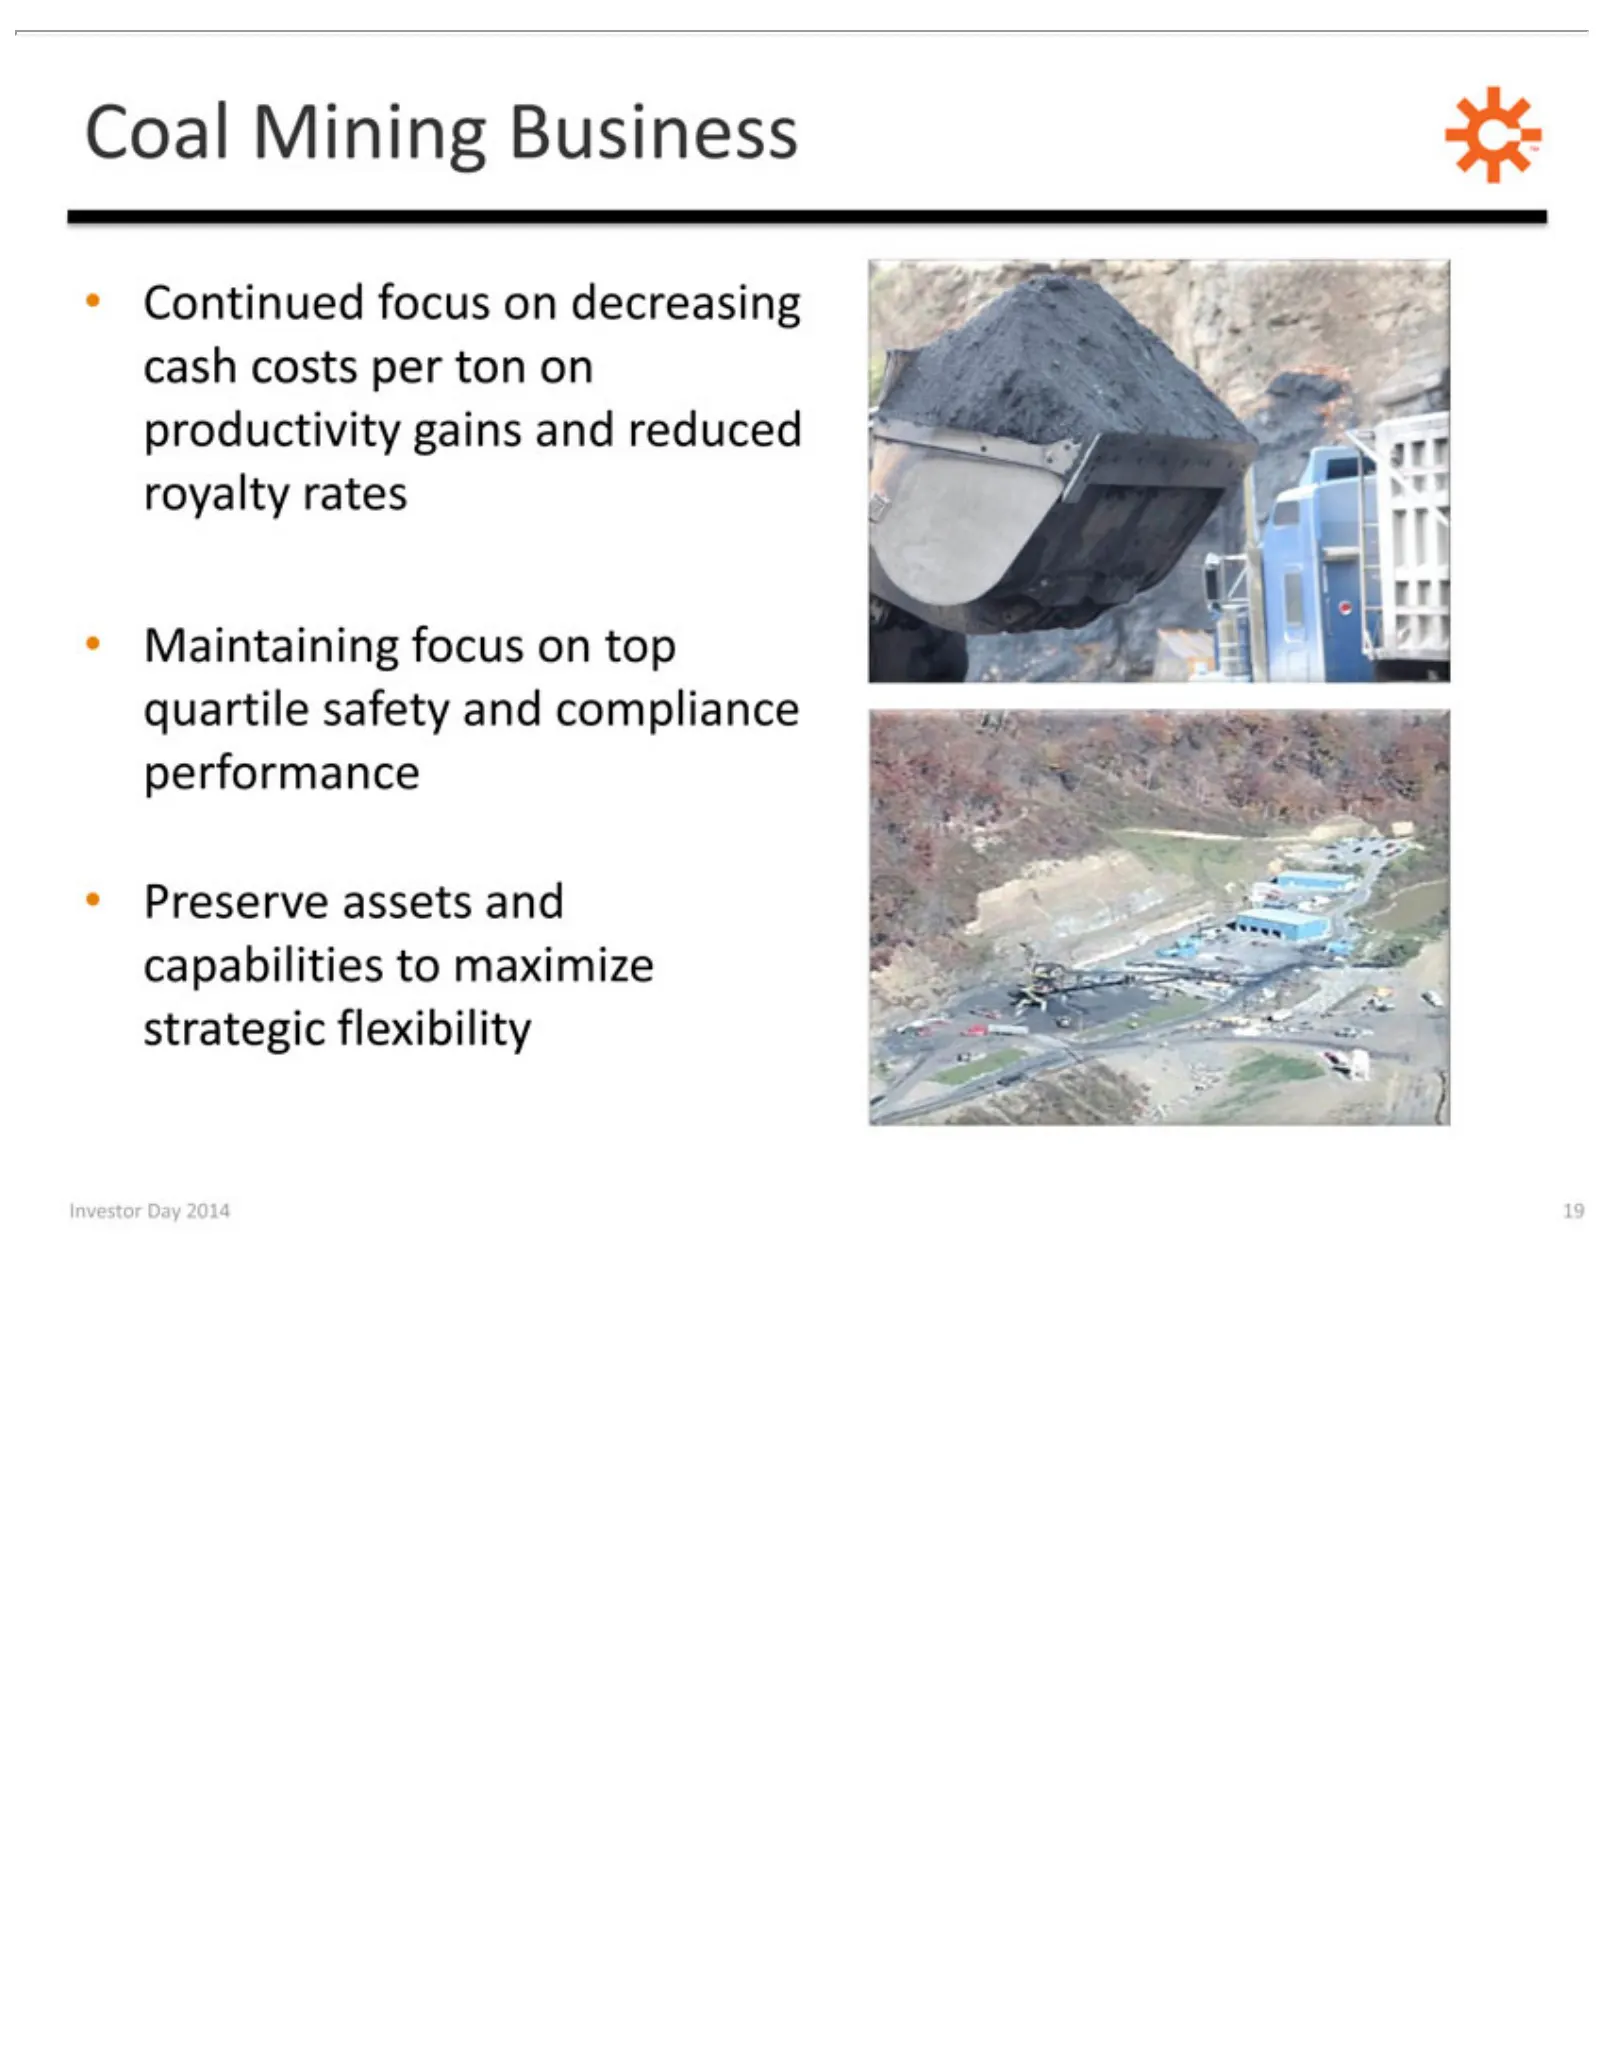
Coal Mining Continued Maintaining Preserve Investor Day assets focus focus Business 2014 and onon 19 capabilities decreasing top quartile cash to safety maximize costsand percompliance strategic ton on productivity flexibility performance gains and reduced royalty rates
Slide 20: Leverage Technology
LEVERAGE Investor Day 2014 TECHNOLOGY 20
Slide 21: Leverage Technology to Optimize Existing Assets
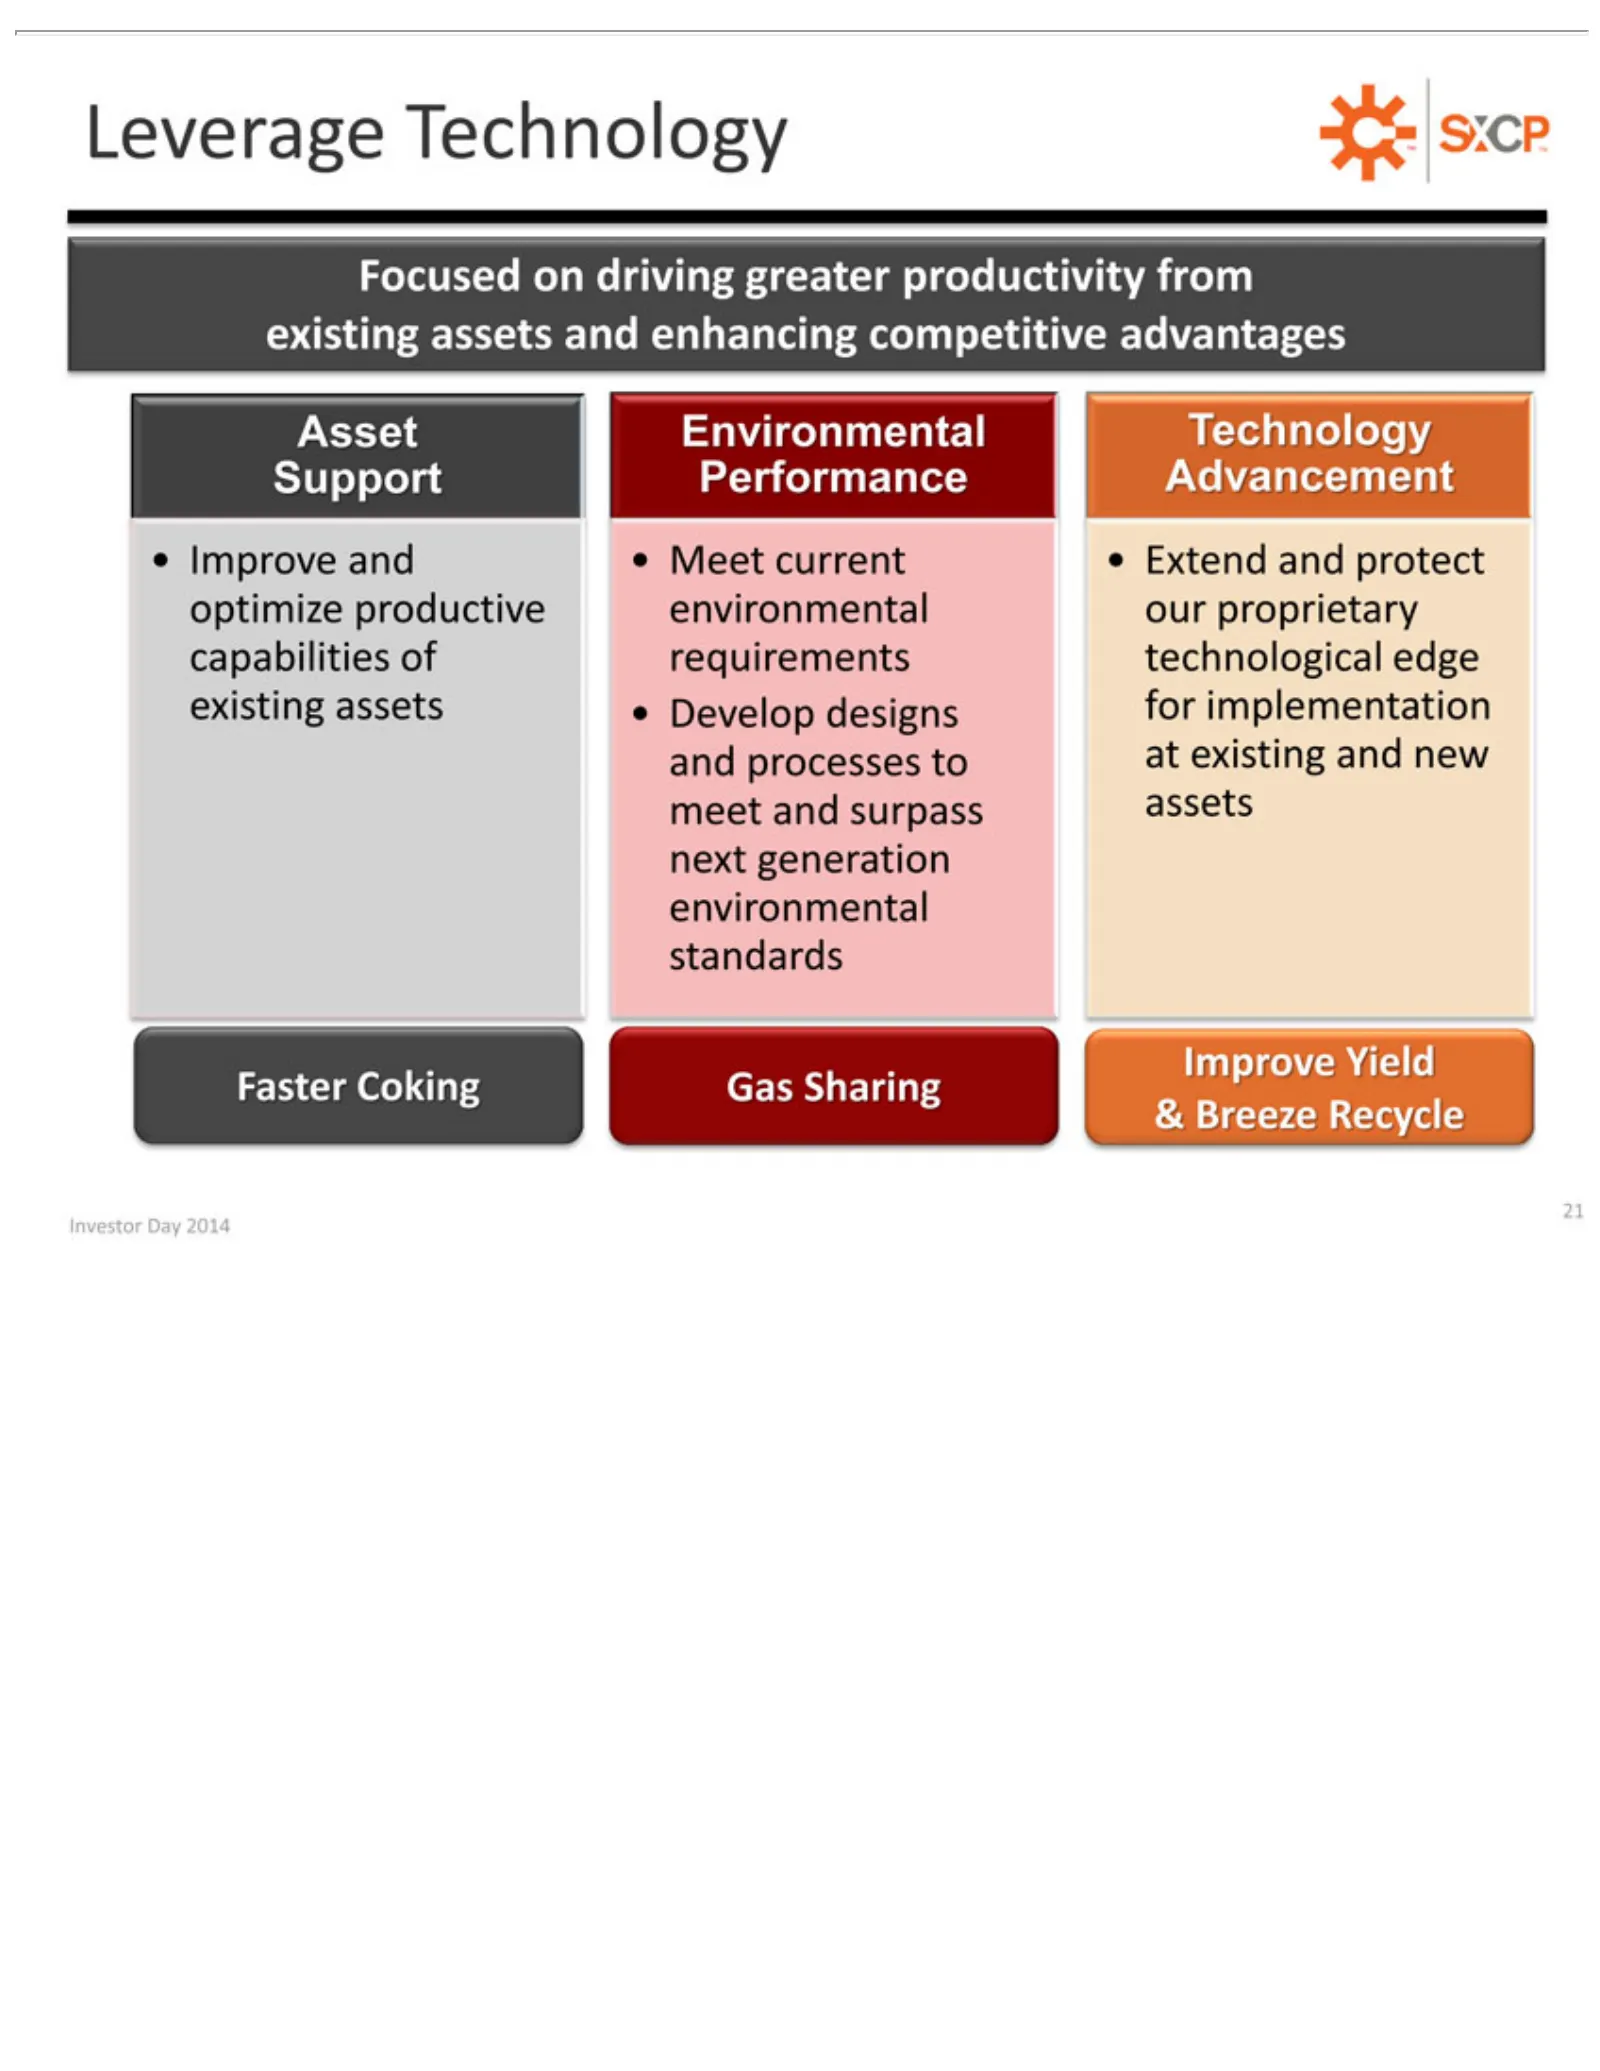
Leverage Focused Asset optimize capabilities existing Faster Environmental Meet Develop Gas Extend Advancement Technology Improve & 21 Investor Breeze Investor Sharing current Support Coking and assets Day on Yield and designs productive Technology Recycle protect Day of driving environmental 2014 P
Slide 22: Faster Coking Rate
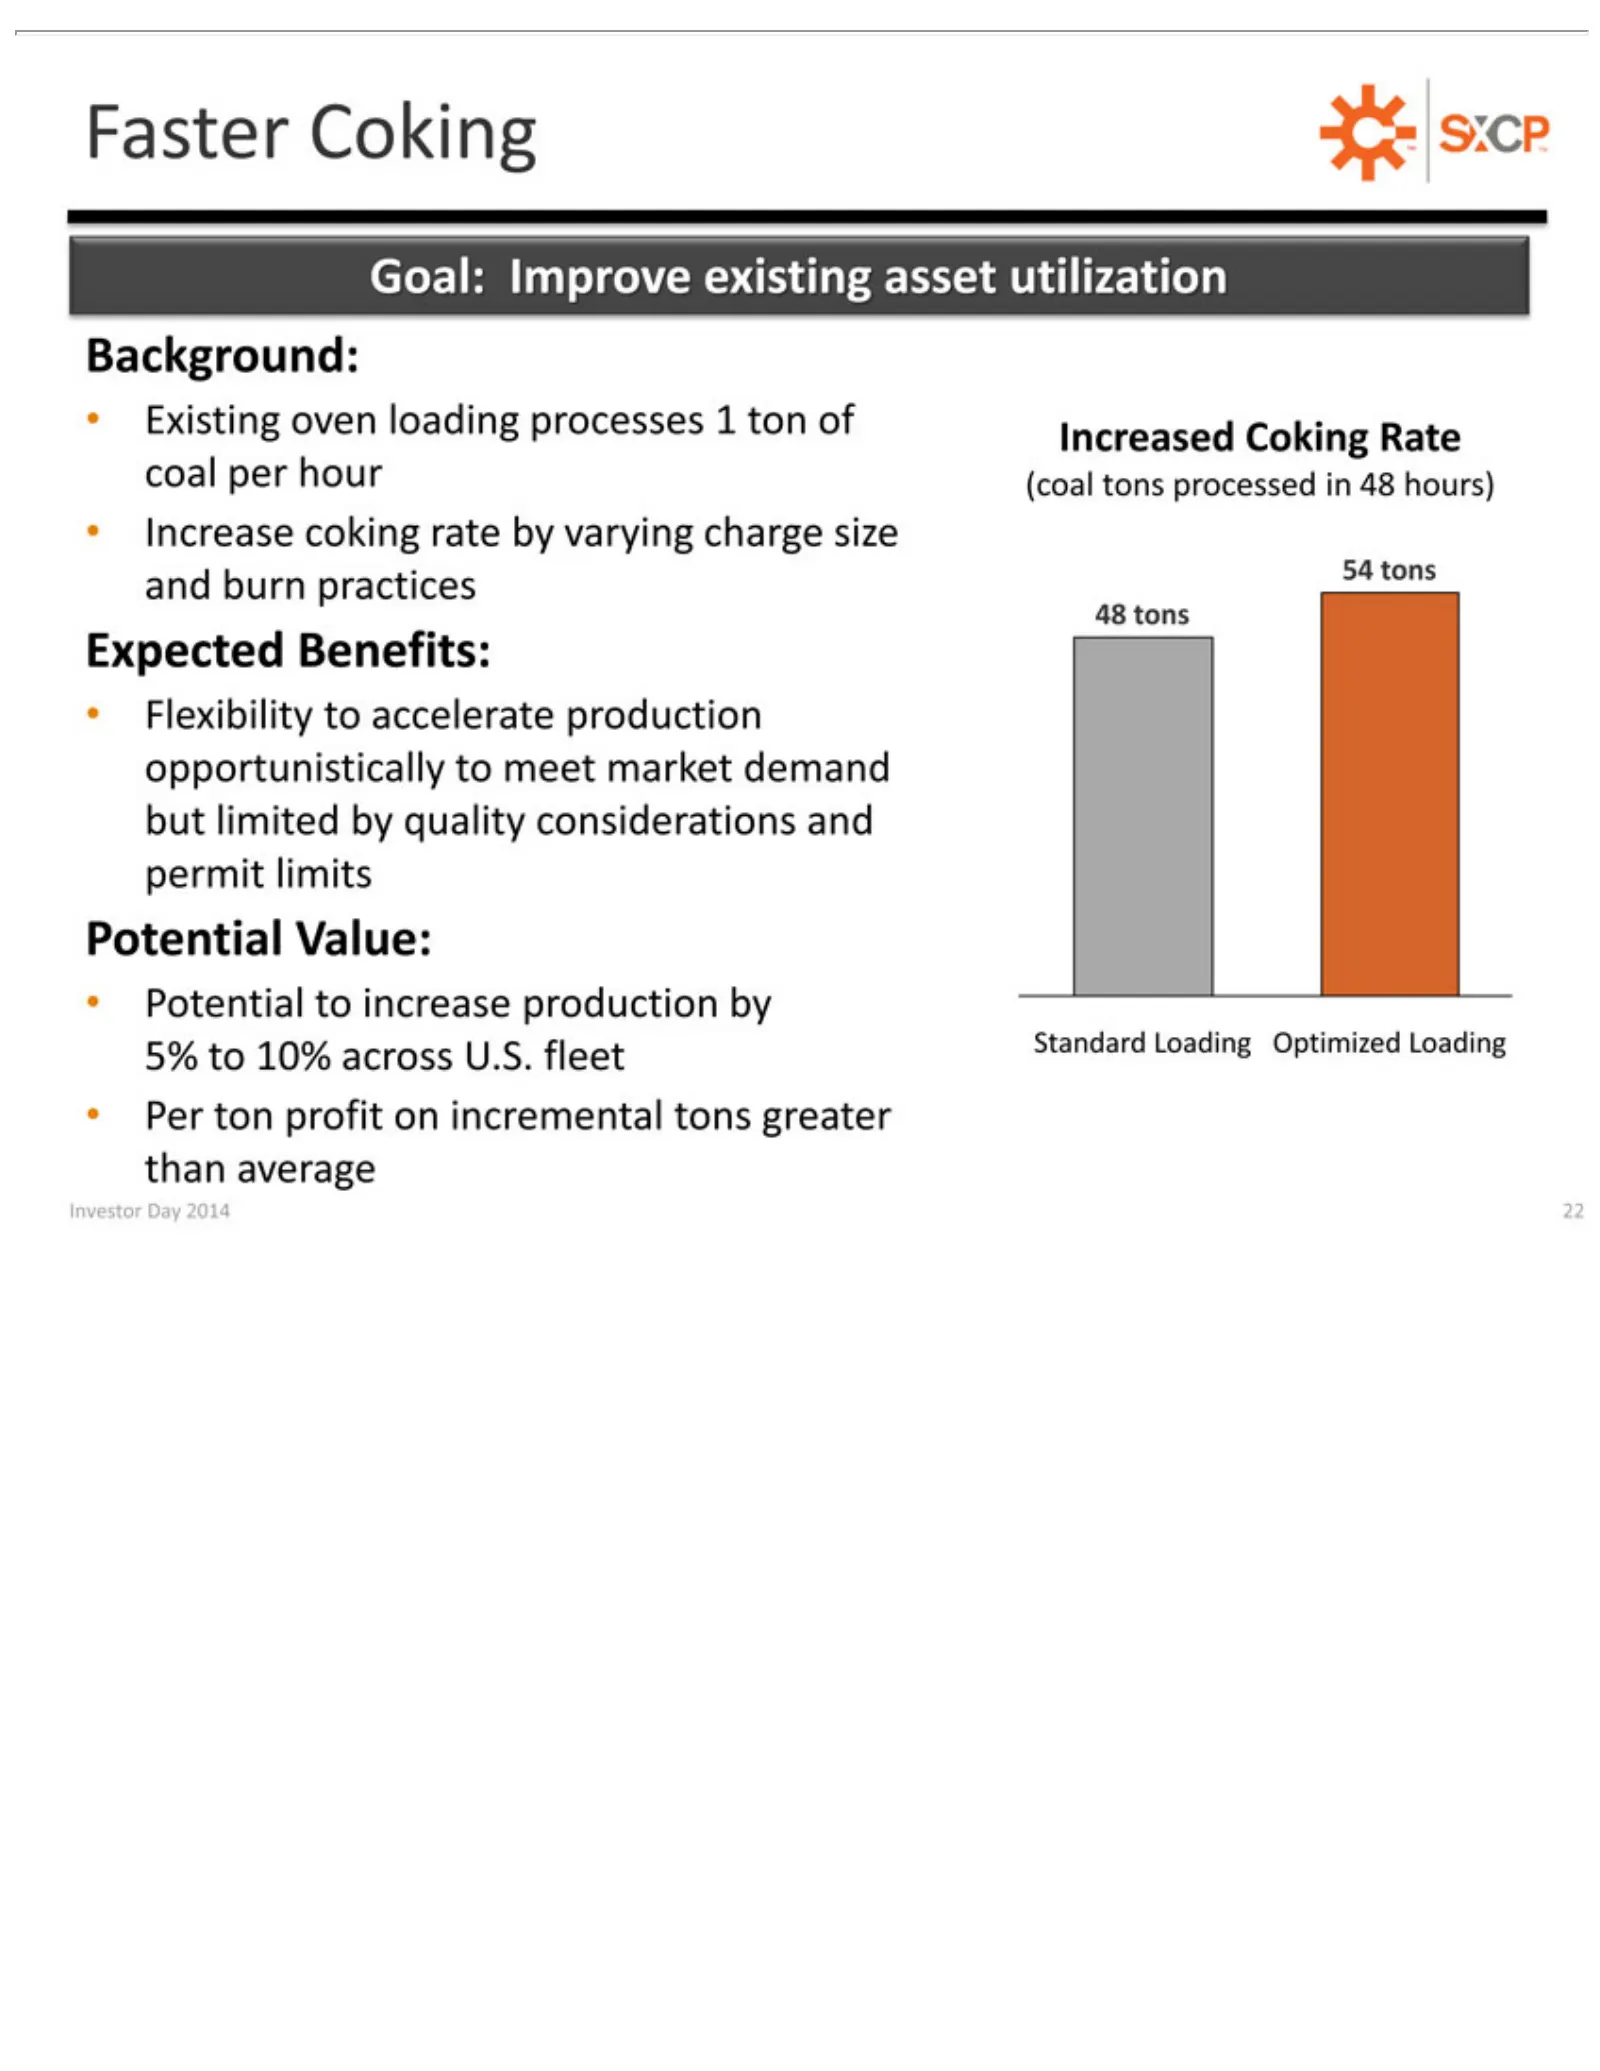
Faster Goal: Existing Increase Expected Flexibility Potential Per Increased (coal 48 54 Standard Investor tons ton tons Improve Coking profit Day coking oven Value: Loading to Benefits: Coking processed toincrease 2014 accelerate on loading existing rate incremental Rate Optimized 22by production in
Slide 23: Gas Sharing Technology
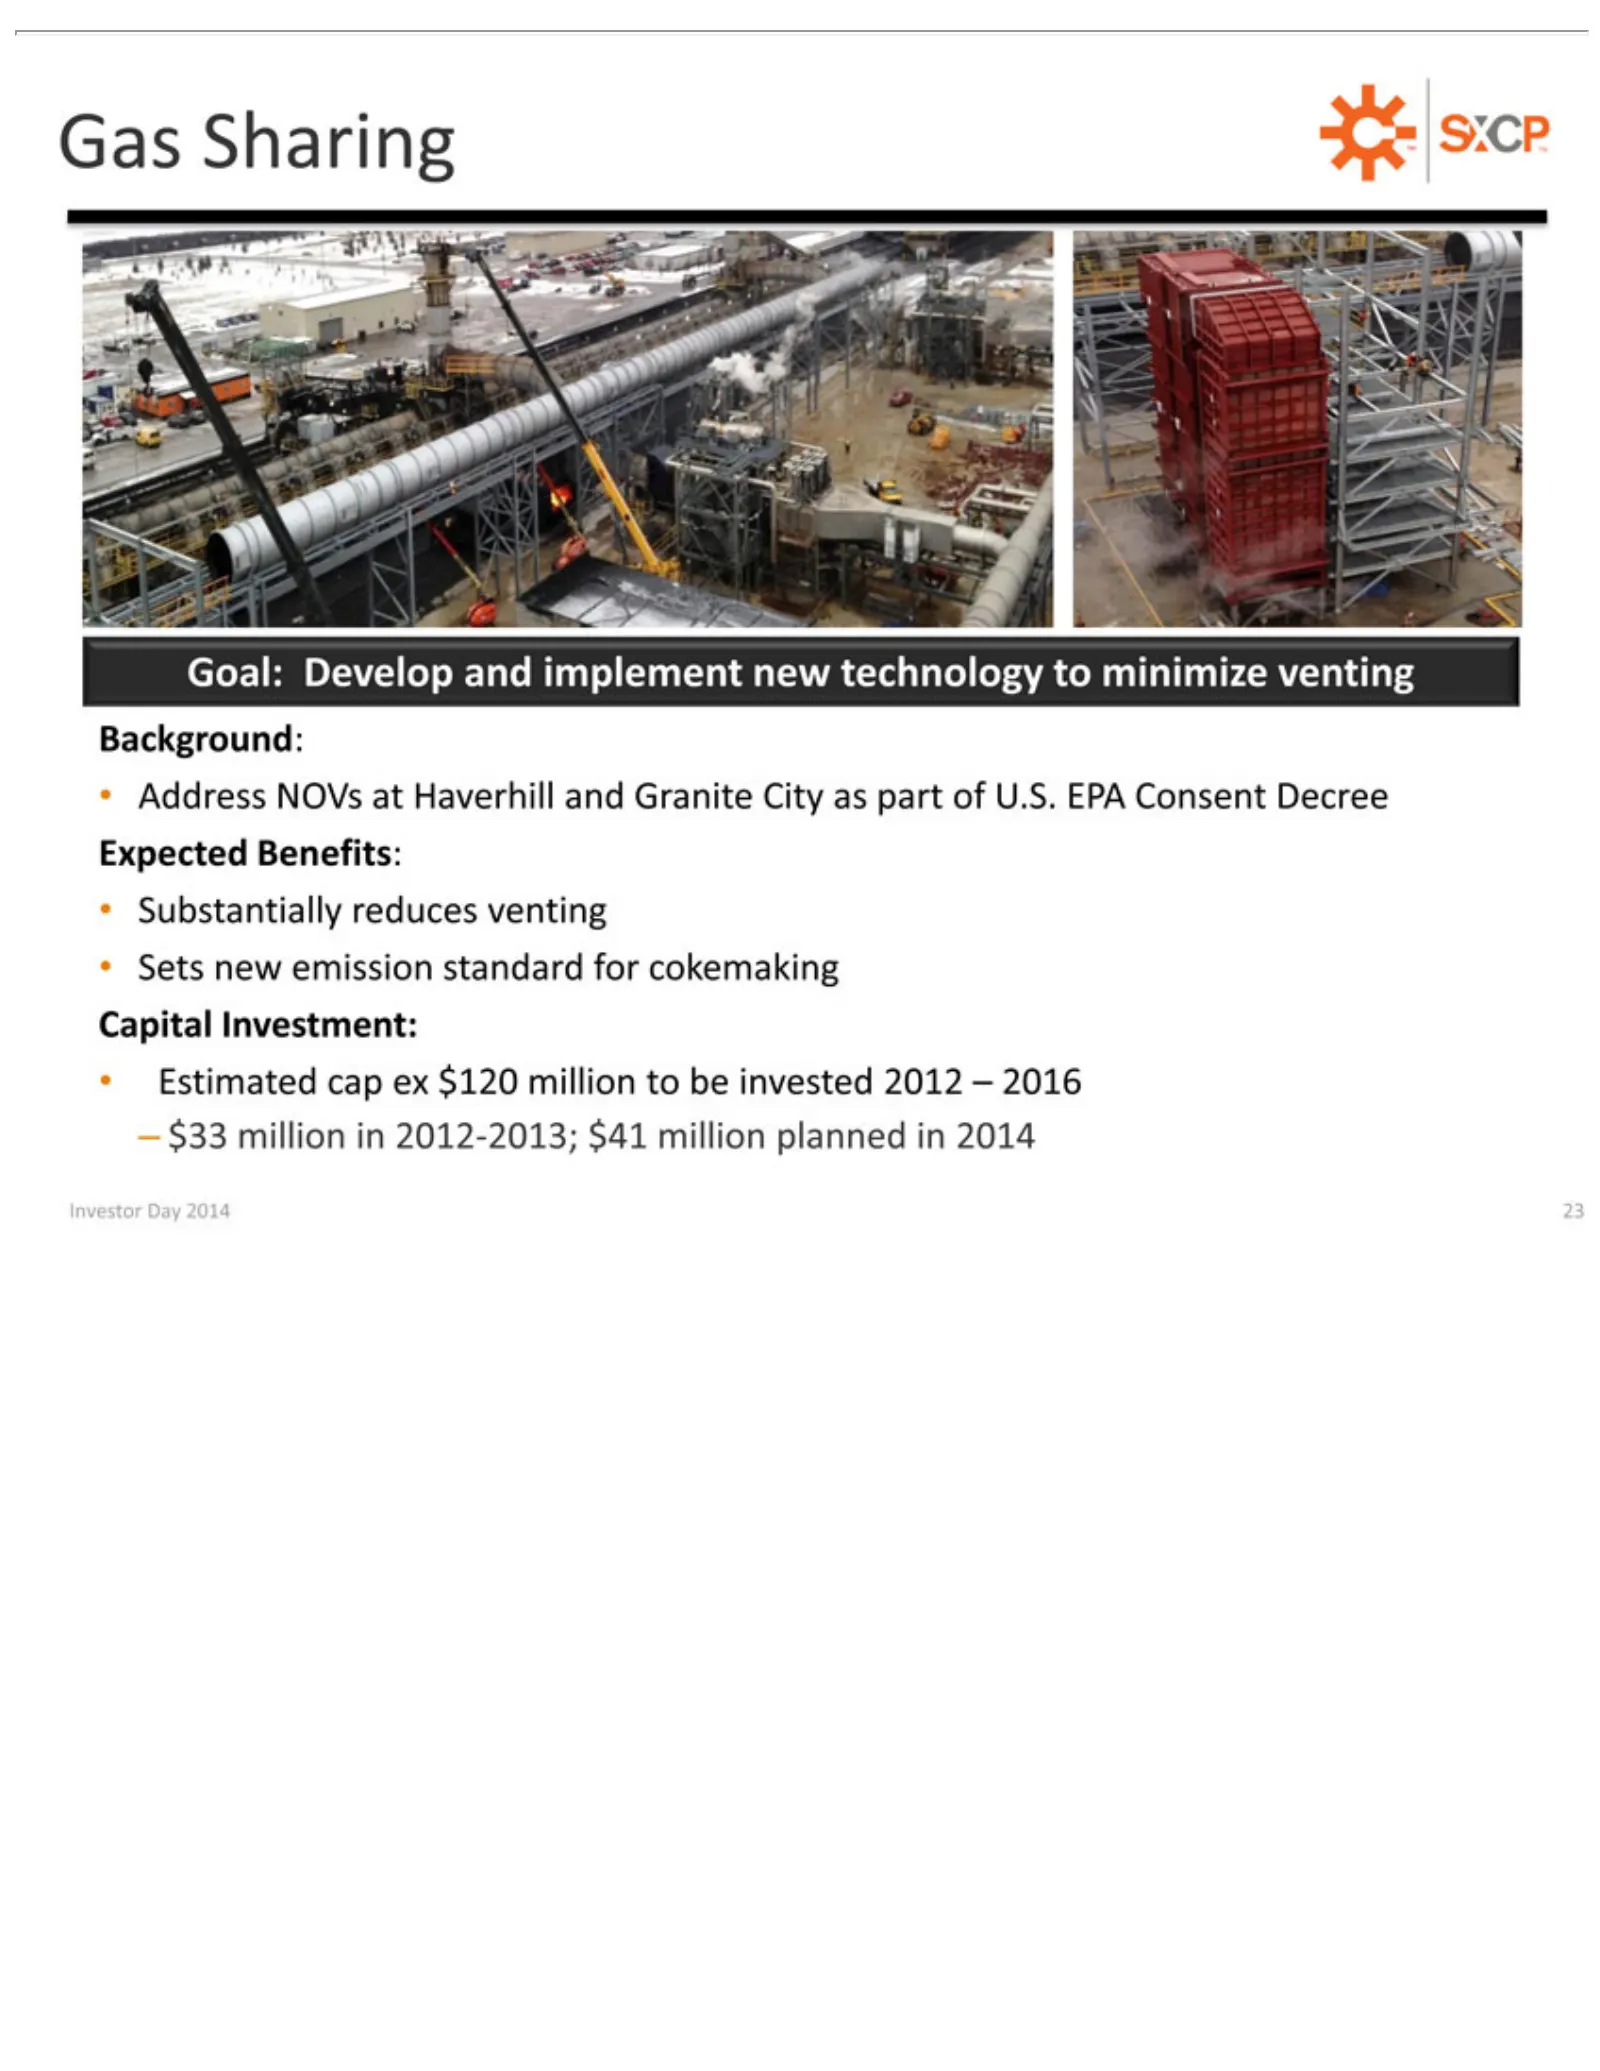
Gas Goal: Address Background: Expected Substantially Sets Capital –Estimated Investor $33Sharing new Develop million Investment: Day NOVs emission Benefits: cap2014 reduces in ex and at2012-2013; $120 Haverhill standard 23 implement venting million for and $41 new to cokemaking Granite million betec
Slide 24: Improve Yield: Burn Loss Reduction
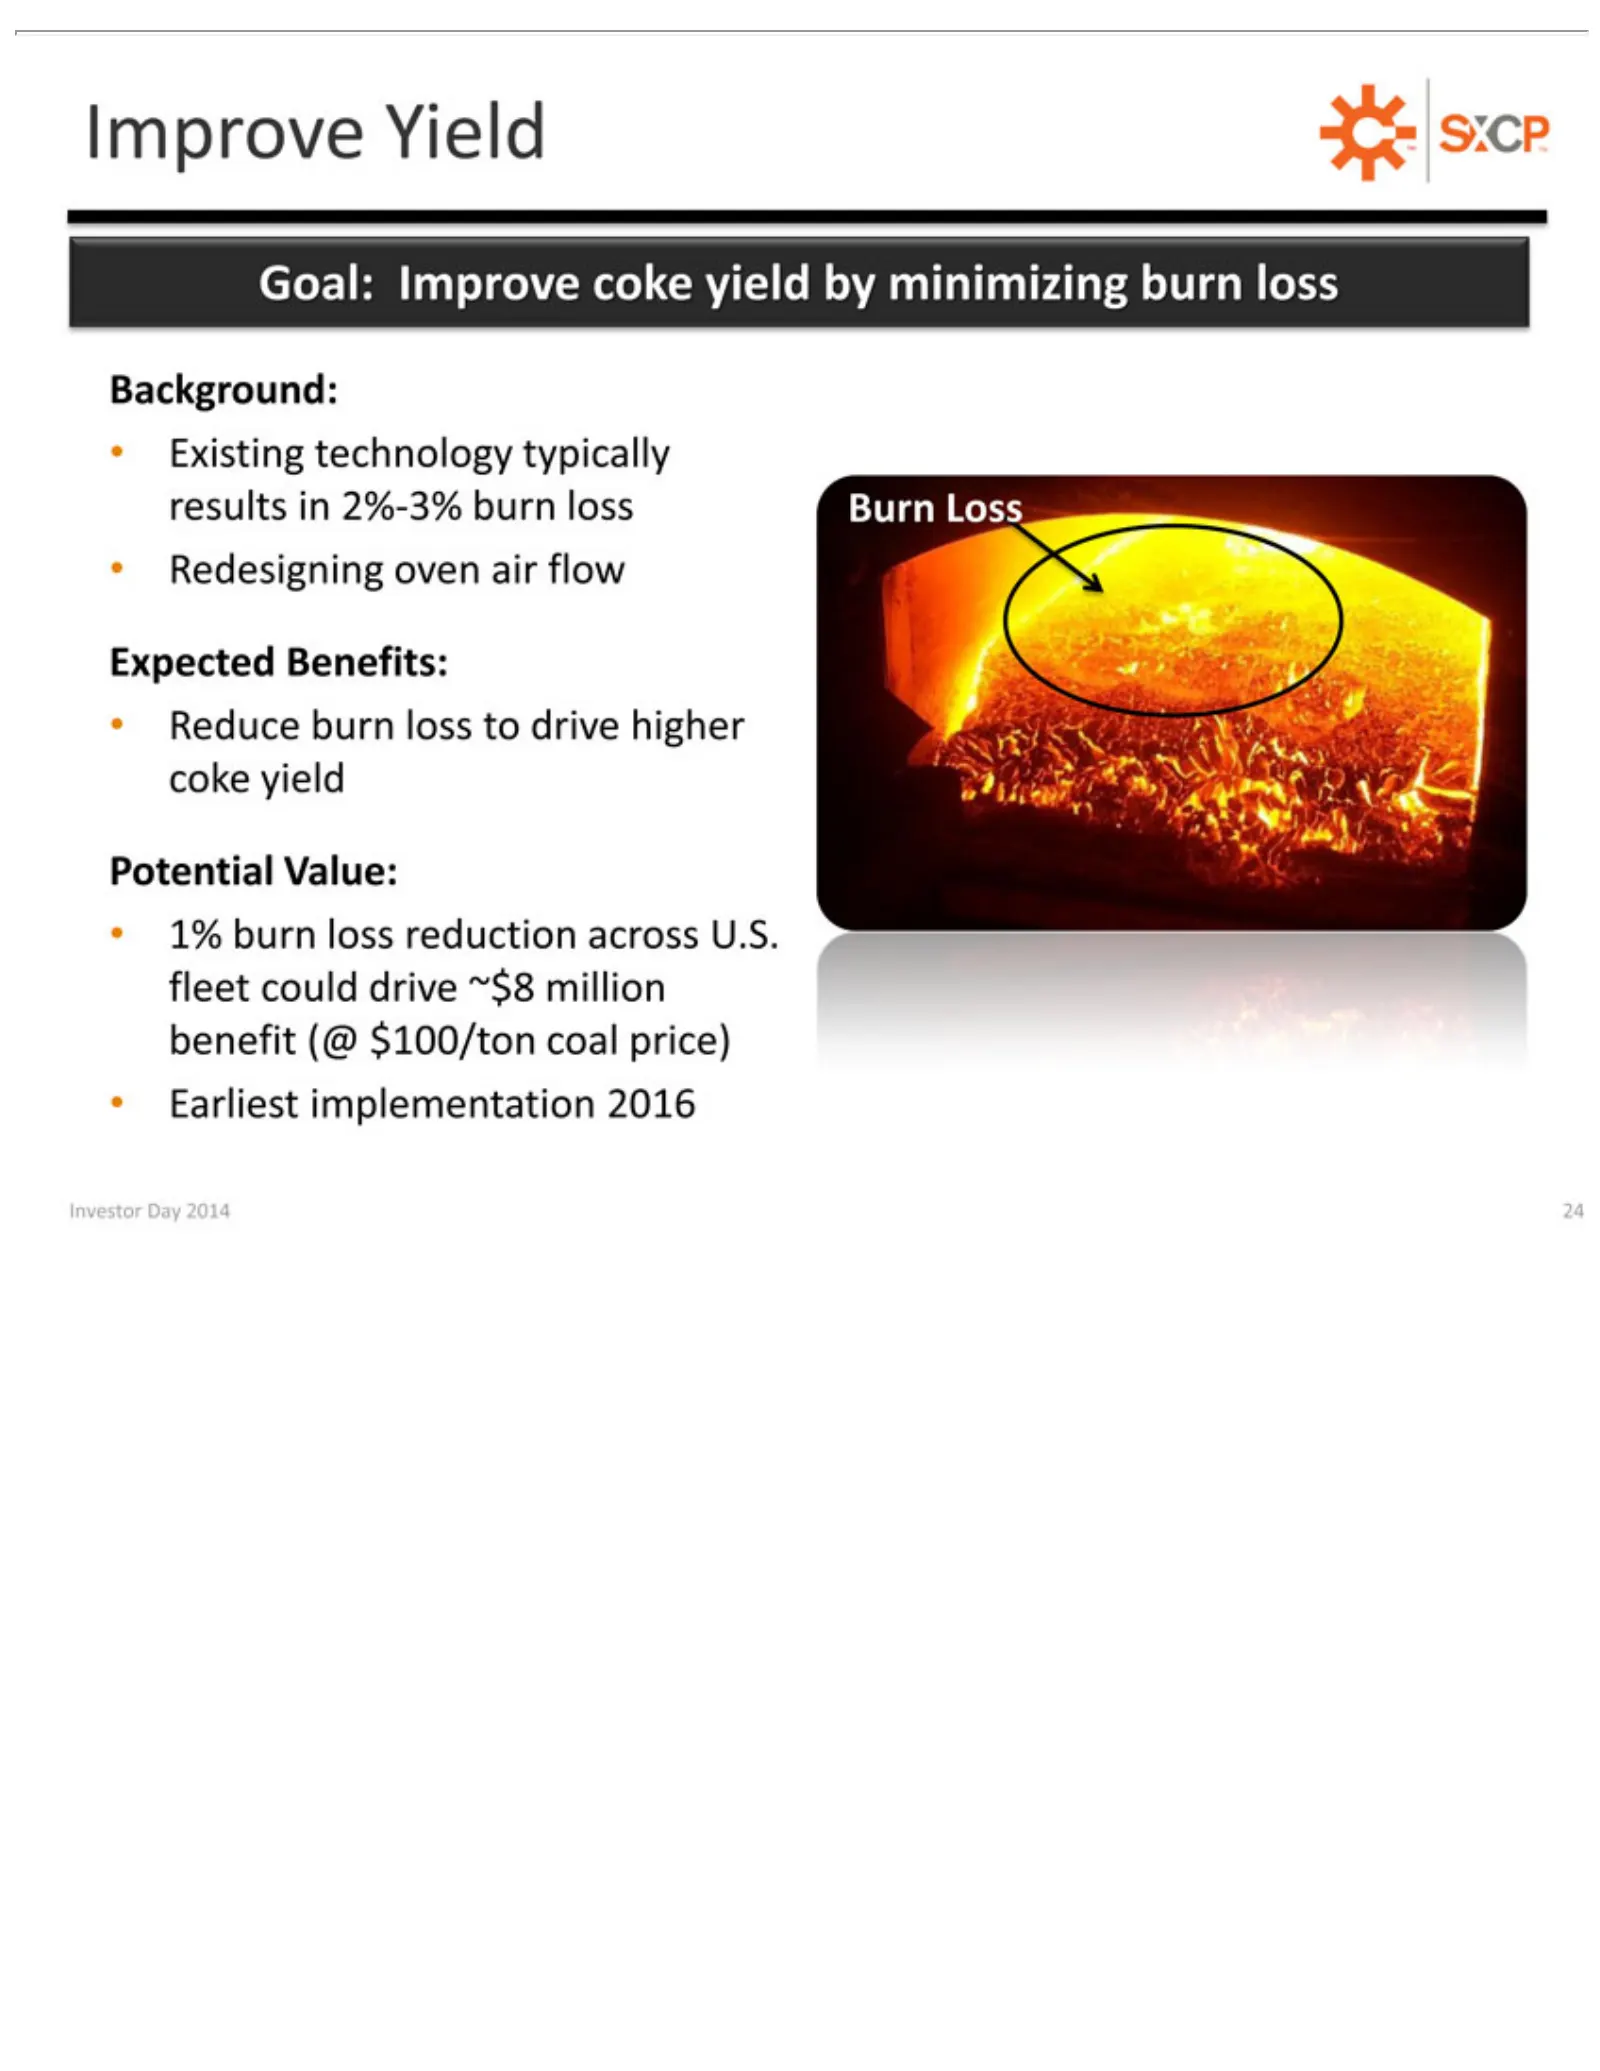
Improve Goal: Existing Background: Redesigning Expected Reduce Potential 1% Earliest Burn Investor burn Loss Improve burn implementation Day technology Yield loss Value: Benefits: oven loss 2014 reduction coke toair 24 drive yield typically flow across 2016 higher by minimizing results U.S. coke fle
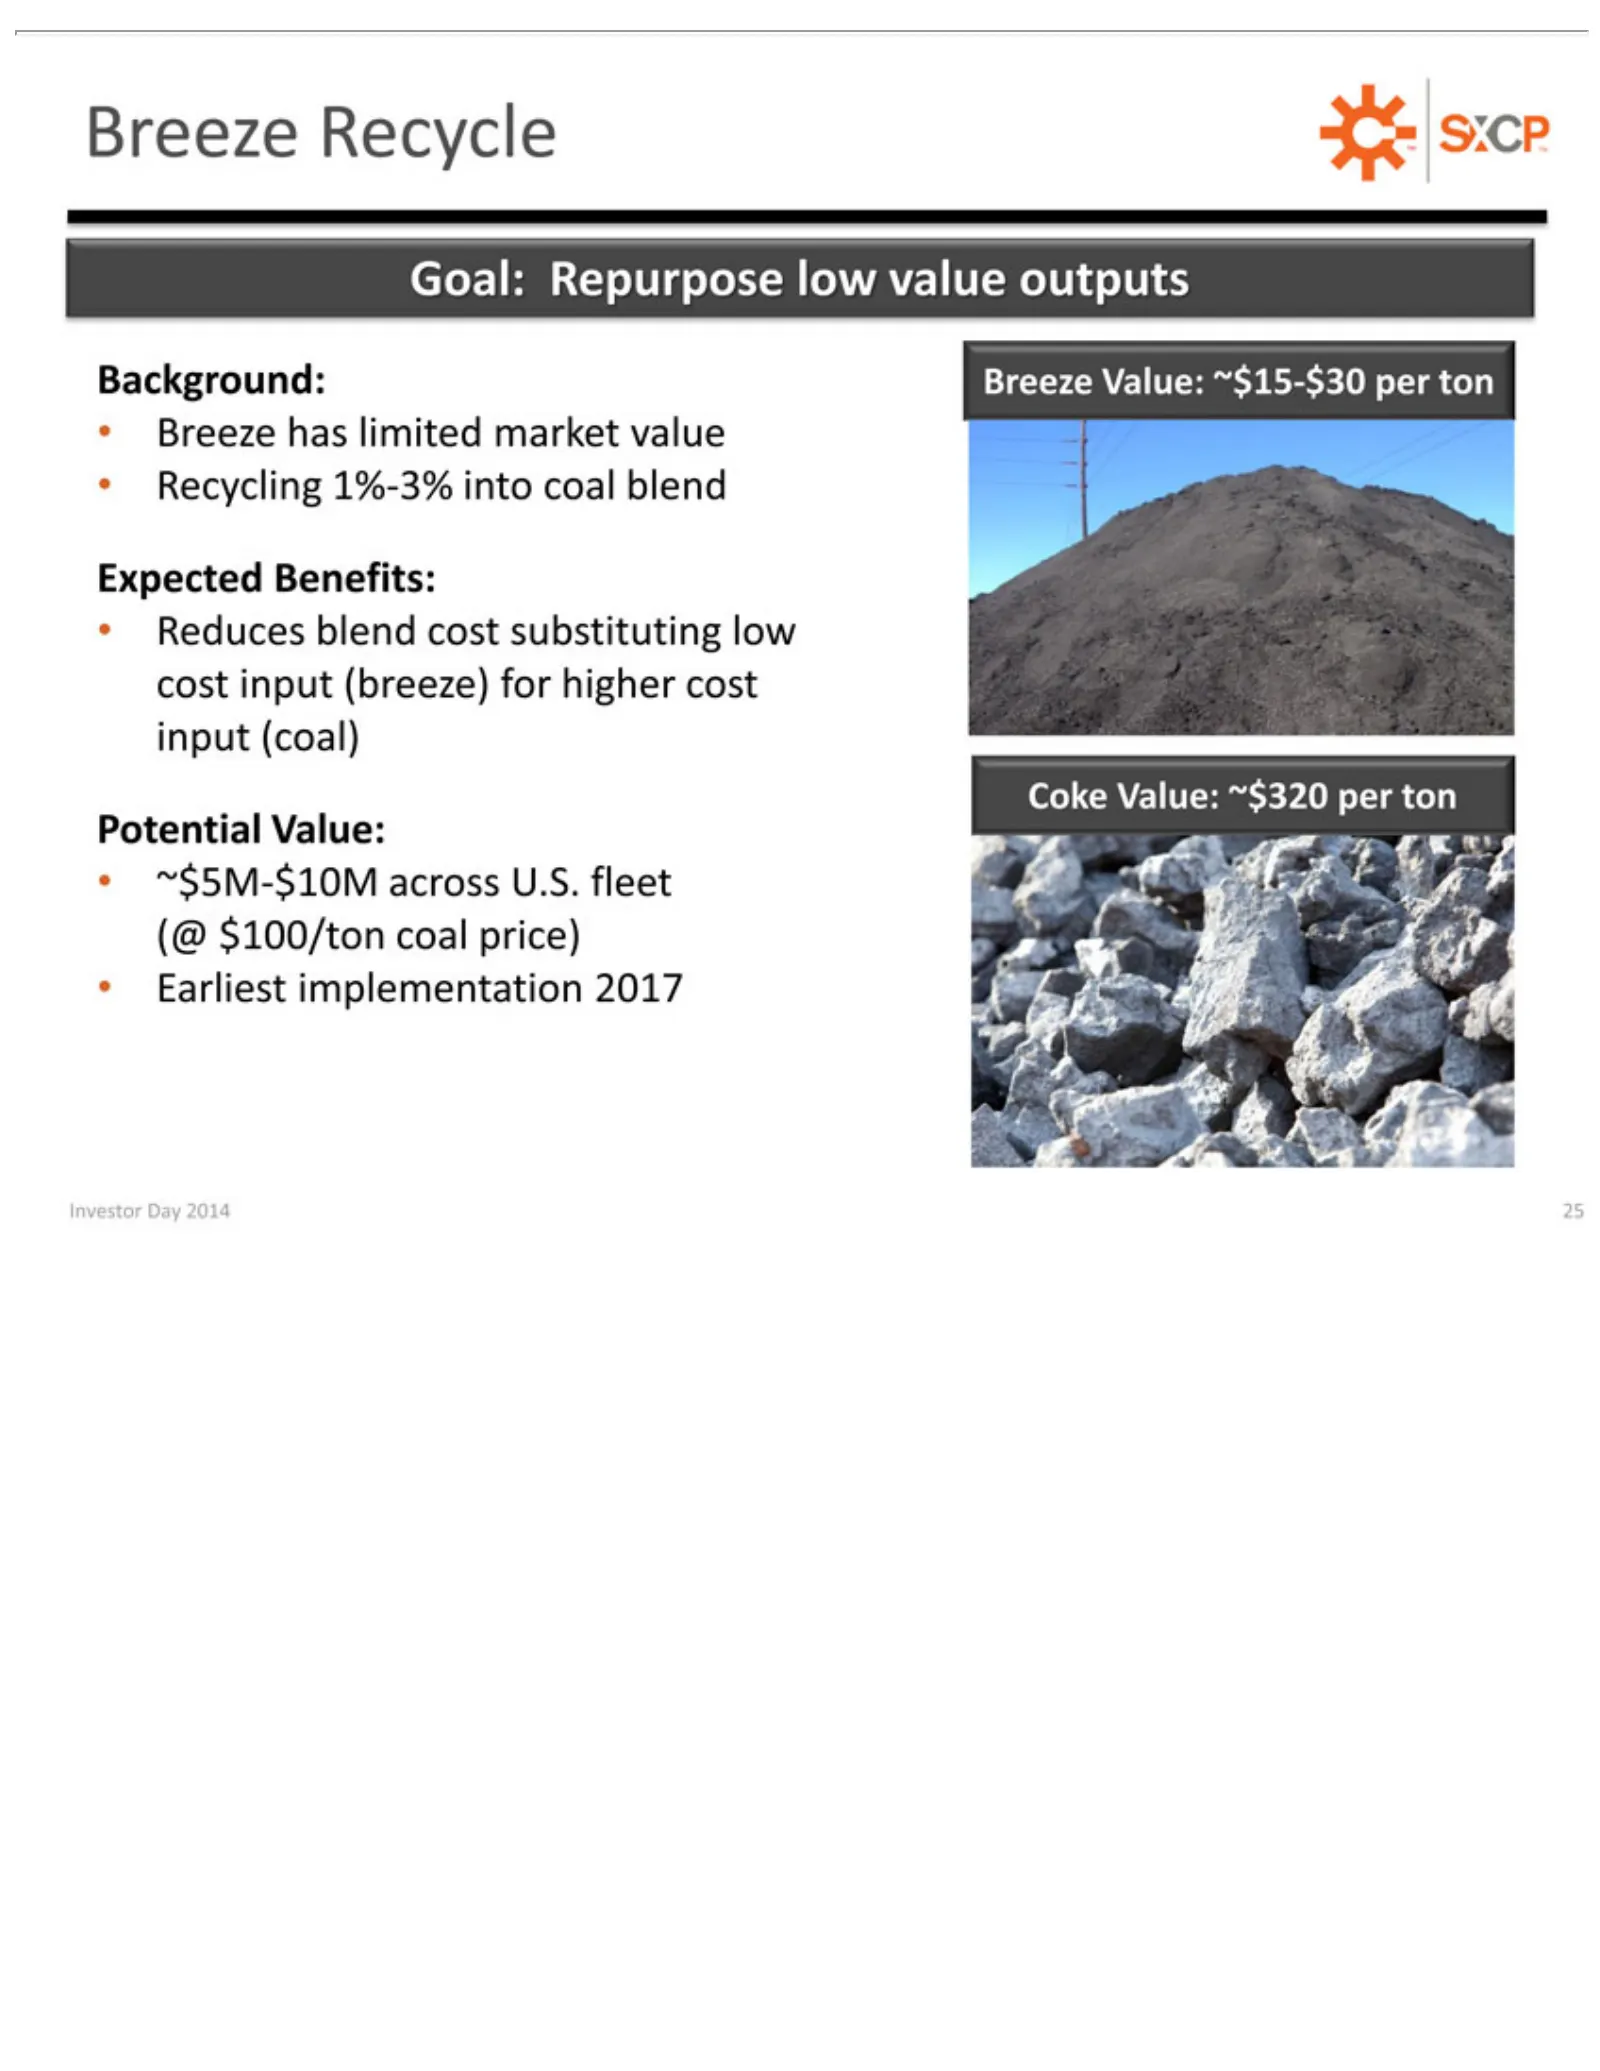
Slide 25: Recycling Breeze
Goal: Background: Recycling Expected Reduces Potential ~$5M-$10M (@ Earliest Breeze Coke Investor $100/ton Value: Repurpose Value: Recycle has implementation Day blend Value: Benefits: 1%-3% limited ~$320 coal across 2014 ~$15-$30 cost low price) into market 25 per substituting U.S. value coal ton 2
Slide 26: Indiana Harbor Refurbishment
INDIANA Investor Day HARBOR 2014 26 REFURBISHMENT
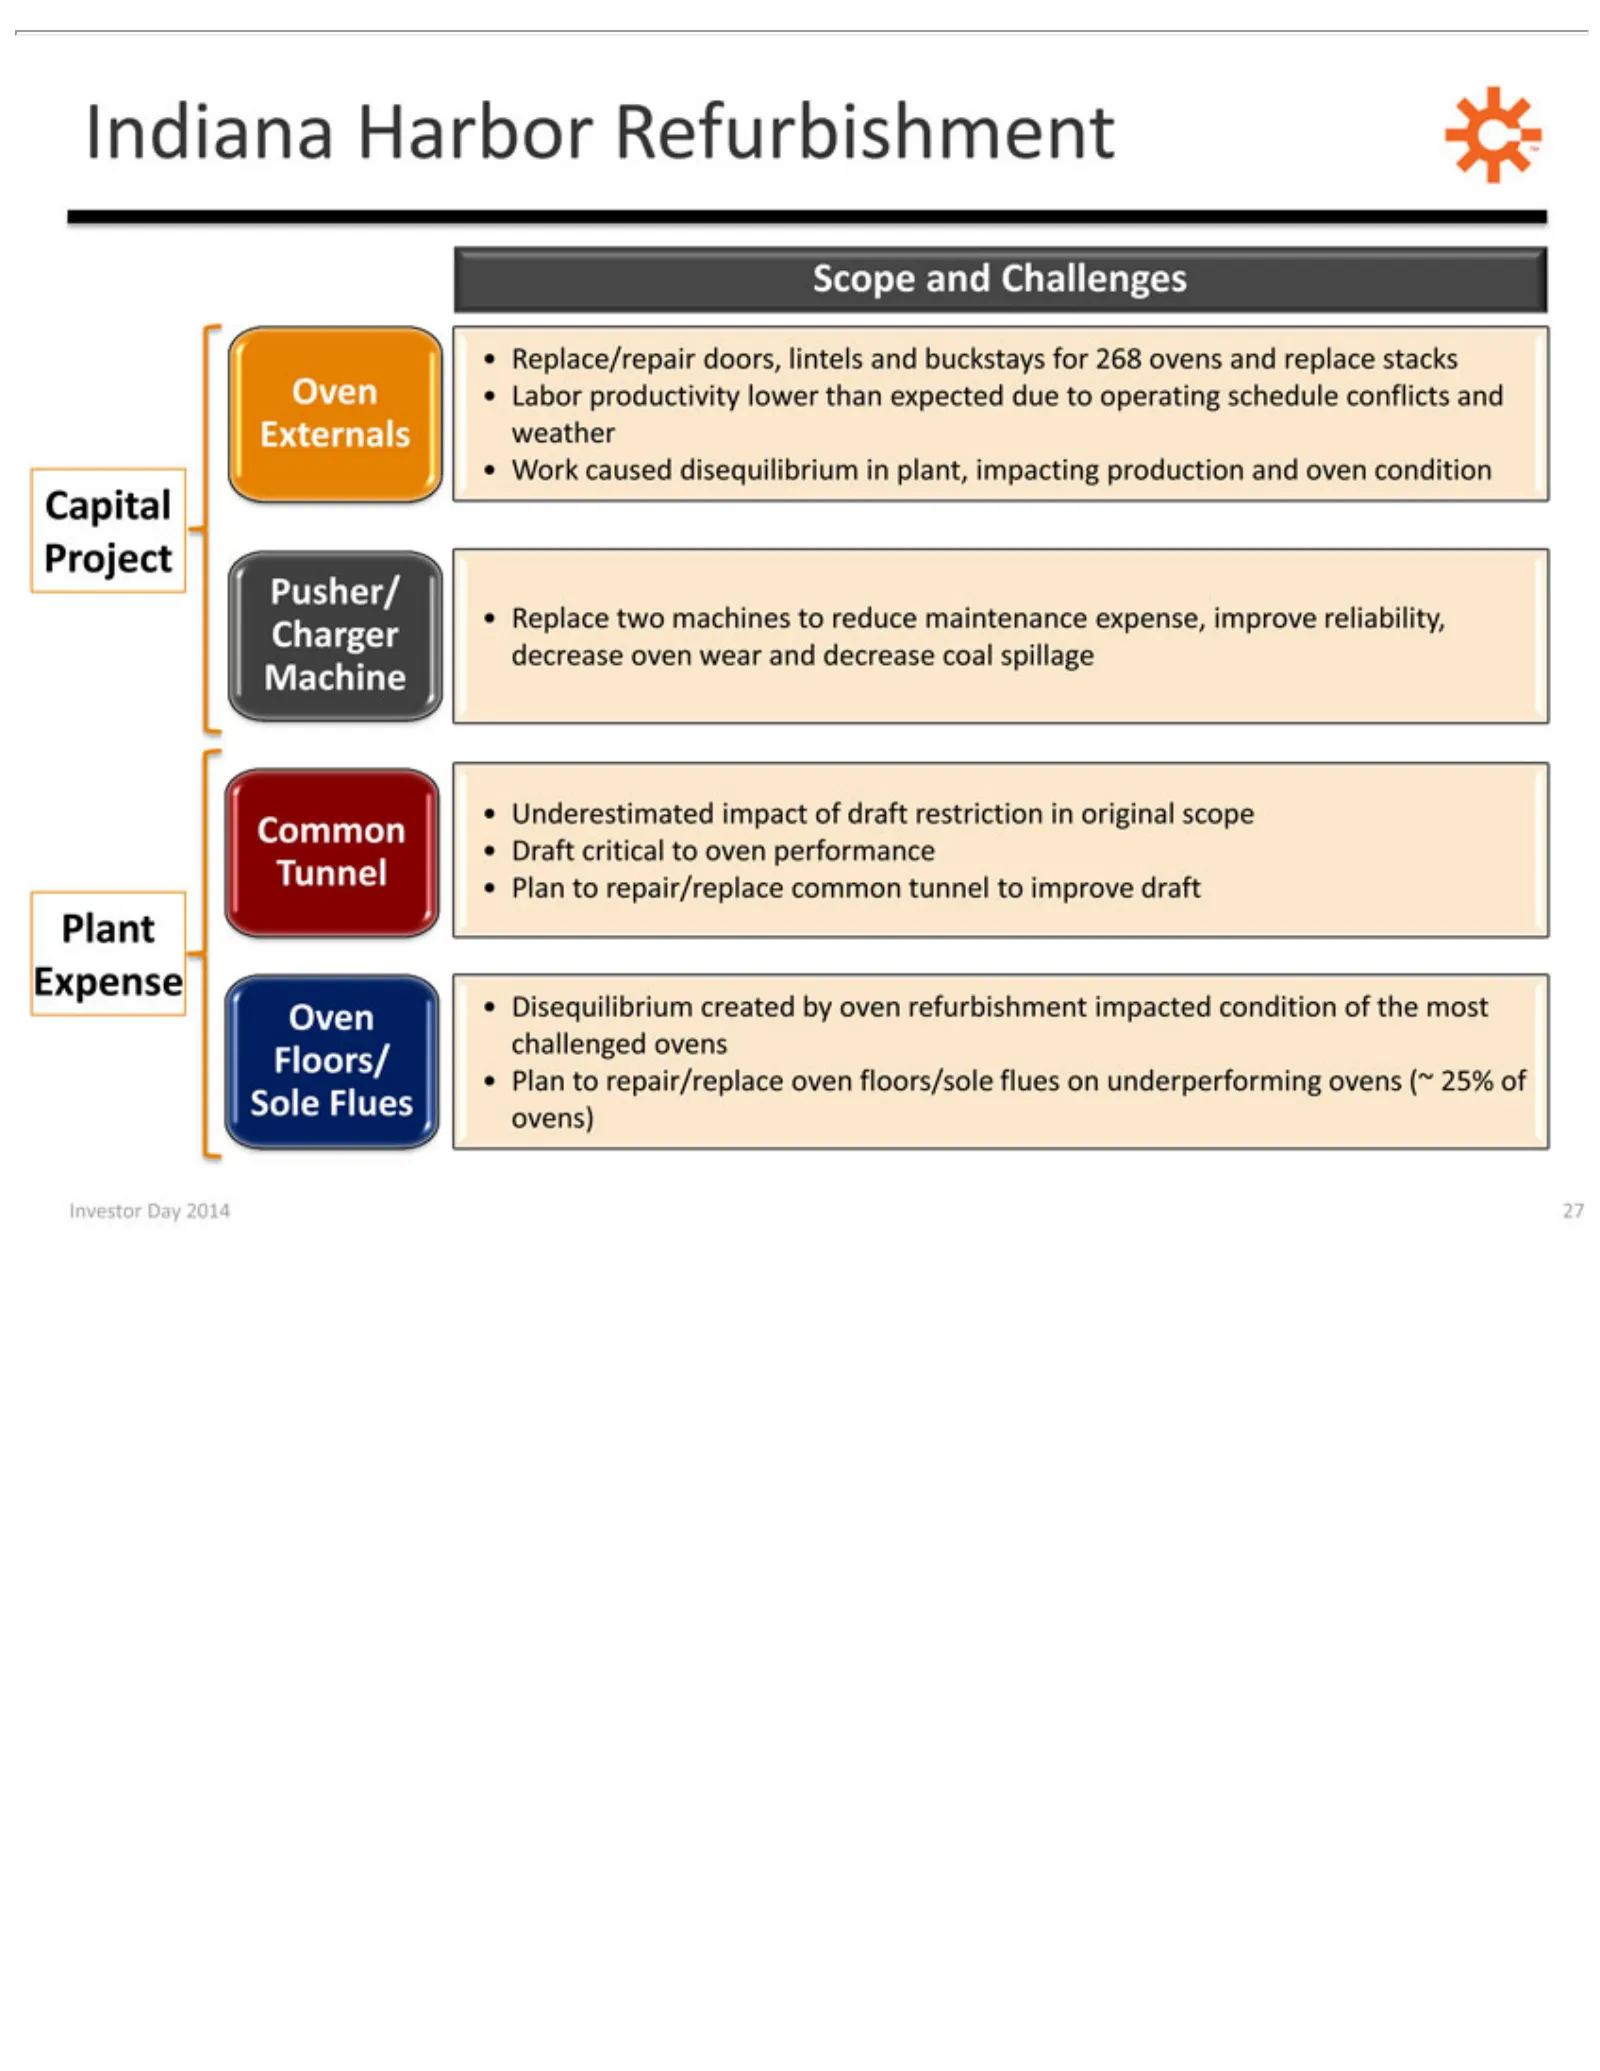
Slide 27: Indiana Harbor Capital and Expense Plan
Indiana Capital Expense Plant Pusher/ Common Sole Floors/ Oven Scope Replace/repair Labor Work Replace Underestimated Draft Disequilibrium Plan Investor Flues to critical Externals caused productivity and repair/replace Project Harbor Charger two Day Tunnel Challenges machines to disequilibrium 2014
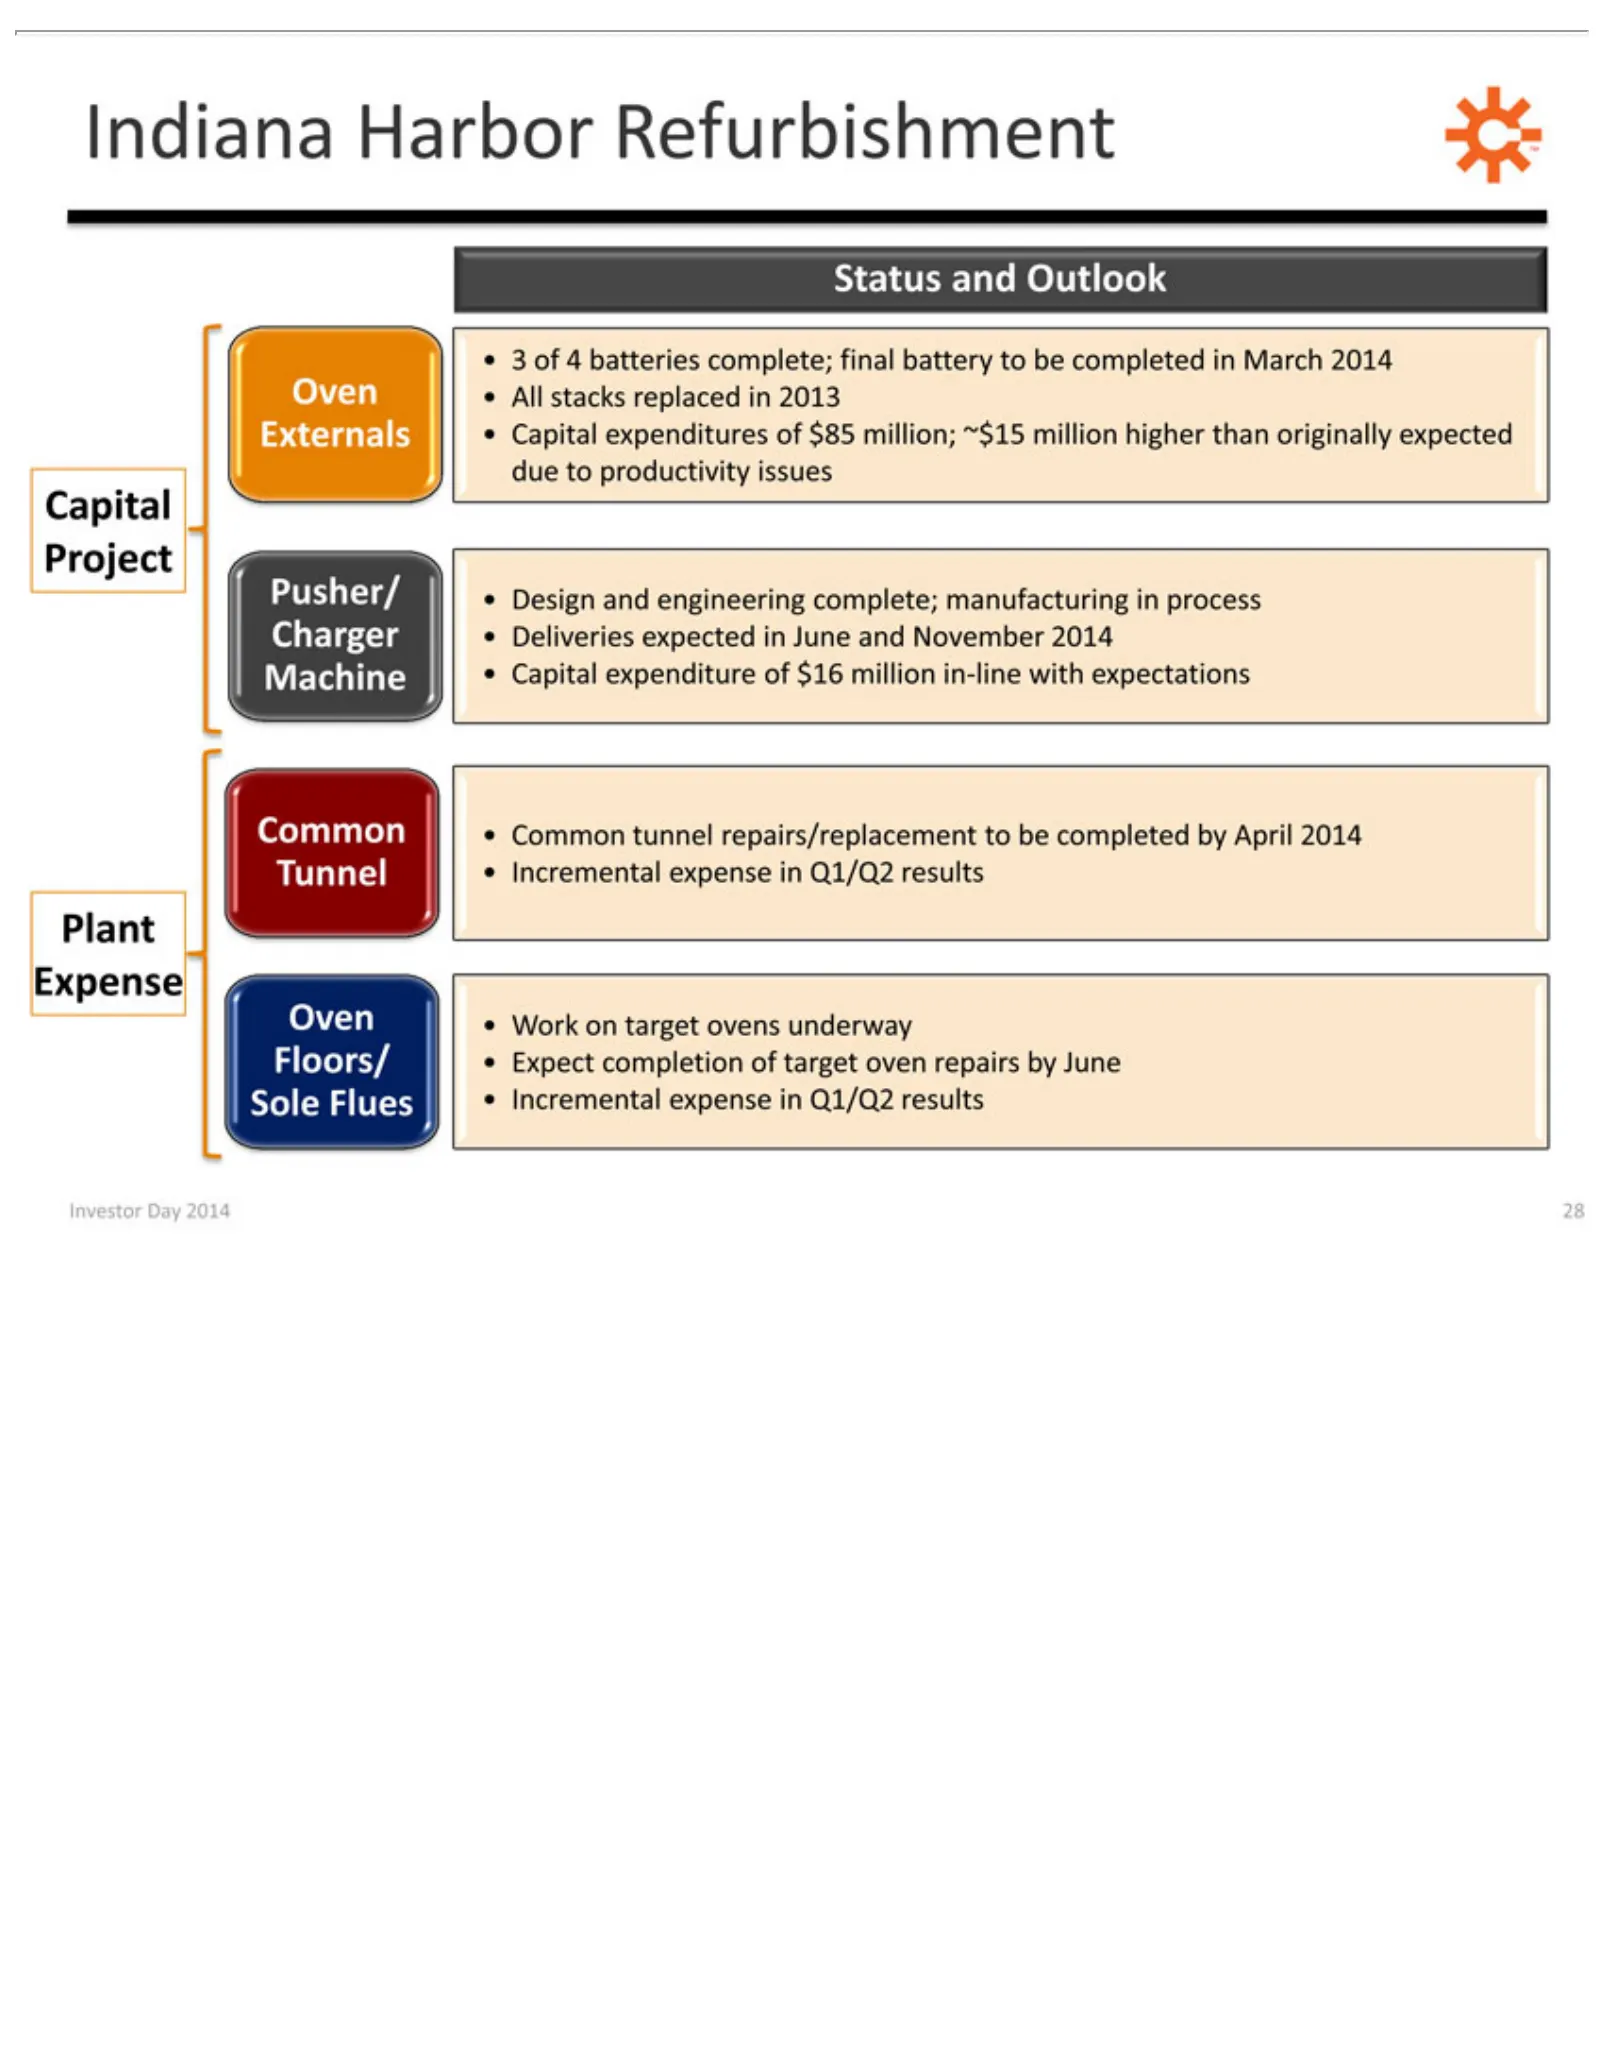
Slide 28: Indiana Harbor Status and Outlook
Indiana Pusher/ Sole Floors/ Oven 3Status All Design Deliveries Capital Common Work Expect Incremental Investor ofstacks 4Flues Externals on batteries and completion and Project expenditures expenditure Harbor Charger Day target Tunnel tunnel replaced expected Outlook engineering expense 2014 ovens
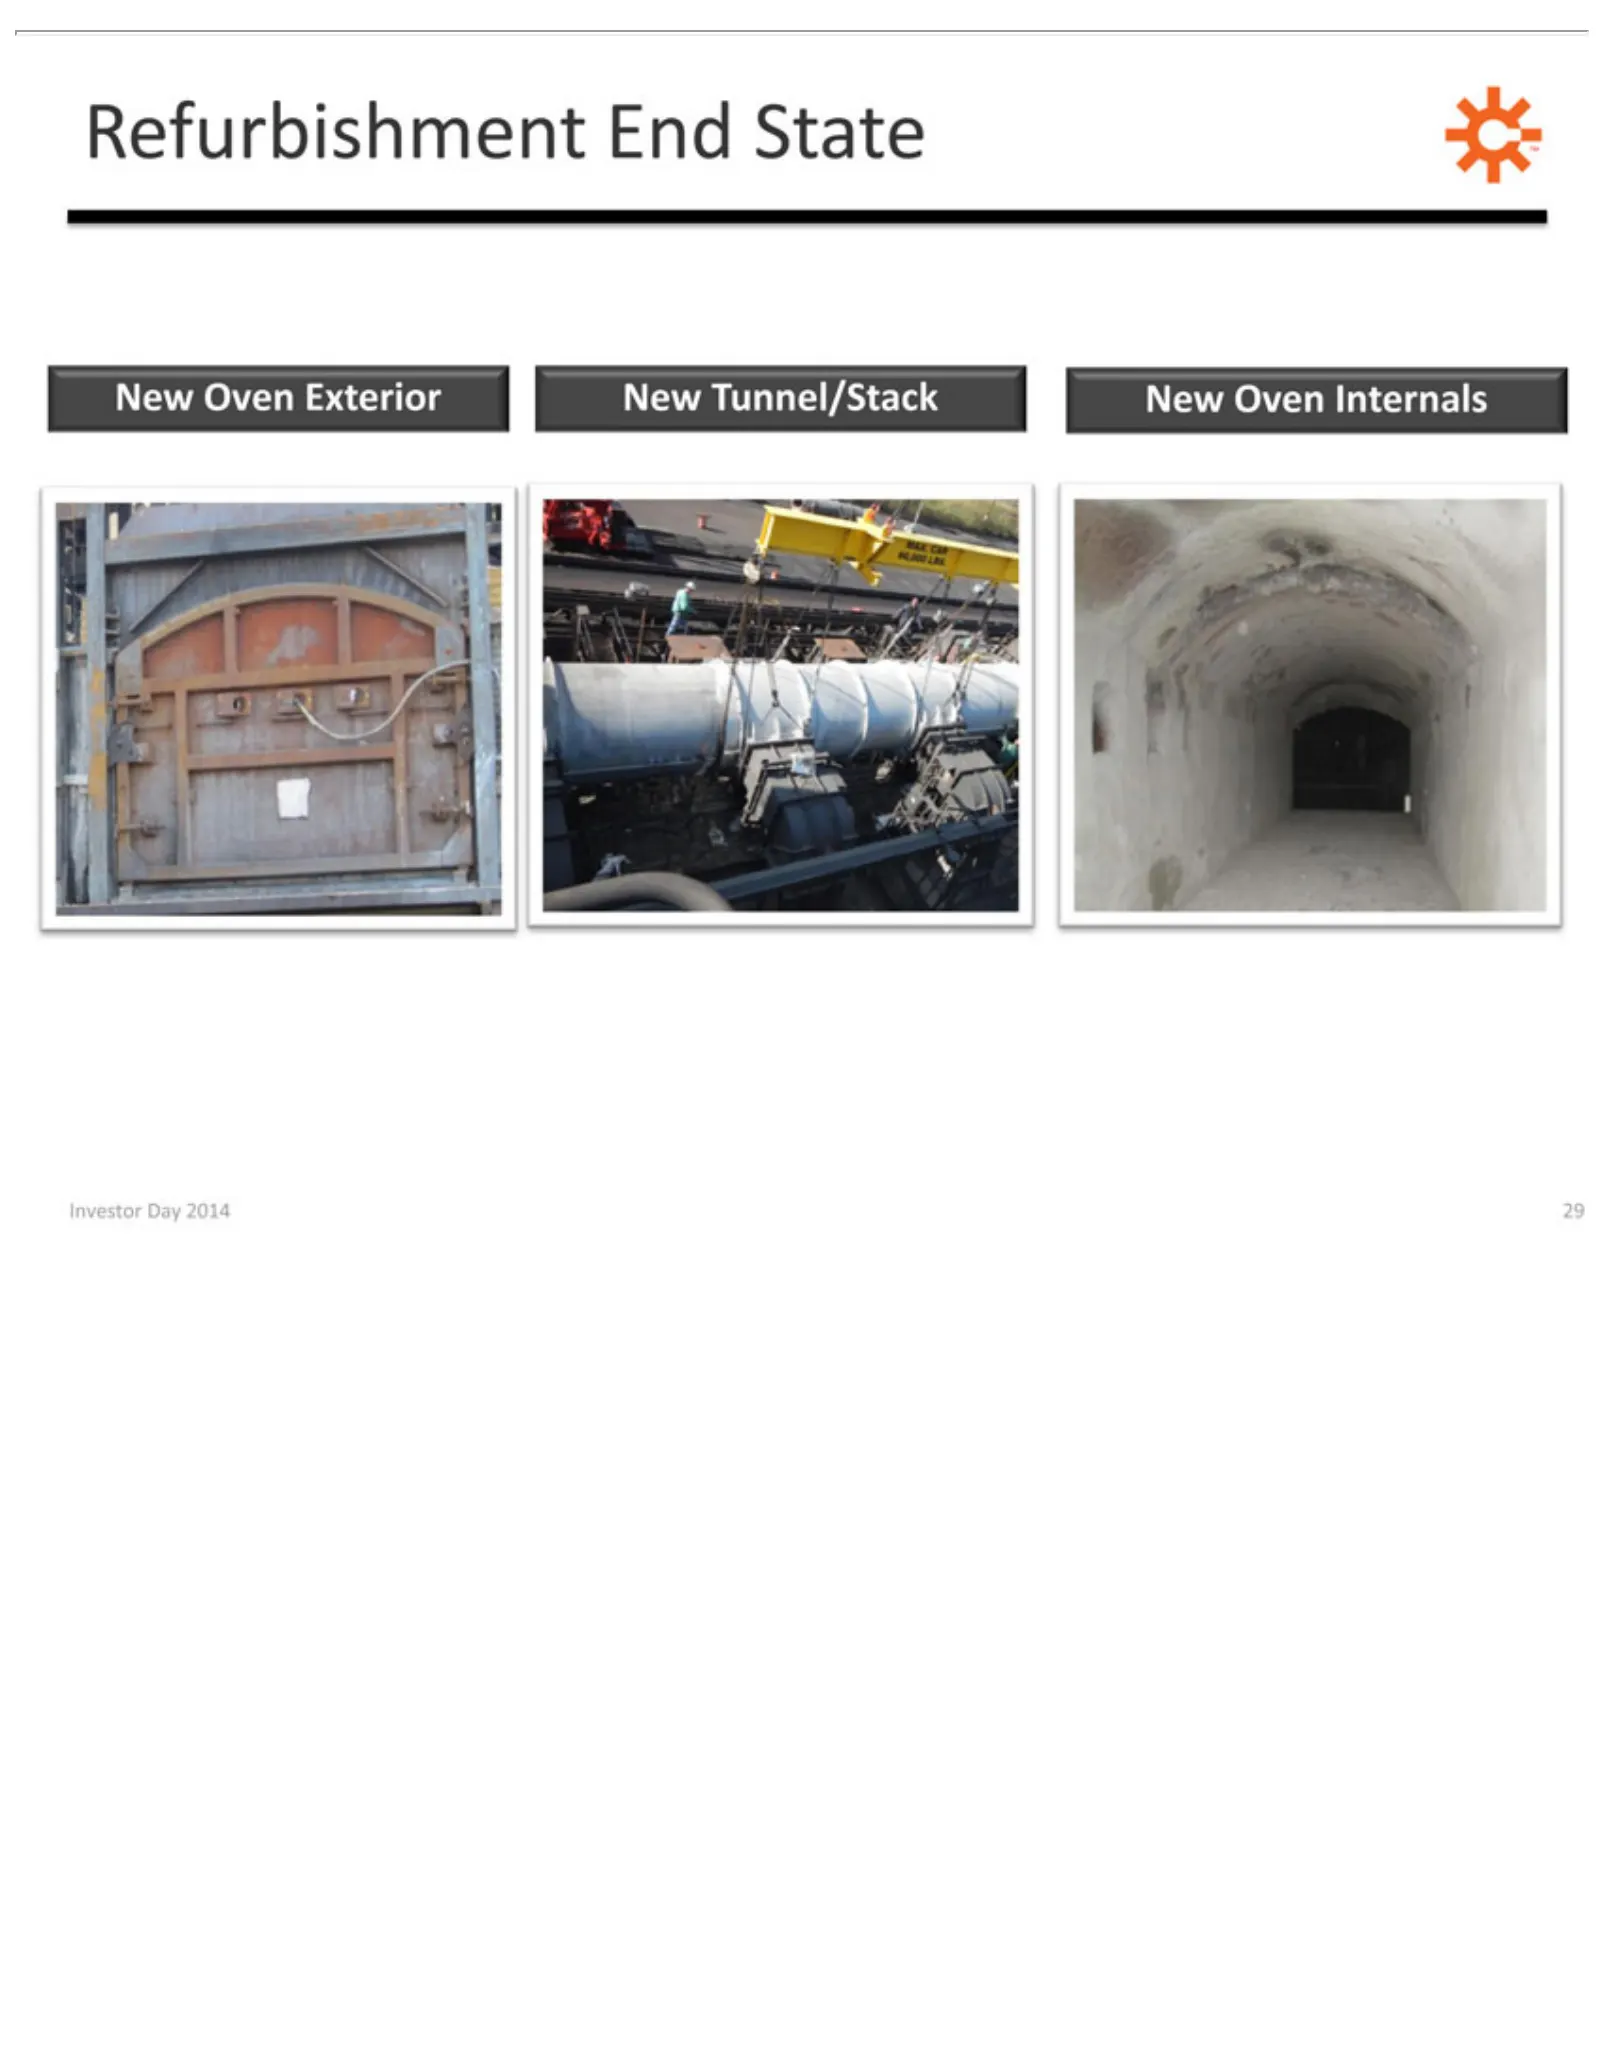
Slide 29: Refurbishment End State
Refurbishment New Investor OvenDay Exterior 2014 End29State New Tunnel/Stack New Oven Internals
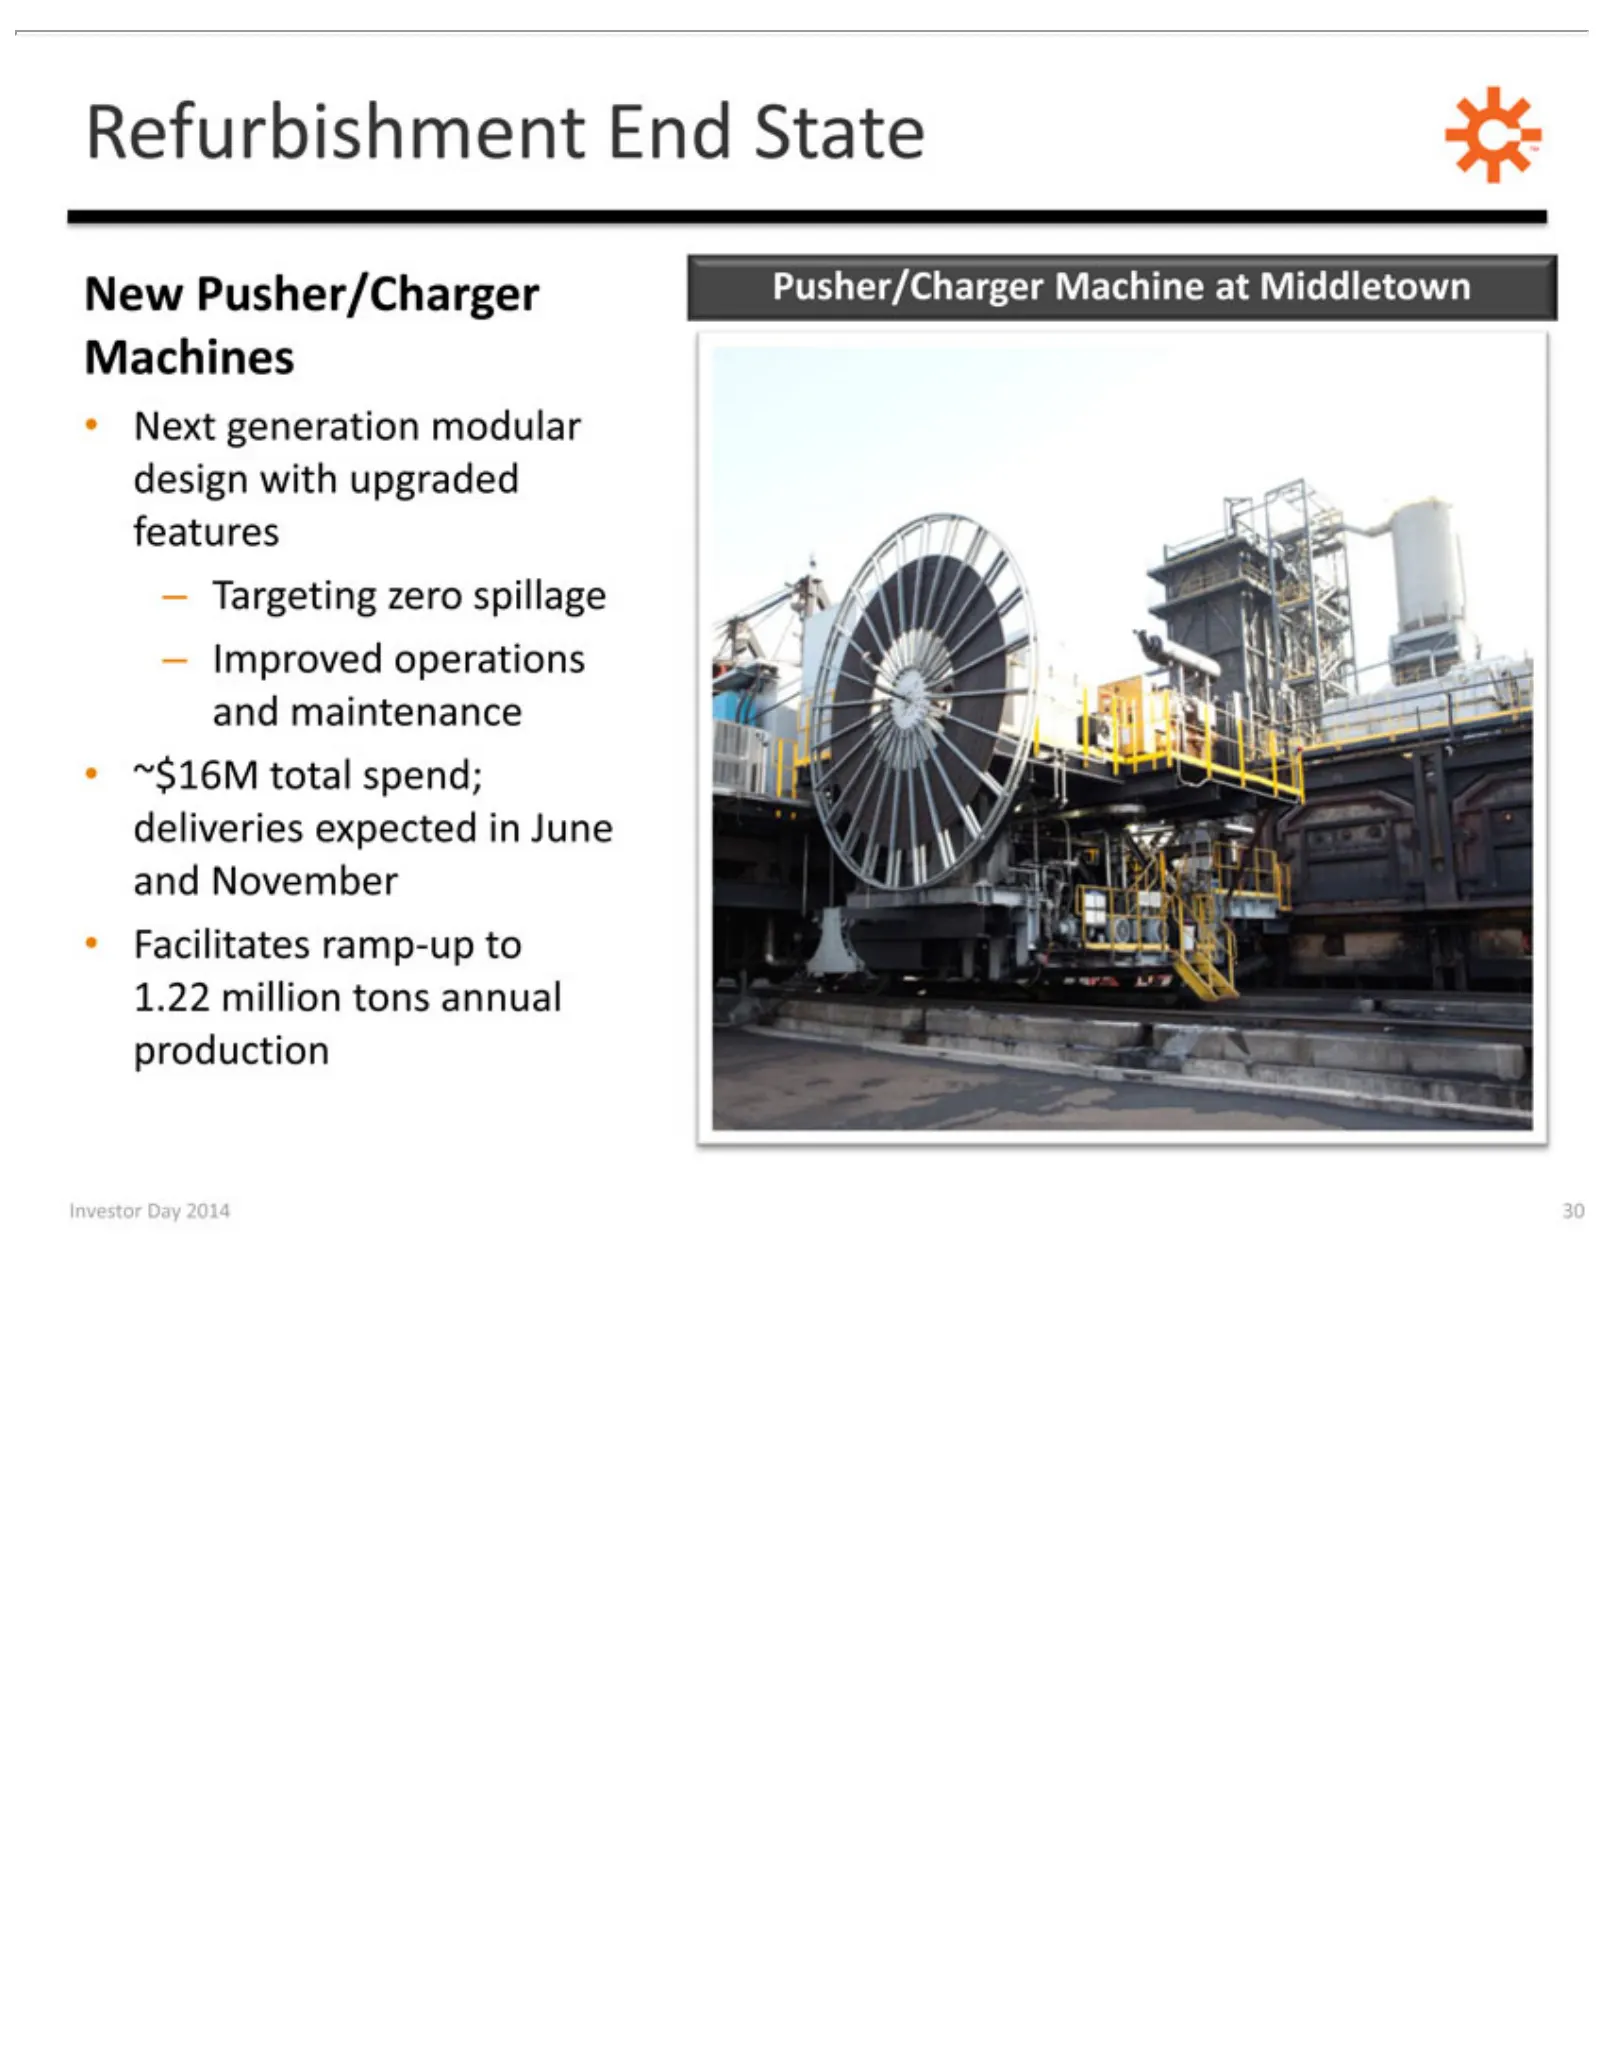
Slide 30: Refurbishment End State: New Machines
Refurbishment New Next –Machines ~$16M Facilitates Investor Targeting Improved Pusher/Charger generation total Day ramp-up zero operations spend; 2014 End modular spillage 30 to State deliveries Pusher/Charger 1.22 and design maintenance million expected with tons Machine upgraded in annual Juneat p
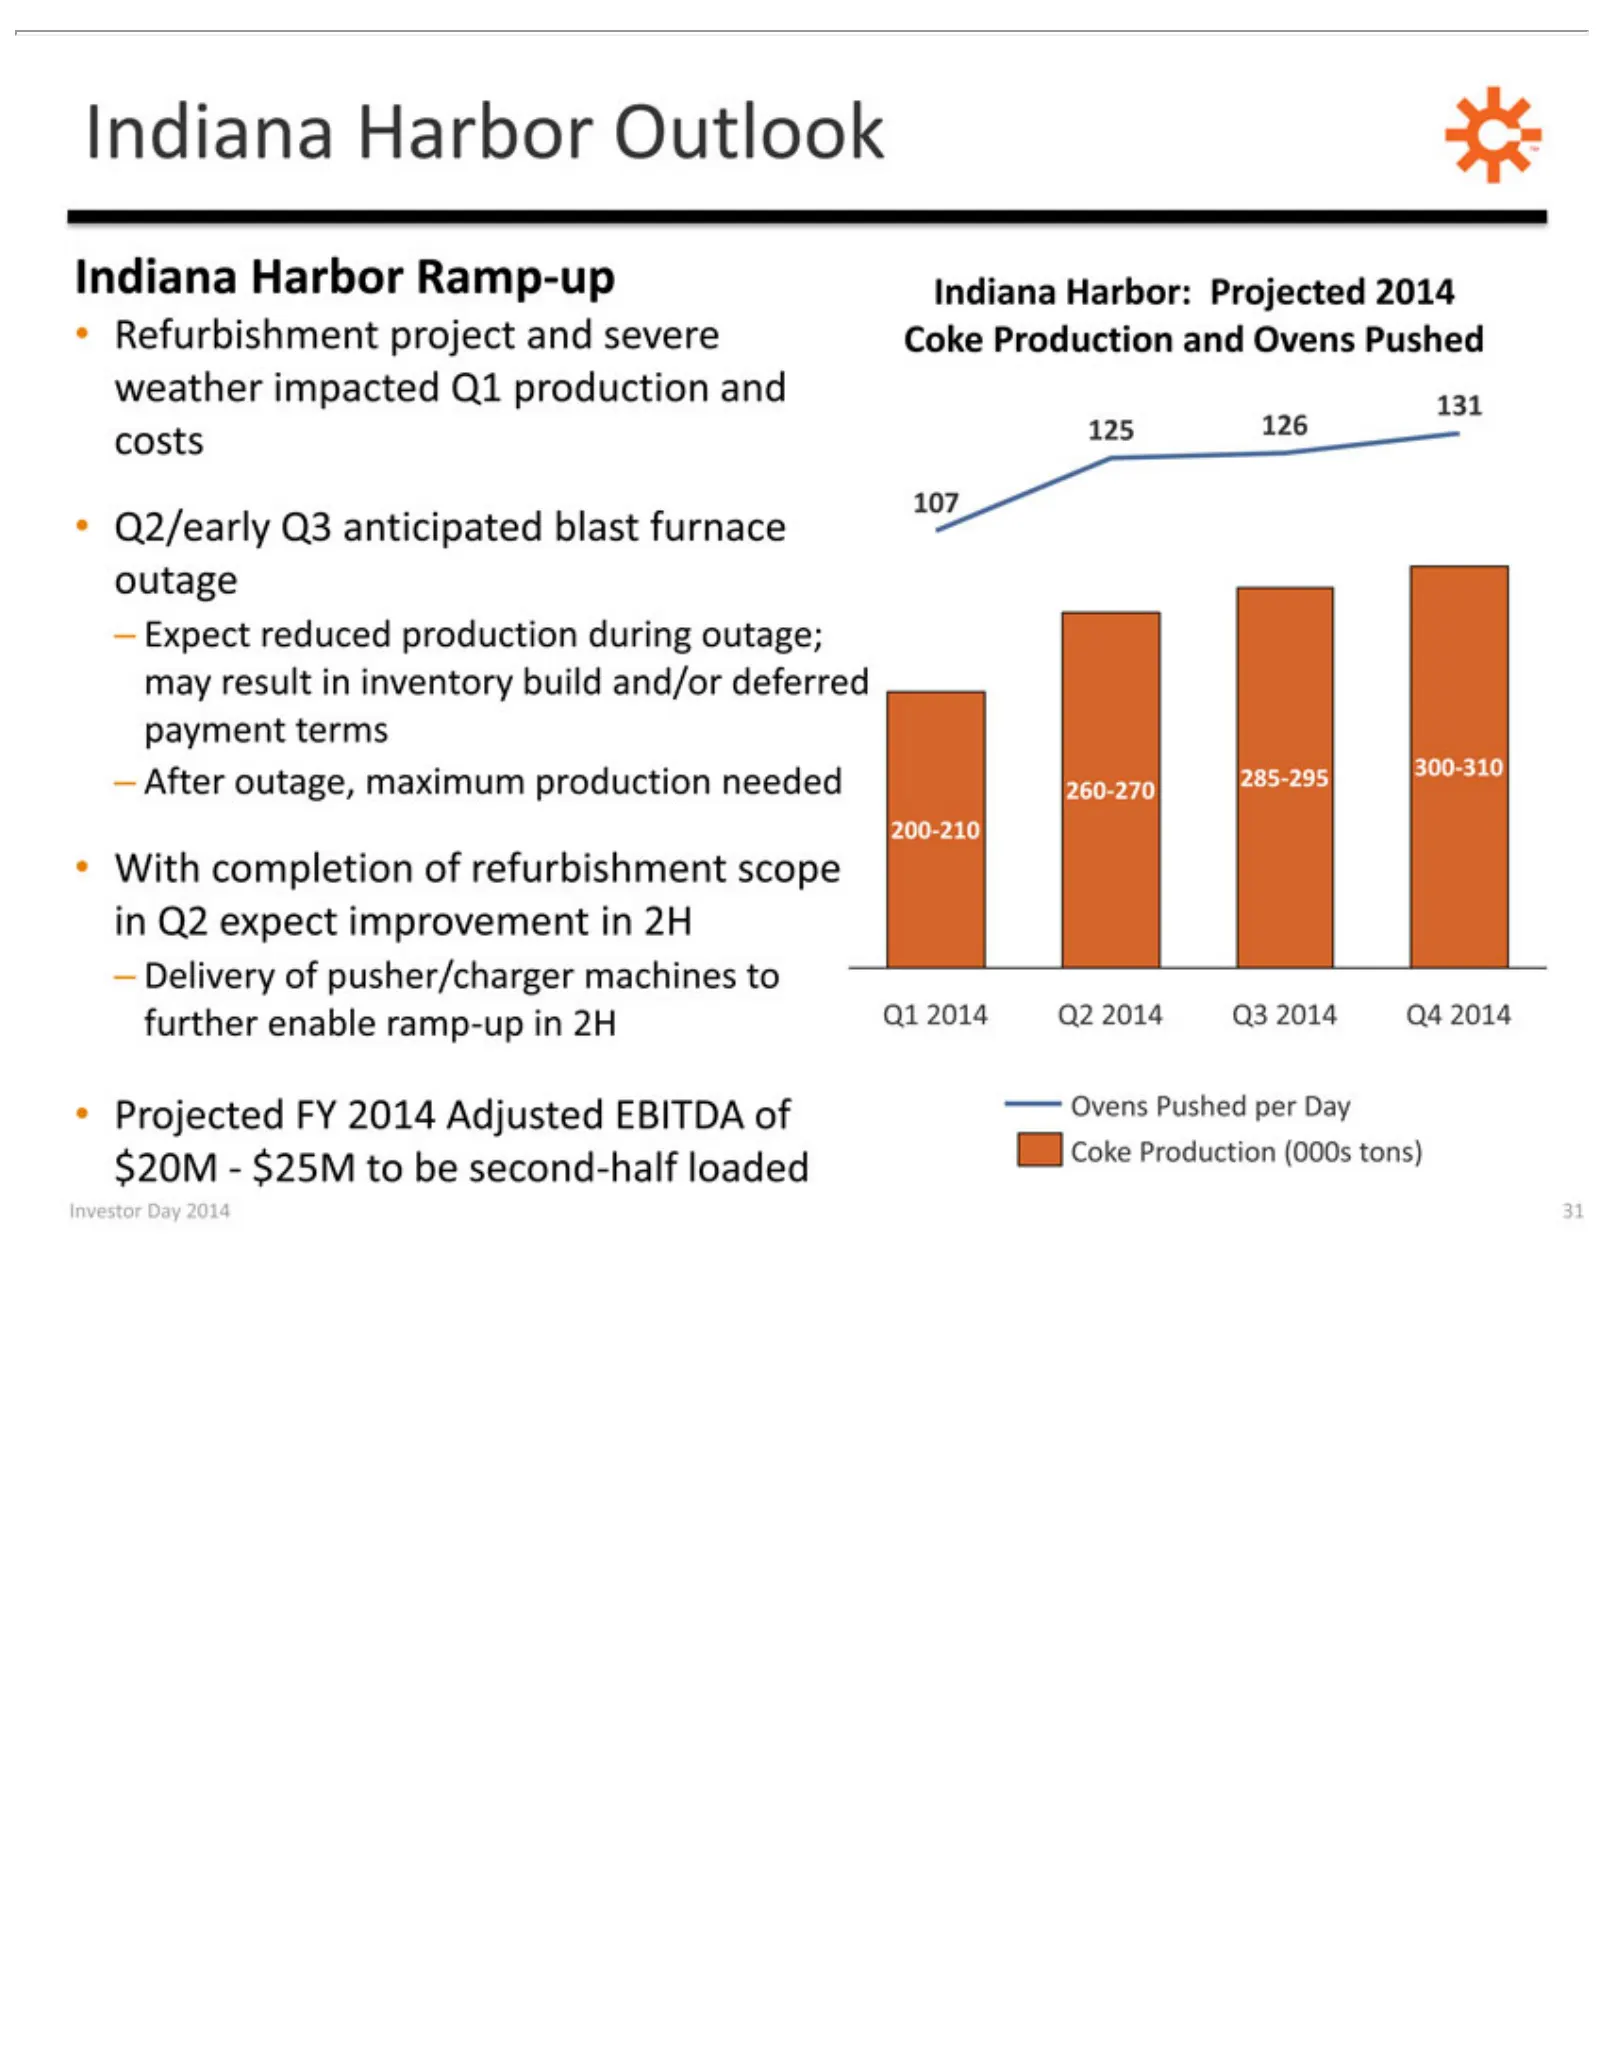
Slide 31: Indiana Harbor Refurbishment and Production Outlook
Indiana Refurbishment Q2/early 131 300-310 260-270 –With Projected Investor After Expect Delivery completion outage, Harbor Day 200-210 Q3 reduced FY ofanticipated 2014 pusher/charger project maximum Outlook Ramp-up of production 31 Adjusted refurbishment and TM blast Indiana production severe EBITD
Slide 32: Potential New Coke Plant
POTENTIAL Investor Day 2014 NEW32COKE PLANT
Slide 33: New Site/Plant Attributes
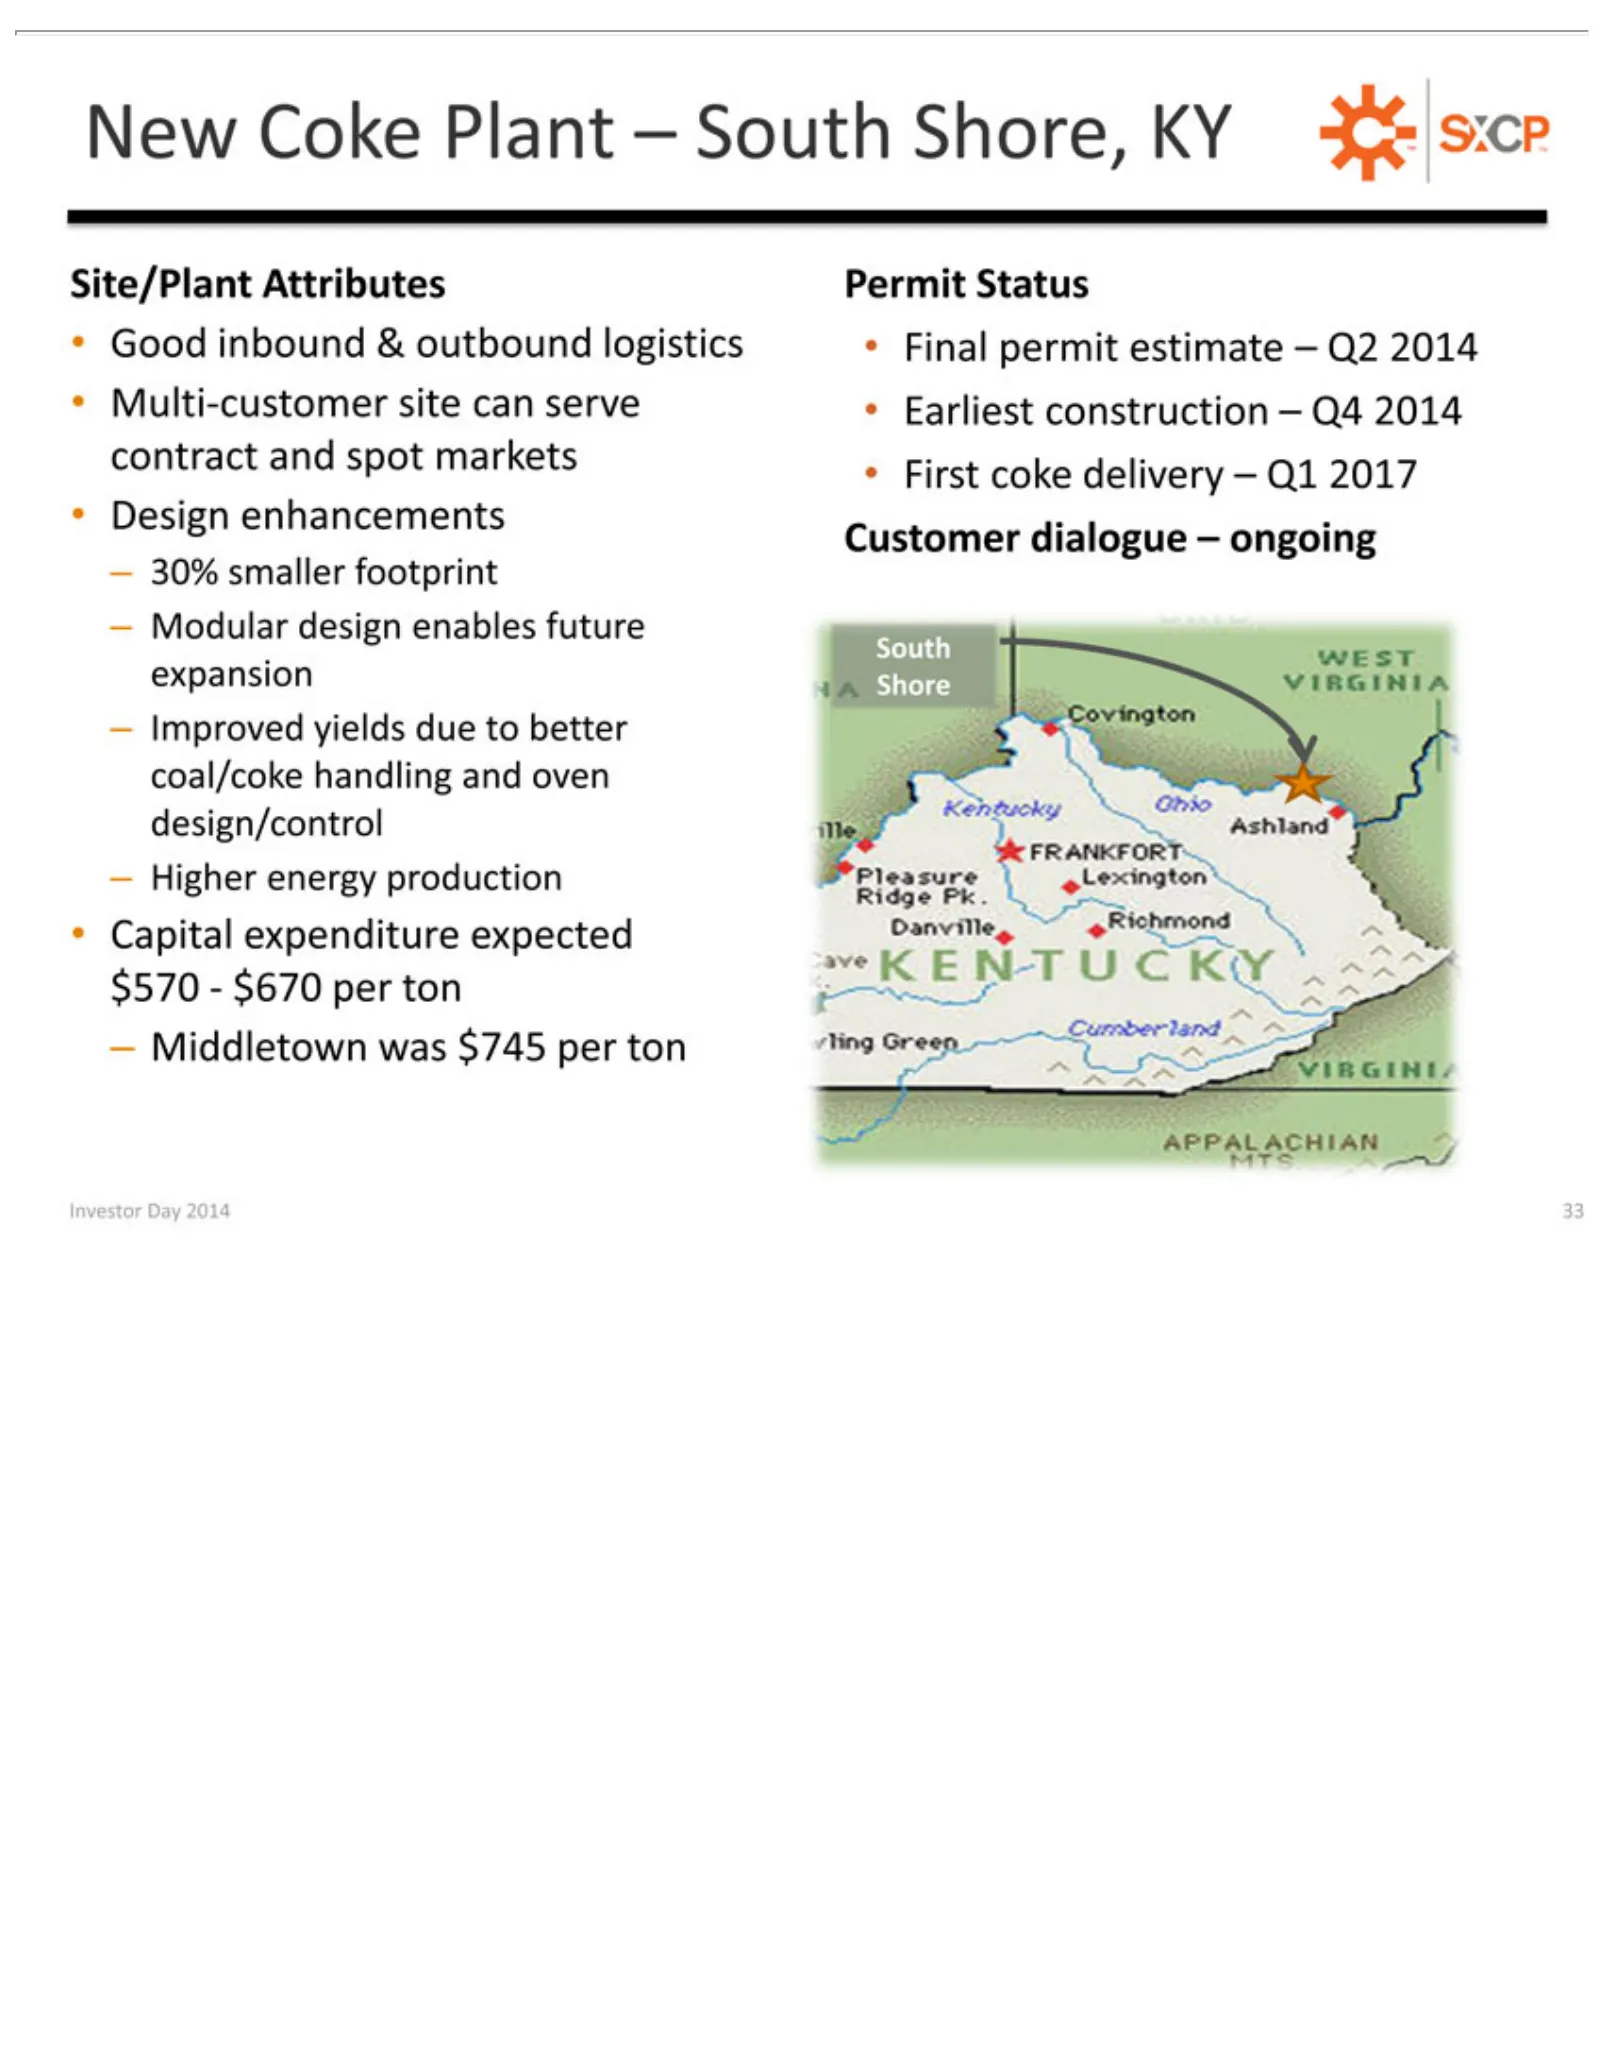
New Site/Plant Good Multi-customer First Design Customer expansion South –Capital Investor 30%coke Modular Improved Higher Middletown Coke inbound smaller enhancements expenditure Day energy Attributes dialogue delivery Shore design Plant yields 2014 was & footprint site production –outbound enables
Slide 34: Proposed New Coke Plant Site
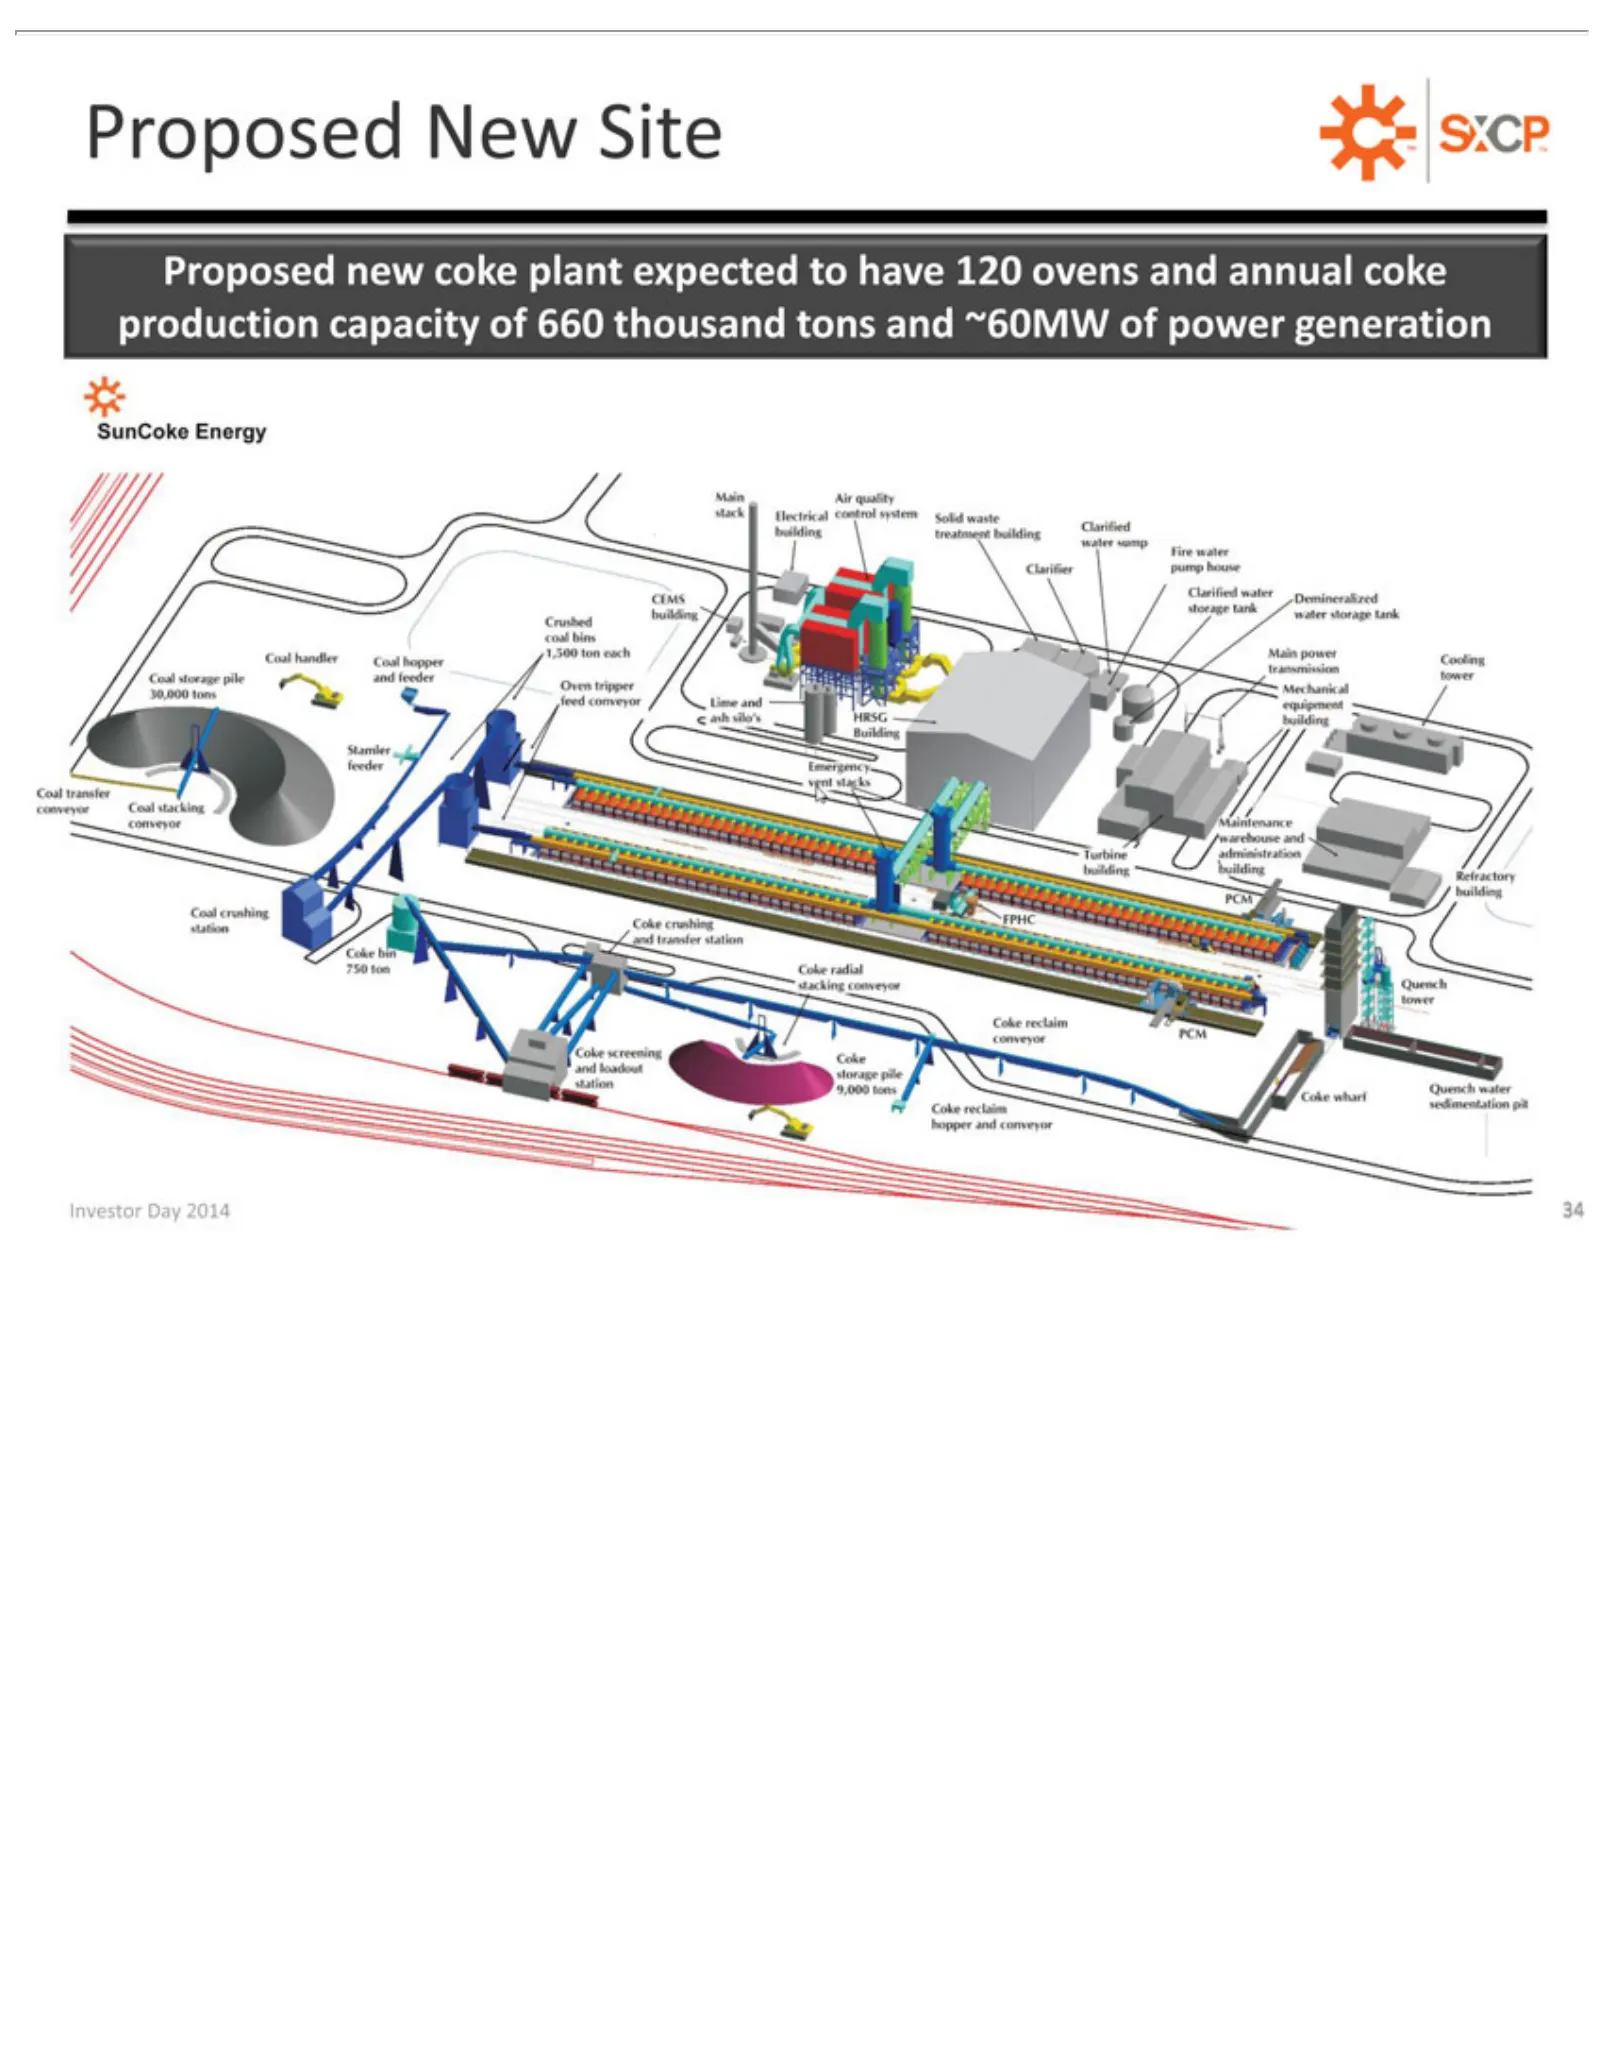
ProposedDay Investor New2014 new coke Site34 TM plant expected to have 120 ovens and annual coke production capacity of 660 thousand tons and ~60MW of power generation
Slide 35: Coal Logistics
COAL LOGISTICS Investor Day 2014 35
Slide 36: Experienced Coal Logistics Platform
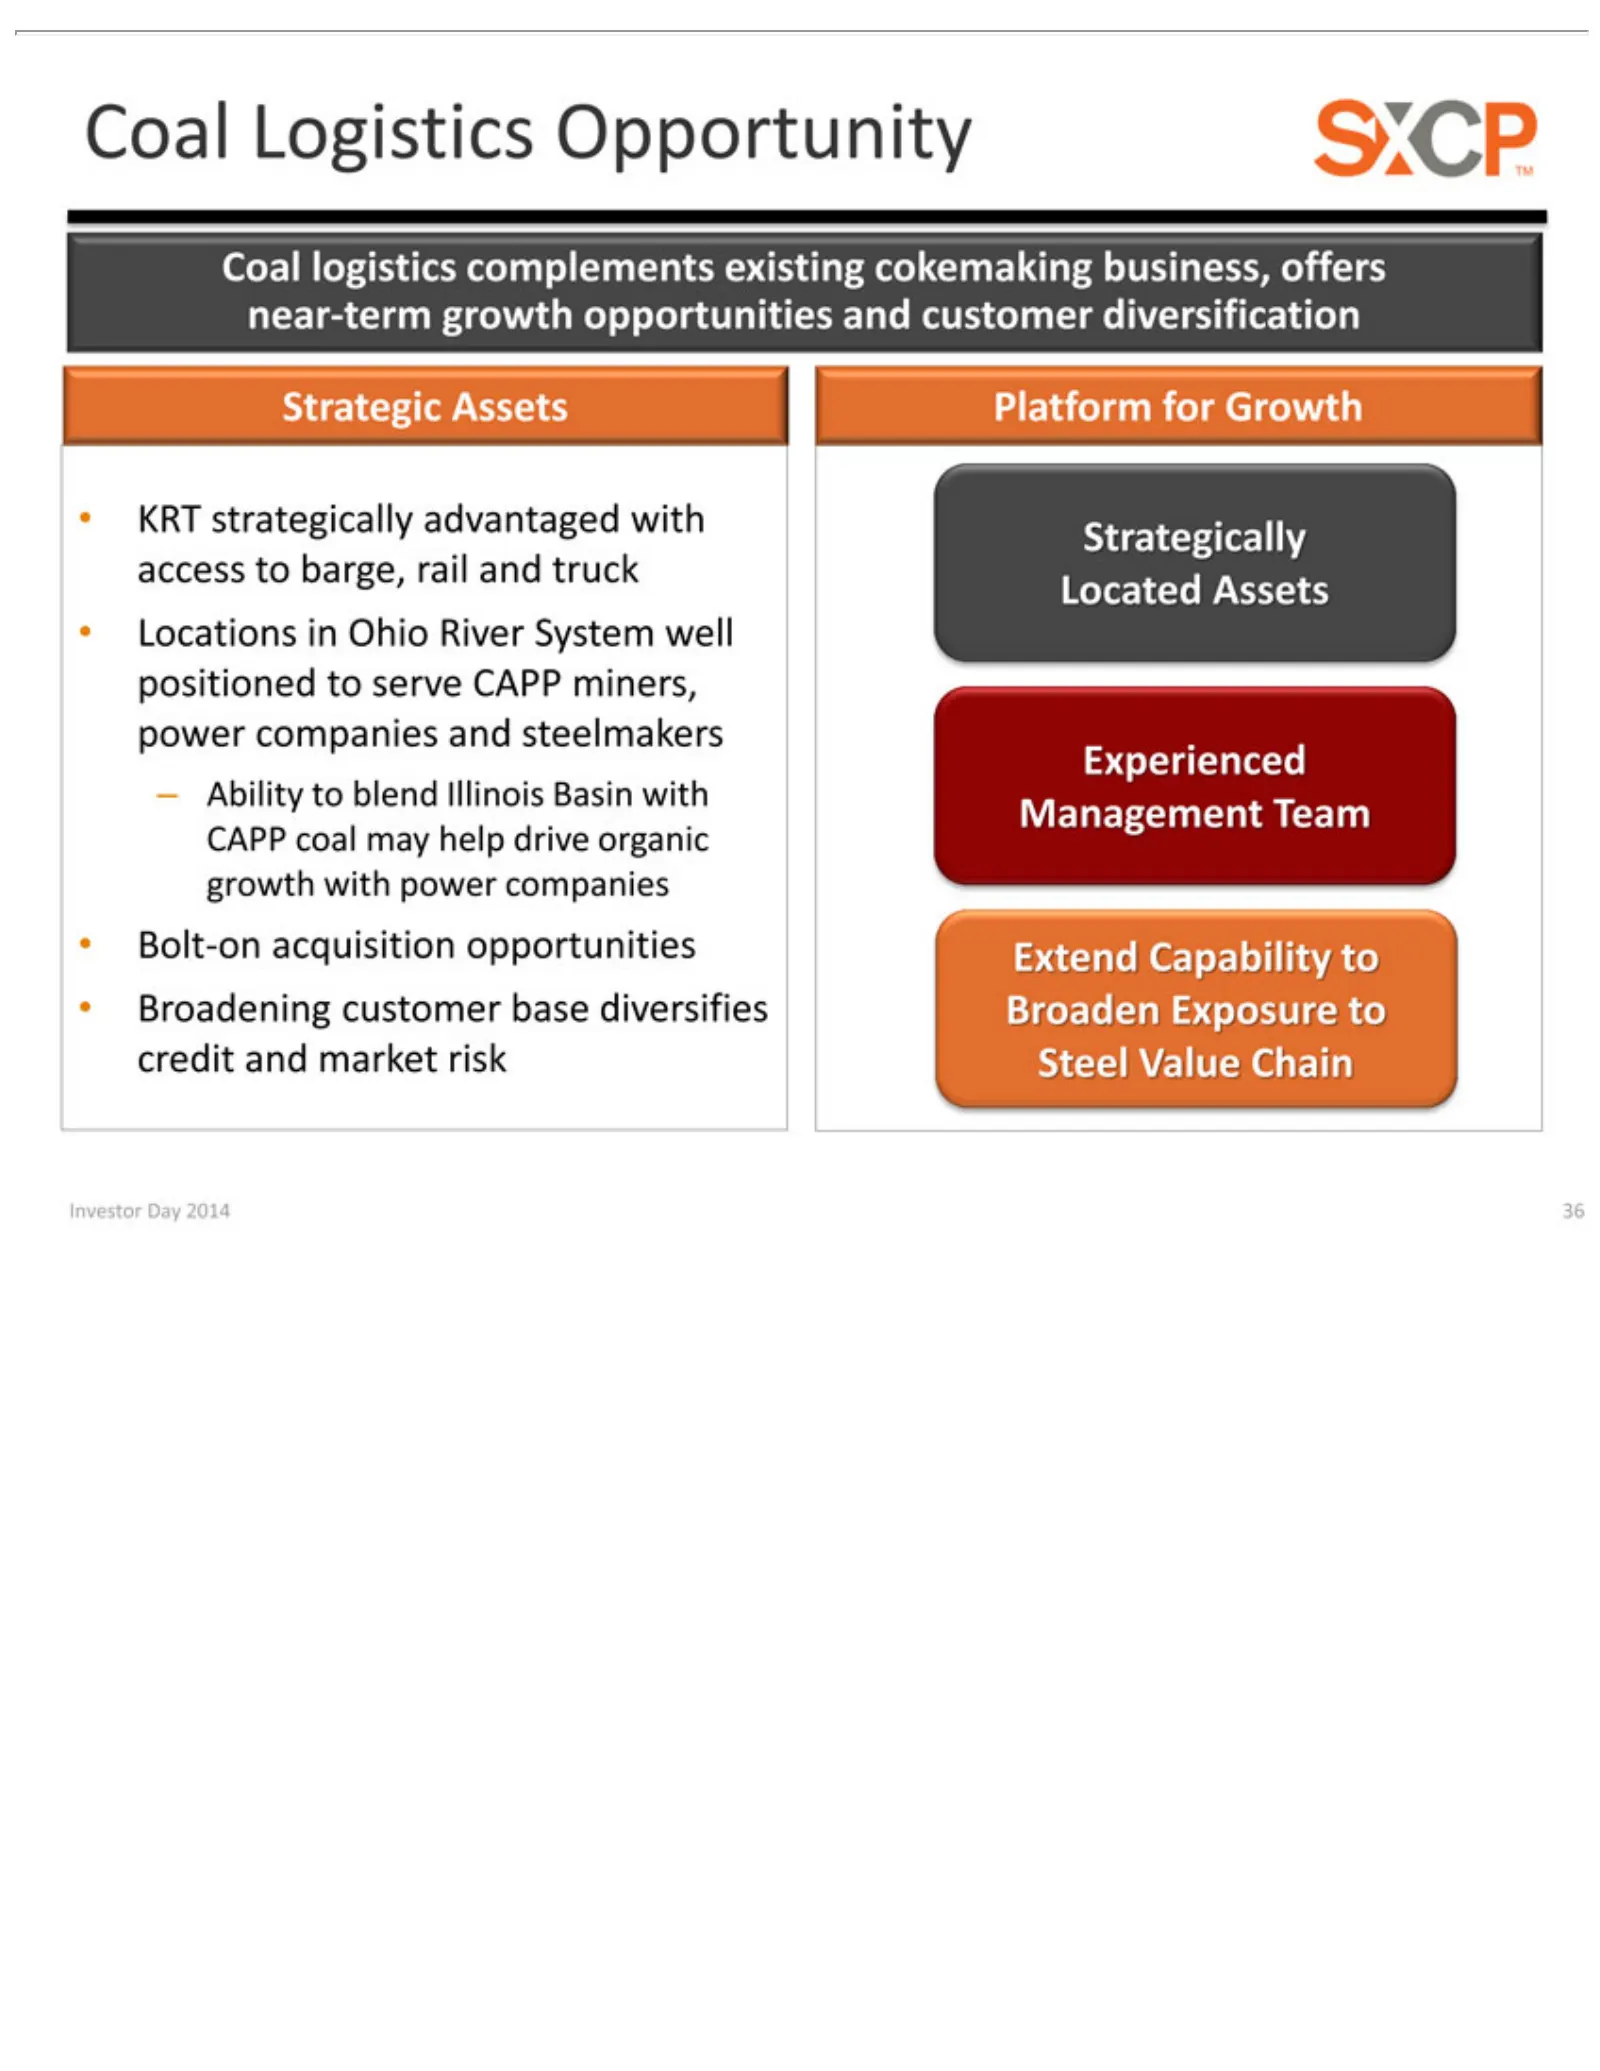
Experienced Coal Strategic KRT –Locations Bolt-on Broadening Platform Strategically Ability ExtendLogistics logistics strategically Investor acquisition Assets for toinblend customer Growth Ohio Management Located complements Opportunity Capability Day 2014 Illinois advantaged River toopportunities
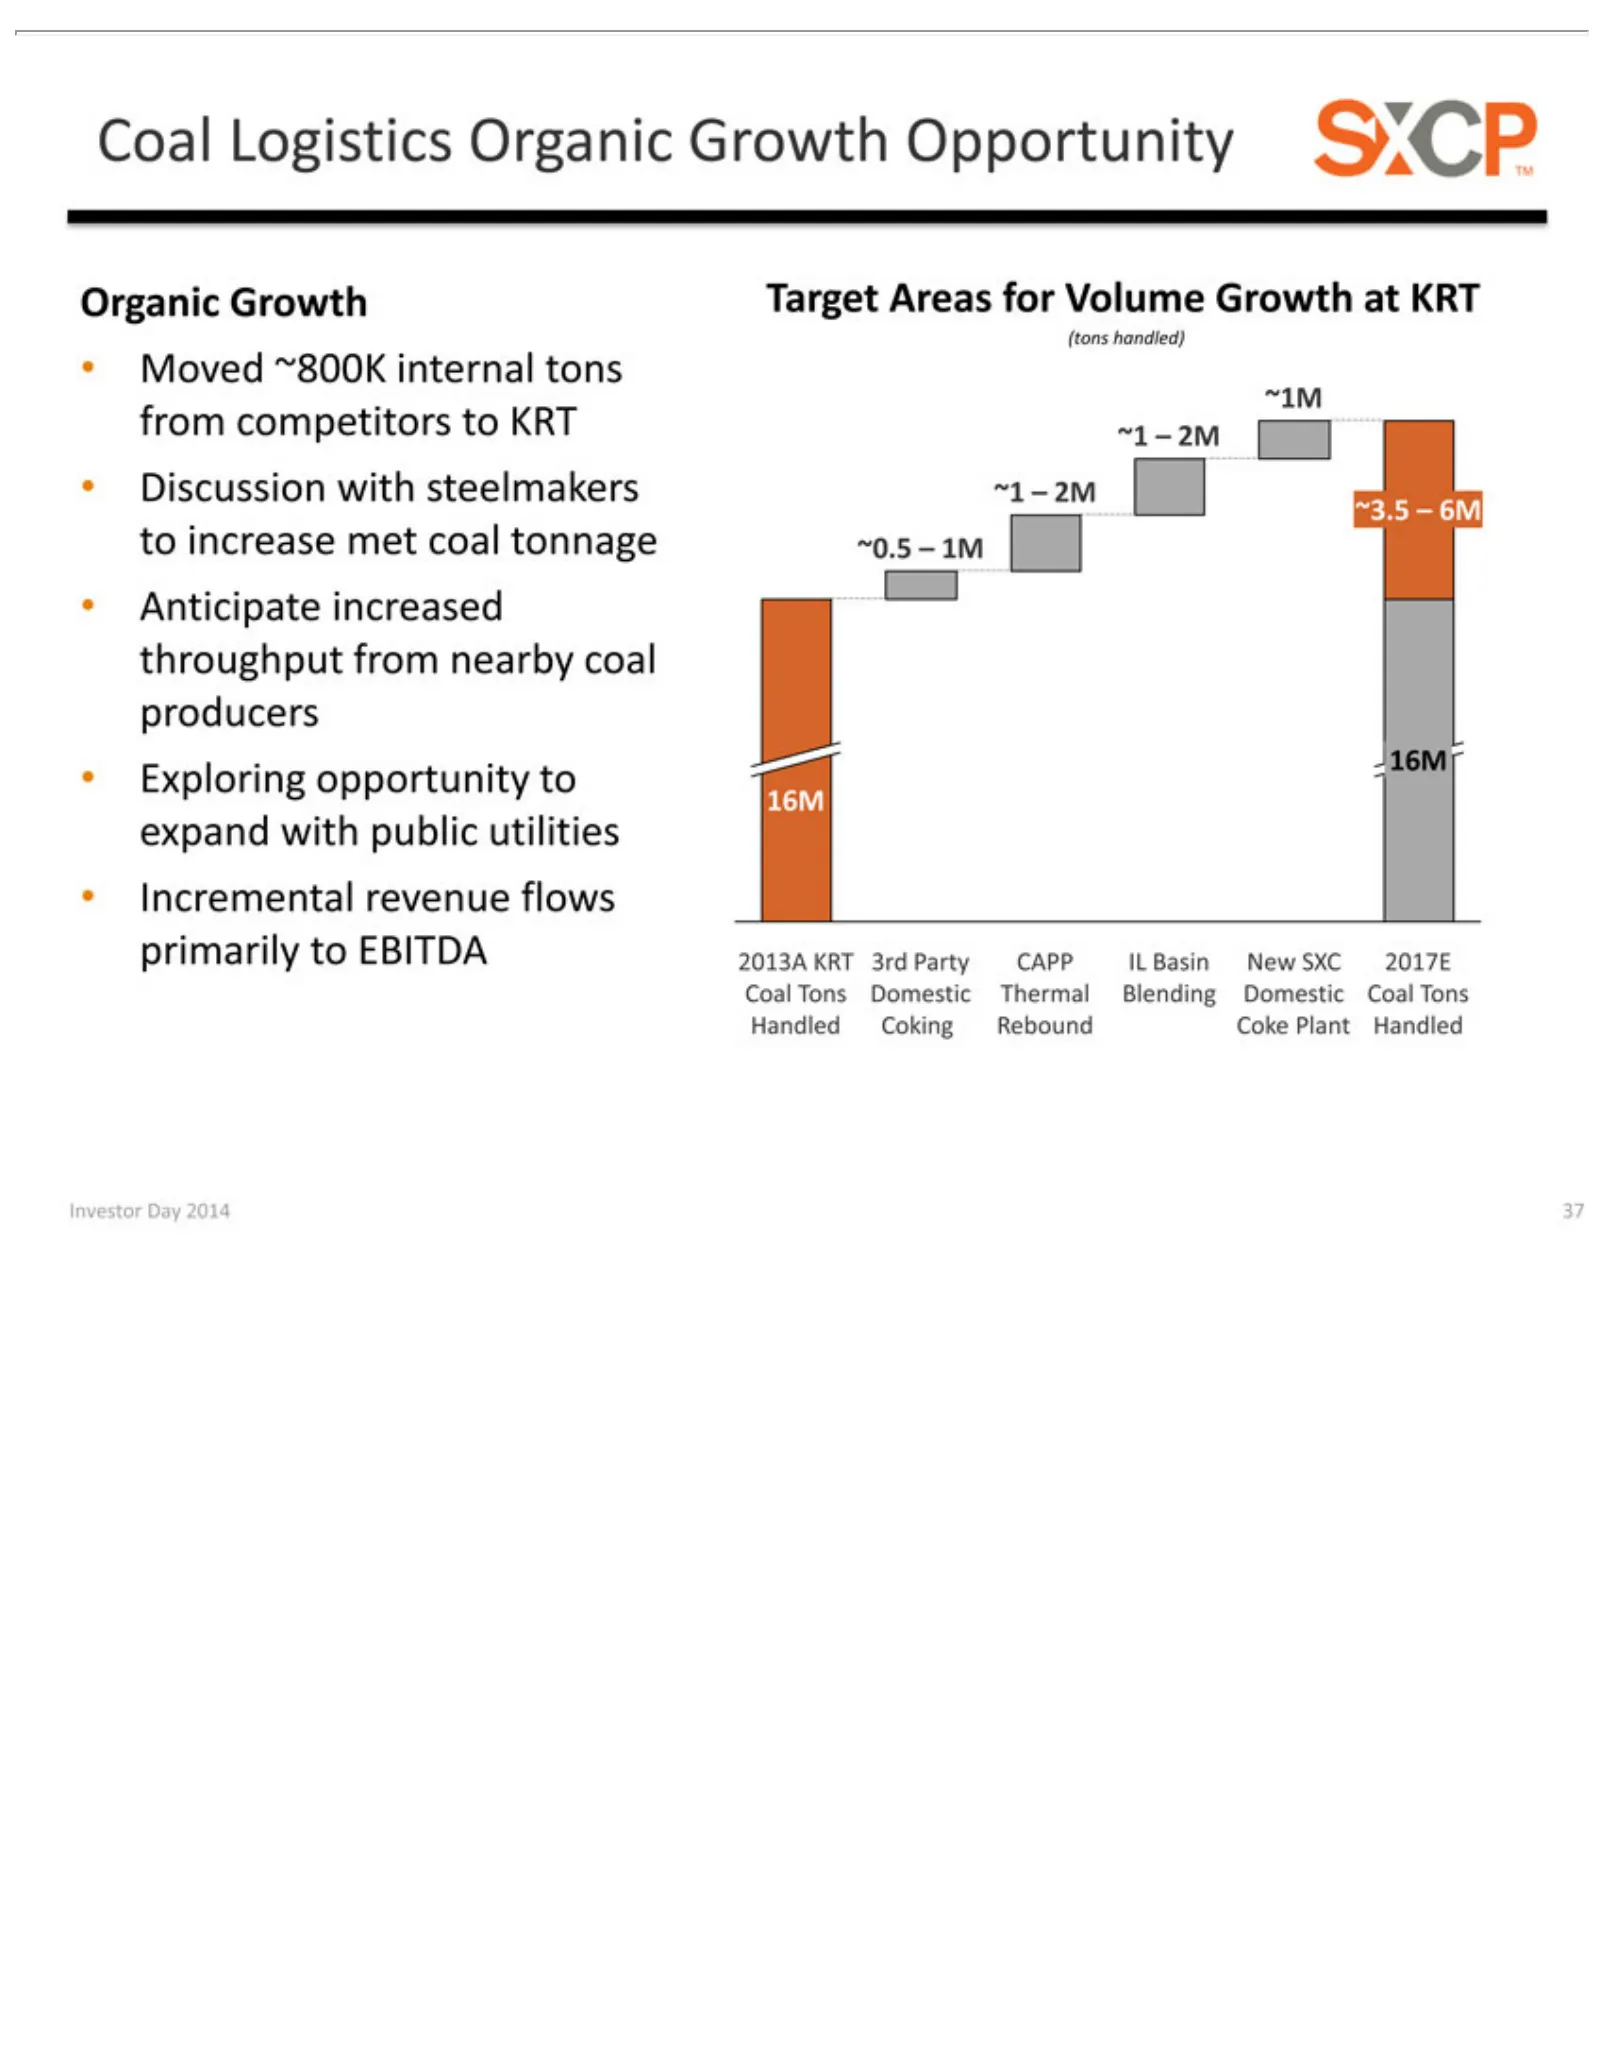
Slide 37: Coal Logistics Organic Growth
Coal Organic (tons Moved from •~1M ~3.5 to Anticipate Exploring expand 16M Incremental primarily Investor Discussion increase –Logistics competitors handled) 6M ~800K with Growth Day toopportunity increased met EBITDA revenue public with 2014 Organic internal coal Target to steelmakers 37 utilities
Slide 38: Jonathan Lock, Vice President Strategy
Jonathan Vice Strategy President— Lock
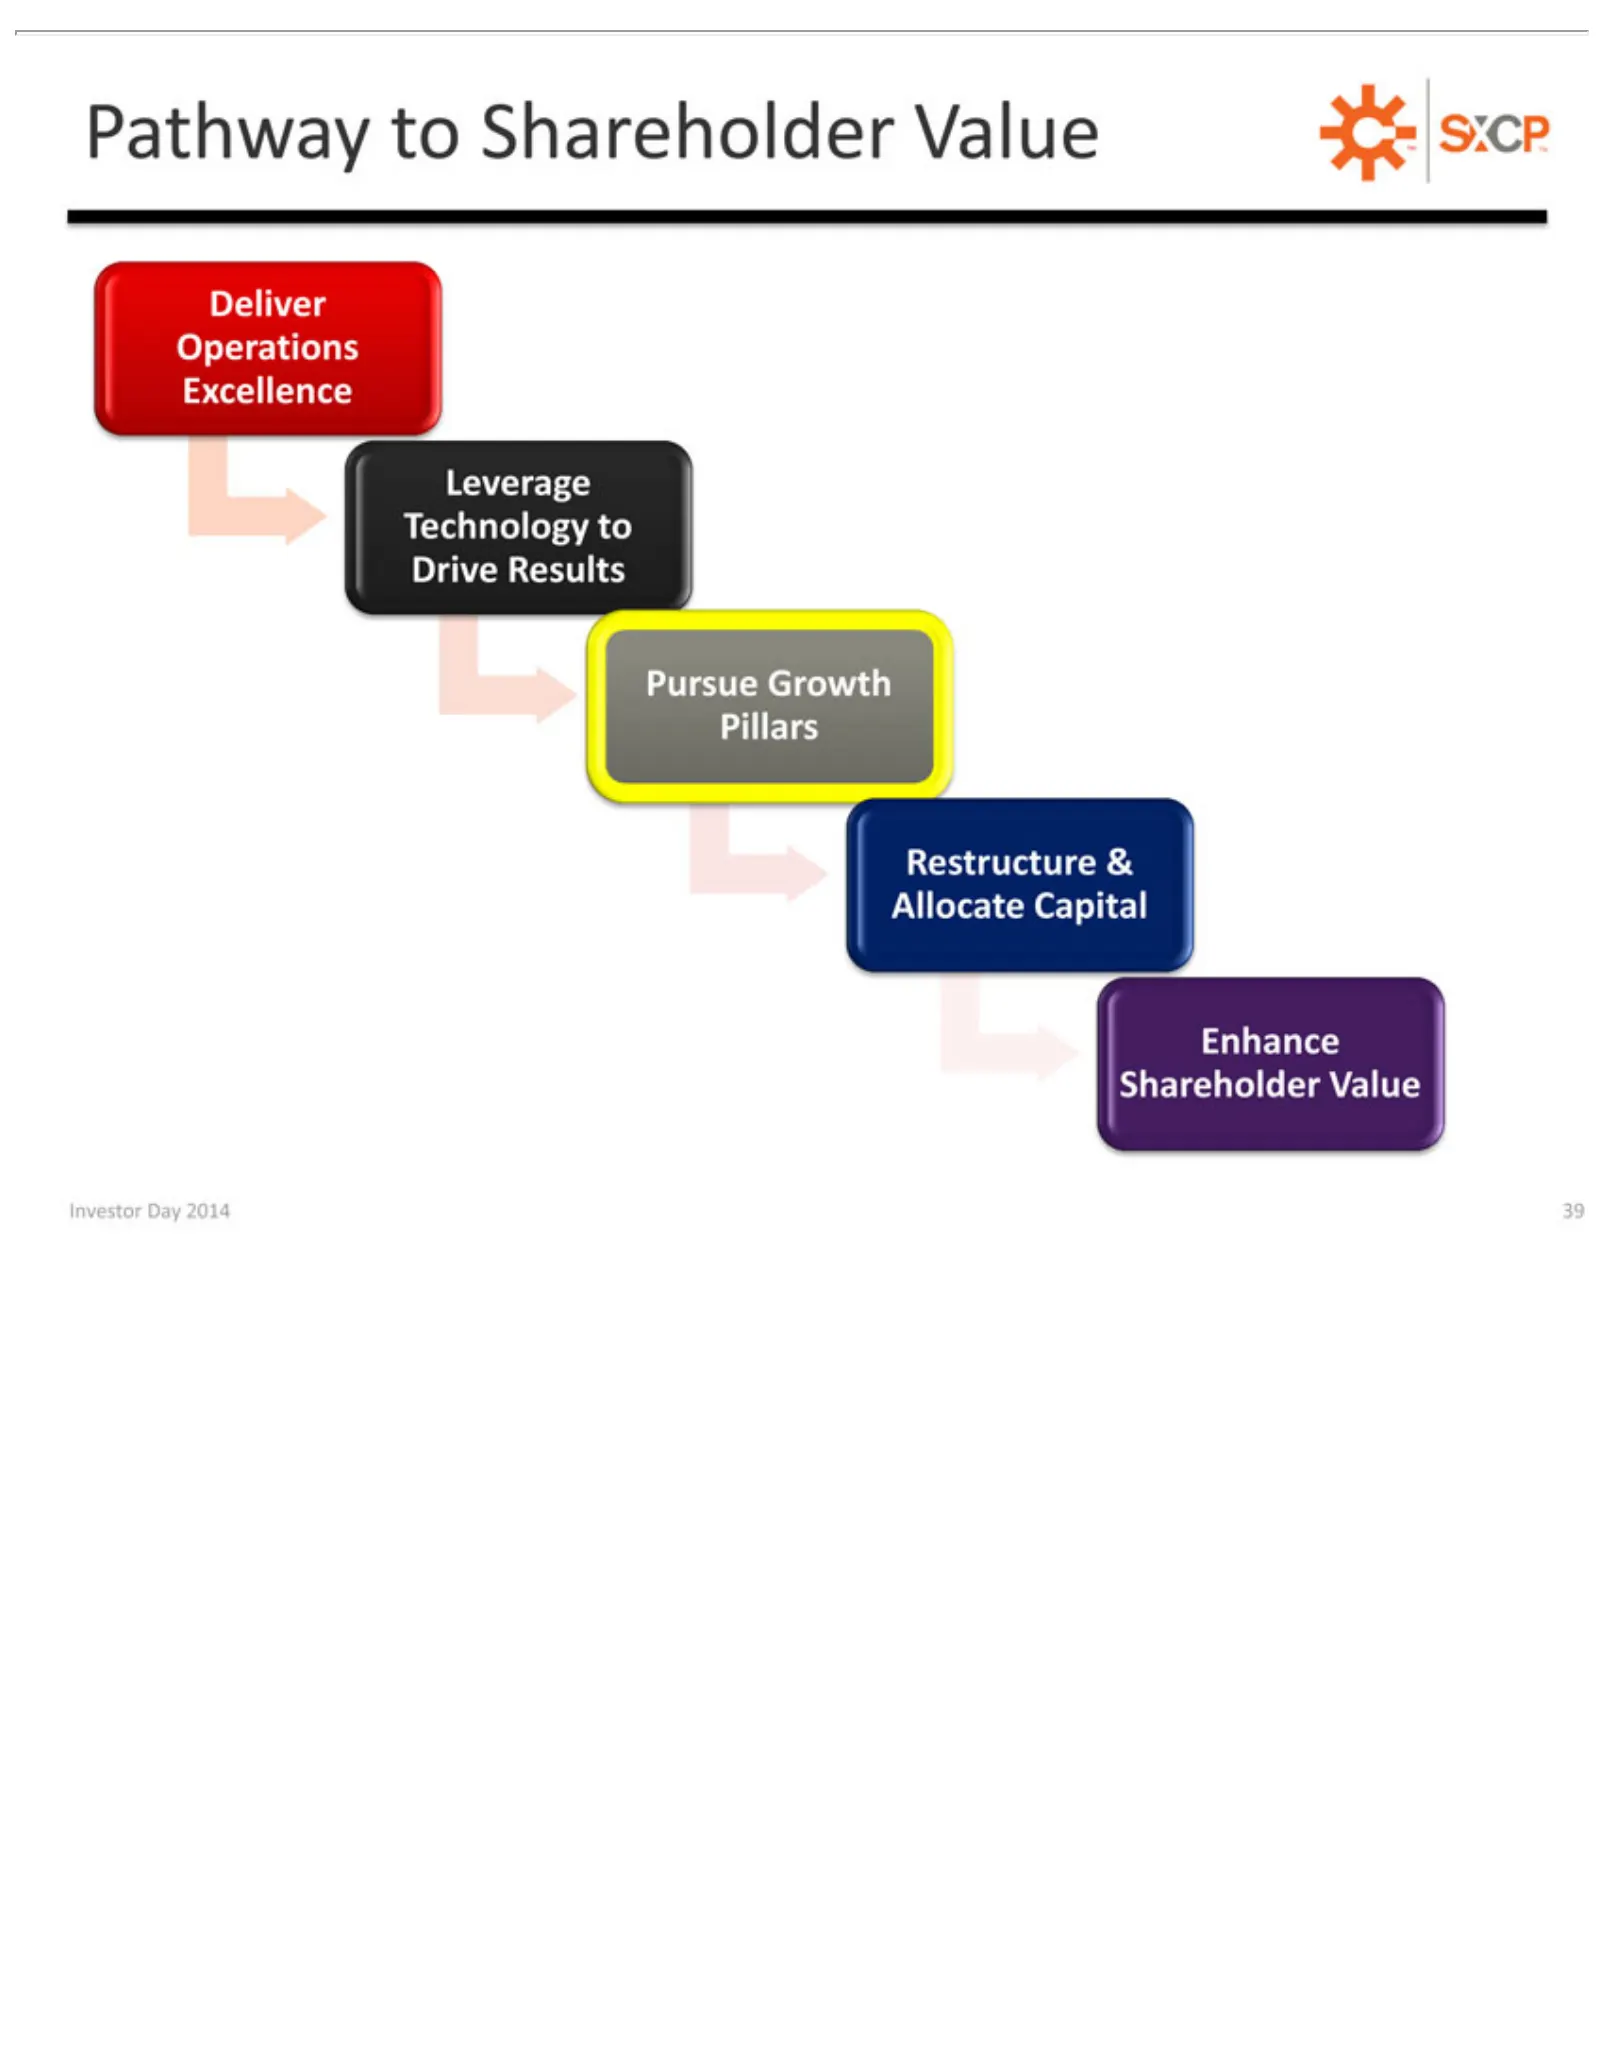
Slide 39: Pathway Pillars: Pursue Growth
PathwayGrowth Deliver Technology Leverage Pursue Restructure Pillars Shareholder Enhance InvestorOperations Day to Shareholder & to Value 2014 Allocate Drive 39 Excellence Results Capital Value
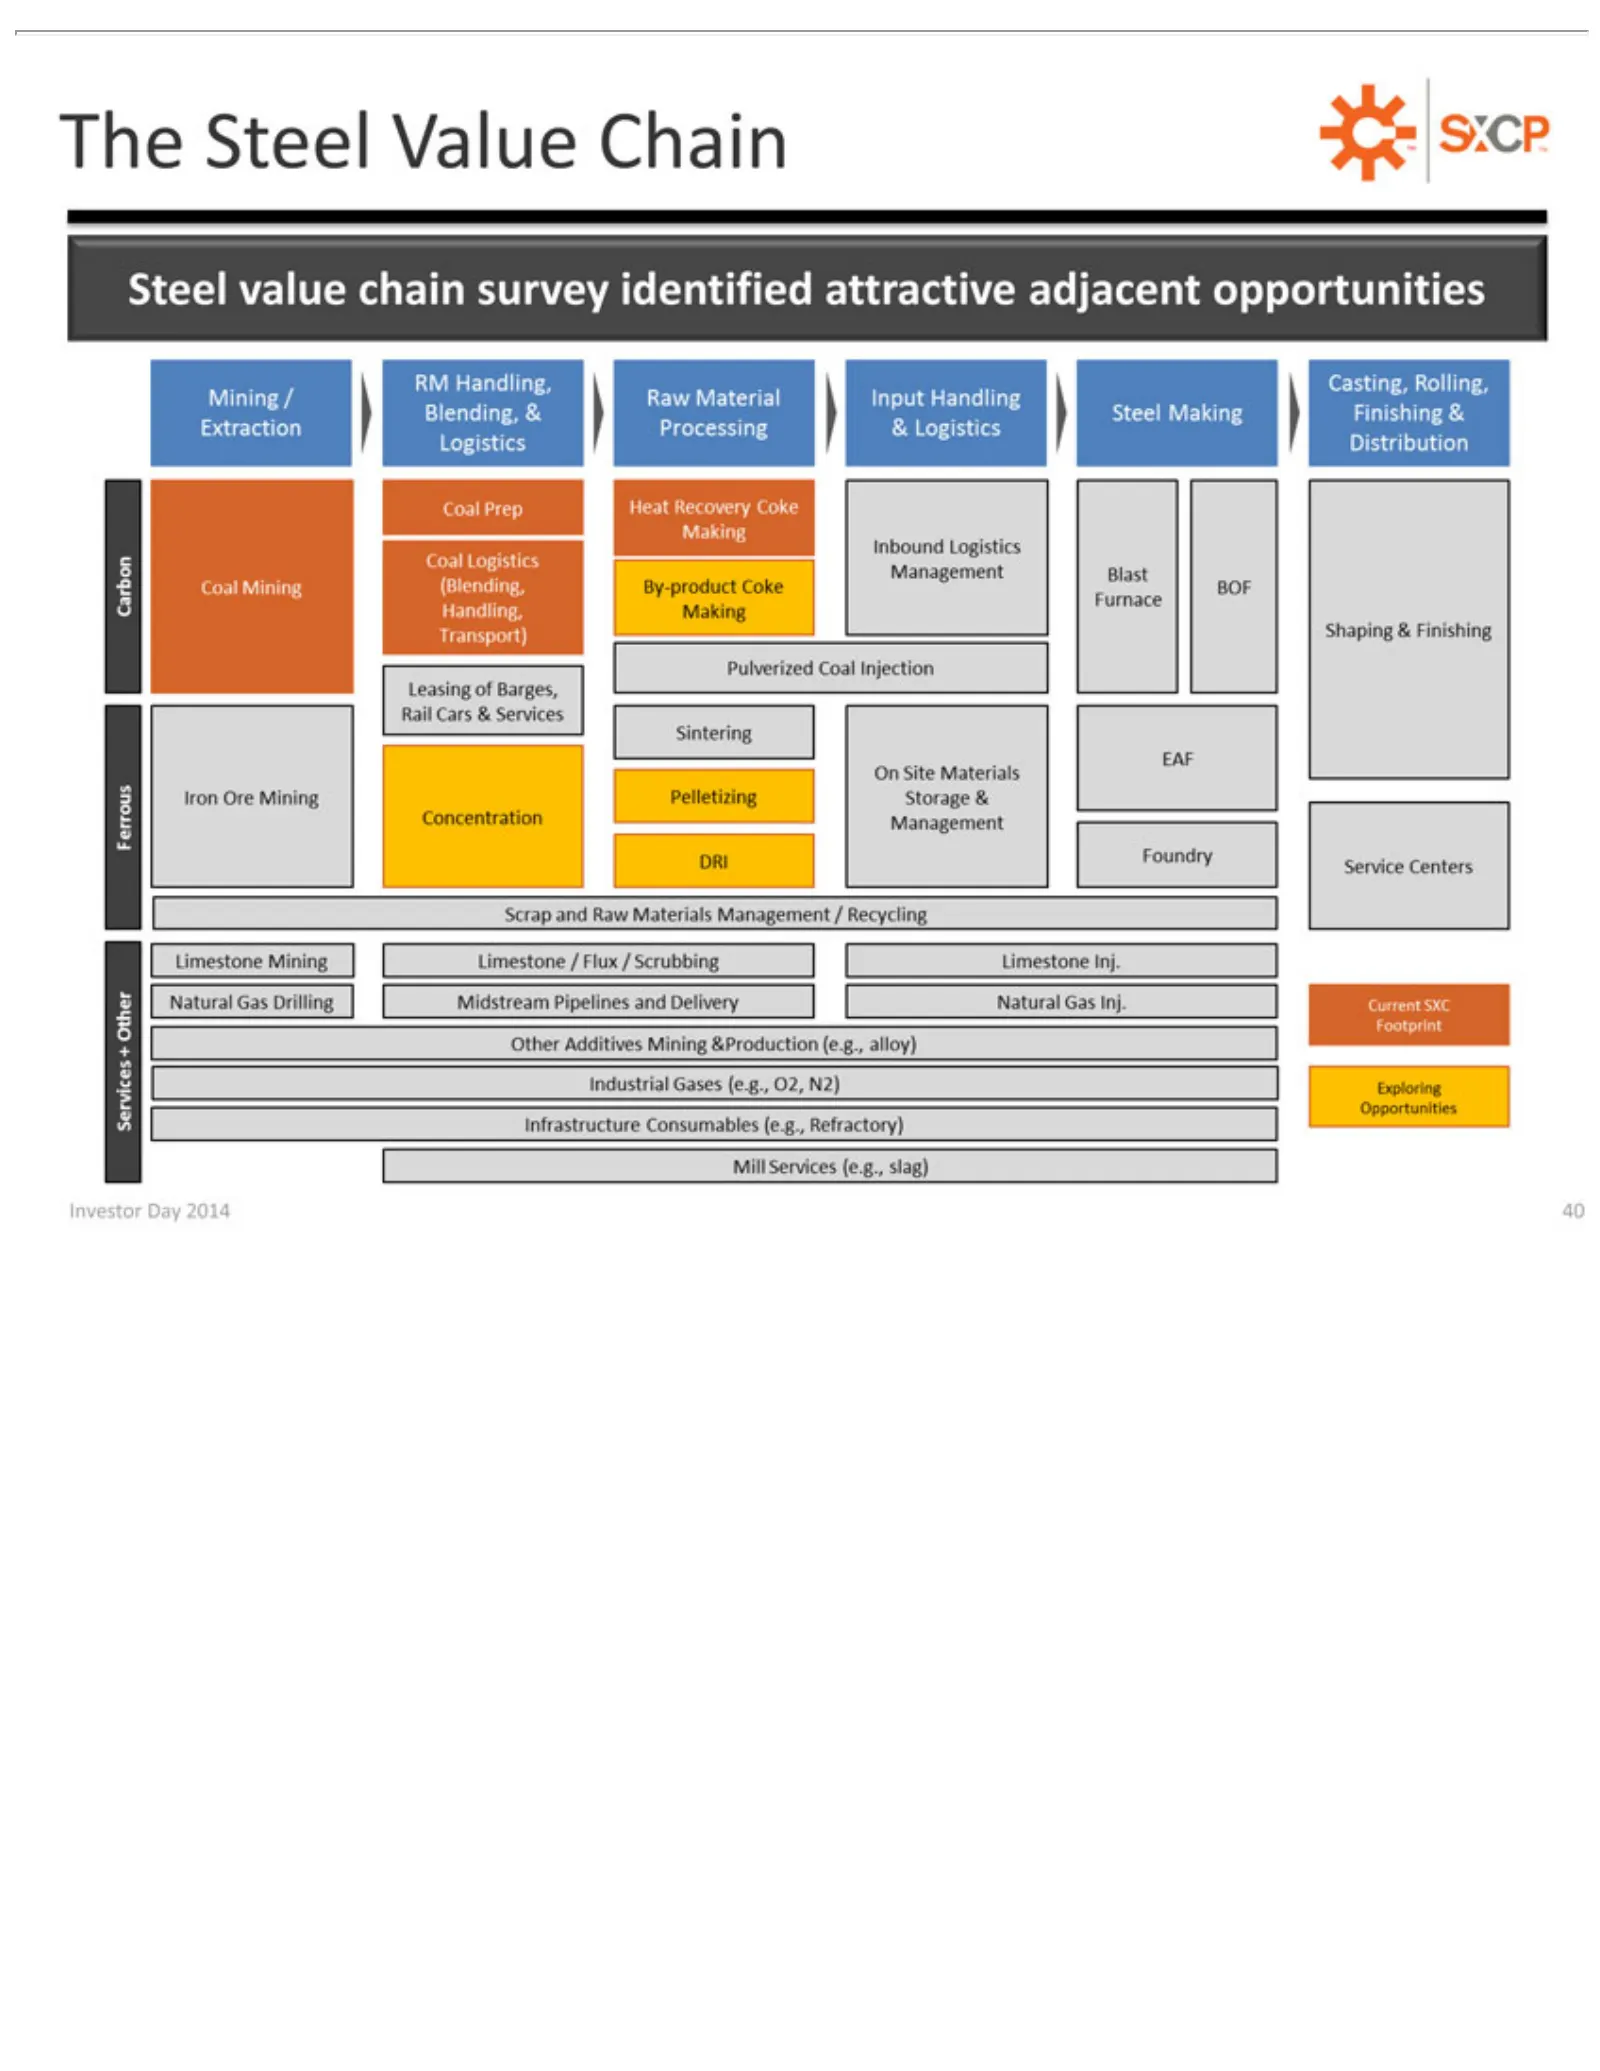
Slide 40: The Steel Value Chain
The Steel Steel Investor value Day Value chain 2014 Chain survey 40 TM identified attractive adjacent opportunities
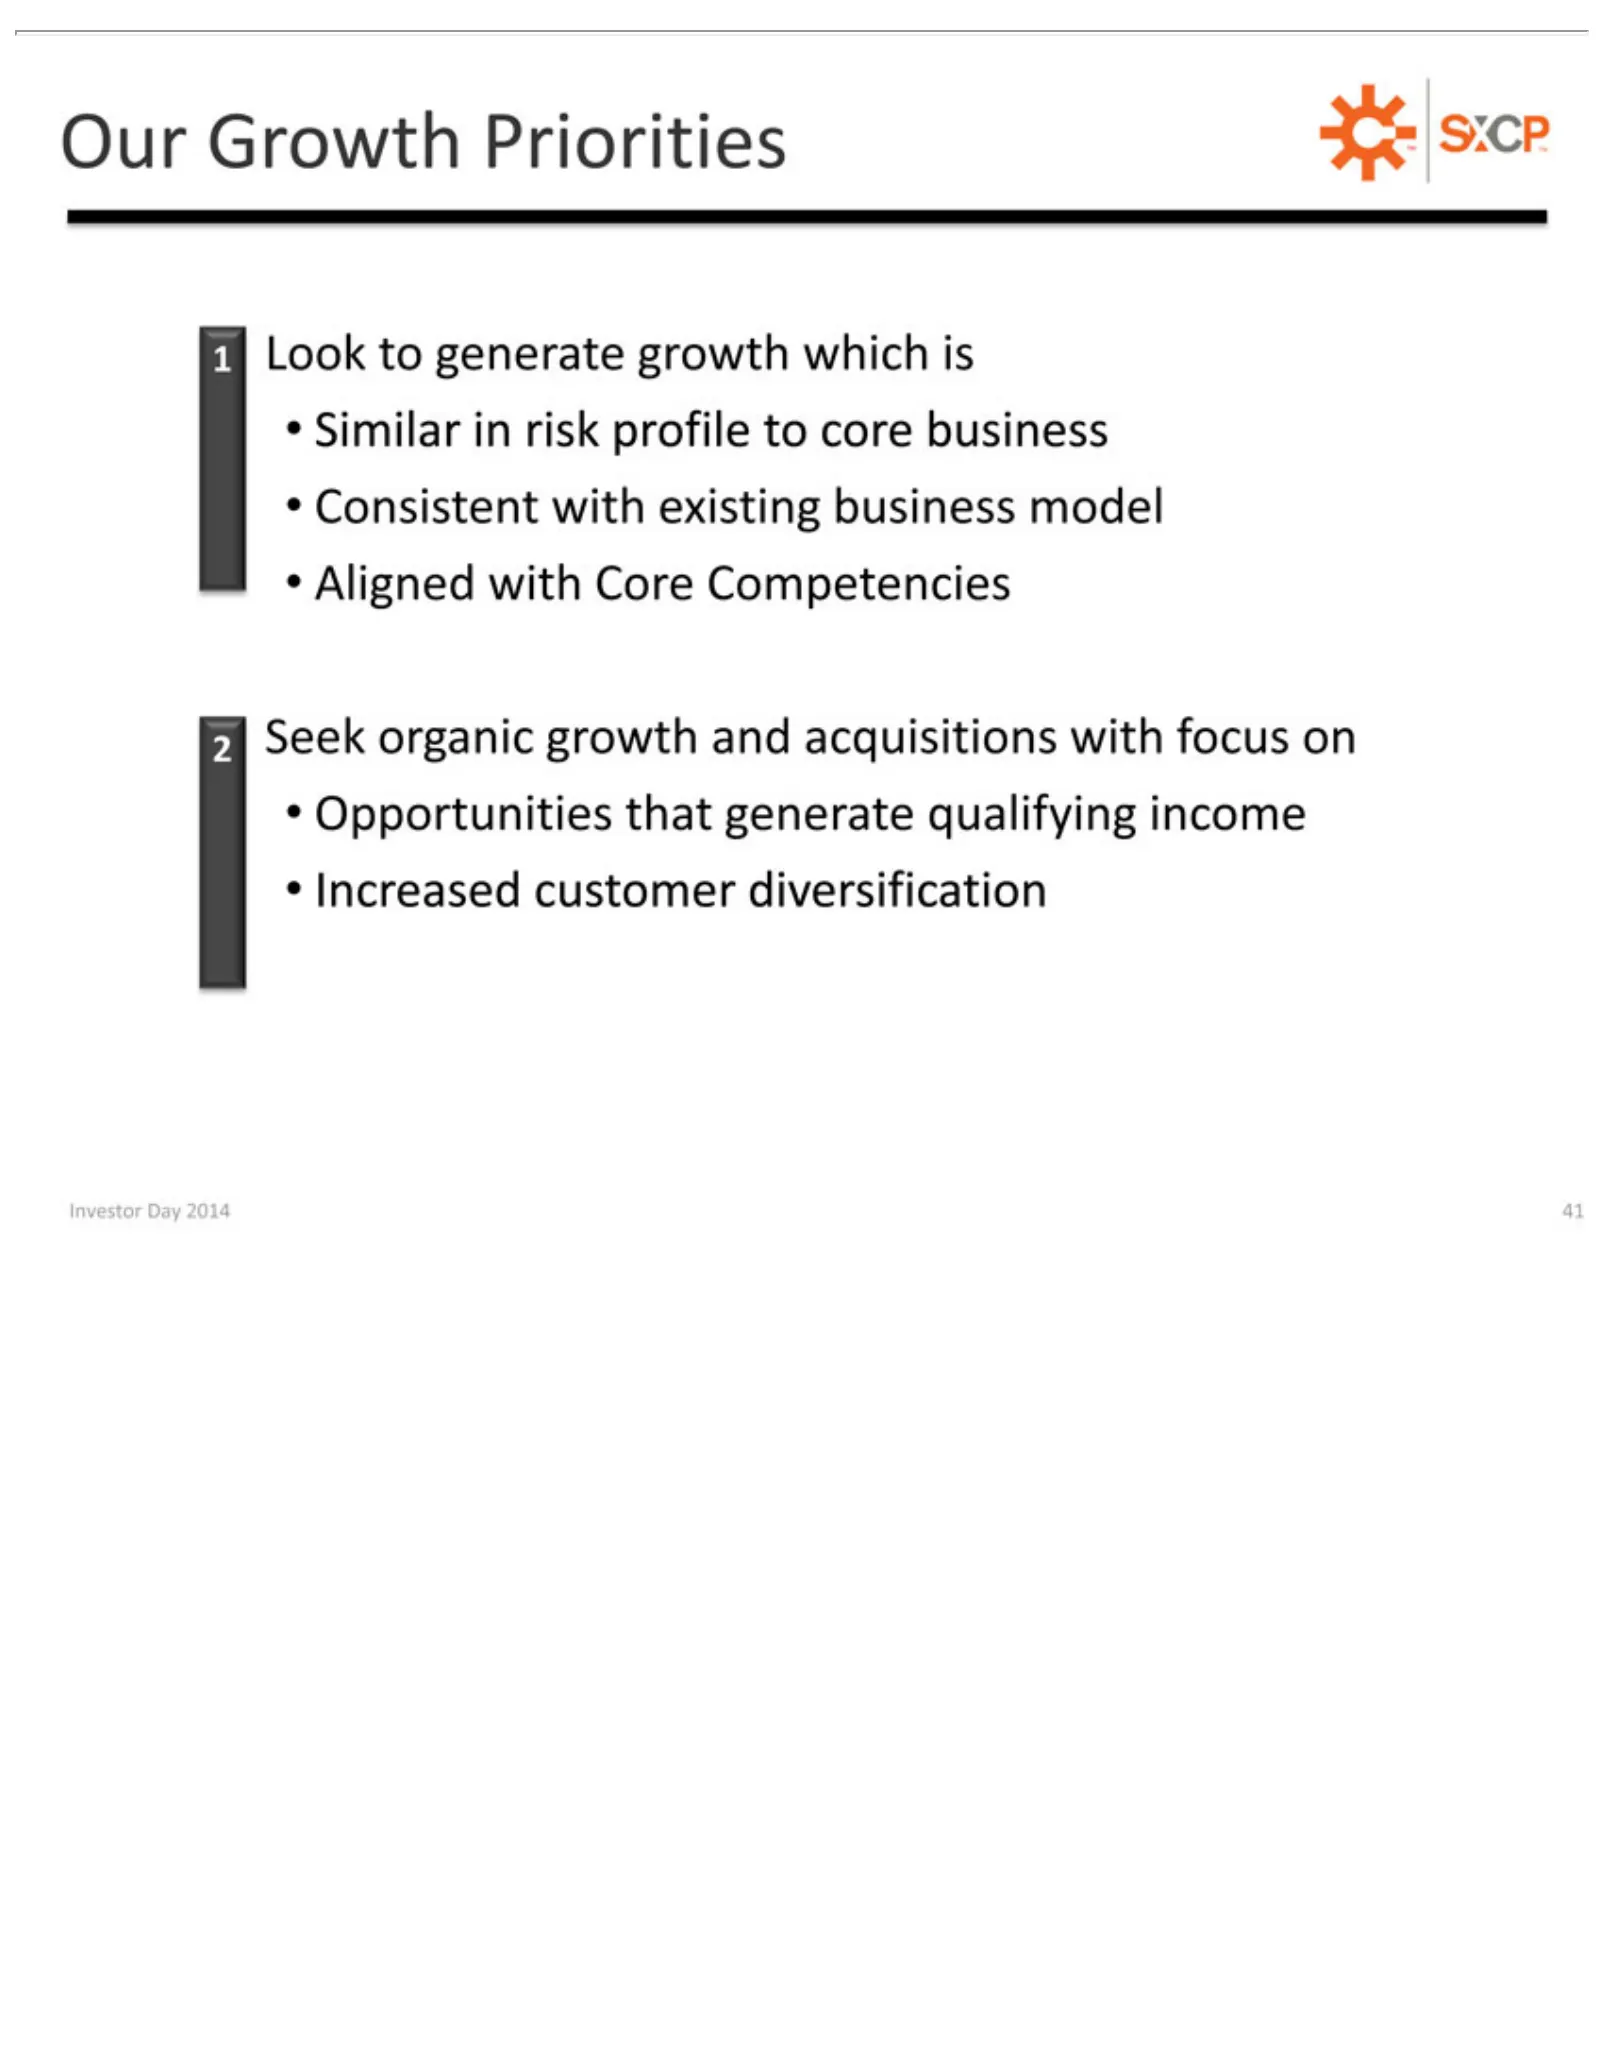
Slide 41: Growth Priorities
1Our Similar Consistent 2Aligned Opportunities Increased Investor Look Seek Growth organic to in with Day customer generate risk with Priorities 2014 Core that profile growth existing generate 41 Competencies growth diversification to TM and core business which acquisitions qualifying business is mo
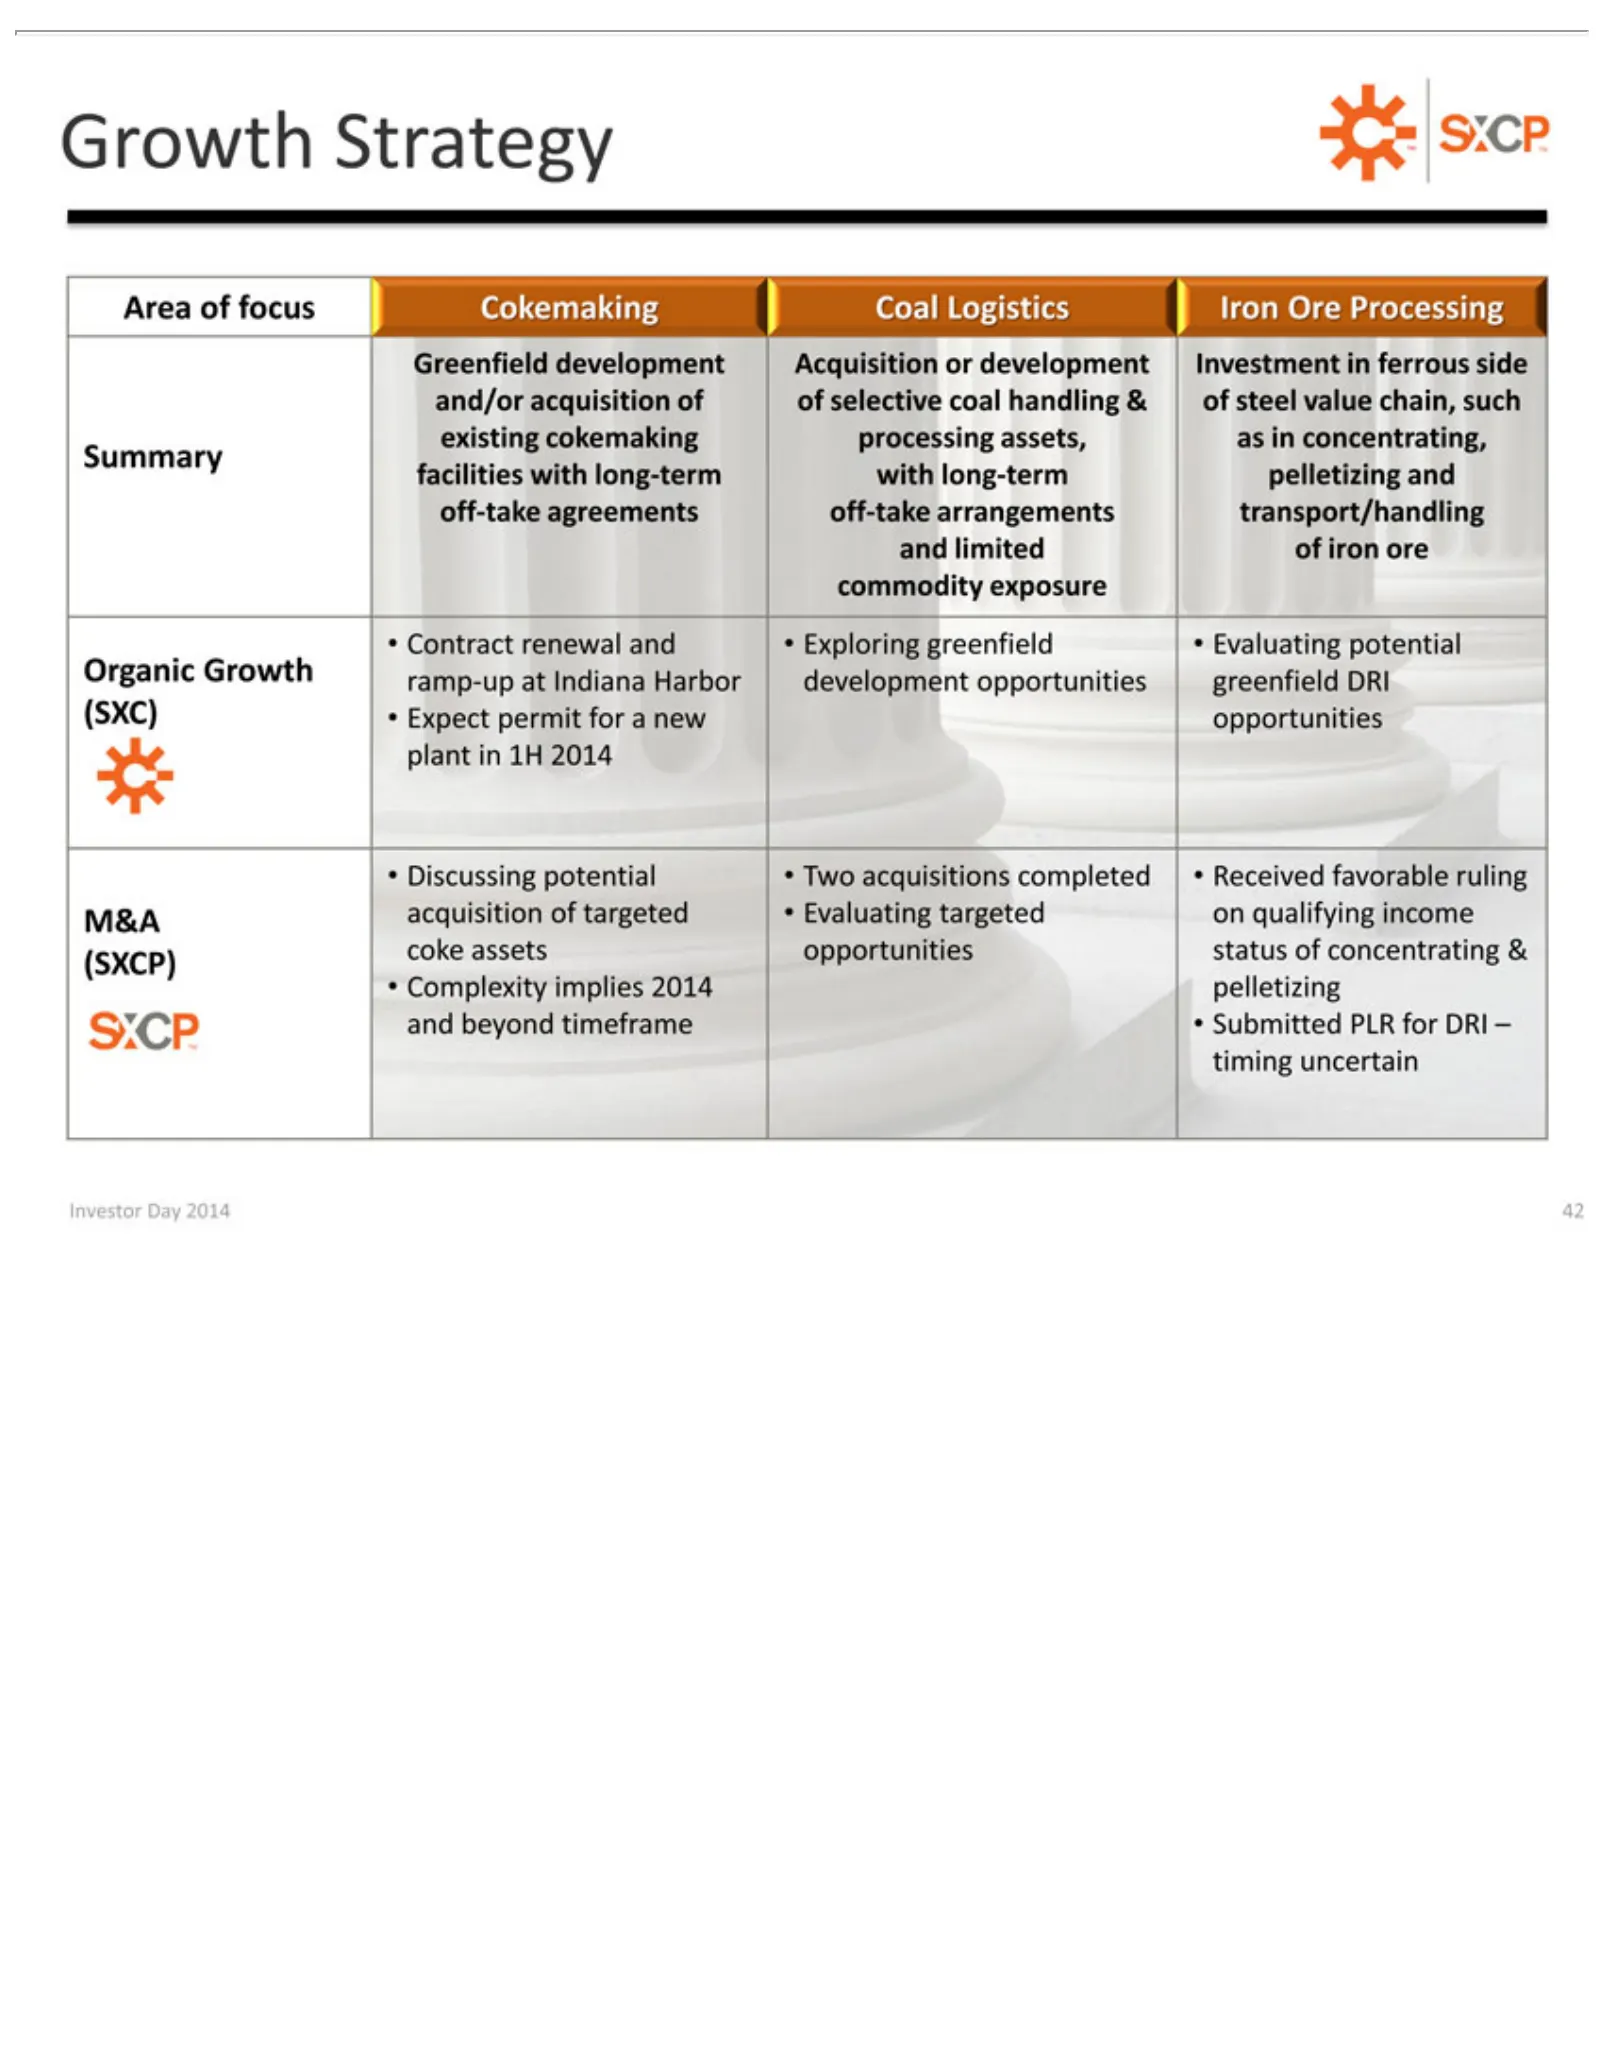
Slide 42: Growth Area Summary
Growth Area Greenfield Summary concentrating, Contract •1H (SXCP) Complexity Investor Discussing 2014 of focus Strategy implies Day renewal facilities development 2014 potential 2014 Cokemaking TM and pelletizing 42 with Exploring • Two long-term Acquisition Coal acquisitions andgreenfield Logistics
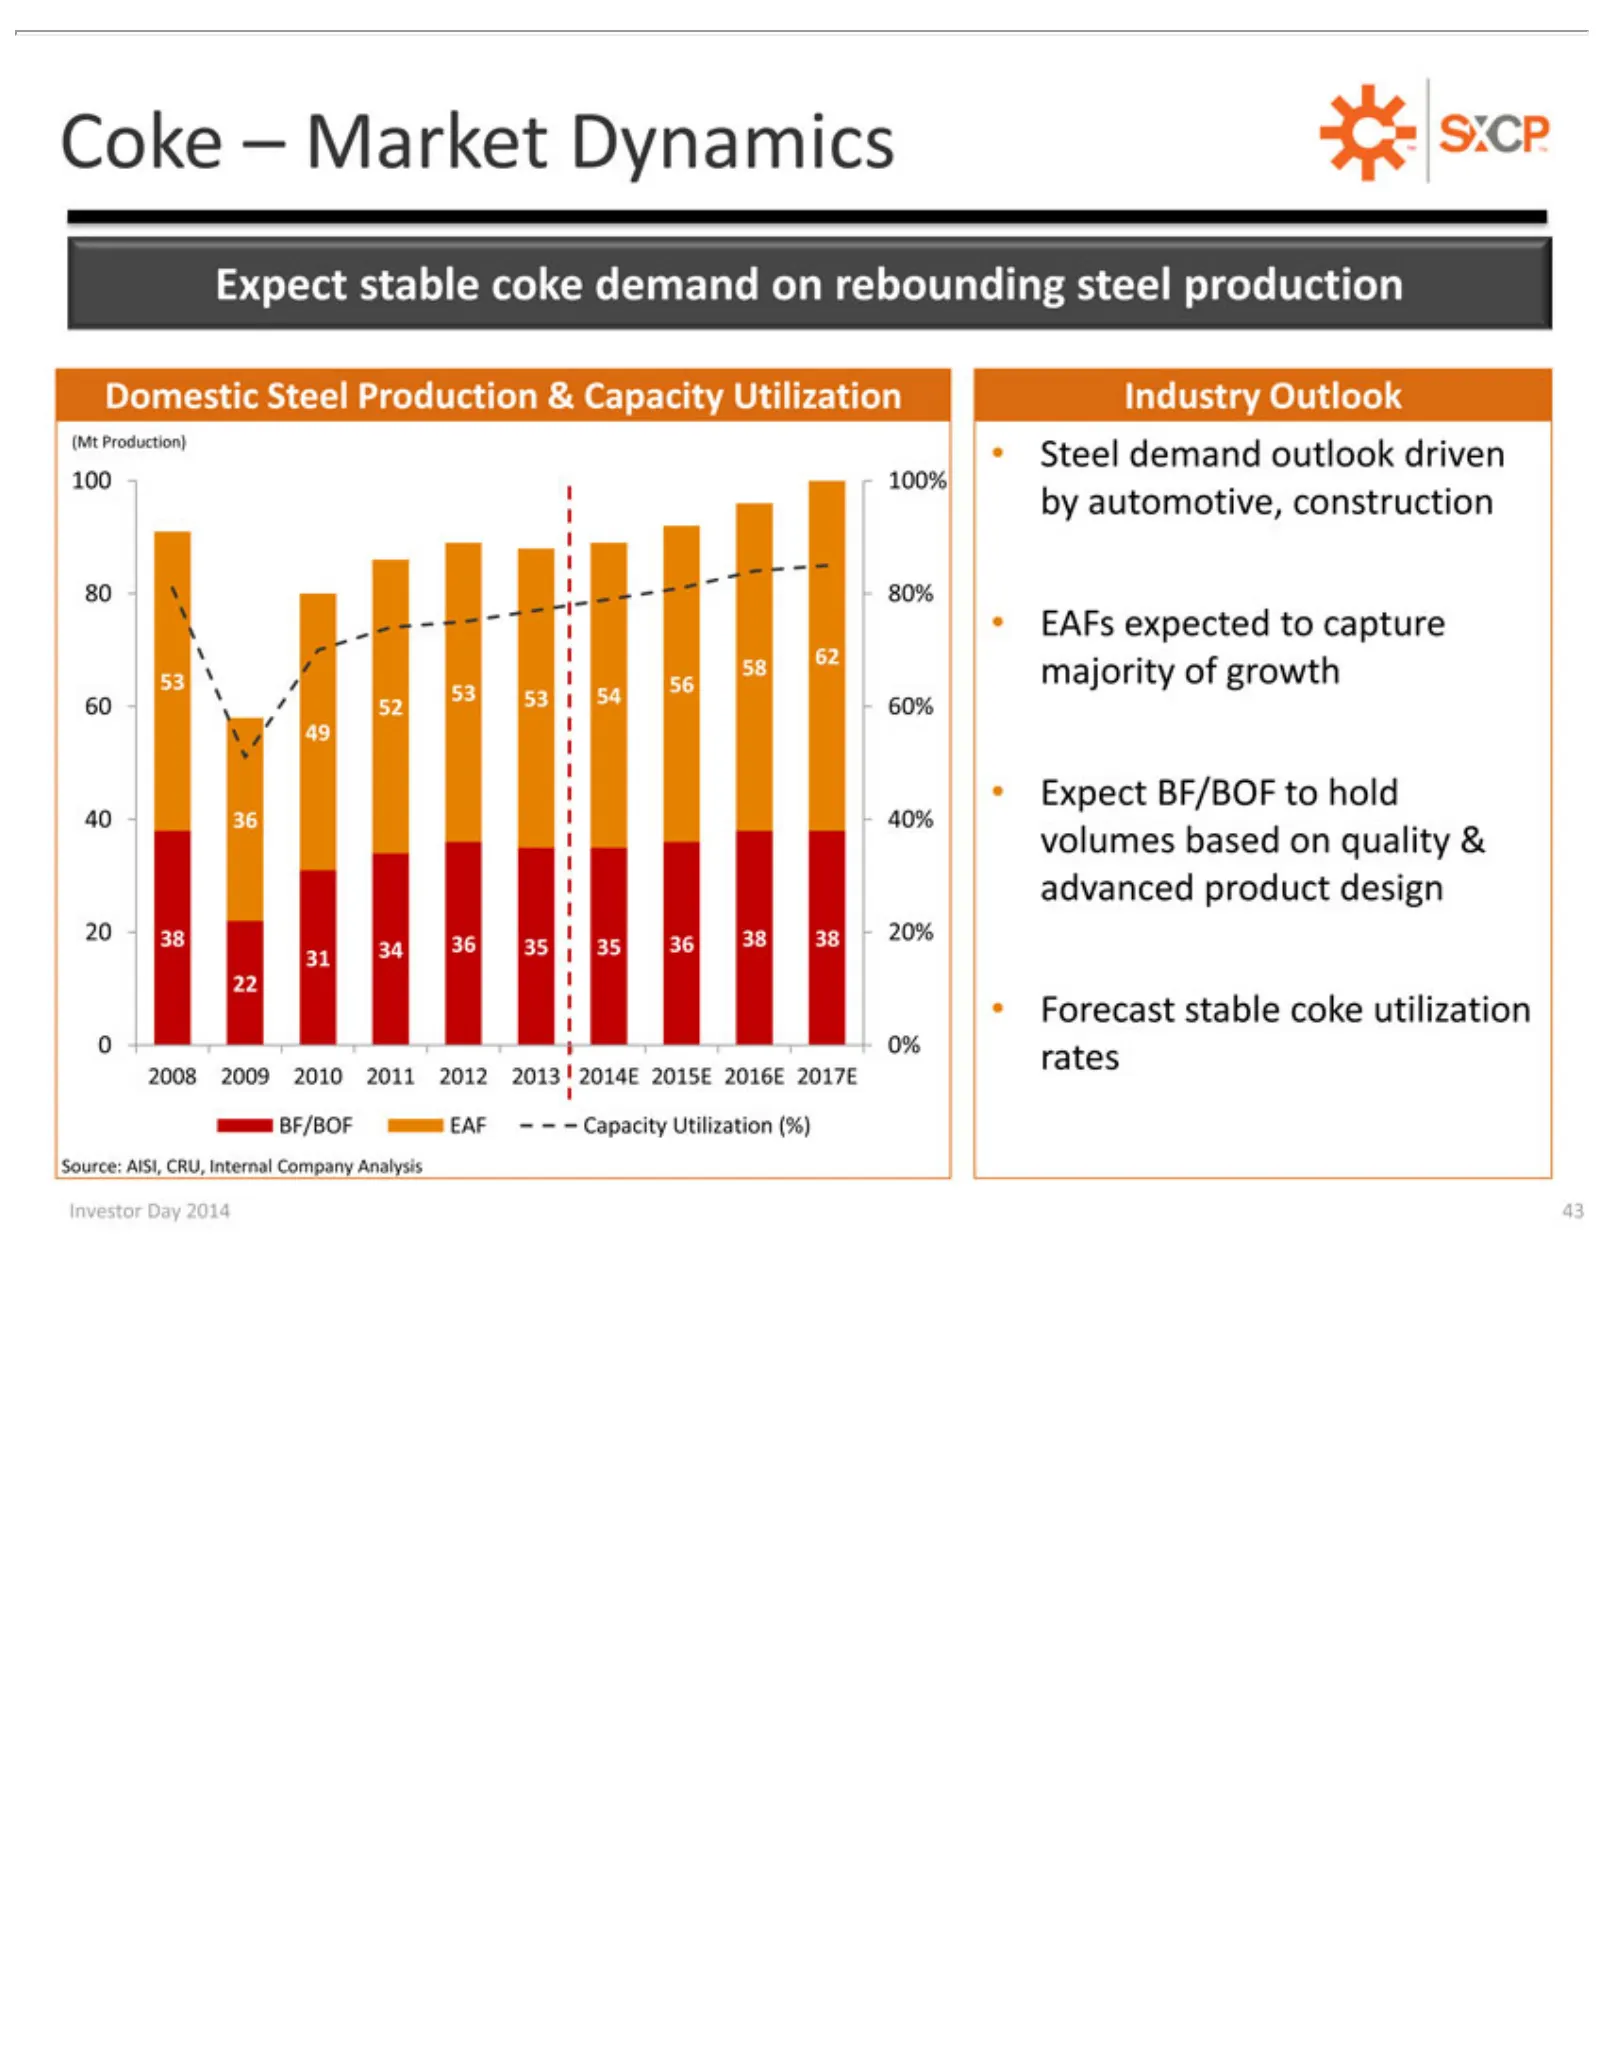
Slide 43: Domestic Coke Market Outlook
20 Coke Domestic (Mt 100 by 80 EAFs 58 62 53 60 Expect 49 40 volumes 340%automotive, 80% majority 56 53 52 36 38 36100% Production) –38 62 54 60% 40% expected 0Forecast 2008 BF/BOF Source: Investorstable BF/BOF Market 2009based 38 rates 35 Steel of AISI, Day 20% coke stable EAF 352010 36 growth on D
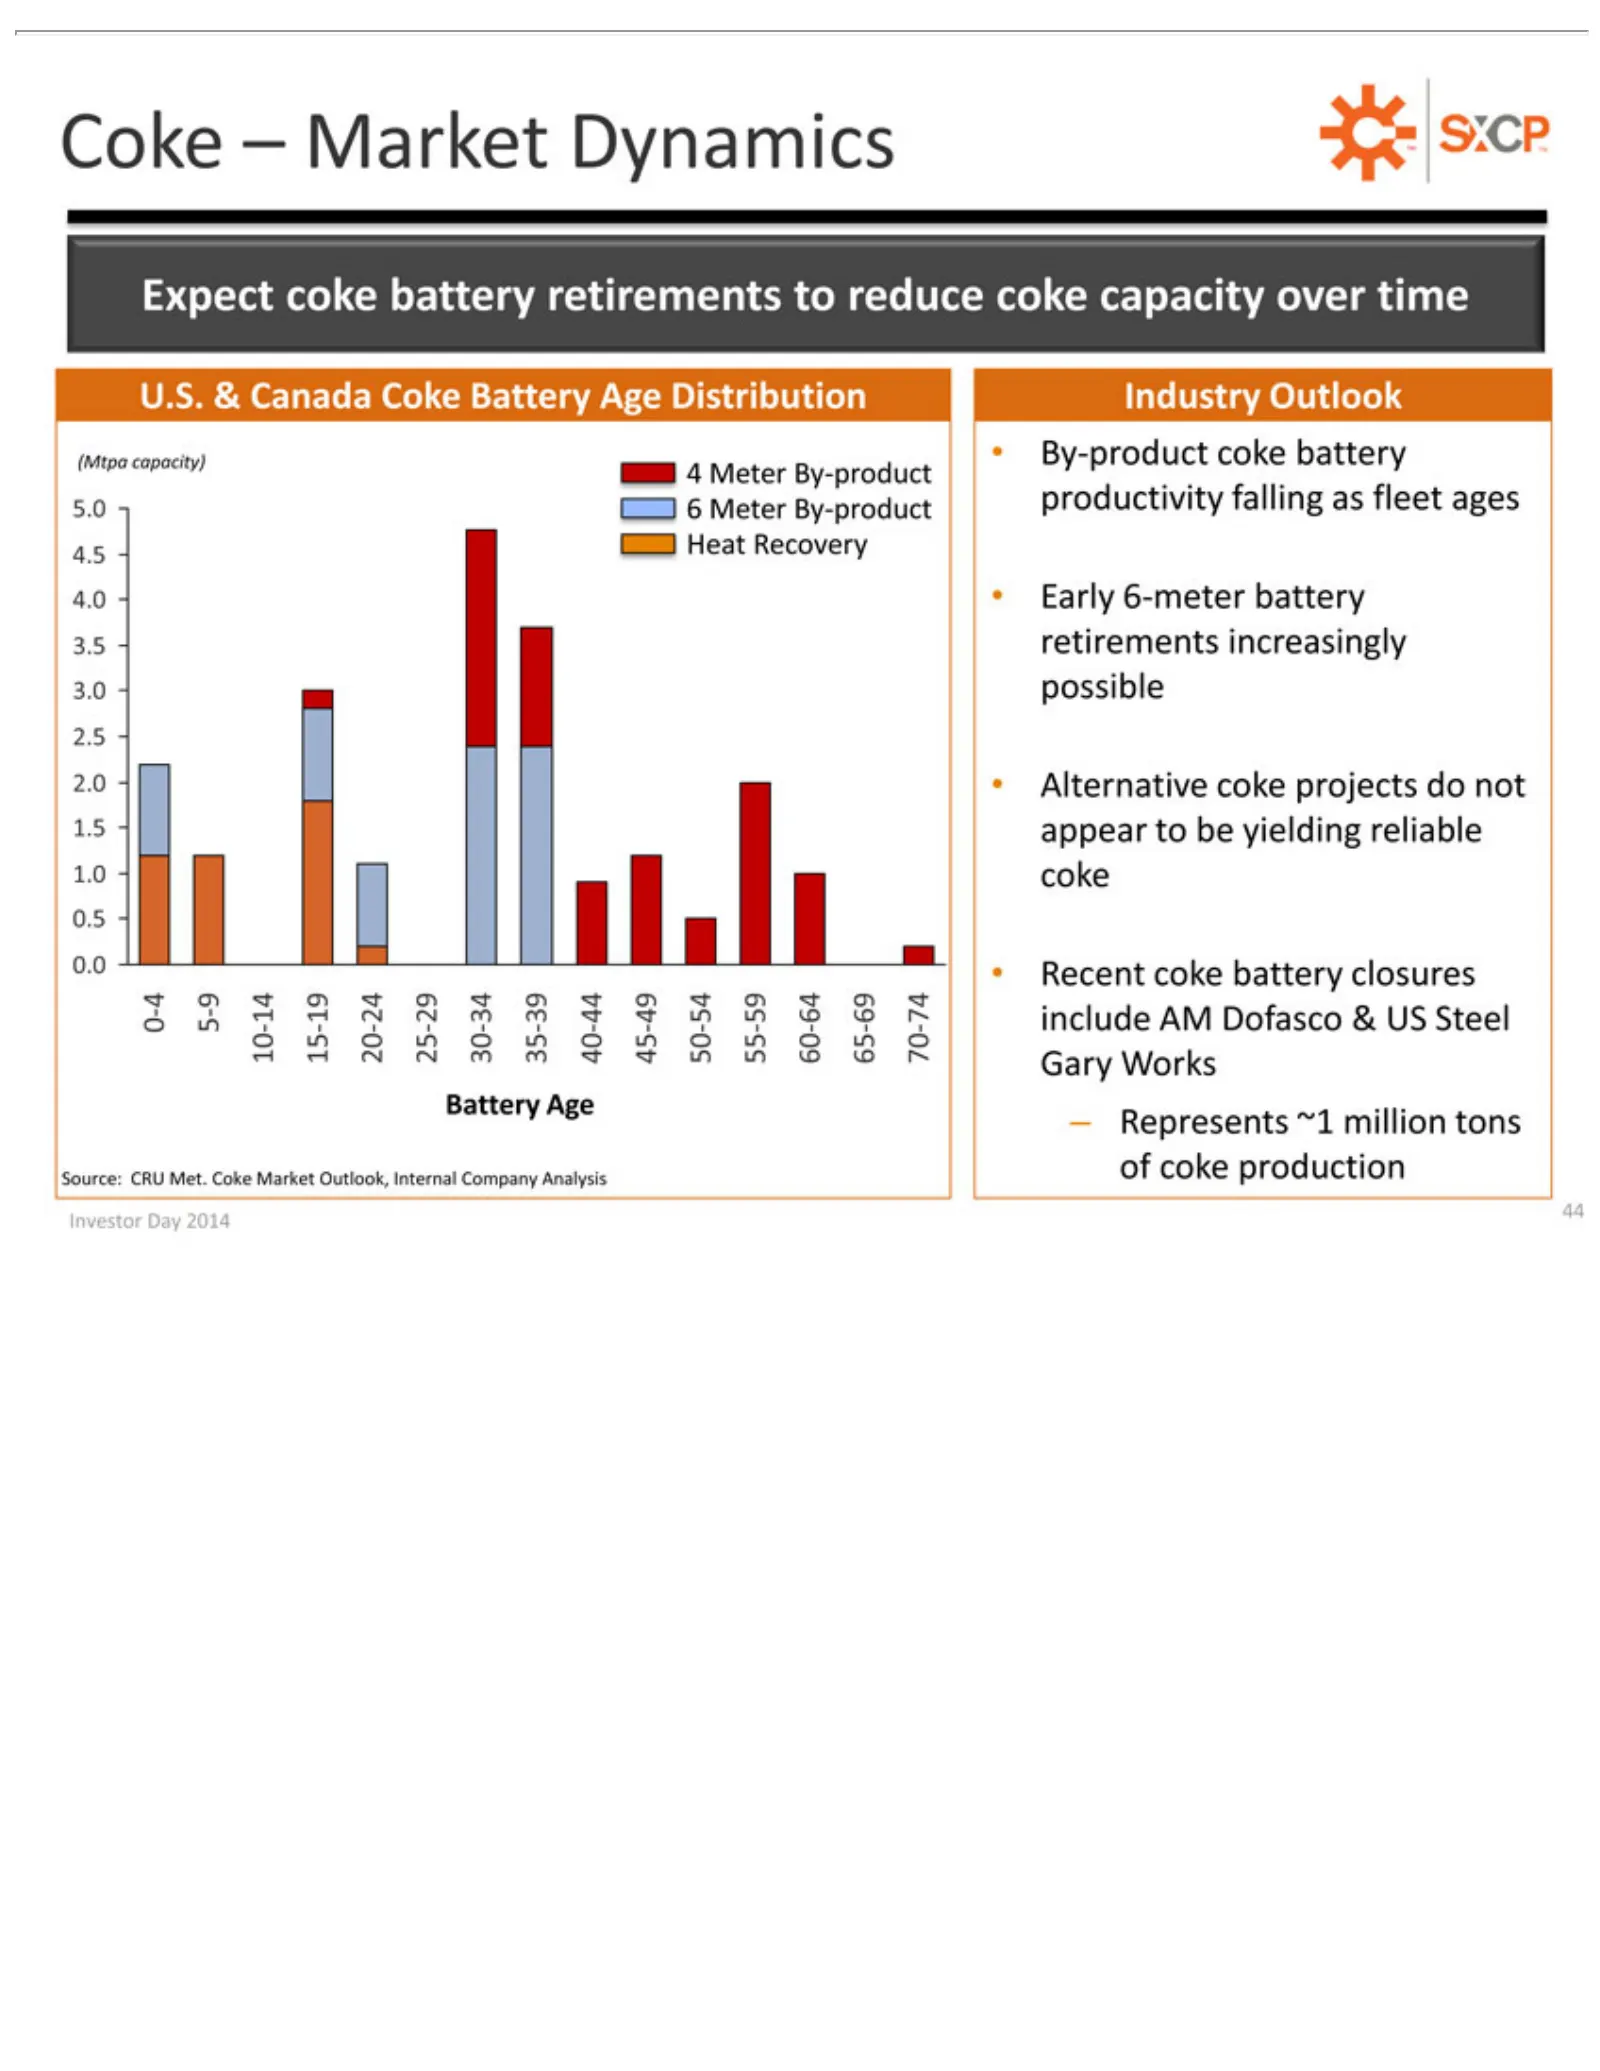
Slide 44: Expect U.S. Coke Battery Retirements
Coke Expect U.S. (Mtpa 4.0 — 49 00.0 Battery Source: Industry By-product Early Alternative –Recent 44 Investor 5Investor Represents 14 3.5 10—15—20 &–6-meter 19 capacity) 3.0 coke Canada Market Age CRU Day Outlook 242.5 coke Day 29 battery ~1 2014 Met. battery 2.0 Dynamics 34 Coke 4million 2014 — pr
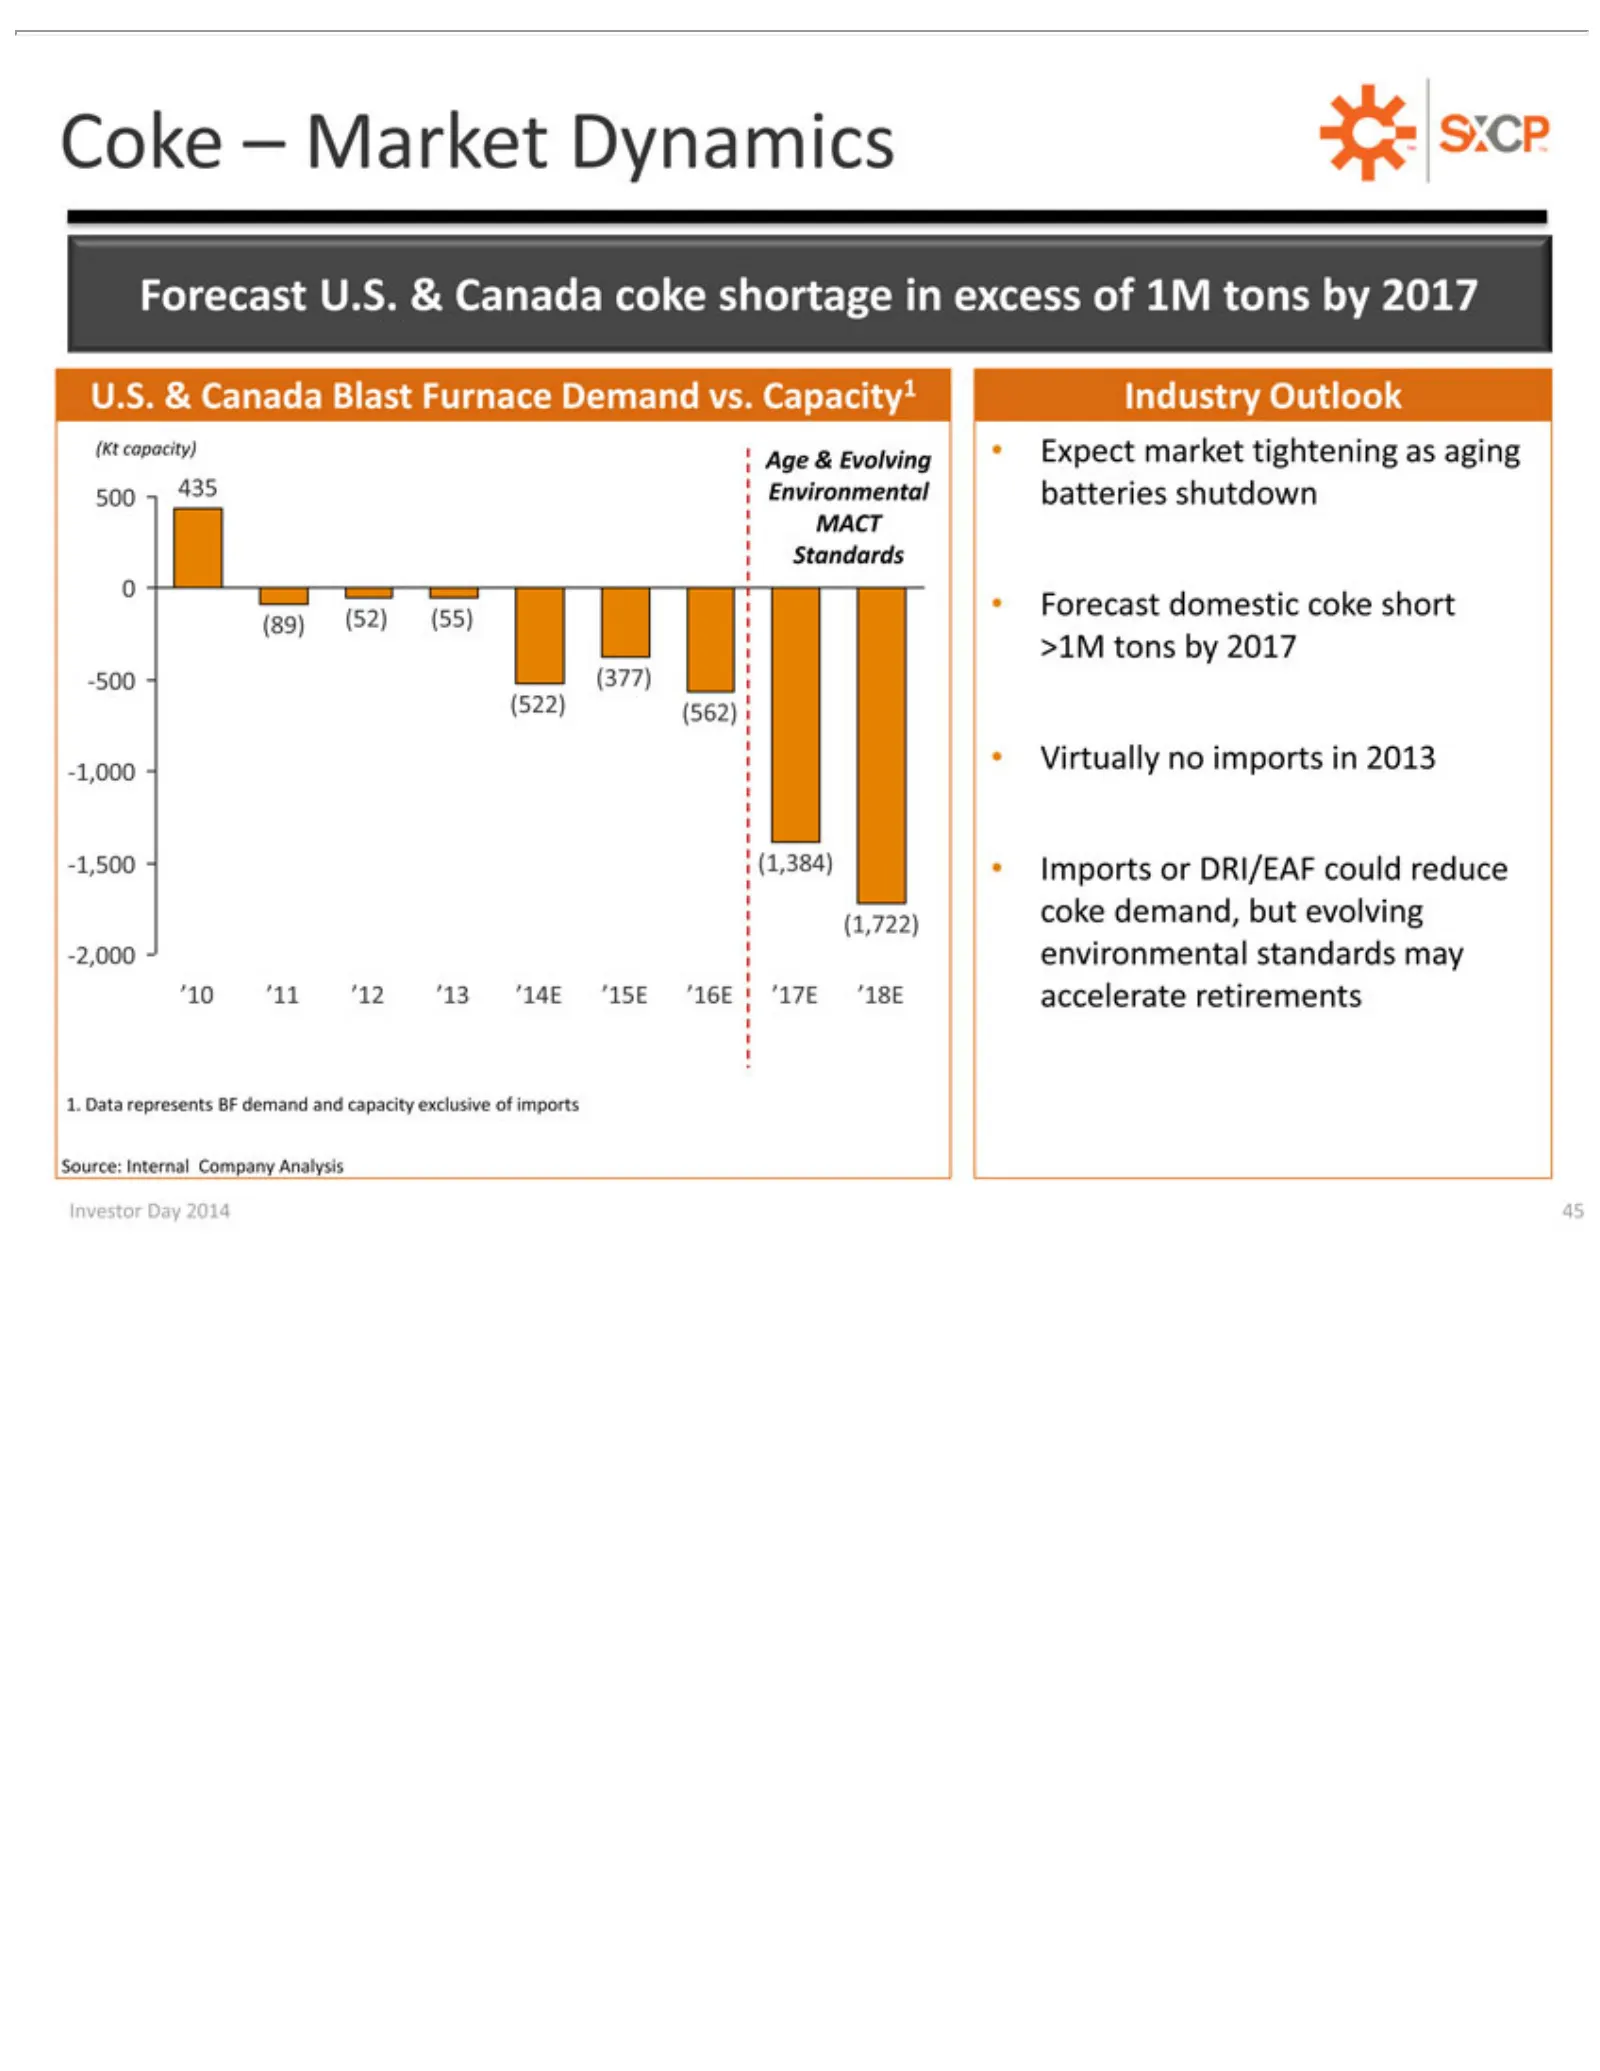
Slide 45: U.S. Coke Demand and Capacity Forecast
Coke Forecast U.S. (Kt Age 500 0F Standards MACT (89) >1M -500 (522) Virtually -1,500 -1,000 -2,000 (1,722) ’10 1. Source: Investor orecast Data capacity) ’11 435 (52) && (377) tons –(562) (1,384) environmental Evolving Canada Market ’12 represents Internal Environmental Day U.S. domestic no (55) by
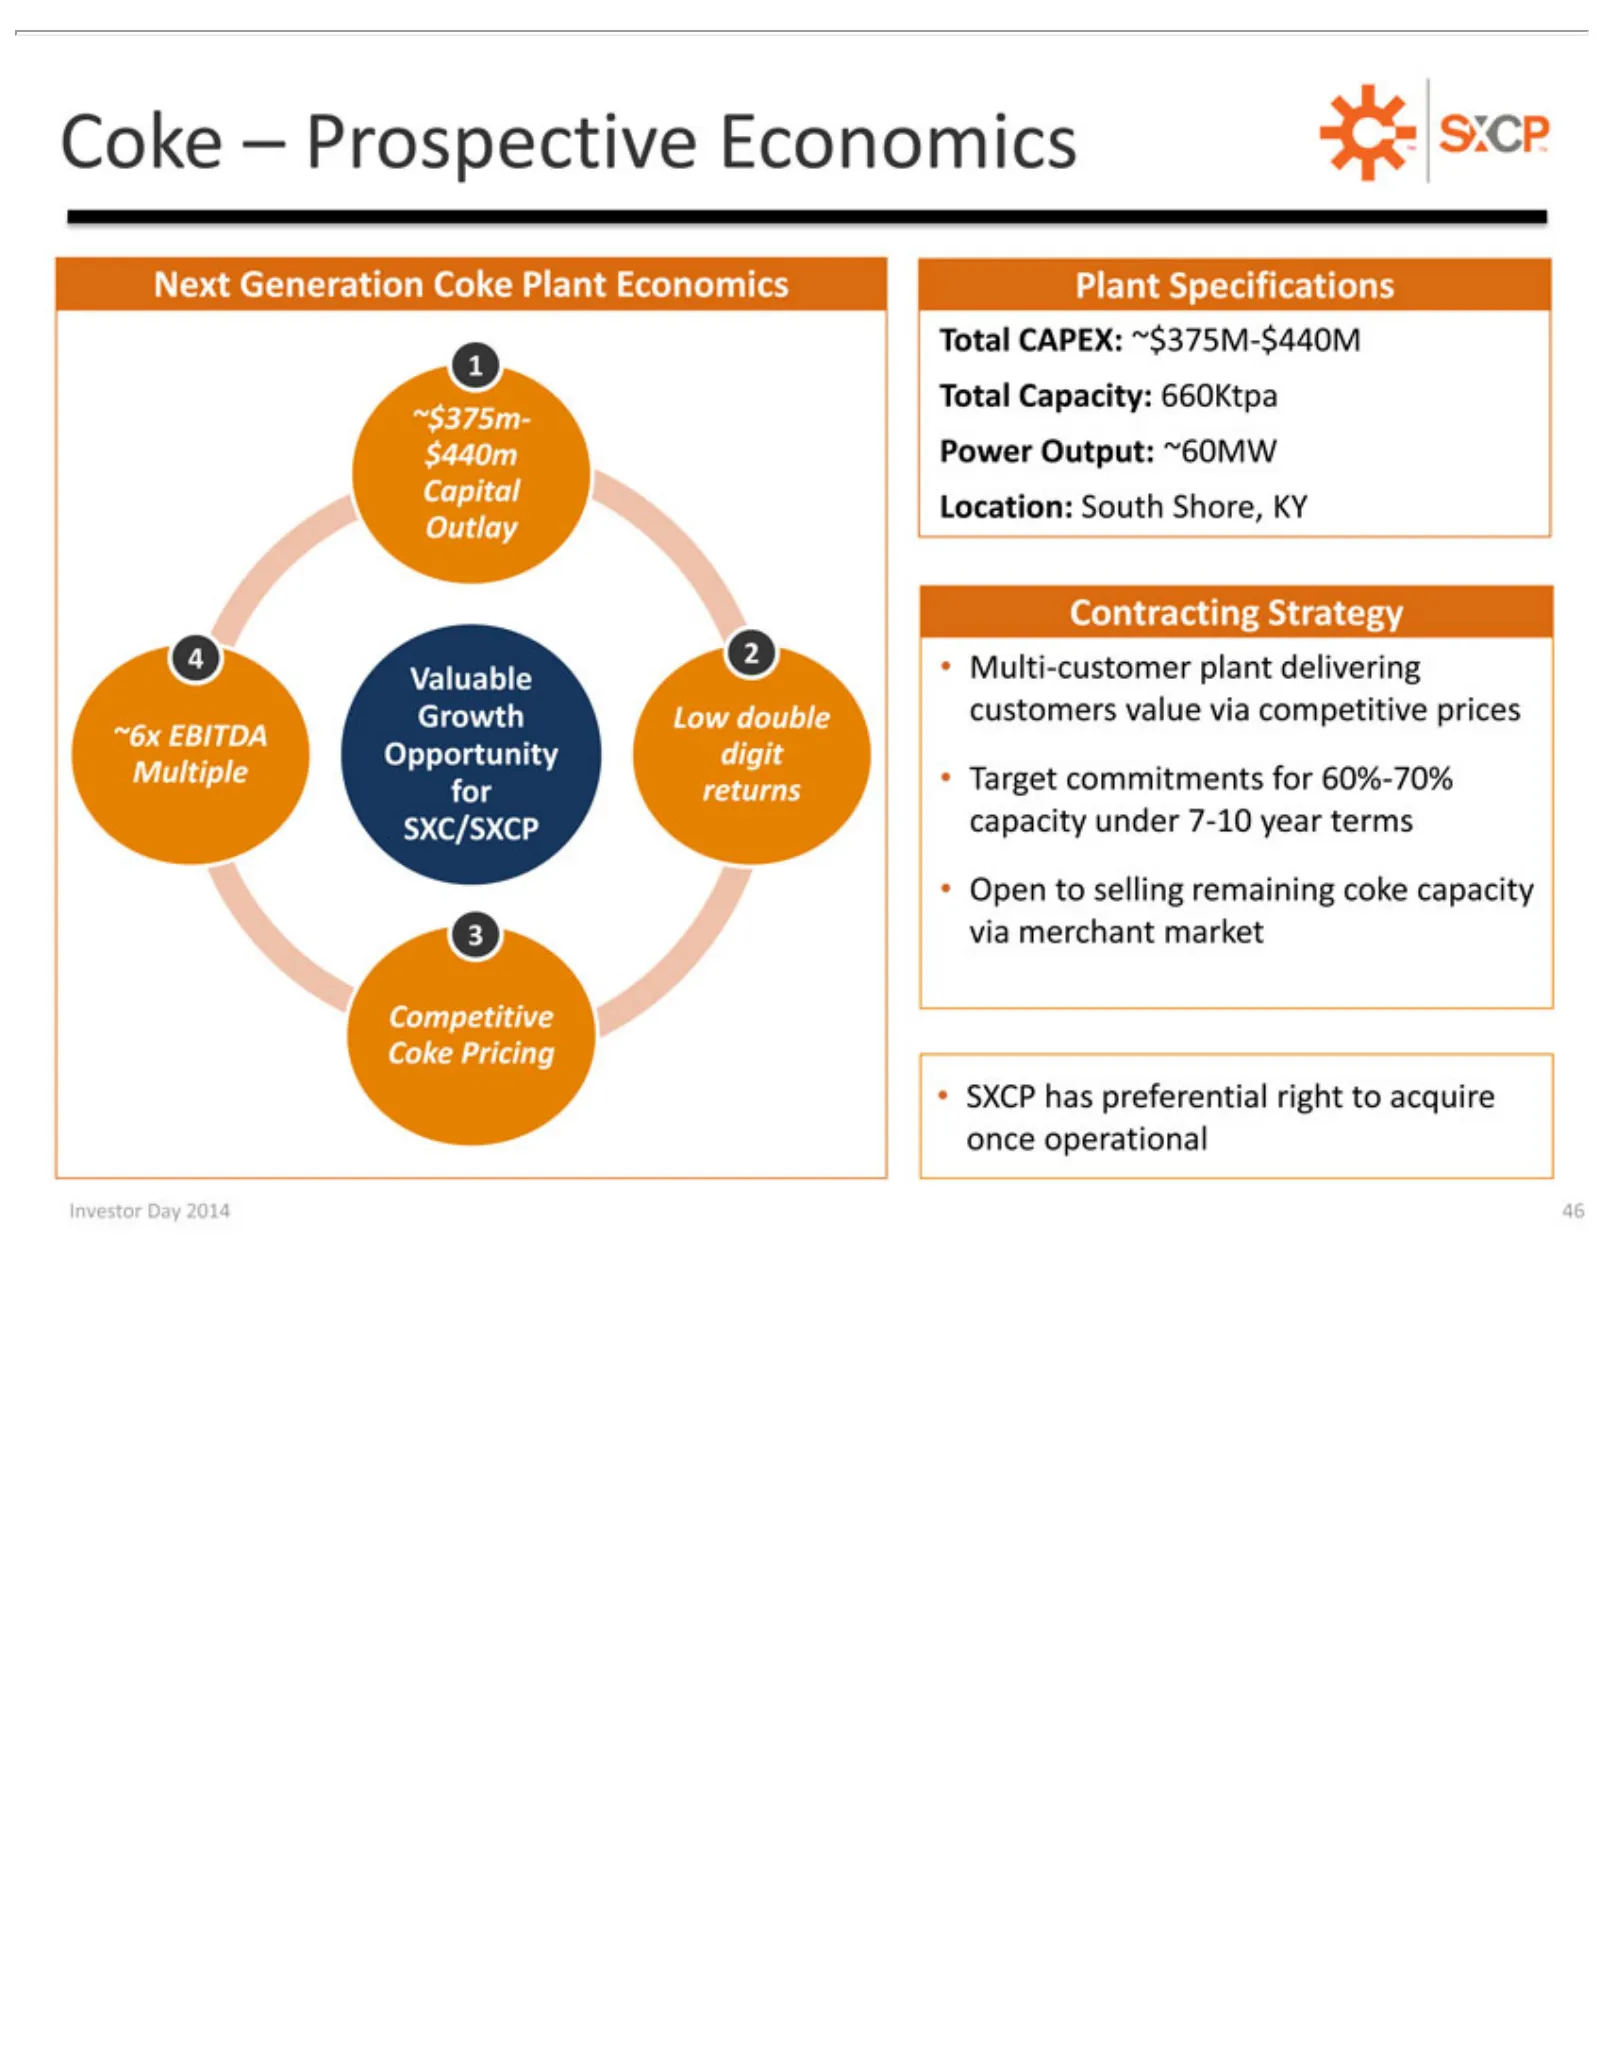
Slide 46: Next Coke Plant Economics
Coke Next Total 1T ~$375m-$440m Location: Capital Contracting 4Outlay Valuable Opportunity Multiple SXC/SXCP Open Competitive SXCP Investor otal 2 Generation CAPEX: Capacity: –tohas Prospective selling Day • South Target preferential Multi-customer capacity Strategy digit Coke 2014 ~$375M-$440M rema
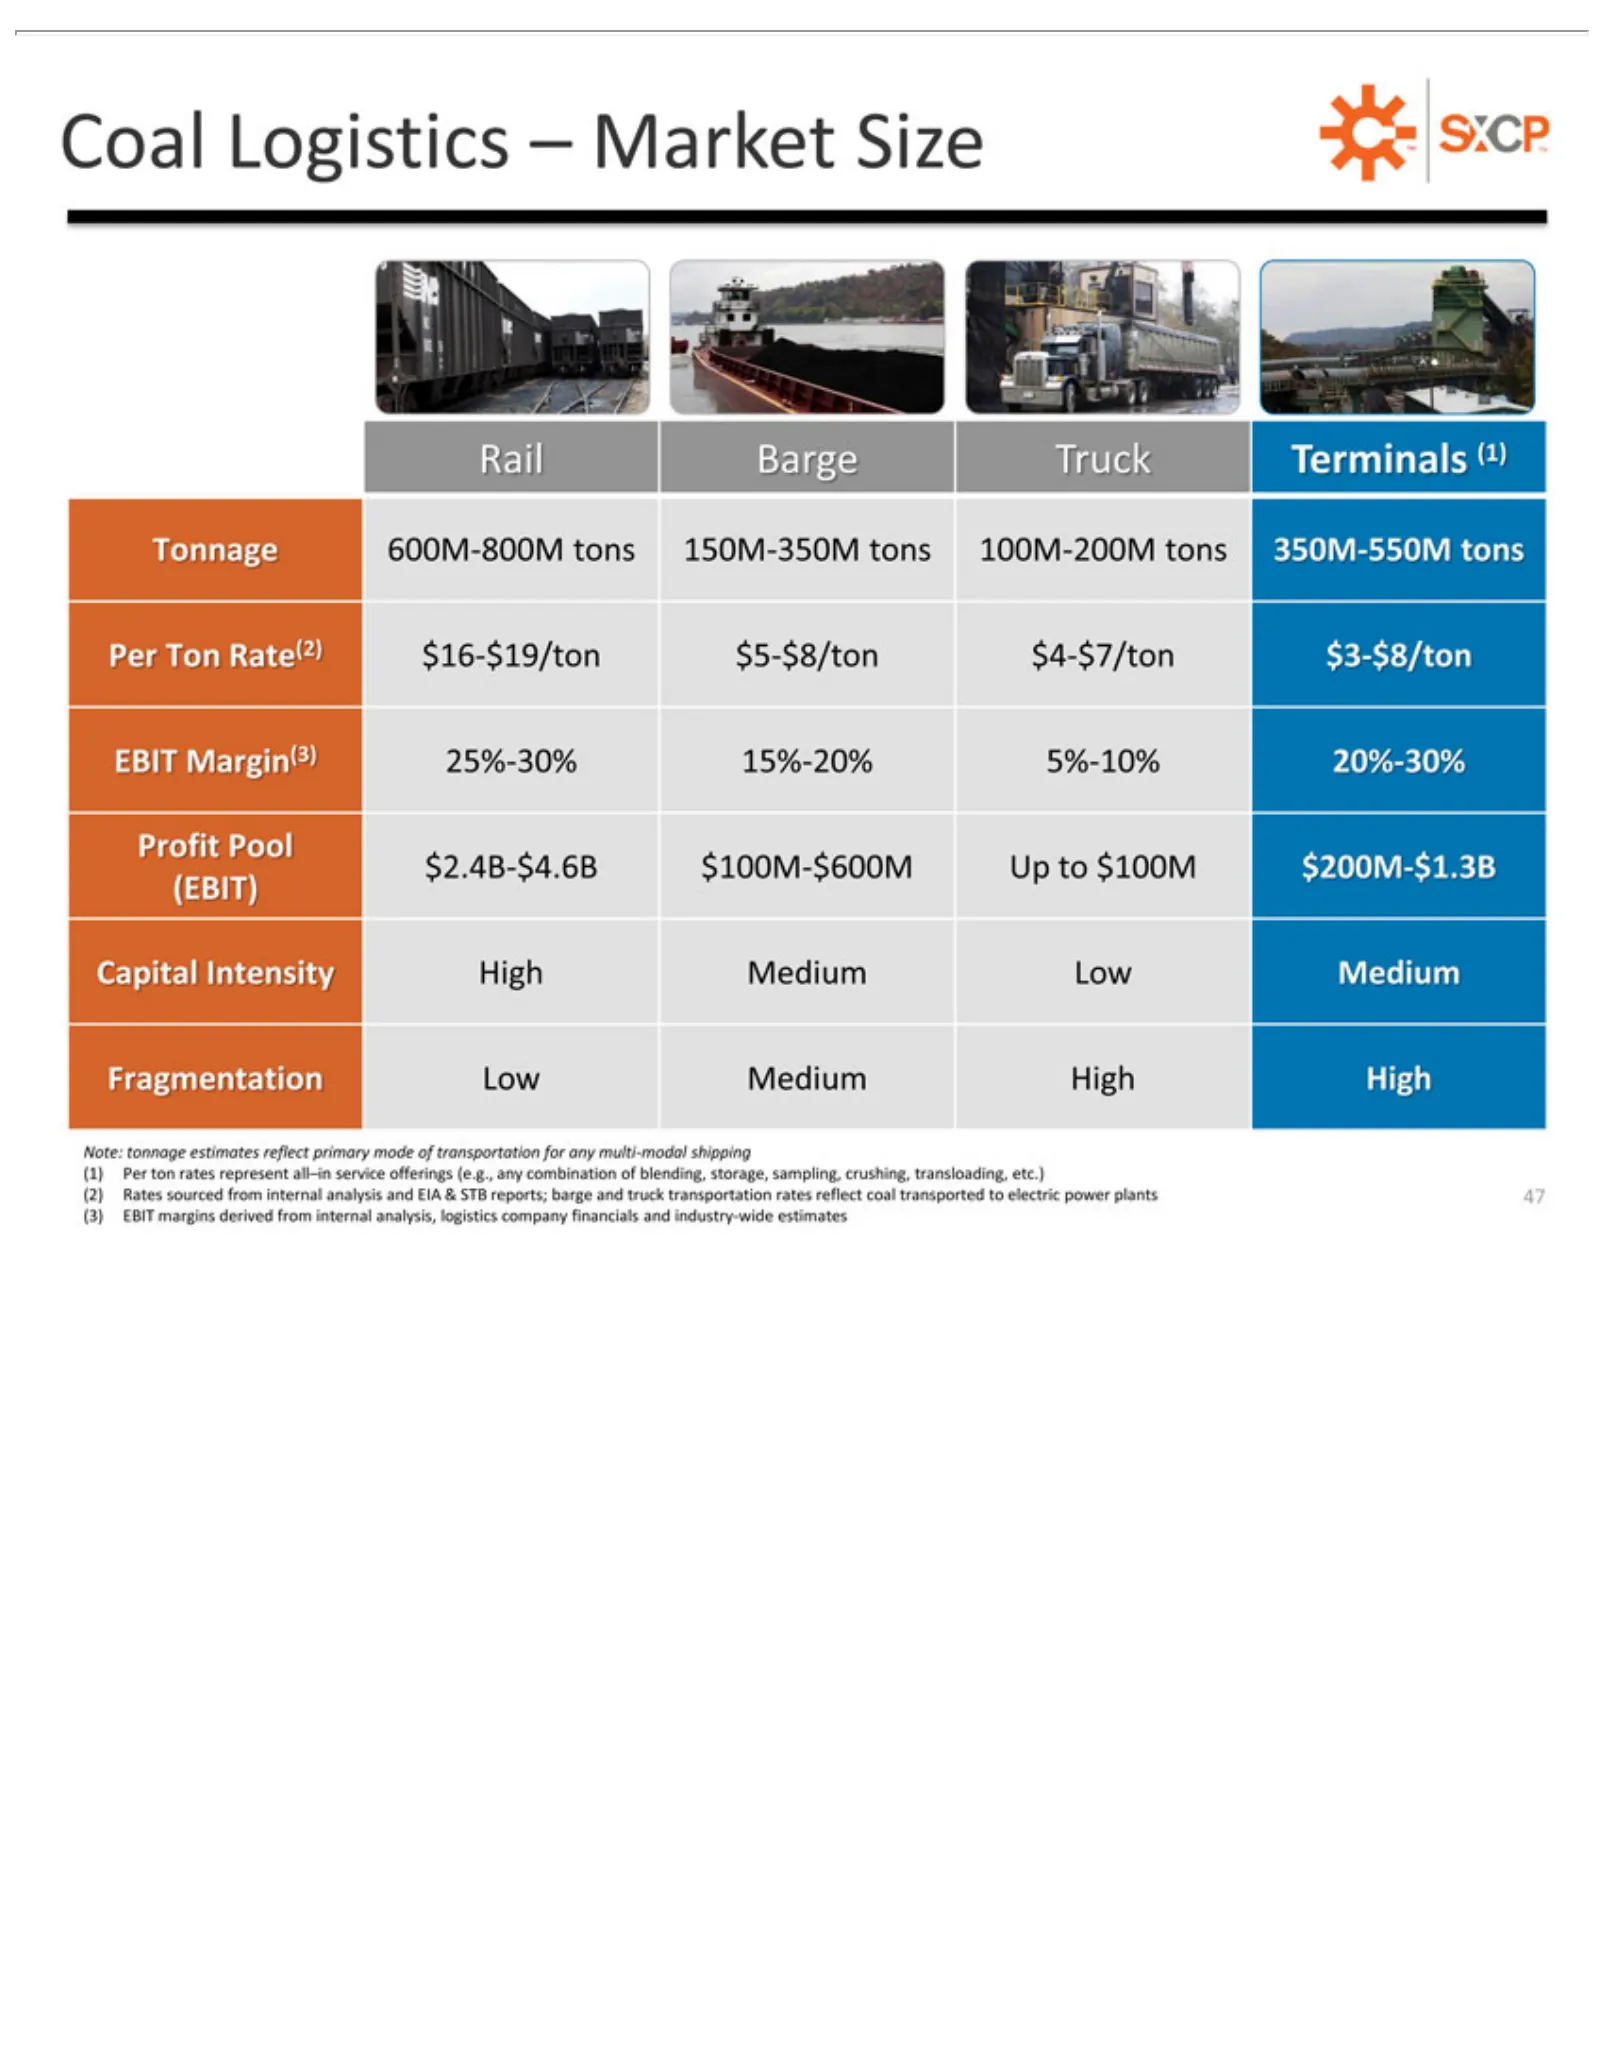
Slide 47: Coal Logistics Market Fragmentation
CoalRates Rail Tonnage Profit Capital (EBIT) Fragmentation Note: (1) (2) logistics Investor Per Barge Logistics tonnage Pool ton Intensity Day company 600M-800M sourced Truck rates $2.4B-$4.6B 2014 estimates –Low represent Market High Terminals from financials 47 Medium tons Medium internal reflect
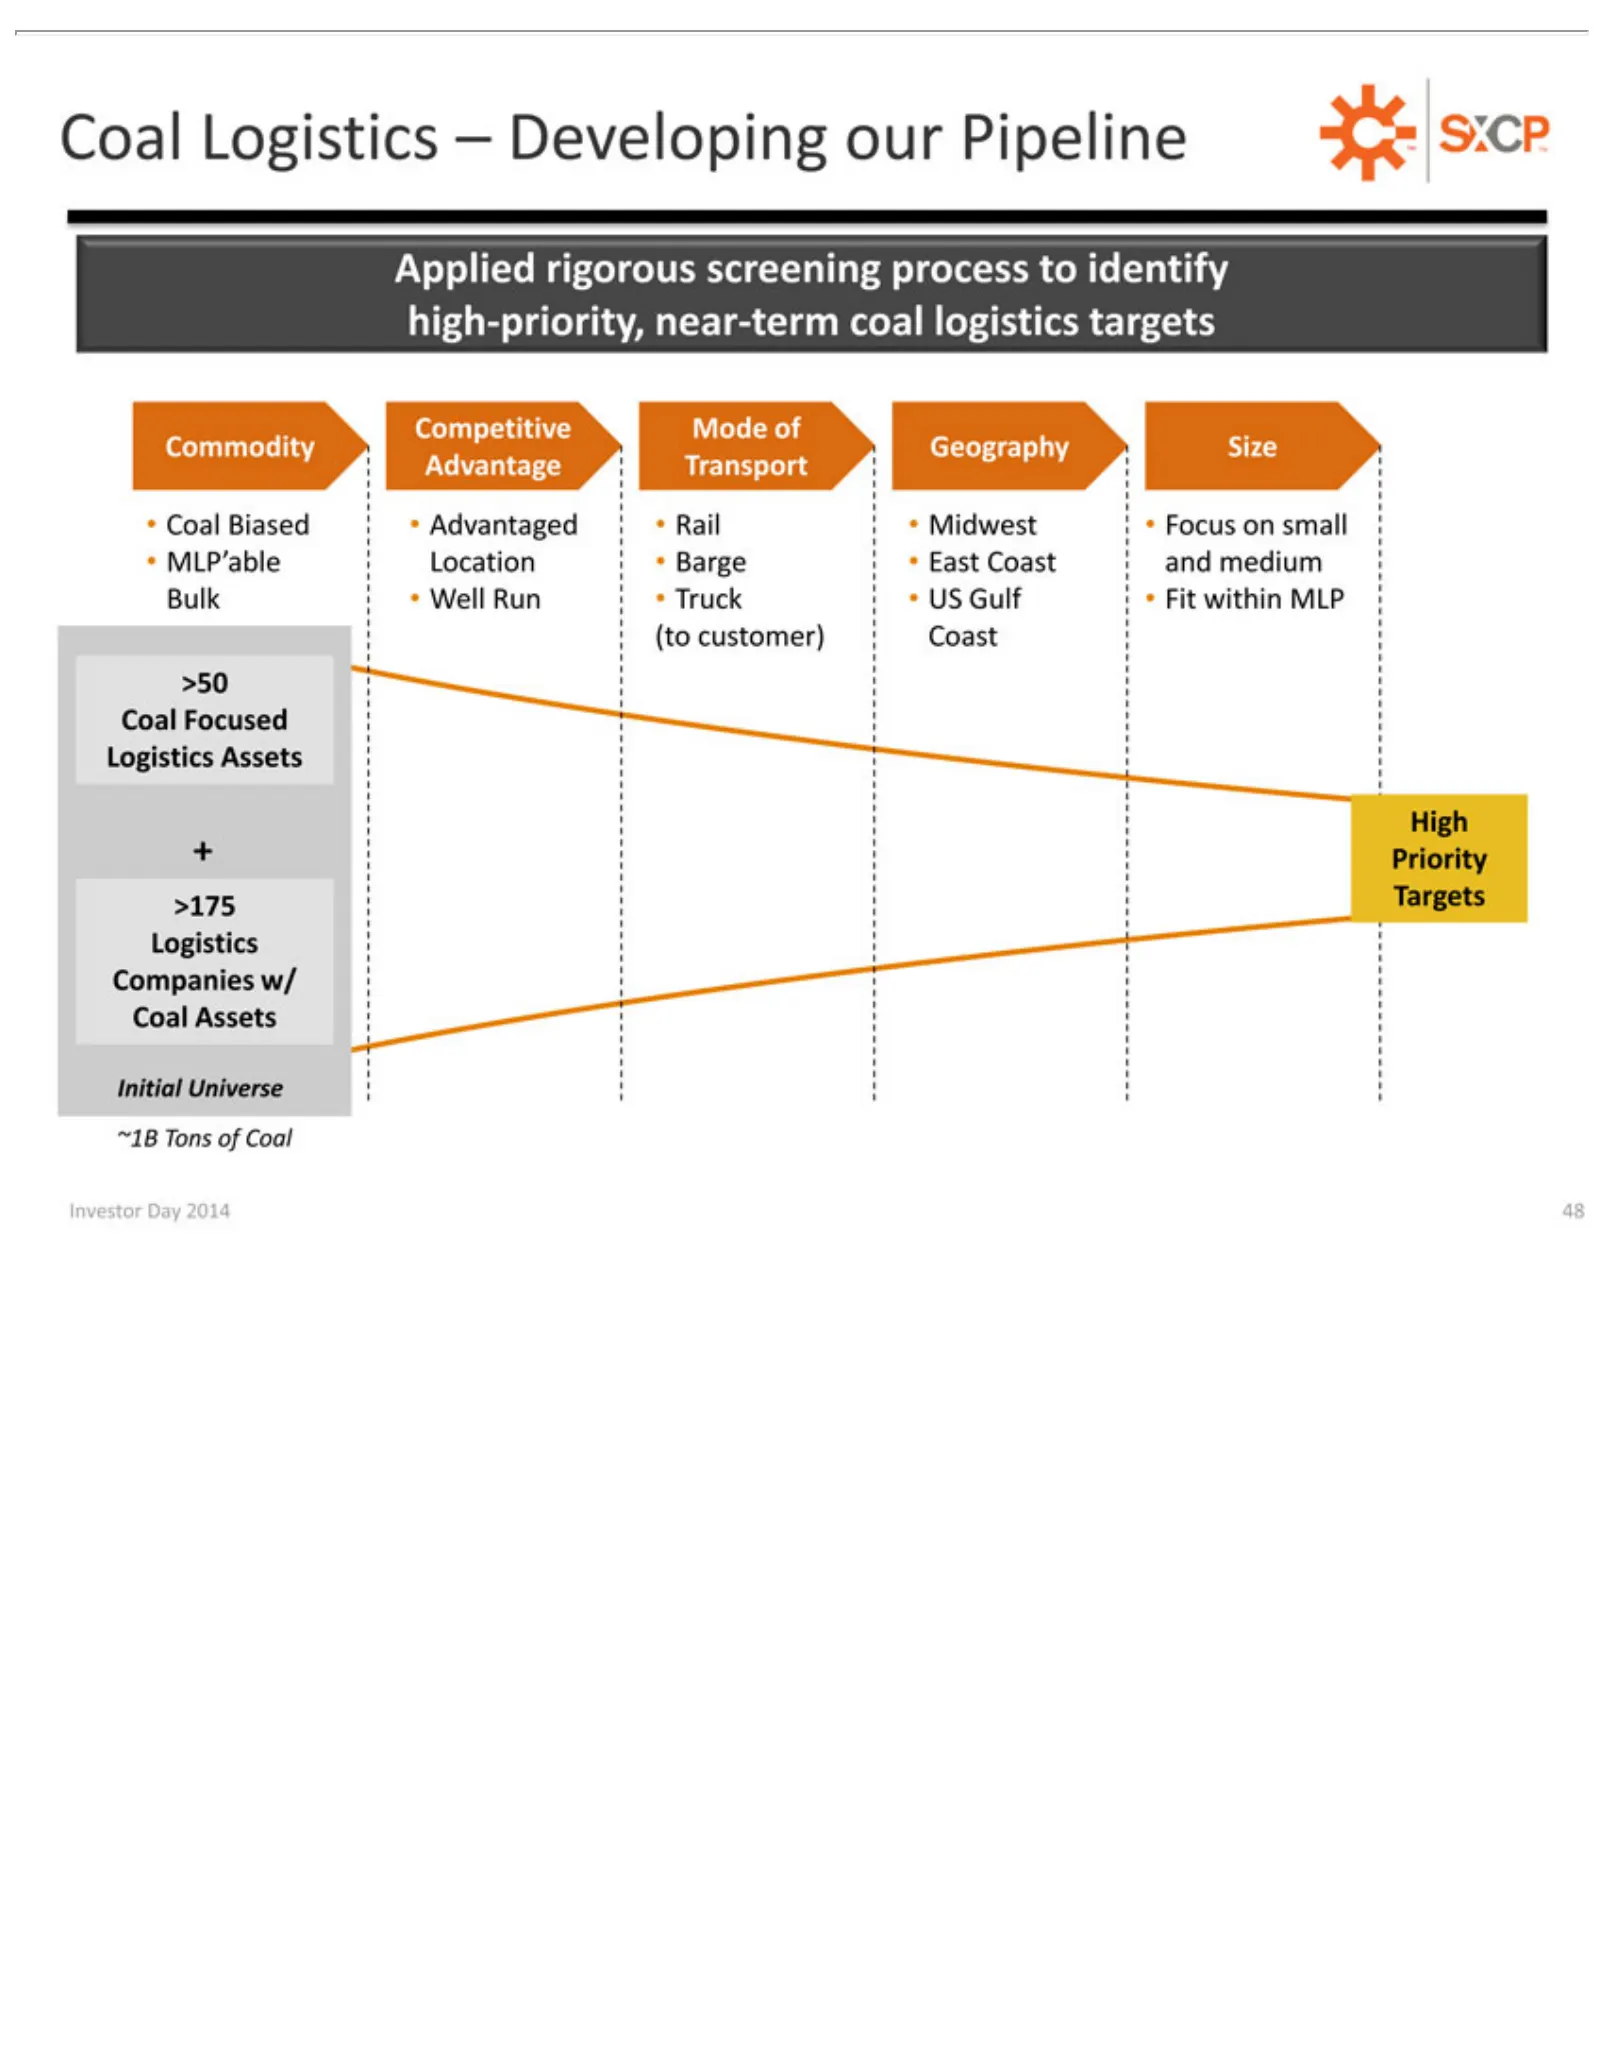
Slide 48: Applied Competitive Coal Logistics Screening
Applied Competitive Commodity Coal MLP’able (to >50 + High Initial ~1B Investor Priority customer) Coal Tons Logistics Biased Universe rigorous Day Focused >175 of Location Geography Advantaged Mode Coal 2014 Coast –Targets Developing screening Logistics 48 of Barge Logistics Size Rail East process
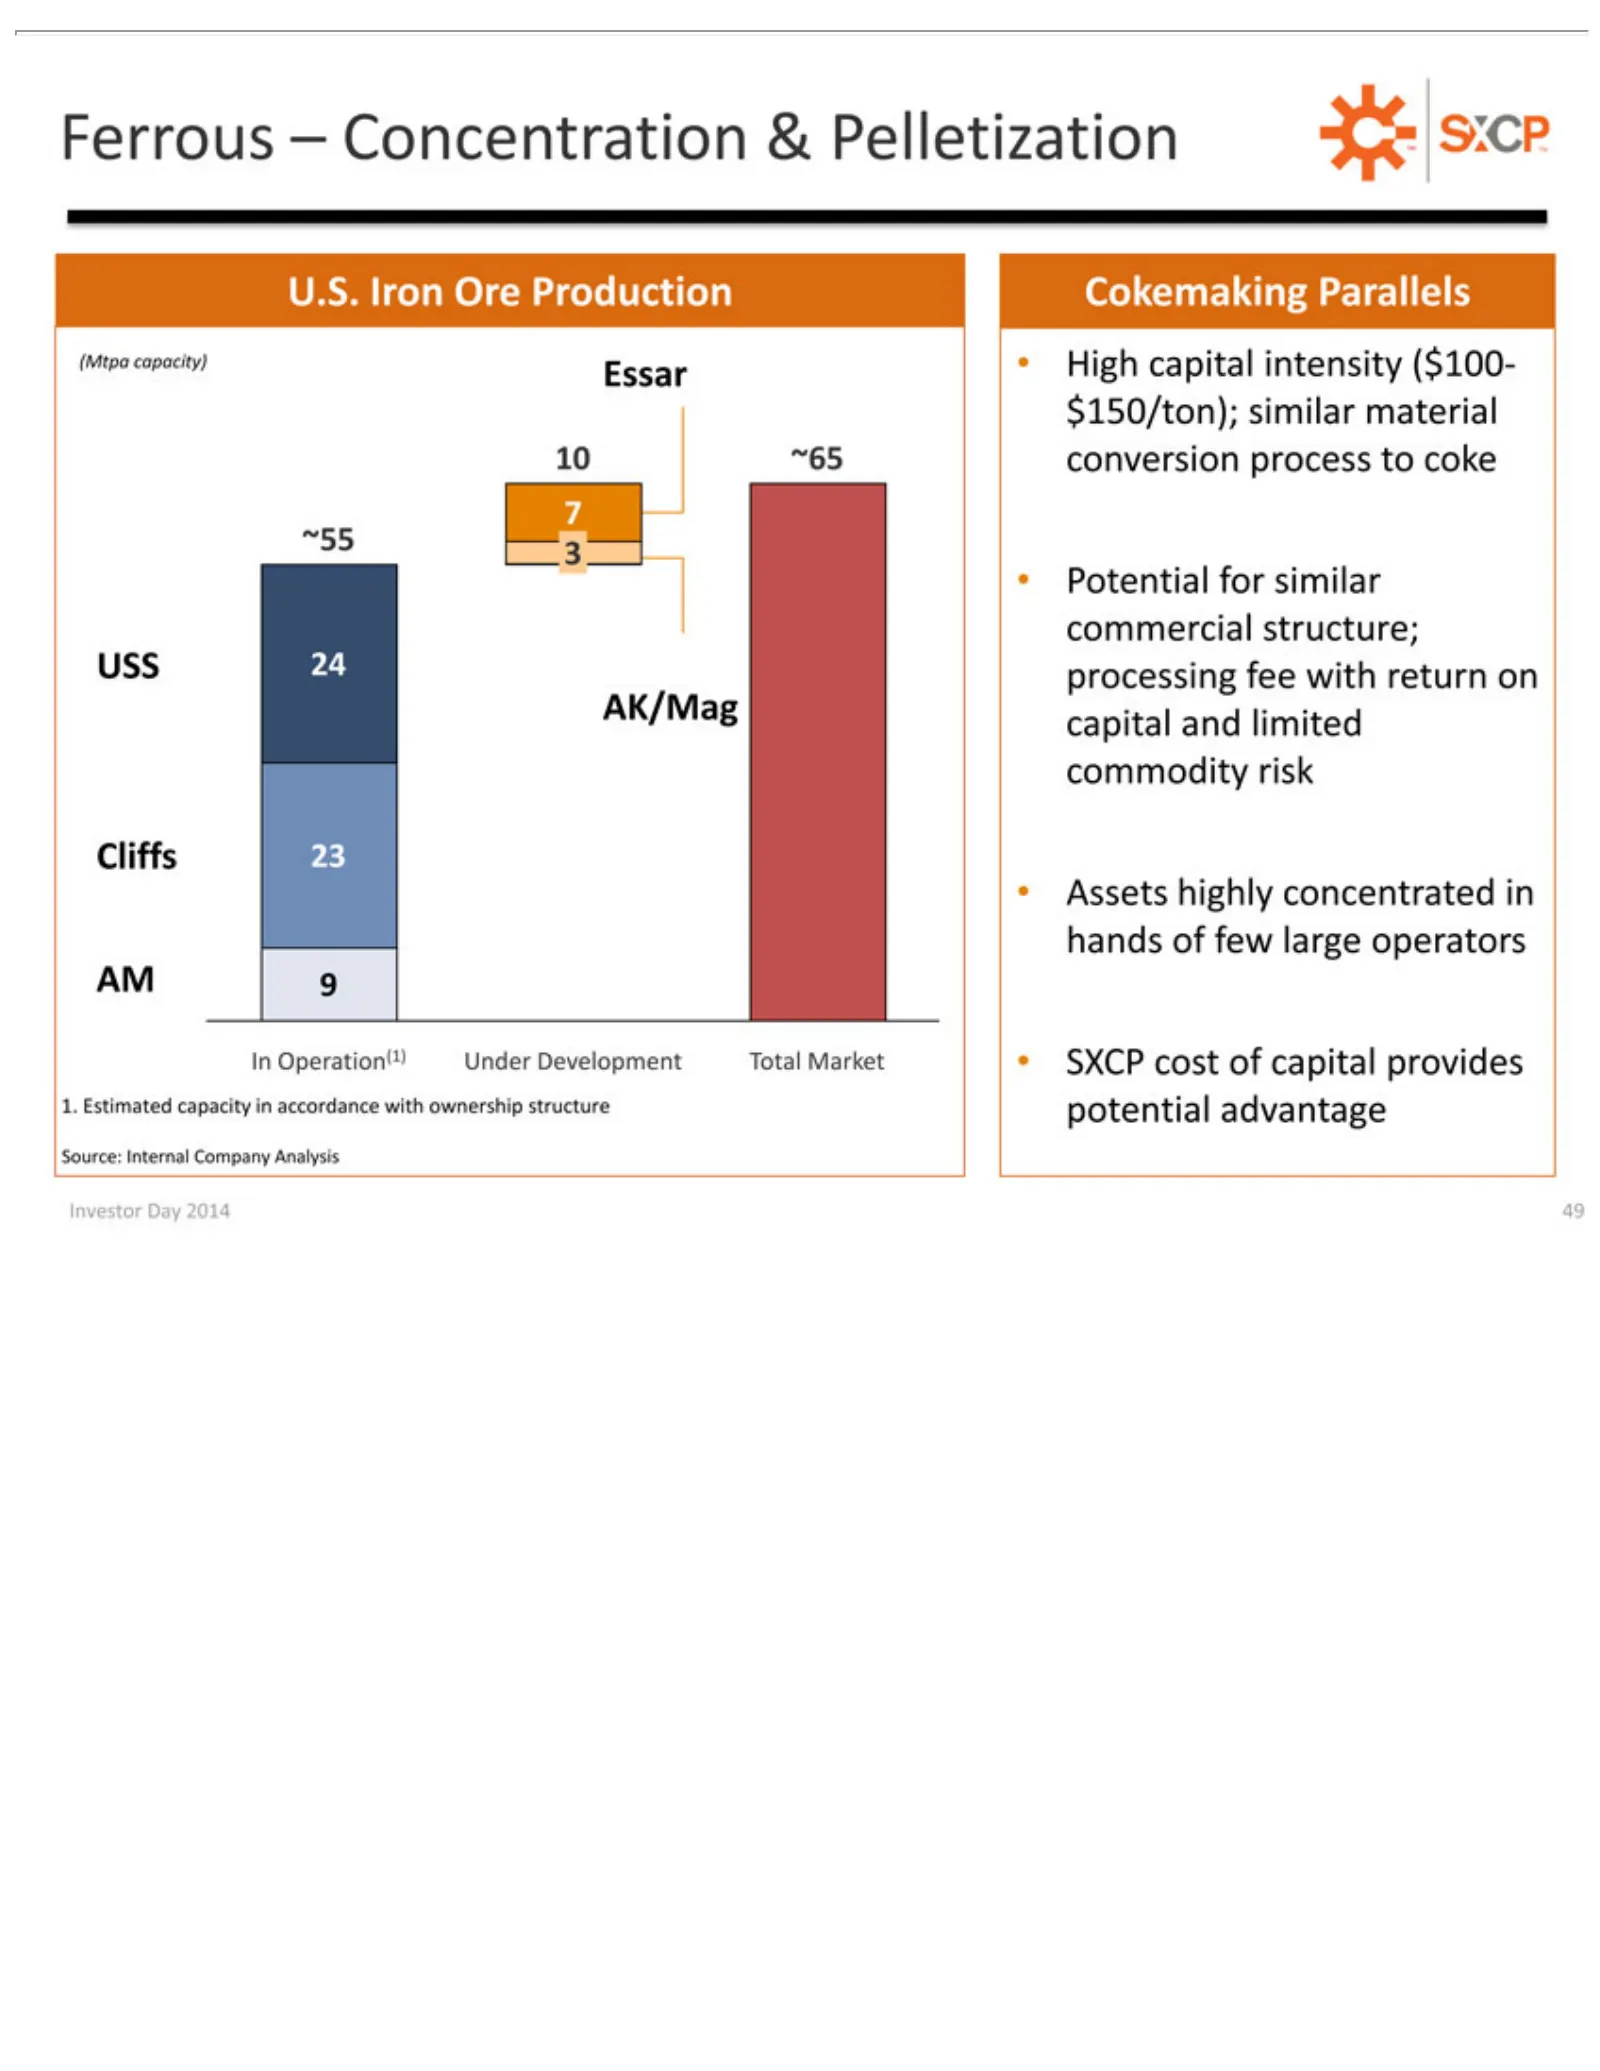
Slide 49: Ferrous: U.S. Iron Ore Processing Capacity
Ferrous U.S. (Mtpa 10 ~55 Potential USS AK/Mag •Cliffs AM In 1. Source: Investor Assets Estimated Operation(1) ~65 79Iron 24 23 3capacity) conversion Internal –processing highly Day for capital Ore Concentration similar capacity 2014 Production concentrated Under Essar Company andprocess 49 fee comm
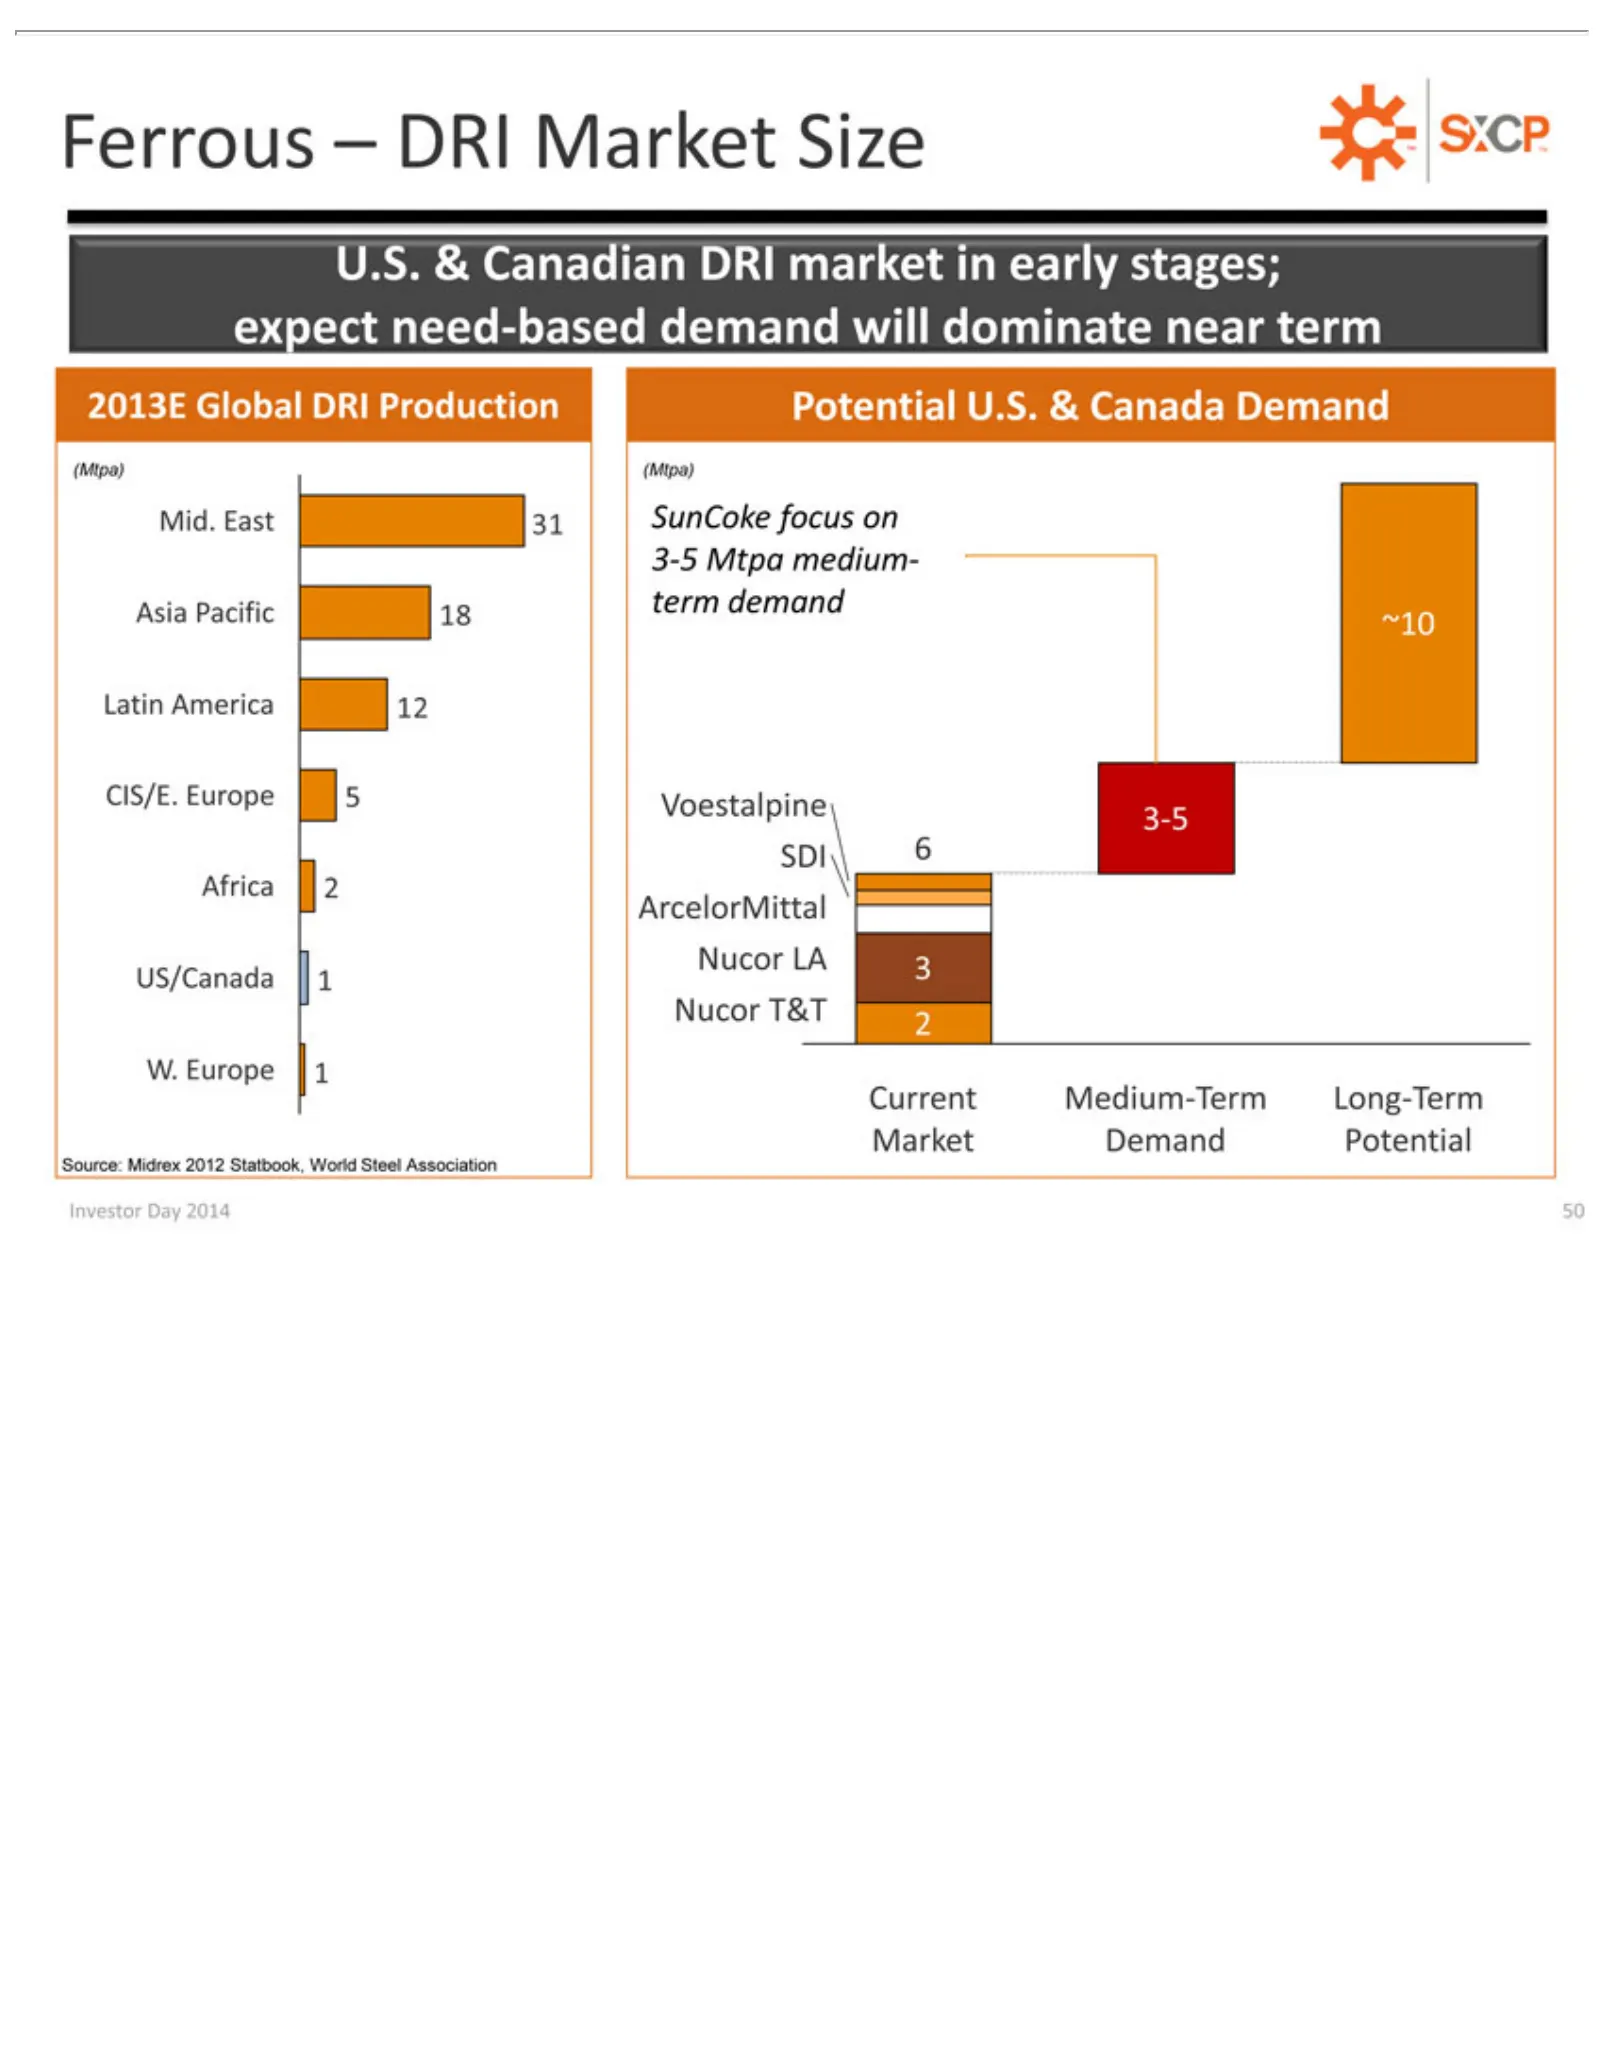
Slide 50: Ferrous: DRI Market Size
Ferrous U.S. 2013E (Mtpa) Mid. Asia 18 Latin CIS/E. 3-5 Africa ArcelorMittal US/Canada Nucor W. Current Source: Investor ~10 Europe SDI & Pacific East America T&T 2Global Europe (Mtpa) Canadian Medium-Term Midrex –6Day DRI 31 112term SunCoke 2014 Nucor DRI 12 Market 52012 Voestalpine DRI demand 50 P
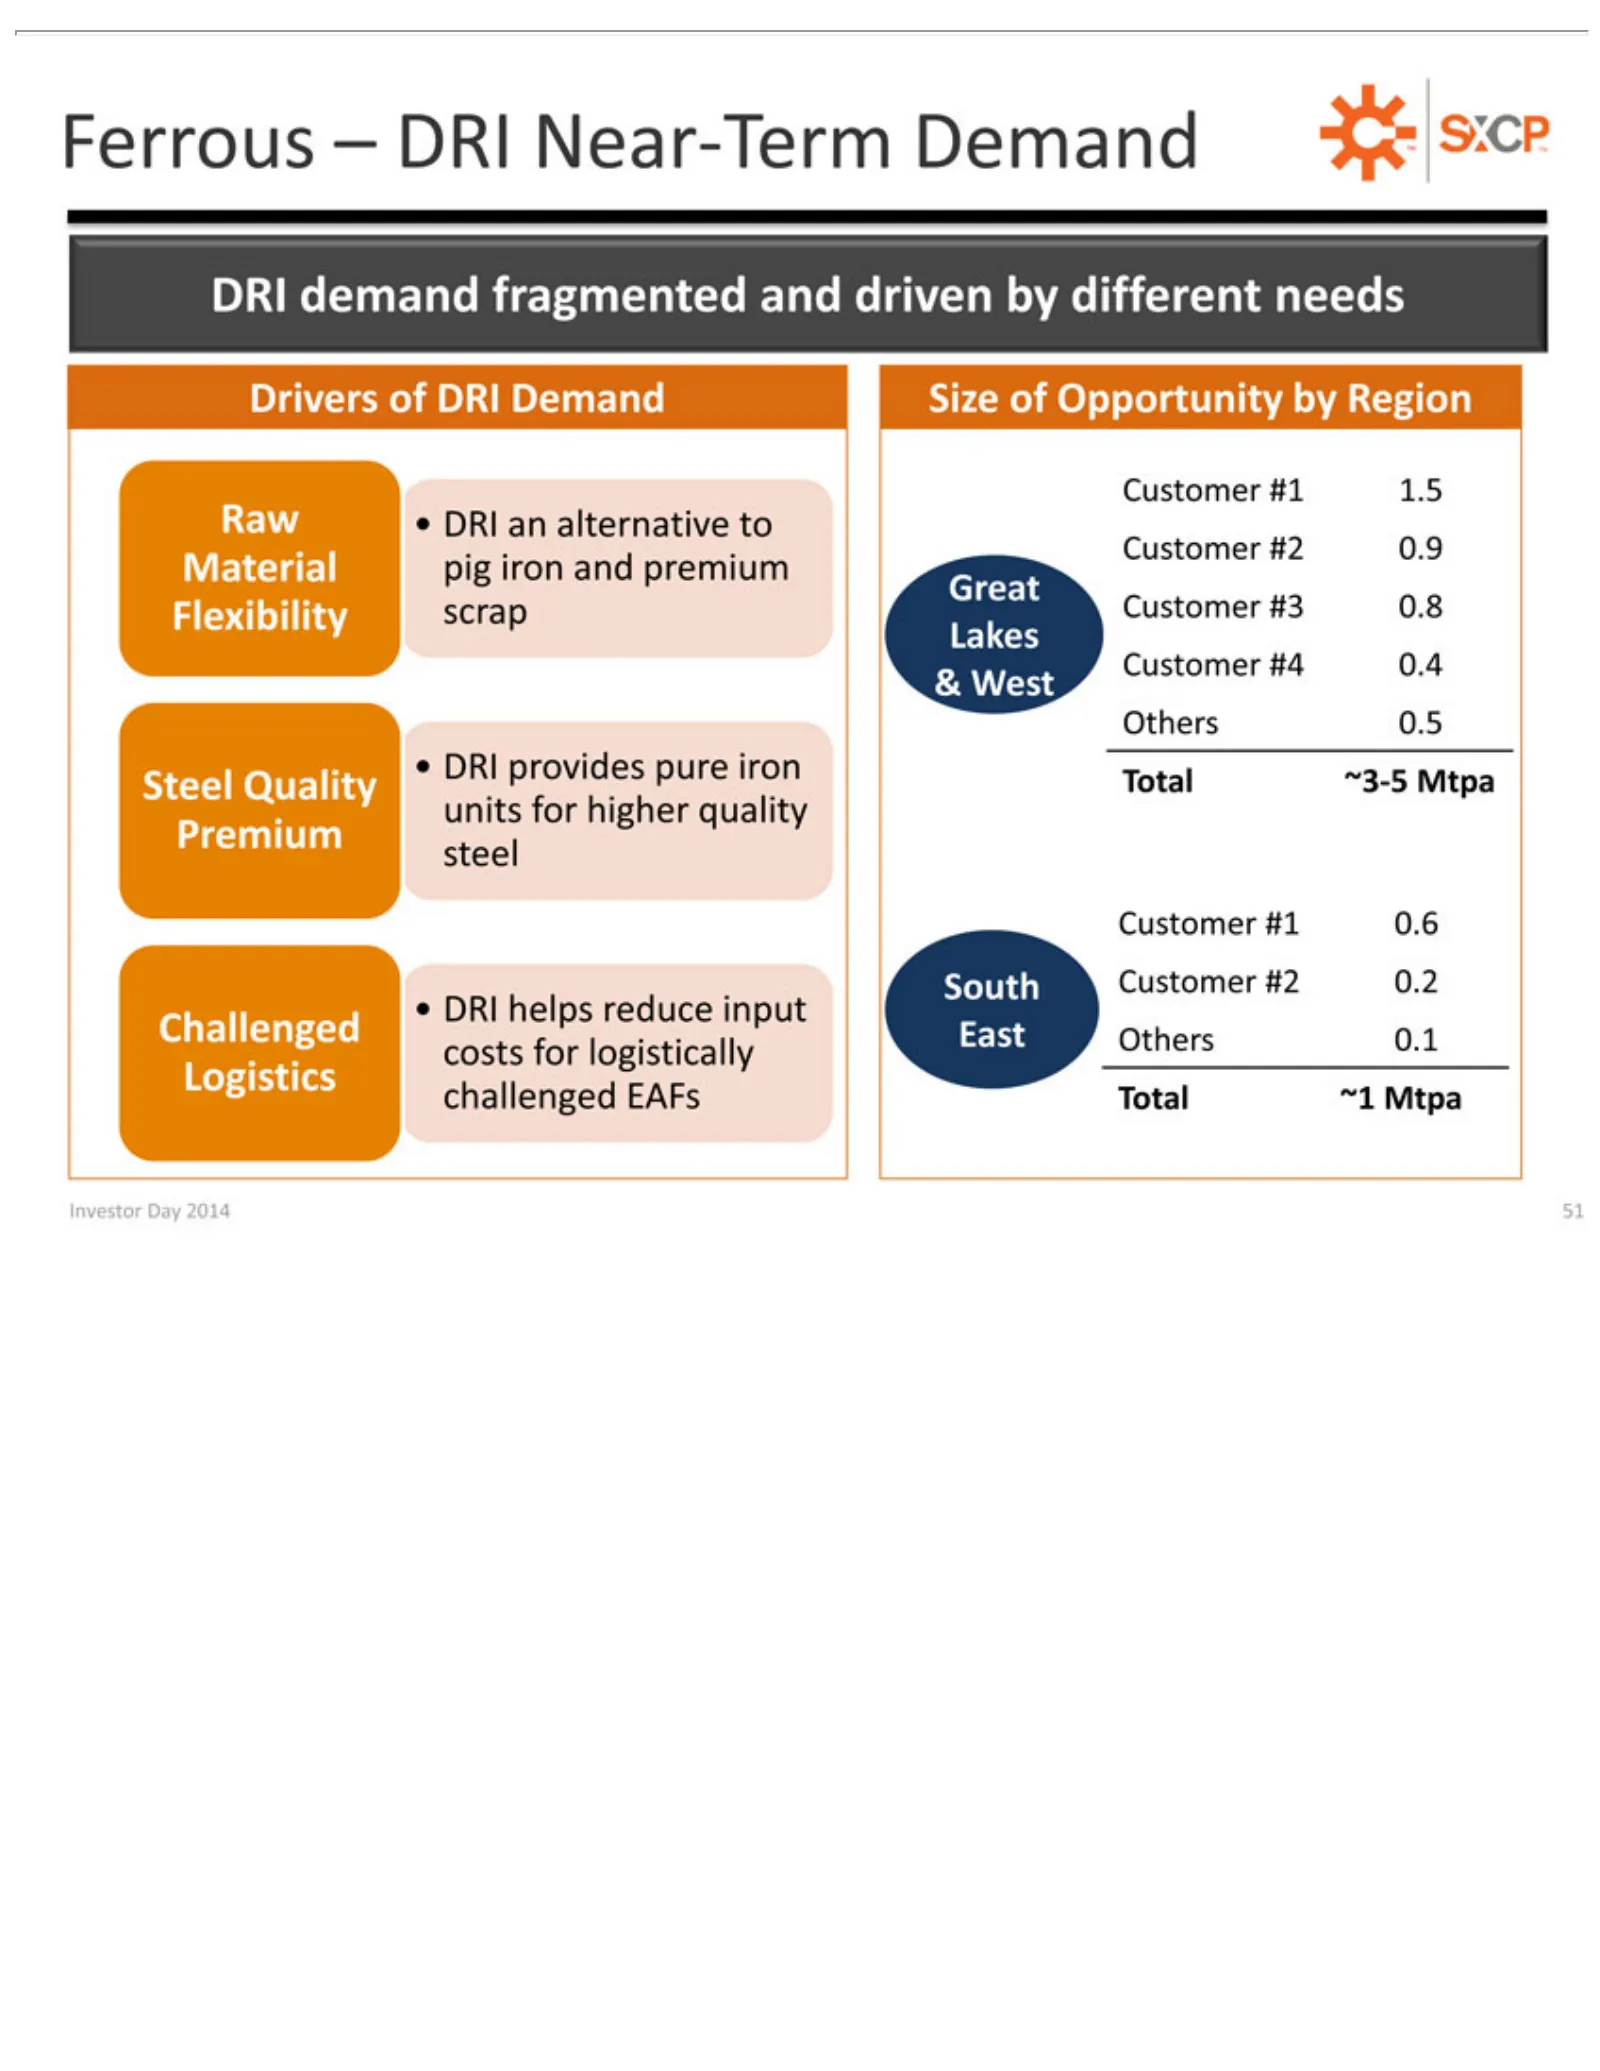
Slide 51: Ferrous Drivers: DRI Demand
Ferrous Drivers Raw Flexibility Great & •Others Steel units Customer steel Premium DRI .6 Challenged costs challenged Logistics Investor DRI West demand helps •for Quality provides DRI 0.5 of –Day higher logistically DRI #1 DRI reduce scrap EAFs an East fragmented 01.5 2014 alternative Near-Term pur
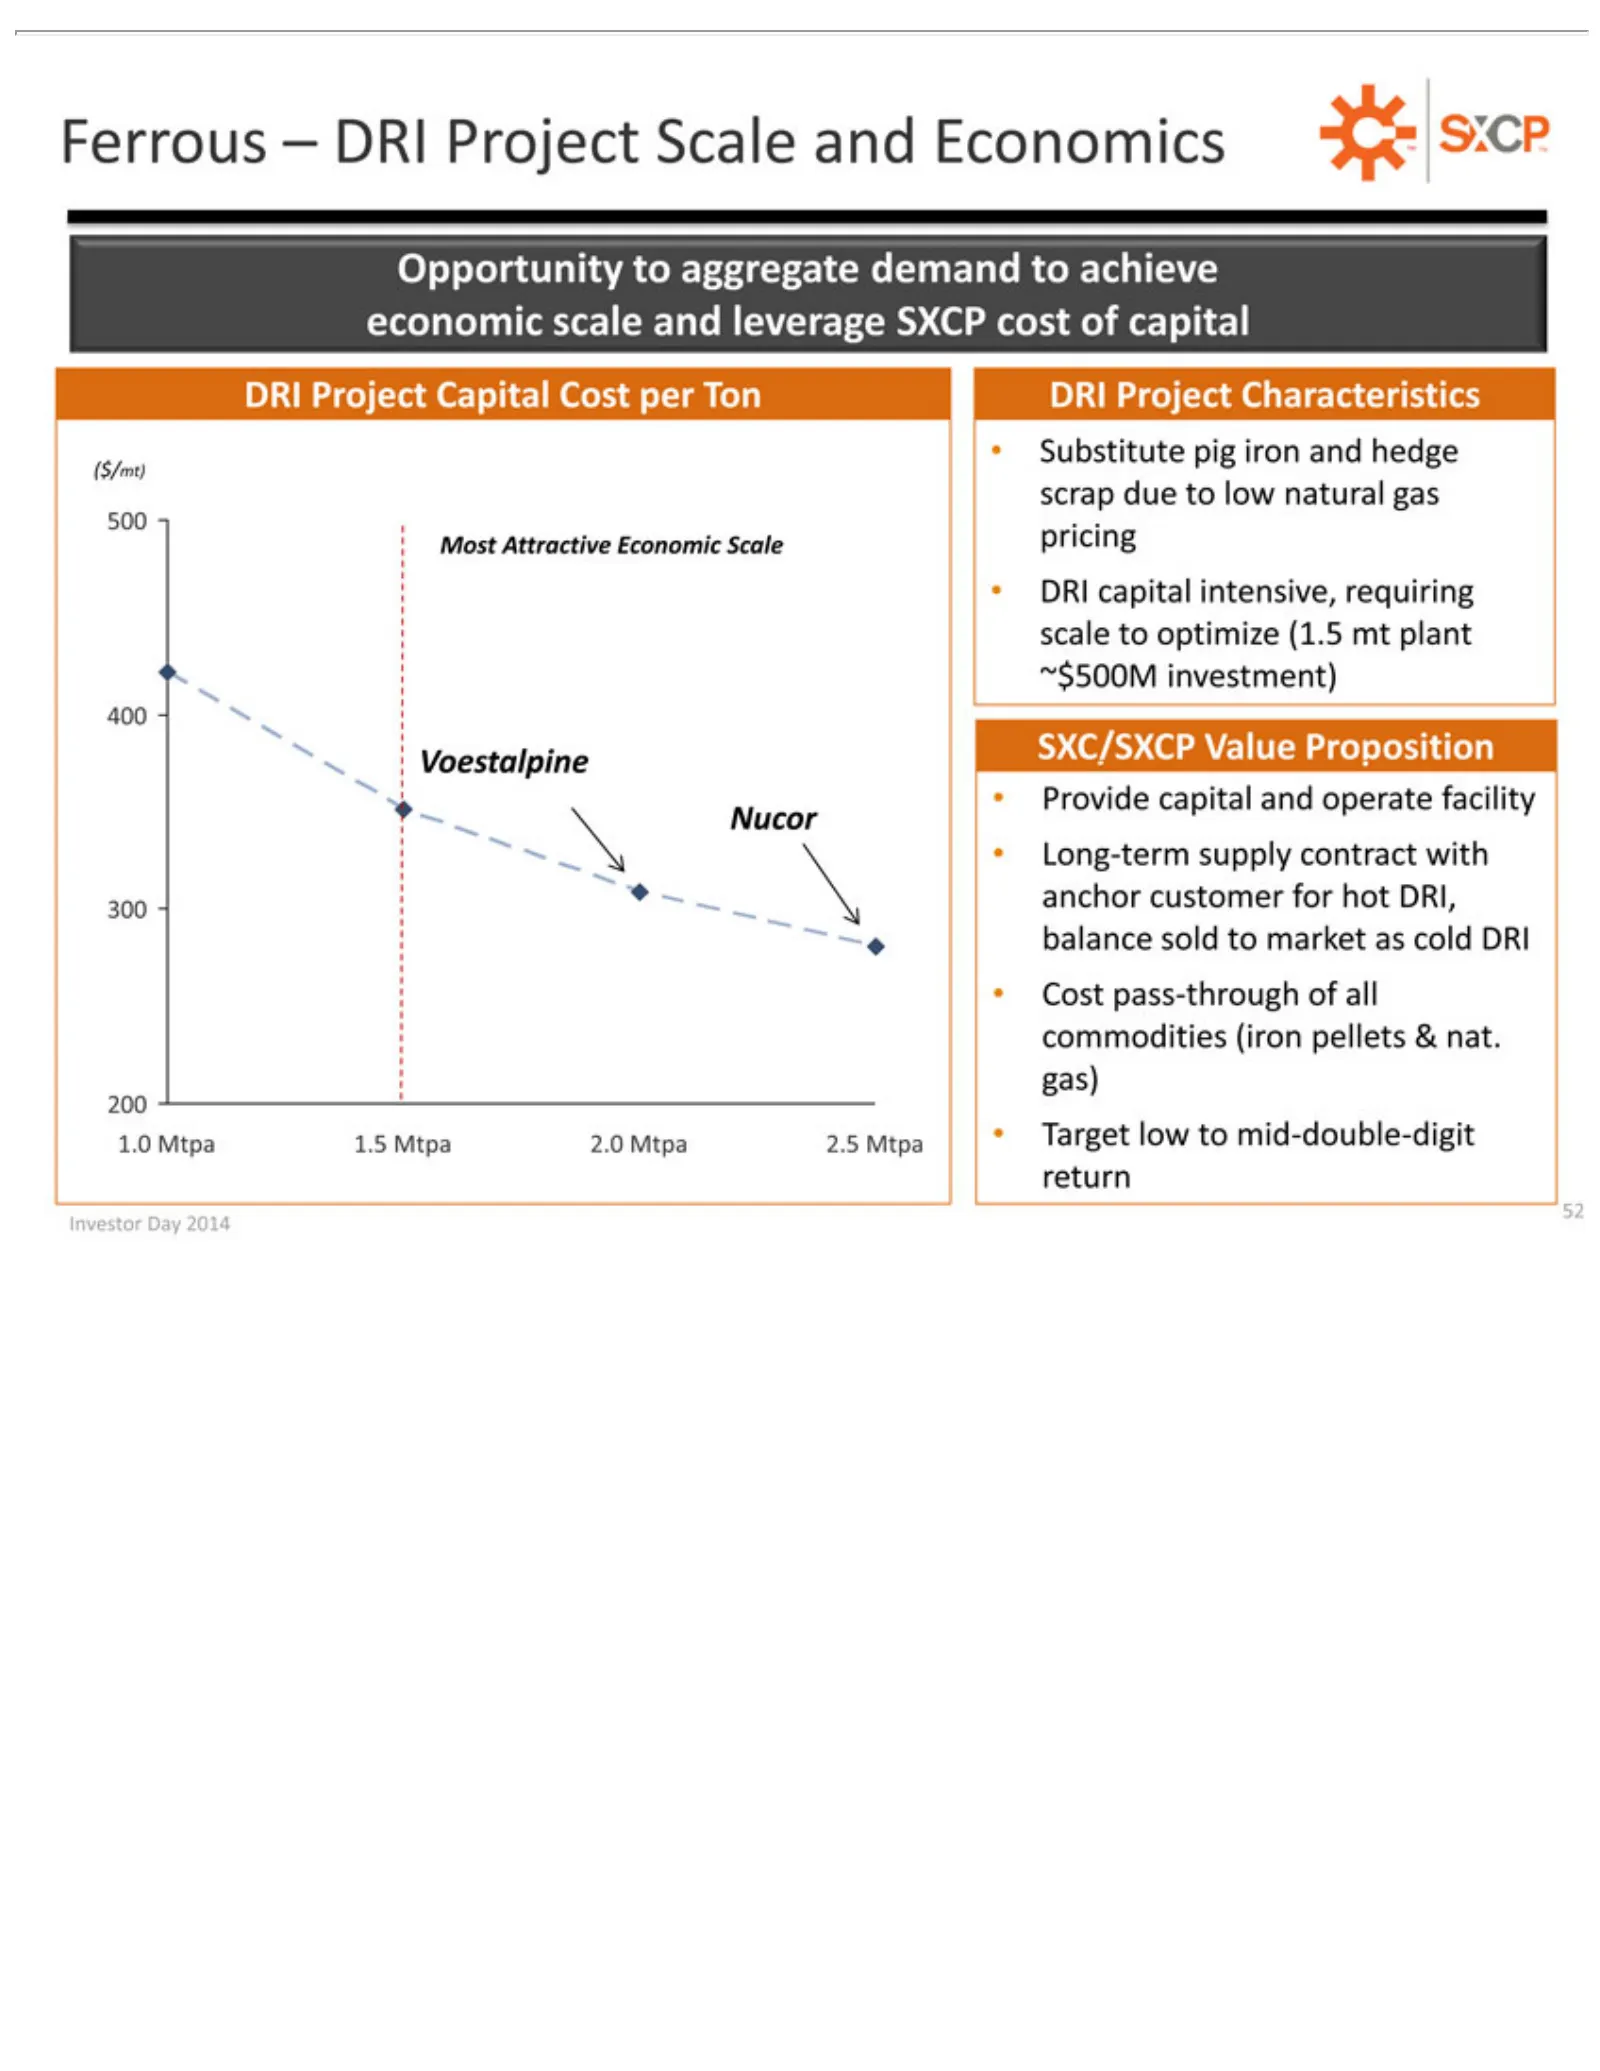
Slide 52: Ferrous Opportunity: DRI Project Economics
Ferrous Opportunity Substitute scrap ($/mt) Most 500 DRI ~$500M SXC/SXCP 400 Provide Voestalpine Long-term Nucor balance 300 Cost all 1.0 200 52 Investor commodities Investor Mtpa Project capital pass-through Attractive due sold –capital Day investment) 1.5 to DRI pig supply Day intensive, Value Cap
Slide 53: Mark Newman, Senior Vice President and Chief Financial Officer
Mark Newman Senior Chief Financial Vice President Officer&
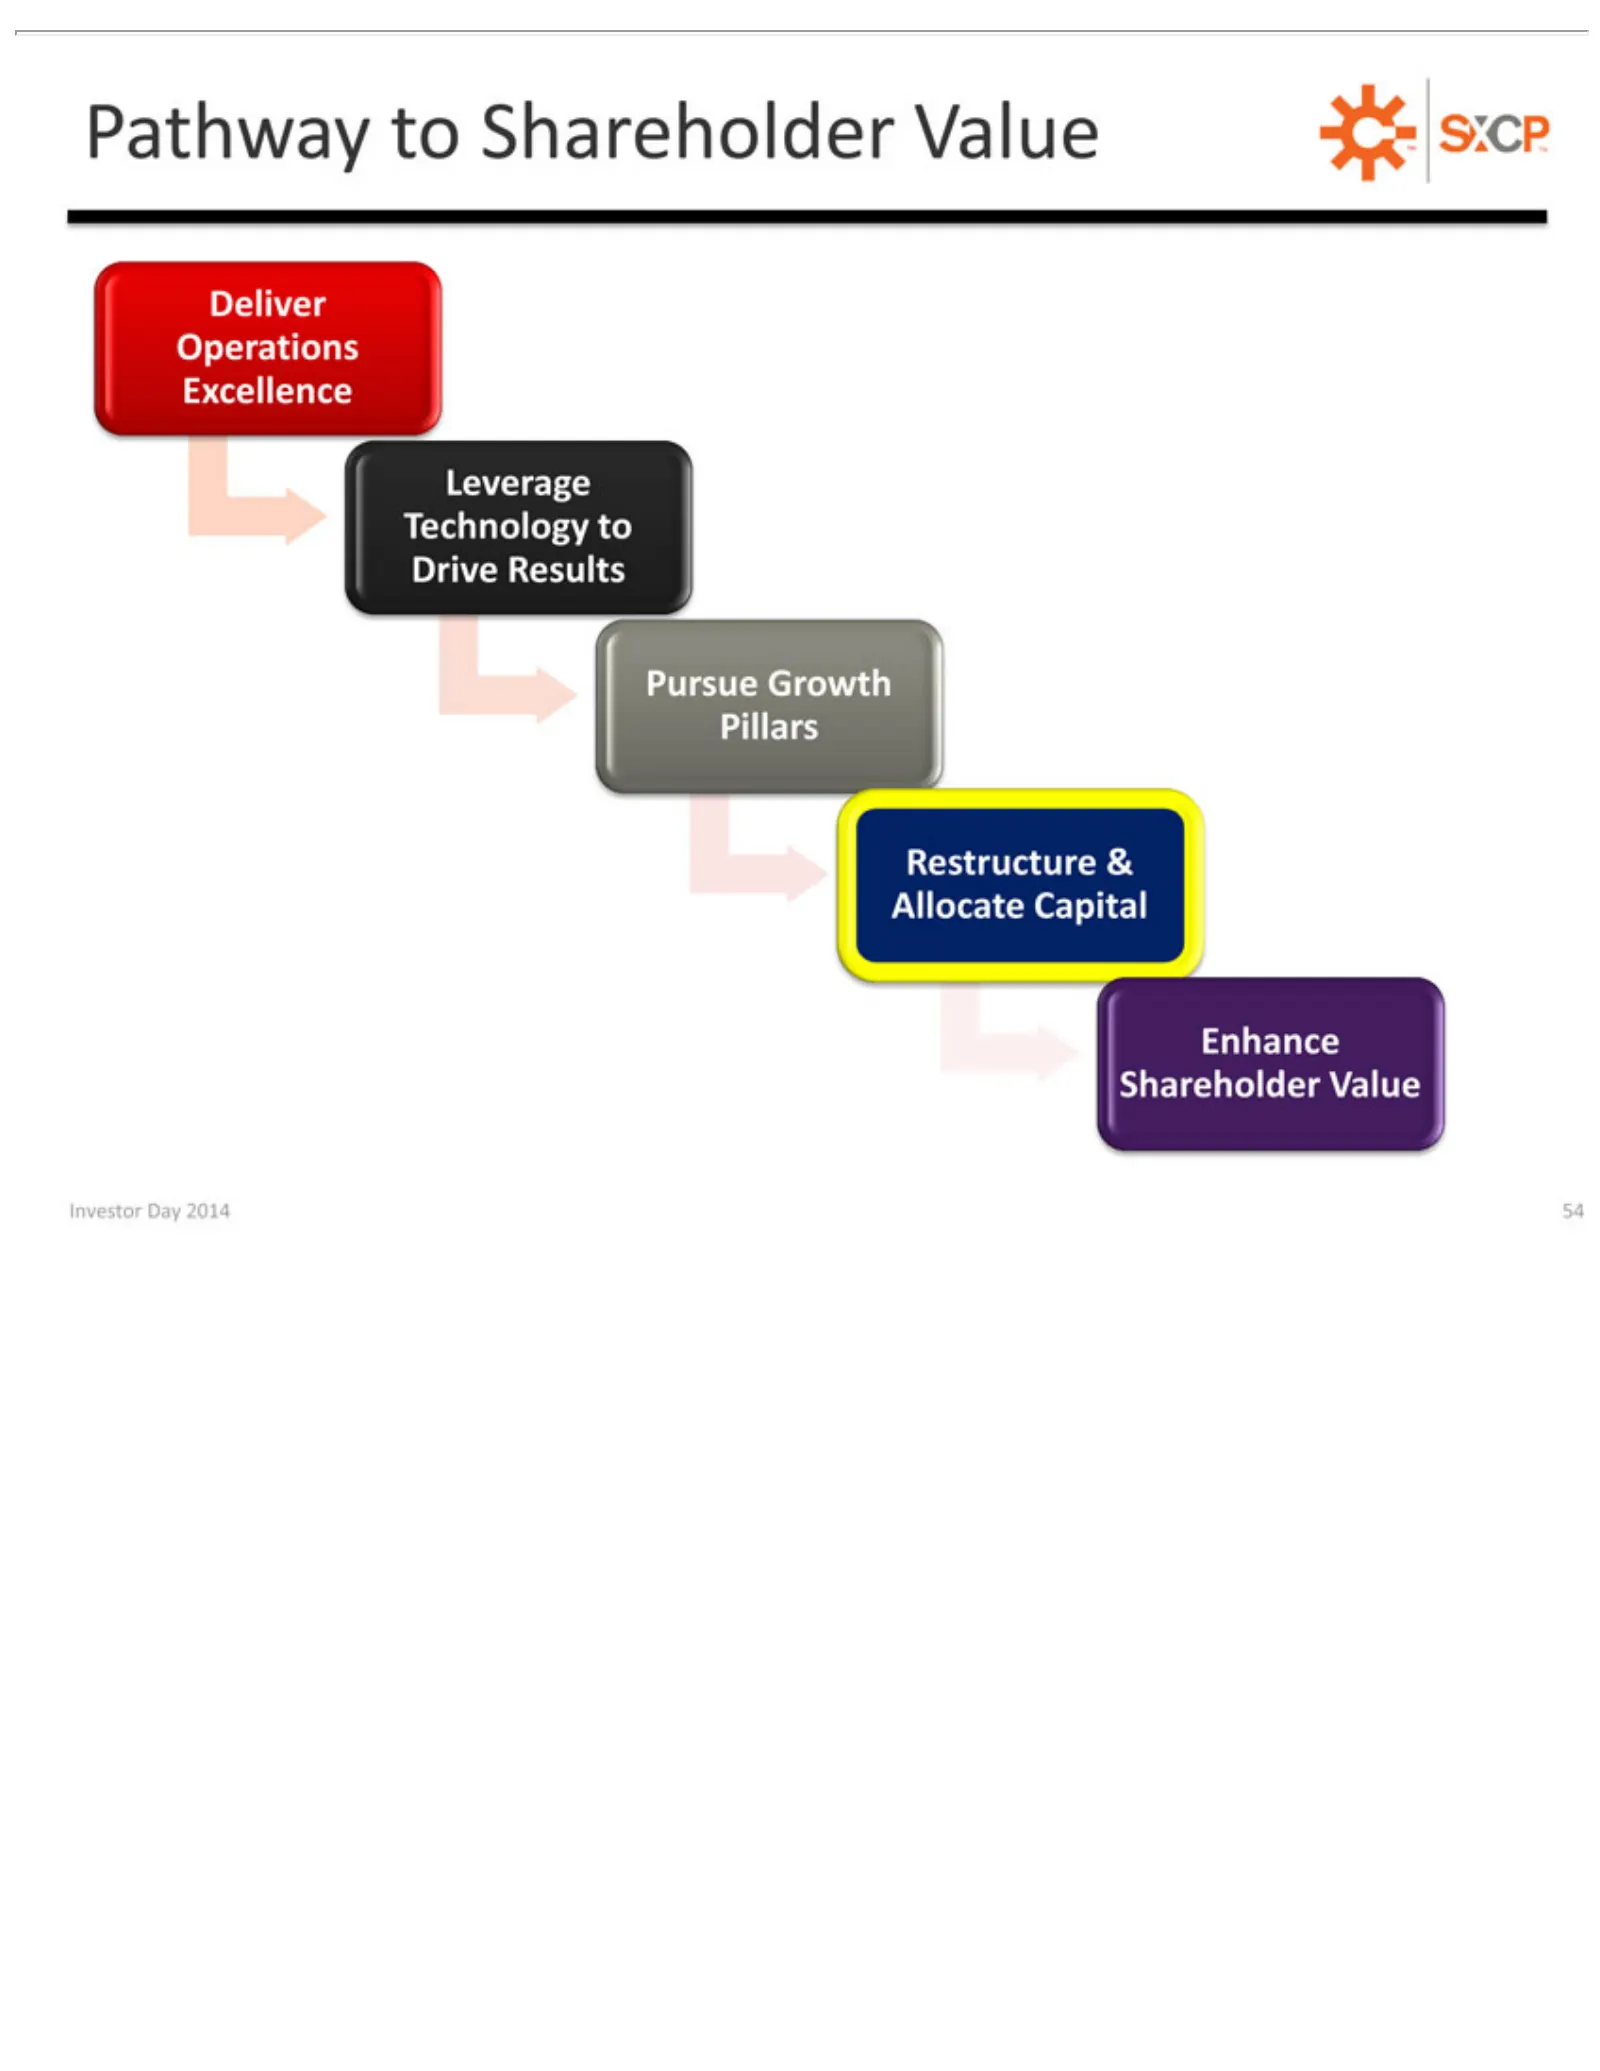
Slide 54: Pathway Pillars: Allocate Capital
PathwayGrowth Deliver Technology Leverage Pursue Restructure Pillars Shareholder Enhance InvestorOperations Day to Shareholder & to Value 2014 Allocate Drive 54 Excellence Results Capital Value TM
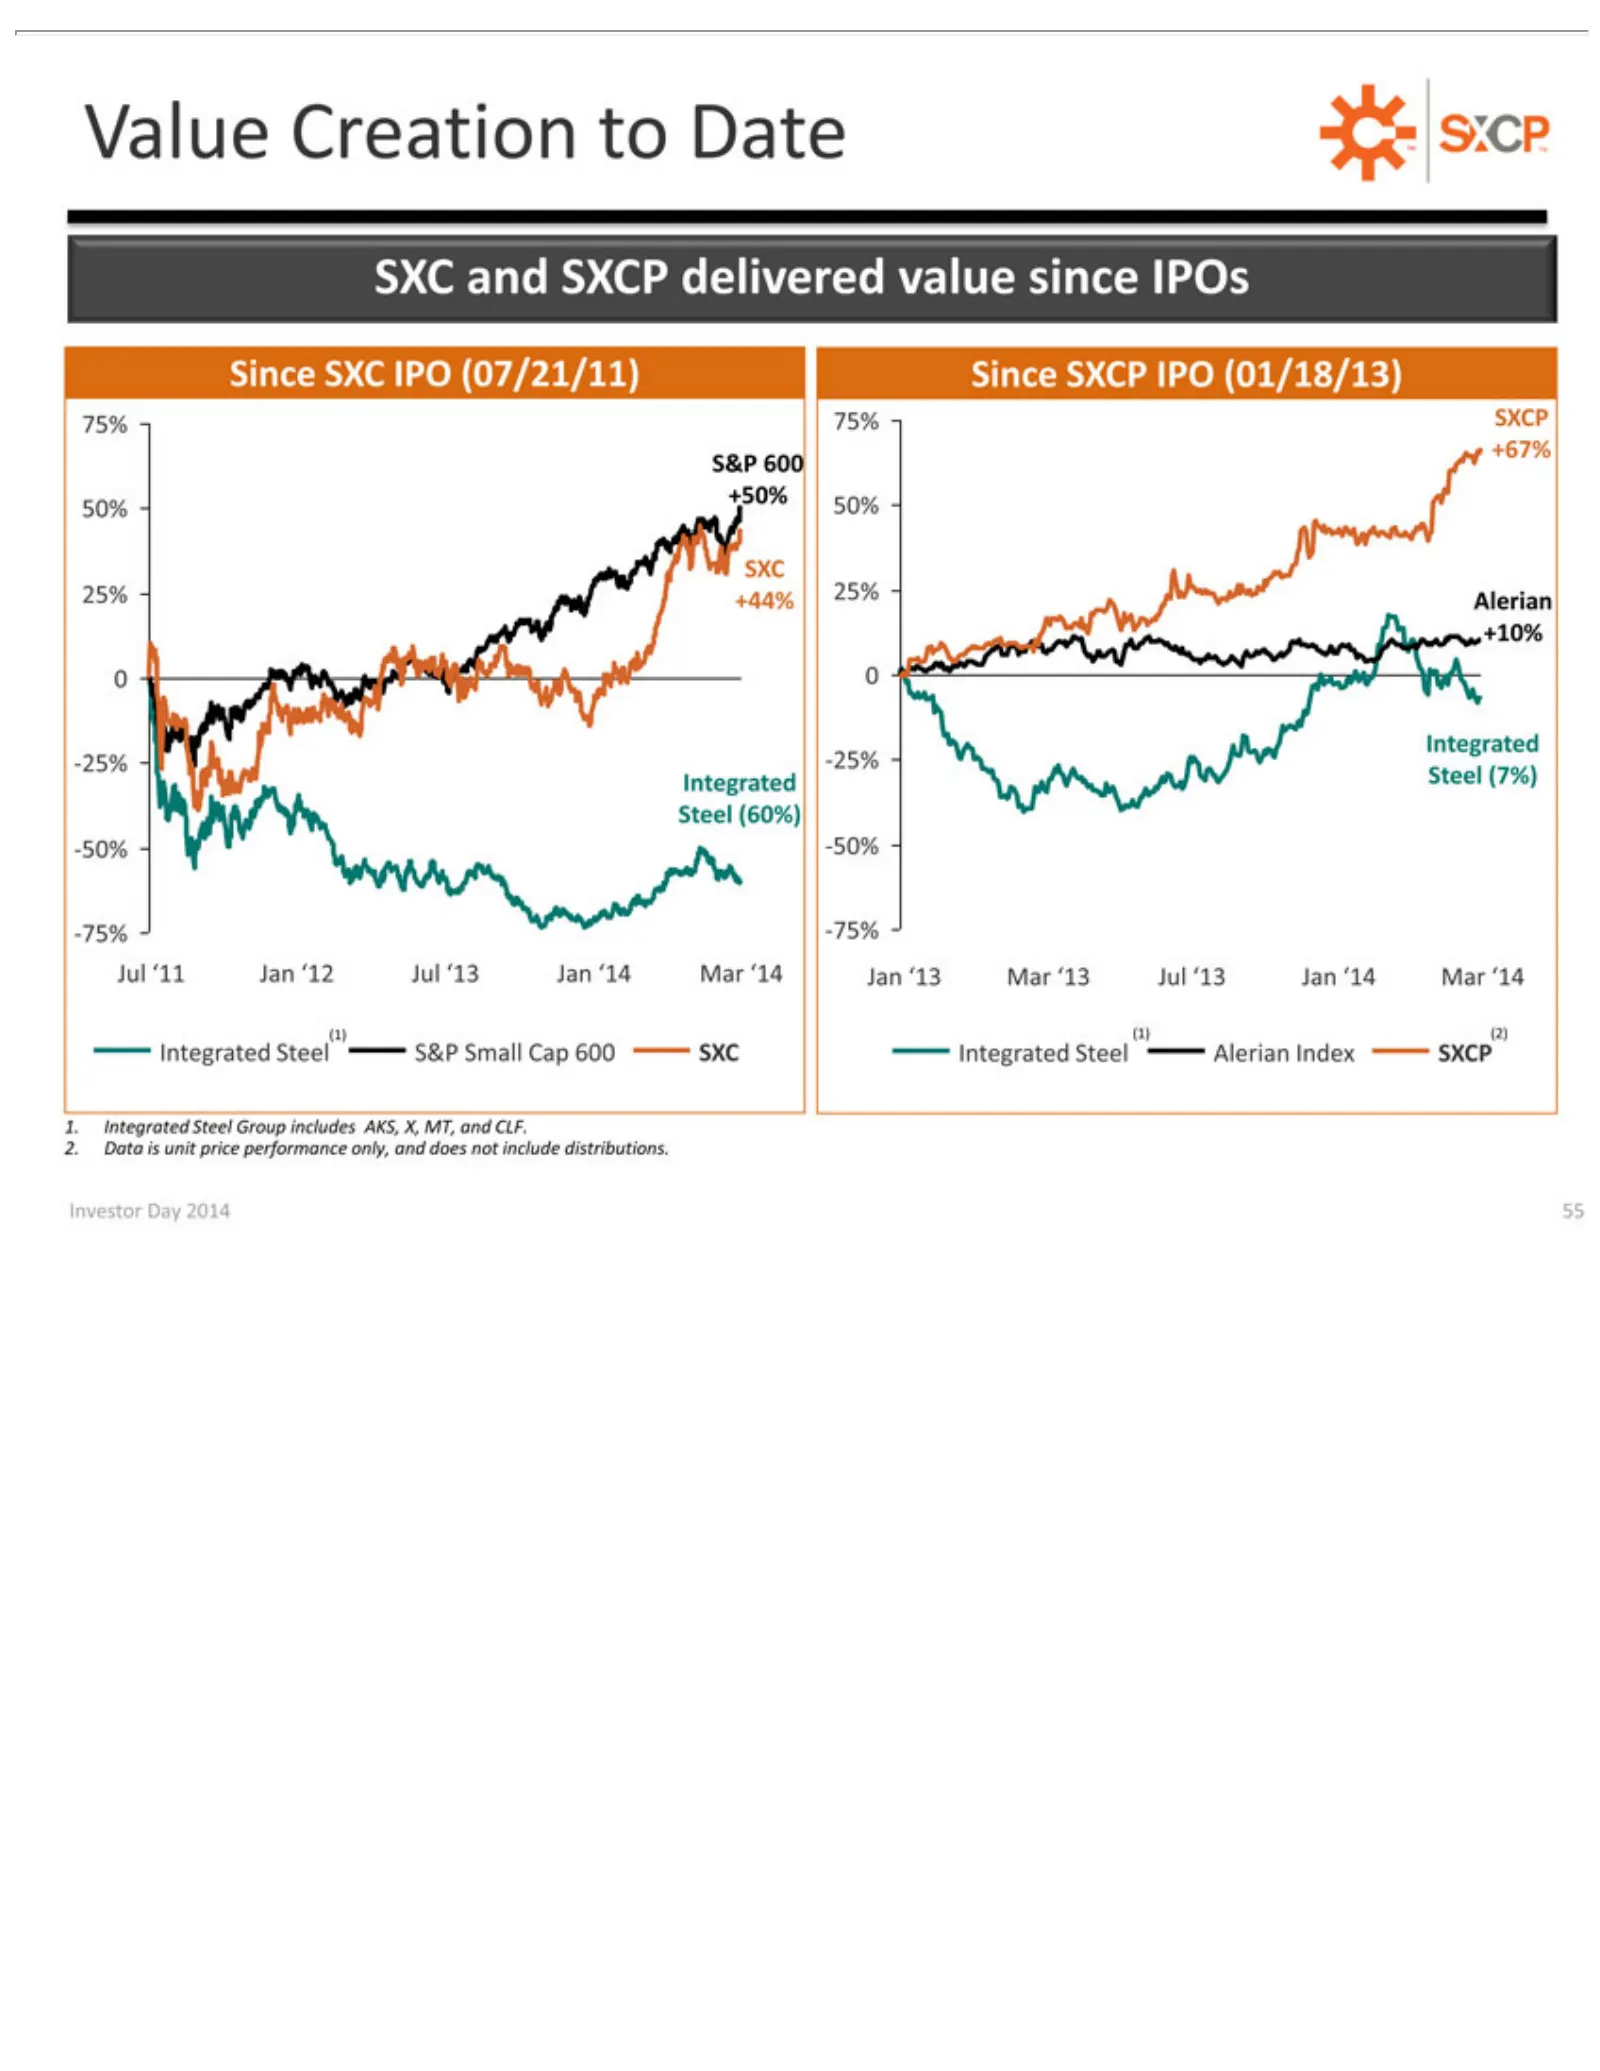
Slide 55: Value Creation Since IPO
Value Since 75% 50% 25% 0SXC -25% -50% -75% Jul (1) Integrated 1. 2. Investor 0Data Integrated (1) ‘11 75% 50% +44% and -25% -50% -75% SXC Creation (2) Jan isDay SXCP unit SXCP Steel ‘12 IPO 25% Steel 2014 price Jul to(07/21/11) (7%) S&P delivered Alerian +67% Date ‘13 Group 55 performance Small Ste
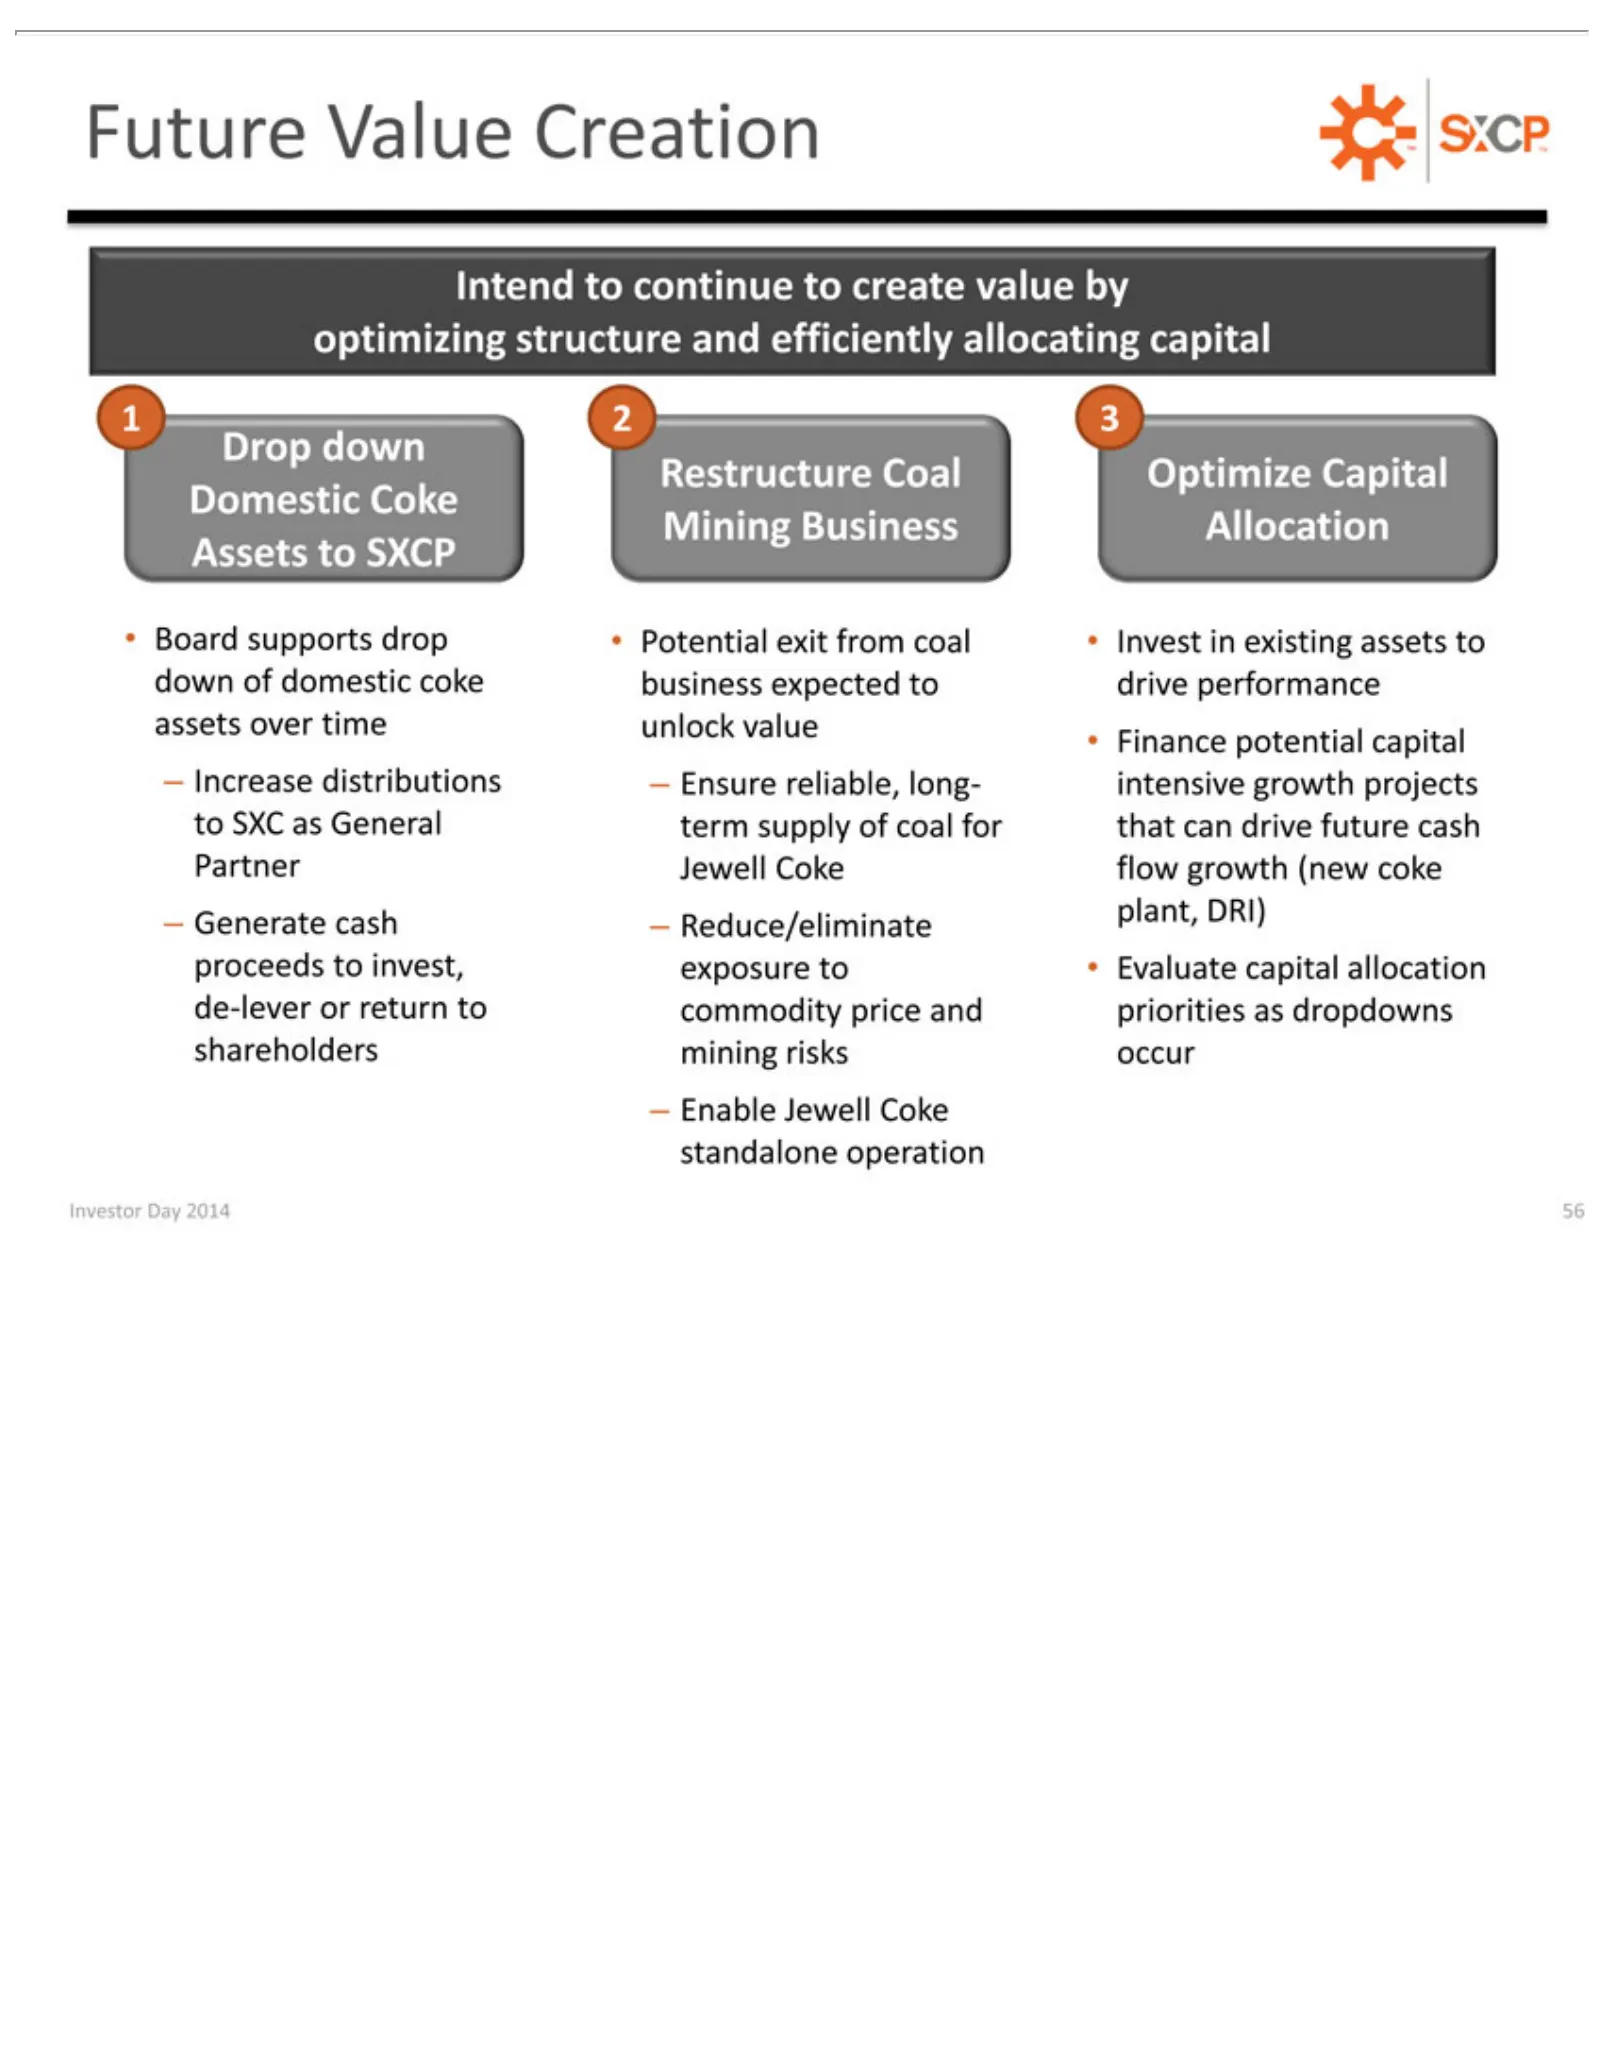
Slide 56: Future Value Creation: Restructure and Capital Allocation
Future 1Intend Drop Restructure Board –Finance Investor 2 3 down Increase Generate Reduce/eliminate Enable supports to Value potential Day Jewell continue distributions cash Coal Creation 2014 drop Coke plant, Optimize capital to 56 proceeds Potential create standalone TM DRI) – Ensure Capital value
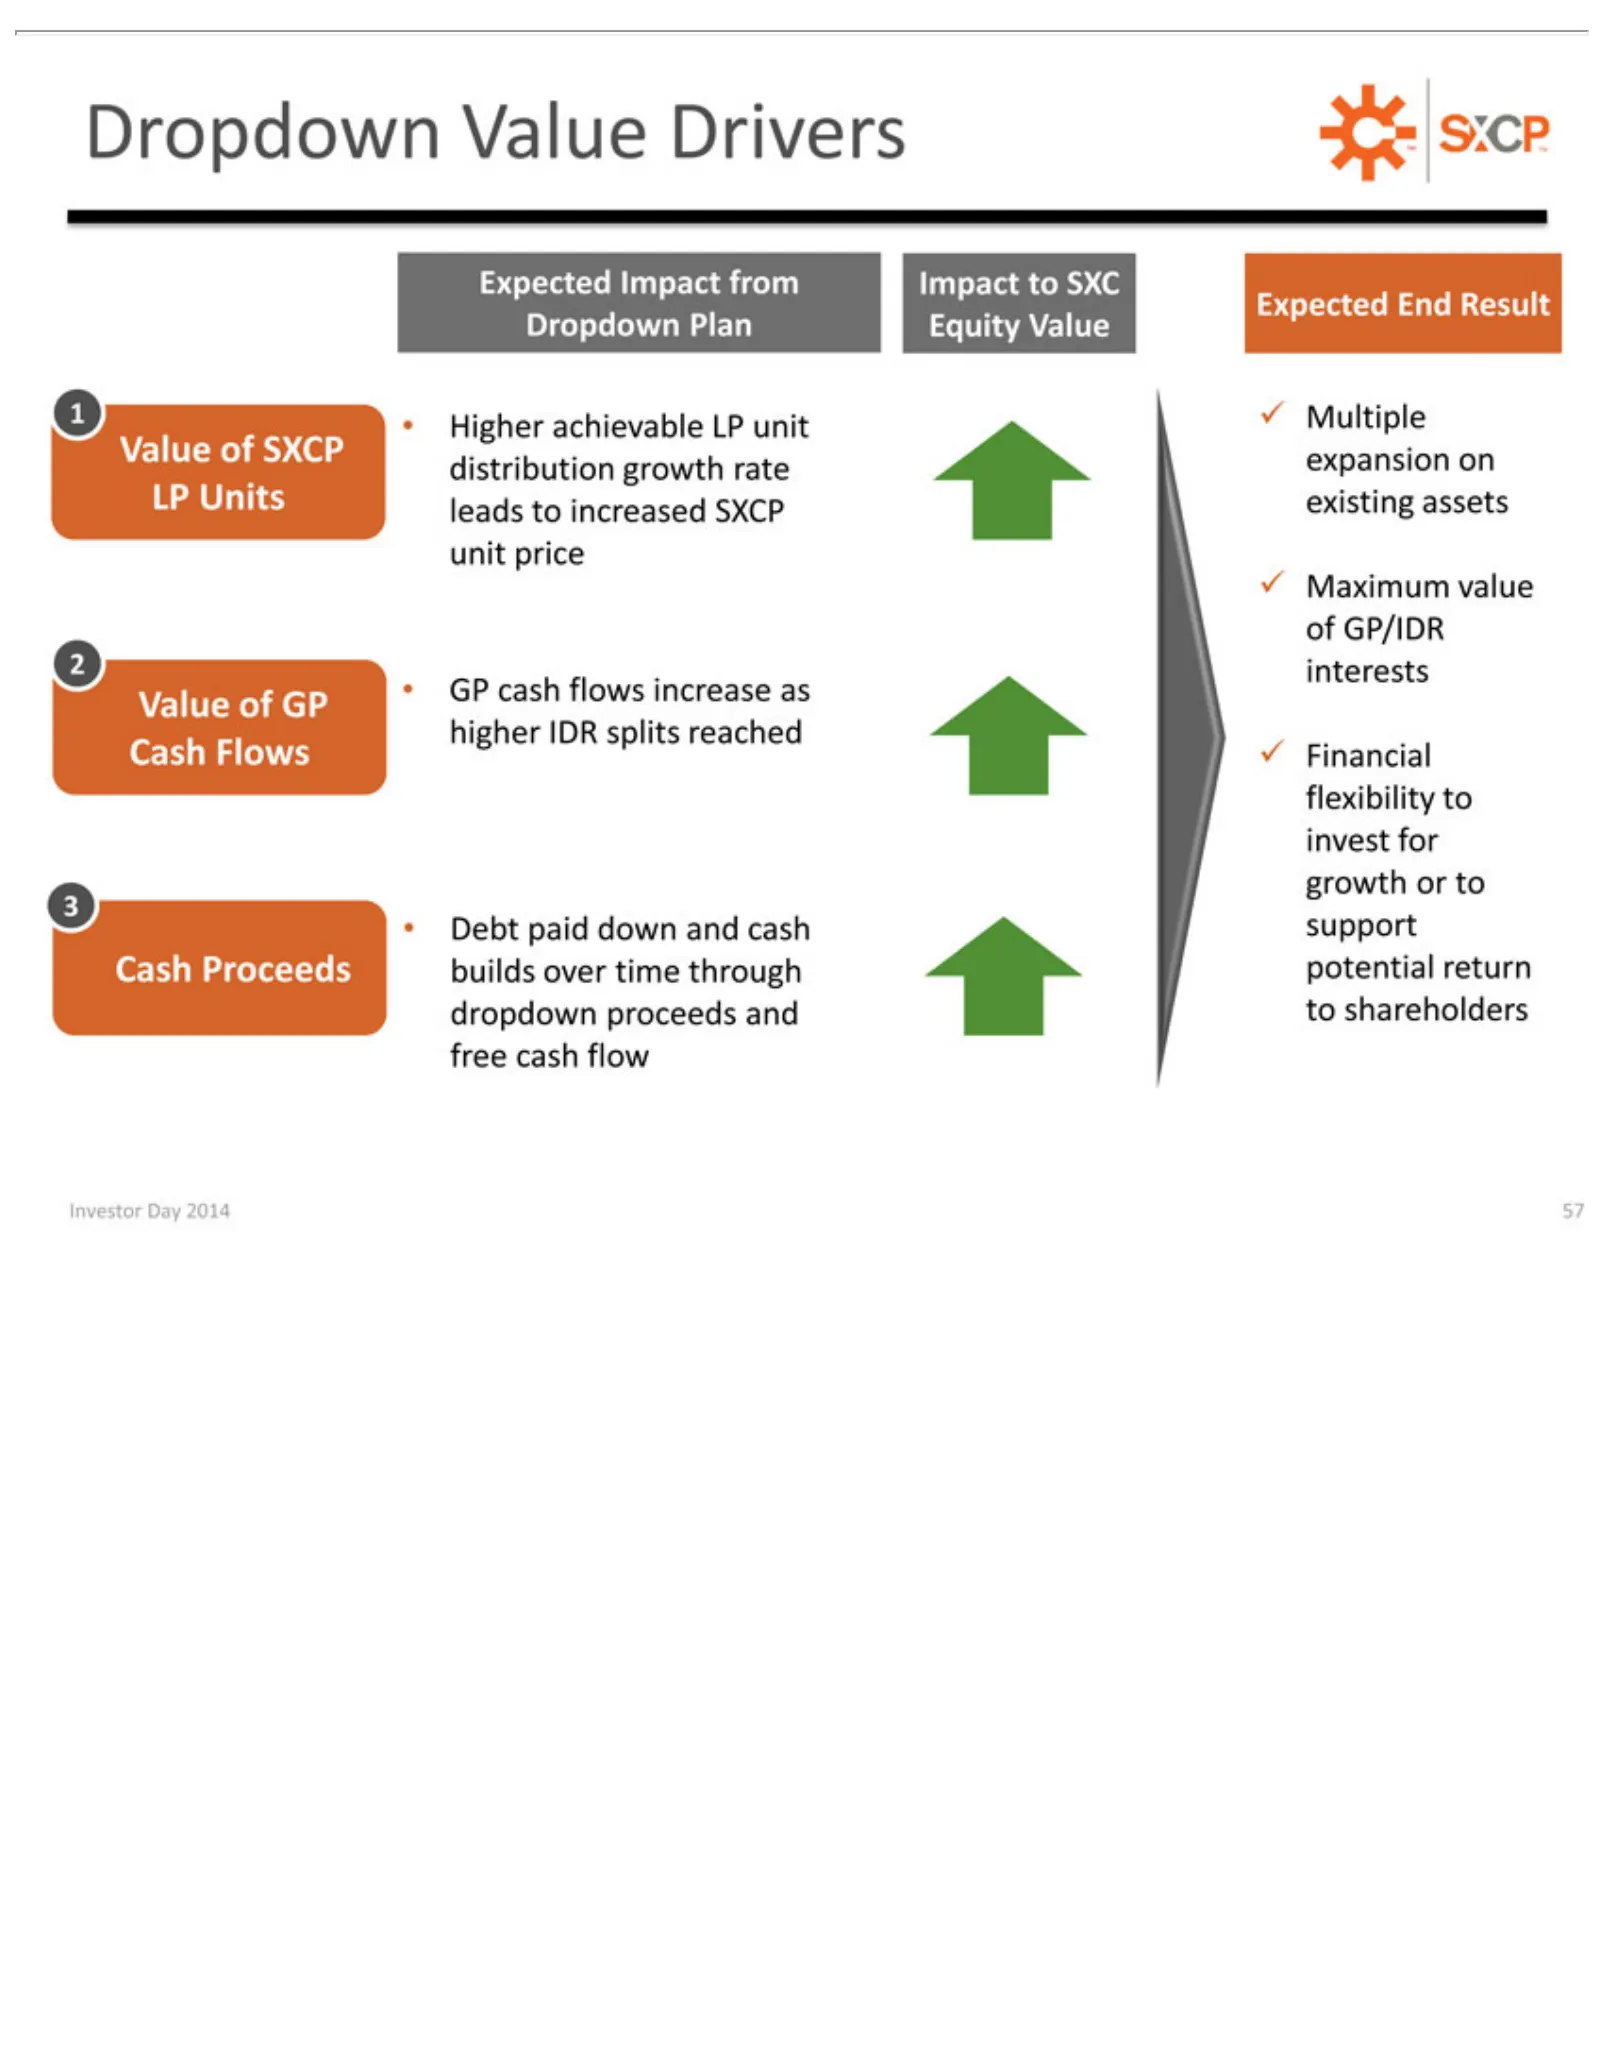
Slide 57: Dropdown Expected Value Drivers
Dropdown 1Expected Value 2LP Cash exibility fl Debt Investor • Higher GPUnits paid cash Flows of Day to SXCP distribution Impact End down flows achievable Value invest ??Financial 2014 Result expansion and increase from Drivers for 57cash Dropdown growth 3LP Impact growth interests TM unit support o
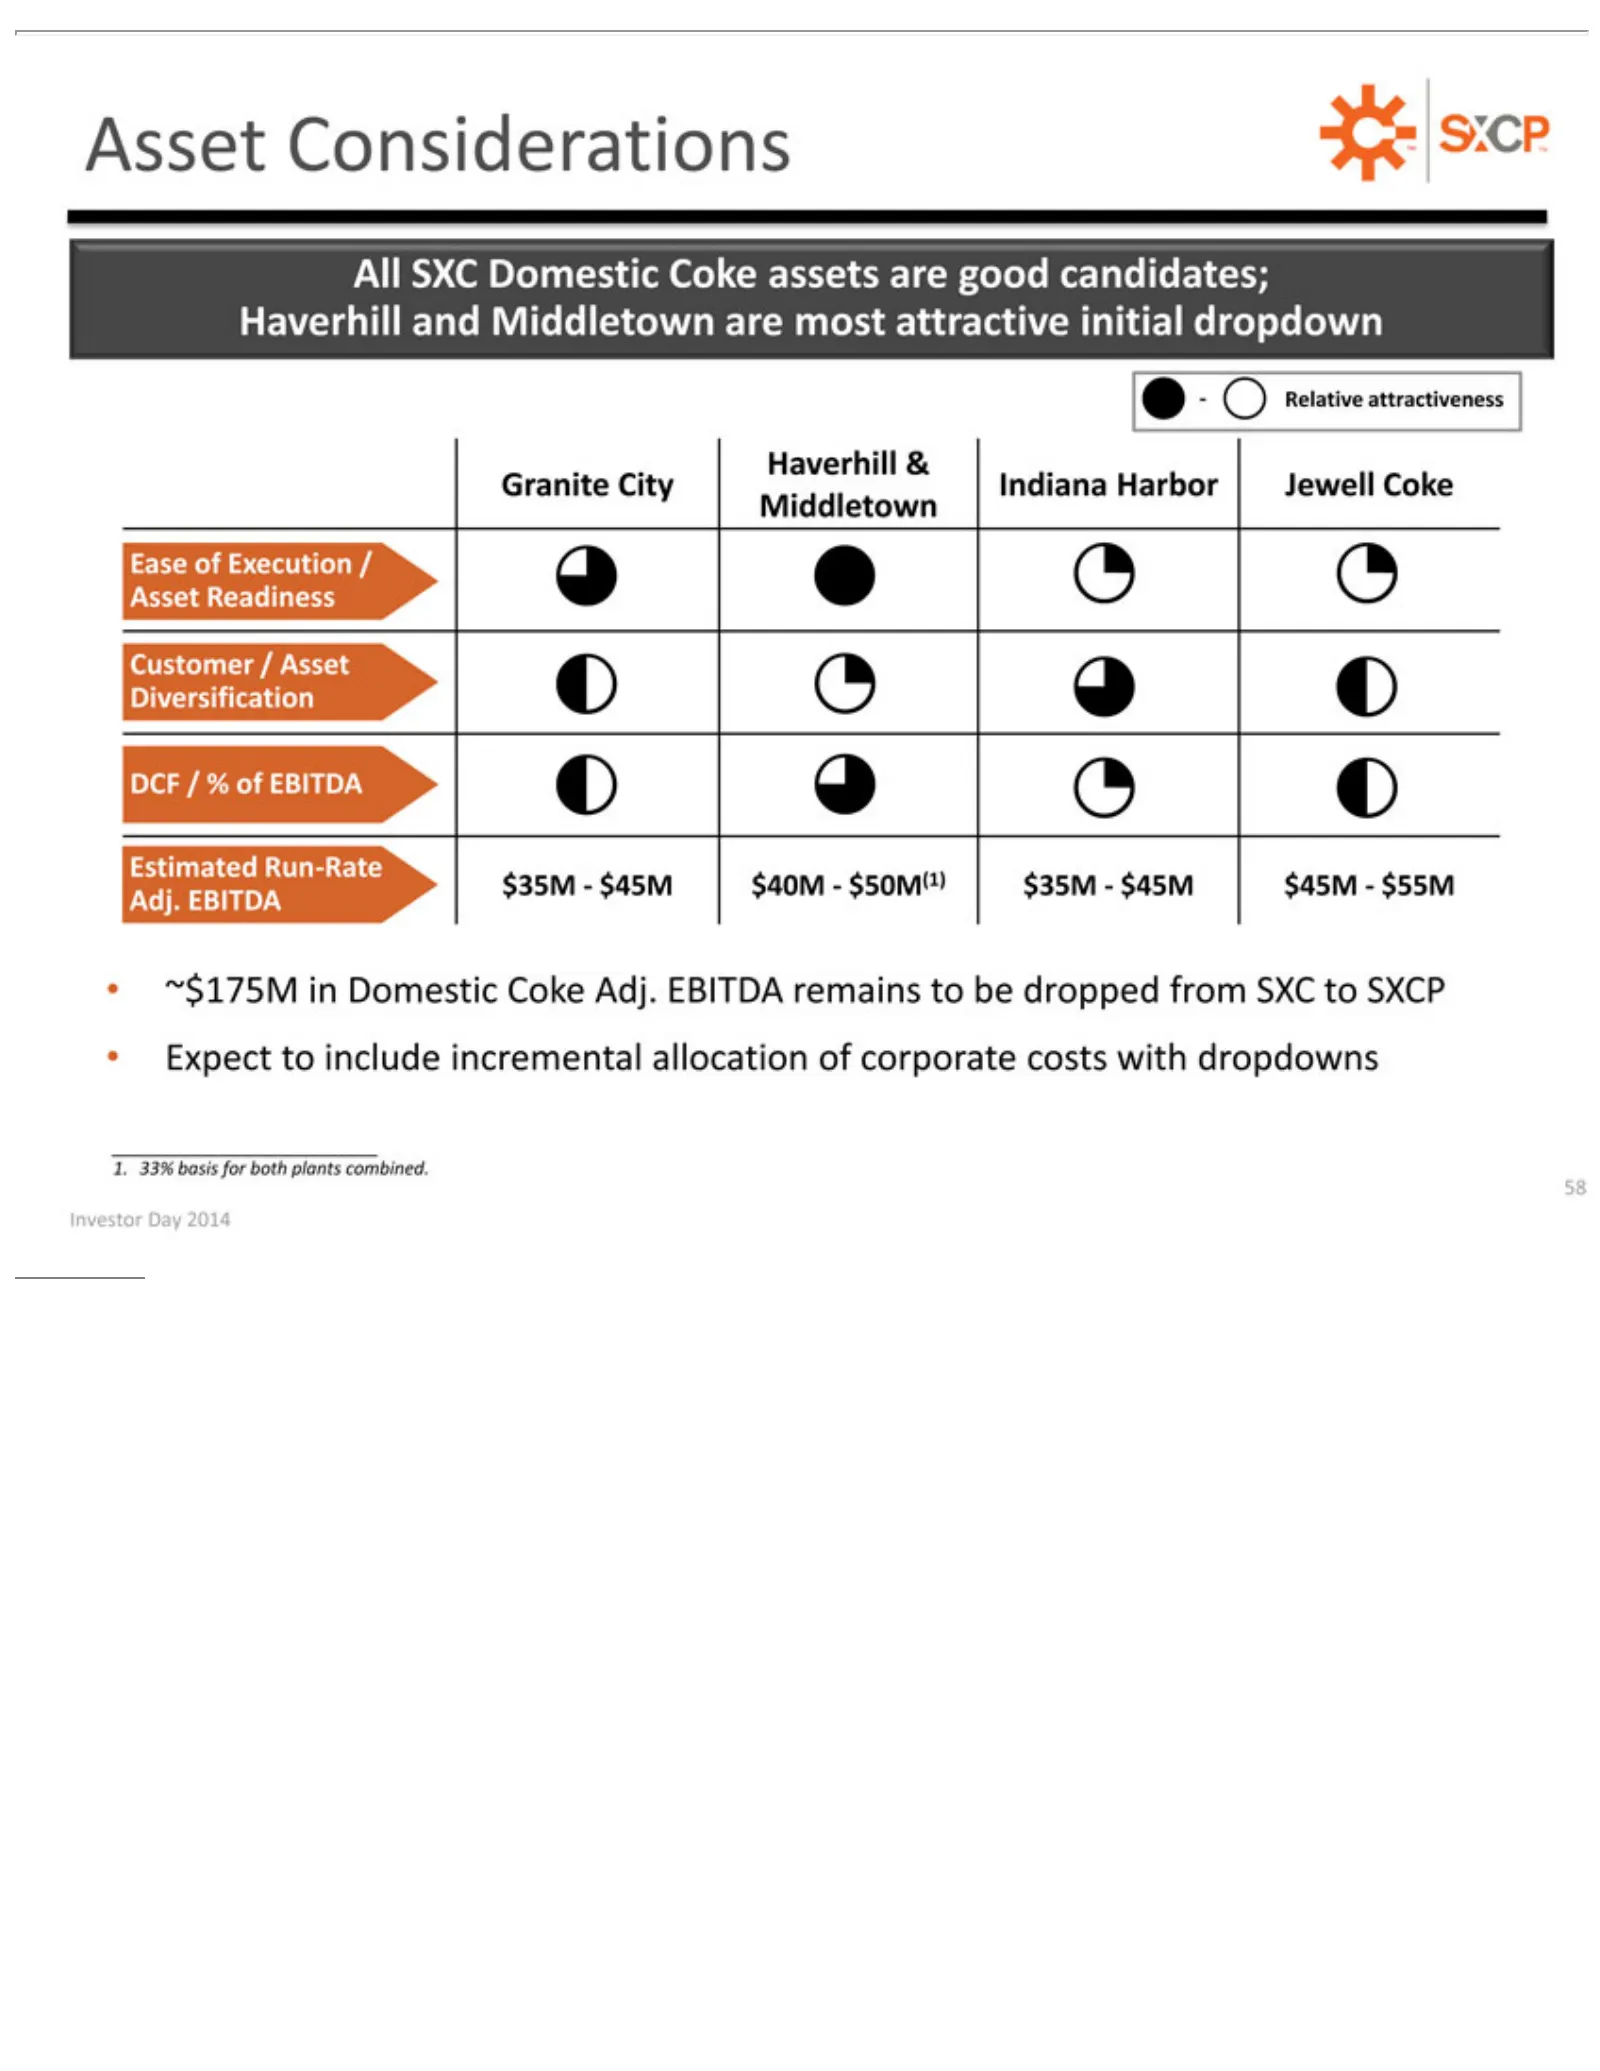
Slide 58: Asset Dropdown Candidates
Asset -All Haverhill Granite Ease Customer DCF Estimated Adj. •~$175M Relative Expect SXC EBITDA of /Considerations %Execution City to in Domestic of &/attractiveness Run-Rate Asset include Domestic EBITDA Indiana $35M—$45M Diversification /Coke incremental Asset Harbor TM Cokeassets Readiness Adj.
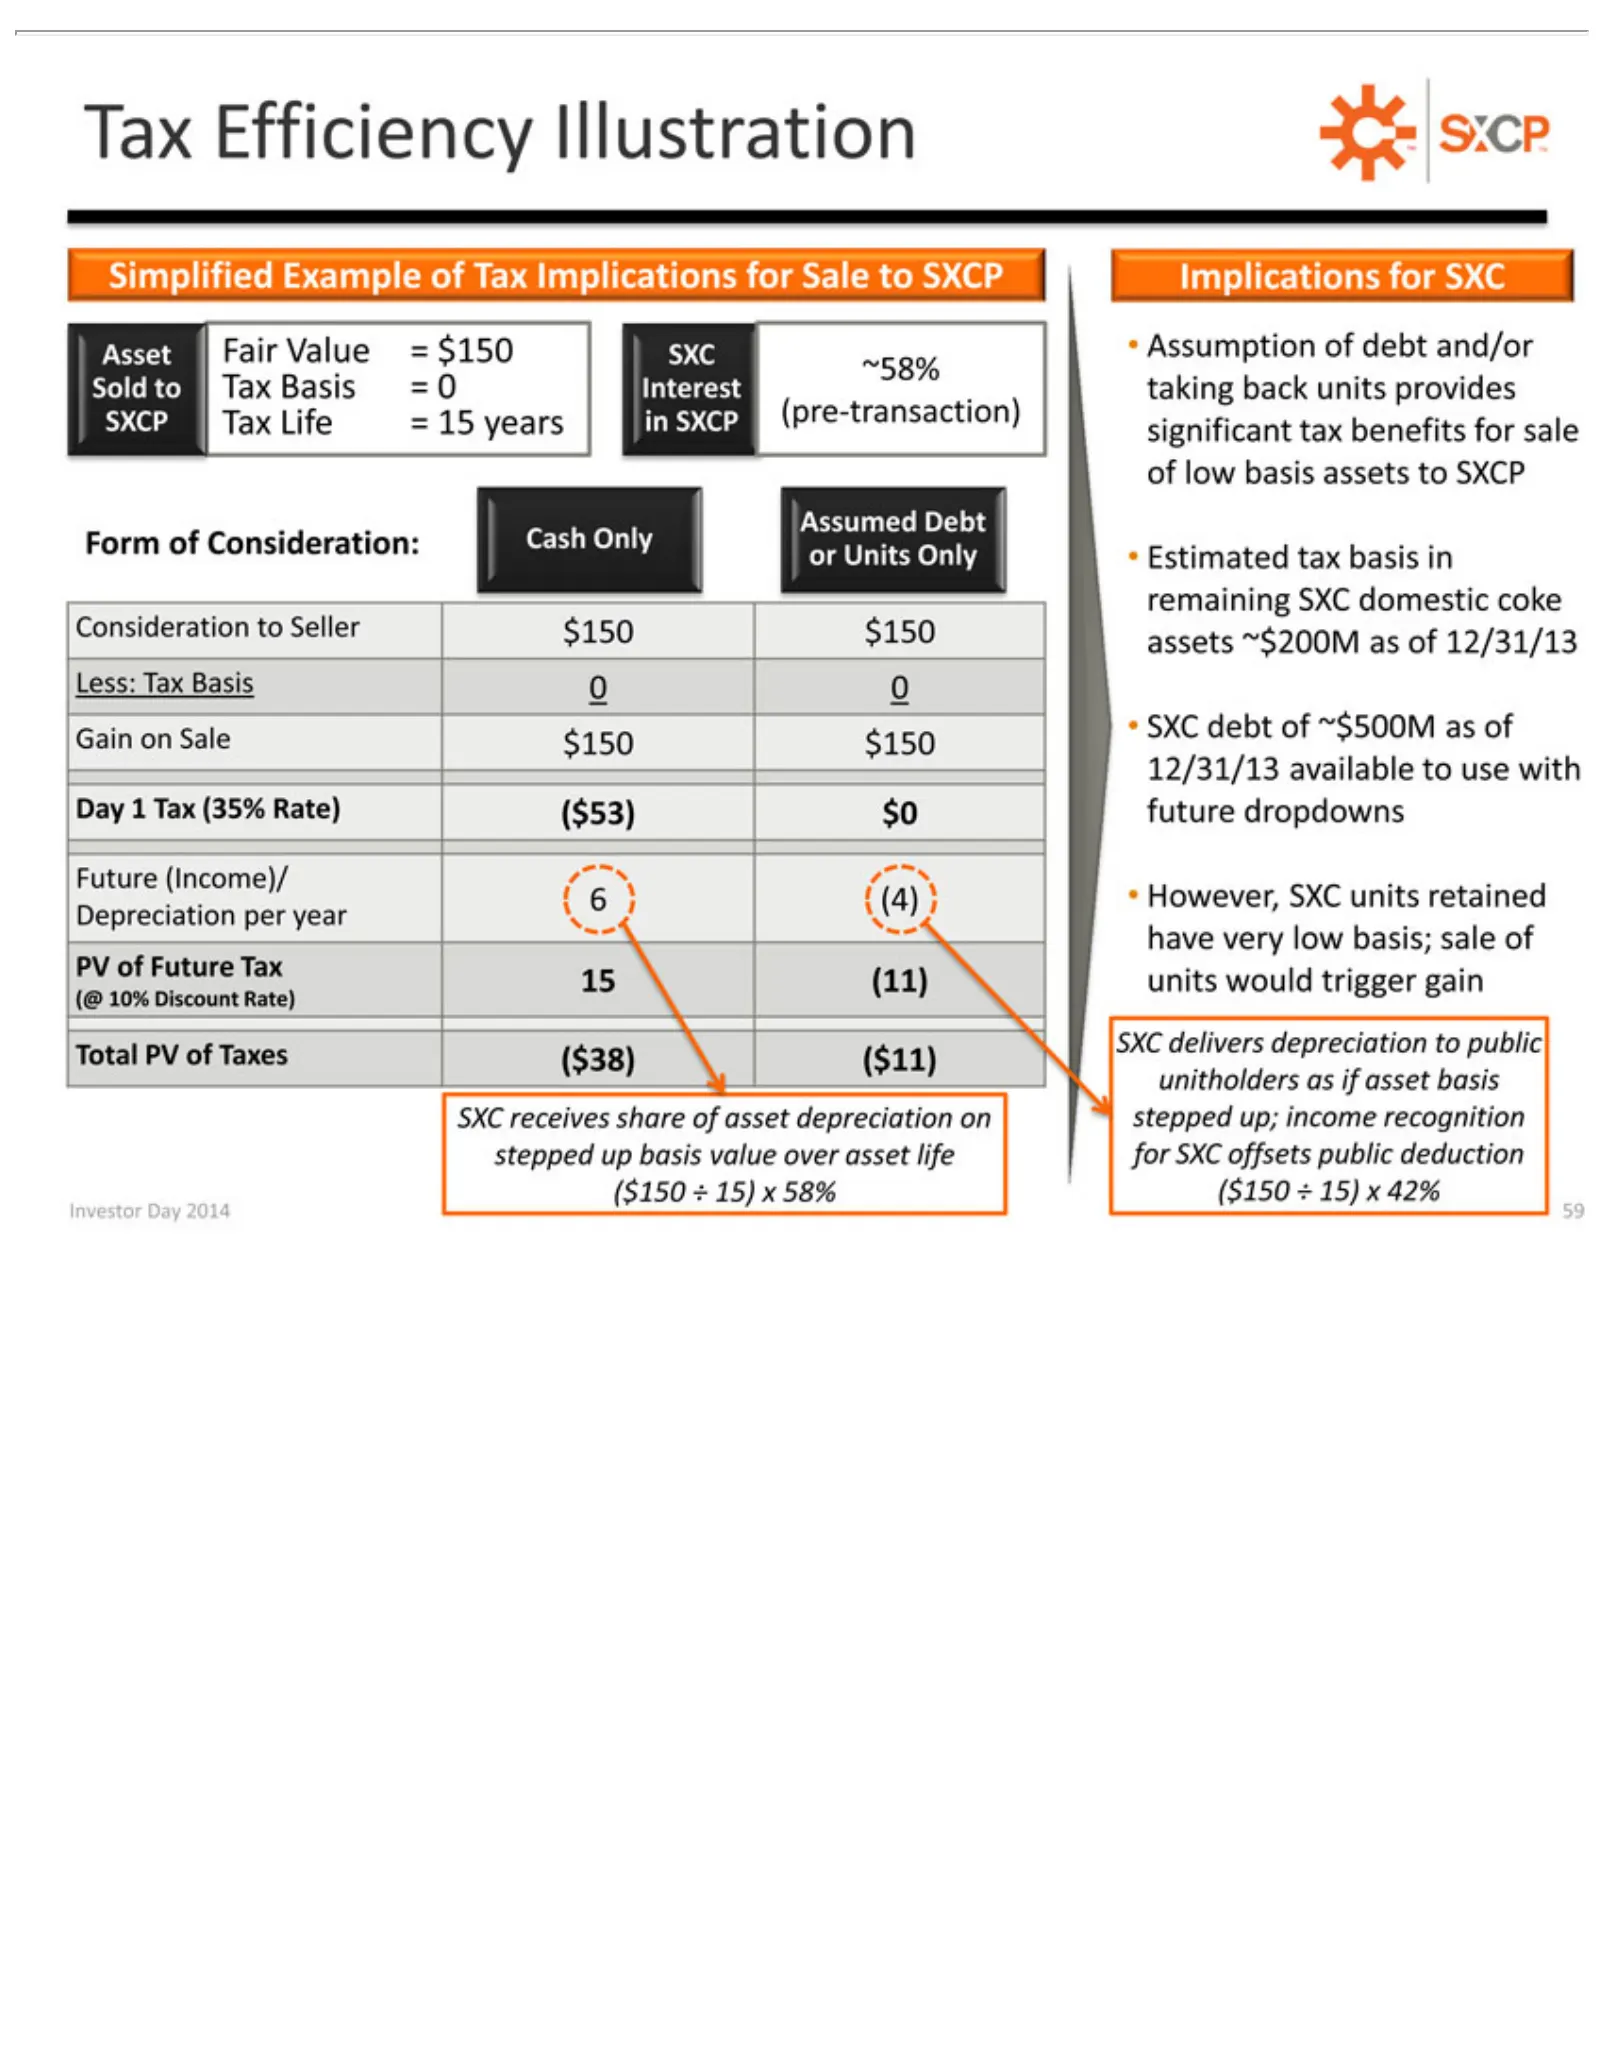
Slide 59: Tax Simplified Asset Sale Illustration
Tax Simplified Asset SXCP Cash Form Estimated Consideration Less: Gain Day 6Future Depreciation PV 15 (@ XC Total 2014 (4) (11) 10% of delivers Efficiency 1•on ($150 Only PV Tax of Fair Future Tax However, (Income)/ units Sale Consideration: Discount of Basis tax Value (35% Life Assumed Example ÷ Ta
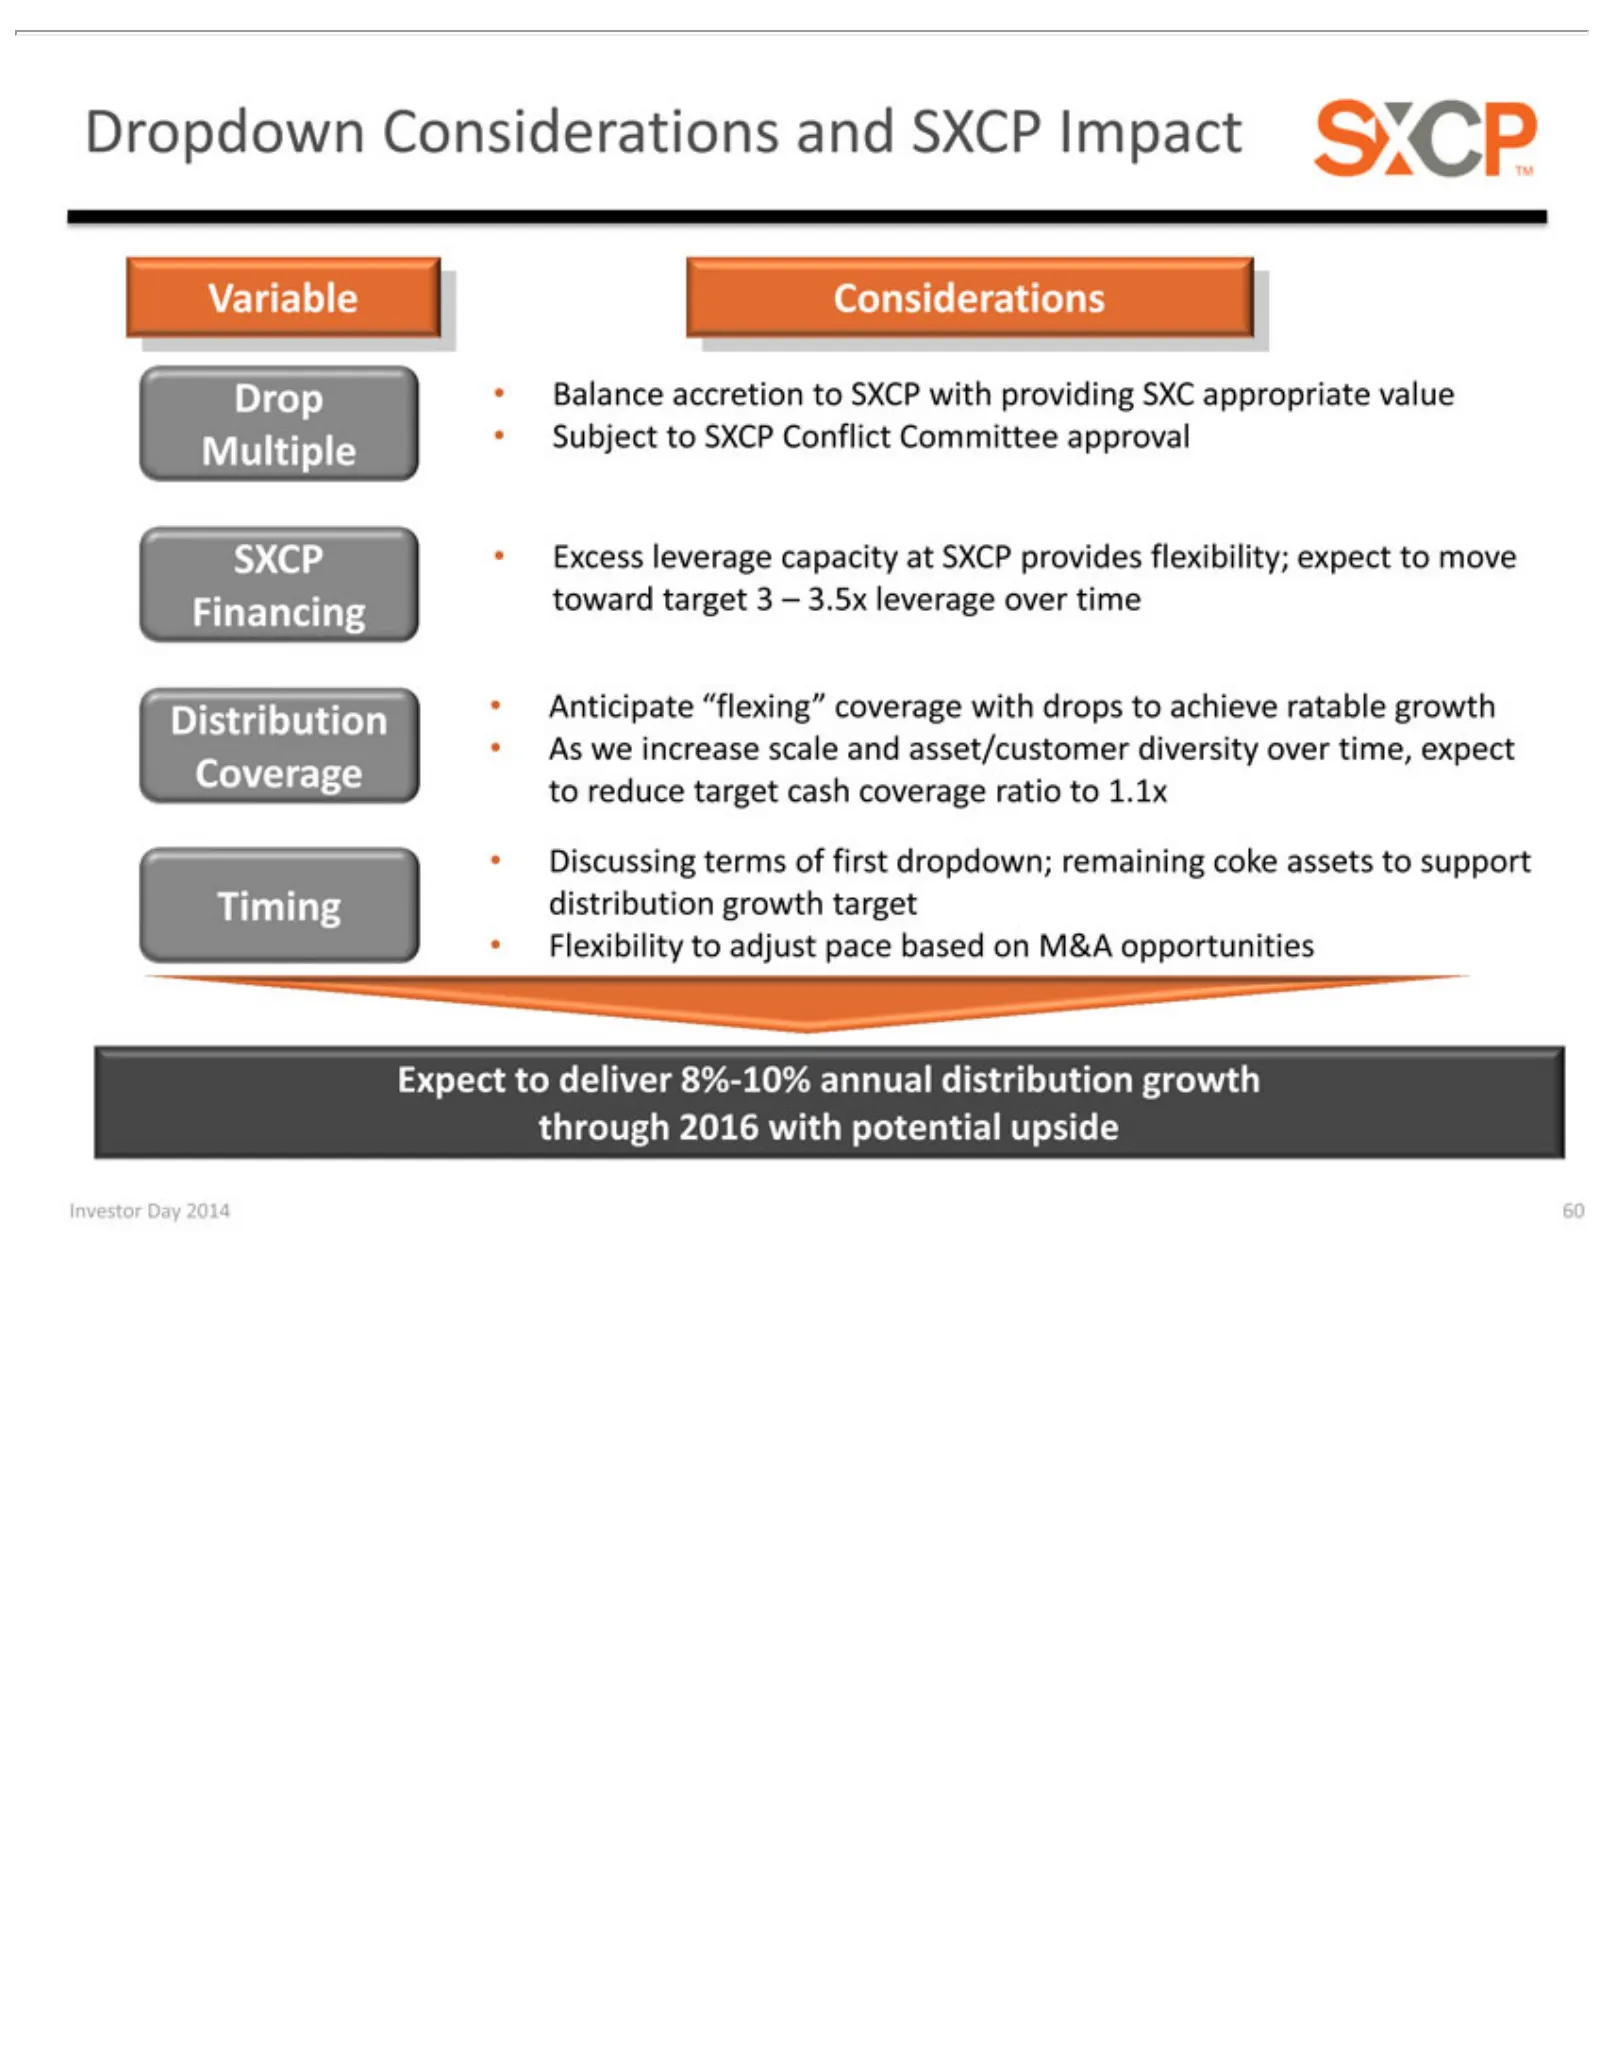
Slide 60: Dropdown Variable Considerations: Distribution Coverage
Dropdown Variable Drop SXCP Distribution As to Coverage Discussing Flexibility Expect Investor reduce we• •increase Balance toExcess Day Considerations target deliver to Considerations terms •2014 adjust Anticipate scale leverage accretion cash 8%-10% of60 pace first coverage andcapacity “flexing” d
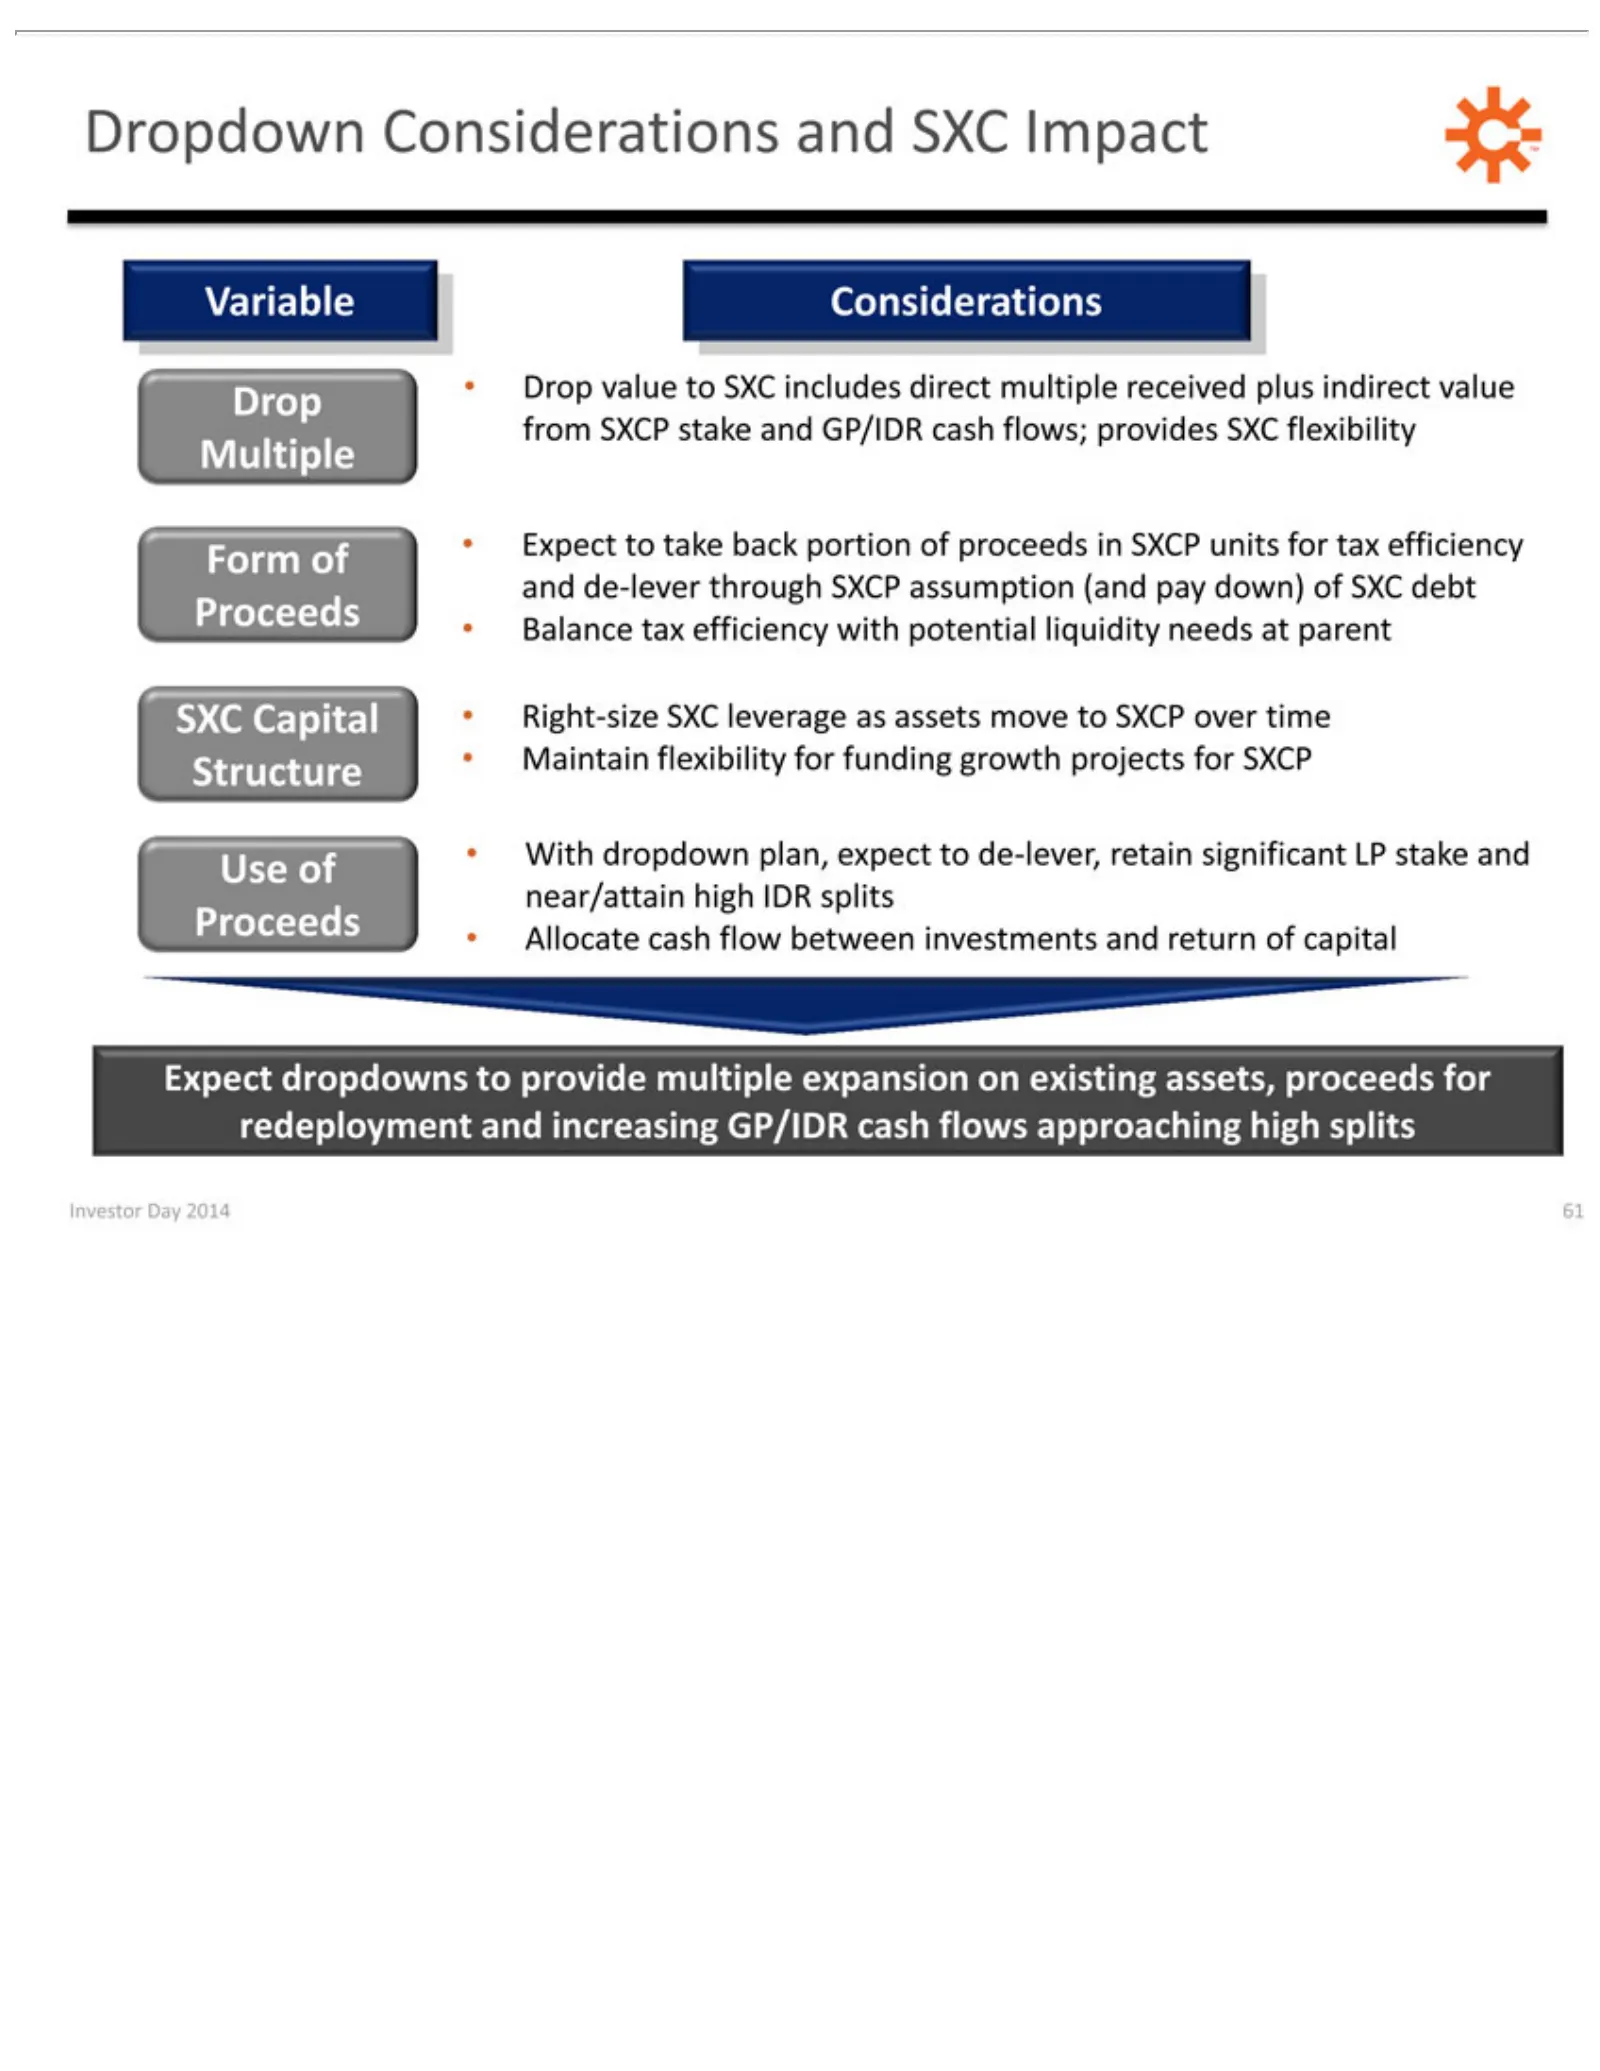
Slide 61: Dropdown Variable Considerations: Use of Proceeds
Dropdown Variable Drop Form Multiple Balance SXC Use Allocate Proceeds Expect Investor ofCapital •of•Drop dropdowns With tax •Day Considerations cash Expect Considerations efficiency value •2014 flow dropdown Right-size toto 61 between take SXC provide with plan, back SXC and includes potential inve
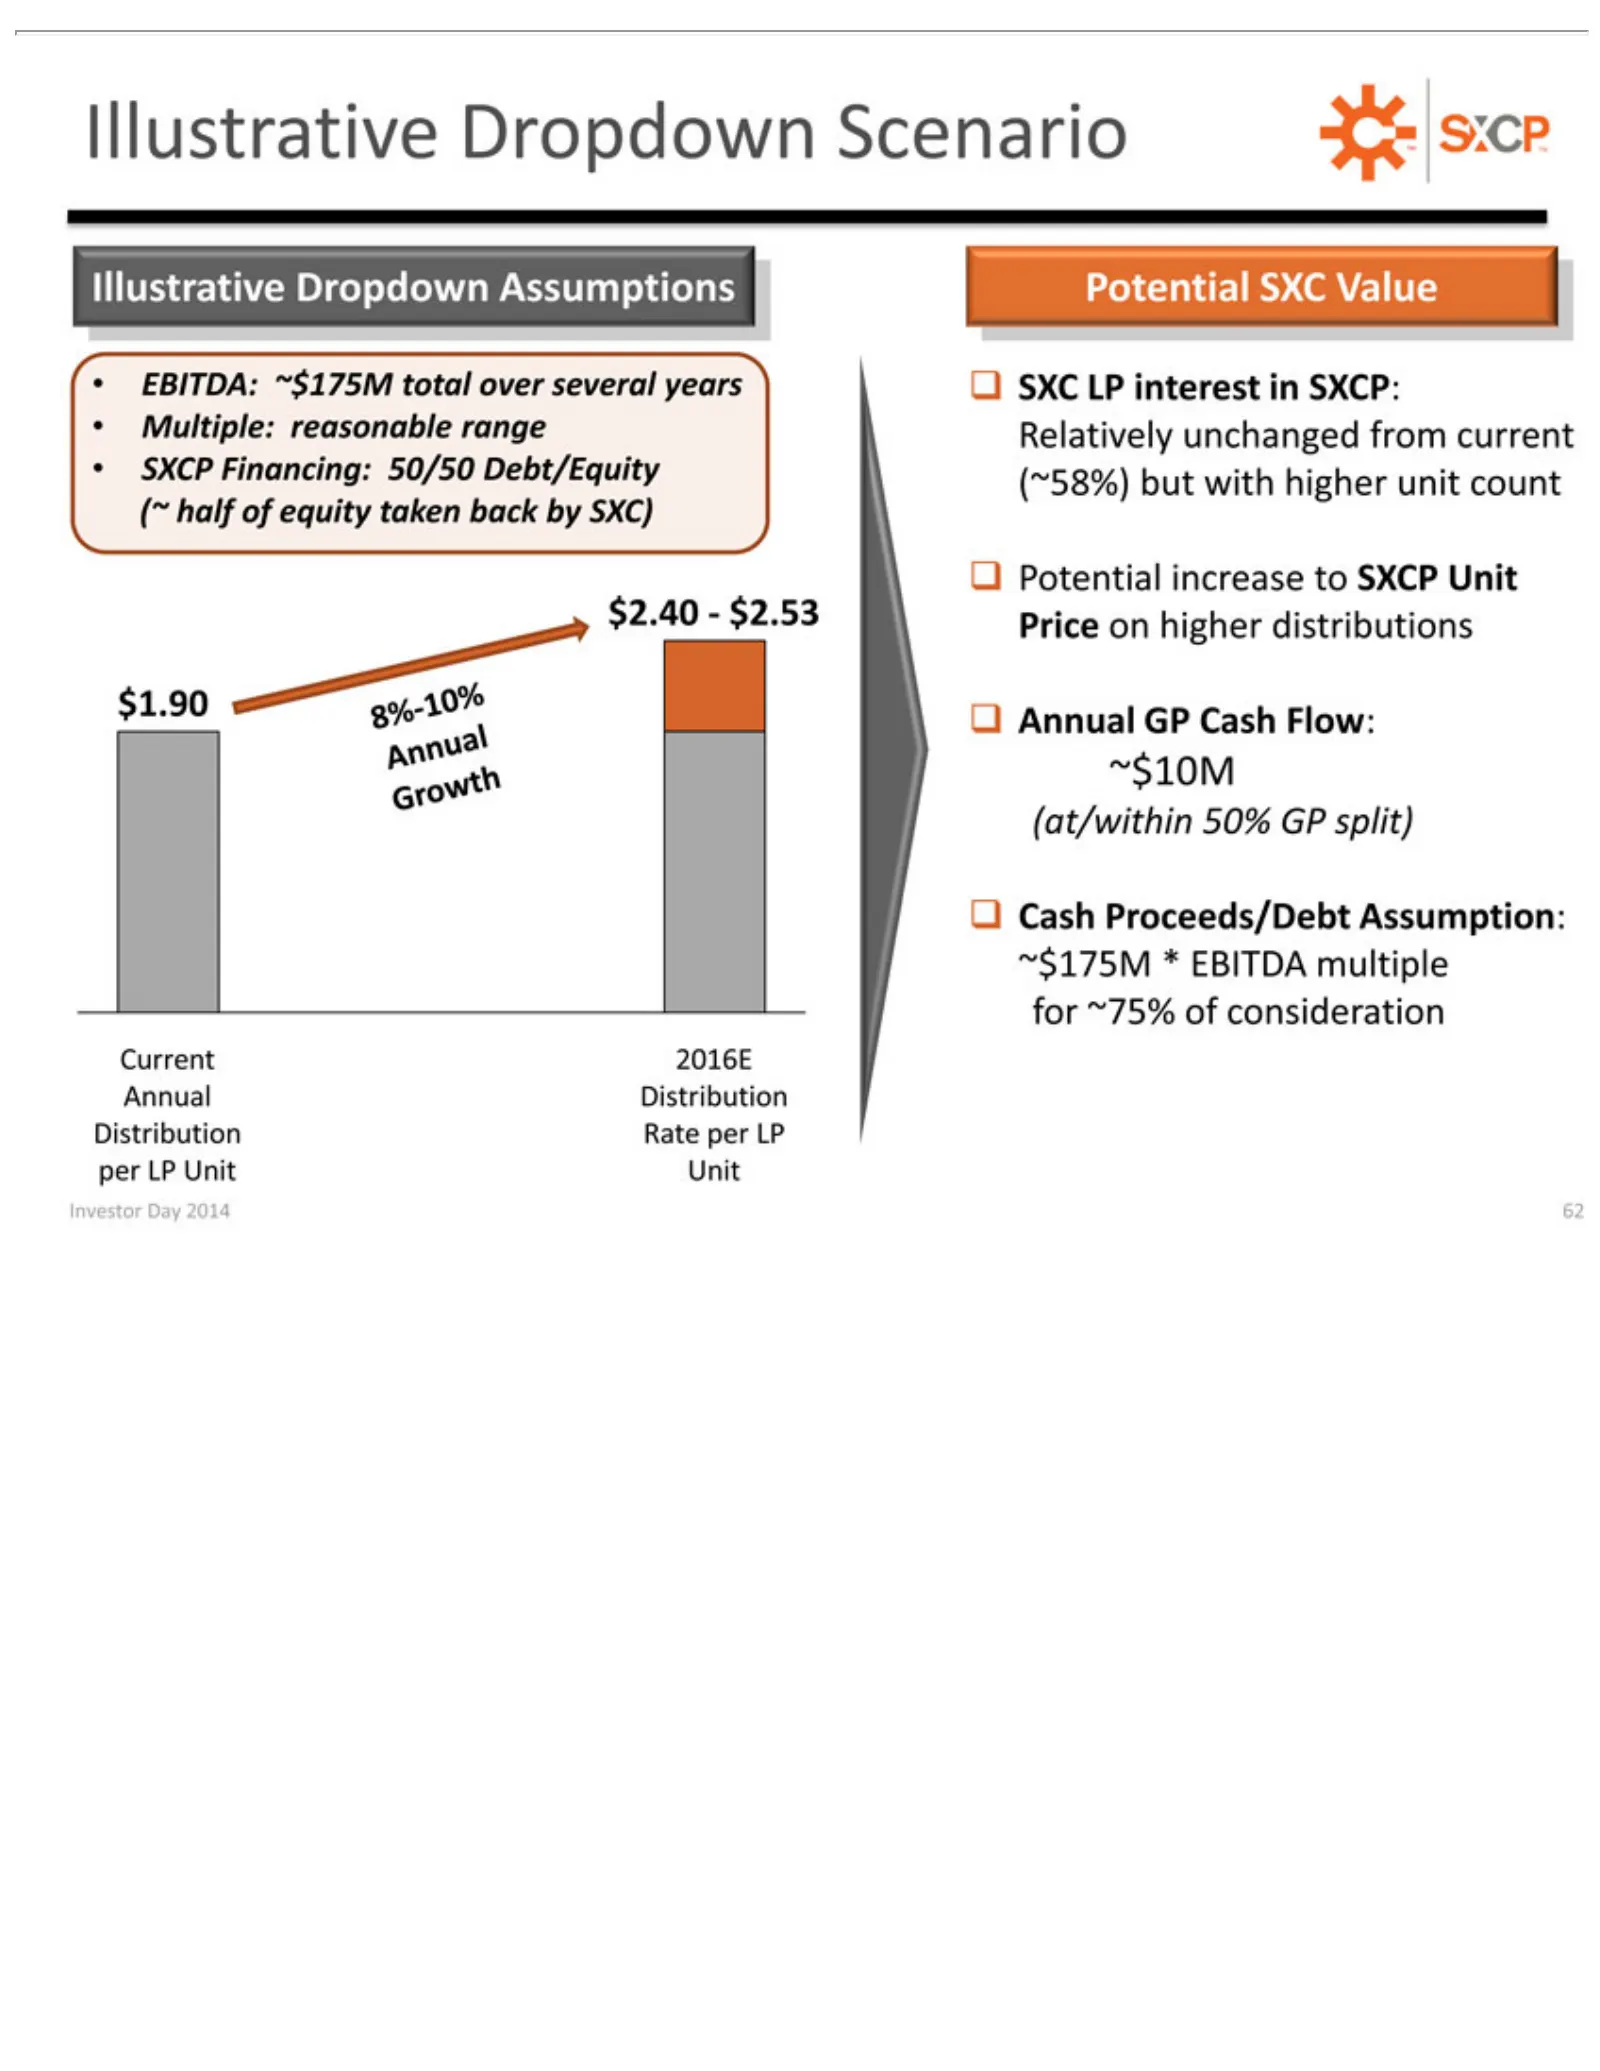
Slide 62: Illustrative Dropdown Scenario
Illustrative EBITDA: •Multiple: (~ ??Potential (at/within ~$10M ??Cash ~$175M Current Investor SXCP half of Proceeds/Debt 2016E Financing: Day *reasonable equity 50% ~$175M EBITDA Dropdown increase 2014 Annual GP taken 62 split) 50/50 total to multiple range Assumptions Scenario Assumption: back SXC
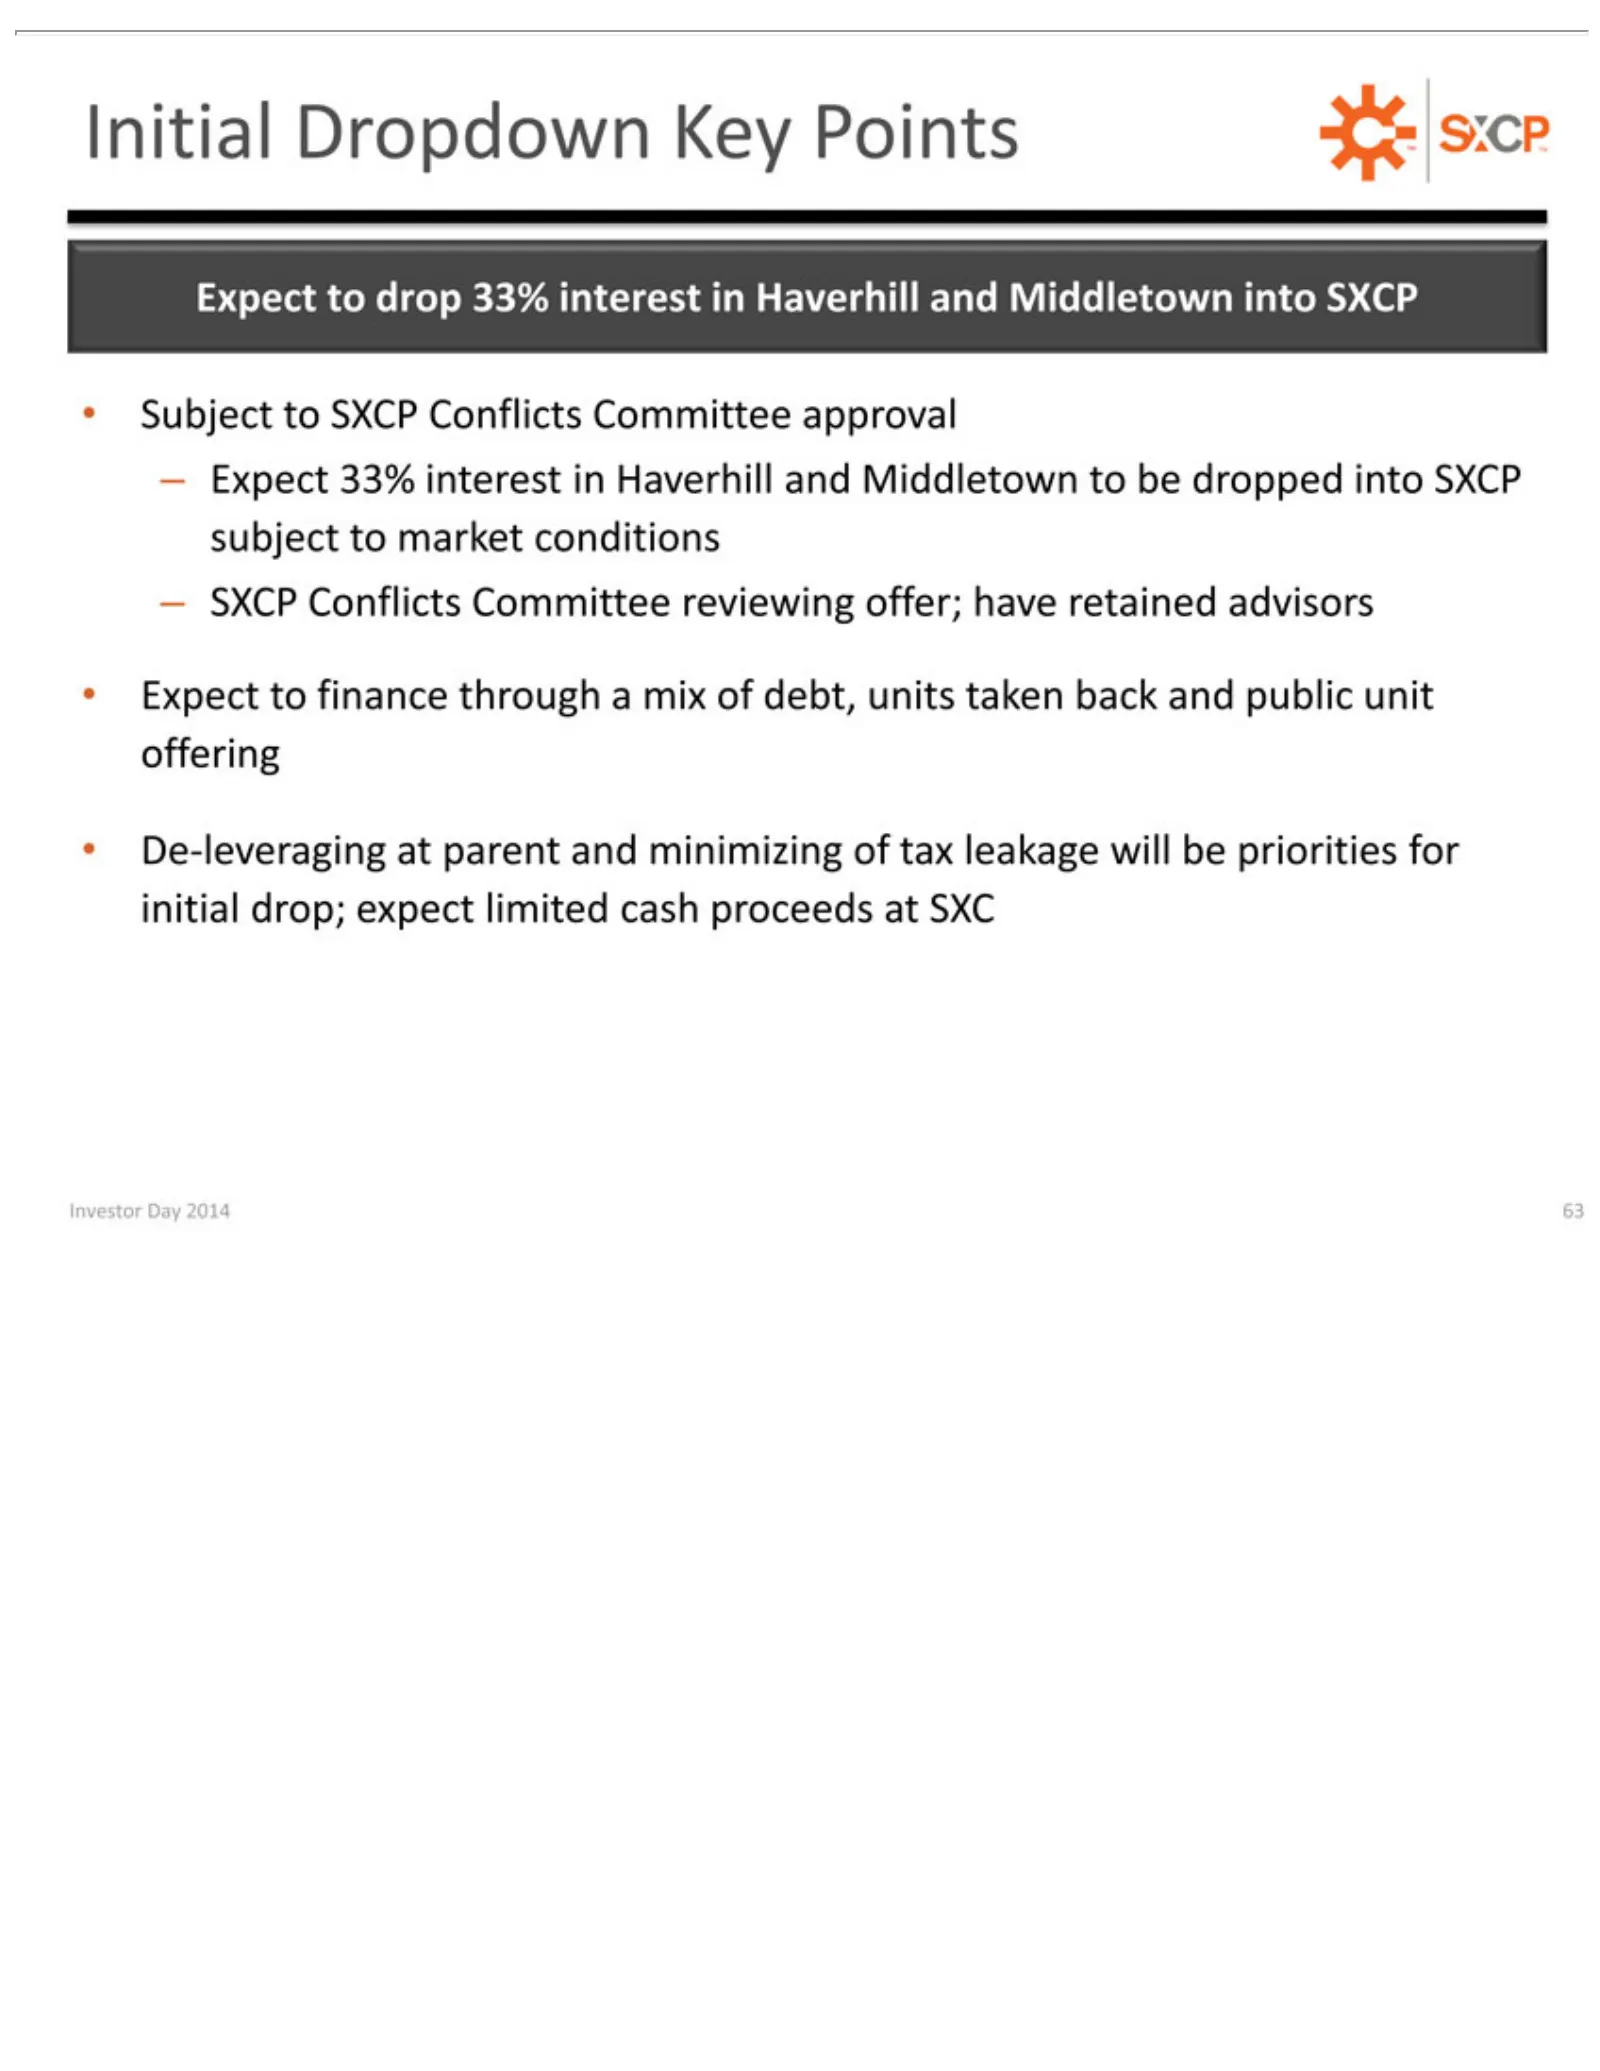
Slide 63: Initial SXCP Dropdown Key Points
Initial –Subject Expect De-leveraging Investor Expect SXCP Dropdown to to Conflicts Day 33% drop finance SXCP 2014 interest at 33% parent Conflicts Key through Committee 63interest in Points and Haverhill aCommittee mix minimizing inTM reviewing Haverhill of and debt, approval Middletown of offer; u
Slide 64: Fritz Henderson, Chairman and Chief Executive Officer
Fritz Henderson Chairman Chief Executive & Officer
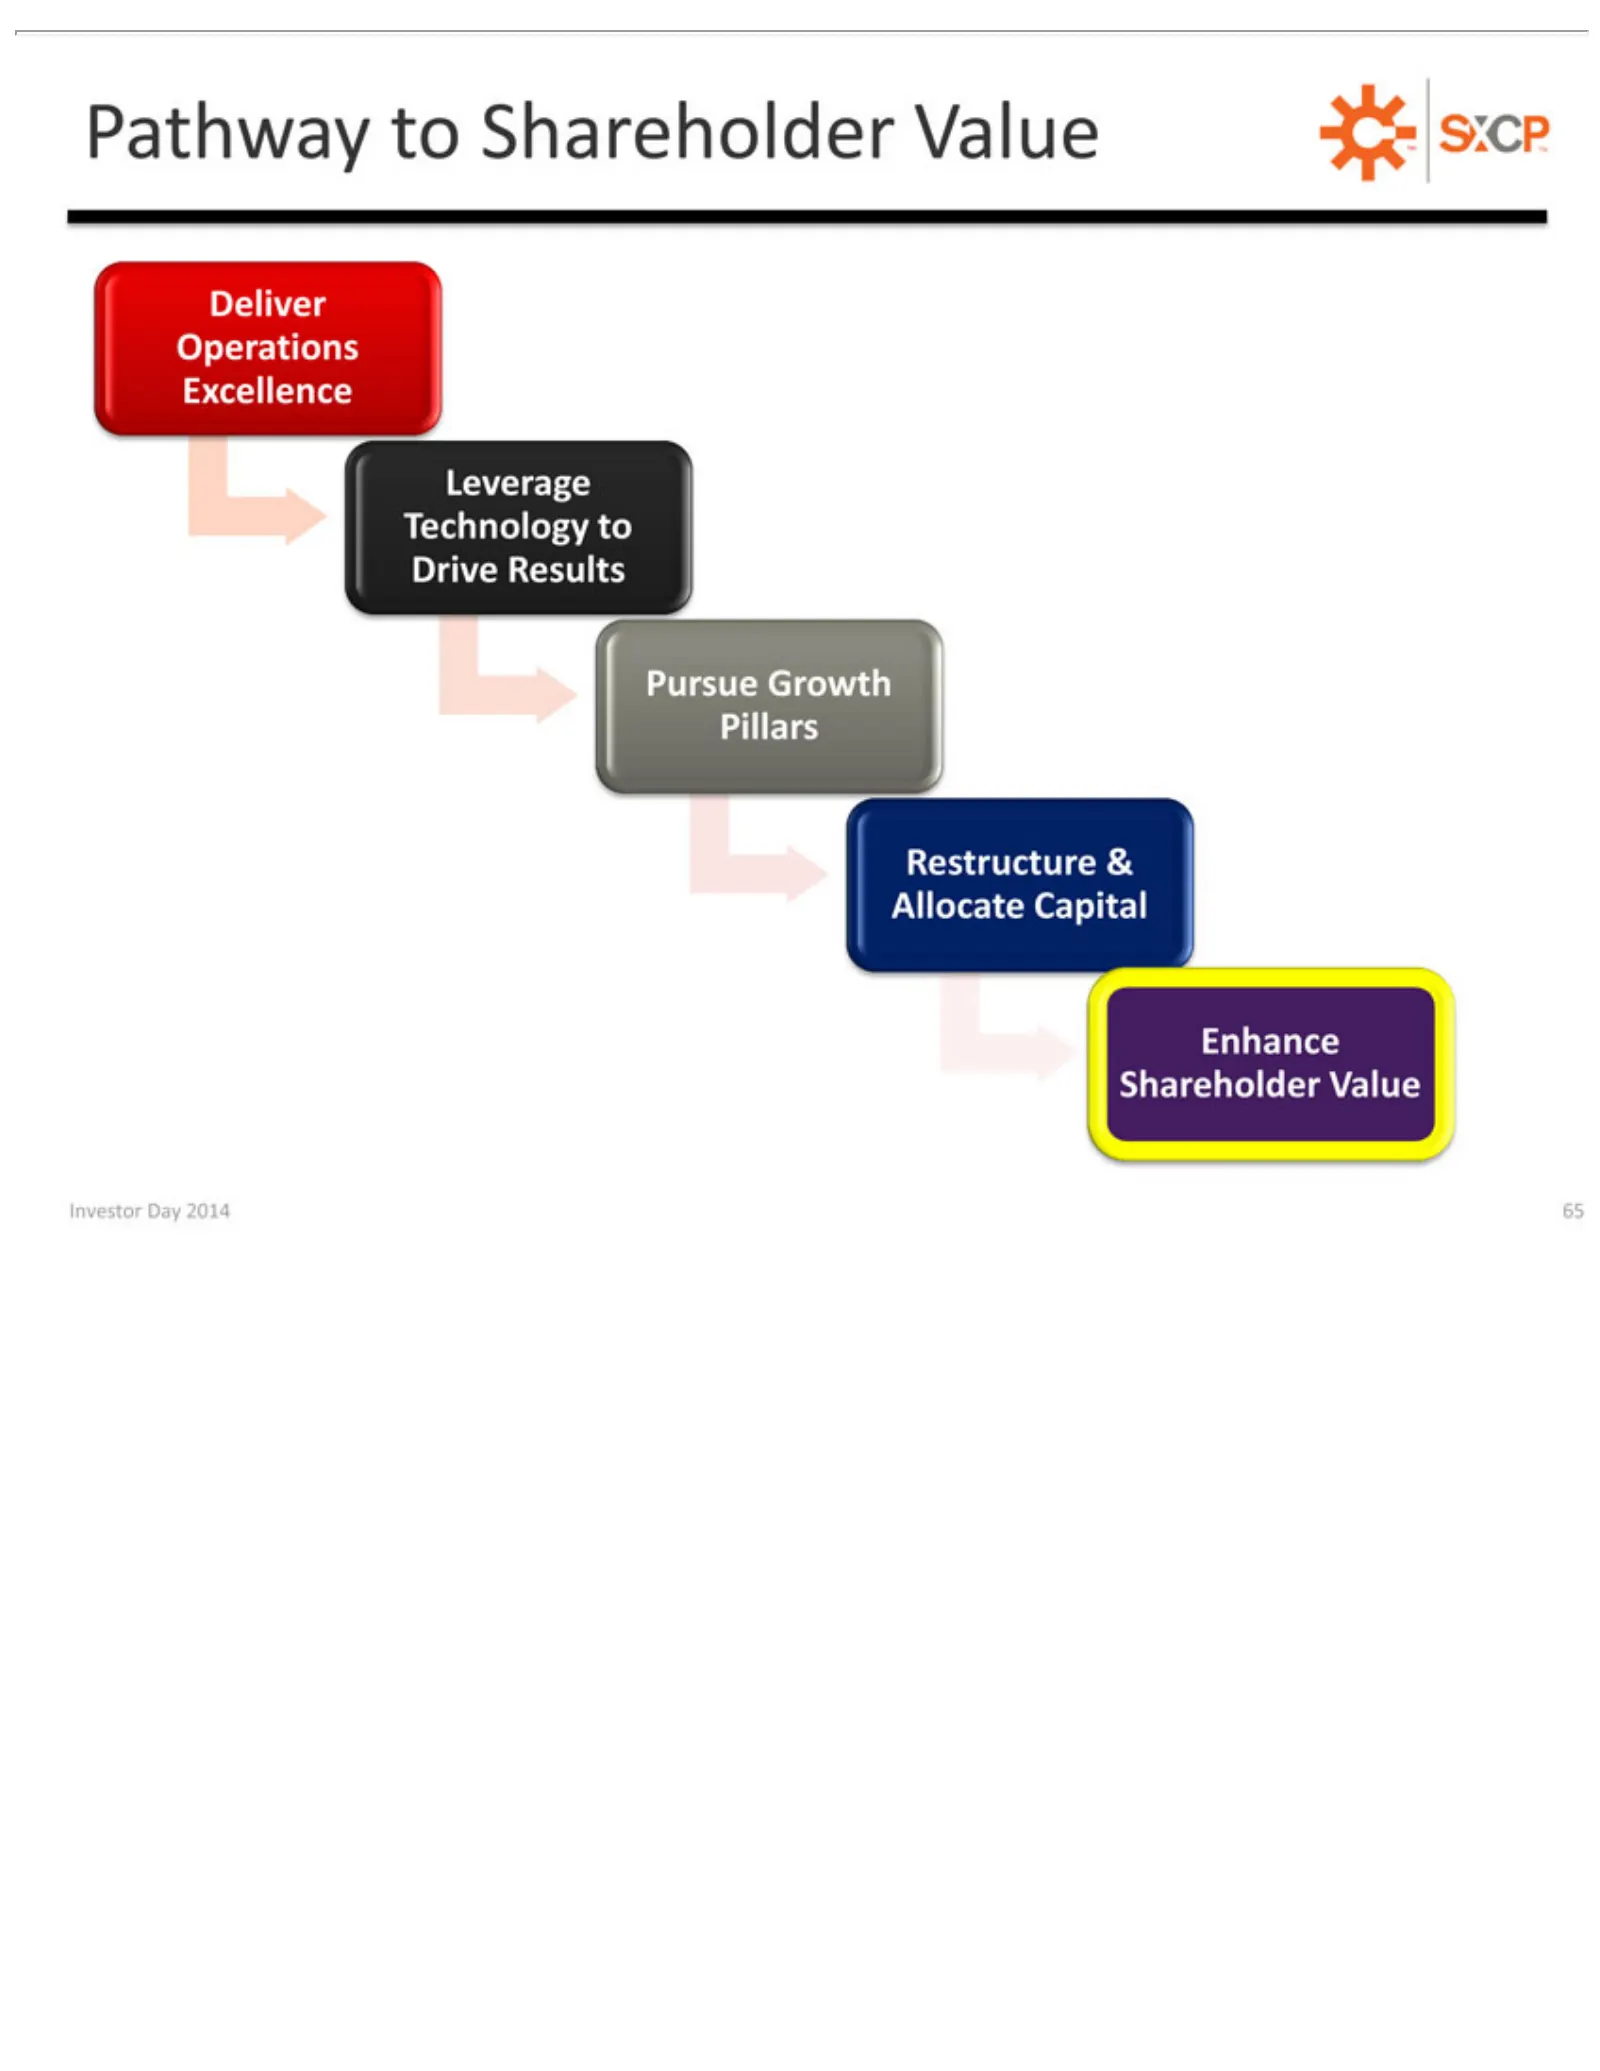
Slide 65: Pathway Pillars: Restructure
PathwayGrowth Deliver Technology Leverage Pursue Restructure Pillars Shareholder Enhance InvestorOperations Day to Shareholder & to Value 2014 Allocate Drive 65 Excellence Results Capital Value TM
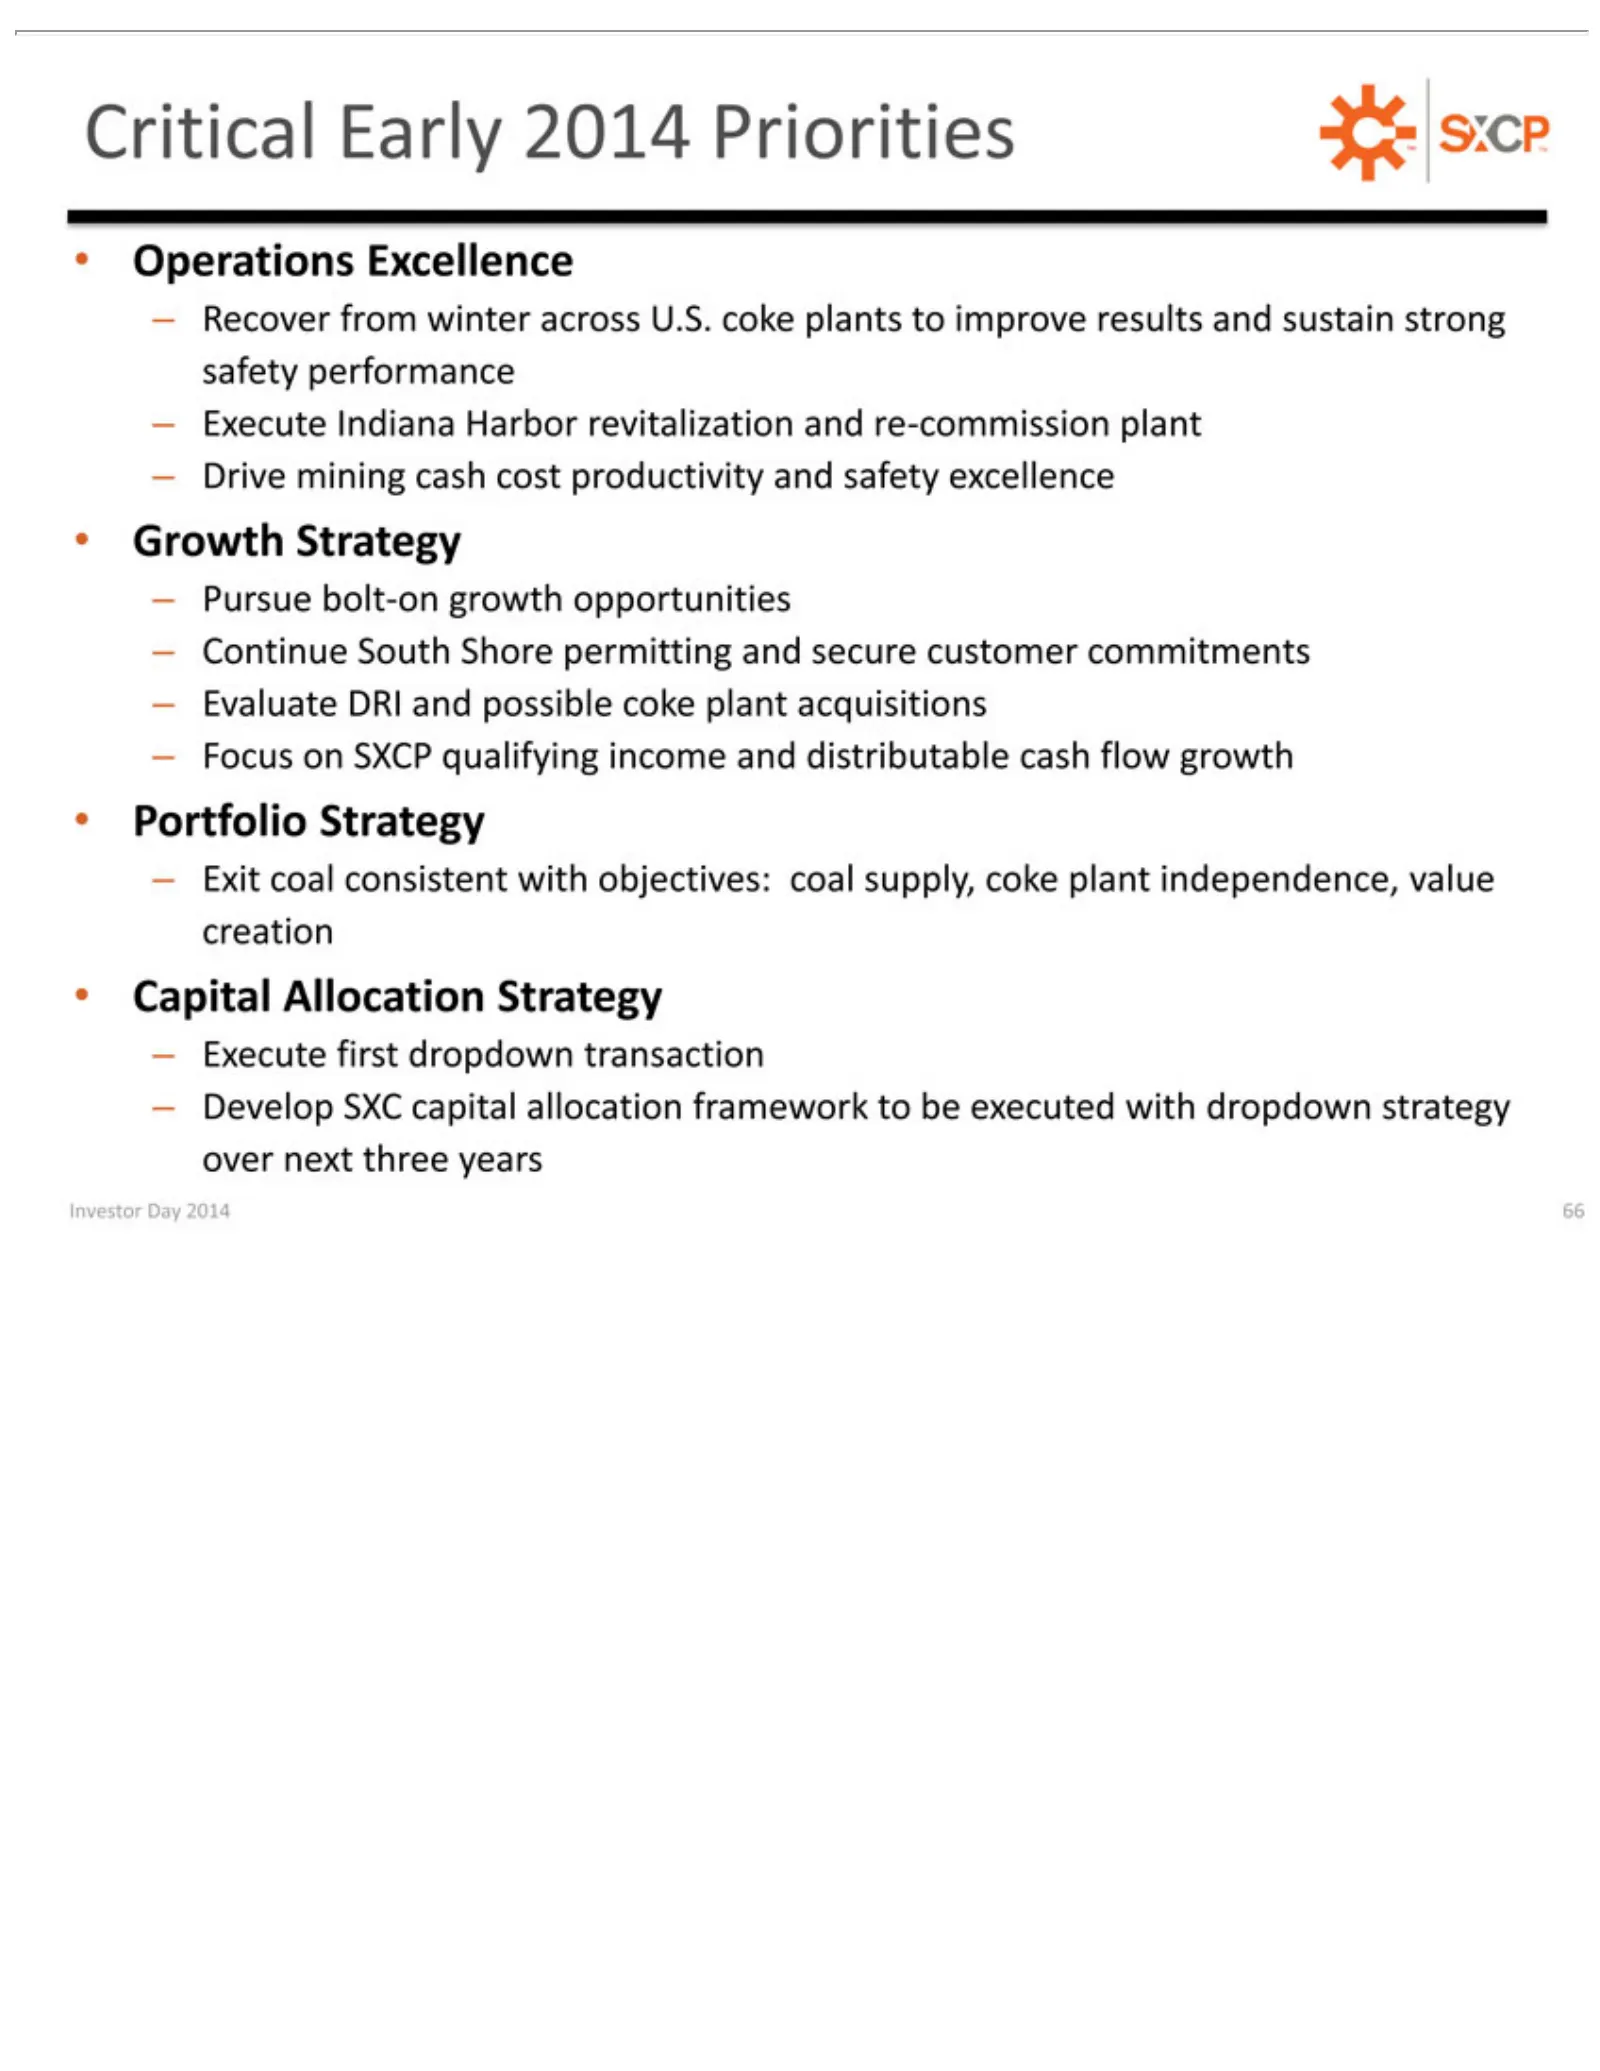
Slide 66: 2014 Priorities
–•Critical Investor Operations Growth Portfolio Capital Recover Drive Pursue Continue Evaluate Focus Exit Execute Develop coal Early mining on Day Allocation bolt-on Strategy Indiana first from SXC Strategy DRI consistent SXCP South Excellence 2014 2014 dropdown cash and winter capital growth Shore
Slide 67: Appendix
Investor Day 2014 67 APPENDIX
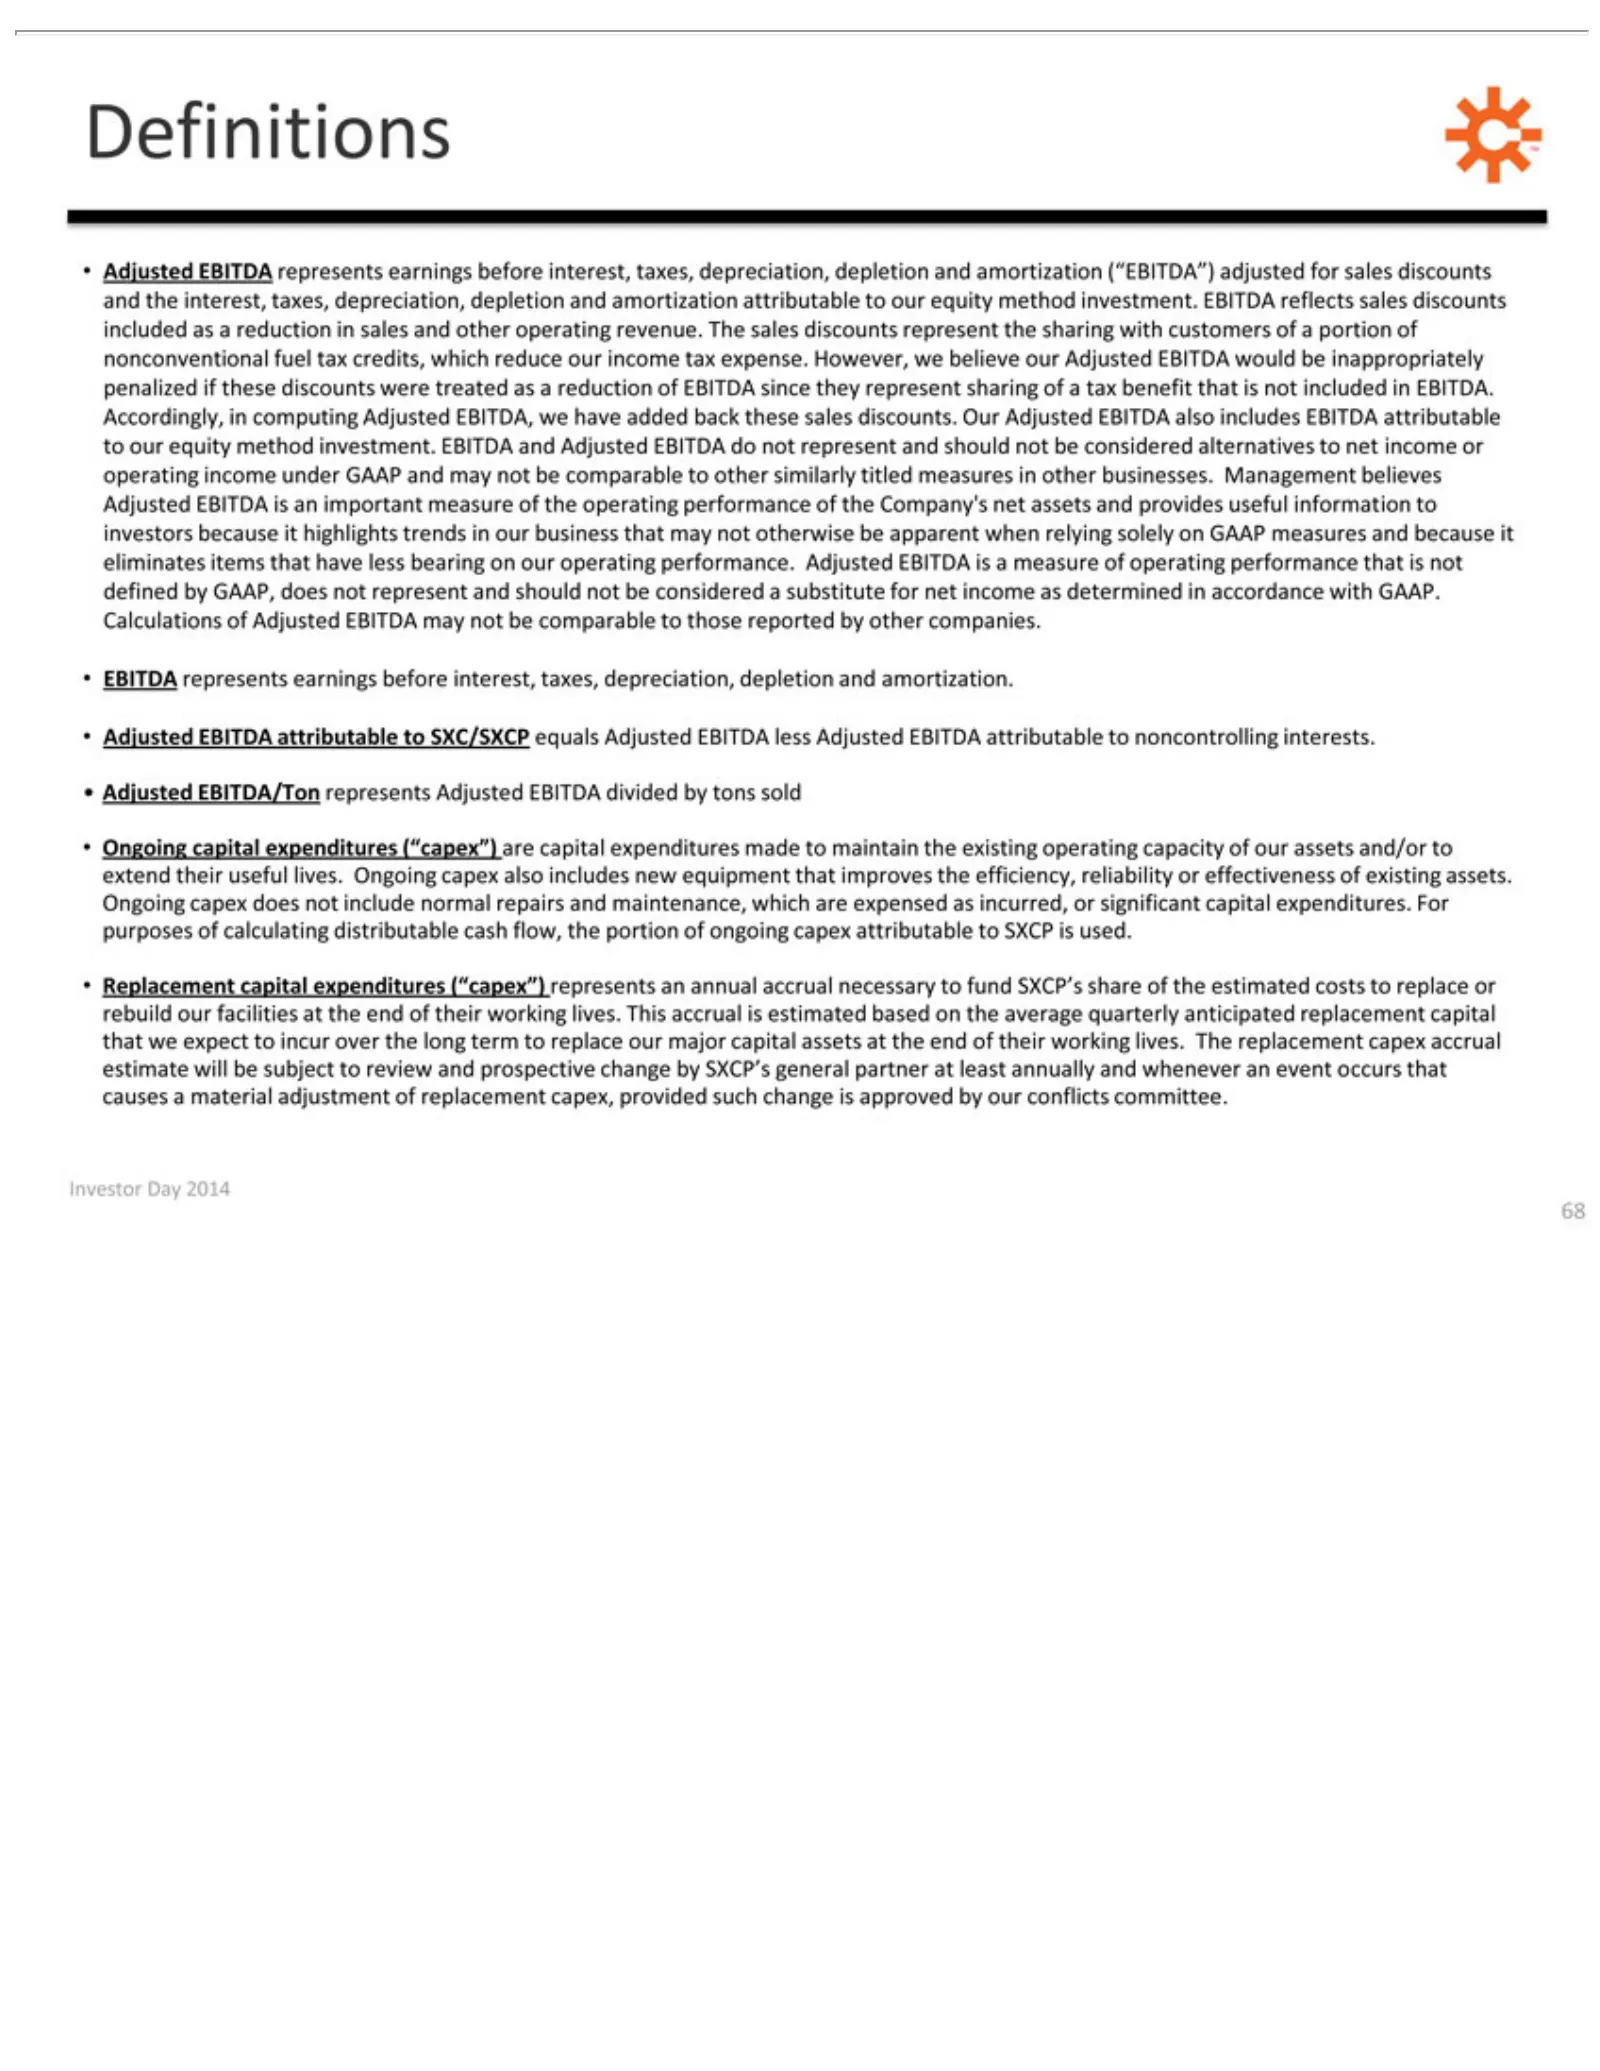
Slide 68: Definitions
Definitions attributable portion reduction under Company’s eliminates substitute •EBITDA Adjusted Ongoing that For Replacement is capex provided Investor Adjusted estimated purposes improves GAAP accrual ofDay capital such also represents EBITDA EBITDA/Ton of for nonconventional items EBITDA to net
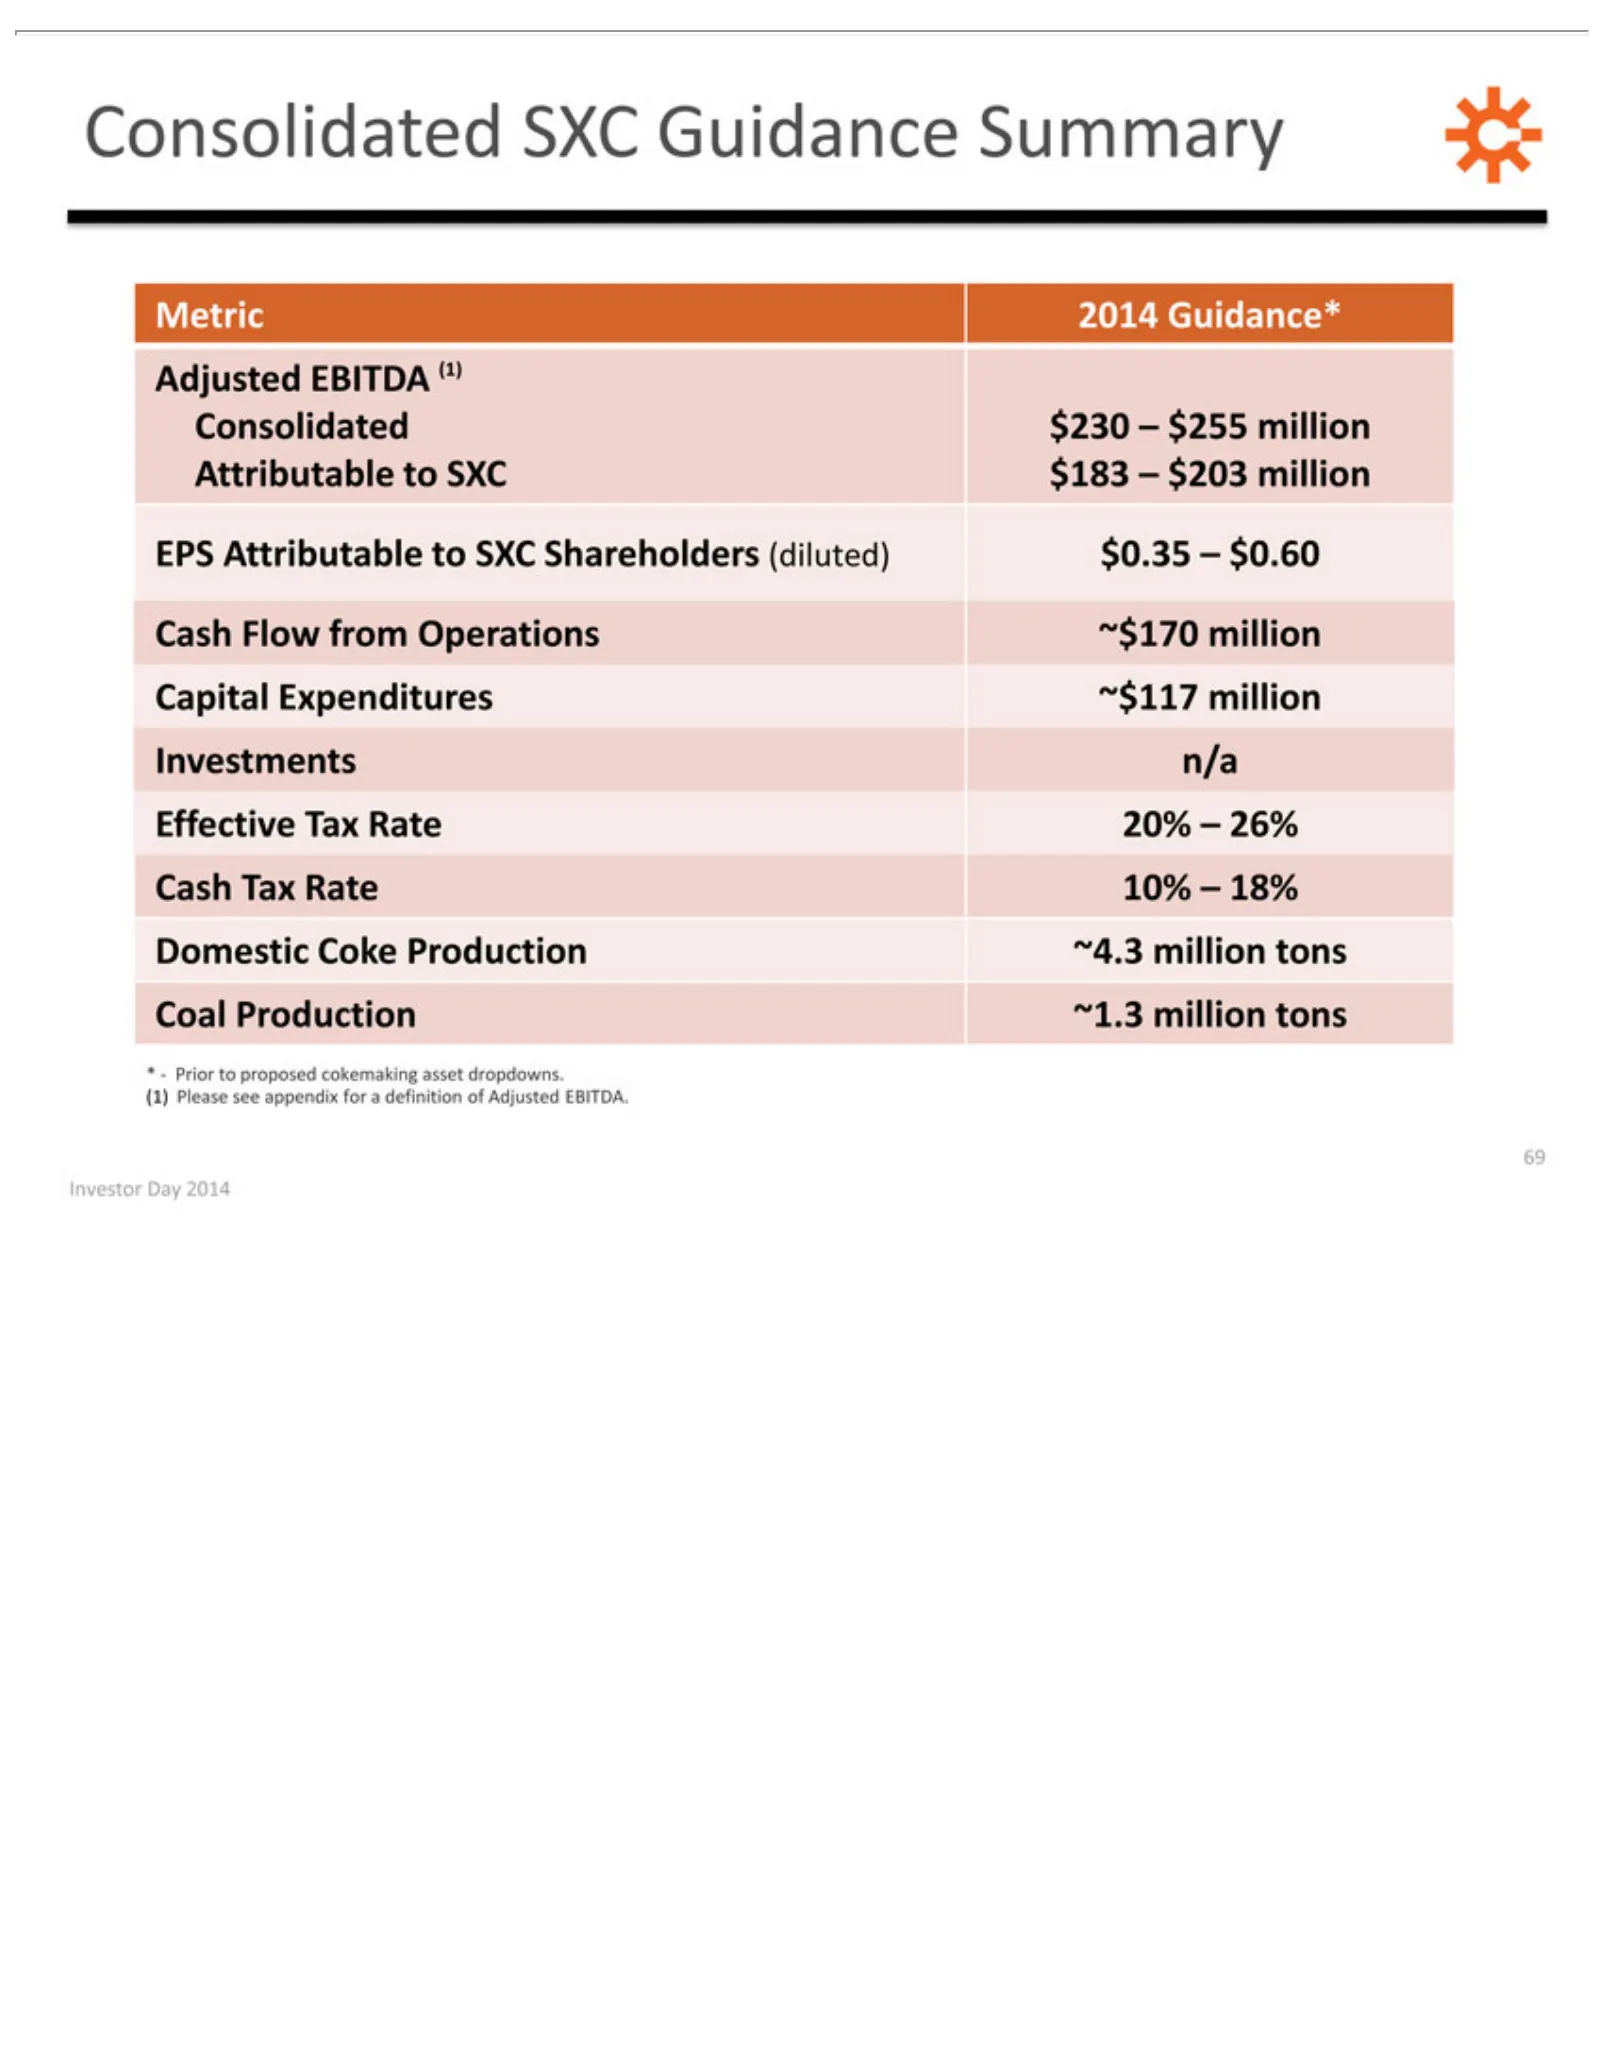
Slide 69: 2014 Guidance
Metric Adjusted Consolidated EPS Cash Capital *— (1) Investor Please Prior Attributable Flow 2014 Expenditures Day EBITDA to see from proposed Guidance* 2014 SXC $230 appendix Operations to69 (1) Guidance –SXC $255 ~$117 cokemaking for Shareholders million a~$170 million definition Summary Attributa
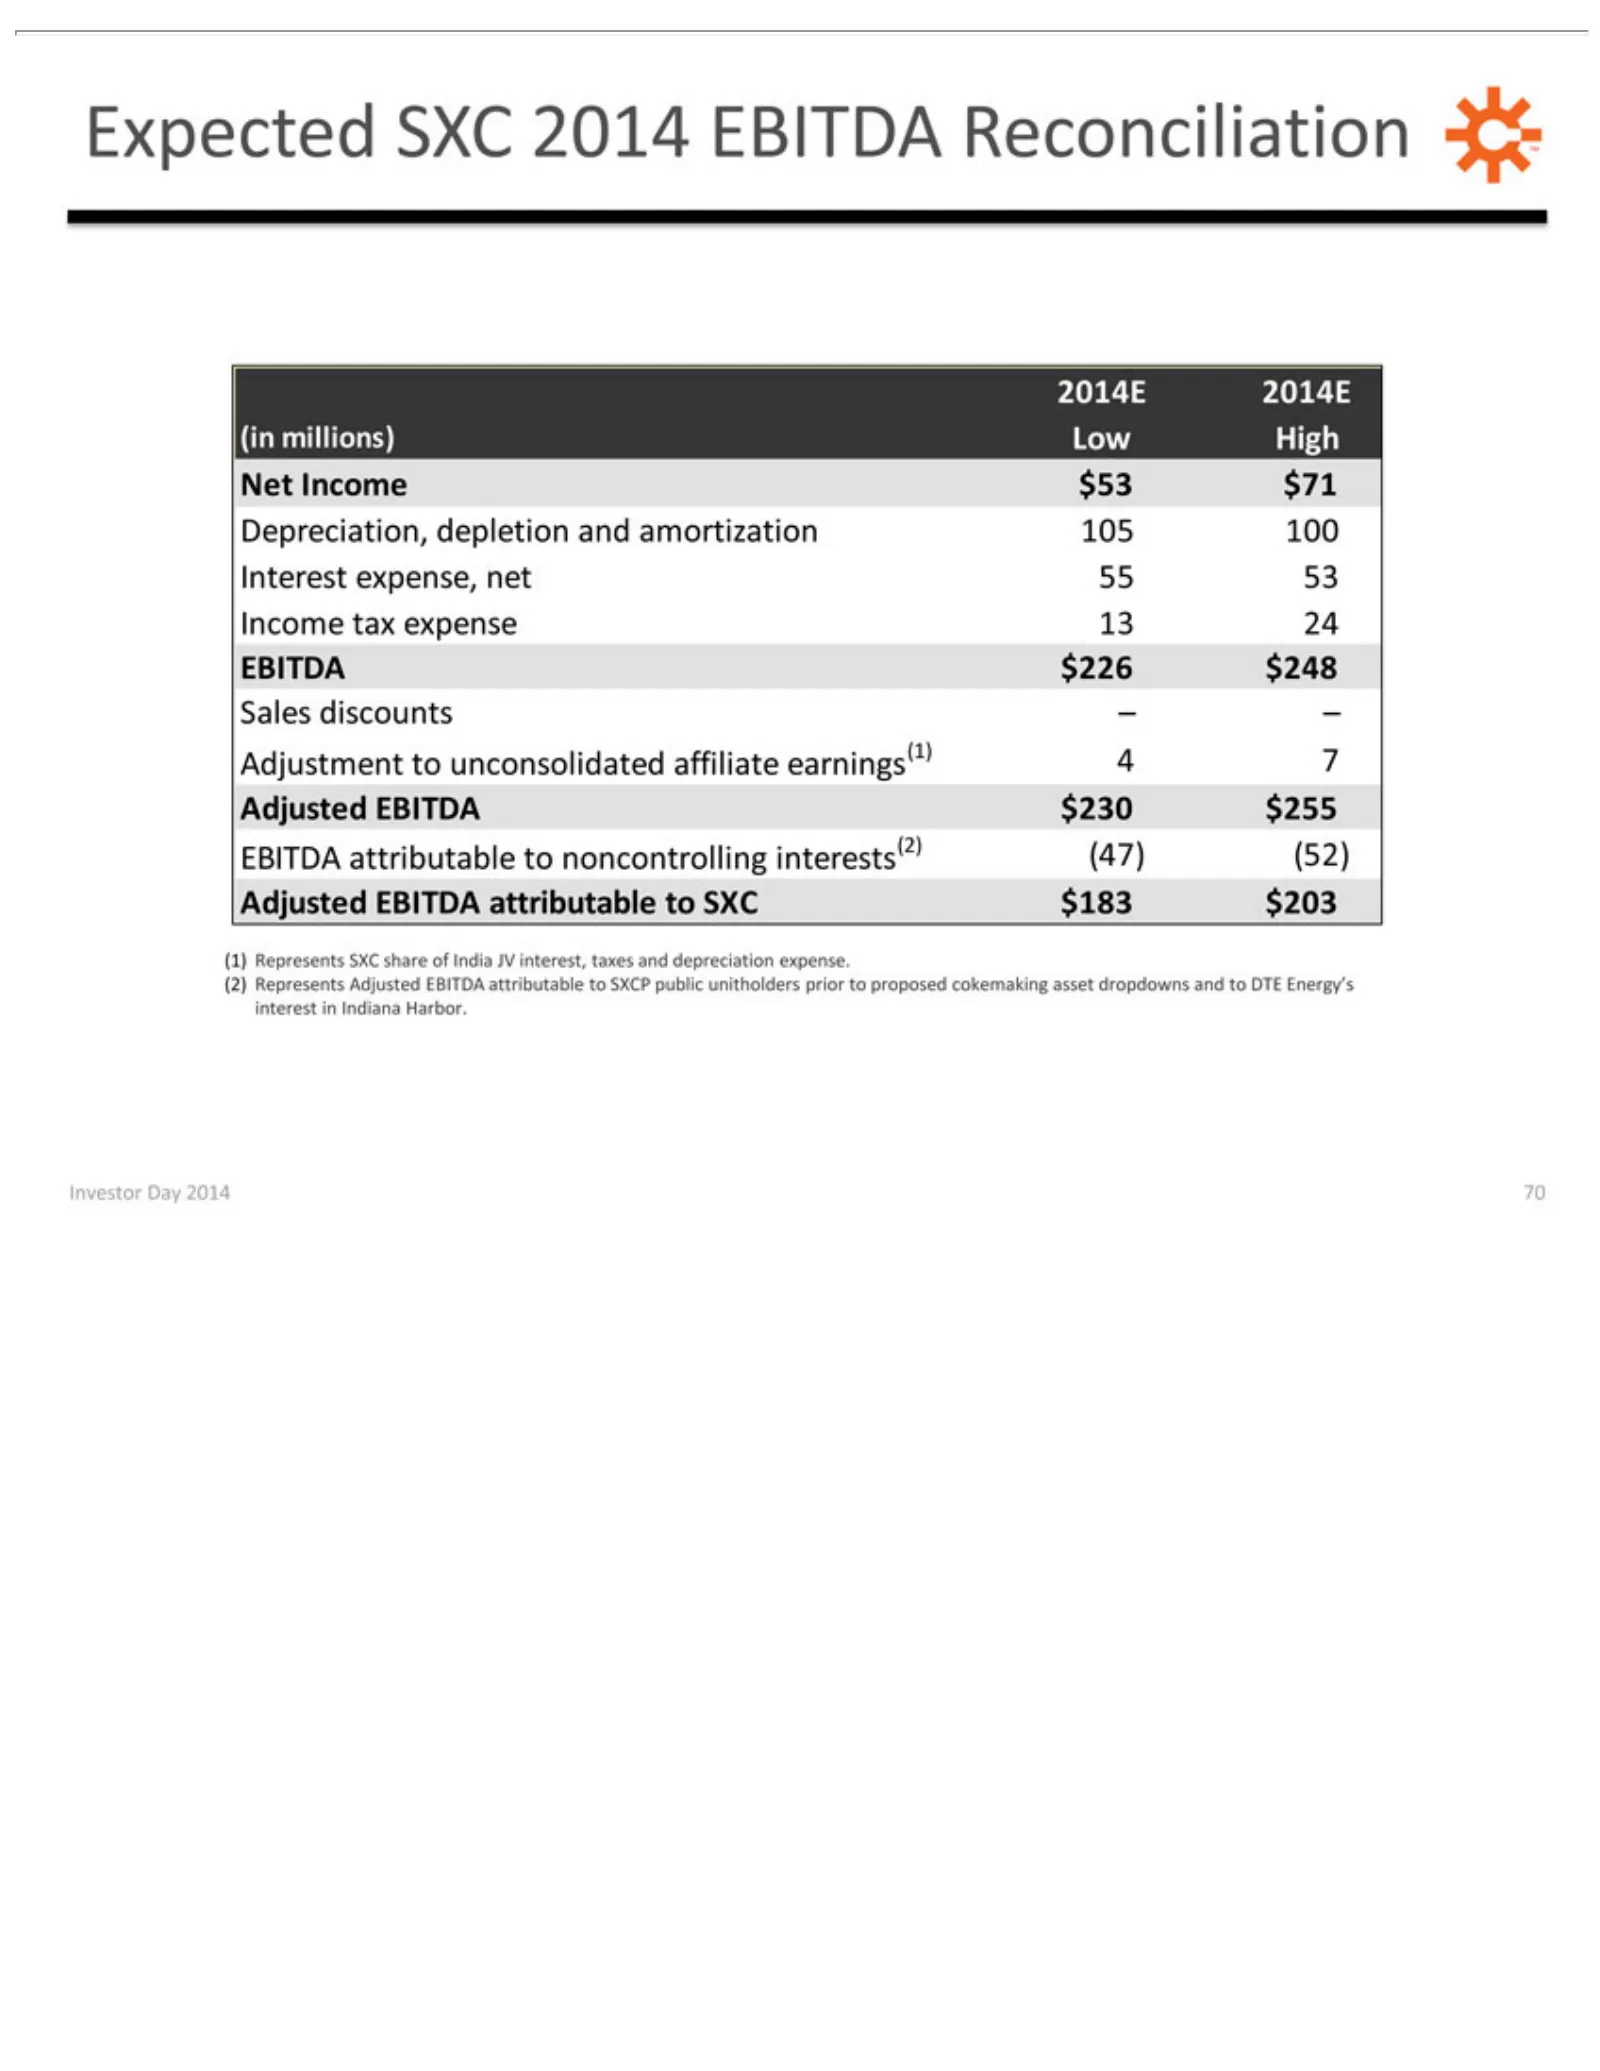
Slide 70: 2014E SXC Adjusted EBITDA Reconciliation
69 Investor Expected 2014E Depreciation, Sales EBITDA Adjusted (1) (2) Investor Represents discounts 2014E Day $226 attributable EBITDA SXCDay 2014 depletion (in Adjusted SXC $248 2014 –2014 millions) –Adjustment 70 $230 attributable share EBITDA to and noncontrolling EBITDA $255 ofLow amortization
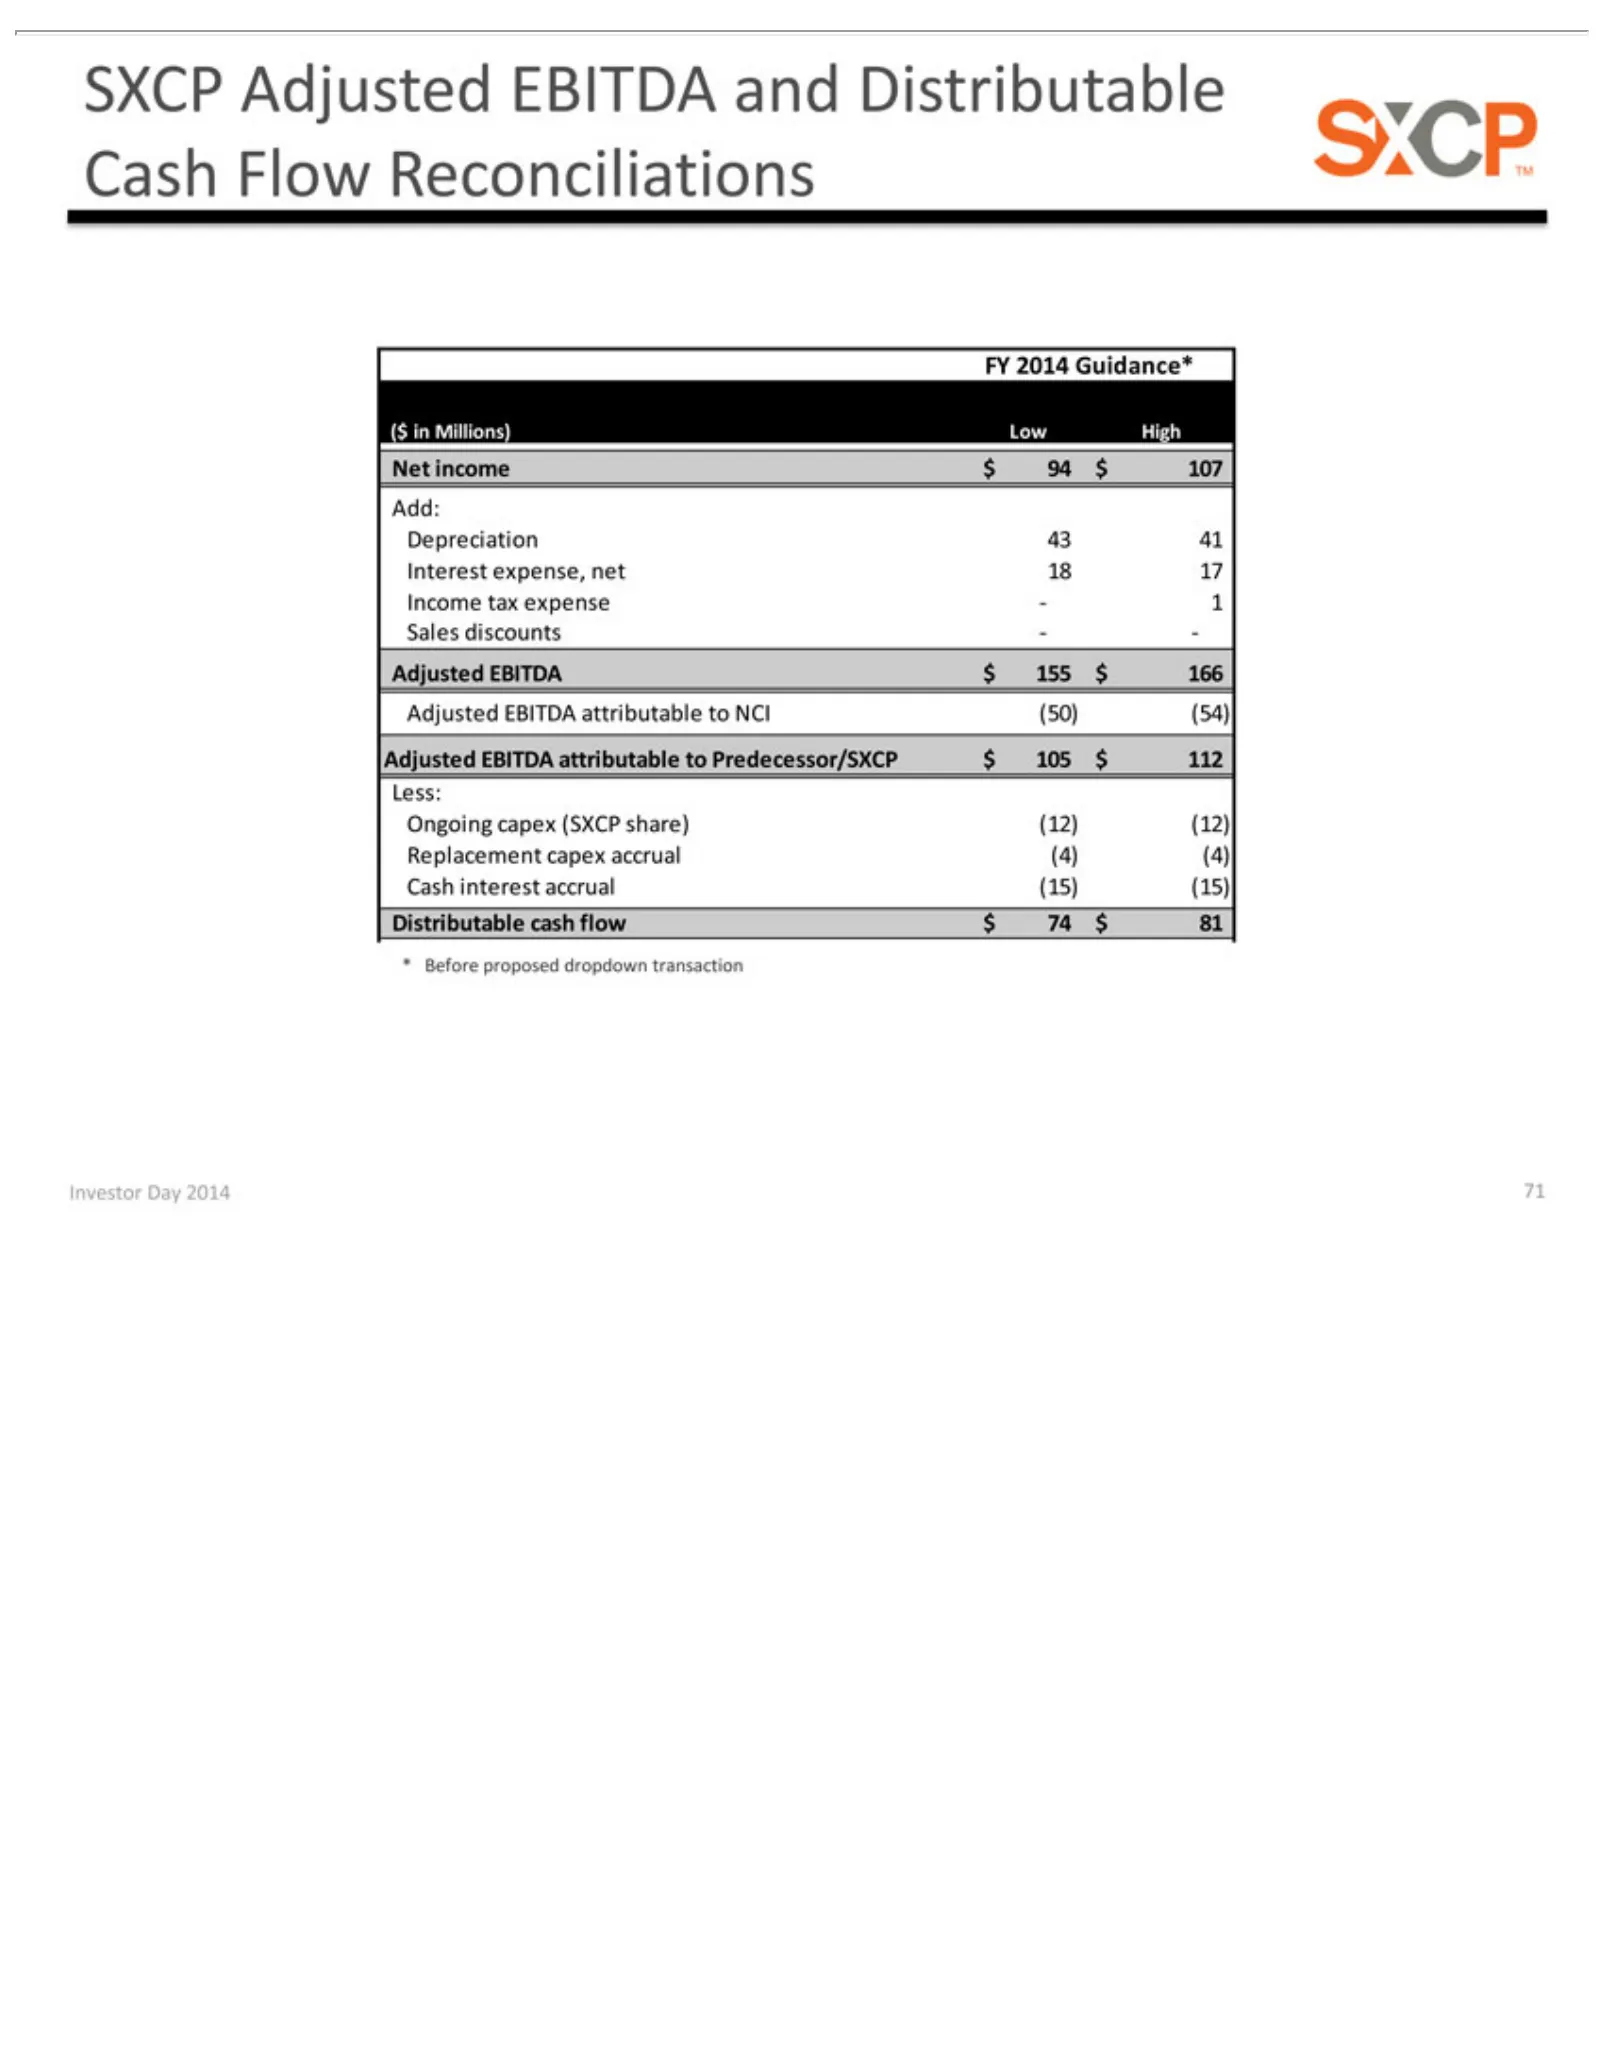
Slide 71: SXCP 2014 Guidance Reconciliations
SXCP FY ($ Net Depreciation Add: Adjusted Ongoing Less: *Distributable Investor Before in2014 income Millions) Adjusted Day proposed Guidance* capex EBITDA $43 2014 cash 94Low (SXCP EBITDA 41 $ flow dropdown 107 71 $Interest attributable High 155share) $ $74 and 166 expense, $transaction (12) Distri
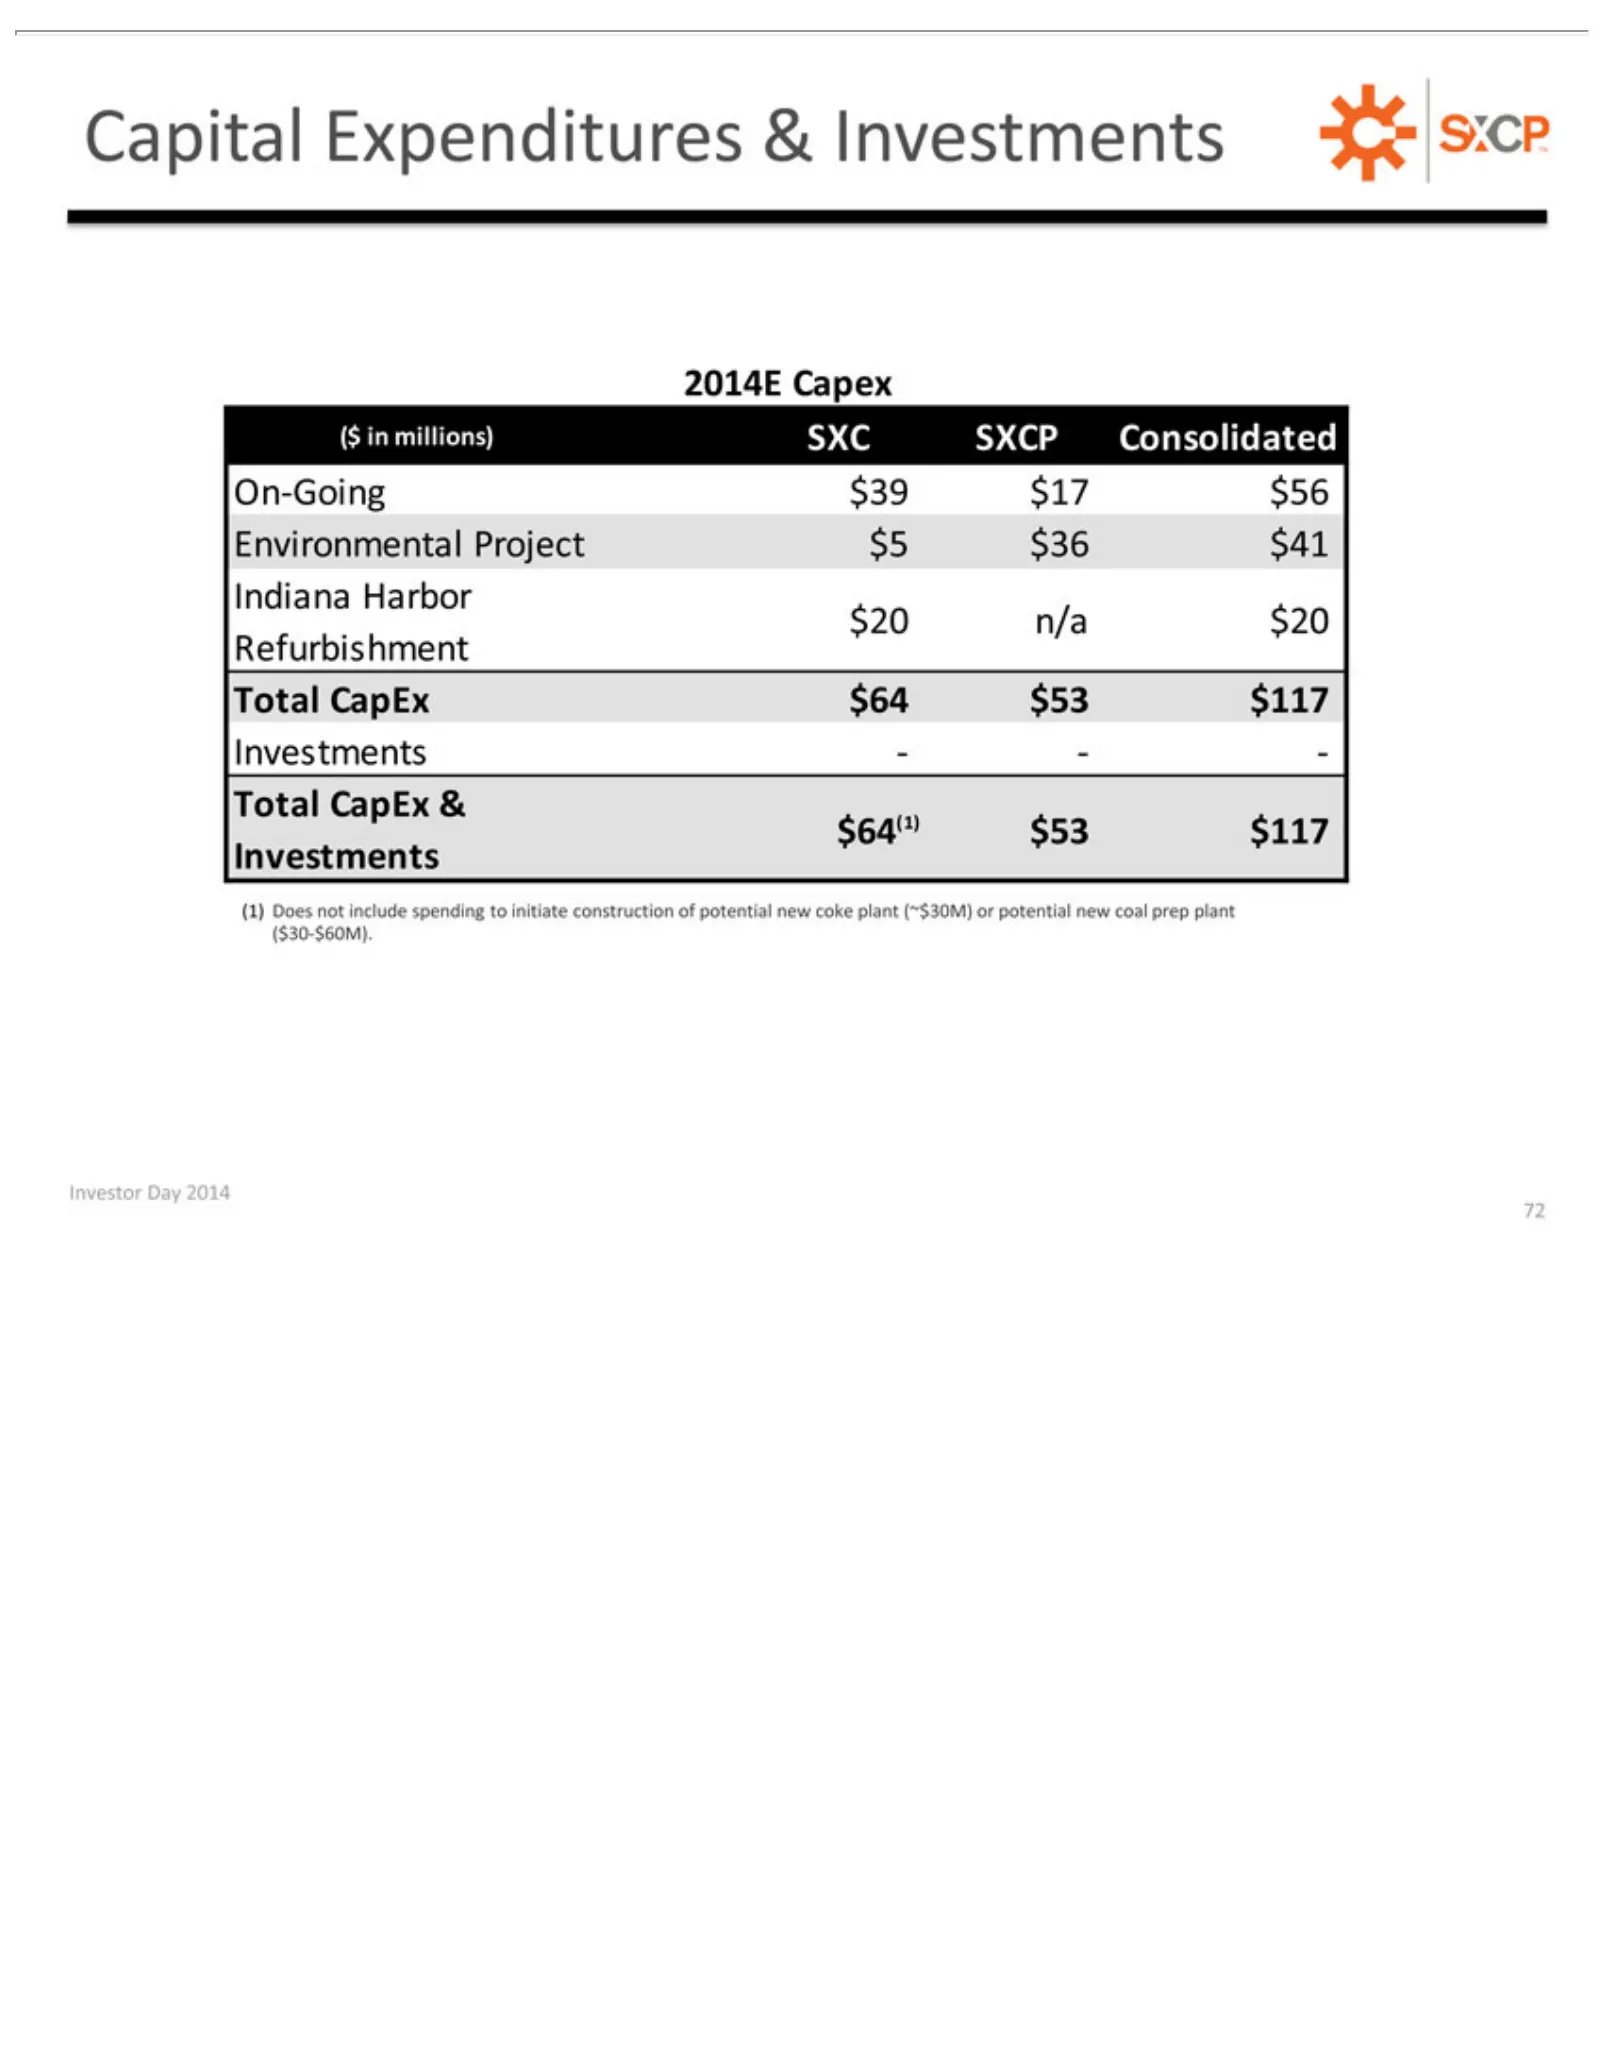
Slide 72: 2014E Capital Expenditures
Capital 2014E ($ On-Going Investments Total $64(1) (1) Investor ($30-$60M). inDoes millions) CapEx Capex $53 Expenditures Day not $39 $117 — include $64 &2014 SXC $17 —Investments $53 -72 $56 SXCP spending &$117 Environmental Investments Consolidated to initiateProject construction $5 $36of $41 pote
Source: SEC EDGAR · 8-K filed Mar 11, 2014
More decks from SunCoke Energy Partners L.P
 Merger or Acquisition (May 2019)42 slides · May 22, 2019
 Q1 2019 Earnings Presentation26 slides · Apr 24, 2019
 Merger or Acquisition (February 2019)41 slides · Feb 26, 2019
 FY2018 Earnings Presentation37 slides · Feb 5, 2019
 FY2018 Earnings Presentation36 slides · Feb 5, 2019
 Q3 2018 Earnings Presentation25 slides · Oct 25, 2018