YIT Oyj · OMXHEX:YIT
YIT Oyj — Non-Deal Roadshow (September 2019)
78 slides from YIT Oyj's roadshow presentation, September 2019

Slide 1: Roadshow presentation September 2019
TRIPLA PROJECT HELSINKI, FINLAND Roadshow presentation September 2019
Slide 2: Contents
Contents 1 YIT in a nutshell 2 YIT’s strategy 2019-2021 3 Group development in Q2/2019 4 Segment reviews 5 Financial position and key ratios 6 Outlook and guidance 7 Appendices 2 Roadshow presentation, September 2019 KONEPAJA AREA DEVELOPMENT PROJECT HELSINKI, FINLAND

Slide 3: YIT in a nutshell
1 YIT in a nutshell 3 Roadshow presentation, September 2019 TRIPLA PROJECT HELSINKI, FINLAND
Slide 4: The merger of YIT and Lemminkäinen, February 1st 2018
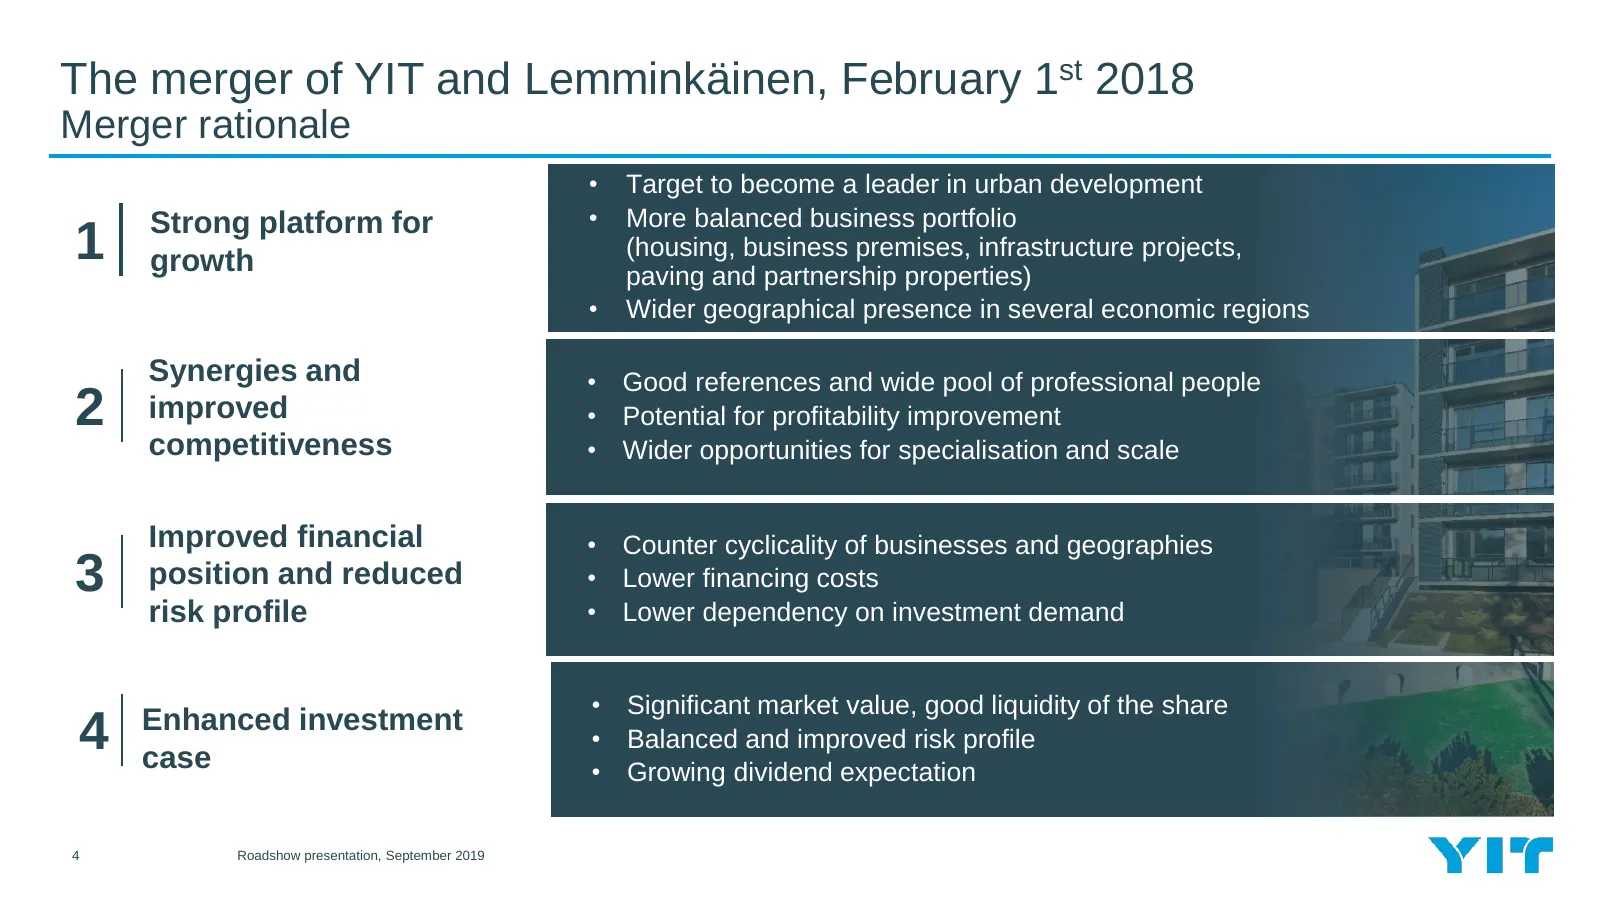
The merger of YIT and Lemminkäinen, February 1st 2018 Merger rationale • Target to become a leader in urban development Strong platform for • More balanced business portfolio 1 growth (housing, business premises, infrastructure projects, paving and partnership properties) • Wider geographical presen
Slide 5: YIT to sell Nordic paving and mineral aggregates businesses to Peab
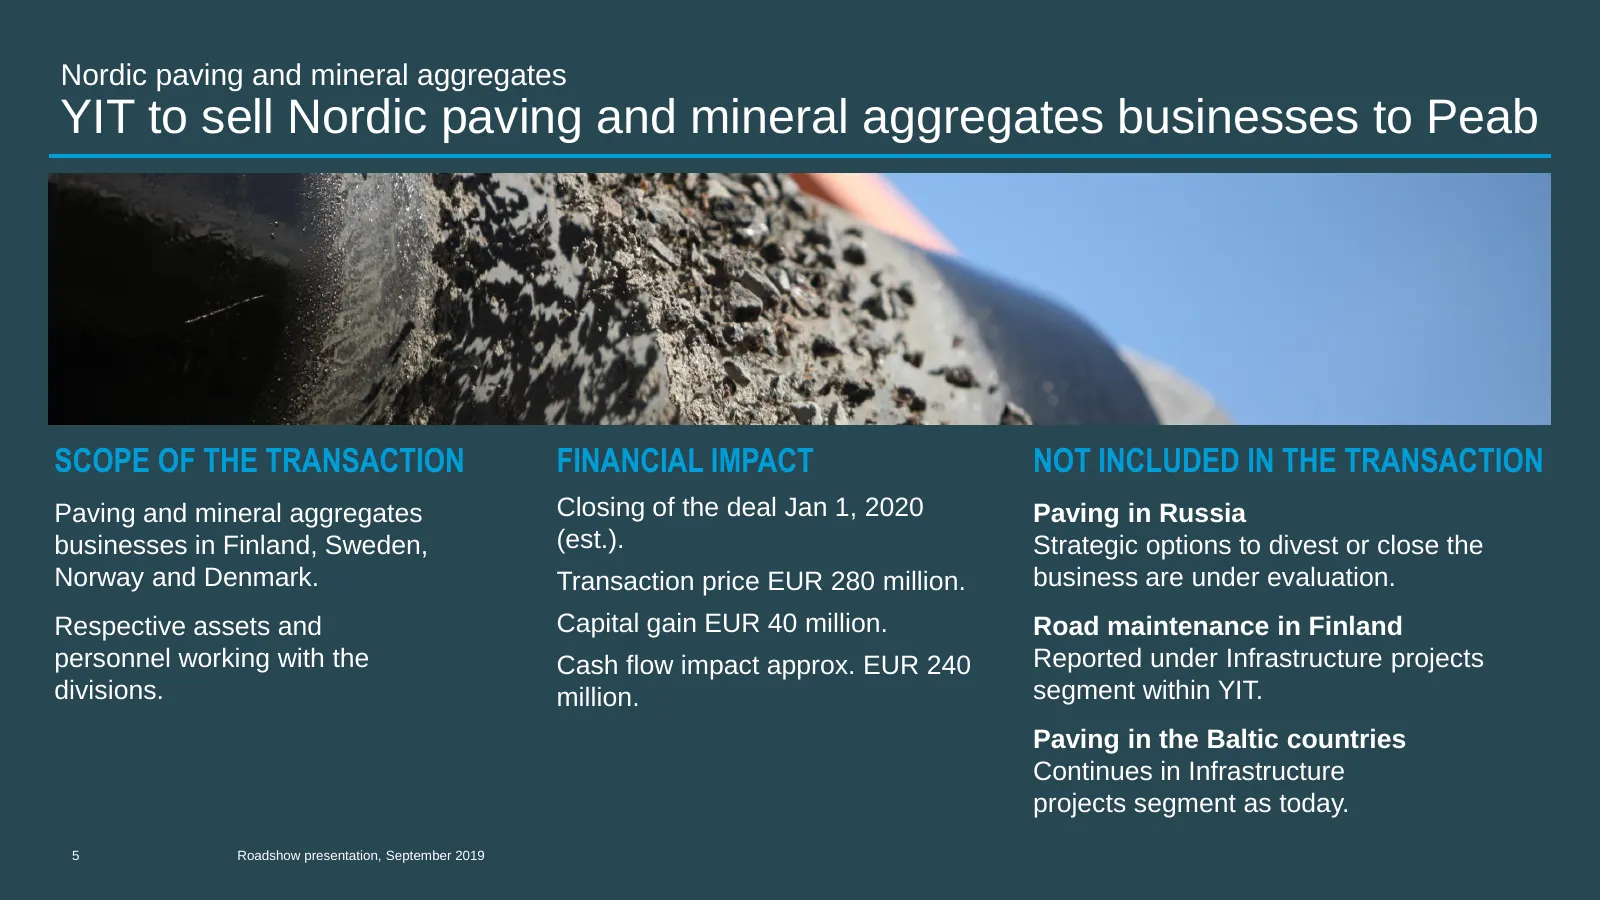
Nordic paving and mineral aggregates YIT to sell Nordic paving and mineral aggregates businesses to Peab SCOPE OF THE TRANSACTION FINANCIAL IMPACT NOT INCLUDED IN THE TRANSACTION Paving and mineral aggregates Closing of the deal Jan 1, 2020 Paving in Russia businesses in Finland, Sweden, (est.). Str
Slide 6: Deal rationale
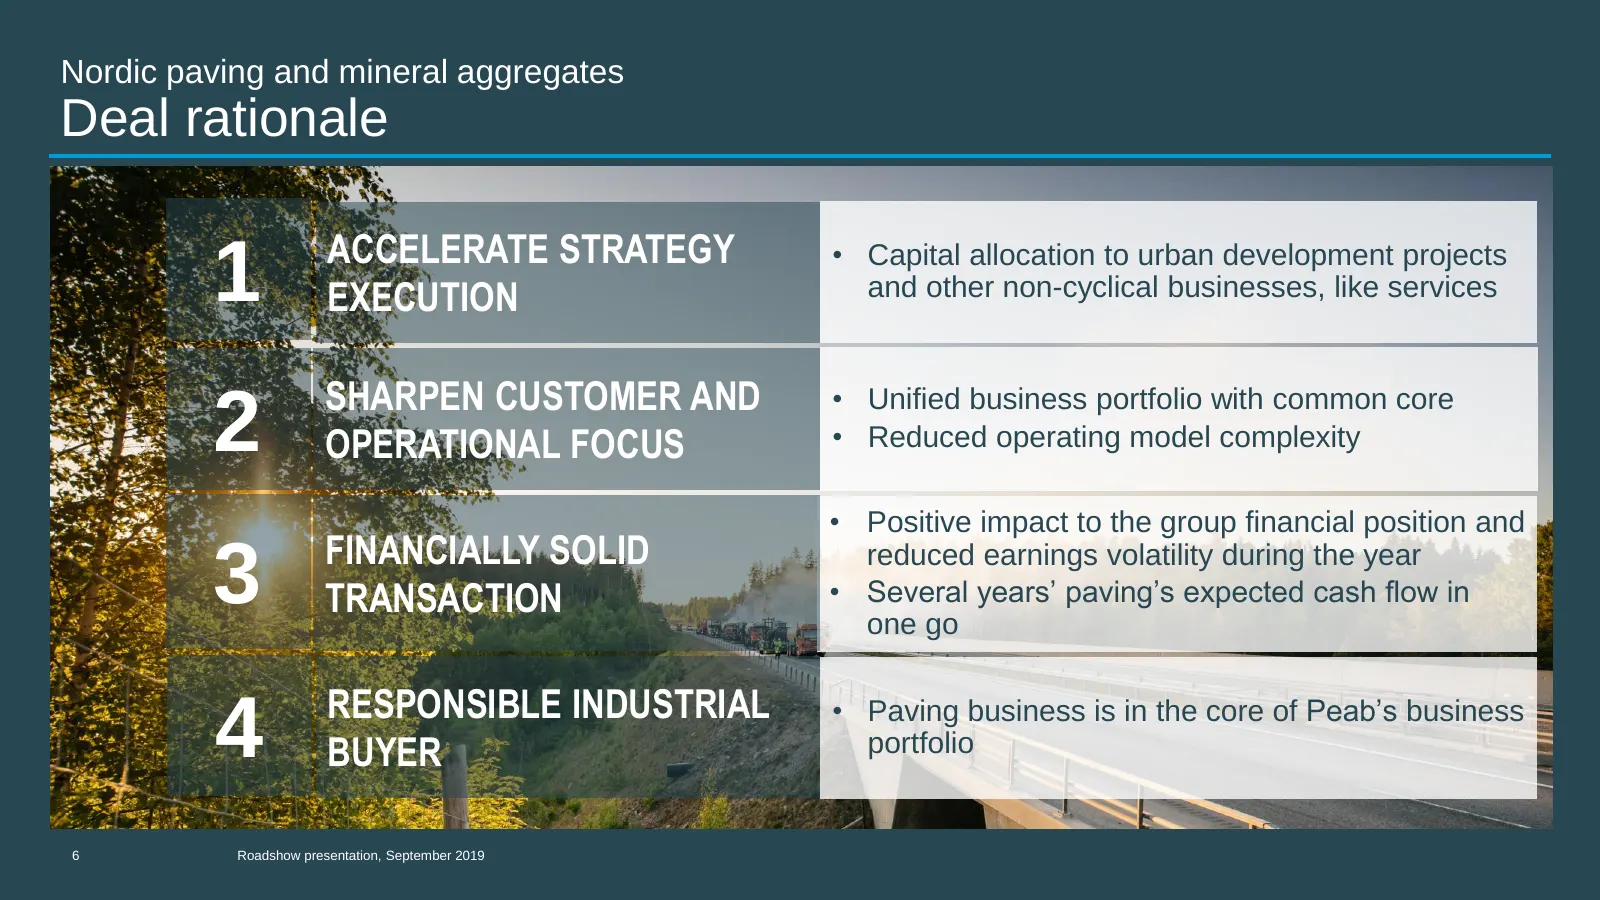
Nordic paving and mineral aggregates Deal rationale ACCELERATE STRATEGY • Capital allocation to urban development projects 1 EXECUTION and other non-cyclical businesses, like services SHARPEN CUSTOMER AND • Unified business portfolio with common core 2 OPERATIONAL FOCUS • Reduced operating model com
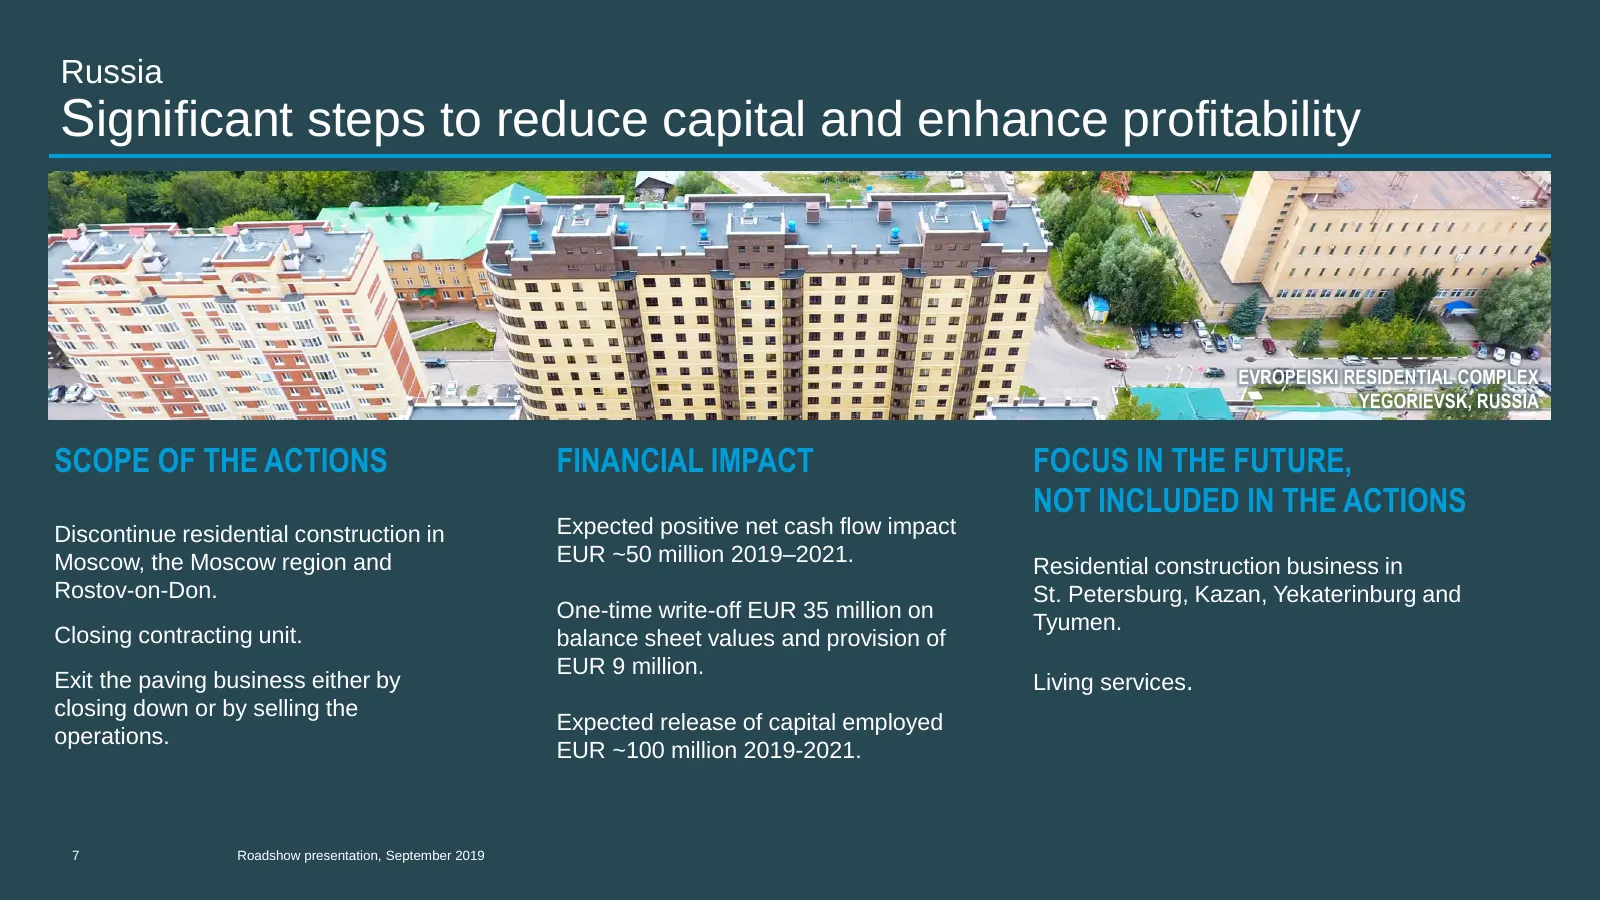
Slide 7: Significant steps to reduce capital and enhance profitability
Russia Significant steps to reduce capital and enhance profitability EVROPEISKI RESIDENTIAL COMPLEX YEGORIEVSK, RUSSIA SCOPE OF THE ACTIONS FINANCIAL IMPACT FOCUS IN THE FUTURE, NOT INCLUDED IN THE ACTIONS Discontinue residential construction in Expected positive net cash flow impact Moscow, the Mos
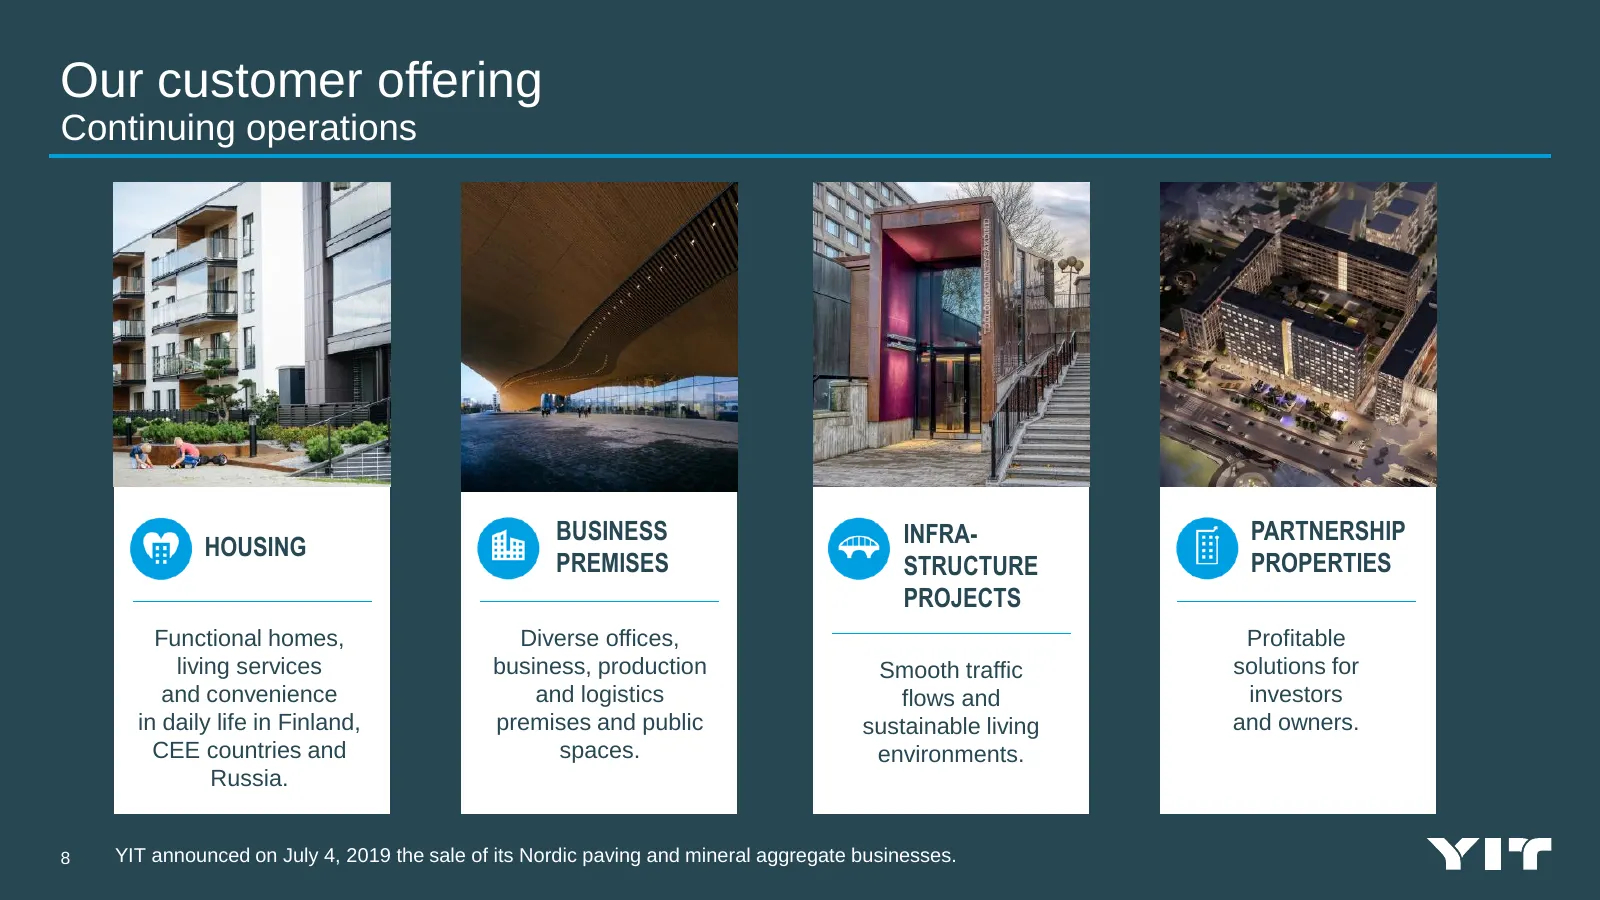
Slide 8: Our customer offering
Our customer offering Continuing operations Ilona Puska BUSINESS INFRA- PARTNERSHIP HOUSING PREMISES STRUCTURE PROPERTIES PROJECTS Functional homes, Diverse offices, Profitable living services business, production Smooth traffic solutions for and convenience and logistics flows and investors in dail
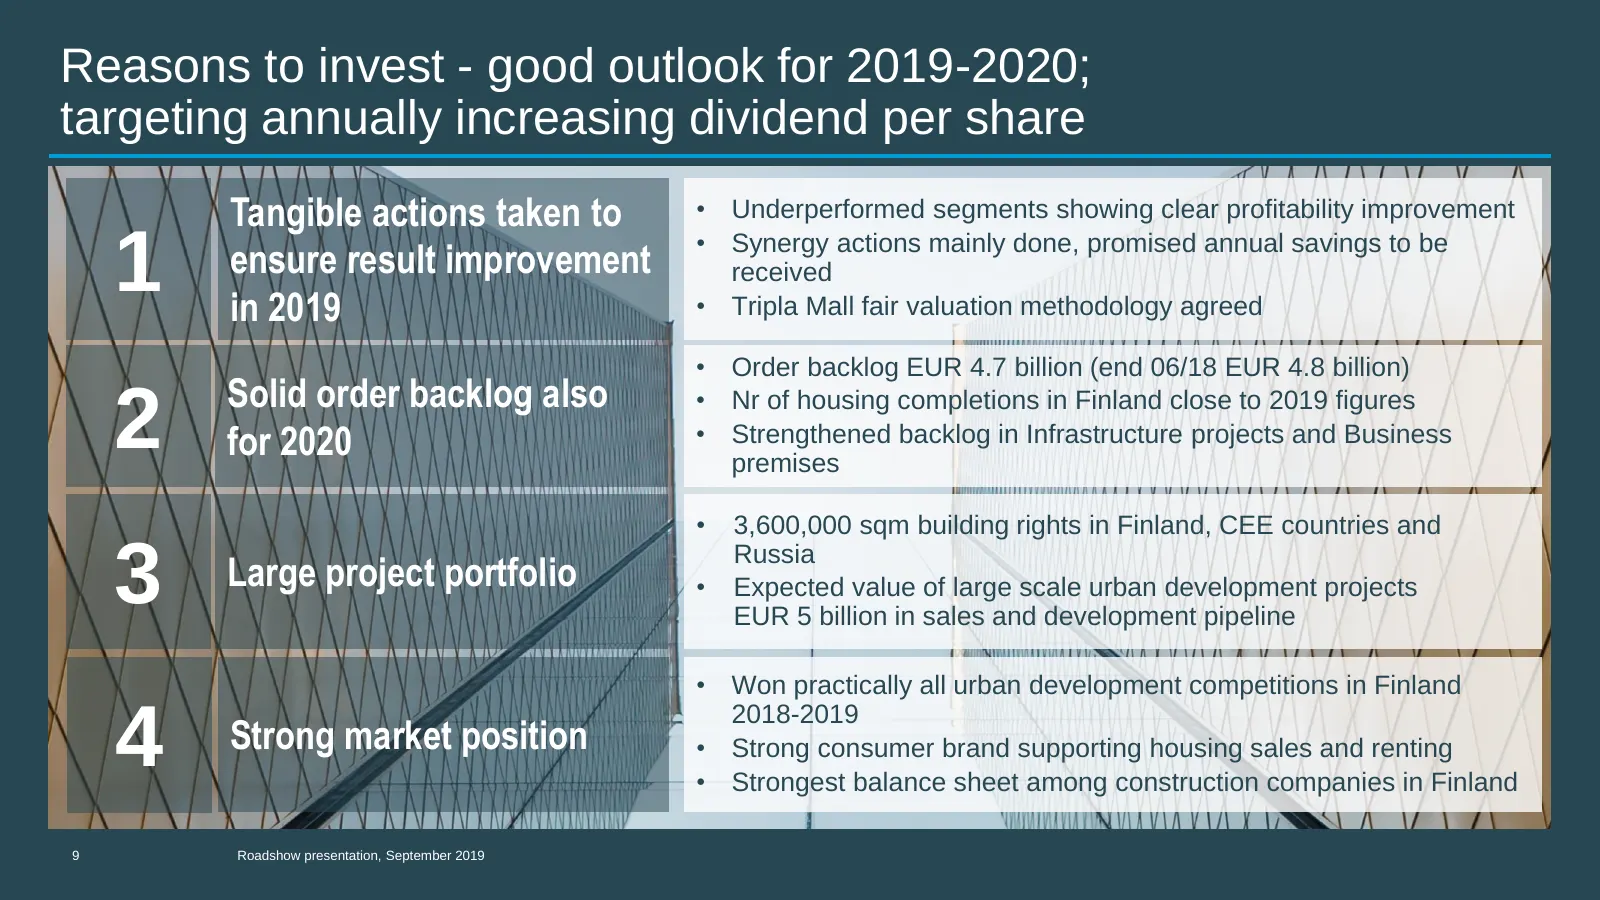
Slide 9: Reasons to invest - good outlook for 2019-2020
Reasons to invest - good outlook for 2019-2020; targeting annually increasing dividend per share Tangible actions taken to • Underperformed segments showing clear profitability improvement • Synergy actions mainly done, promised annual savings to be 1 ensure result improvement in 2019 received • Tri
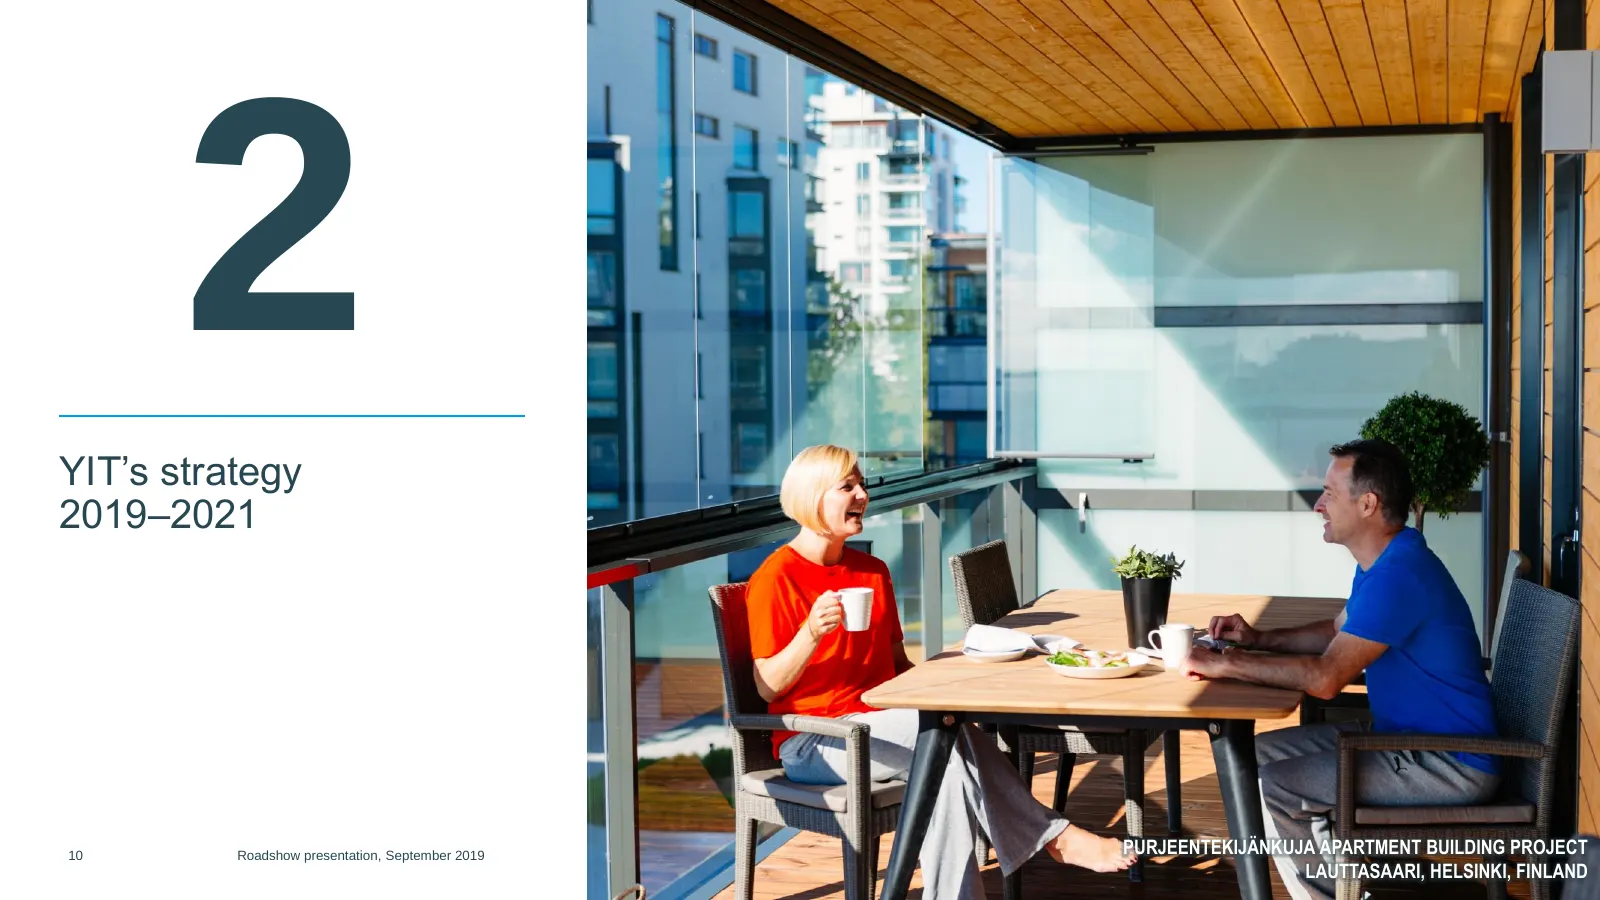
Slide 10: YIT's strategy 2019-2021
2 YIT’s strategy 2019‒2021 10 Roadshow presentation, September 2019 PURJEENTEKIJÄNKUJA APARTMENT BUILDING PROJECT LAUTTASAARI, HELSINKI, FINLAND
Slide 11: Megatrends support growth and productivity
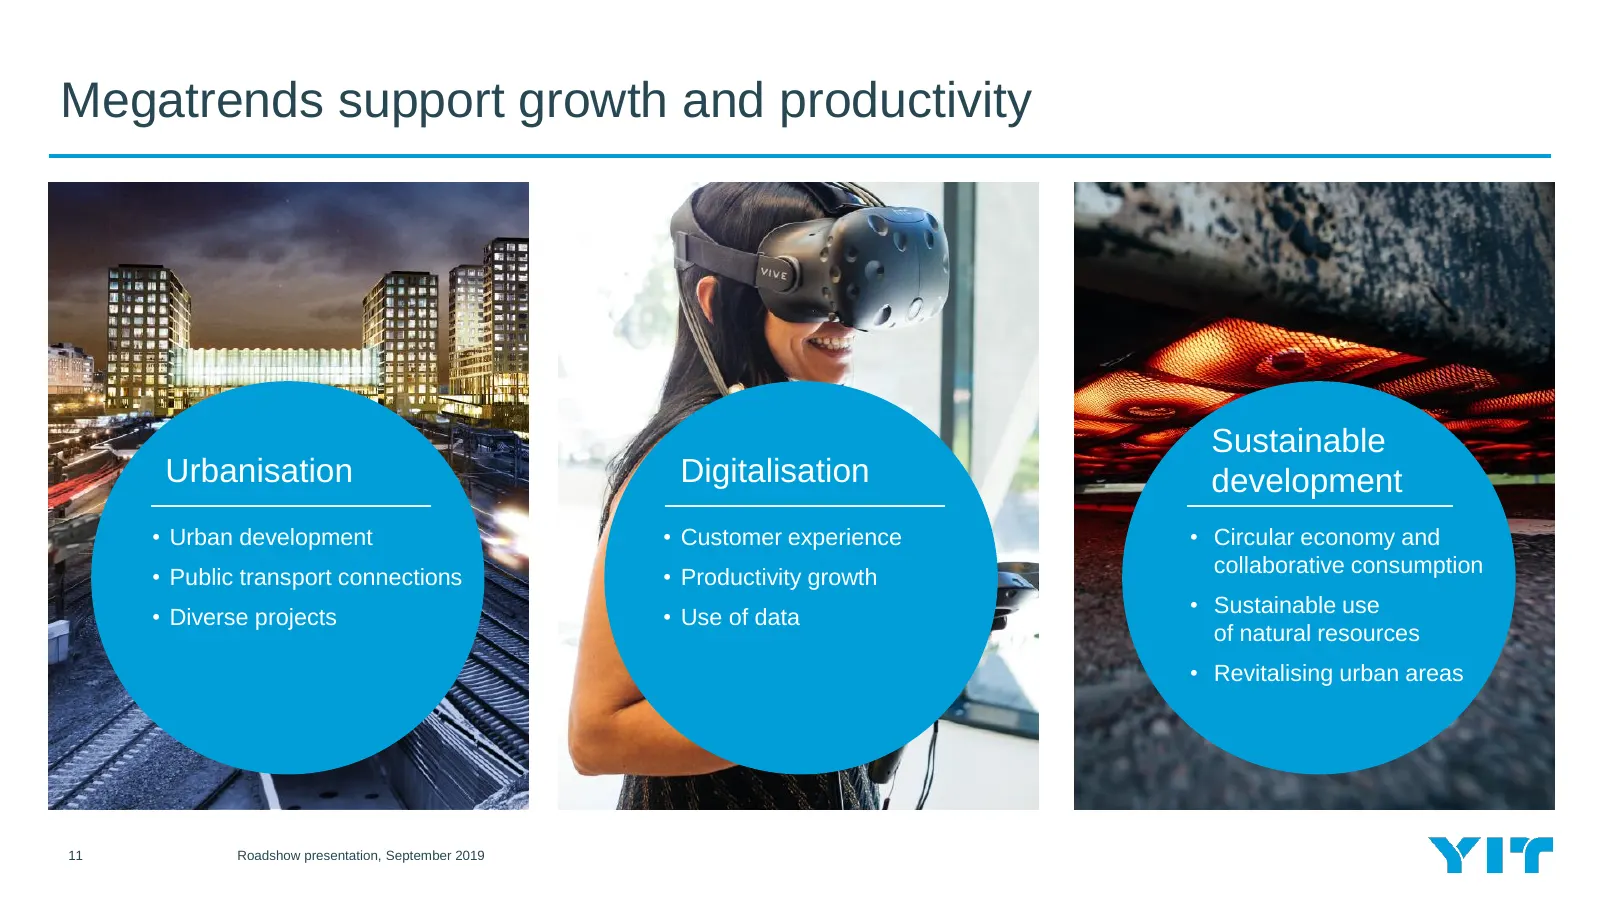
Megatrends support growth and productivity Sustainable Urbanisation Digitalisation development • Urban development • Customer experience • Circular economy and collaborative consumption • Public transport connections • Productivity growth • Diverse projects • Use of data • Sustainable use of natural
Slide 12: YIT Strategy 2019-2021 - Performance through cycles
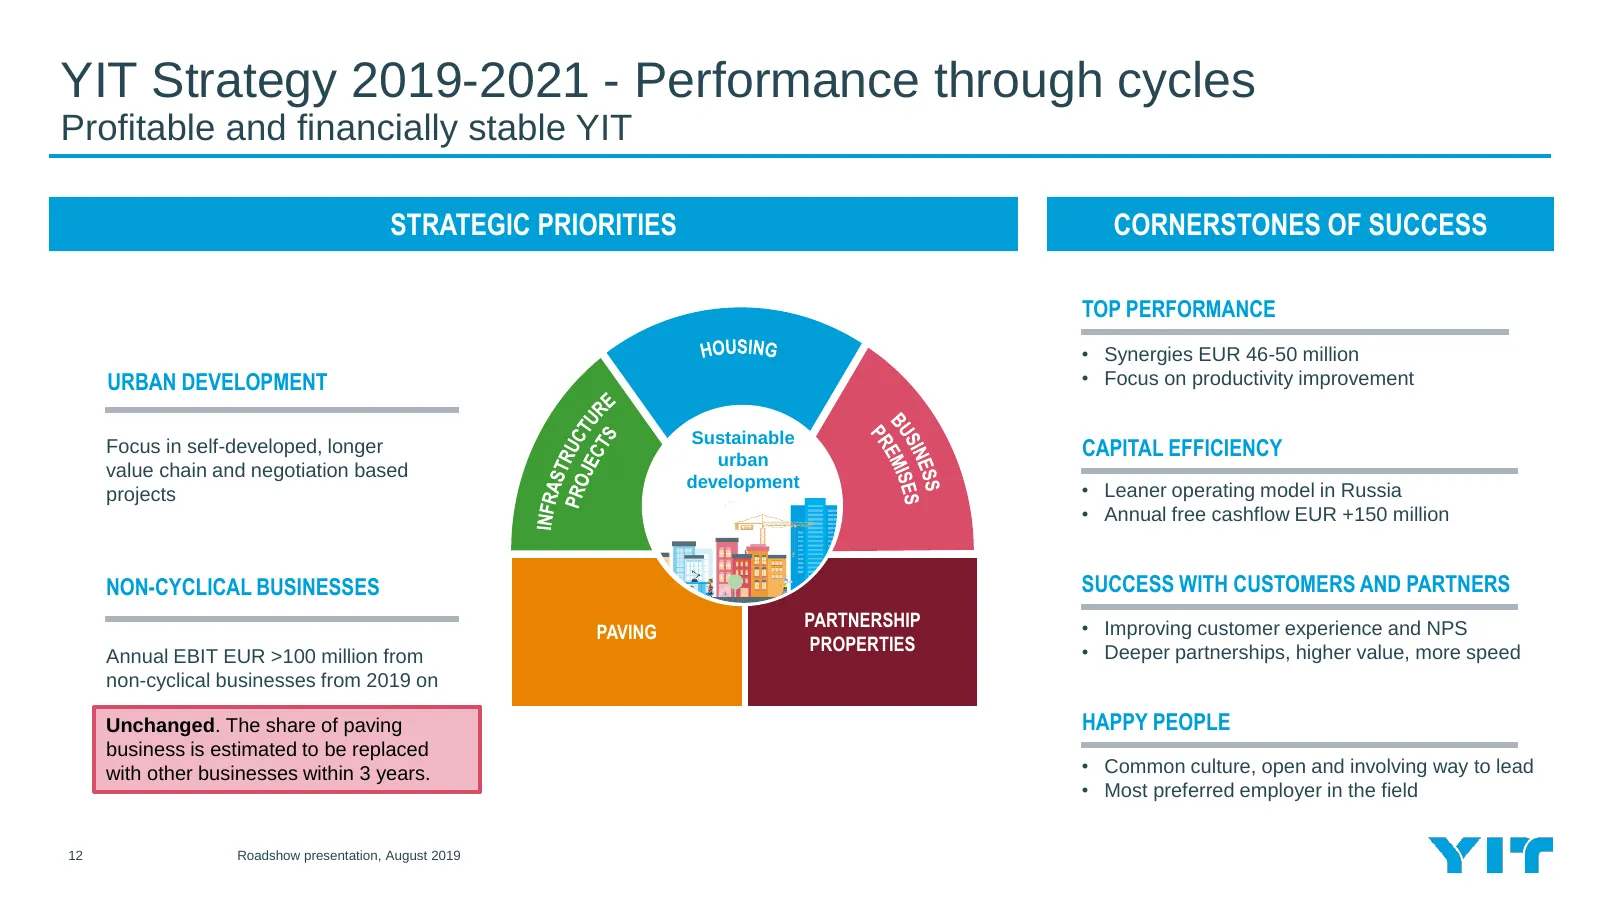
YIT Strategy 2019-2021 - Performance through cycles Profitable and financially stable YIT STRATEGIC PRIORITIESSTRATEGIC PRIORITIES CORNERSTONESOF CORNERSTONES OF SUCCESS SUCCESS TOP PERFORMANCE • Synergies EUR 46-50 million URBAN DEVELOPMENT • Focus on productivity improvement Sustainable Focus in s
Slide 13: Strategic financial targets 2019–2021
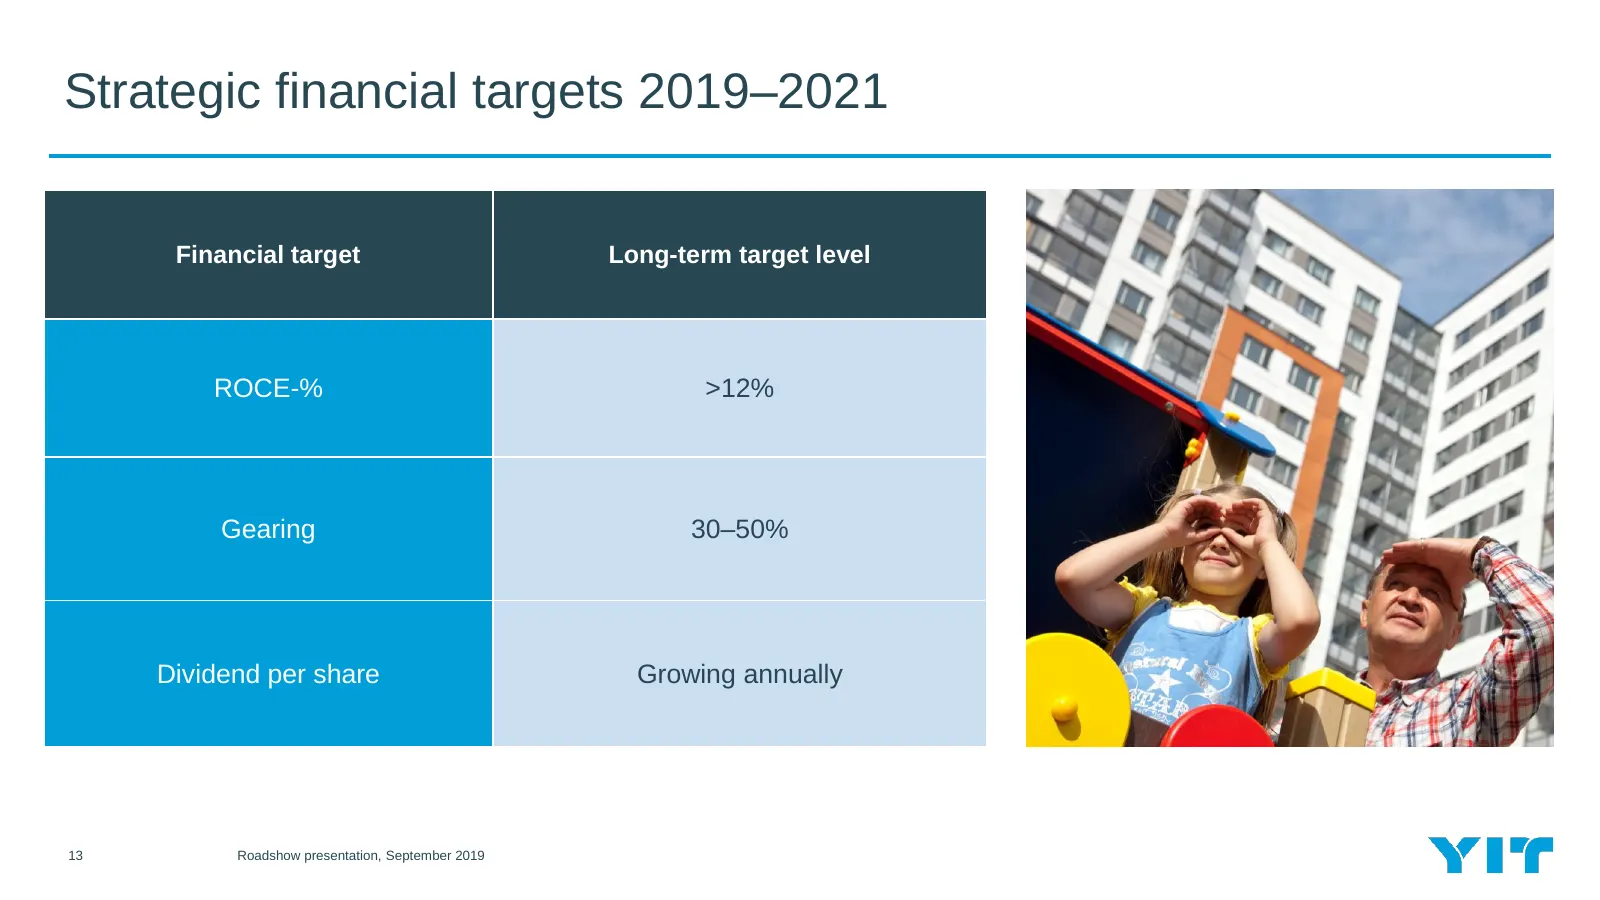
Strategic financial targets 2019–2021 Financial target Long-term target level ROCE-% >12% Gearing 30–50% Dividend per share Growing annually 13 Roadshow presentation, September 2019
Slide 14: Group development in Q2/2019
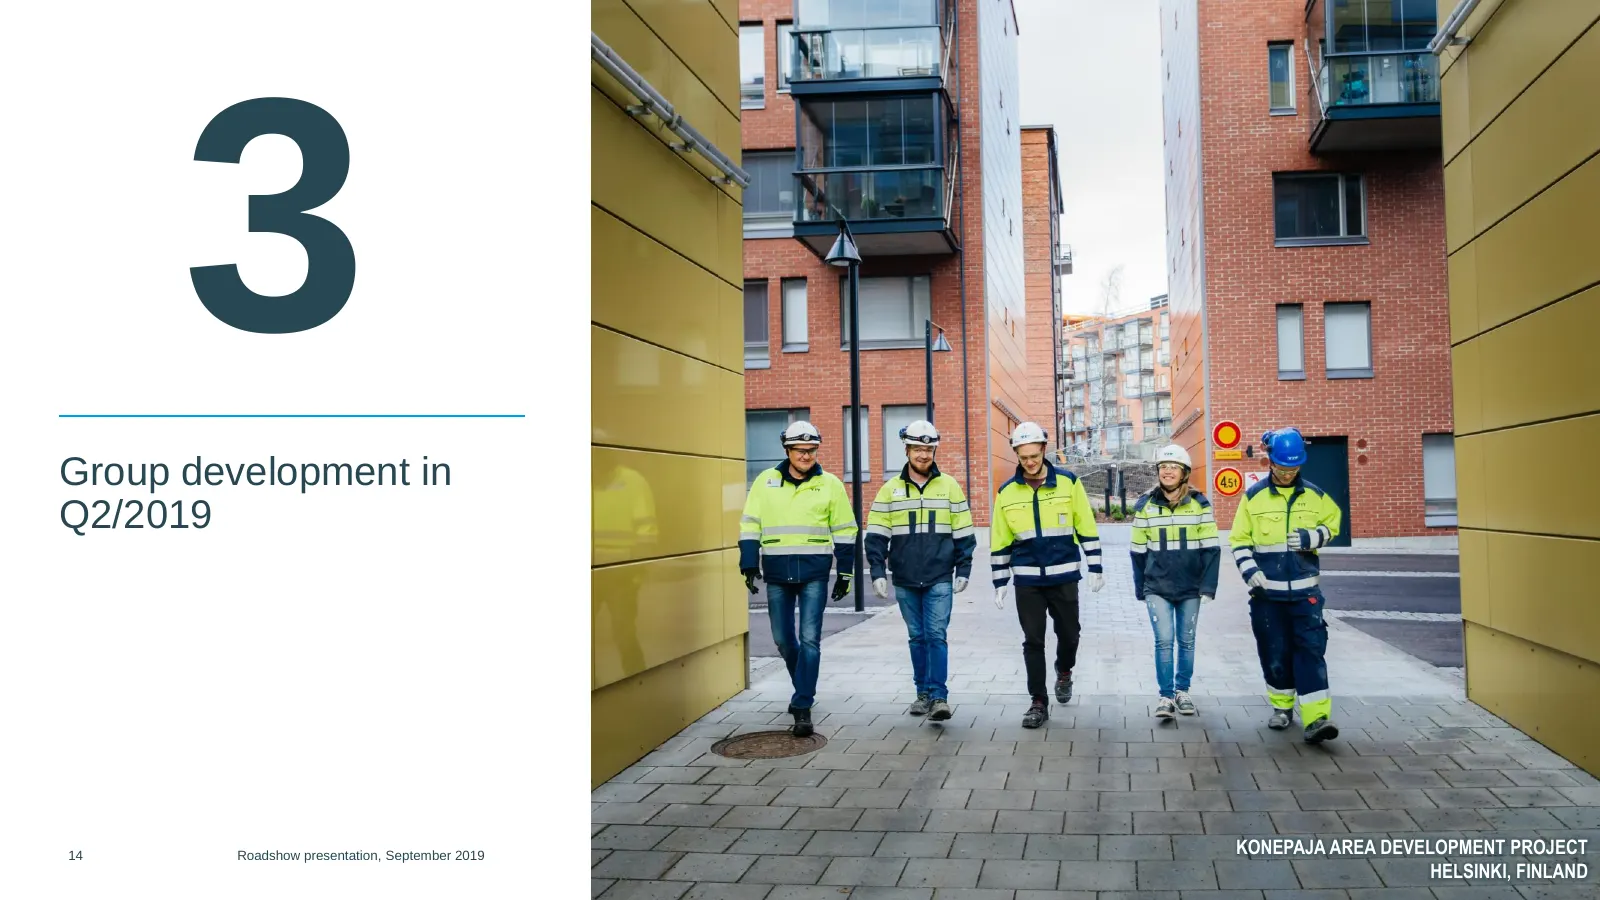
3 Group development in Q2/2019 14 Roadshow presentation, September 2019 KONEPAJA AREA DEVELOPMENT PROJECT HELSINKI, FINLAND
Slide 15: Recent structural changes and changes in reporting
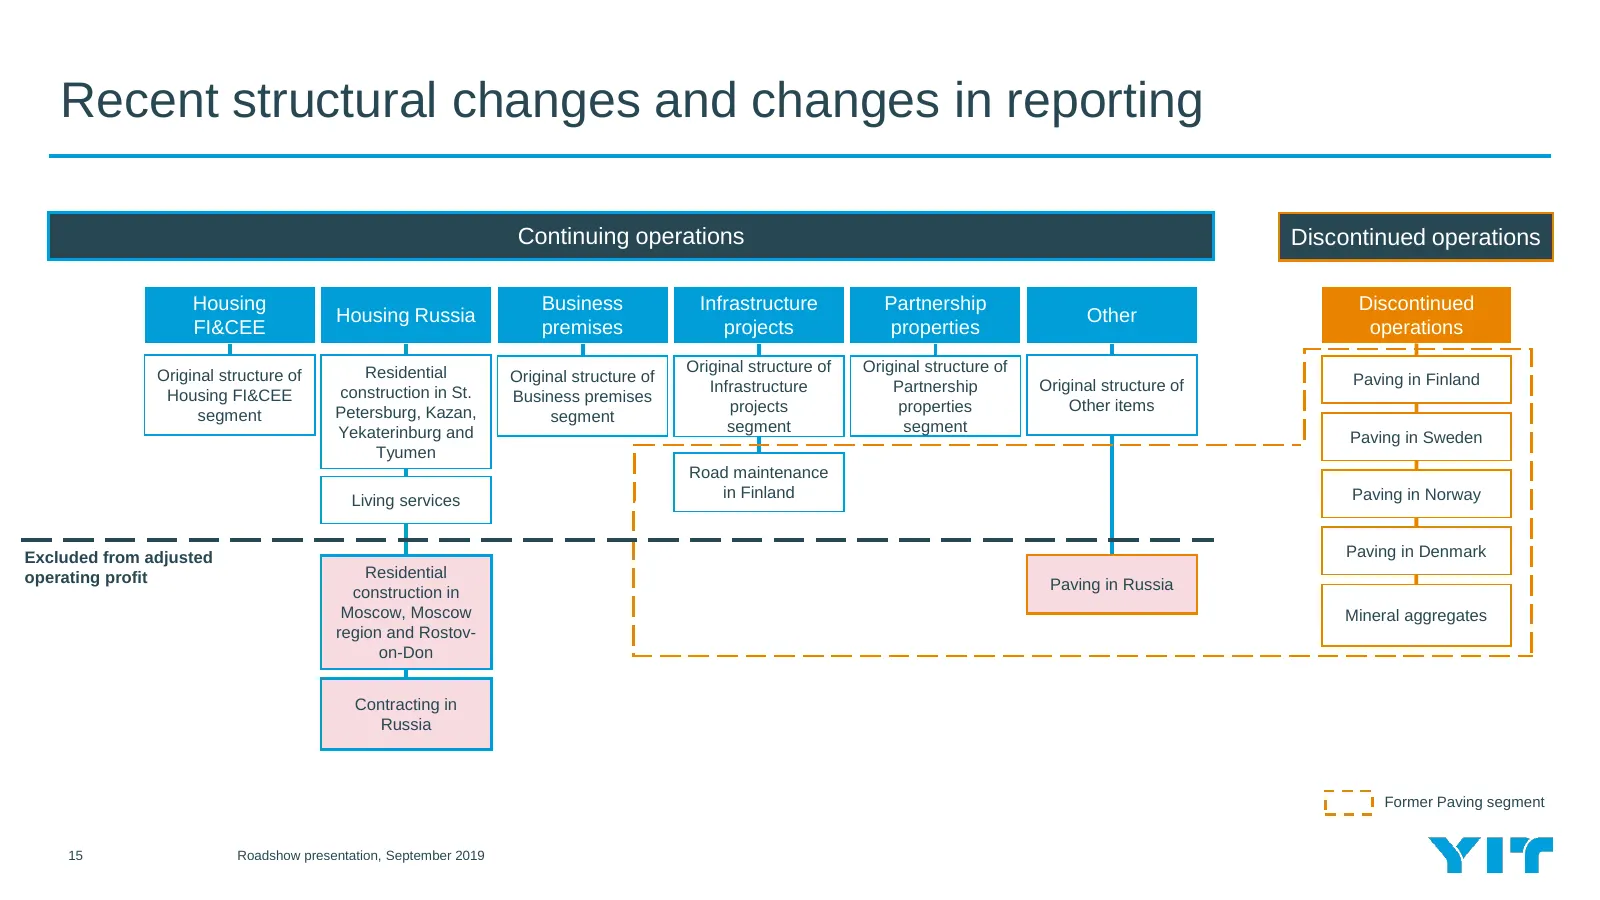
Recent structural changes and changes in reporting Continuing operations Discontinued operations Housing Business Infrastructure Partnership Discontinued Housing Russia Other FI&CEE premises projects properties operations Residential Original structure of Original structure of Original structure of
Slide 16: Q2 in brief
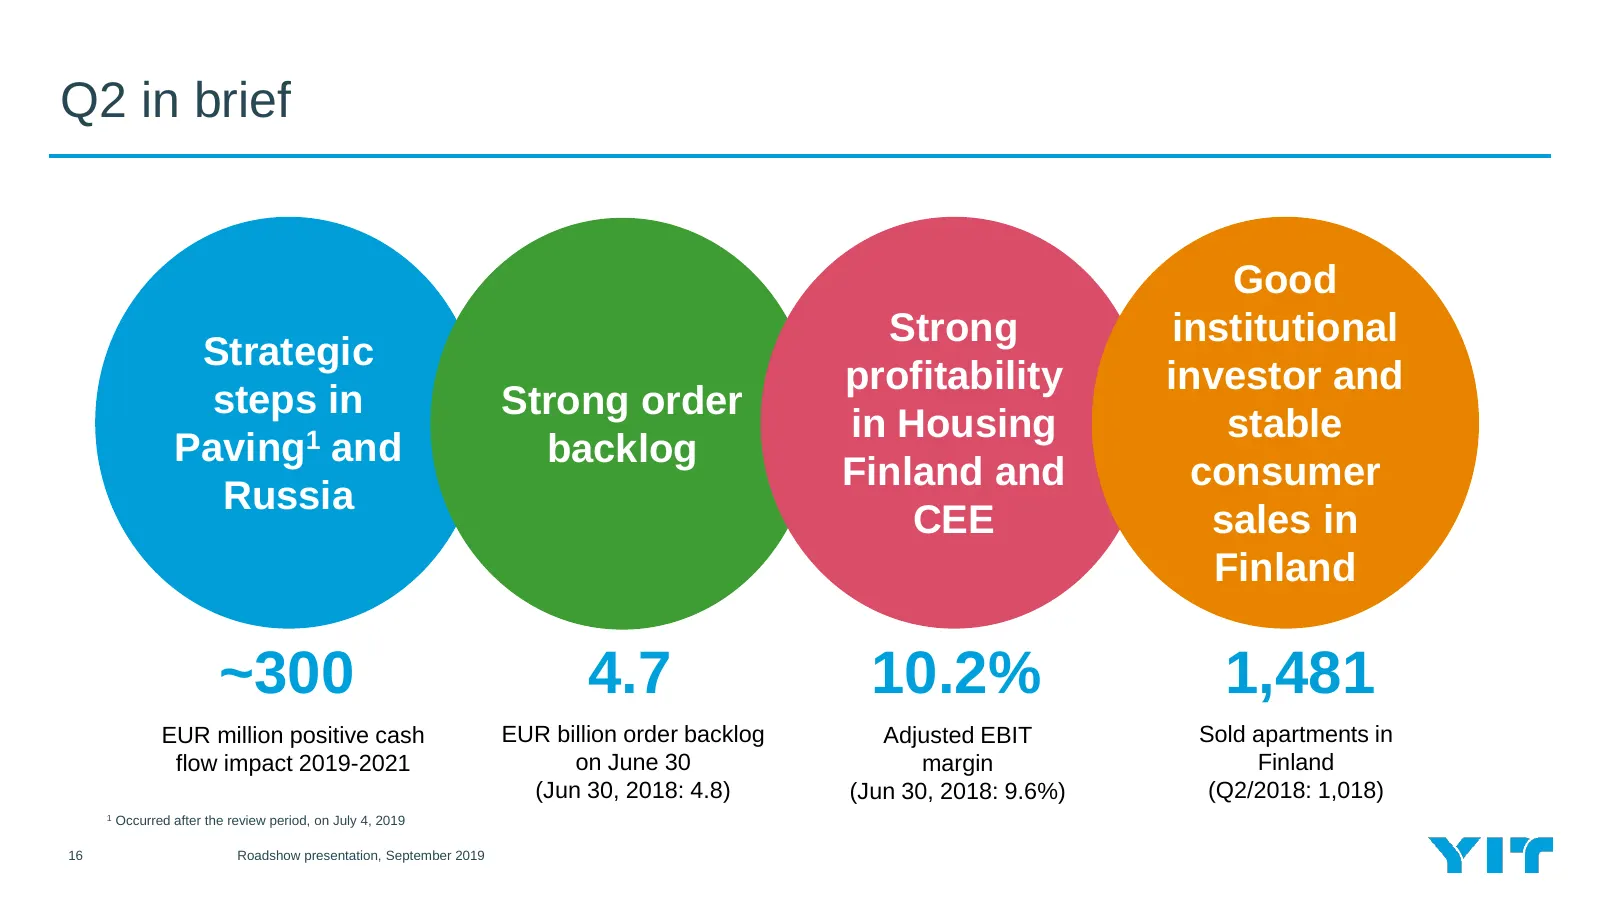
Q2 in brief Good Strong institutional Strategic profitability investor and steps in Strong order in Housing stable Paving1 and backlog Finland and consumer Russia CEE sales in Finland ~300 4.7 10.2% 1,481 EUR million positive cash EUR billion order backlog Adjusted EBIT Sold apartments in flow impac
Slide 17: Improved operating profit and strong order backlog
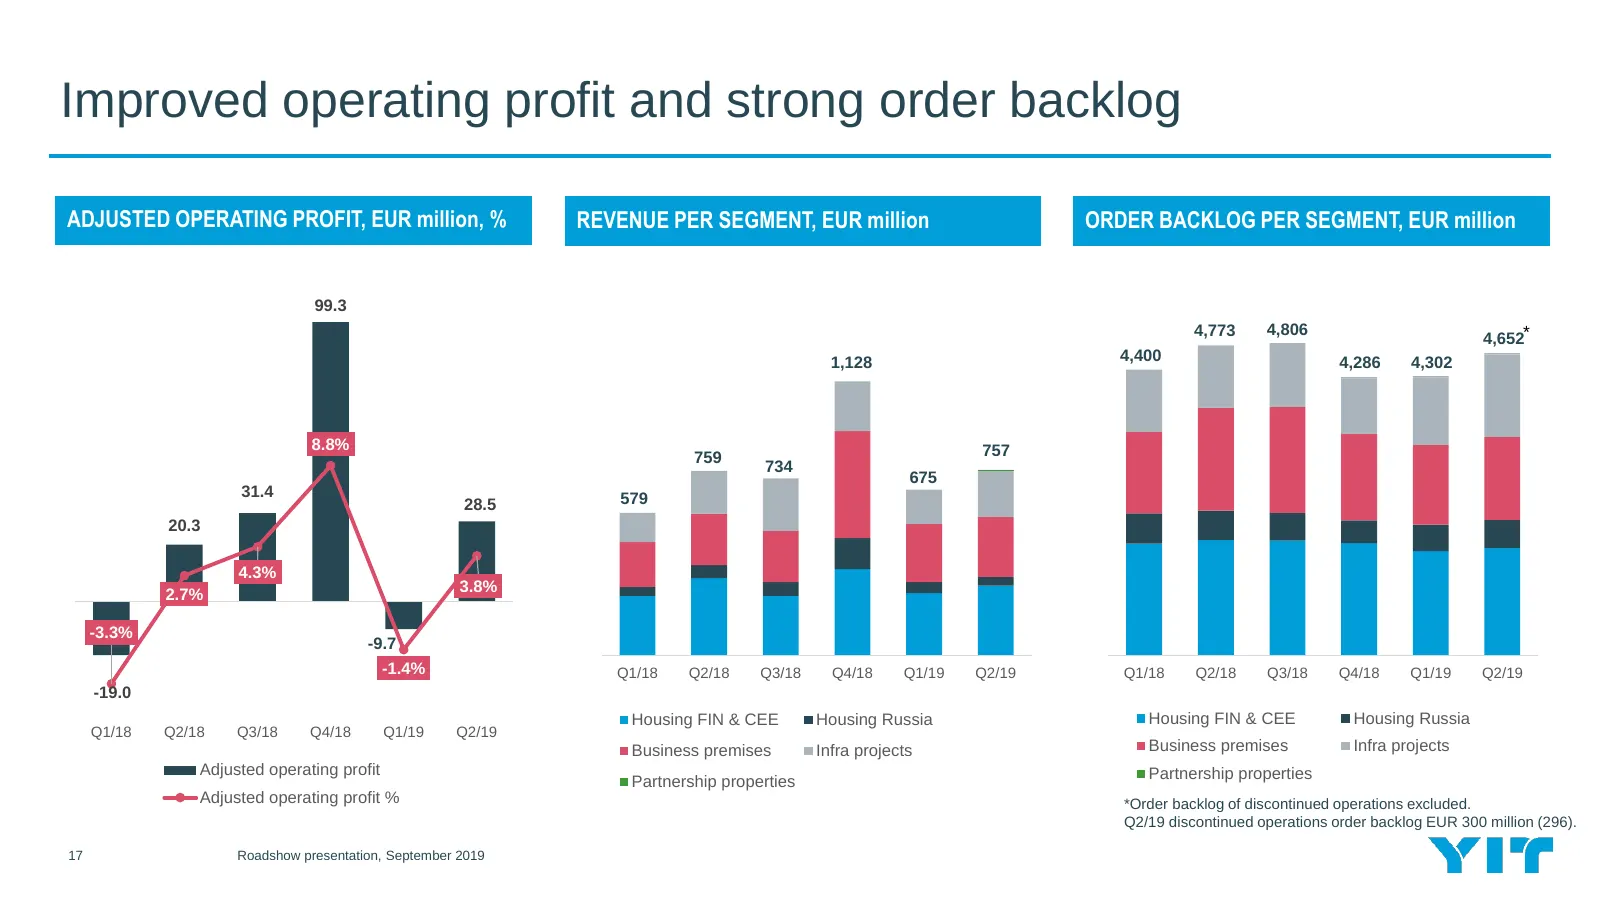
Improved operating profit and strong order backlog ADJUSTED OPERATING PROFIT, EUR million, % REVENUE PER SEGMENT, EUR million ORDER BACKLOG PER SEGMENT, EUR million 99.3 4,773 4,806 4,652* 1,128 4,400 4,286 4,302 8.8% 757 759 734 675 31.4 579 28.5 20.3 4.3% 2.7% 3.8% -3.3% -9.7 -1.4% Q1/18 Q2/18 Q3/
Slide 18: Performance by segment in Q2
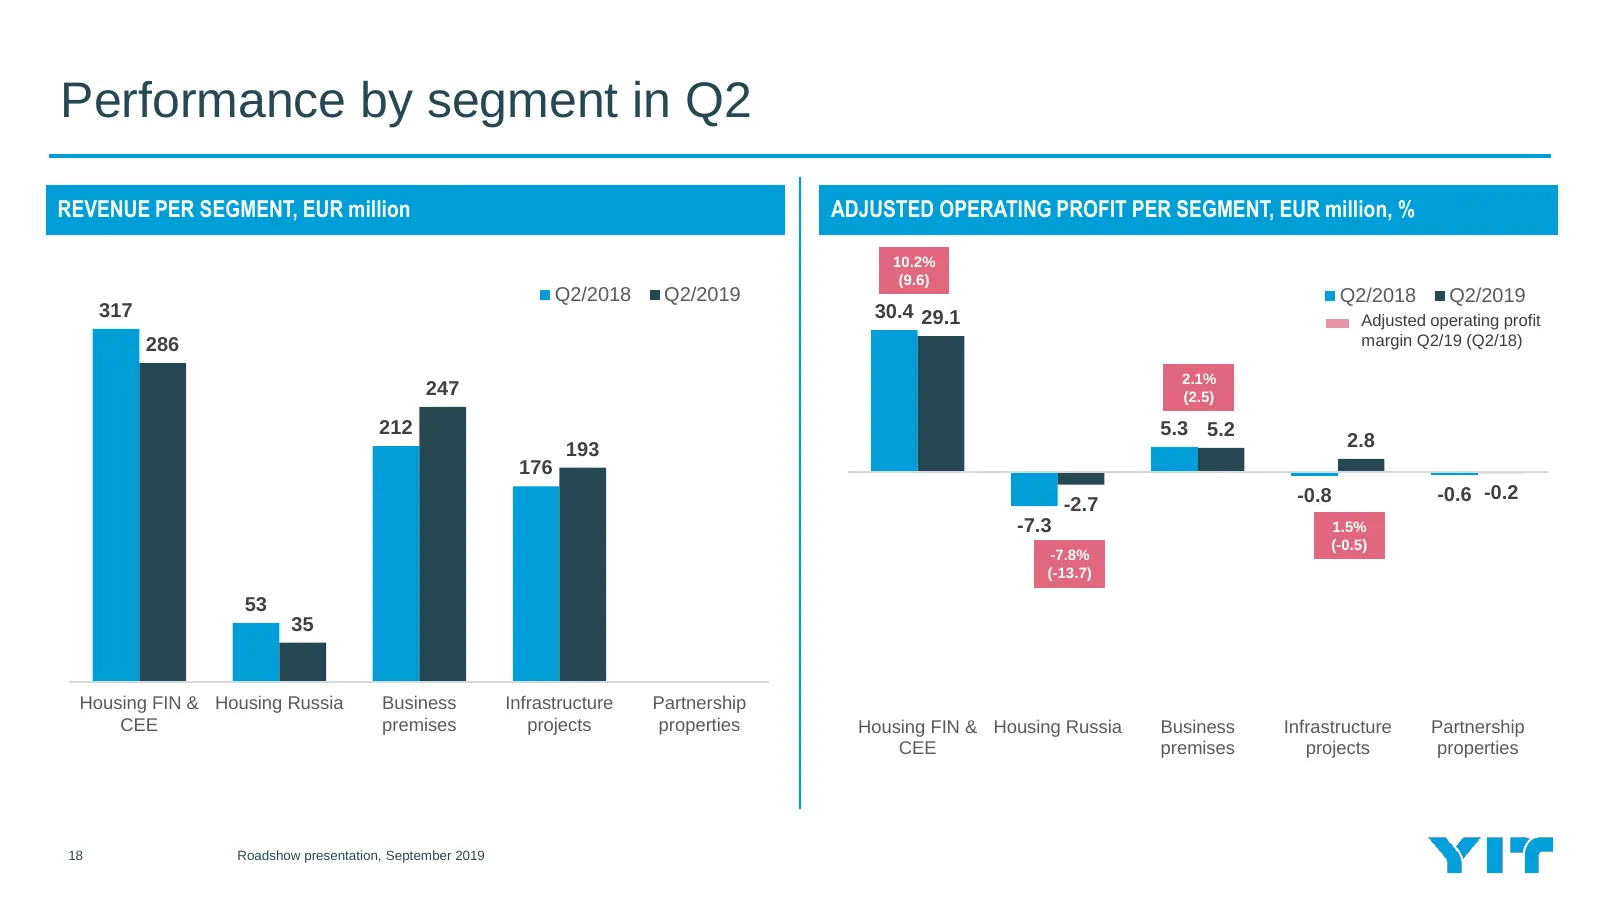
Performance by segment in Q2 REVENUE PER SEGMENT, EUR million ADJUSTED OPERATING PROFIT PER SEGMENT, EUR million, % 50.0 10.2% 40.0 (9.6) Q2/2018 Q2/2019 Q2/2018 Q2/2019 330 317 30.4 29.1 Adjusted operating profit 30.0 286 margin Q2/19 (Q2/18) 280 20.0 2.1% 247 (2.5) 230 212 10.0 5.3 5.2 193 2.8 180
Slide 19: Synergies and integration costs
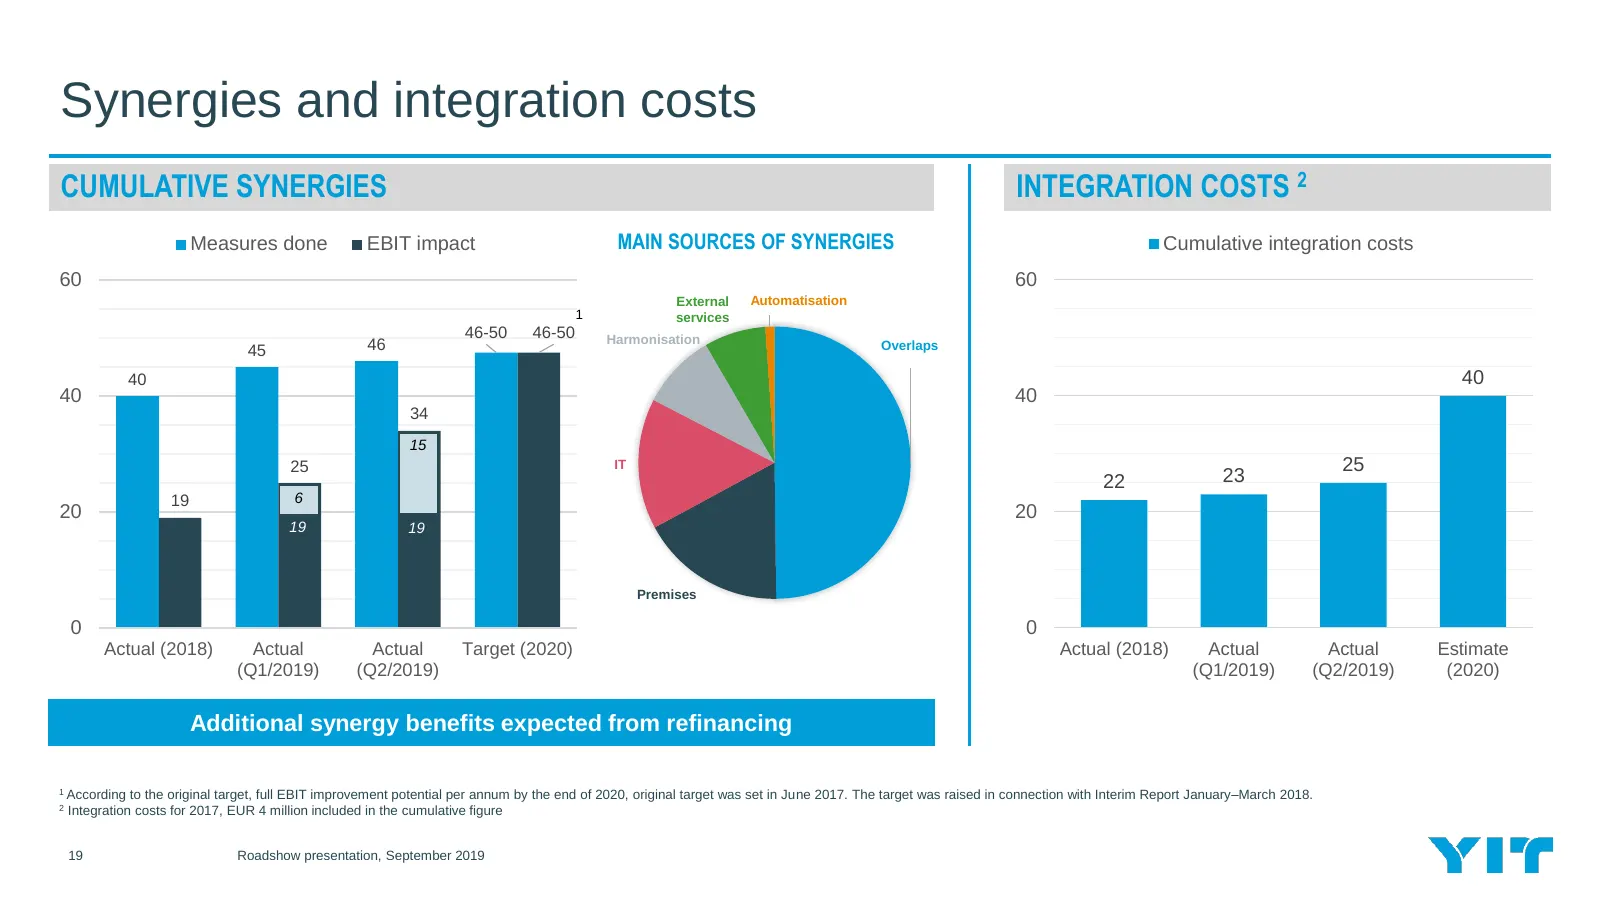
Synergies and integration costs CUMULATIVE SYNERGIES INTEGRATION COSTS 2 Measures done EBIT impact MAIN SOURCES OF SYNERGIES Cumulative integration costs 60 60 External Automatisation 1 services 46-50 46-50 Harmonisation 45 46 Overlaps 40 40 40 40 34 15 25 IT 25 22 23 19 6 20 20 19 19 19 Premises 0
Slide 20: Market outlook for the next 12 months
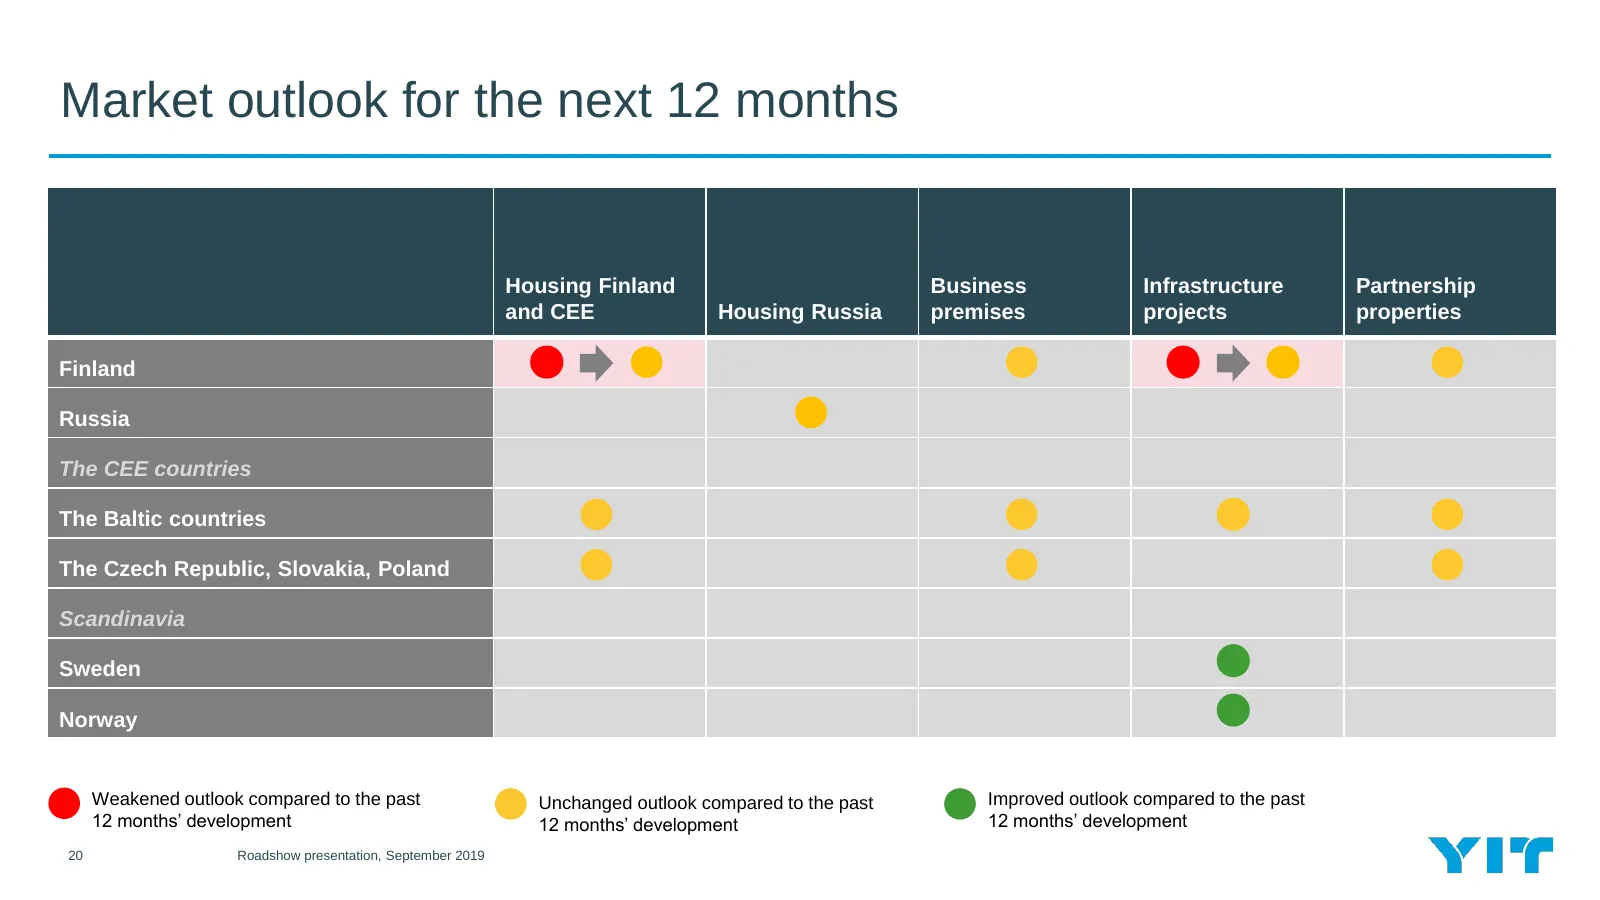
Market outlook for the next 12 months Housing Finland Business Infrastructure Partnership and CEE Housing Russia premises projects properties Finland Russia The CEE countries The Baltic countries The Czech Republic, Slovakia, Poland Scandinavia Sweden Norway Weakened outlook compared to the past Unc
Slide 21: Segment reviews
4 Segment reviews 21 Roadshow presentation, September 2019 HENRIKSDAL WASTE WATER TREATMENT PLANT STOCKHOLM, SWEDEN
Slide 22: Housing Finland and CEE: Healthy profitability
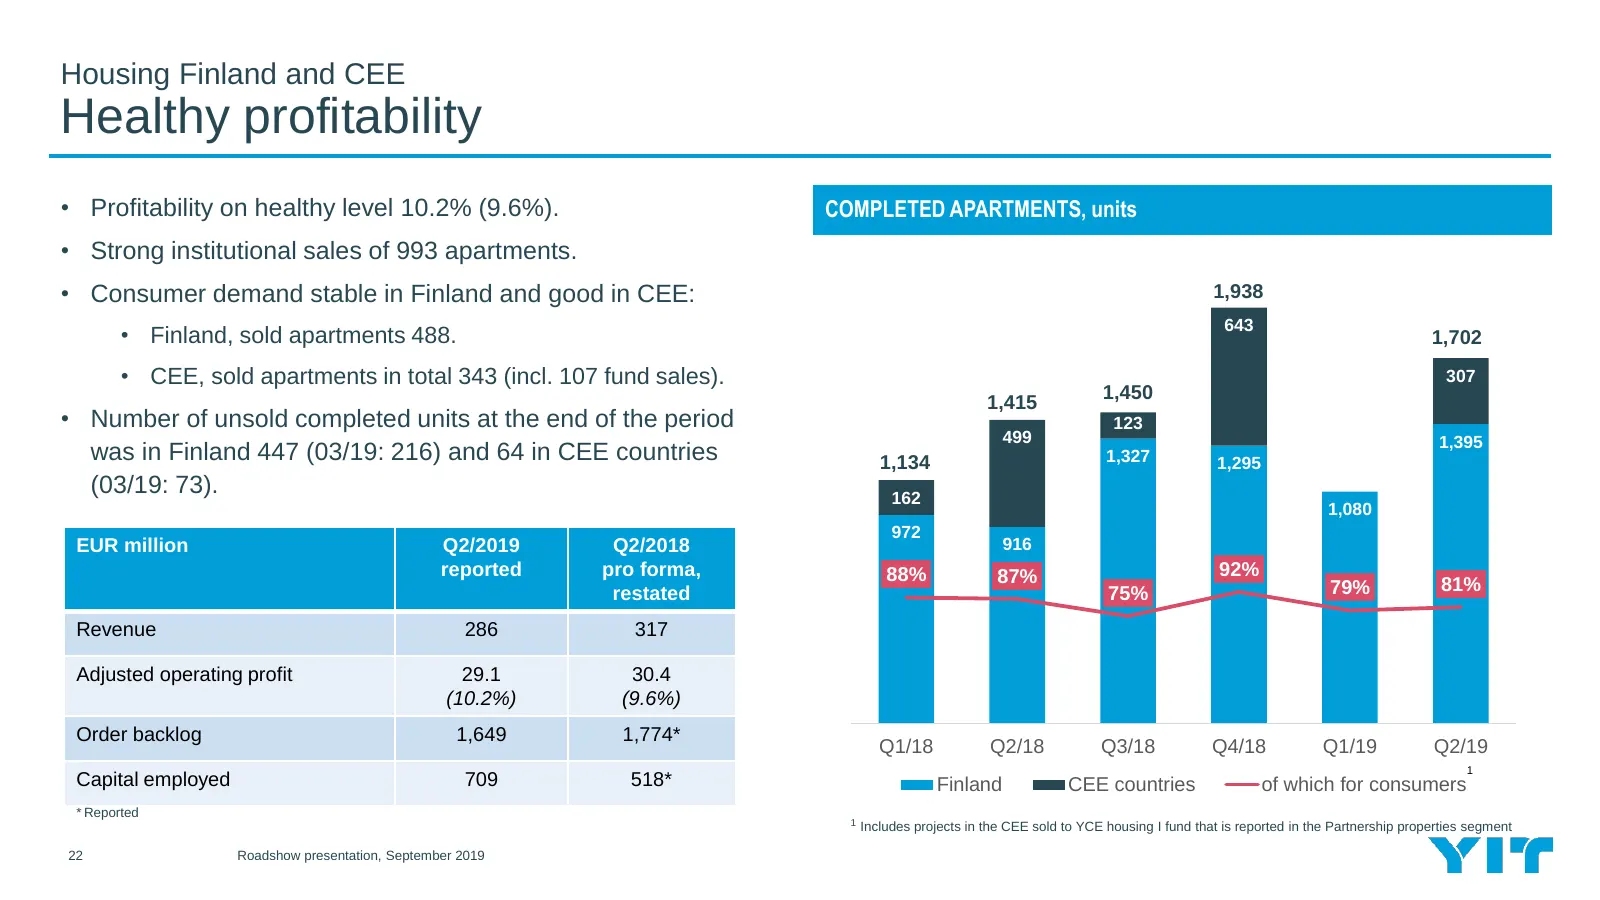
Housing Finland and CEE Healthy profitability • Profitability on healthy level 10.2% (9.6%). COMPLETED APARTMENTS, units • Strong institutional sales of 993 apartments. • Consumer demand stable in Finland and good in CEE: 2,000 1,938 300% 643 • Finland, sold apartments 488. 1,800 1,702 250% • CEE, s
Slide 23: Housing Russia: Significant steps to reduce capital
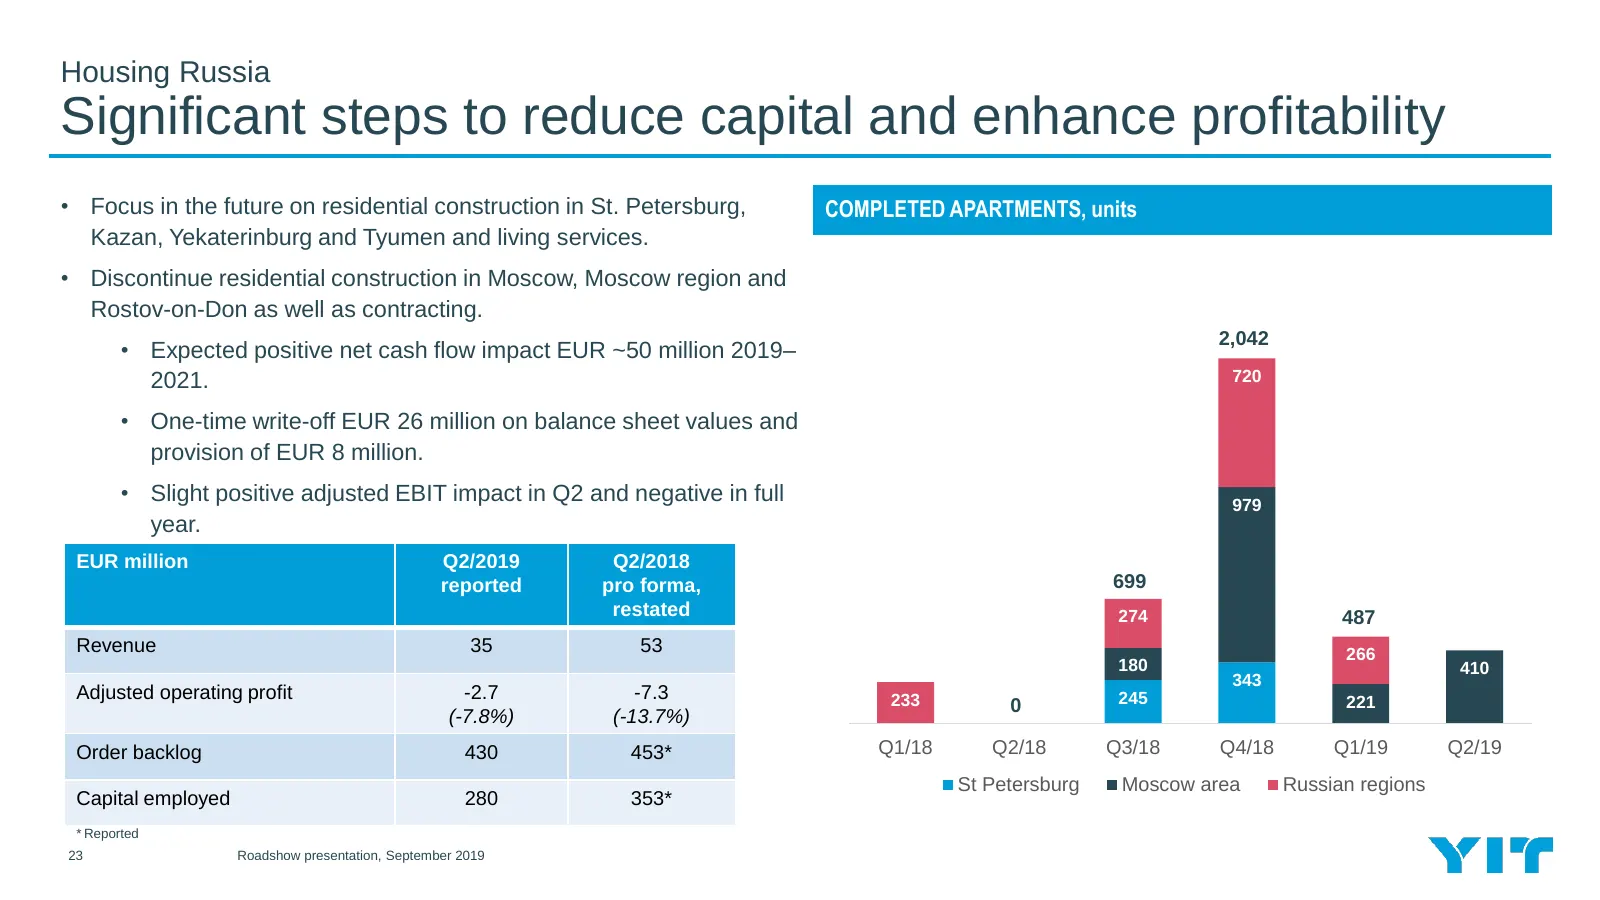
Housing Russia Significant steps to reduce capital and enhance profitability • Focus in the future on residential construction in St. Petersburg, COMPLETED APARTMENTS, units Kazan, Yekaterinburg and Tyumen and living services. • Discontinue residential construction in Moscow, Moscow region and 2400
Slide 24: Business premises: Major projects added to order backlog
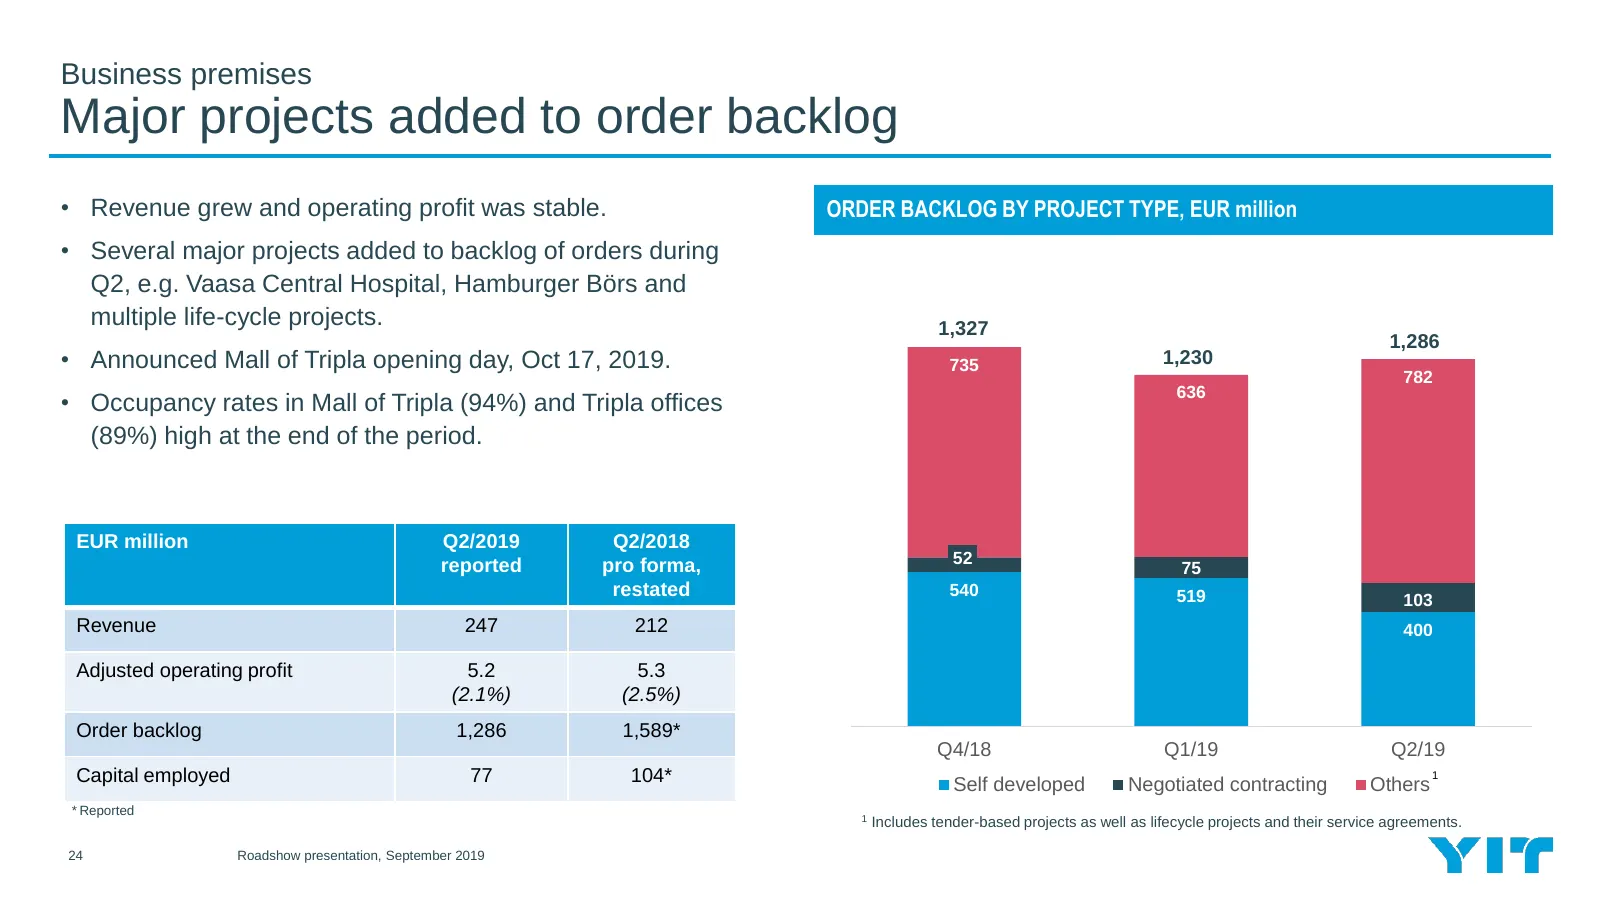
Business premises Major projects added to order backlog • Revenue grew and operating profit was stable. ORDER BACKLOG BY PROJECT TYPE, EUR million • Several major projects added to backlog of orders during Q2, e.g. Vaasa Central Hospital, Hamburger Börs and multiple life-cycle projects. 1,400 1,327
Slide 25: Infrastructure projects: Positive development in order backlog
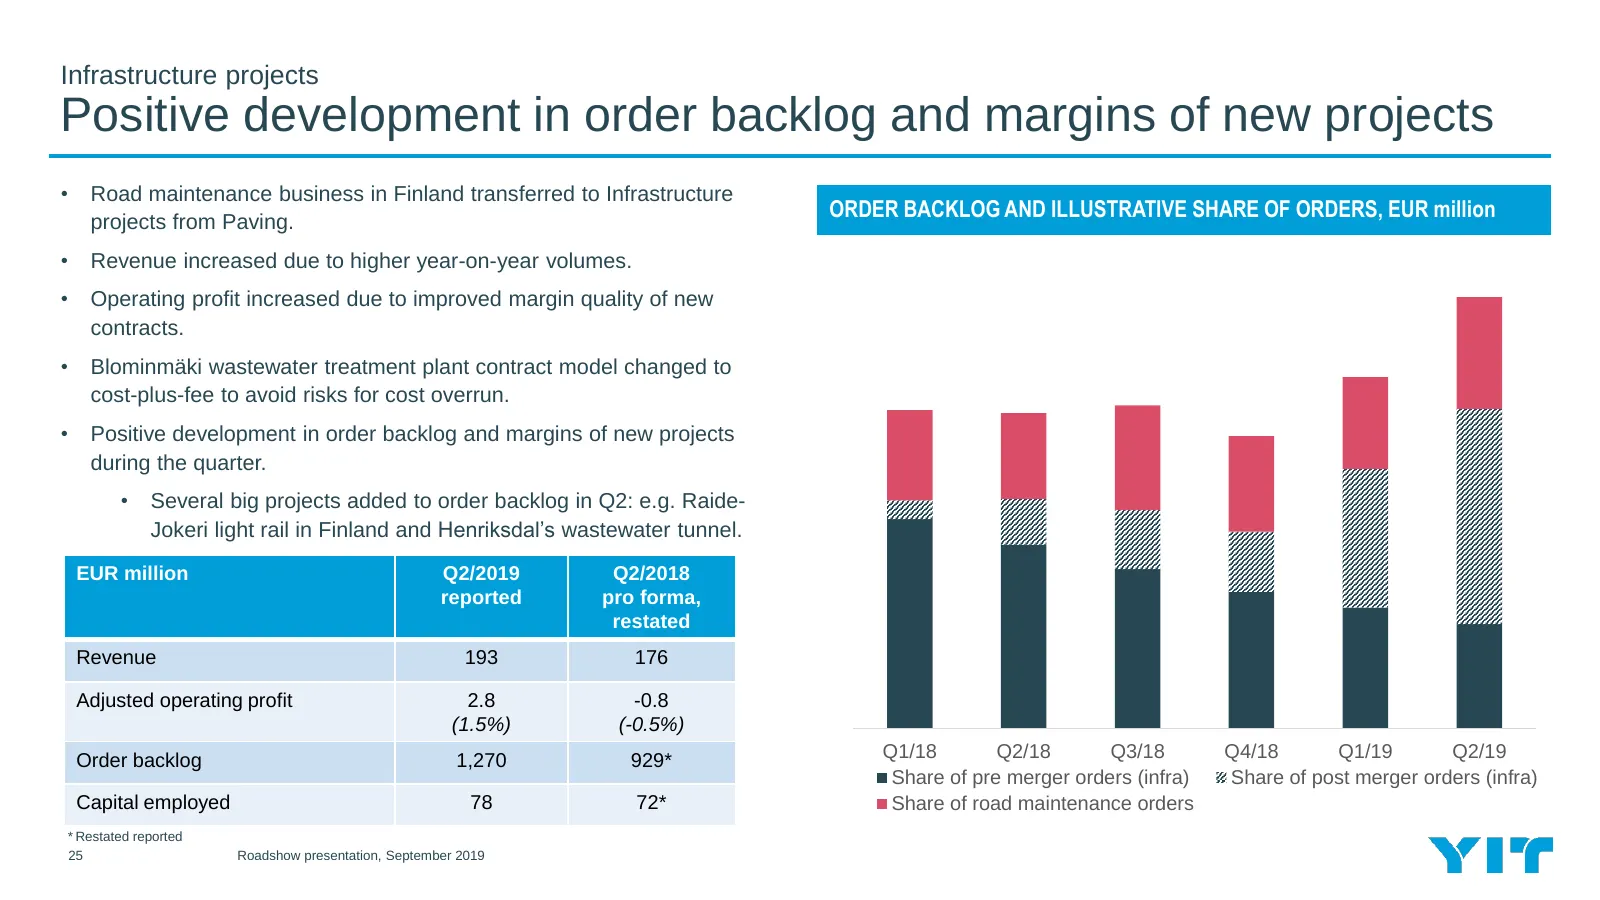
Infrastructure projects Positive development in order backlog and margins of new projects • Road maintenance business in Finland transferred to Infrastructure ORDER BACKLOG AND ILLUSTRATIVE SHARE OF ORDERS, EUR million projects from Paving. • 1400 Revenue increased due to higher year-on-year volumes
Slide 26: Partnership properties: Investment portfolio evolving
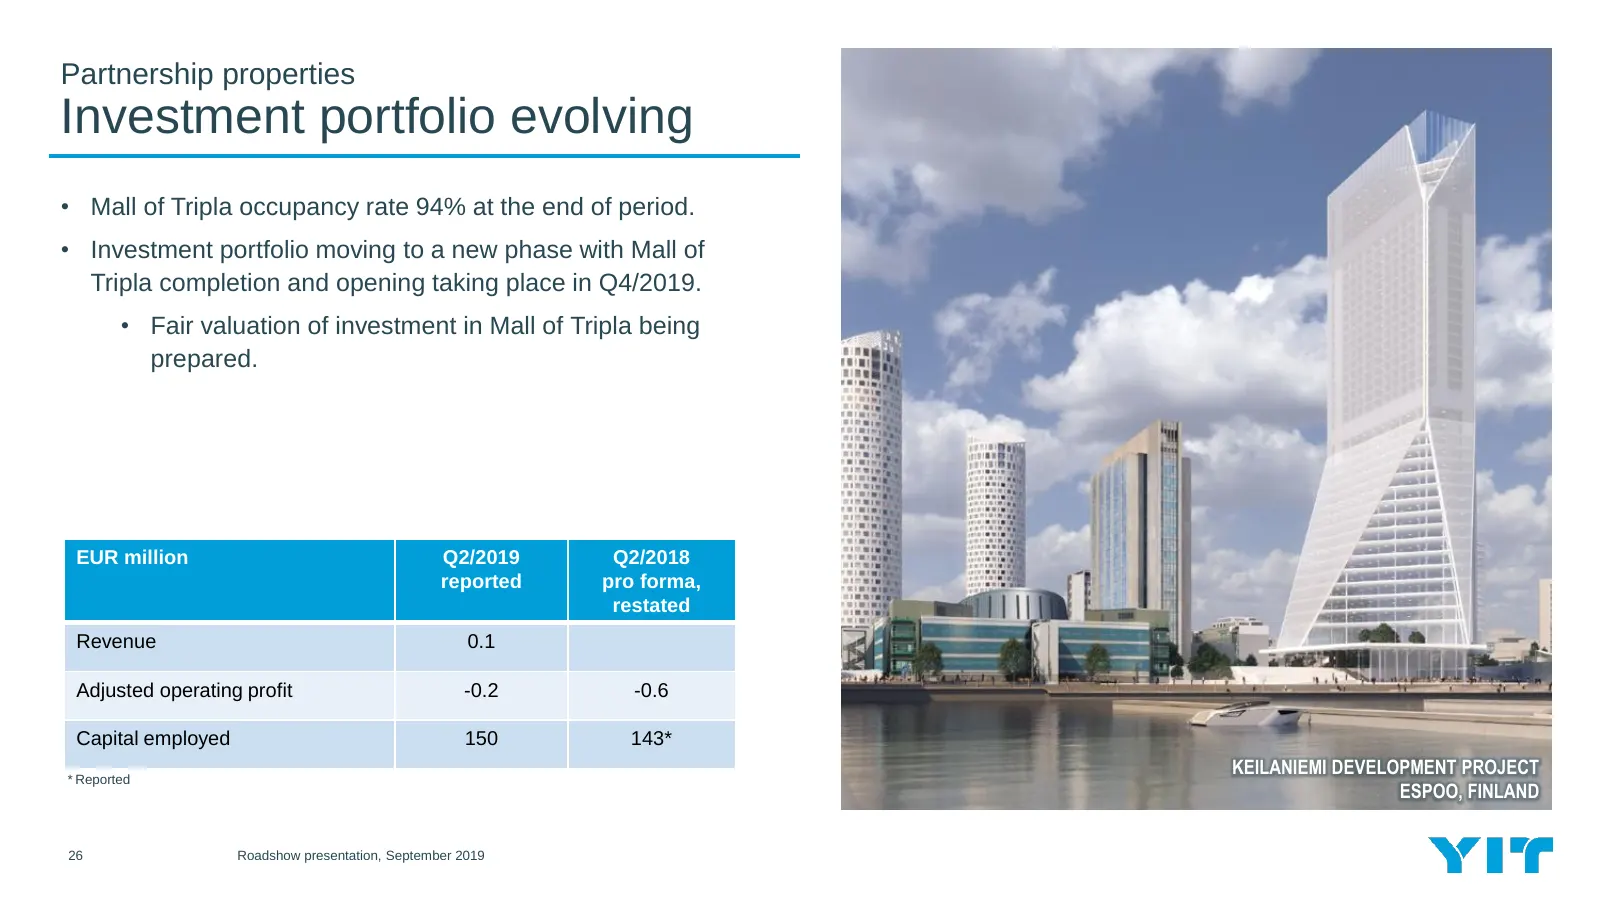
Partnership properties Investment portfolio evolving • Mall of Tripla occupancy rate 94% at the end of period. • Investment portfolio moving to a new phase with Mall of Tripla completion and opening taking place in Q4/2019. • Fair valuation of investment in Mall of Tripla being prepared. EUR million
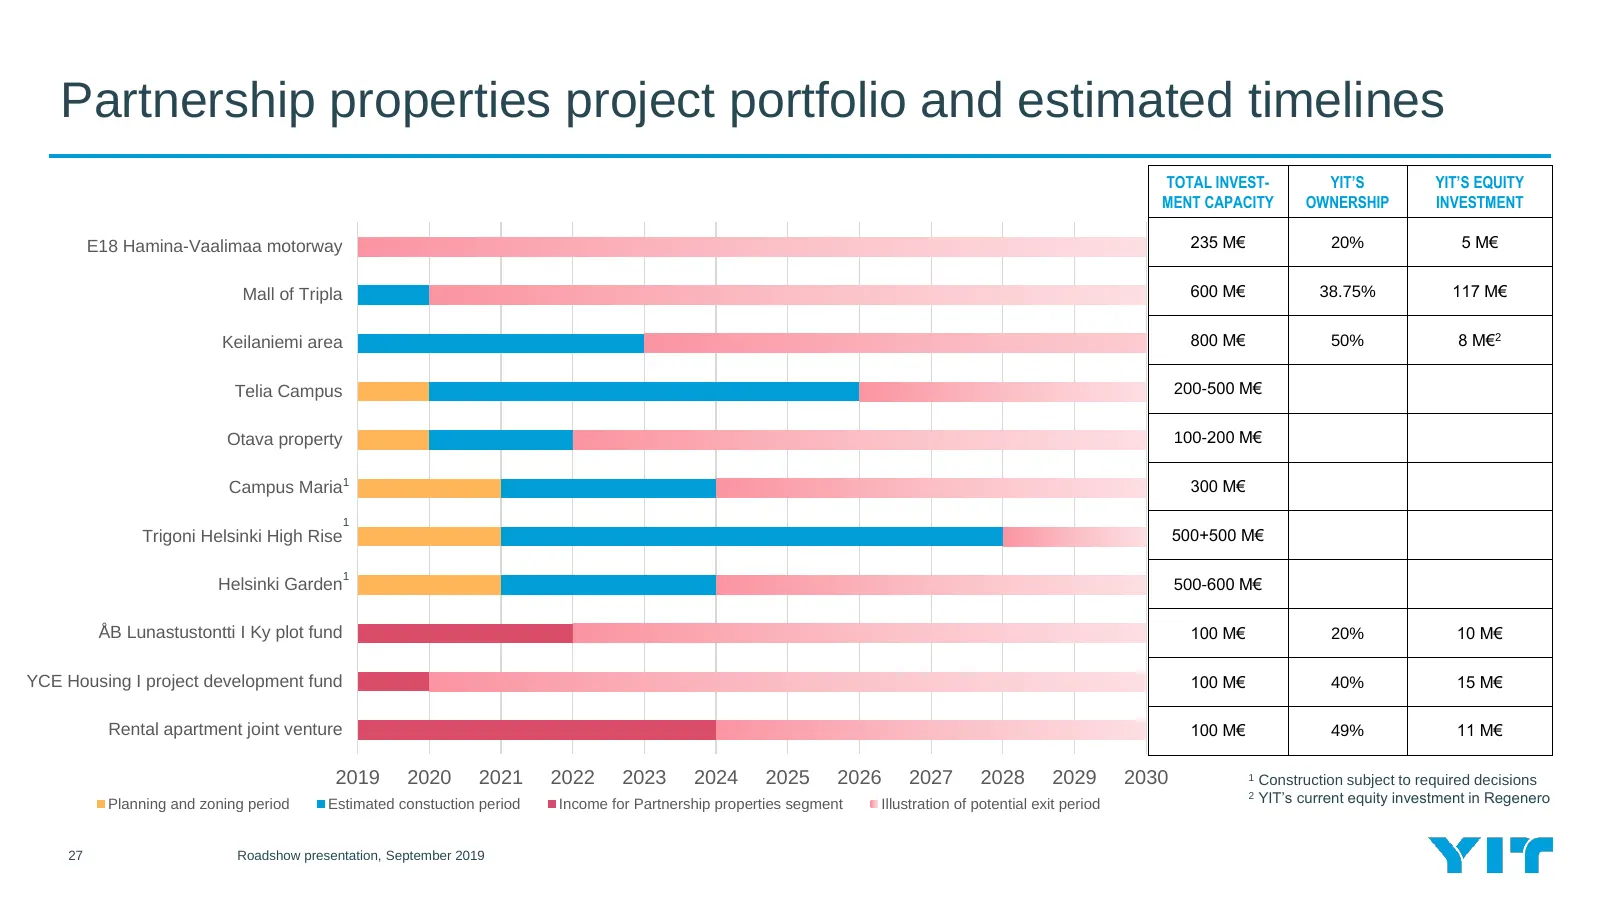
Slide 27: Partnership properties project portfolio and estimated timelines
Partnership properties project portfolio and estimated timelines TOTAL INVEST- YIT’S YIT’S EQUITY MENT CAPACITY OWNERSHIP INVESTMENT E18 Hamina-Vaalimaa motorway 235 M€ 20% 5 M€ Mall of Tripla 600 M€ 38.75% 117 M€ Keilaniemi area 800 M€ 50% 8 M€2 Telia Campus 200-500 M€ Otava property 100-200 M€ Cam
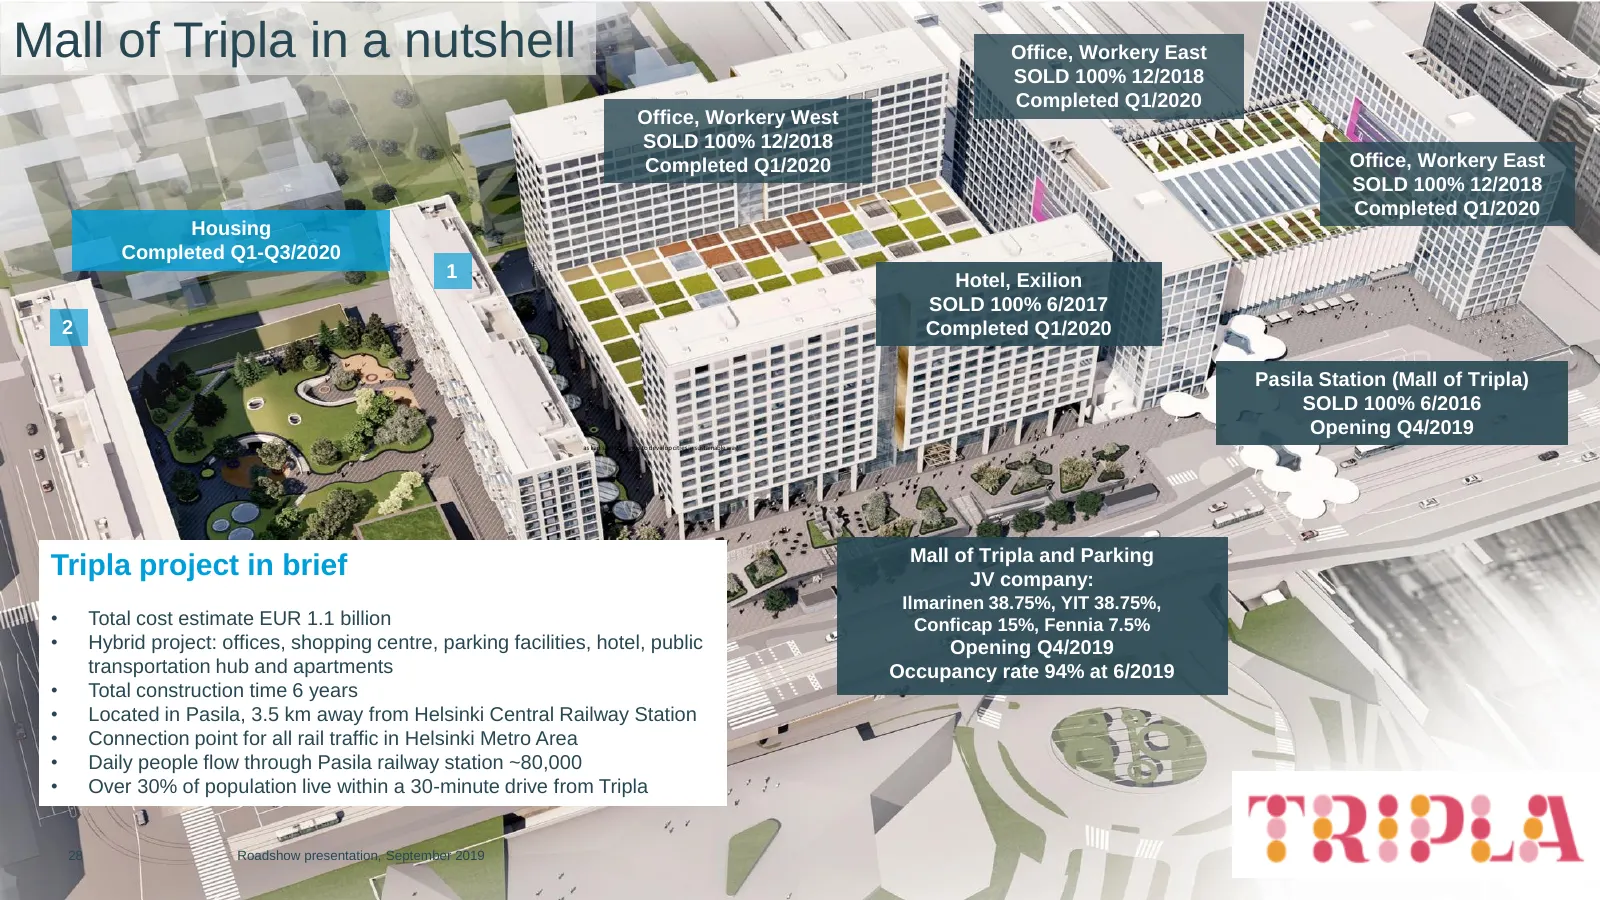
Slide 28: Mall of Tripla in a nutshell
Mall of Tripla in a nutshell Office, Workery East SOLD 100% 12/2018 Completed Q1/2020 Office, Workery West SOLD 100% 12/2018 Completed Q1/2020 Office, Workery East SOLD 100% 12/2018 Completed Q1/2020 Housing Completed Q1-Q3/2020 1 Hotel, Exilion SOLD 100% 6/2017 2 Completed Q1/2020 Pasila Station (M
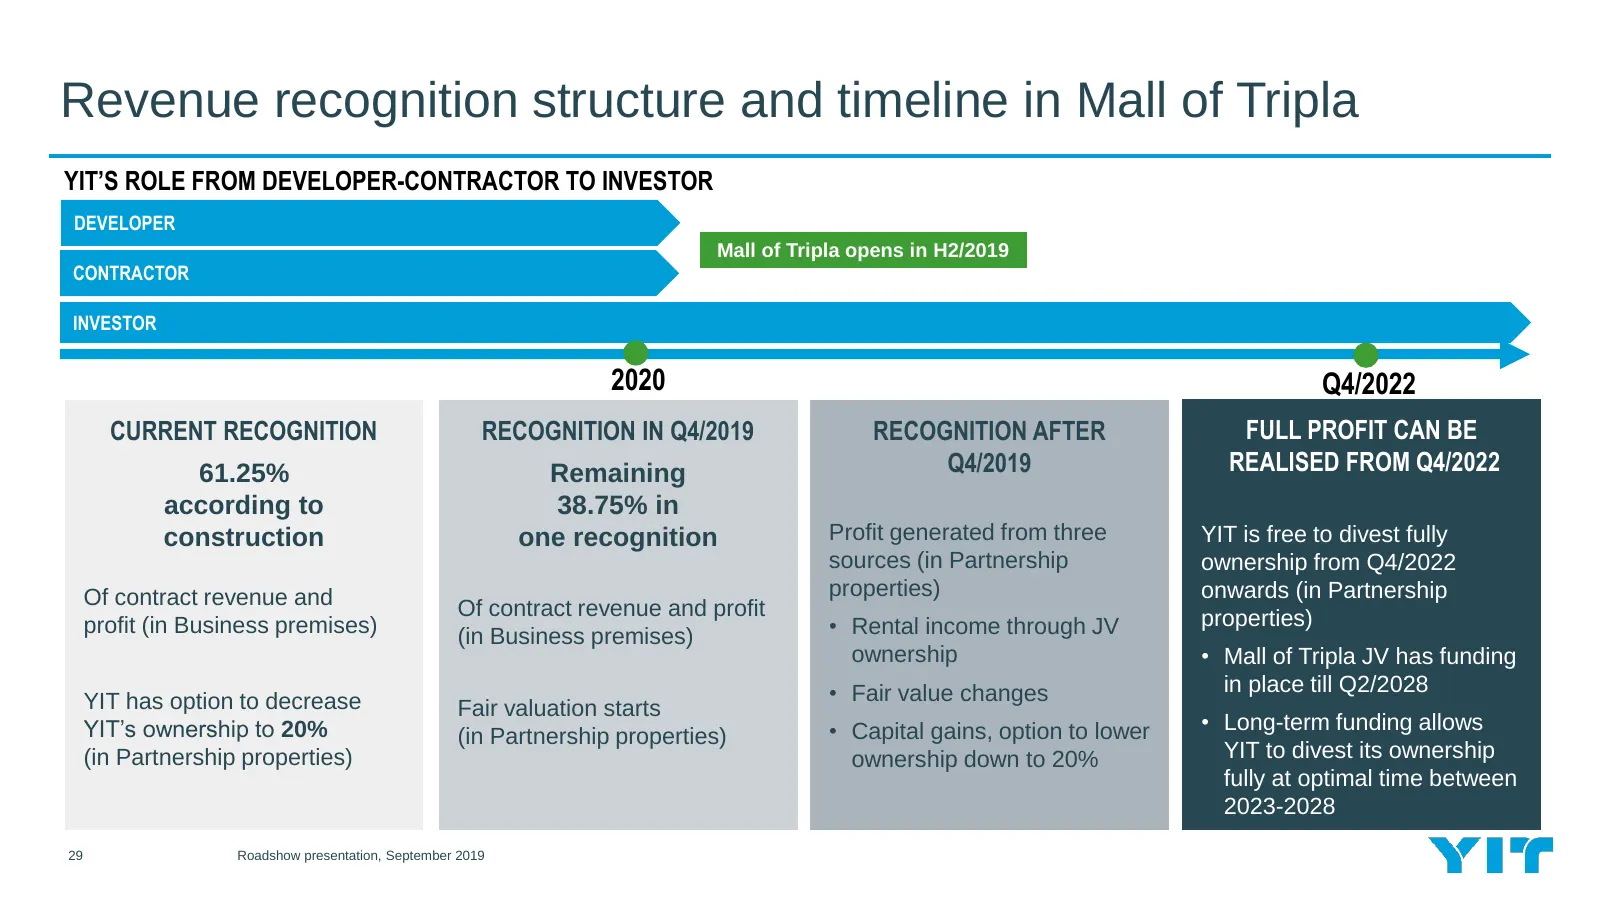
Slide 29: Revenue recognition structure and timeline in Mall of Tripla
Revenue recognition structure and timeline in Mall of Tripla YIT’S ROLE FROM DEVELOPER-CONTRACTOR TO INVESTOR DEVELOPER Mall of Tripla opens in H2/2019 CONTRACTOR INVESTOR 2020 Q4/2022 CURRENT RECOGNITION RECOGNITION IN Q4/2019 RECOGNITION AFTER FULL PROFIT CAN BE 61.25% Remaining Q4/2019 REALISED F
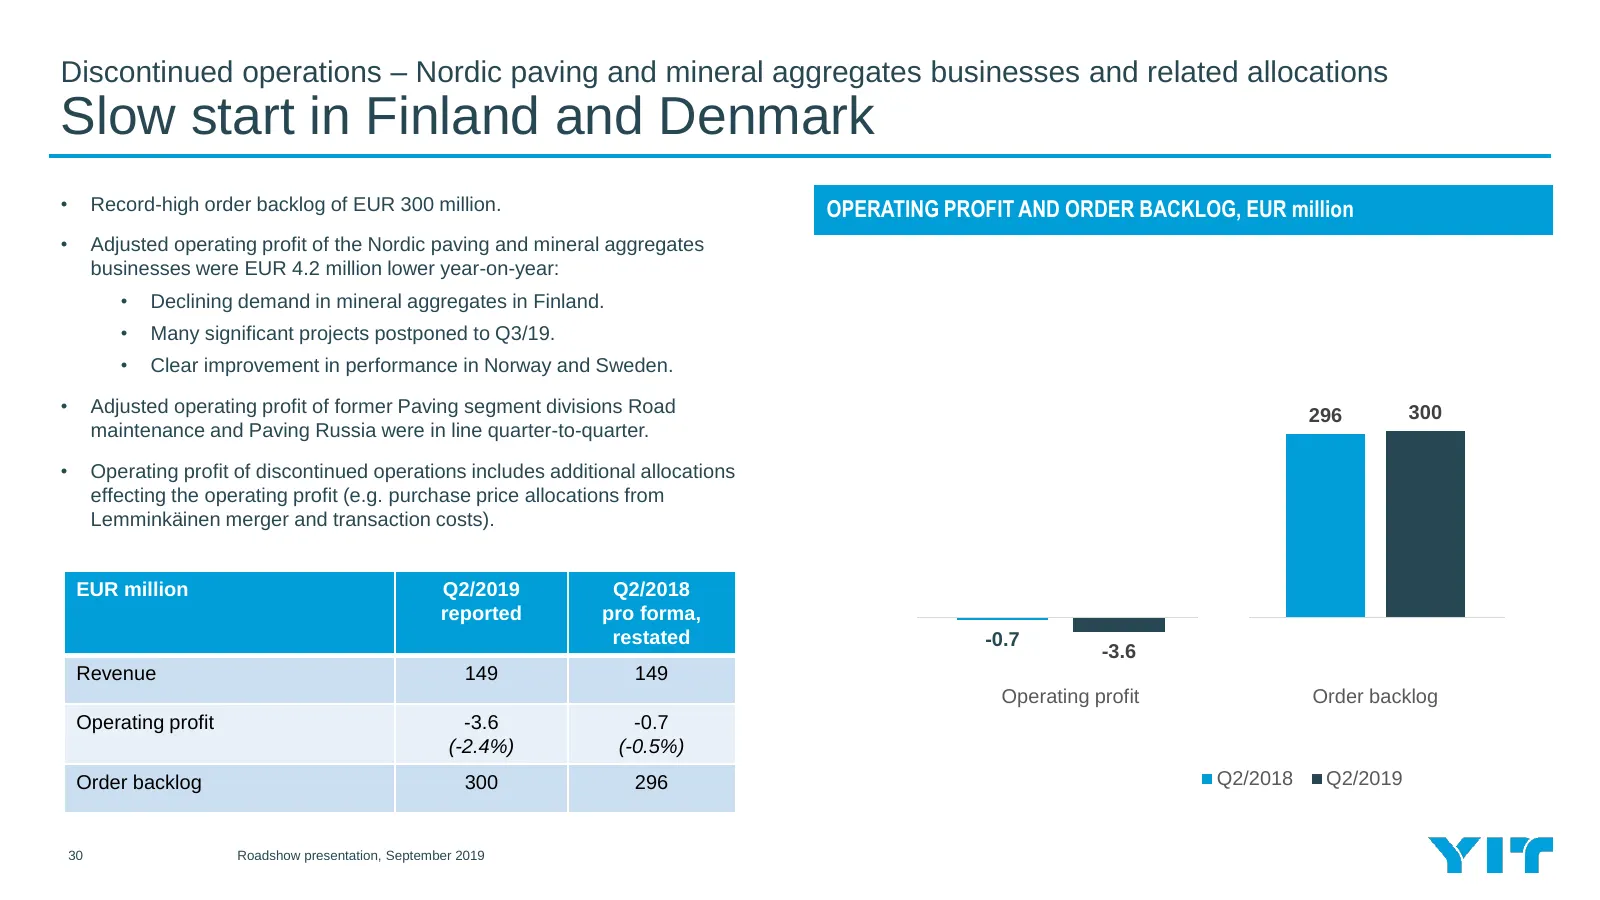
Slide 30: Discontinued operations: Slow start in Finland and Denmark
Discontinued operations – Nordic paving and mineral aggregates businesses and related allocations Slow start in Finland and Denmark • Record-high order backlog of EUR 300 million. OPERATING PROFIT AND ORDER BACKLOG, EUR million • Adjusted operating profit of the Nordic paving and mineral aggregates
Slide 31: Financial position and key ratios
5 Financial position and key ratios 31 Roadshow presentation, September 2019 TIMBER CAMPUS PUDASJÄRVI, FINLAND
Slide 32: Operating cash flow negative
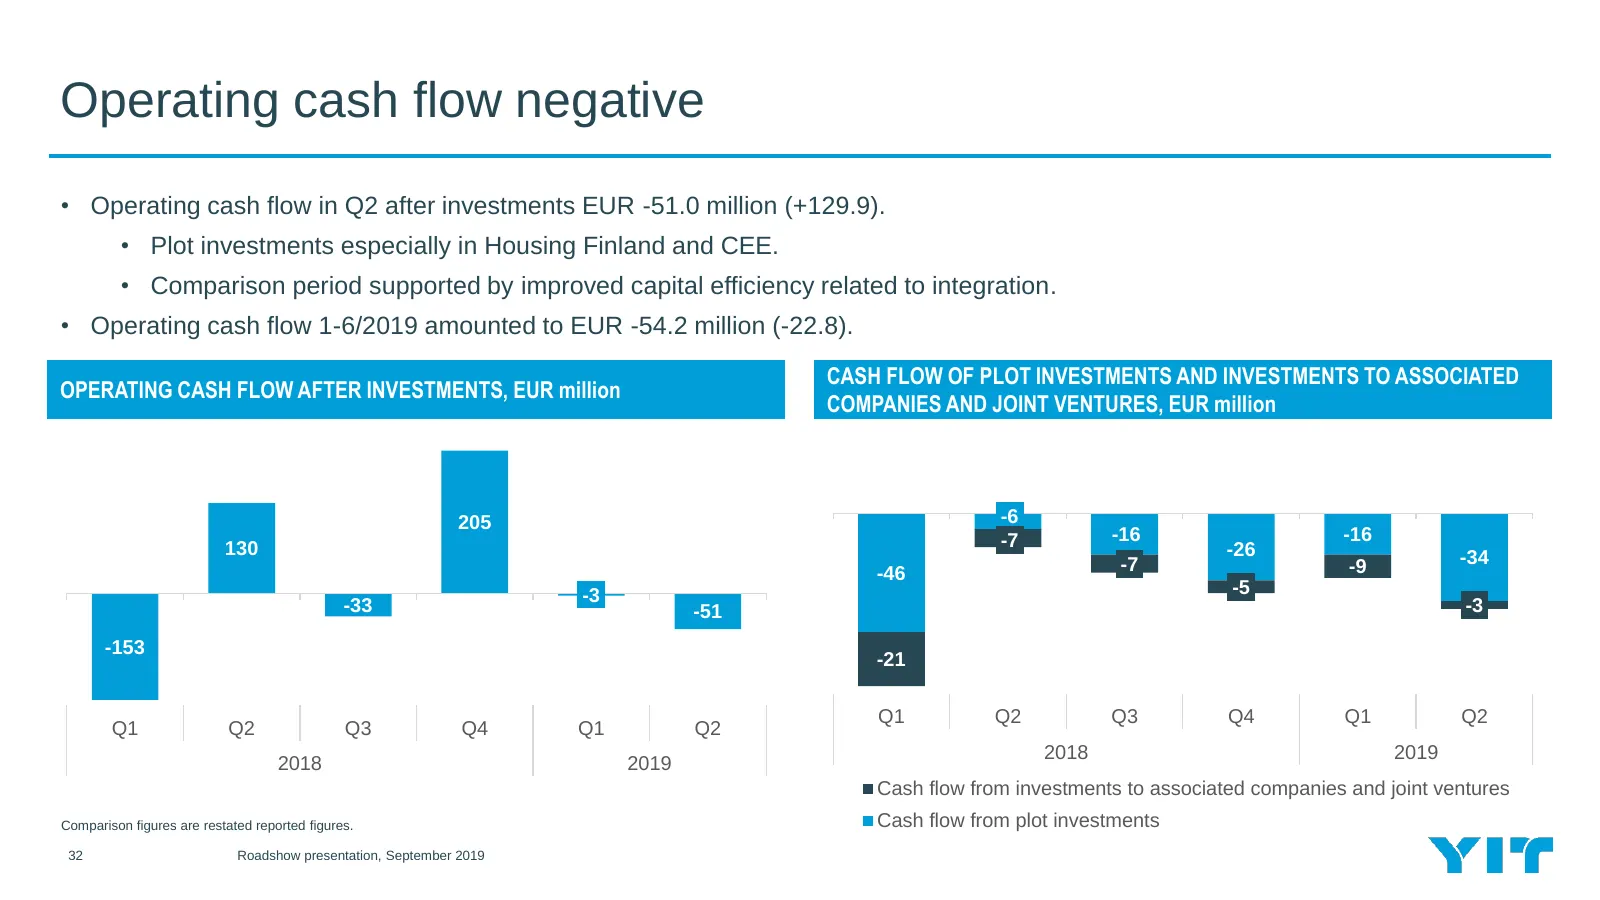
Operating cash flow negative • Operating cash flow in Q2 after investments EUR -51.0 million (+129.9). • Plot investments especially in Housing Finland and CEE. • Comparison period supported by improved capital efficiency related to integration. • Operating cash flow 1-6/2019 amounted to EUR -54.2 m
Slide 33: Adjusted net debt lower than in comparison period
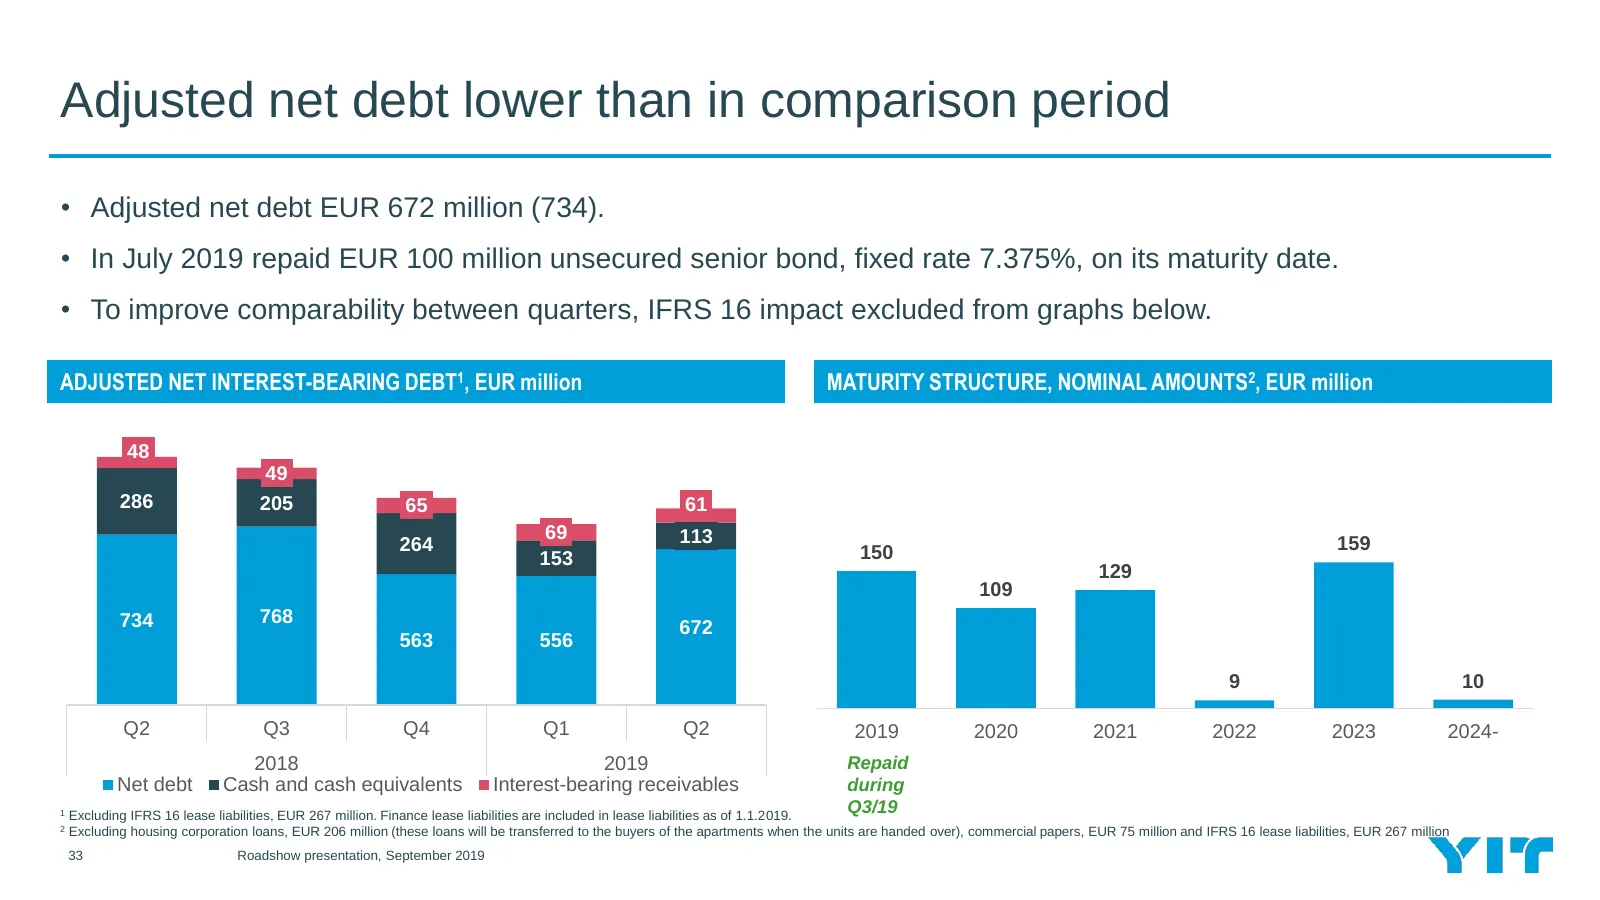
Adjusted net debt lower than in comparison period • Adjusted net debt EUR 672 million (734). • In July 2019 repaid EUR 100 million unsecured senior bond, fixed rate 7.375%, on its maturity date. • To improve comparability between quarters, IFRS 16 impact excluded from graphs below. ADJUSTED NET INTE
Slide 34: Adjusted financial key ratios
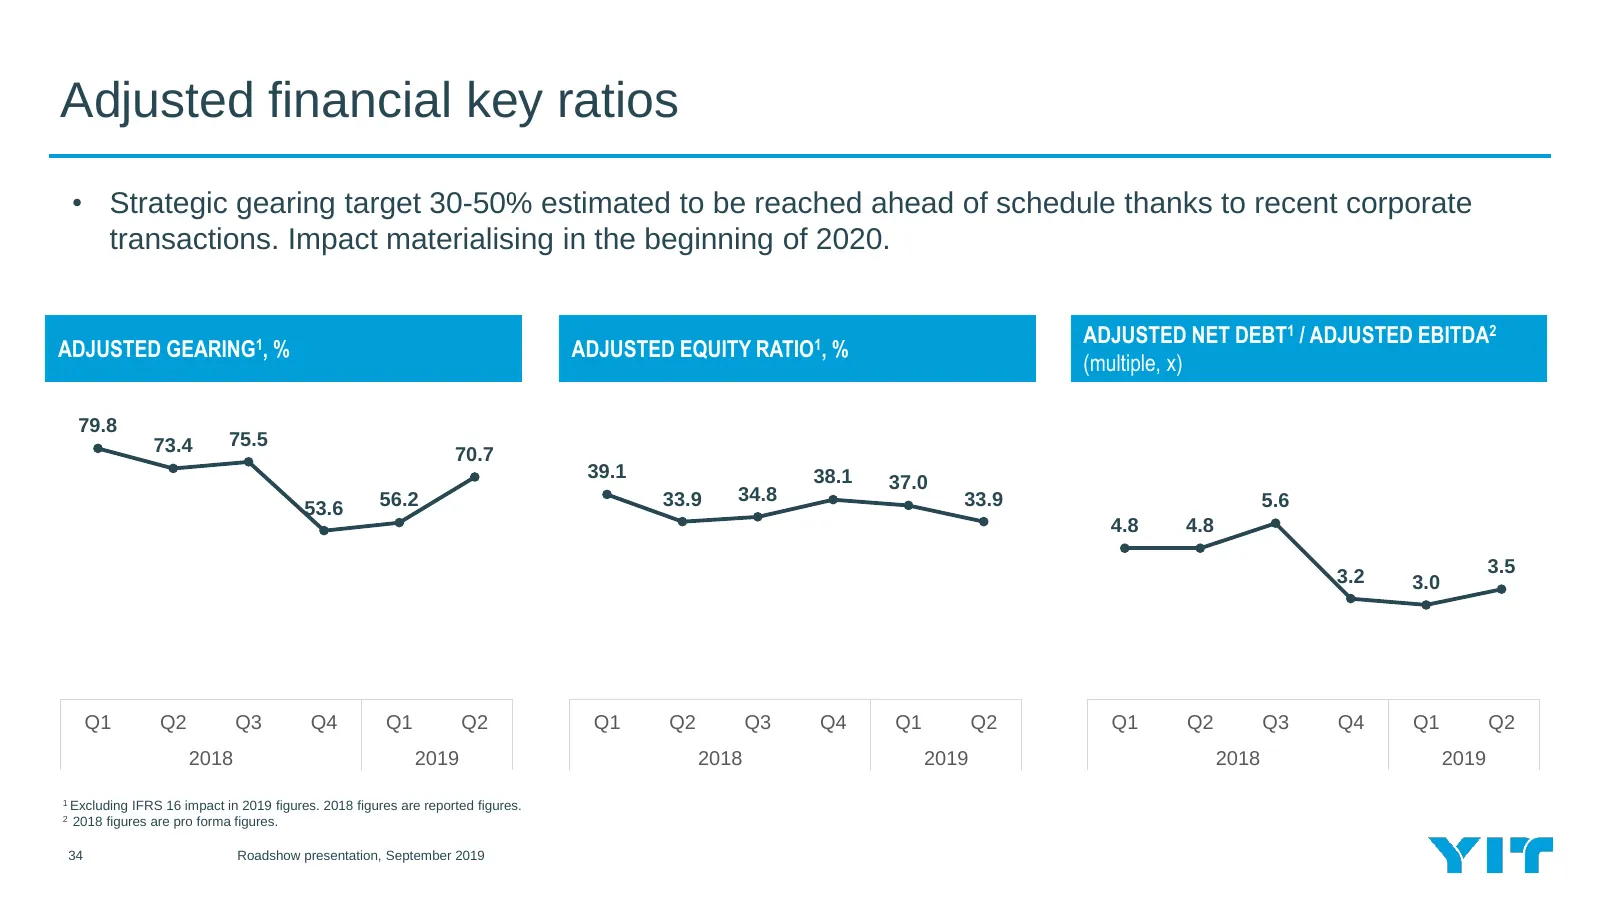
Adjusted financial key ratios • Strategic gearing target 30-50% estimated to be reached ahead of schedule thanks to recent corporate transactions. Impact materialising in the beginning of 2020. ADJUSTED NET DEBT1 / ADJUSTED EBITDA2 ADJUSTED GEARING1, % ADJUSTED EQUITY RATIO1, % (multiple, x) 79.8 73
Slide 35: Capital employed by segment
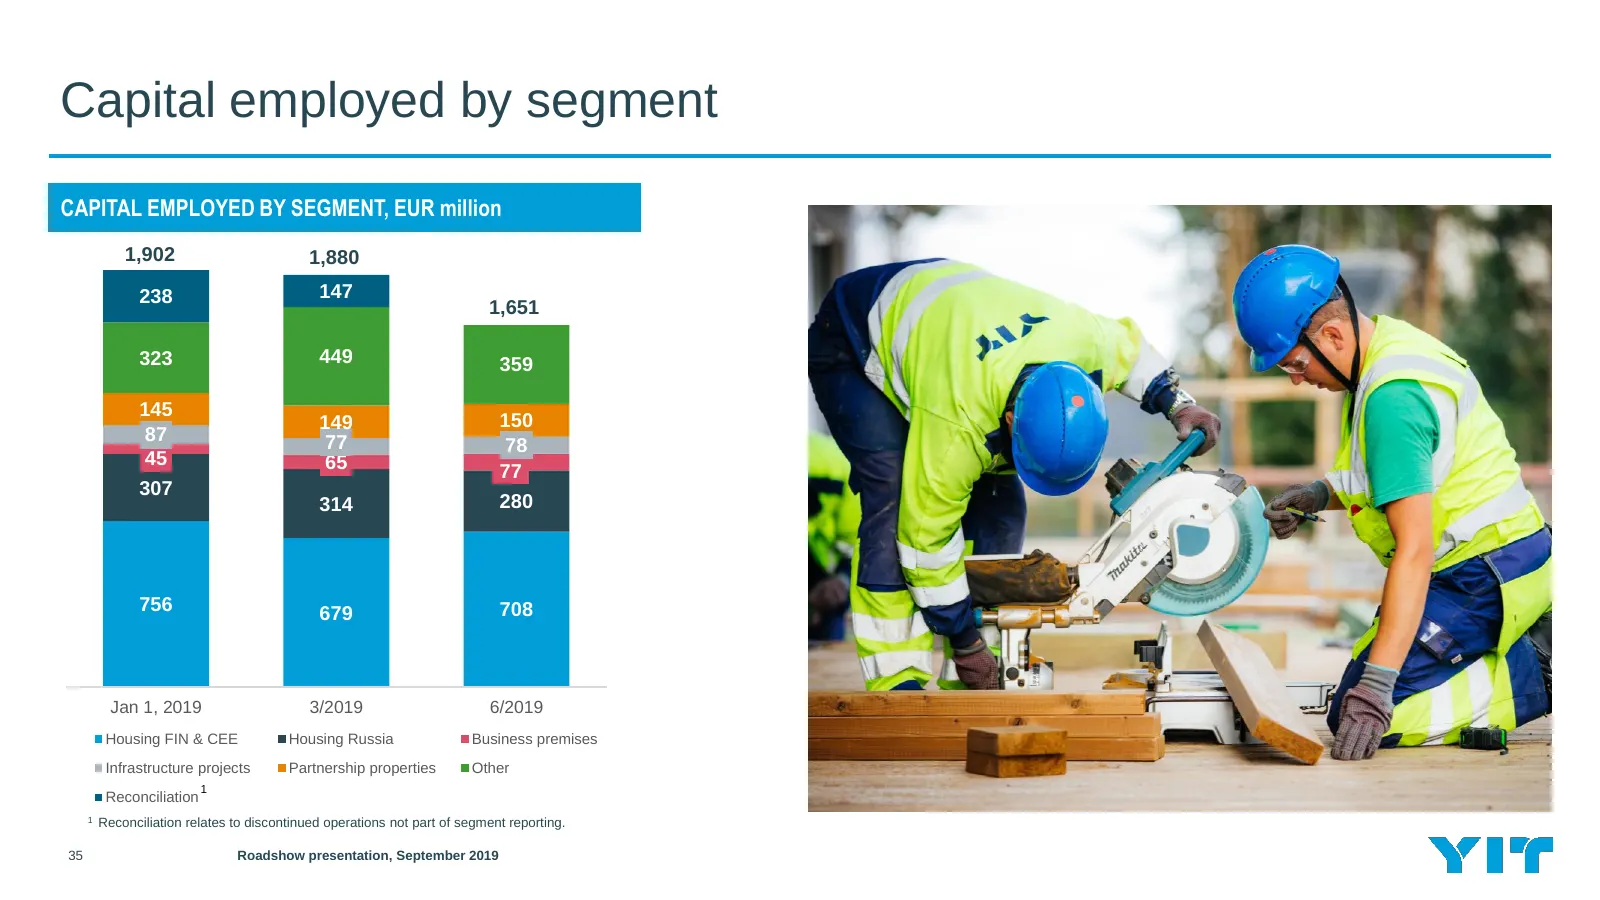
Capital employed by segment CAPITAL EMPLOYED BY SEGMENT, EUR million 1,902 1,880 238 147 1,651 323 449 359 145 149 150 87 77 78 45 65 77 307 314 280 756 679 708 Jan 1, 2019 3/2019 6/2019 Housing FIN & CEE Housing Russia Business premises Infrastructure projects Partnership properties Other 1 Reconci
Slide 36: Outlook and guidance
6 Outlook and guidance 36 Roadshow presentation, September 2019 PURJEENTEKIJÄNKUJA RESIDENTIAL APARTMENT PROJECT LAUTTASAARI, FINLAND
Slide 37: Estimated completions of consumer apartment projects under construction
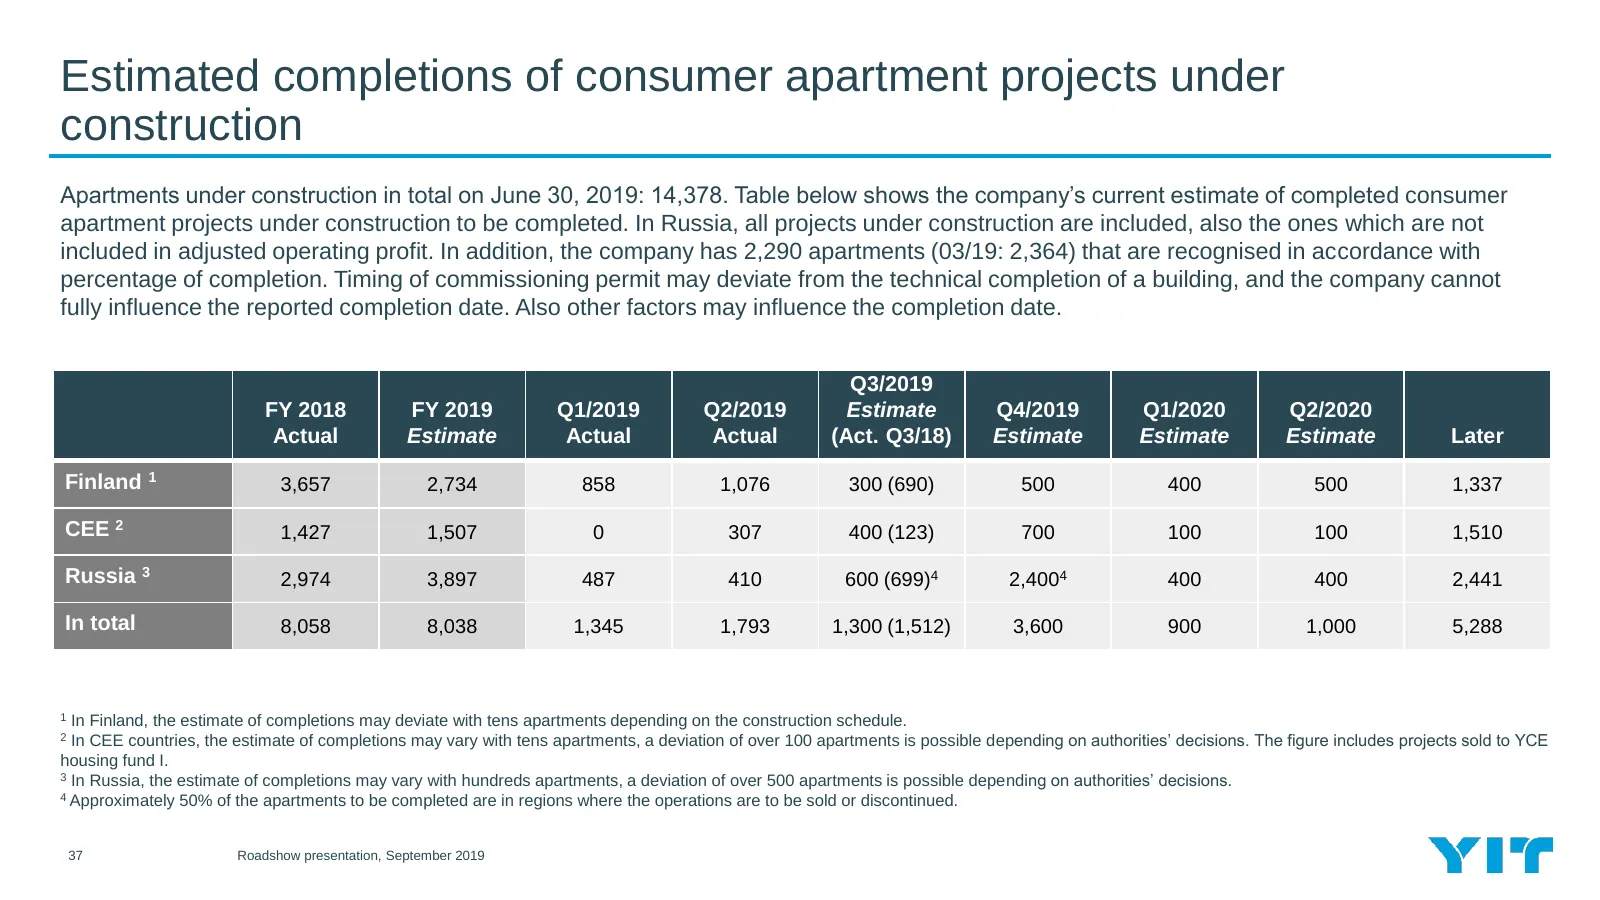
Estimated completions of consumer apartment projects under construction Apartments under construction in total on June 30, 2019: 14,378. Table below shows the company’s current estimate of completed consumer apartment projects under construction to be completed. In Russia, all projects under constru
Slide 38: Guidance for 2019
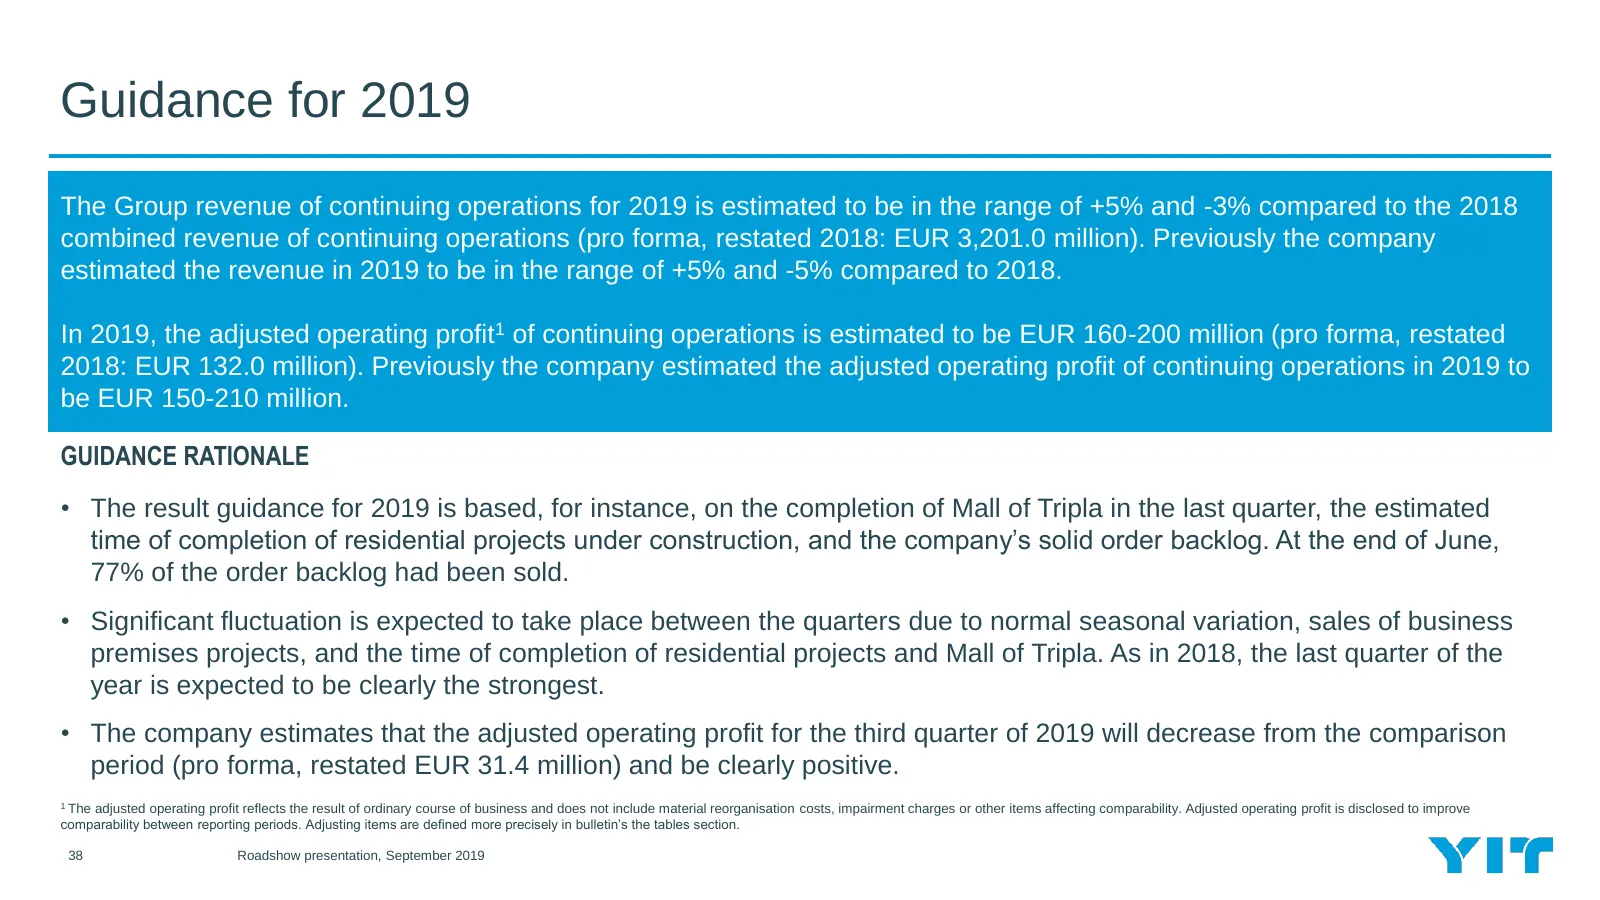
Guidance for 2019 The Group revenue of continuing operations for 2019 is estimated to be in the range of +5% and -3% compared to the 2018 combined revenue of continuing operations (pro forma, restated 2018: EUR 3,201.0 million). Previously the company estimated the revenue in 2019 to be in the range

Slide 39: Appendices
7 Appendices 39 Roadshow presentation, September 2019 TRIPLA PROJECT HELSINKI, FINLAND
Slide 40: Presentation of financial information in Q2
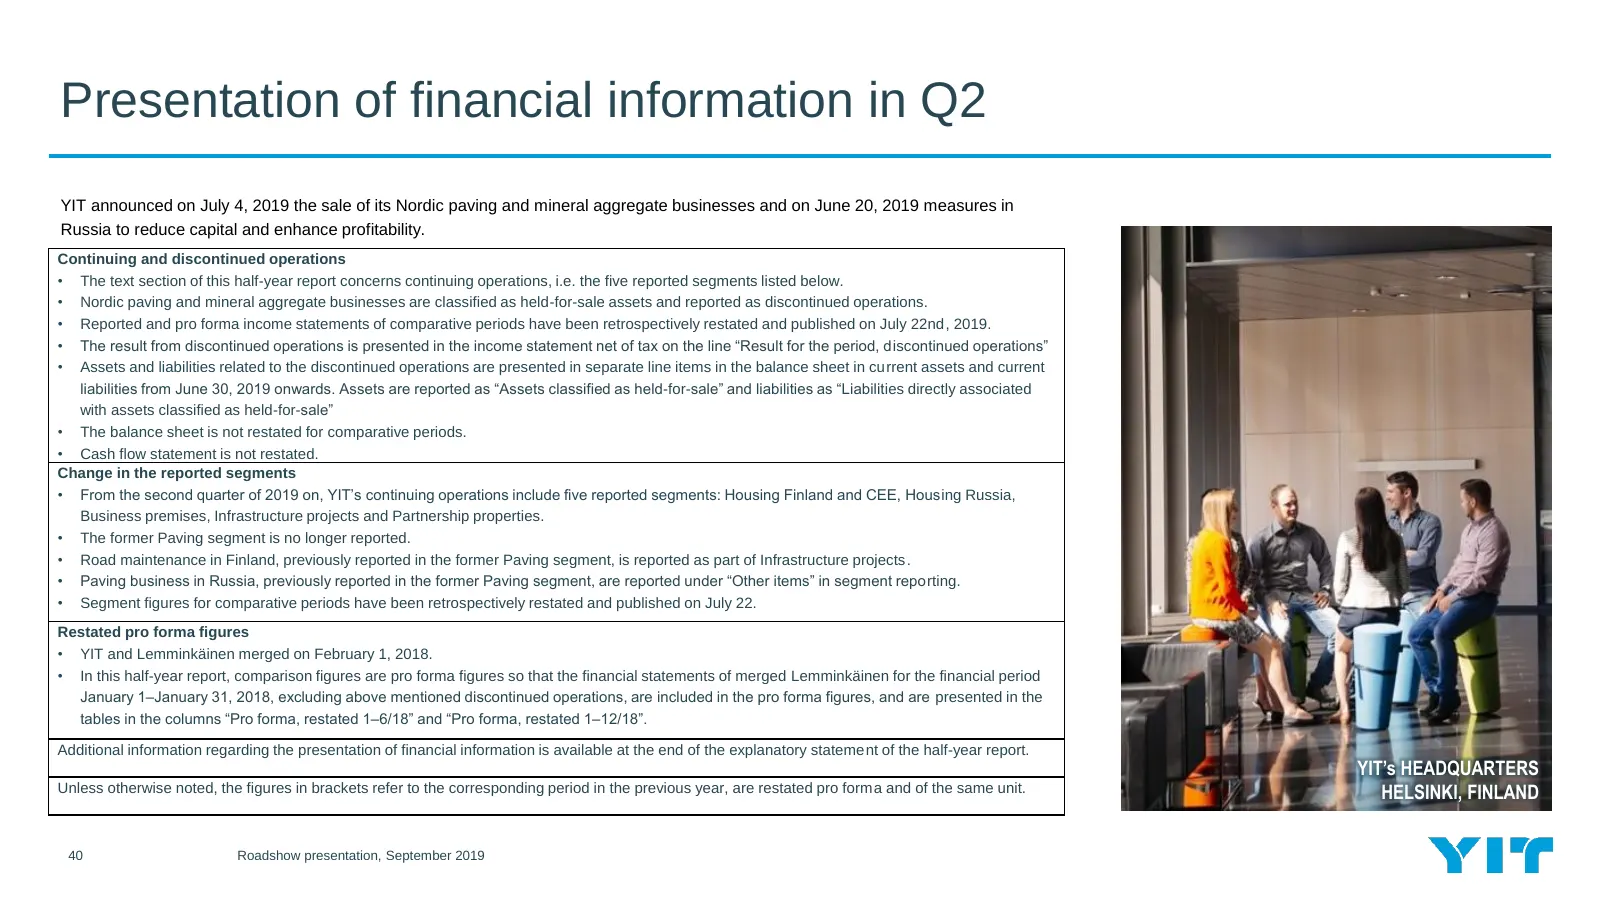
Presentation of financial information in Q2 YIT announced on July 4, 2019 the sale of its Nordic paving and mineral aggregate businesses and on June 20, 2019 measures in Russia to reduce capital and enhance profitability. Continuing and discontinued operations • The text section of this half-year re
Slide 41: Appendices
Appendices I. Key figures and additional information about financial position II. Housing sales and start-ups III. Share ownership IV. General economic and construction indicators V. Housing indicators VI. Business premises, infrastructure and paving indicators 41 Roadshow presentation, September 20

Slide 42: Key figures and additional information about financial position
I Key figures and additional information about financial position 42 Roadshow presentation, September 2019
Slide 43: Key figures
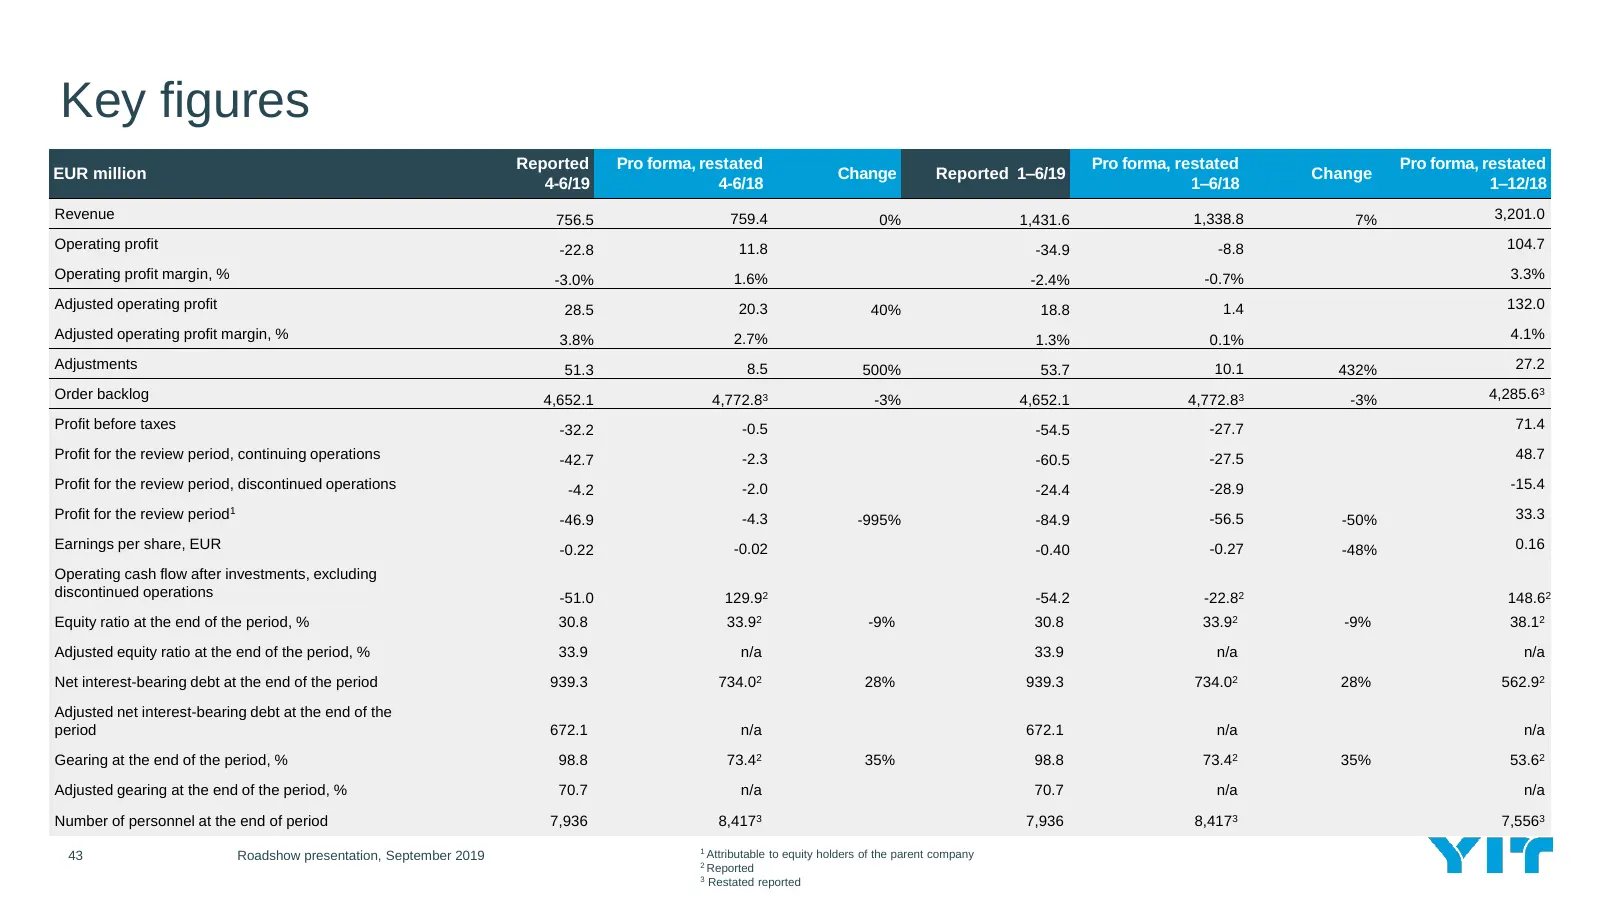
Key figures Reported Pro forma, restated Pro forma, restated Pro forma, restated EUR million Change Reported 1–6/19 Change 4-6/19 4-6/18 1–6/18 1–12/18 Revenue 756.5 759.4 0% 1,431.6 1,338.8 7% 3,201.0 Operating profit -22.8 11.8 -34.9 -8.8 104.7 Operating profit margin, % -3.0% 1.6% -2.4% -0.7% 3.3
Slide 44: Balanced debt portfolio
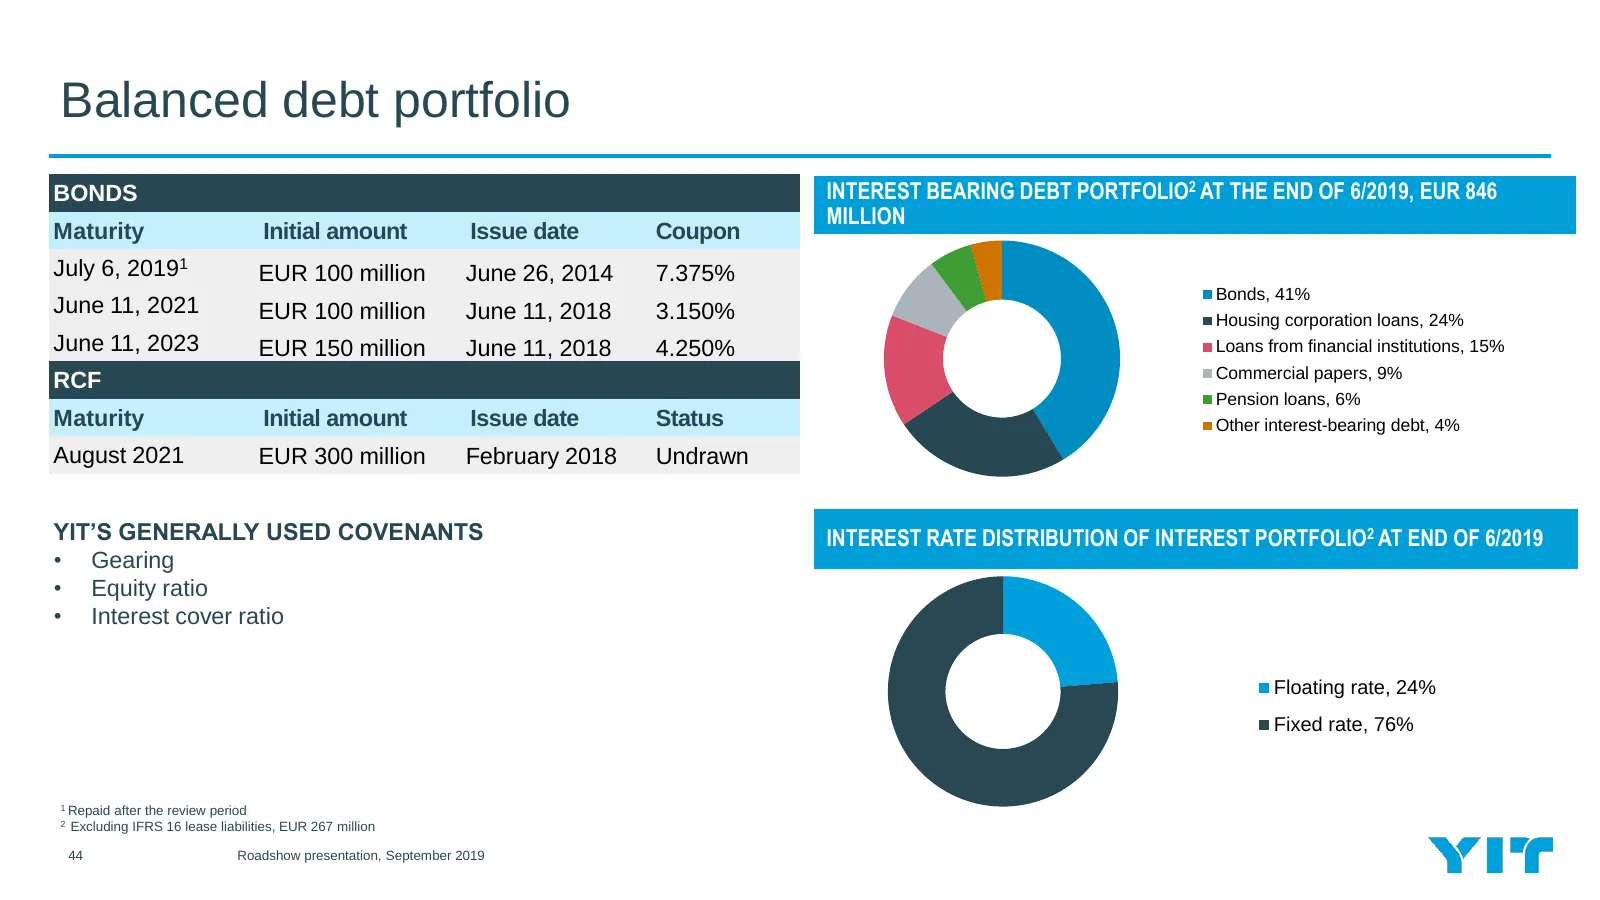
Balanced debt portfolio BONDS INTEREST BEARING DEBT PORTFOLIO2 AT THE END OF 6/2019, EUR 846 MILLION Maturity Initial amount Issue date Coupon July 6, 20191 EUR 100 million June 26, 2014 7.375% Bonds, 41% June 11, 2021 EUR 100 million June 11, 2018 3.150% Housing corporation loans, 24% June 11, 2023

Slide 45: Housing sales and start-ups
II Housing sales and start-ups 45 Roadshow presentation, September 2019
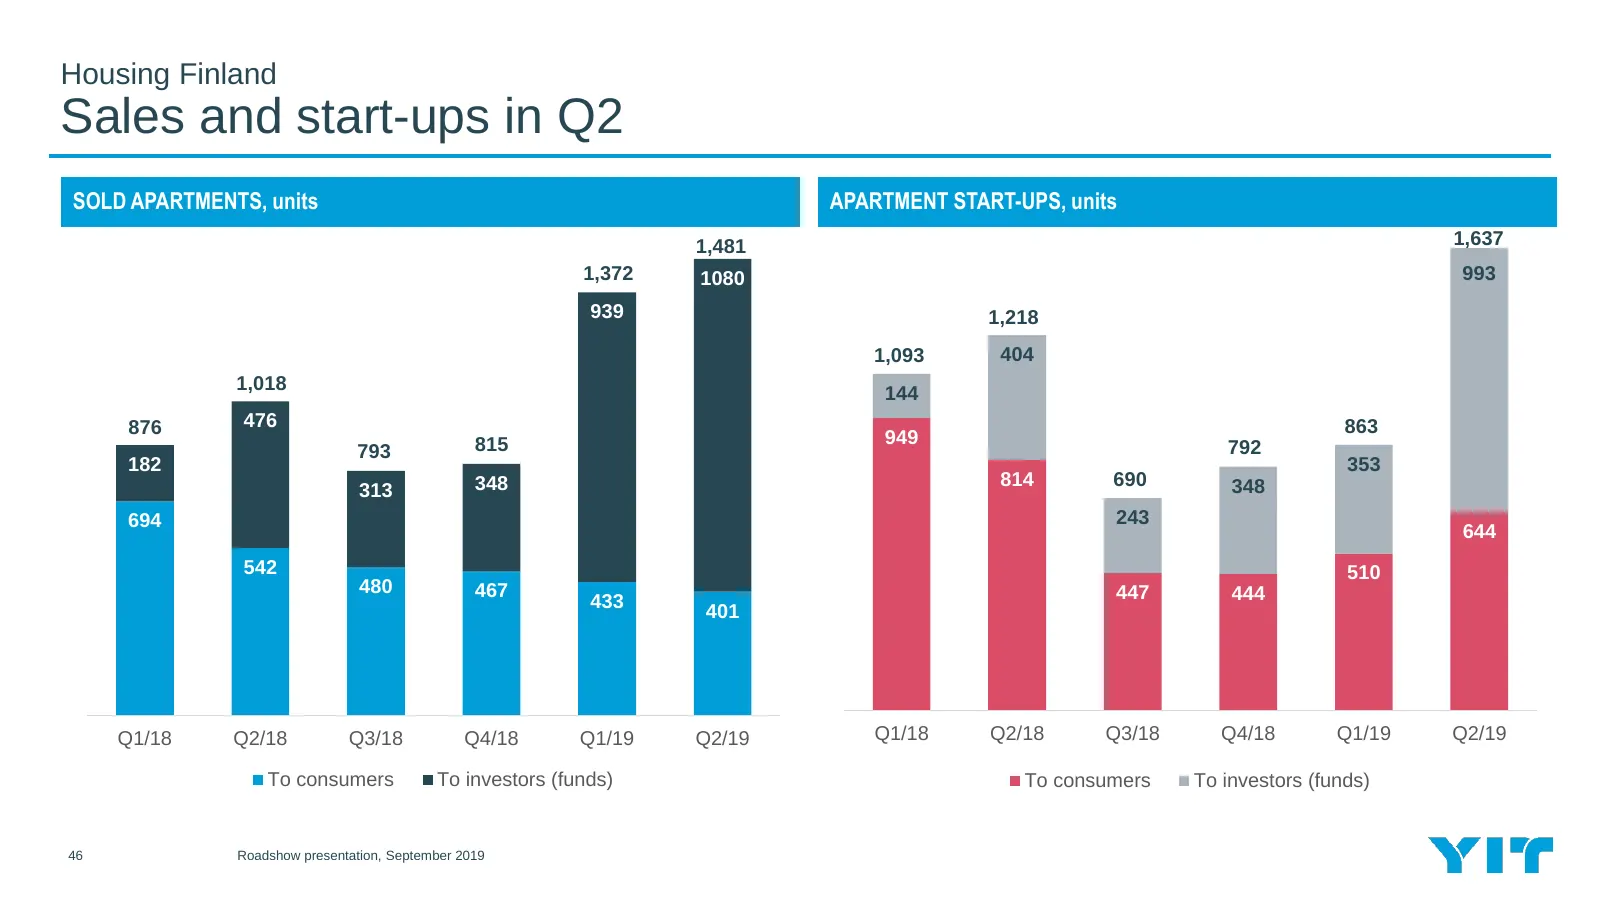
Slide 46: Housing Finland: Sales and start-ups in Q2
Housing Finland Sales and start-ups in Q2 SOLD APARTMENTS, units APARTMENT START-UPS, units 1500 1,481 1500 1,637 1,372 1080 993 1300 939 1300 1,218 1,093 404 1100 1100 1,018 144 876 476 863 900 815 900 949 792 793 182 353 348 814 690 348 700 313 700 694 243 644 500 500 542 510 480 467 447 444 433 4
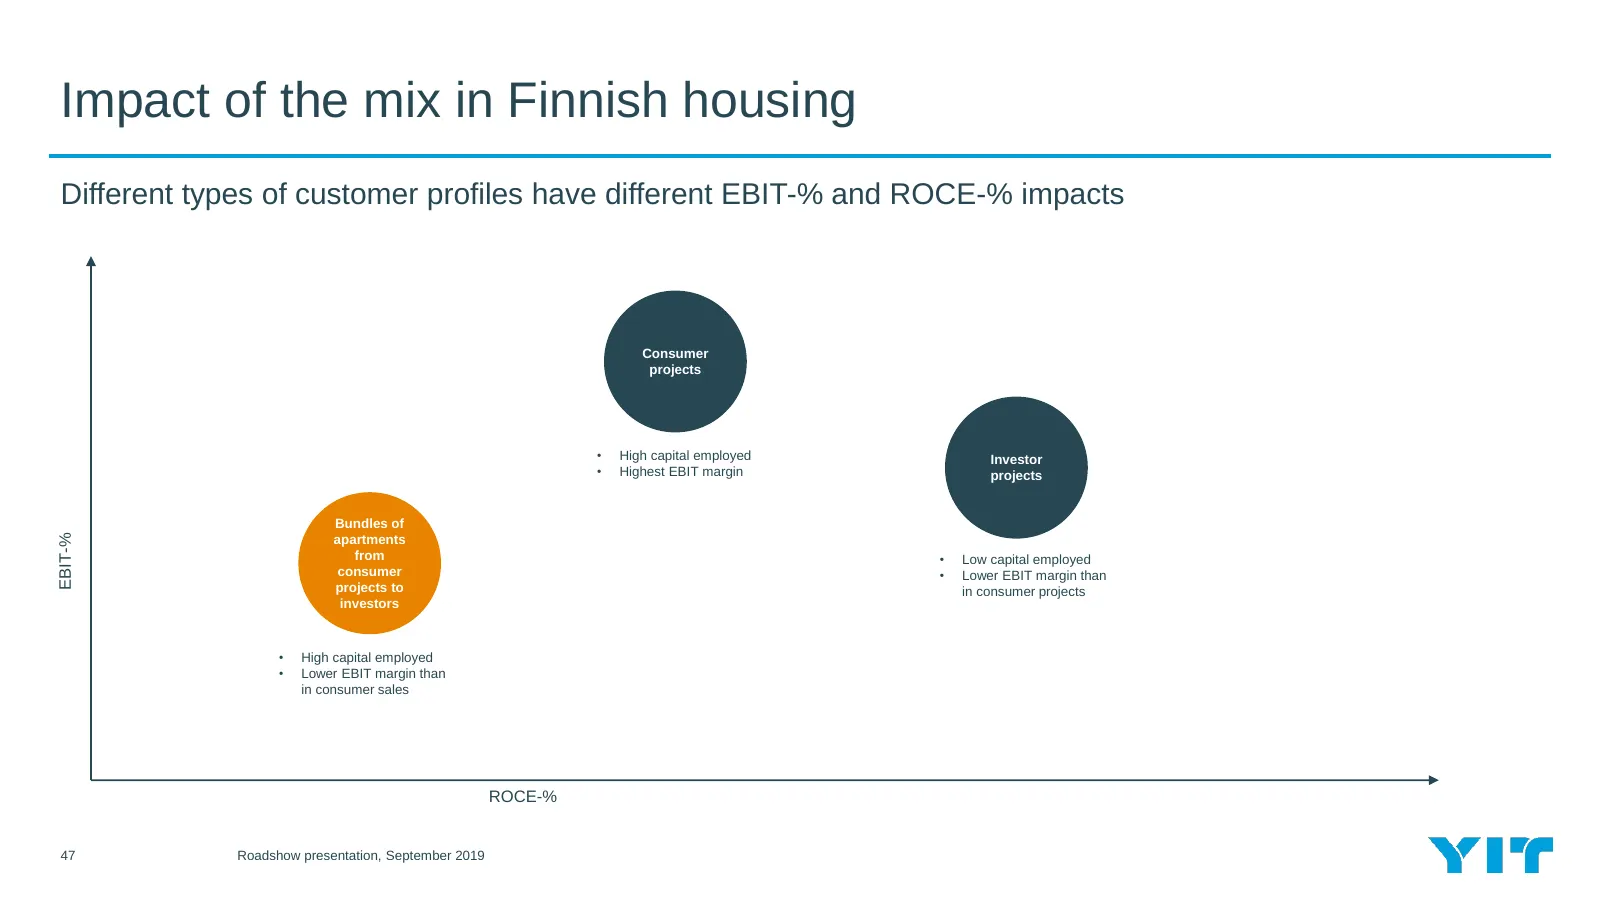
Slide 47: Impact of the mix in Finnish housing
Impact of the mix in Finnish housing Different types of customer profiles have different EBIT-% and ROCE-% impacts Consumer projects • High capital employed Investor • Highest EBIT margin projects Bundles of EBIT-% apartments from • Low capital employed consumer • Lower EBIT margin than projects to
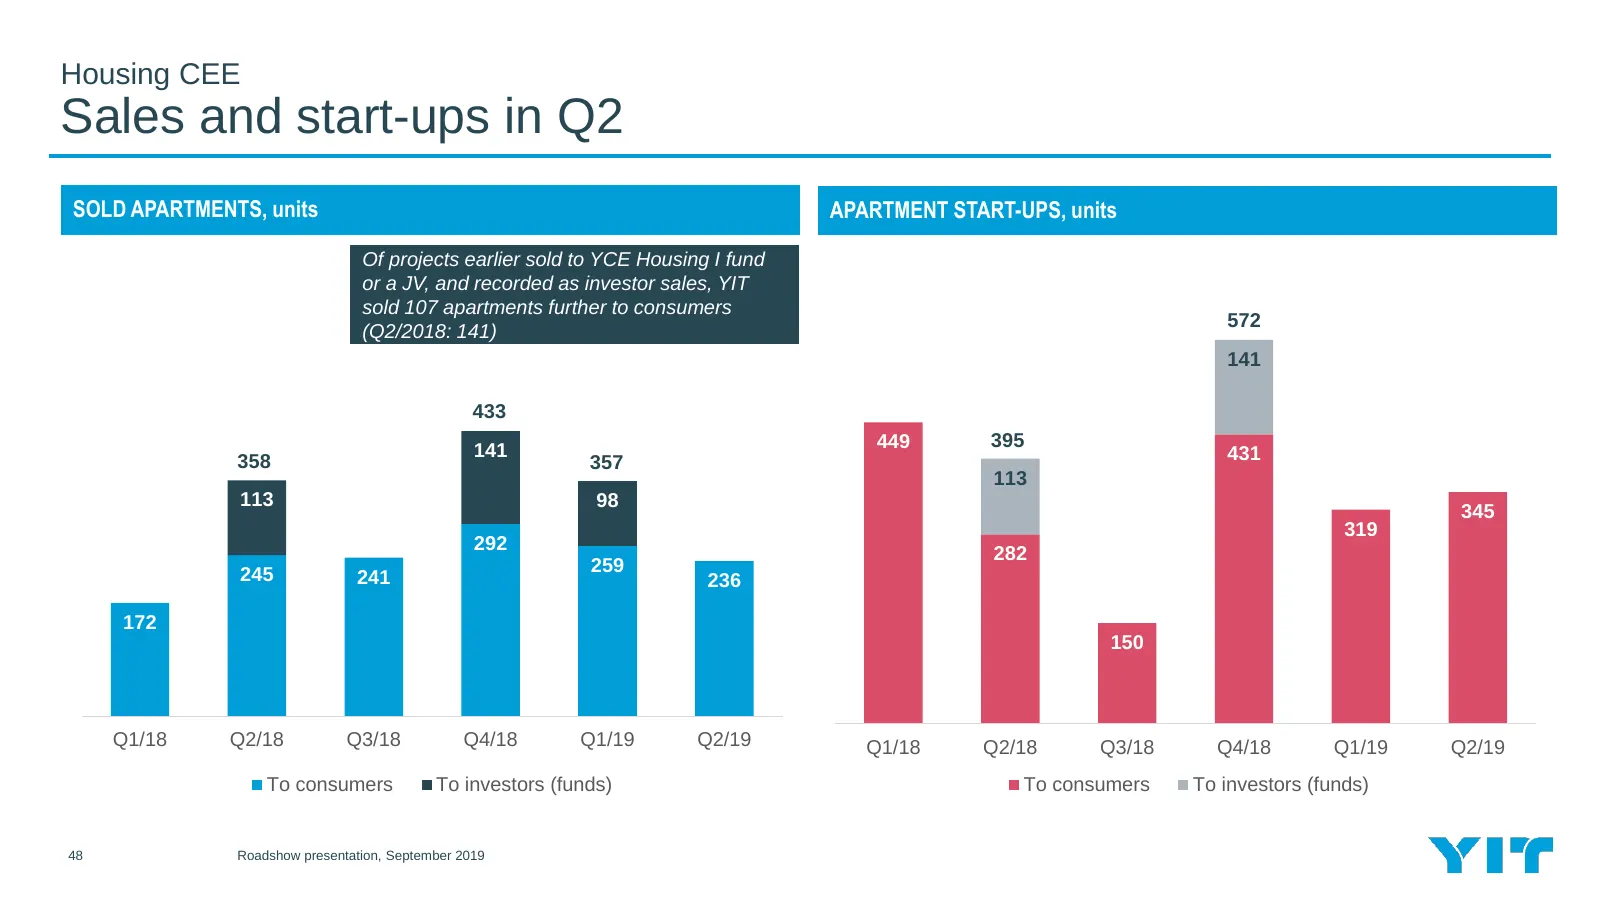
Slide 48: Housing CEE: Sales and start-ups in Q2
Housing CEE Sales and start-ups in Q2 SOLD APARTMENTS, units APARTMENT START-UPS, units Of projects earlier sold to YCE Housing I fund or a JV, and recorded as investor sales, YIT sold 107 apartments further to consumers 572 (Q2/2018: 141) 141 433 141 449 395 358 357 431 113 113 98 345 319 292 282 2
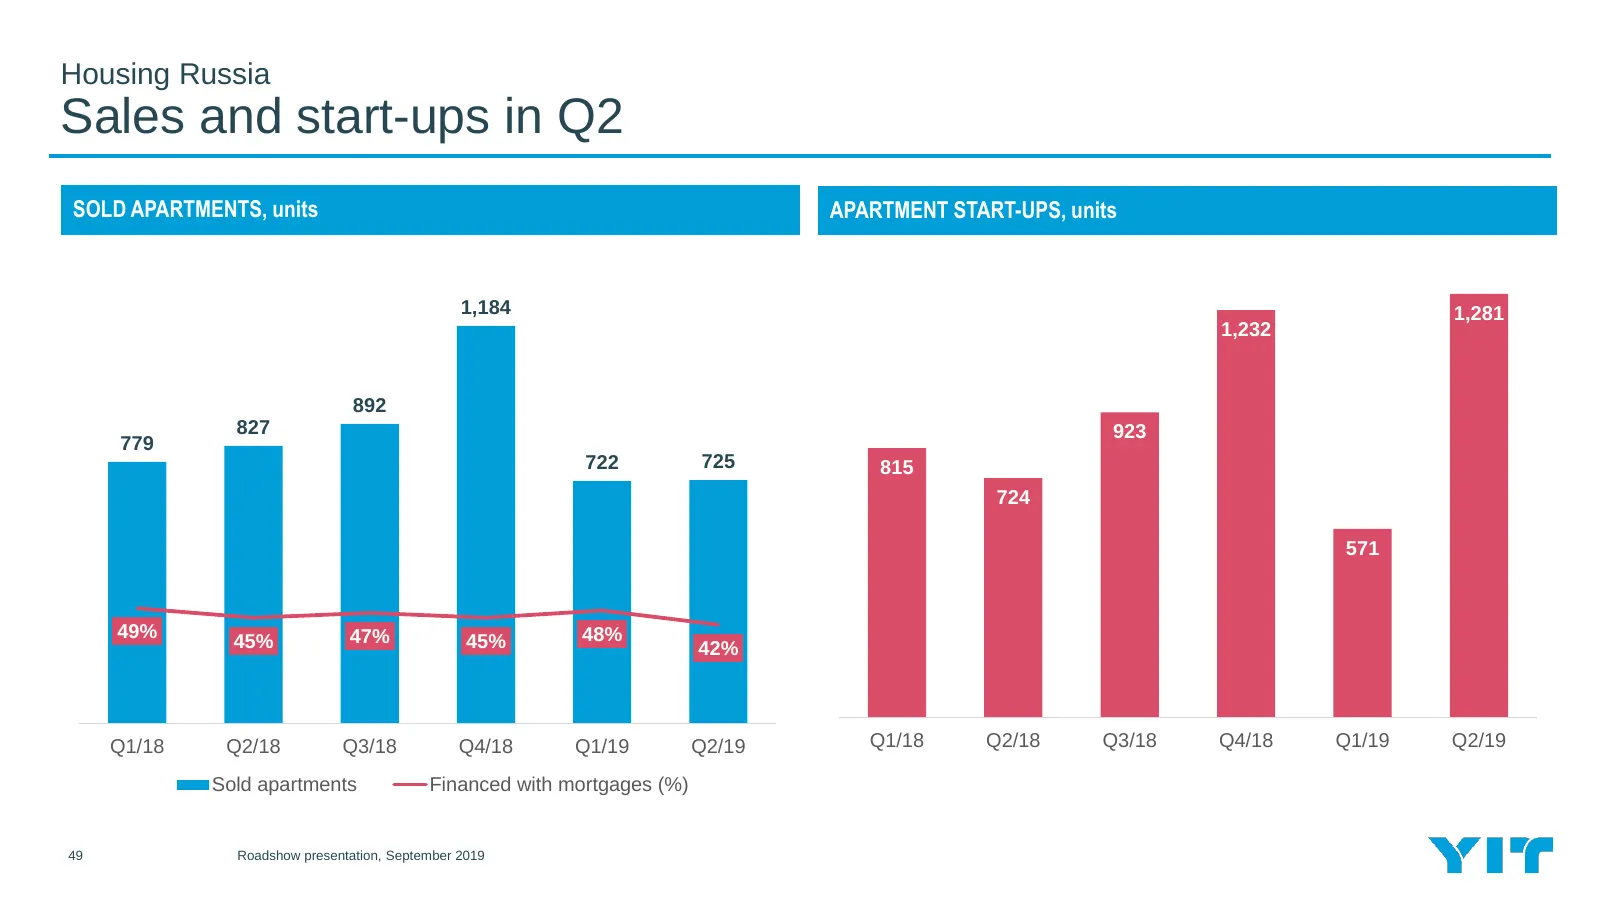
Slide 49: Housing Russia: Sales and start-ups in Q2
Housing Russia Sales and start-ups in Q2 SOLD APARTMENTS, units APARTMENT START-UPS, units 1400 200% 1400 180% 1200 1,184 1200 1,281 1,232 160% 1000 1000 140% 892 827 923 779 120% 800 725 800 722 815 100% 724 600 600 80% 571 60% 400 400 49% 45% 47% 45% 48% 40% 200 42% 200 20% 0 0 0% Q1/18 Q2/18 Q3/1

Slide 50: Share ownership
III Share ownership 50 Roadshow presentation, September 2019
Slide 51: YIT's shareholders
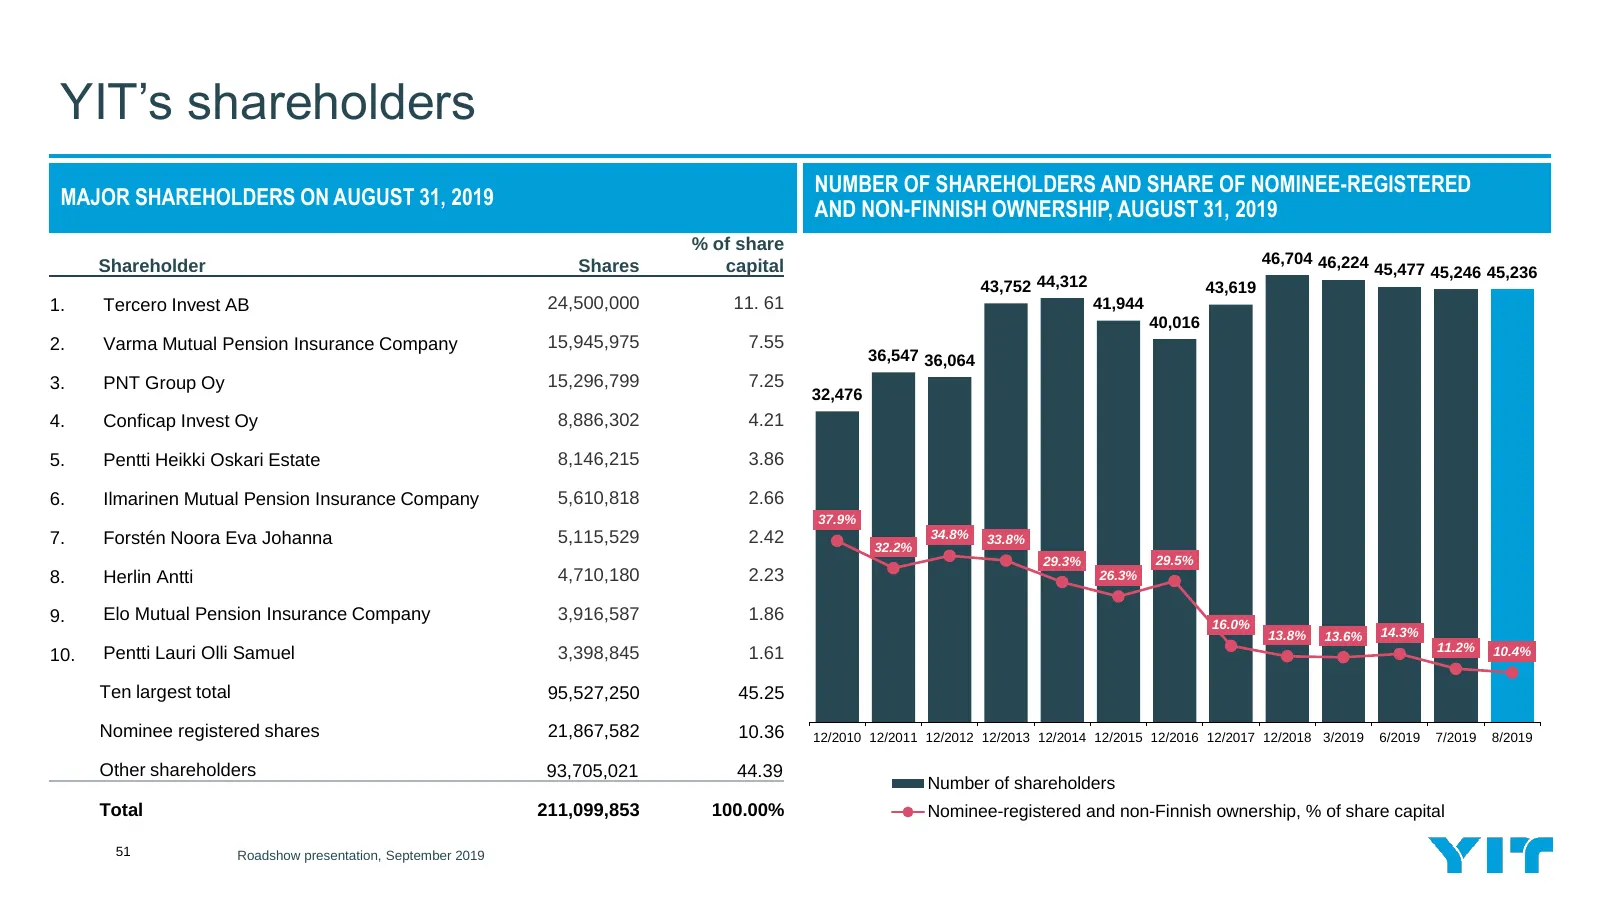
YIT’s shareholders NUMBER OF SHAREHOLDERS AND SHARE OF NOMINEE-REGISTERED MAJOR SHAREHOLDERS ON AUGUST 31, 2019 AND NON-FINNISH OWNERSHIP, AUGUST 31, 2019 % of share Shareholder Shares capital 46,704 46,224 45,477 45,246 45,236 43,752 44,312 43,619 1. Tercero Invest AB 24,500,000 11. 61 41,944 40,01
Slide 52: Board of Directors as of March 12, 2019
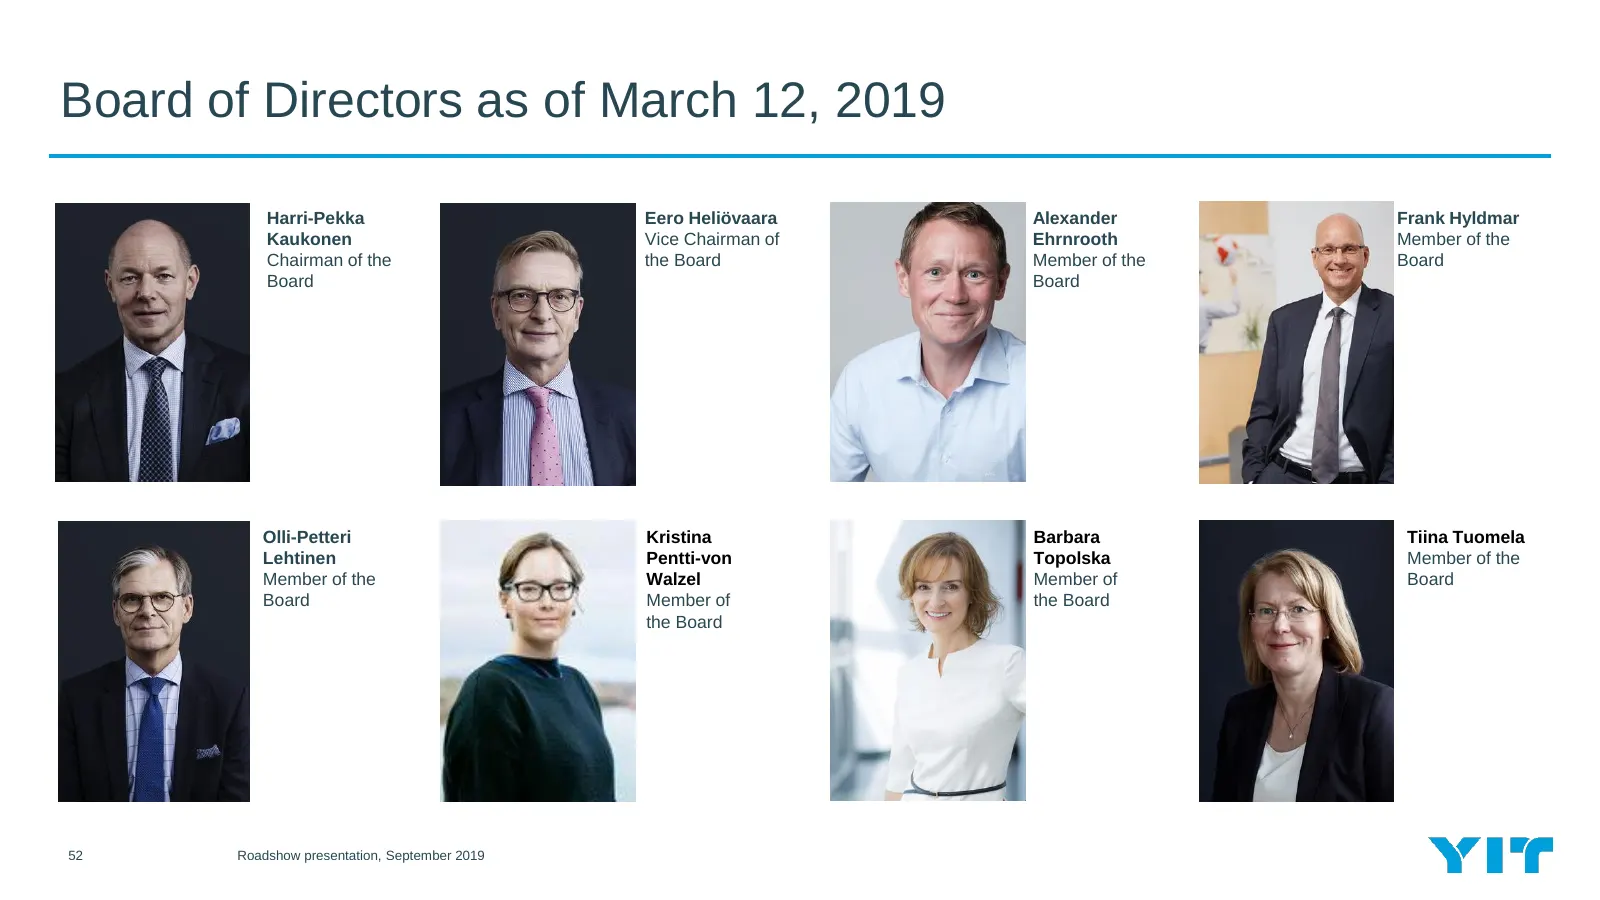
Board of Directors as of March 12, 2019 Harri-Pekka Eero Heliövaara Alexander Frank Hyldmar Kaukonen Vice Chairman of Ehrnrooth Member of the Chairman of the the Board Member of the Board Board Board Olli-Petteri Kristina Barbara Tiina Tuomela Lehtinen Pentti-von Topolska Member of the Member of the
Slide 53: Group Management Team as of November 1, 2018
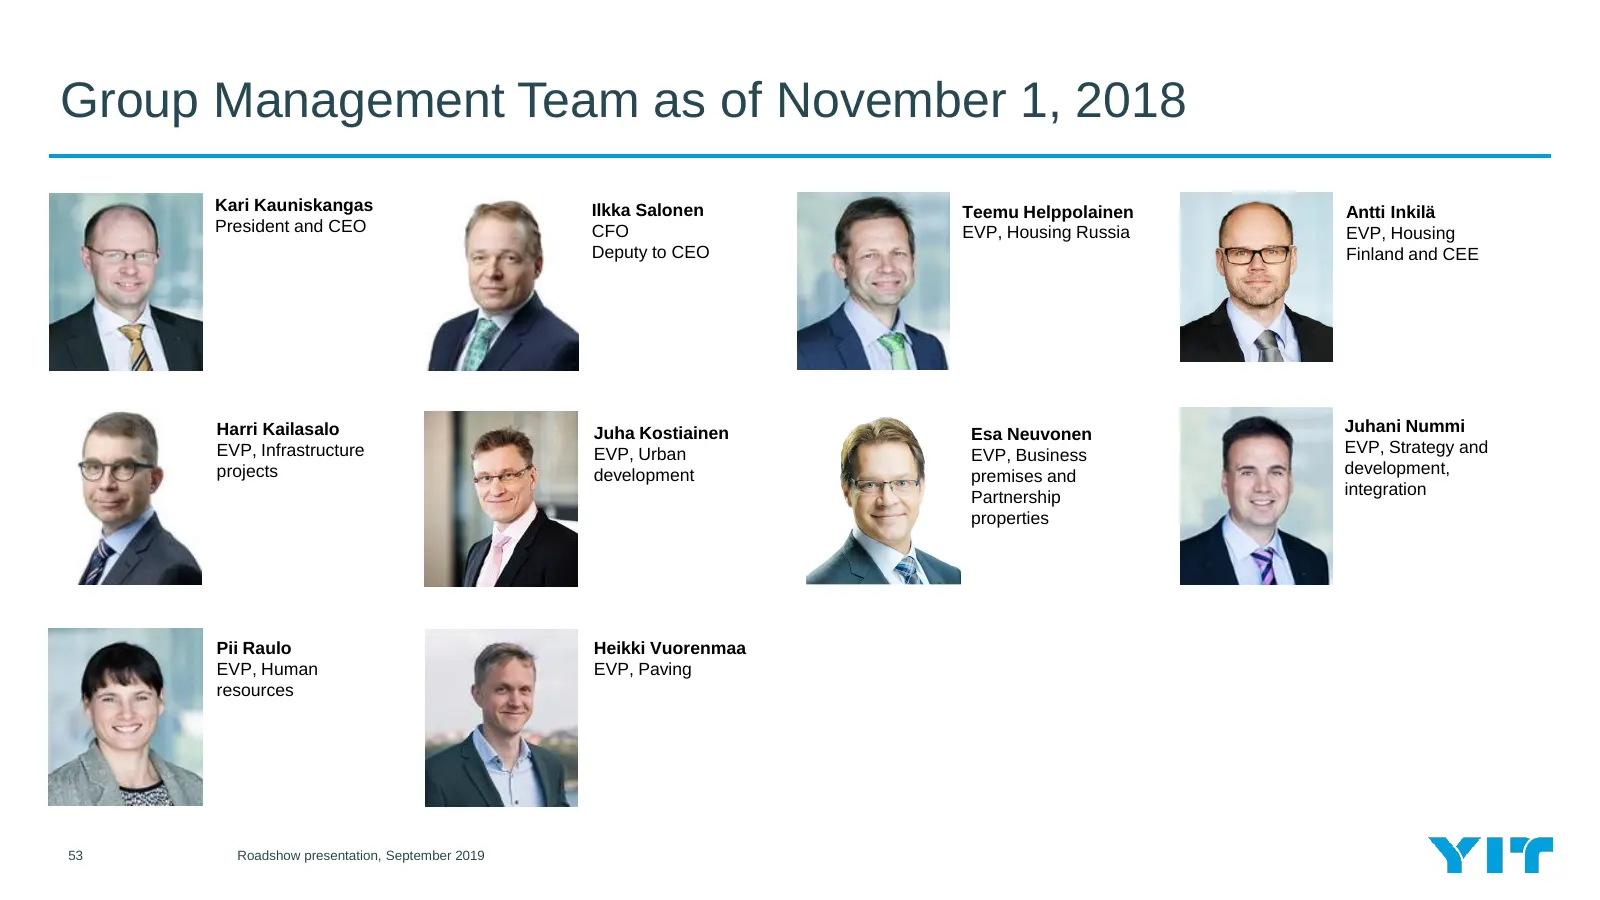
Group Management Team as of November 1, 2018 Kari Kauniskangas Ilkka Salonen Teemu Helppolainen Antti Inkilä President and CEO CFO EVP, Housing Russia EVP, Housing Deputy to CEO Finland and CEE Harri Kailasalo Juha Kostiainen Esa Neuvonen Juhani Nummi EVP, Infrastructure EVP, Urban EVP, Business EVP
Slide 54: The merger of YIT and Lemminkäinen, February 1st 2018
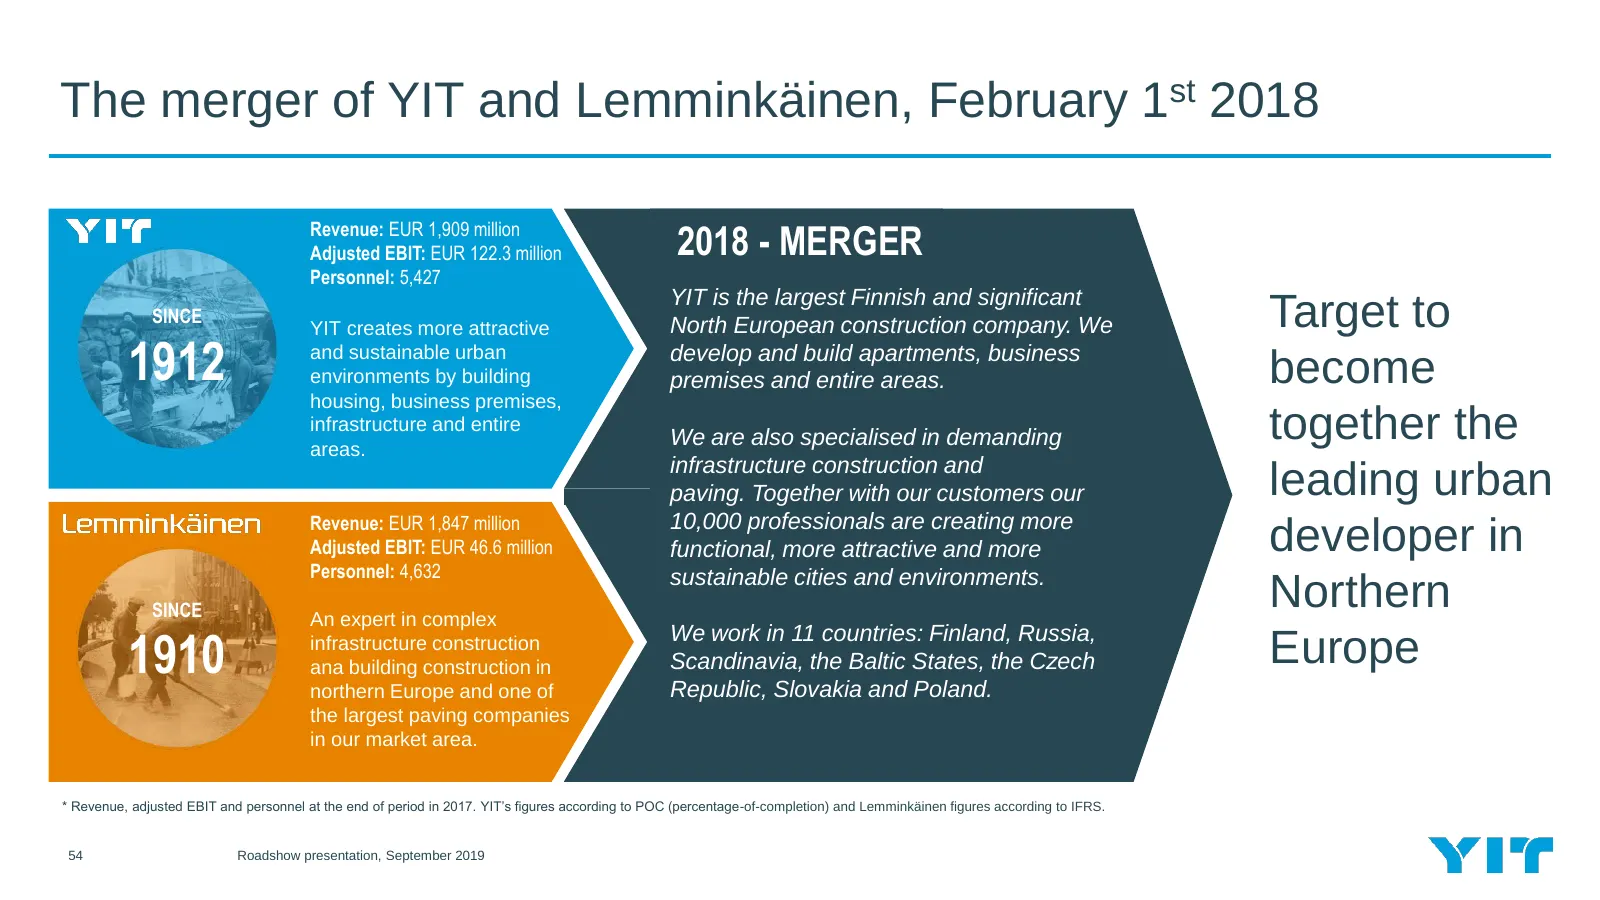
The merger of YIT and Lemminkäinen, February 1st 2018 Revenue: EUR 1,909 million Adjusted EBIT: EUR 122.3 million 2018 - MERGER Personnel: 5,427 YIT is the largest Finnish and significant SINCE YIT creates more attractive North European construction company. We Target to 1912 and sustainable urban e
Slide 55: Dividend payout
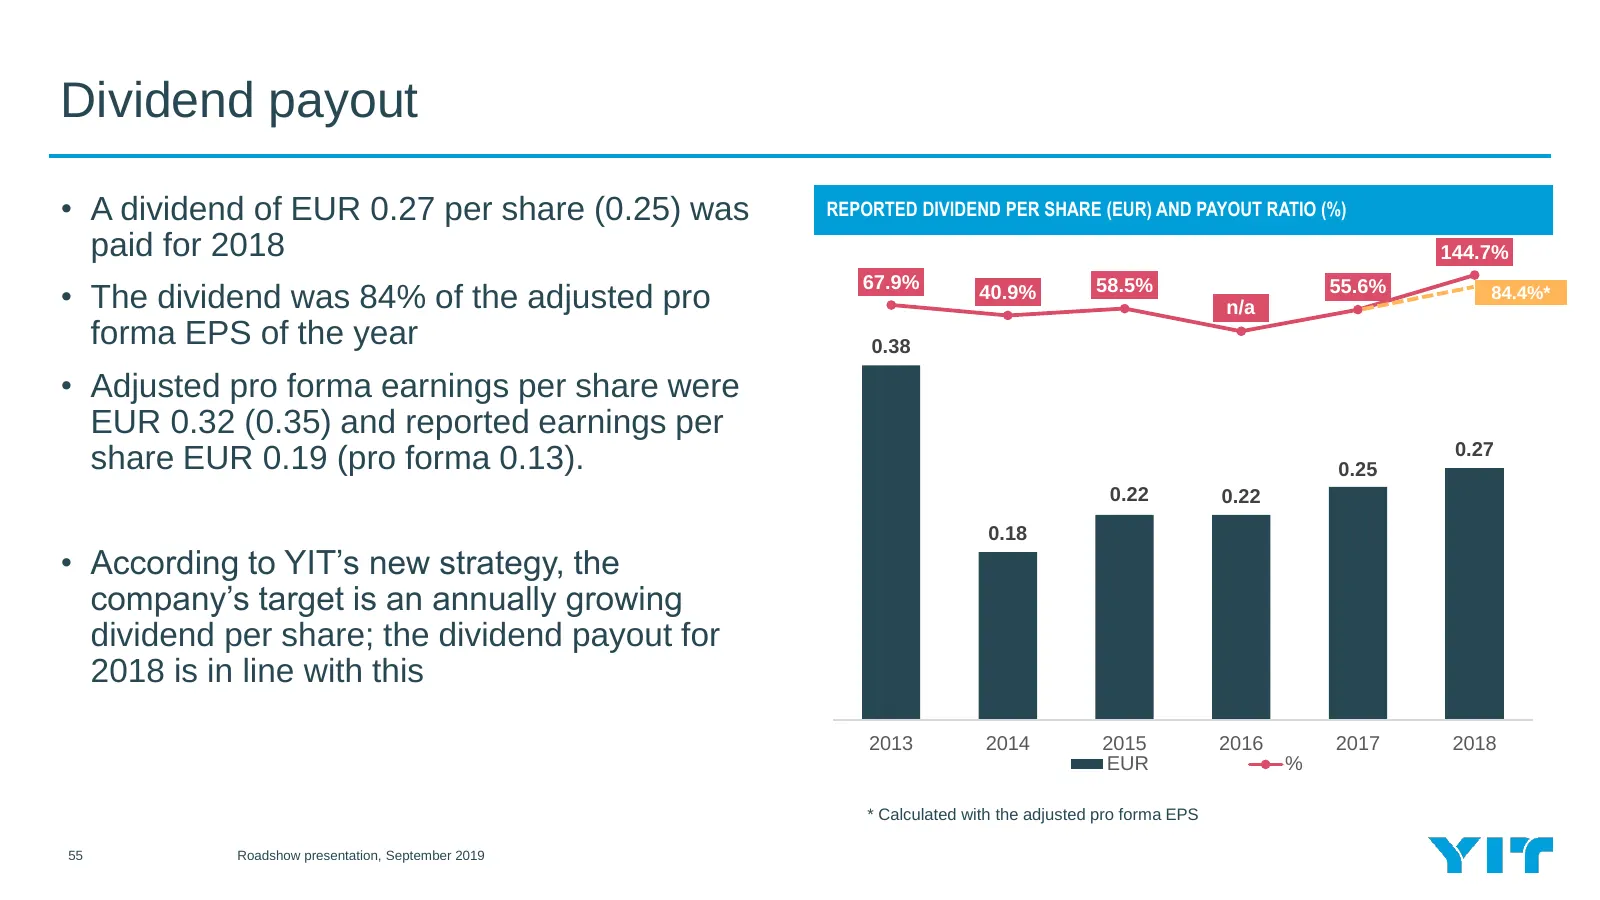
Dividend payout • A dividend of EUR 0.27 per share (0.25) was REPORTED DIVIDEND PER SHARE (EUR) AND PAYOUT RATIO (%) paid for 2018 144.7% 67.9% 58.5% • The dividend was 84% of the adjusted pro 40.9% n/a 0.0% 55.6% 84.4%* forma EPS of the year 0.38 • Adjusted pro forma earnings per share were EUR 0.3

Slide 56: General economic and construction indicators
IV General economic and construction indicators 56 Roadshow presentation, September 2019
Slide 57: General economic and construction indicators
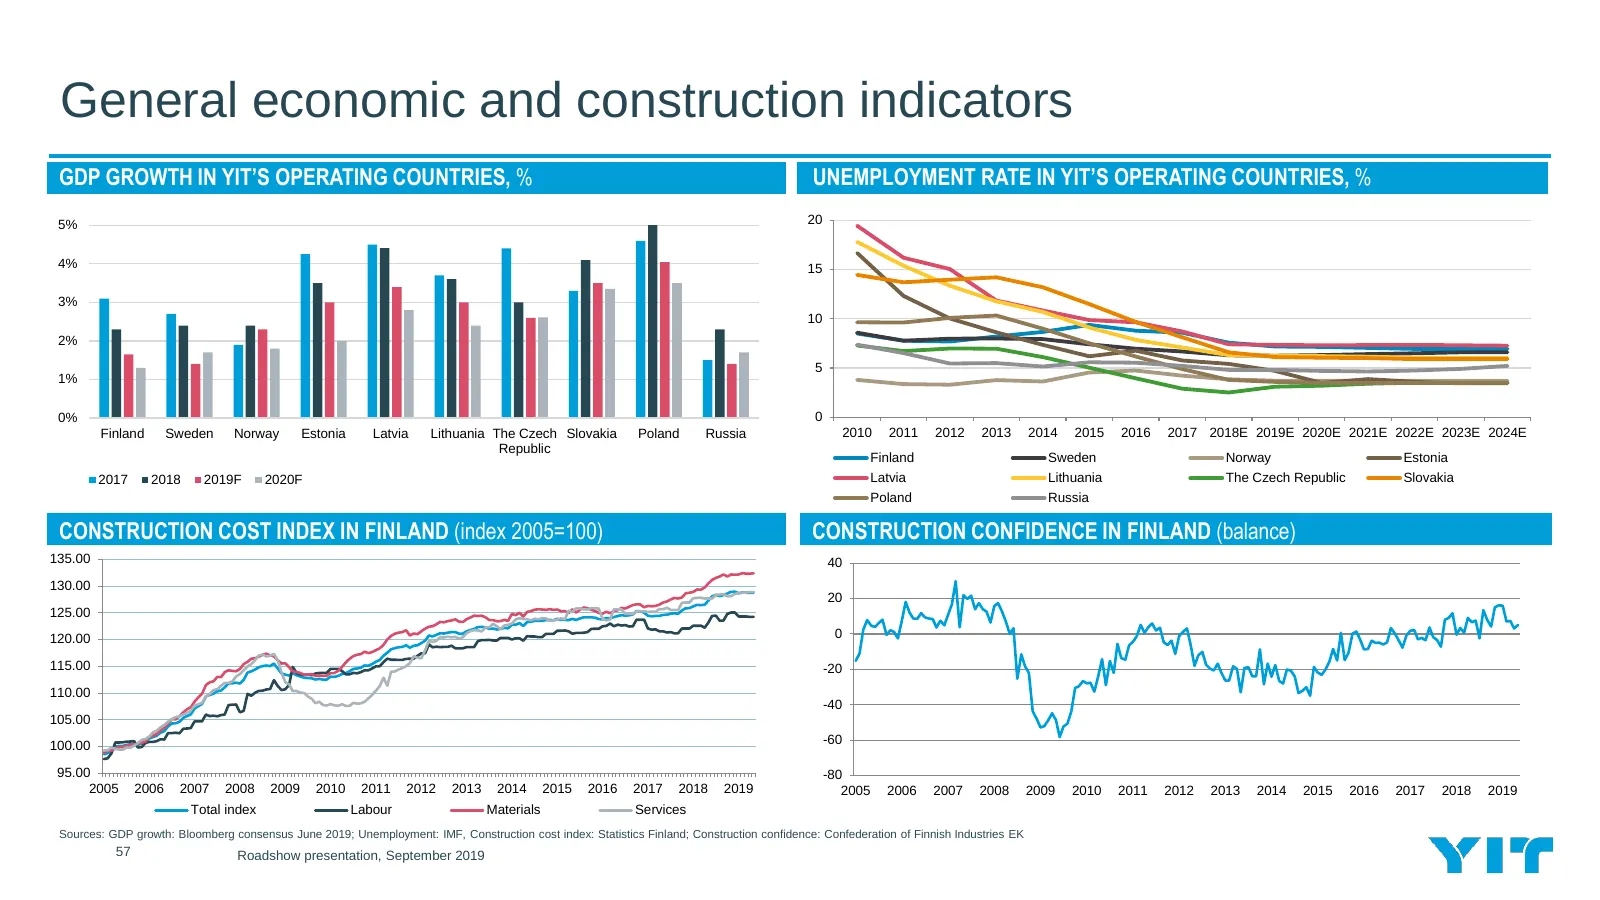
General economic and construction indicators GDP GROWTH IN YIT’S OPERATING COUNTRIES, % UNEMPLOYMENT RATE IN YIT’S OPERATING COUNTRIES, % 5% 20 4% 15 3% 10 2% 5 1% 0% 0 Finland Sweden Norway Estonia Latvia Lithuania The Czech Slovakia Poland Russia 2010 2011 2012 2013 2014 2015 2016 2017 2018E 2019E

Slide 58: Housing indicators
V Housing indicators 58 Roadshow presentation, September 2019
Slide 59: Operating environment for housing in Q2
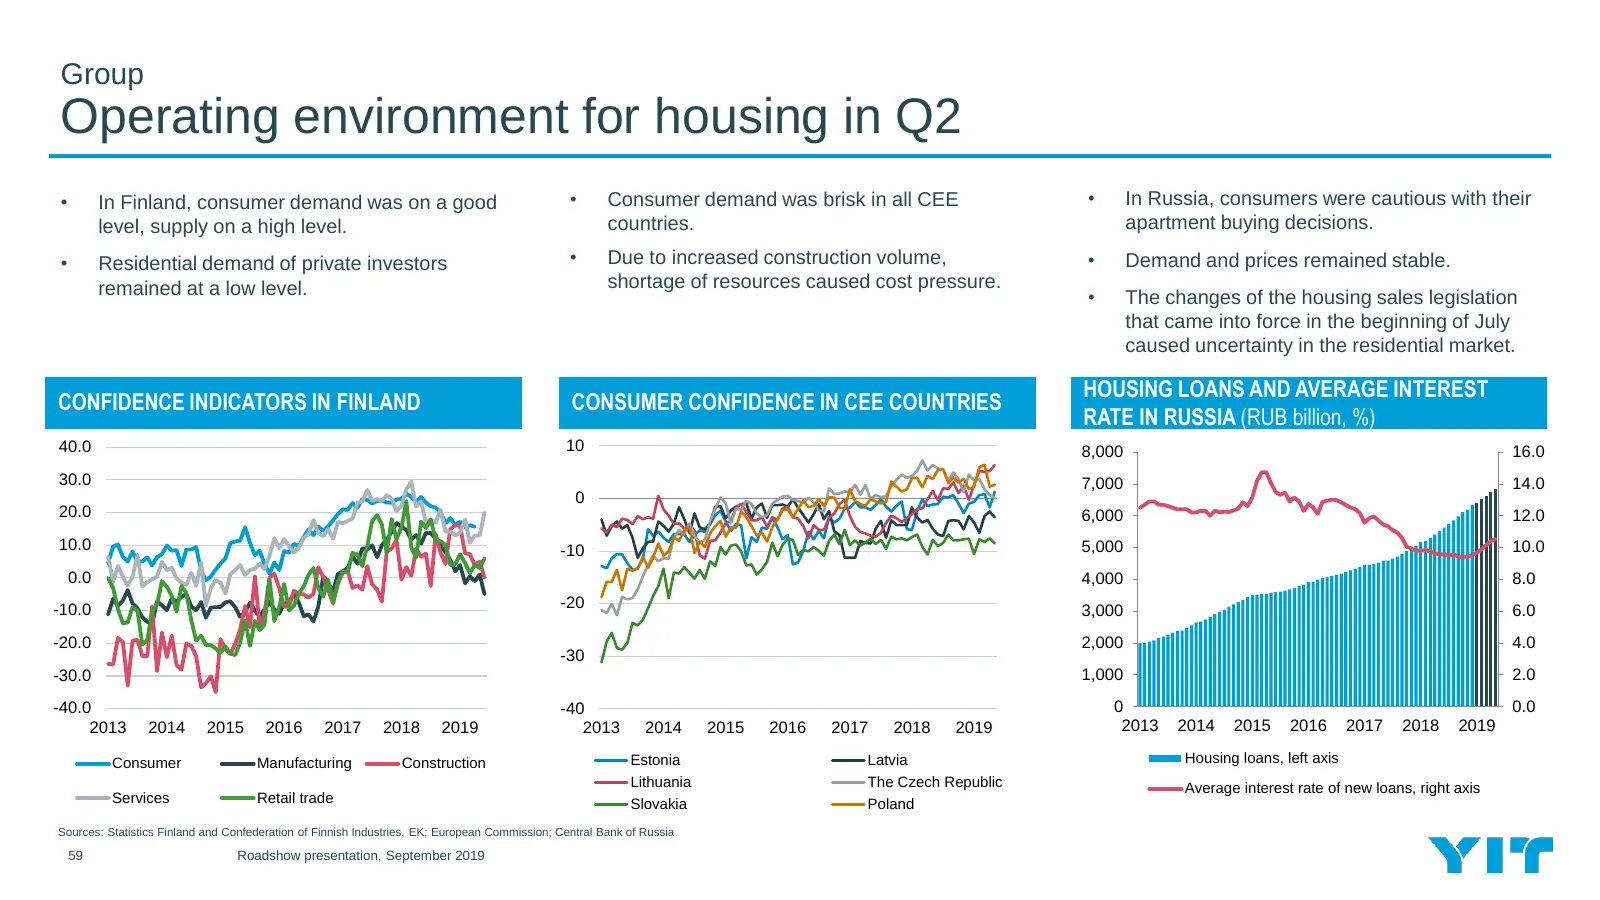
Group Operating environment for housing in Q2 • In Finland, consumer demand was on a good • Consumer demand was brisk in all CEE • In Russia, consumers were cautious with their level, supply on a high level. countries. apartment buying decisions. • Residential demand of private investors • Due to in
Slide 60: Finland: Start-ups expected to decrease in 2020
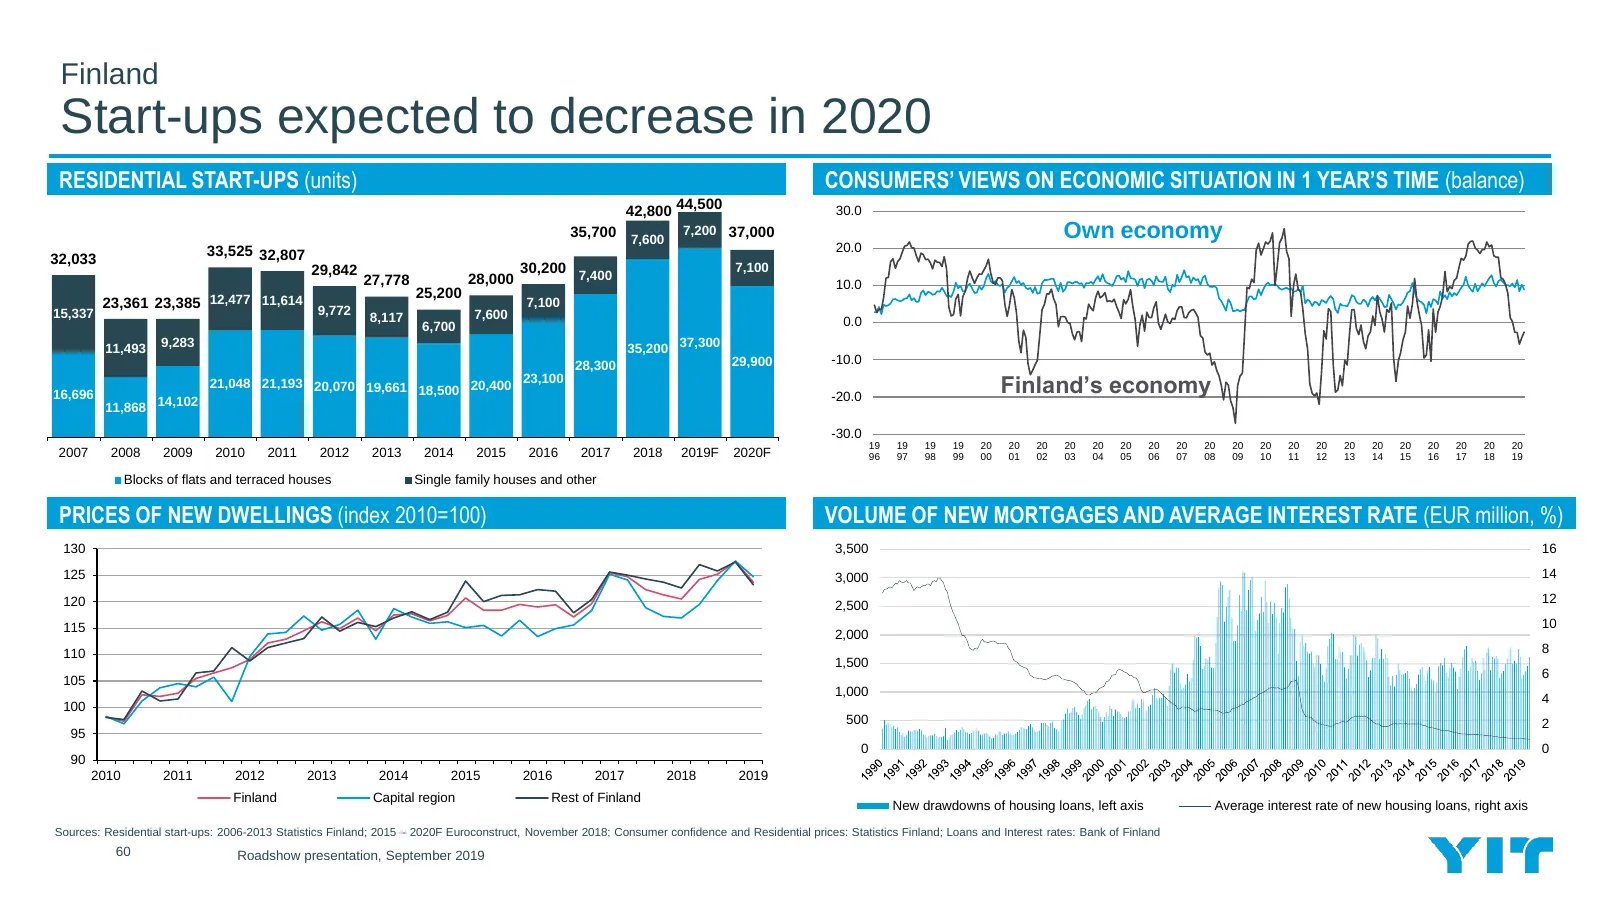
Finland Start-ups expected to decrease in 2020 RESIDENTIAL START-UPS (units) CONSUMERS’ VIEWS ON ECONOMIC SITUATION IN 1 YEAR’S TIME (balance) 44,500 30.0 42,800 35,700 7,600 7,200 37,000 Own economy 33,525 32,807 20.0 32,033 29,842 30,200 7,400 7,100 27,778 28,000 10.0 25,200 23,361 23,385 12,477 1
Slide 61: Construction indicators
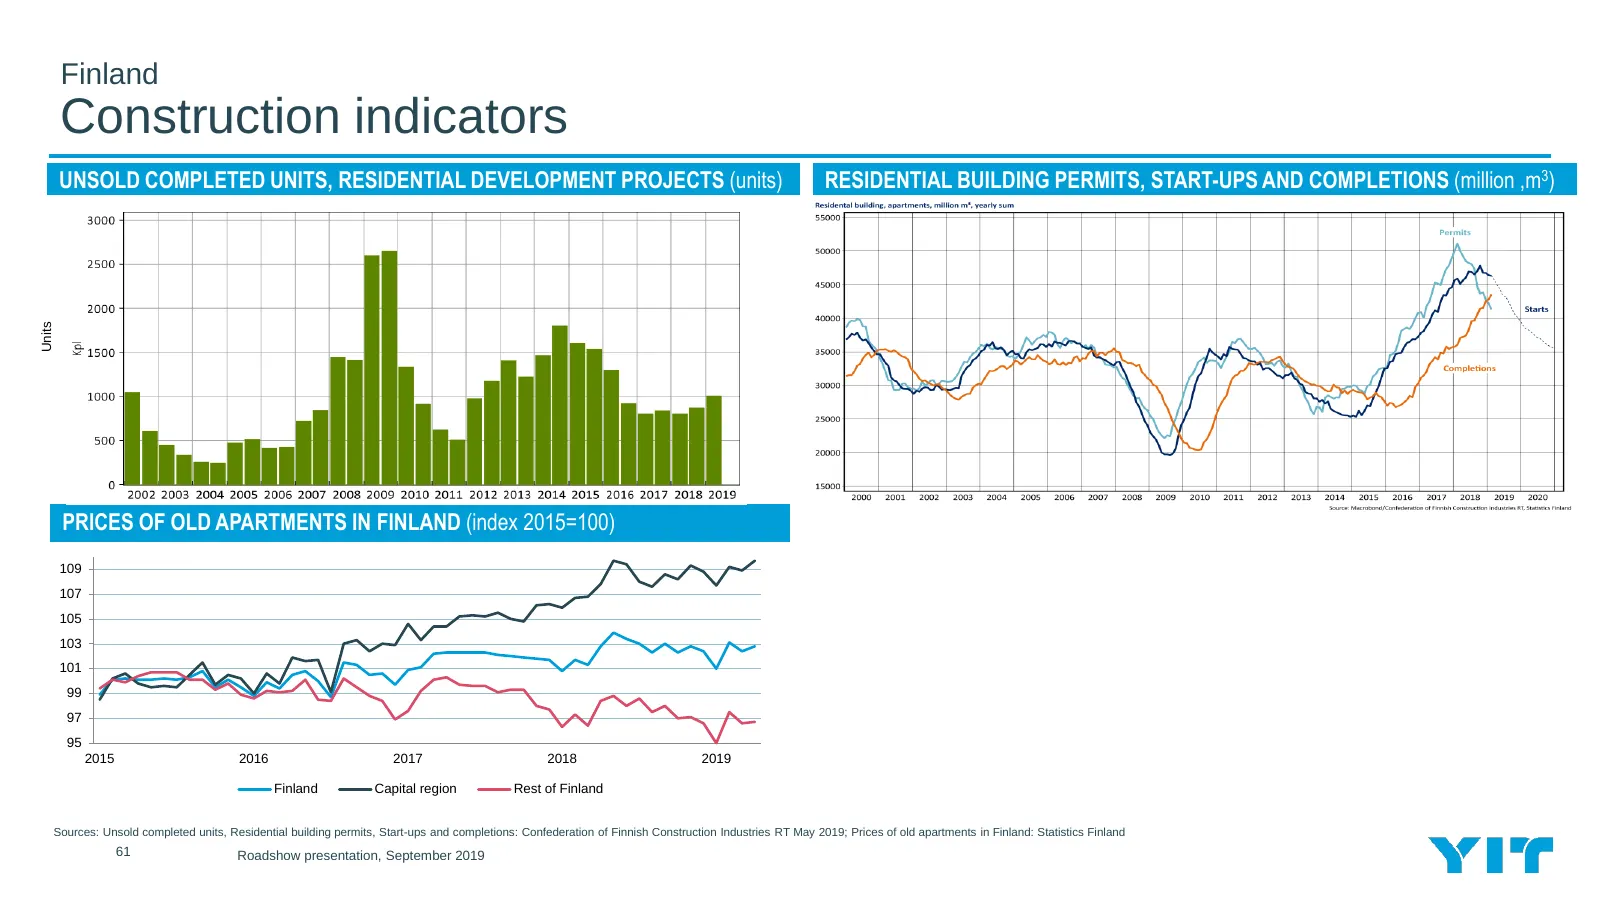
Finland Construction indicators UNSOLD COMPLETED UNITS, RESIDENTIAL DEVELOPMENT PROJECTS (units) RESIDENTIAL BUILDING PERMITS, START-UPS AND COMPLETIONS (million ,m3) Units PRICES OF OLD APARTMENTS IN FINLAND (index 2015=100) 109 107 105 103 101 99 97 95 2015 2016 2017 2018 2019 Finland Capital regi
Slide 62: Operating environment in CEE
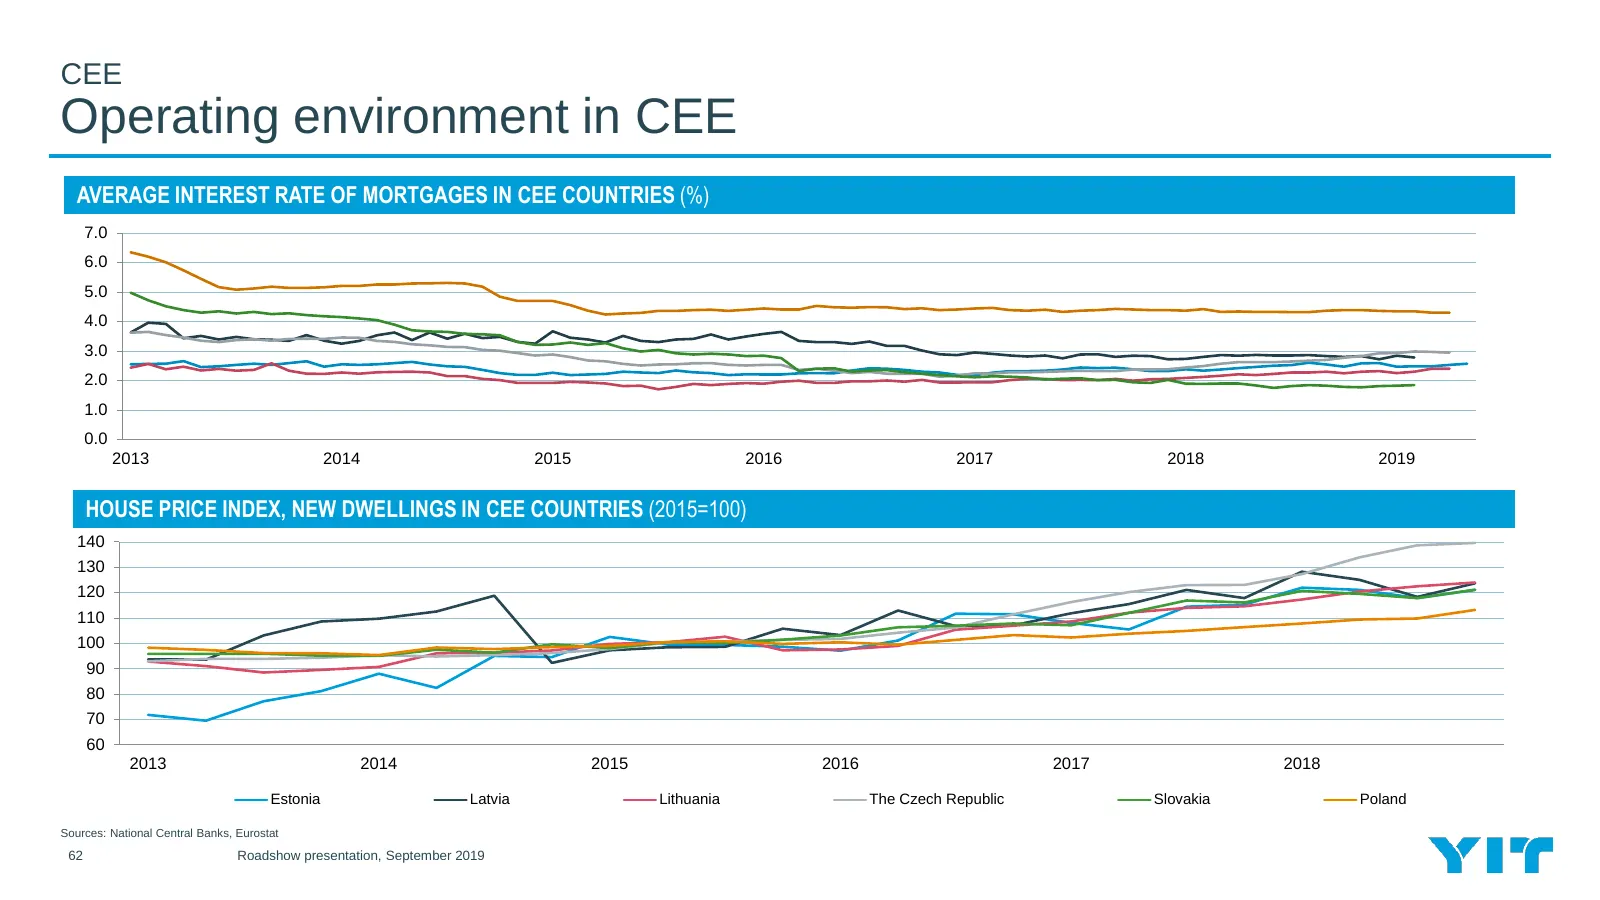
CEE Operating environment in CEE AVERAGE INTEREST RATE OF MORTGAGES IN CEE COUNTRIES (%) 7.0 6.0 5.0 4.0 3.0 2.0 1.0 0.0 2013 2014 2015 2016 2017 2018 2019 HOUSE PRICE INDEX, NEW DWELLINGS IN CEE COUNTRIES (2015=100) 140 130 120 110 100 90 80 70 60 2013 2014 2015 2016 2017 2018 Estonia Latvia Lithua
Slide 63: Residential construction expected to level off
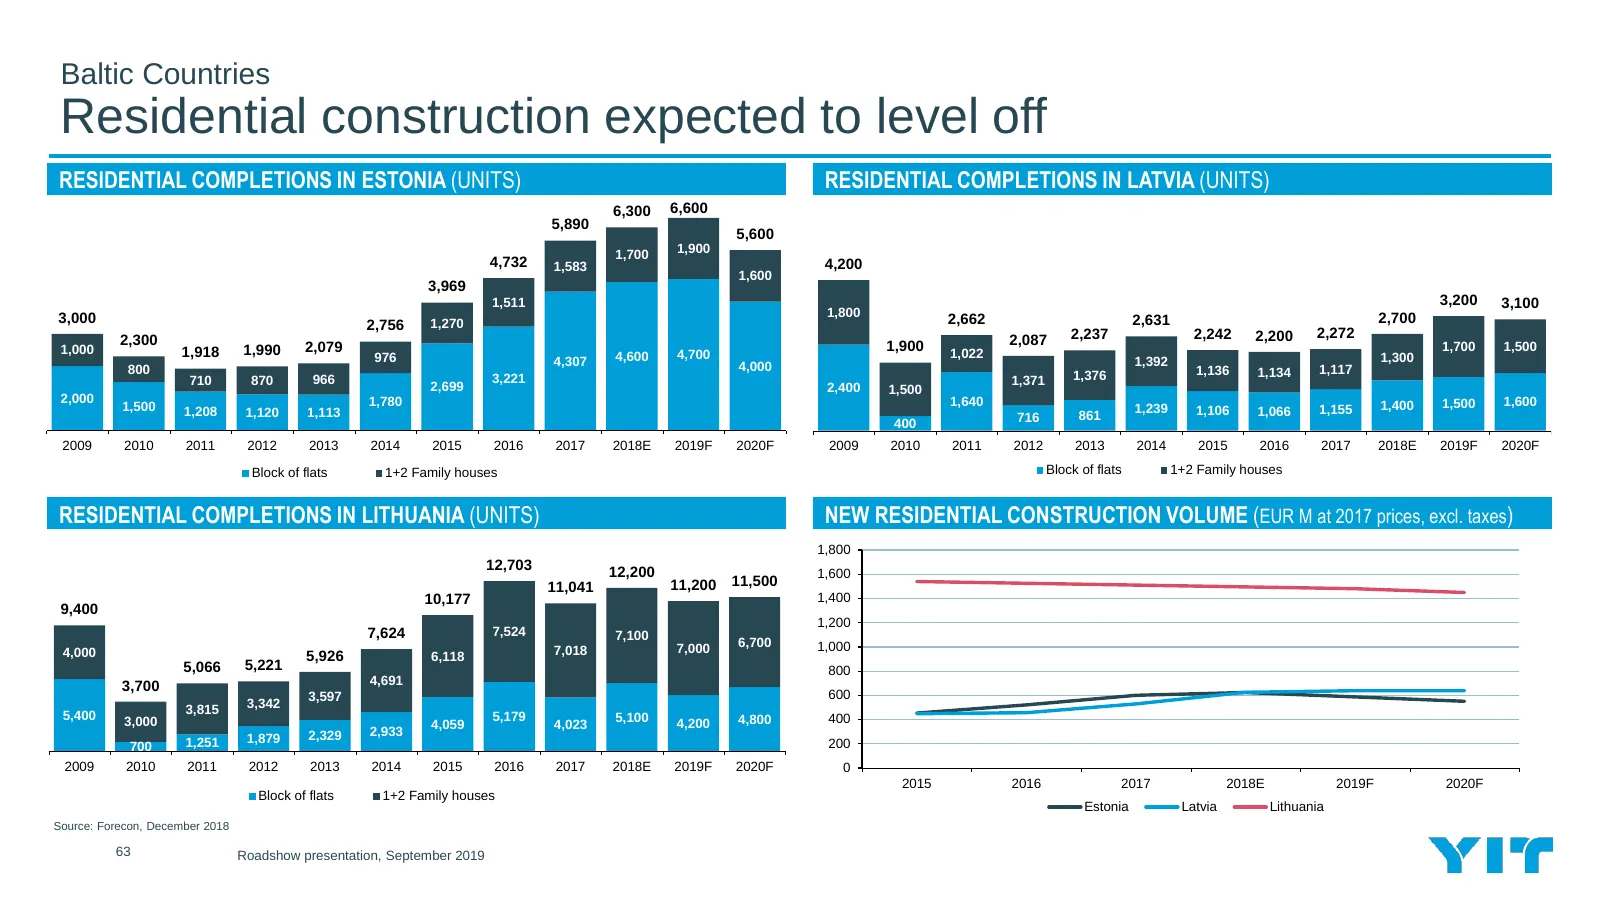
Baltic Countries Residential construction expected to level off RESIDENTIAL COMPLETIONS IN ESTONIA (UNITS) RESIDENTIAL COMPLETIONS IN LATVIA (UNITS) 6,300 6,600 5,890 5,600 1,700 1,900 4,732 1,583 4,200 1,600 3,969 1,511 3,200 3,100 3,000 1,800 2,700 2,756 1,270 2,662 2,631 2,300 2,087 2,237 2,242 2
Slide 64: Start-ups forecasted to grow in the Czech Republic
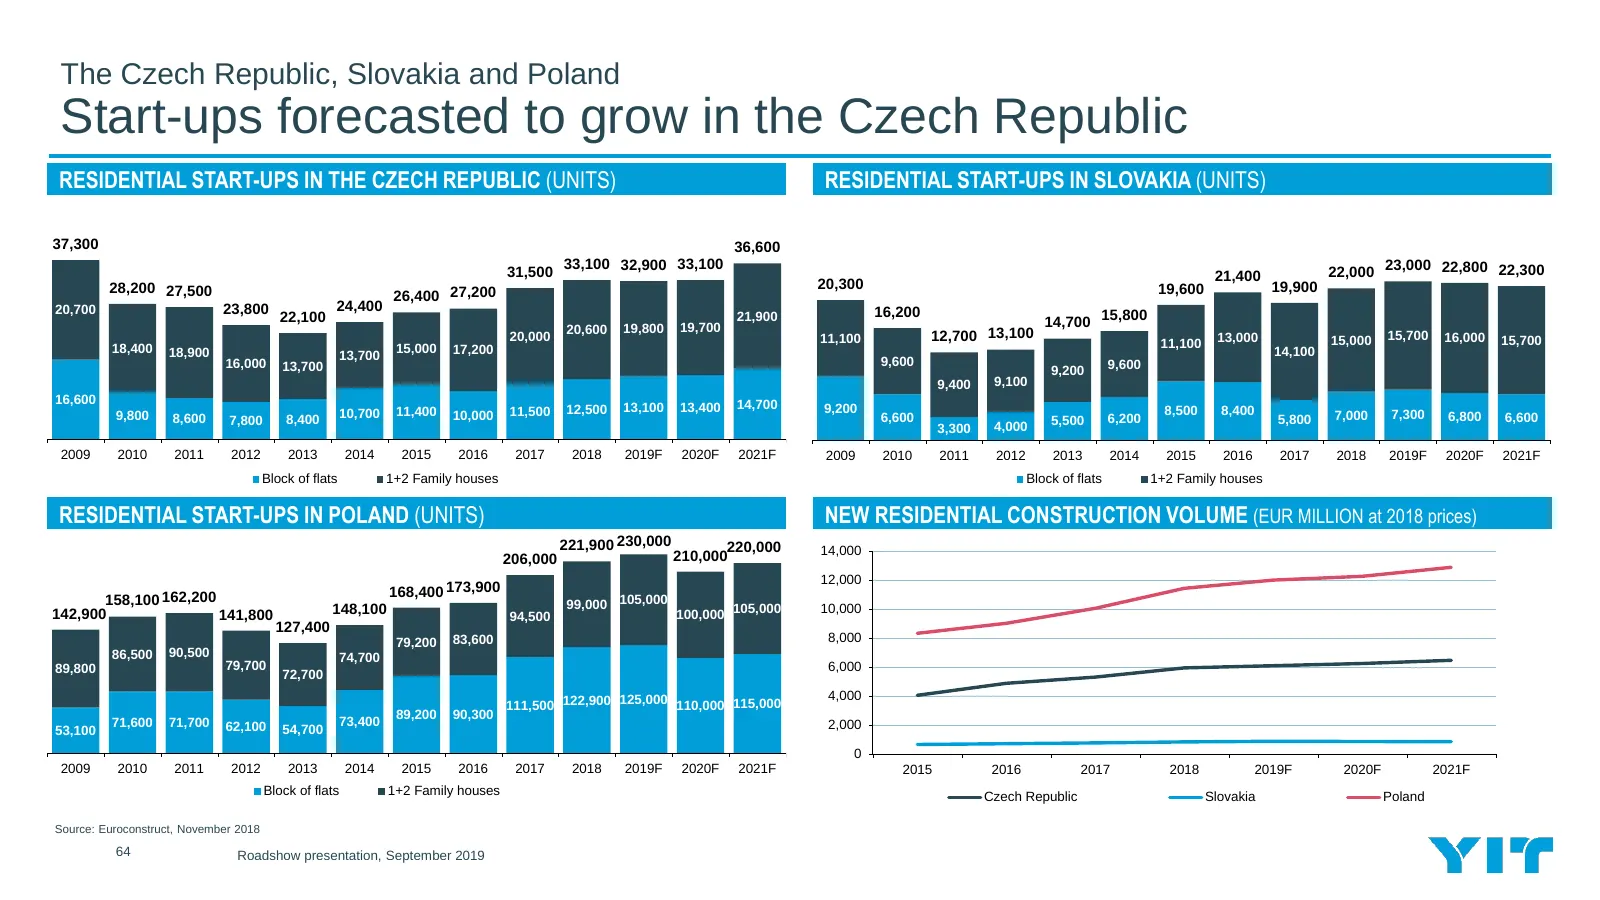
The Czech Republic, Slovakia and Poland Start-ups forecasted to grow in the Czech Republic RESIDENTIAL START-UPS IN THE CZECH REPUBLIC (UNITS) RESIDENTIAL START-UPS IN SLOVAKIA (UNITS) 37,300 36,600 33,100 32,900 33,100 31,500 21,400 22,000 23,000 22,800 22,300 28,200 27,500 20,300 19,600 19,900 26,
Slide 65: EUR/RUB exchange rate and housing indicators
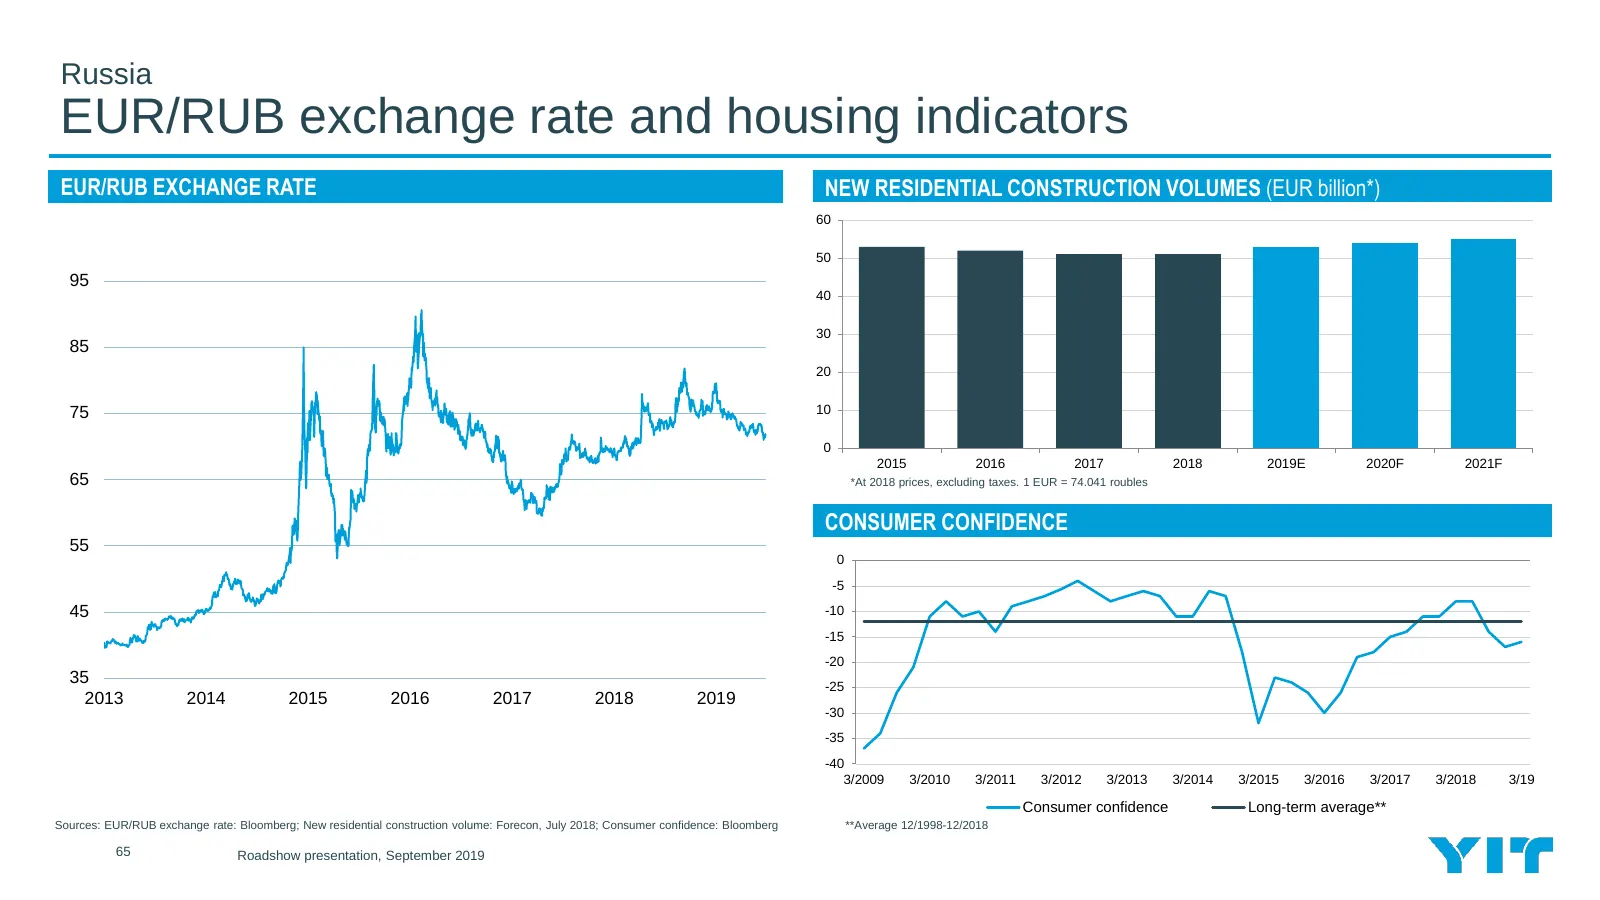
Russia EUR/RUB exchange rate and housing indicators EUR/RUB EXCHANGE RATE NEW RESIDENTIAL CONSTRUCTION VOLUMES (EUR billion*) 60 50 95 40 30 85 20 75 10 0 2015 2016 2017 2018 2019E 2020F 2021F 65 *At 2018 prices, excluding taxes. 1 EUR = 74.041 roubles CONSUMER CONFIDENCE 55 0 -5 45 -10 -15 -20 35 -

Slide 66: Business premises, infrastructure and paving indicators
VI Business premises, infrastructure and paving indicators 66 Roadshow presentation, September 2019
Slide 67: Operating environment for business premises and infrastructure projects in Q2
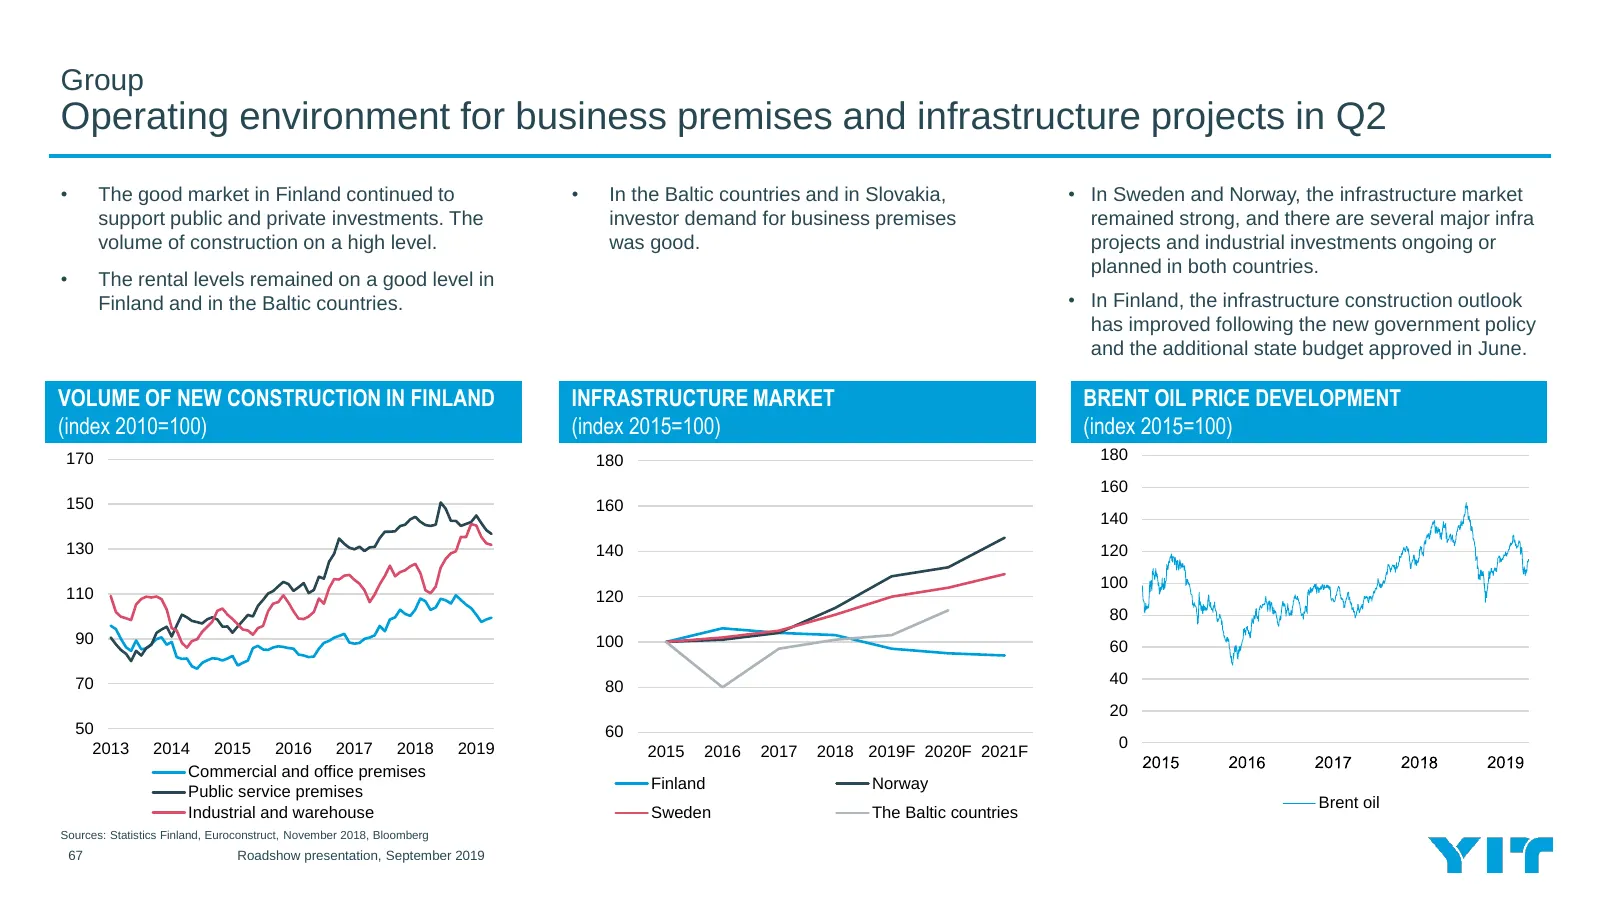
Group Operating environment for business premises and infrastructure projects in Q2 • The good market in Finland continued to • In the Baltic countries and in Slovakia, • In Sweden and Norway, the infrastructure market support public and private investments. The investor demand for business premises
Slide 68: Infrastructure and business premises operating environment
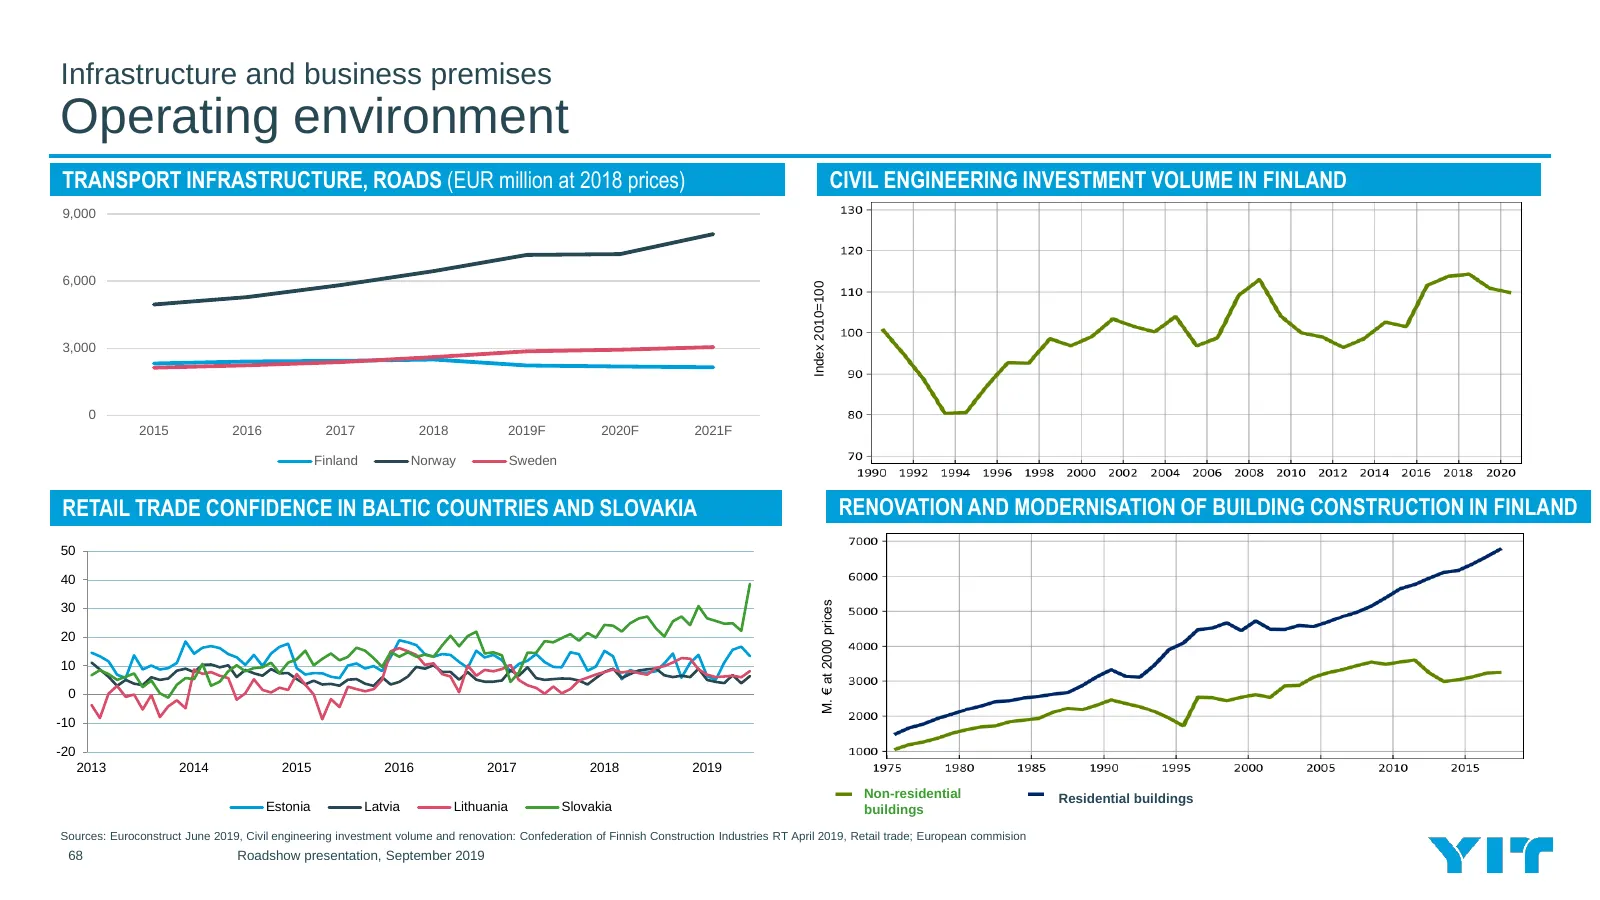
Infrastructure and business premises Operating environment TRANSPORT INFRASTRUCTURE, ROADS (EUR million at 2018 prices) CIVIL ENGINEERING INVESTMENT VOLUME IN FINLAND 9,000 6,000 Index 2010=100 3,000 0 2015 2016 2017 2018 2019F 2020F 2021F Finland Norway Sweden RETAIL TRADE CONFIDENCE IN BALTIC COUN
Slide 69: Non-residential construction volumes
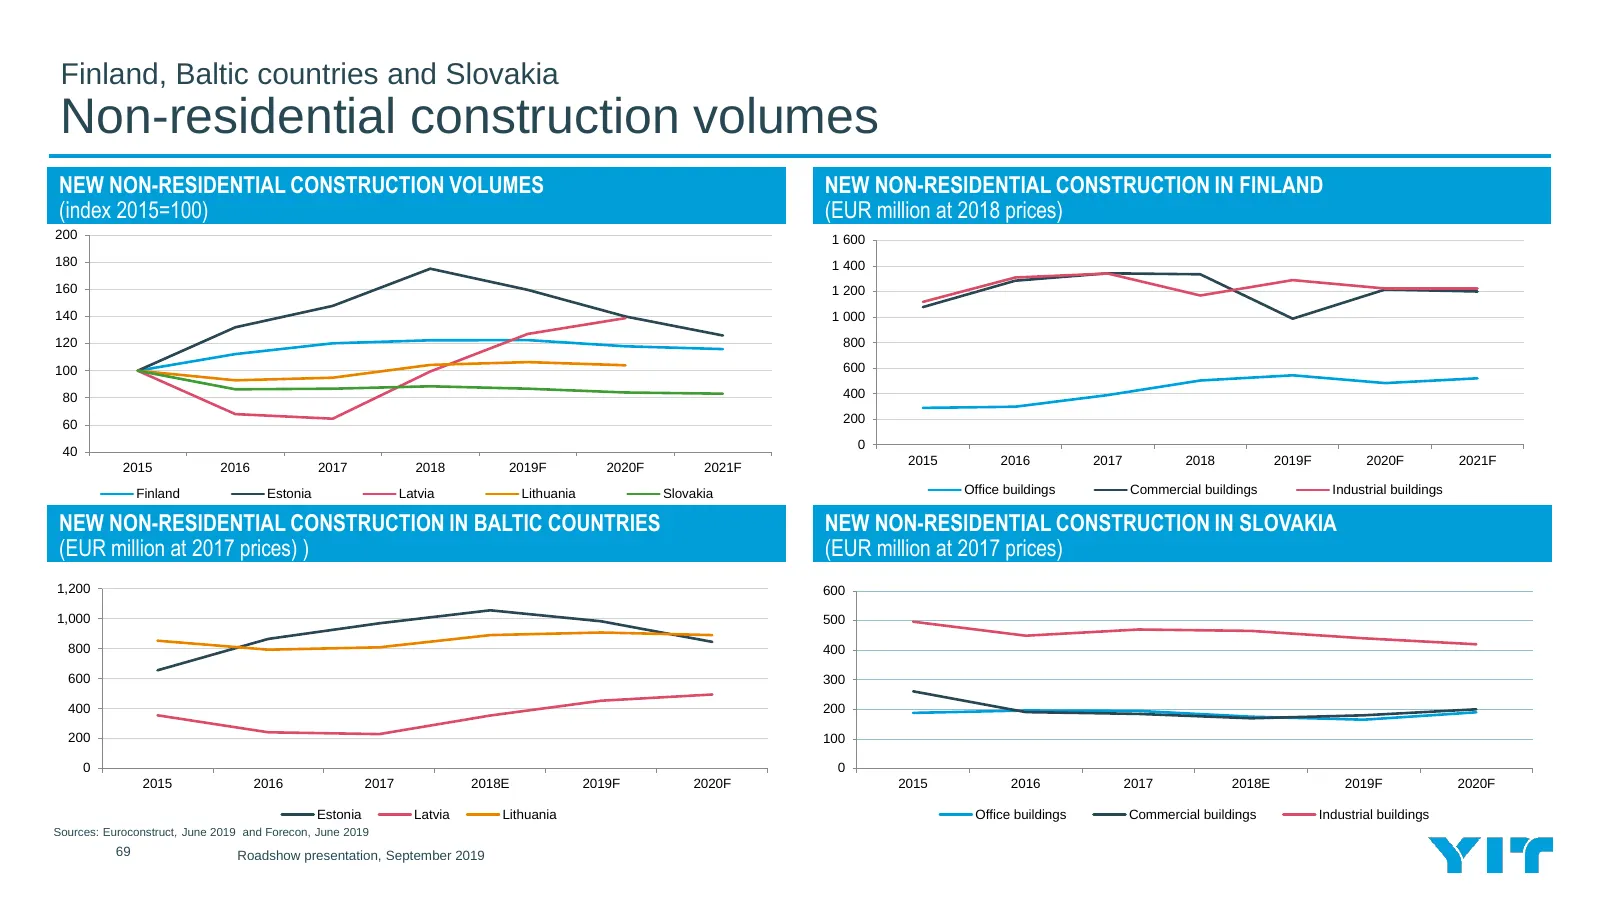
Finland, Baltic countries and Slovakia Non-residential construction volumes NEW NON-RESIDENTIAL CONSTRUCTION VOLUMES NEW NON-RESIDENTIAL CONSTRUCTION IN FINLAND (index 2015=100) (EUR million at 2018 prices) 200 1 600 180 1 400 160 1 200 140 1 000 120 800 100 600 80 400 60 200 0 40 2015 2016 2017 201
Slide 70: Yields and transaction volumes in Finland
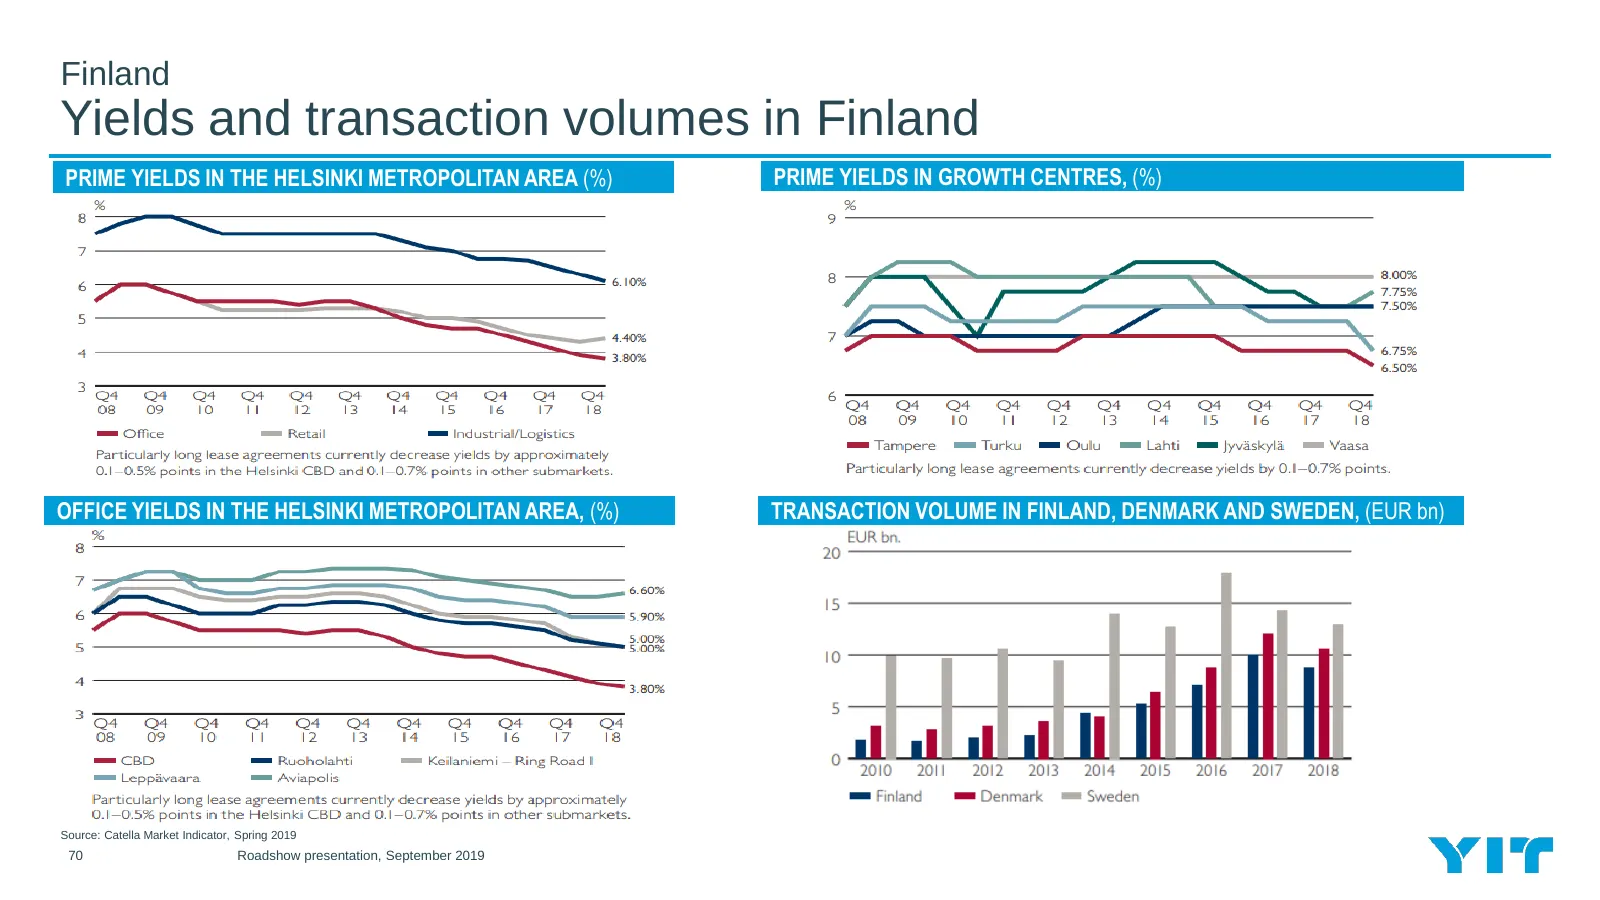
Finland Yields and transaction volumes in Finland PRIME YIELDS IN THE HELSINKI METROPOLITAN AREA (%) PRIME YIELDS IN GROWTH CENTRES, (%) OFFICE YIELDS IN THE HELSINKI METROPOLITAN AREA, (%) TRANSACTION VOLUME IN FINLAND, DENMARK AND SWEDEN, (EUR bn) Source: Catella Market Indicator, Spring 2019 70 R
Slide 71: Yields expected to decrease slightly
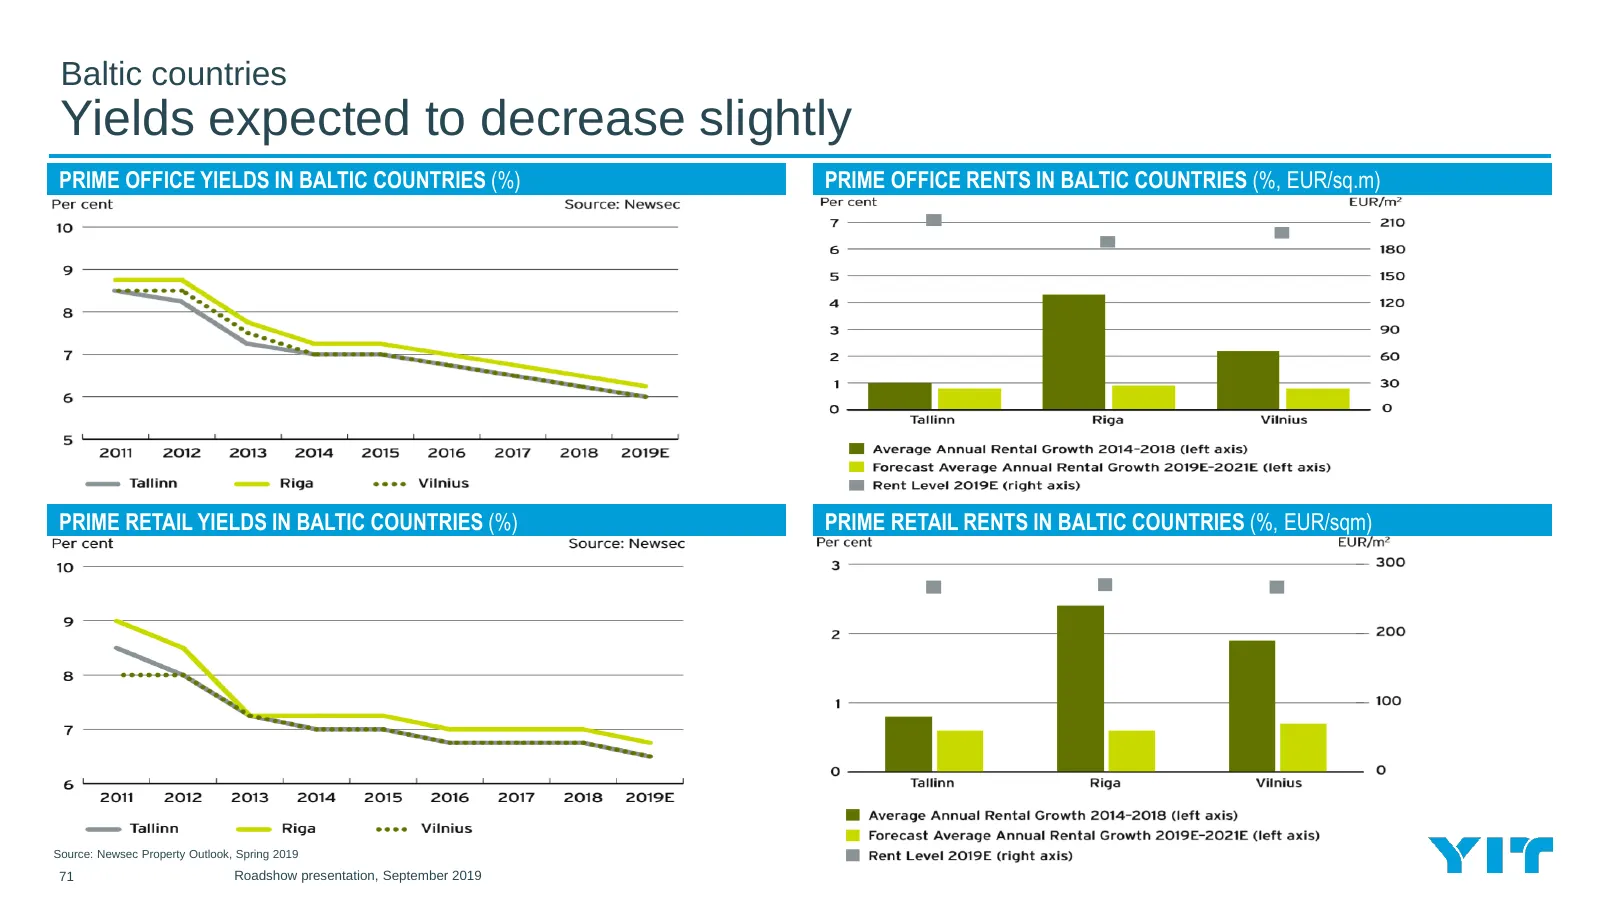
Baltic countries Yields expected to decrease slightly PRIME OFFICE YIELDS IN BALTIC COUNTRIES (%) PRIME OFFICE RENTS IN BALTIC COUNTRIES (%, EUR/sq.m) PRIME RETAIL YIELDS IN BALTIC COUNTRIES (%) PRIME RETAIL RENTS IN BALTIC COUNTRIES (%, EUR/sqm) Source: Newsec Property Outlook, Spring 2019 71 Roads
Slide 72: Additional information
Additional information Ilkka Salonen Chief Financial Officer +358 45 359 4434 ilkka.salonen@yit.fi Tiina Kuusisaari Manager, Investor Relations +358 40 52 88 154 tiina.kuusisaari@yit.fi Follow YIT on Twitter @YITInvestors 72 Roadshow presentation, September 2019
Slide 73: We are the largest Finnish and a significant North European construction company
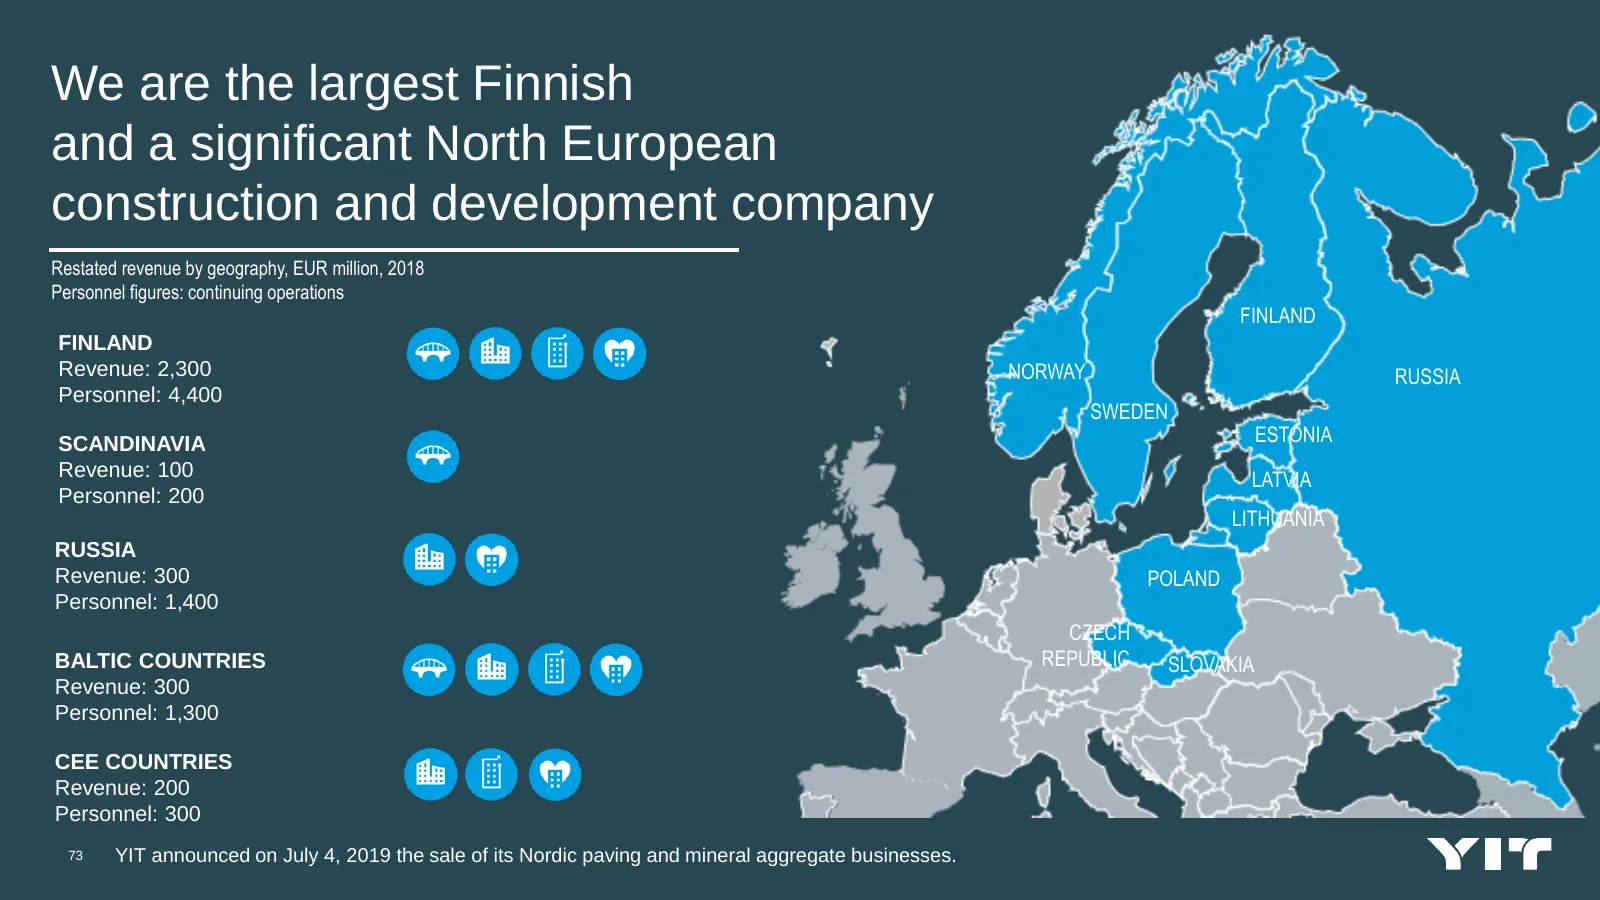
We are the largest Finnish and a significant North European construction and development company Restated revenue by geography, EUR million, 2018 Personnel figures: continuing operations FINLAND FINLAND Revenue: 2,300 NORWAY RUSSIA Personnel: 4,400 SWEDEN SCANDINAVIA ESTONIA Revenue: 100 LATVIA Pers
Slide 74: Examples of urban development projects
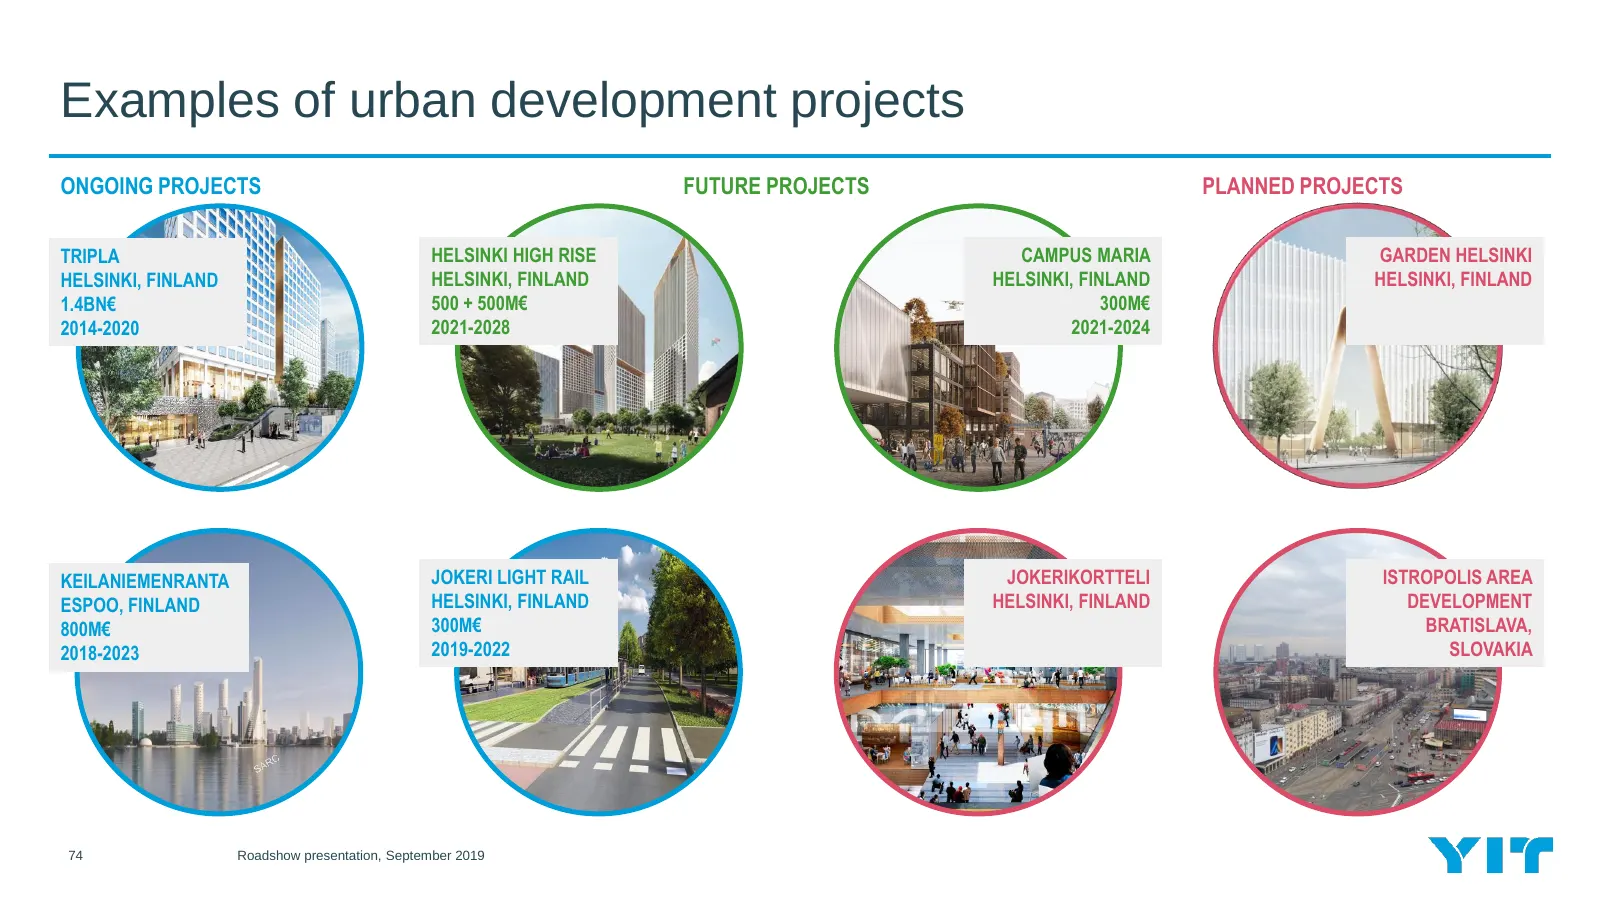
Examples of urban development projects ONGOING PROJECTS FUTURE PROJECTS PLANNED PROJECTS TRIPLA HELSINKI HIGH RISE CAMPUS MARIA GARDEN HELSINKI HELSINKI, FINLAND HELSINKI, FINLAND HELSINKI, FINLAND HELSINKI, FINLAND 1.4BN€ 500 + 500M€ 300M€ 2014-2020 2021-2028 2021-2024 KEILANIEMENRANTA JOKERI LIGHT
Slide 75: Implementation through strategic development programmes
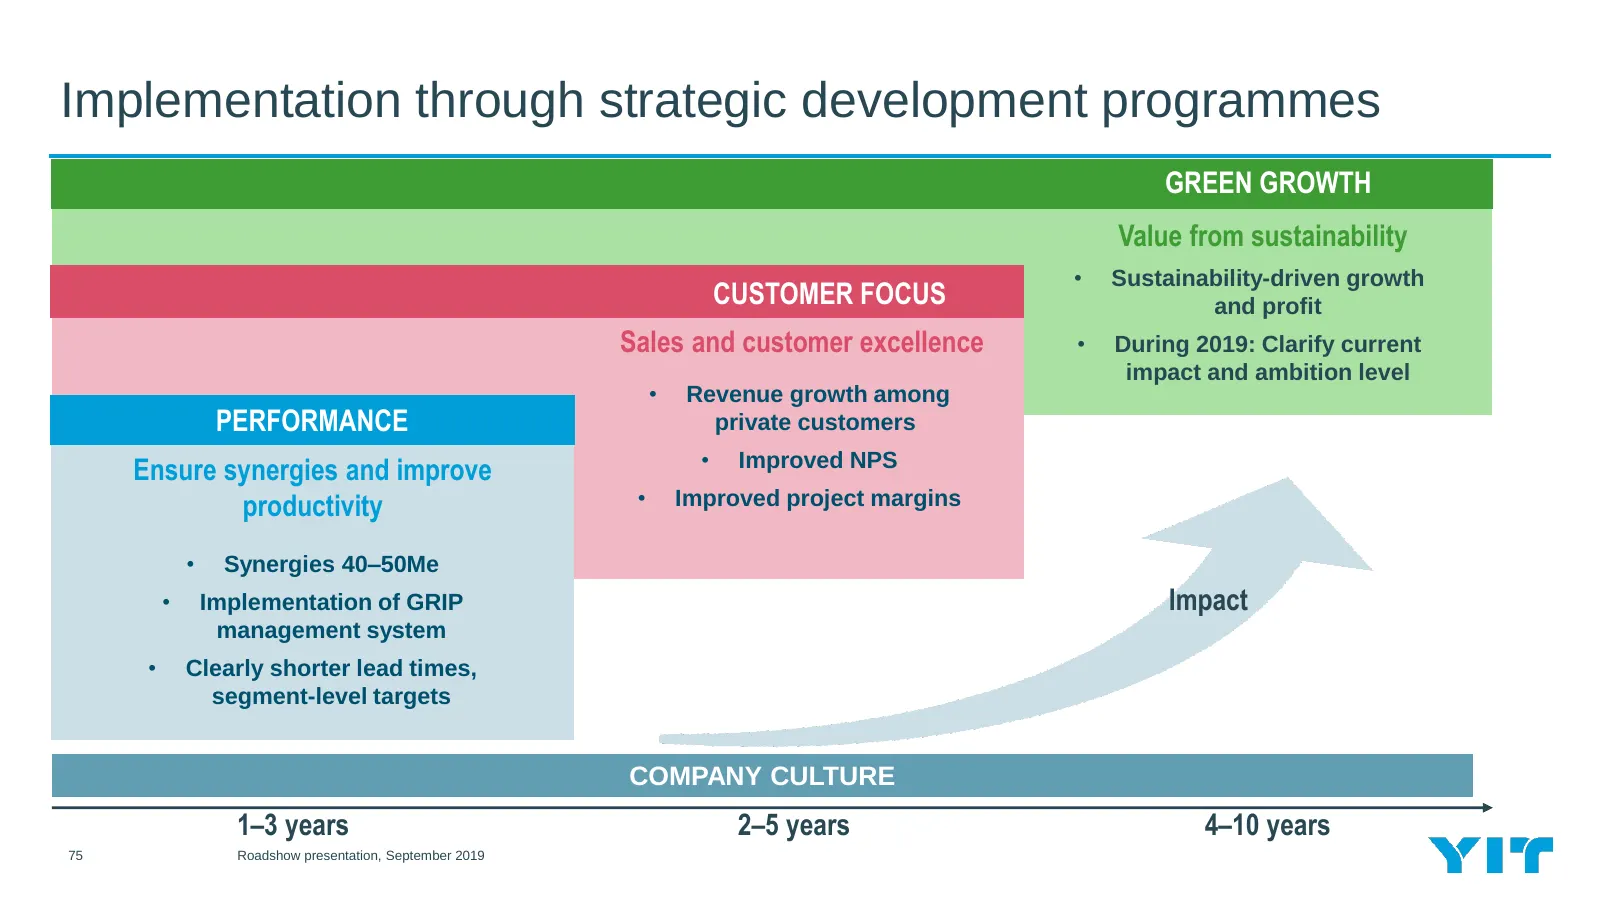
Implementation through strategic development programmes GREEN GROWTH Value from sustainability • Sustainability-driven growth CUSTOMER FOCUS and profit Sales and customer excellence • During 2019: Clarify current impact and ambition level • Revenue growth among PERFORMANCE private customers • Improv
Slide 76: Key elements of YIT culture
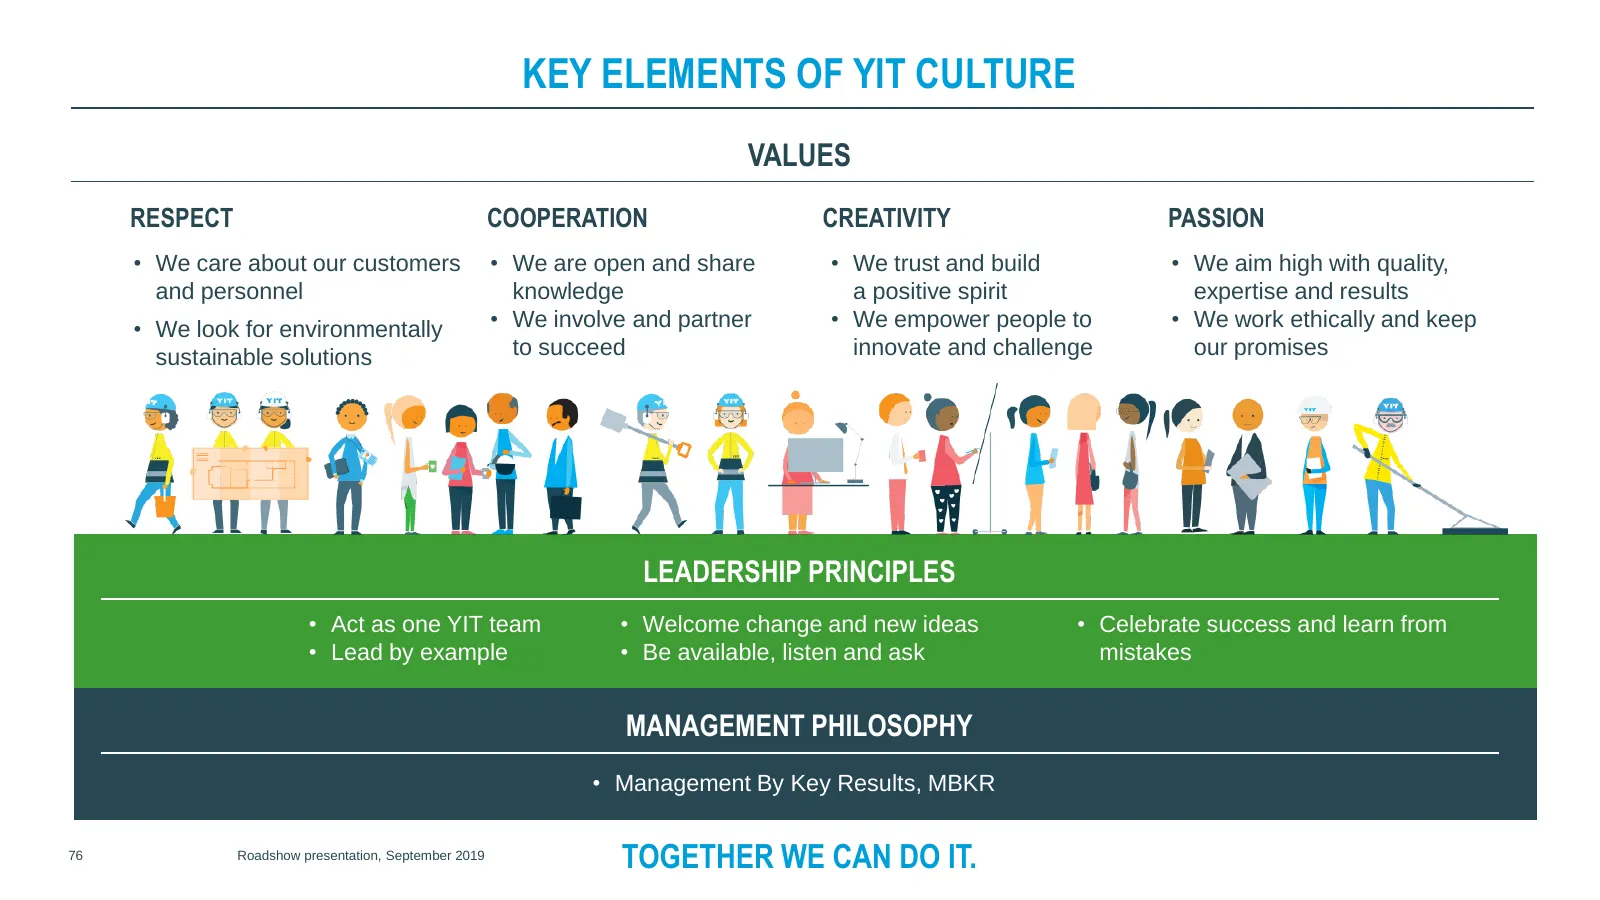
KEY ELEMENTS OF YIT CULTURE VALUES RESPECT COOPERATION CREATIVITY PASSION • We care about our customers • We are open and share • We trust and build • We aim high with quality, and personnel knowledge a positive spirit expertise and results • We look for environmentally • We involve and partner • We
Slide 77: Disclaimer
Disclaimer This presentation has been prepared by, and the information contained herein (unless otherwise indicated) has been provided by YIT Corporation (the “Company”). By attending the meeting or event where this presentation is made, or by reading the presentation slides, you agree to be bound b

Slide 78: Together we can do it.
Together we can doit.
Source: Internet Archive copy of yitgroup.com
More decks from YIT Oyj
 Q3 2026 Earnings Presentation36 slides · Oct 30, 2026
 Investor Day (September 2026)36 slides · Sep 24, 2026
 Q2 2026 Earnings Presentation32 slides · Jul 24, 2026
 Q1 2026 Earnings Presentation33 slides · Apr 28, 2026
 Corporate Update (March 2026)11 slides · Mar 6, 2026
 Q4 2025 Earnings Presentation39 slides · Feb 6, 2026