Sculptor Capital Management Inc
Sculptor Capital Management — Q3 2019 Earnings Presentation
25 slides from Sculptor Capital Management's earnings presentation, Nov 7, 2019
Slide 1: Sculptor Capital Management Reports Third Quarter 2019 Results
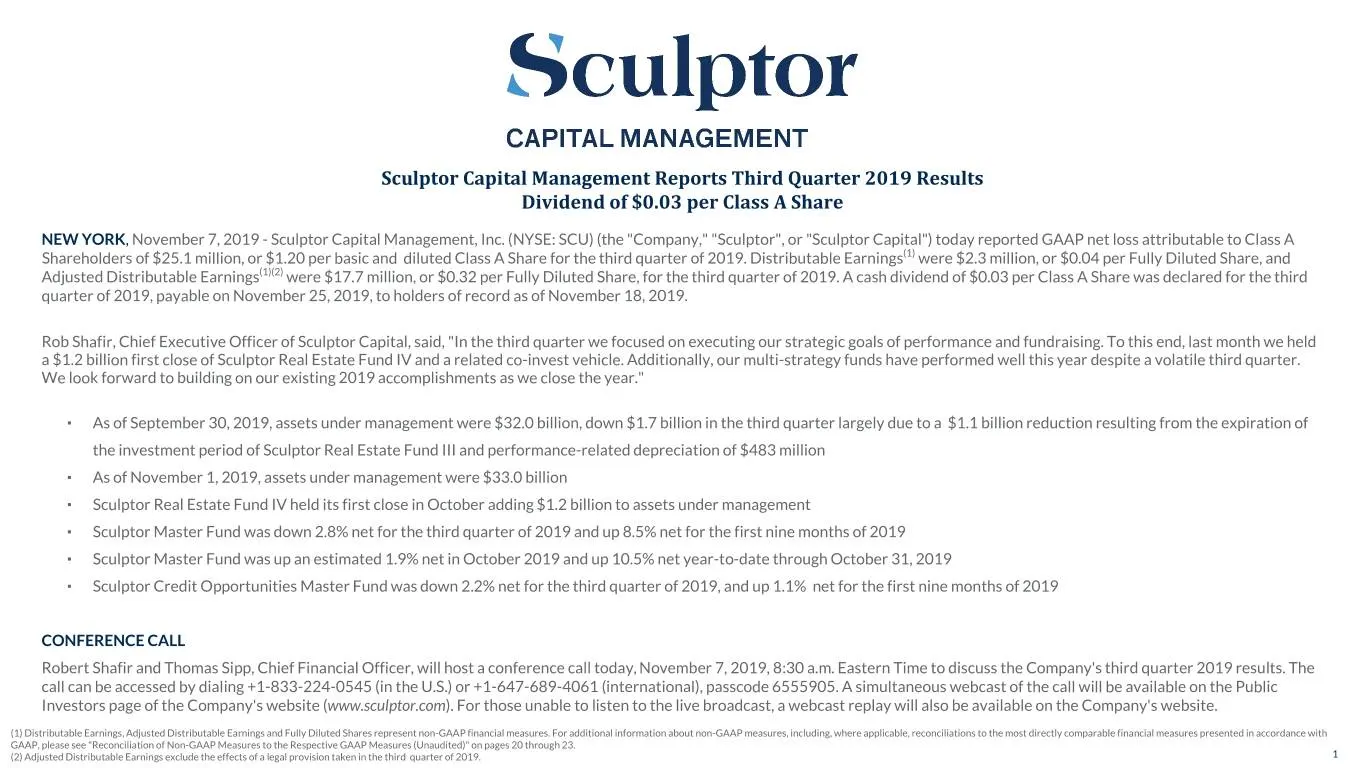
Sculptor Capital Management Reports Third Quarter 2019 Results Dividend of $0.03 per Class A Share NEW YORK, November 7, 2019 - Sculptor Capital Management, Inc. (NYSE: SCU) (the "Company," "Sculptor", or "Sculptor Capital") today reported GAAP net loss attributable to Class A Shareholders of $25.1
Slide 2: Forward-Looking Statements / About Sculptor Capital Management
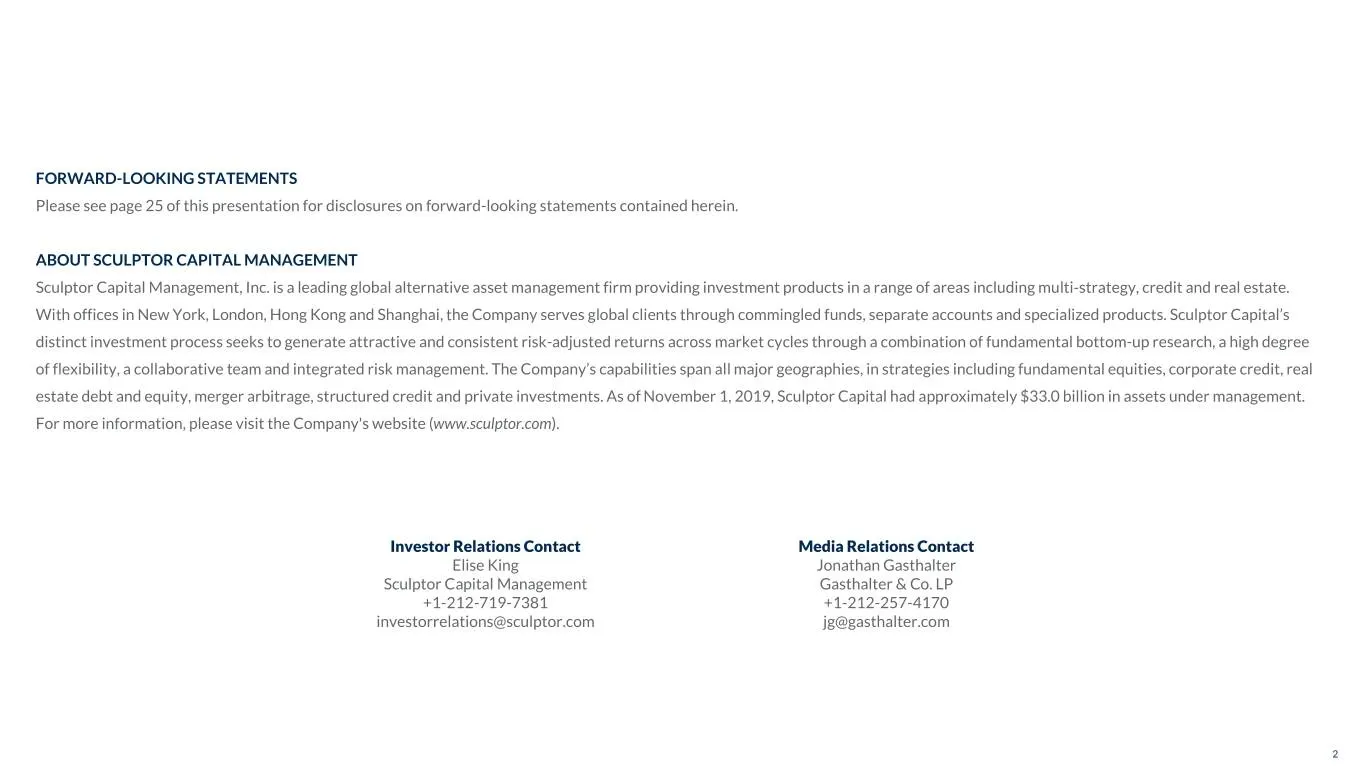
FORWARD-LOOKING STATEMENTS Please see page 25 of this presentation for disclosures on forward-looking statements contained herein. ABOUT SCULPTOR CAPITAL MANAGEMENT Sculptor Capital Management, Inc. is a leading global alternative asset management firm providing investment products in a range of are
Slide 3: Sculptor Capital Management - 3Q 2019 Earnings Presentation
Sculptor Capital Management - 3Q 2019 Earnings Presentation November 7, 2019
Slide 4: Sculptor Capital Management - 3Q 2019 Financial Results
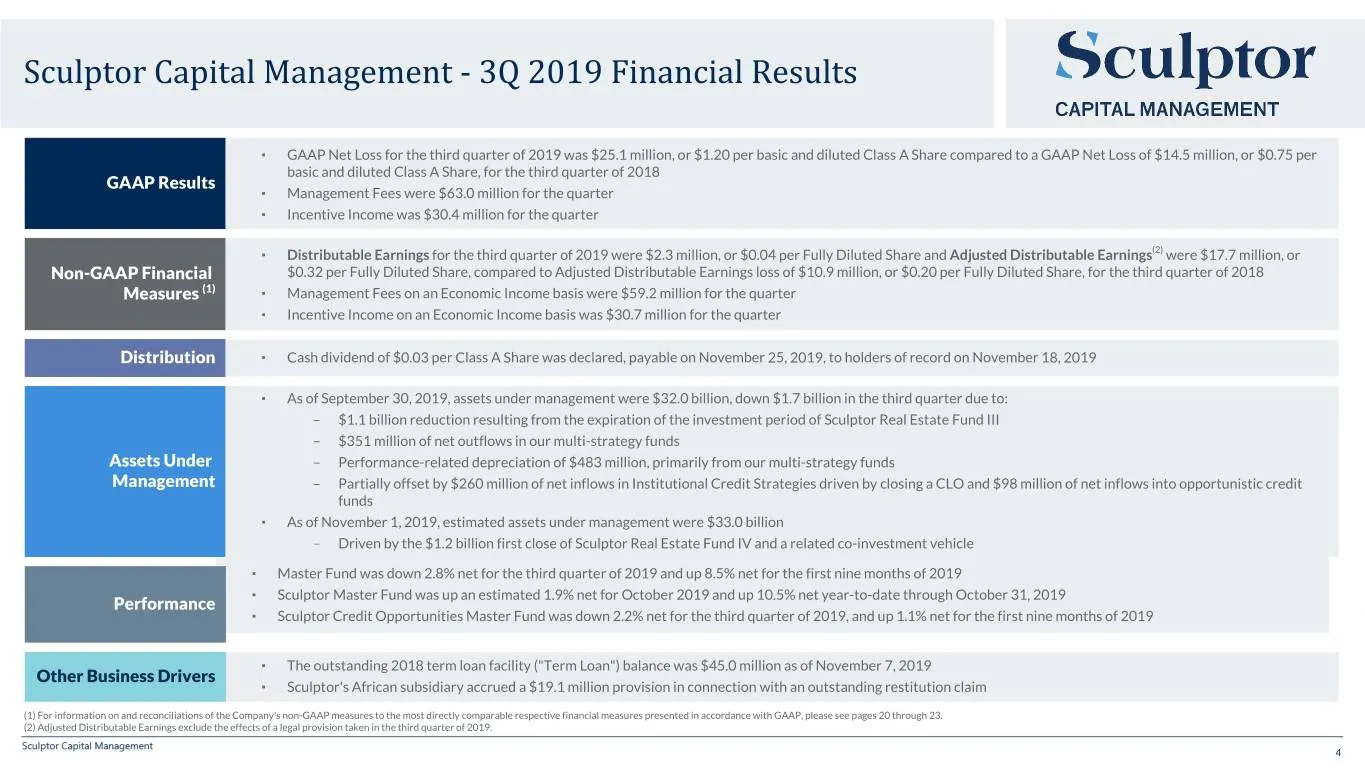
Sculptor Capital Management - 3Q 2019 Financial Results ▪ GAAP Net Loss for the third quarter of 2019 was $25.1 million, or $1.20 per basic and diluted Class A Share compared to a GAAP Net Loss of $14.5 million, or $0.75 per basic and diluted Class A Share, for the third quarter of 2018 GAAP Results
Slide 5: 3Q 2019 GAAP Financial Highlights
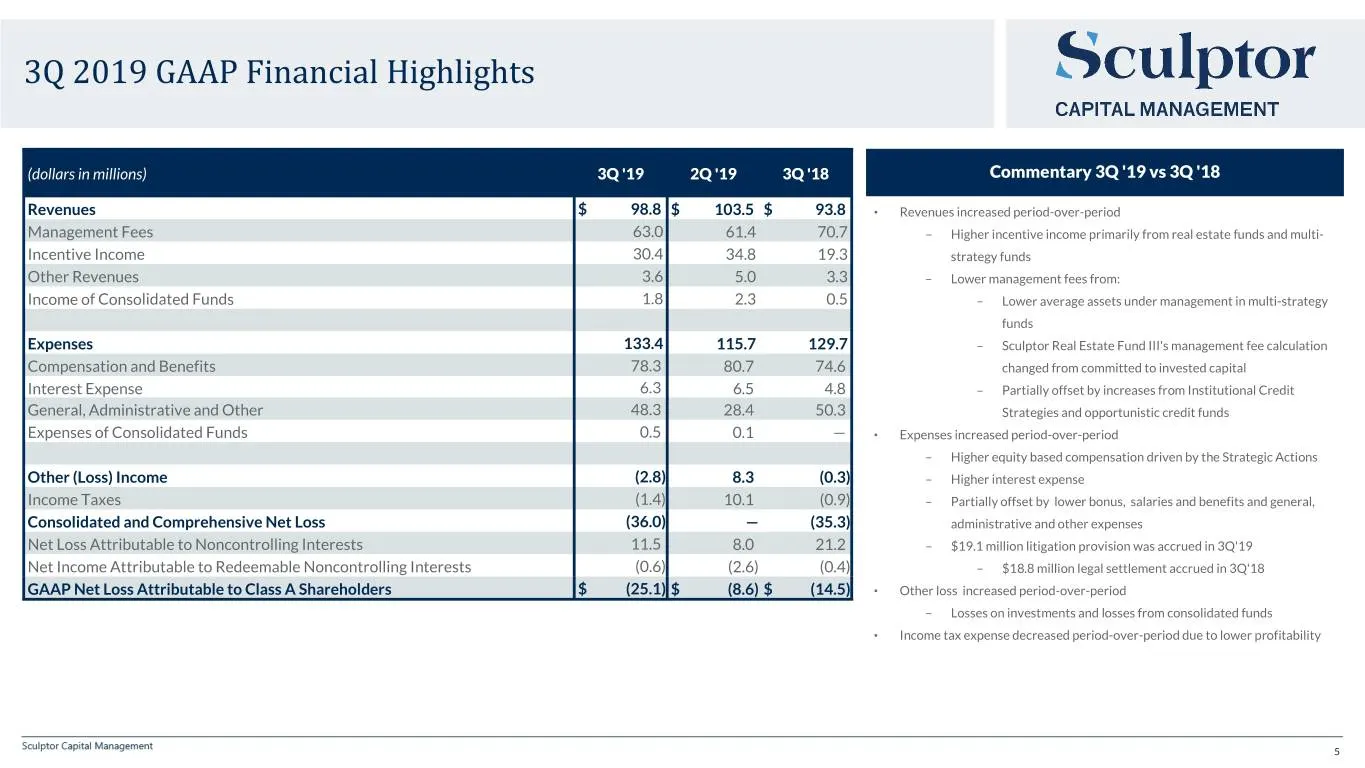
3Q 2019 GAAP Financial Highlights (dollars in millions) 3Q '19 2Q '19 3Q '18 Commentary 3Q '19 vs 3Q '18 Revenues $ 98.8 $ 103.5 $ 93.8 ▪ Revenues increased period-over-period Management Fees 63.0 61.4 70.7 – Higher incentive income primarily from real estate funds and multi- Incentive Income 30.4 3
Slide 6: Fund Performance
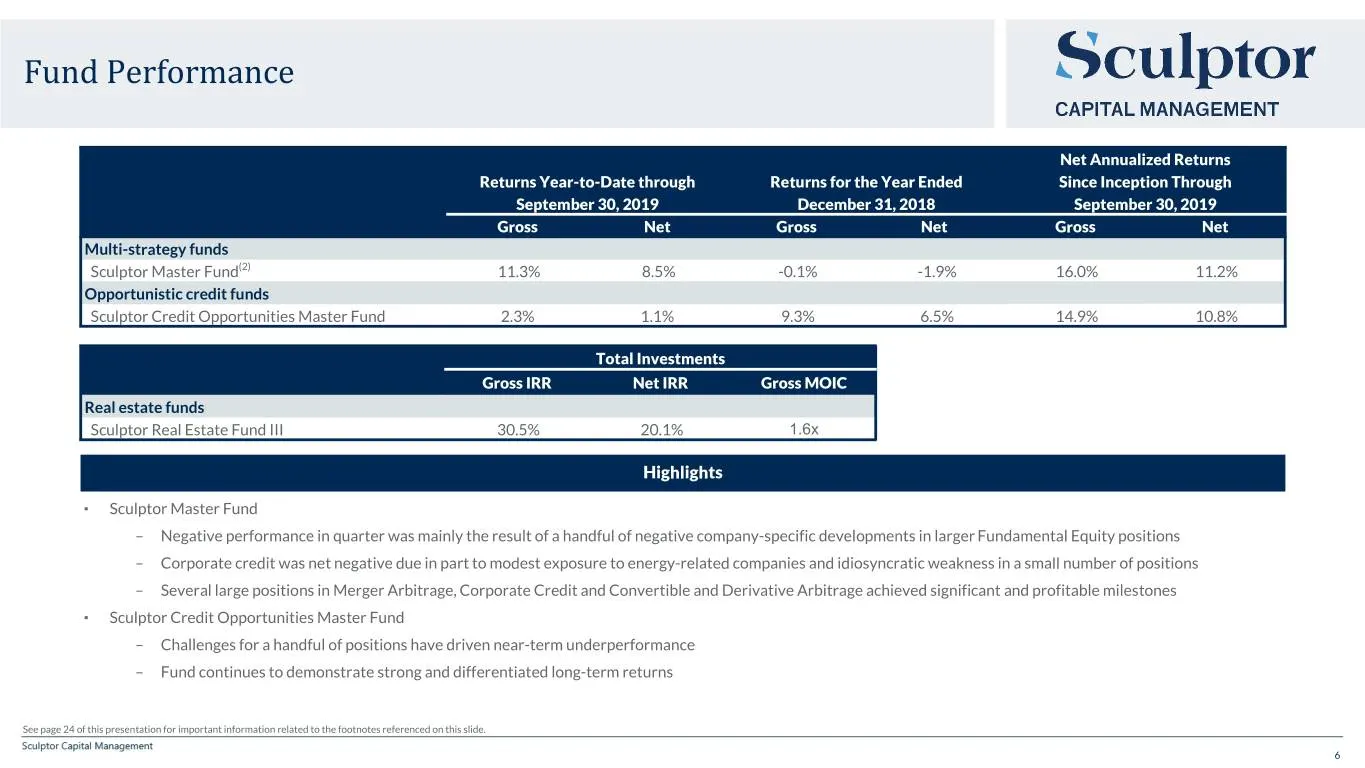
Fund Performance Net Annualized Returns Returns Year-to-Date through Returns for the Year Ended Since Inception Through September 30, 2019 December 31, 2018 September 30, 2019 Gross Net Gross Net Gross Net Multi-strategy funds Sculptor Master Fund(2) 11.3% 8.5% -0.1% -1.9% 16.0% 11.2% Opportunistic
Slide 7: Assets Under Management
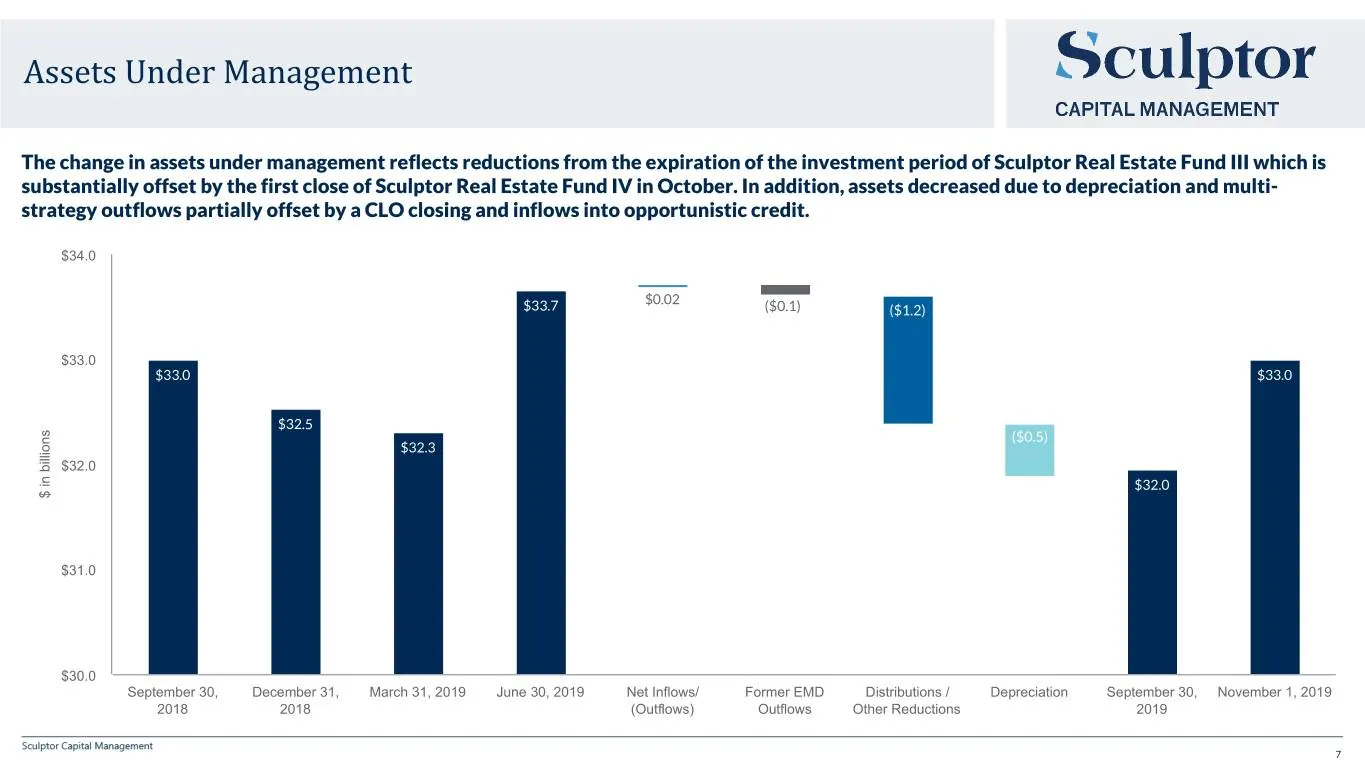
Assets Under Management The change in assets under management reflects reductions from the expiration of the investment period of Sculptor Real Estate Fund III which is substantially offset by the first close of Sculptor Real Estate Fund IV in October. In addition, assets decreased due to depreciati
Slide 8: Summary Changes to AUM
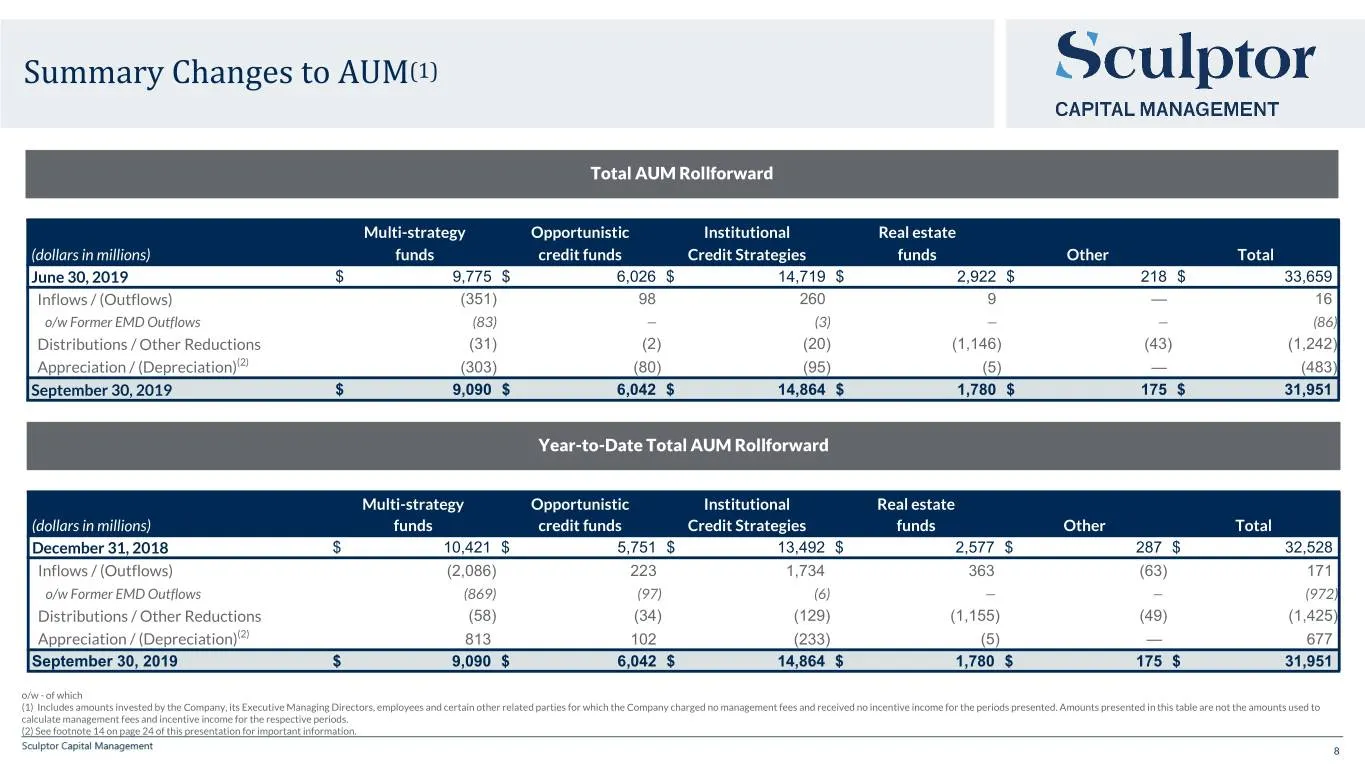
Summary Changes to AUM(1) Total AUM Rollforward Multi-strategy Opportunistic Institutional Real estate (dollars in millions) funds credit funds Credit Strategies funds Other Total June 30, 2019 $ 9,775 $ 6,026 $ 14,719 $ 2,922 $ 218 $ 33,659 Inflows / (Outflows) (351) 98 260 9 — 16 o/w Former EMD Ou
Slide 9: Distributable Earnings & Distributions
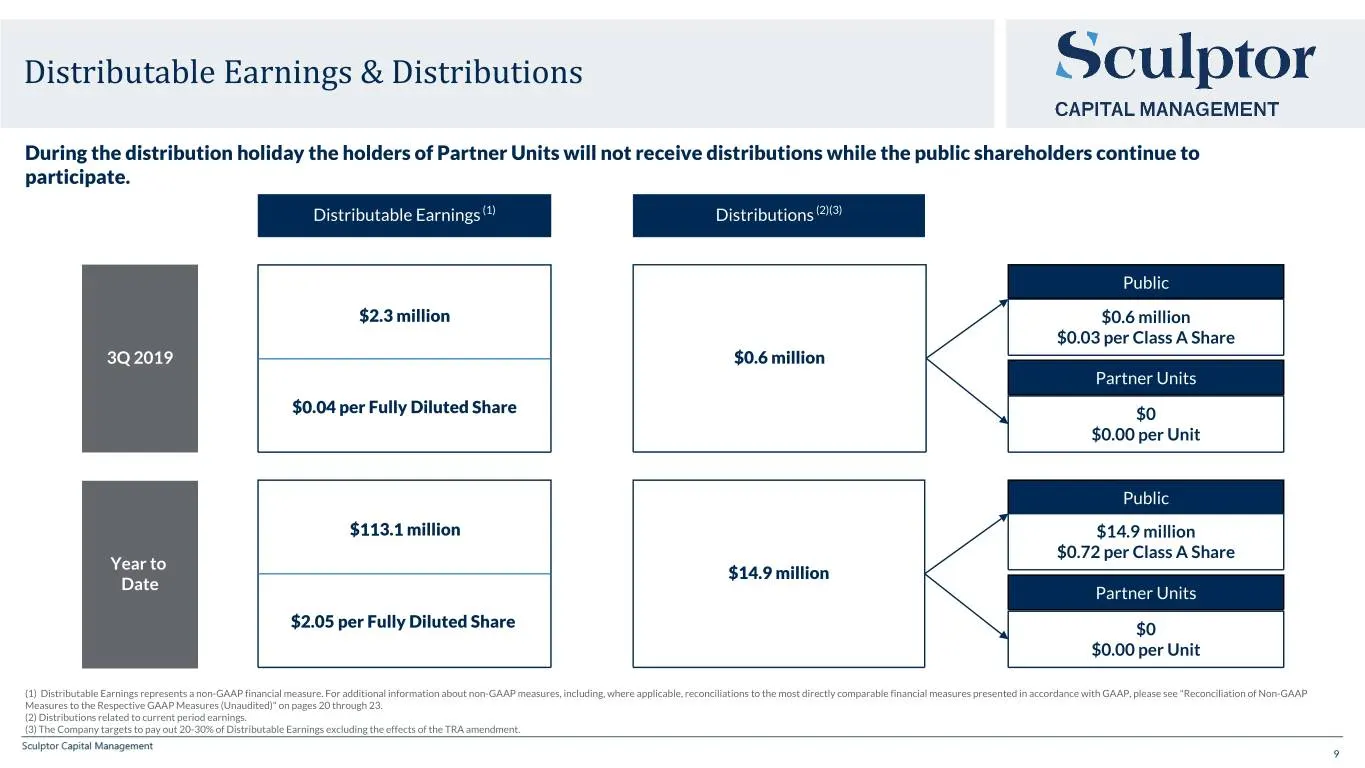
Distributable Earnings & Distributions During the distribution holiday the holders of Partner Units will not receive distributions while the public shareholders continue to participate. Distributable Earnings (1) Distributions (2)(3) Public $2.3 million $0.6 million $0.03 per Class A Share 3Q 2019 $
Slide 10: 3Q 2019 Economic Income Financial Highlights
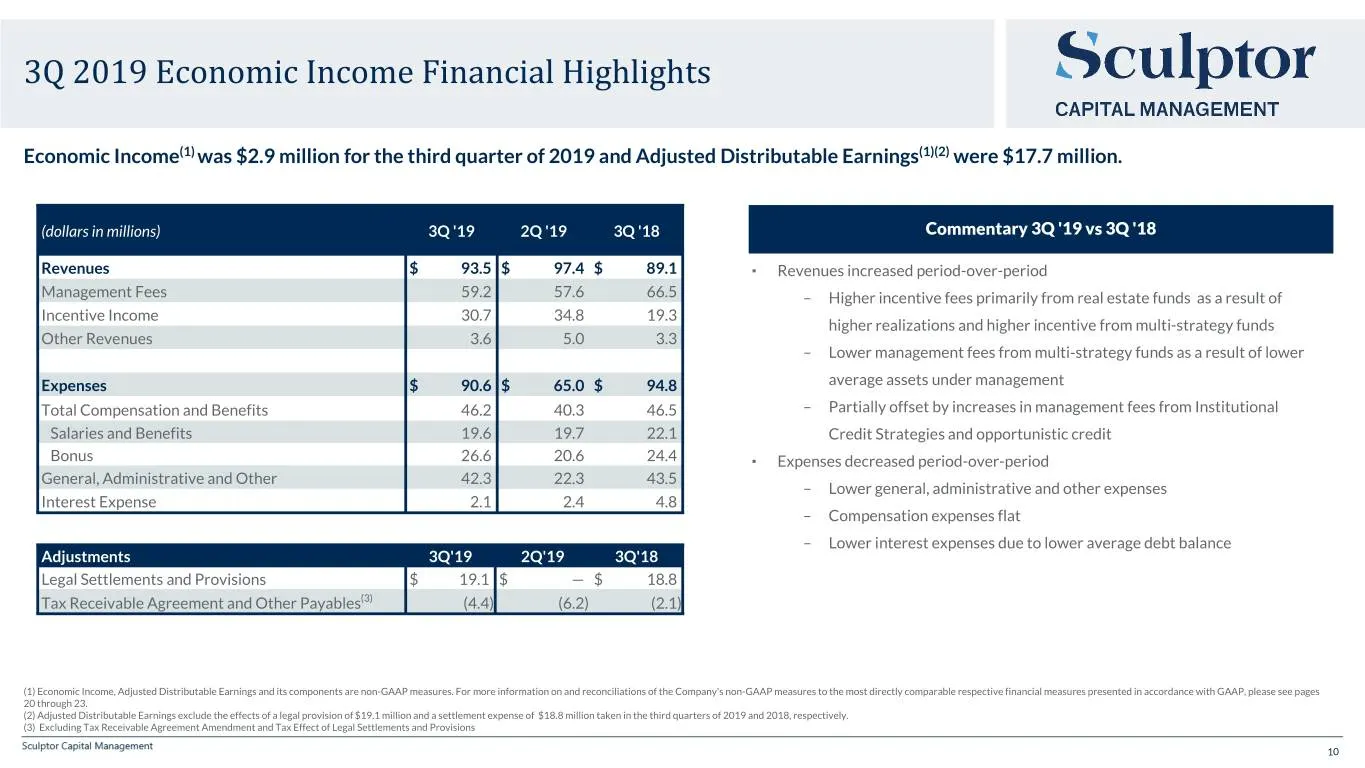
3Q 2019 Economic Income Financial Highlights Economic Income(1) was $2.9 million for the third quarter of 2019 and Adjusted Distributable Earnings(1)(2) were $17.7 million. (dollars in millions) 3Q '19 2Q '19 3Q '18 Commentary 3Q '19 vs 3Q '18 Revenues $ 93.5 $ 97.4 $ 89.1 ▪ Revenues increased perio
Slide 11: Accrued but Unrecognized Incentive Income
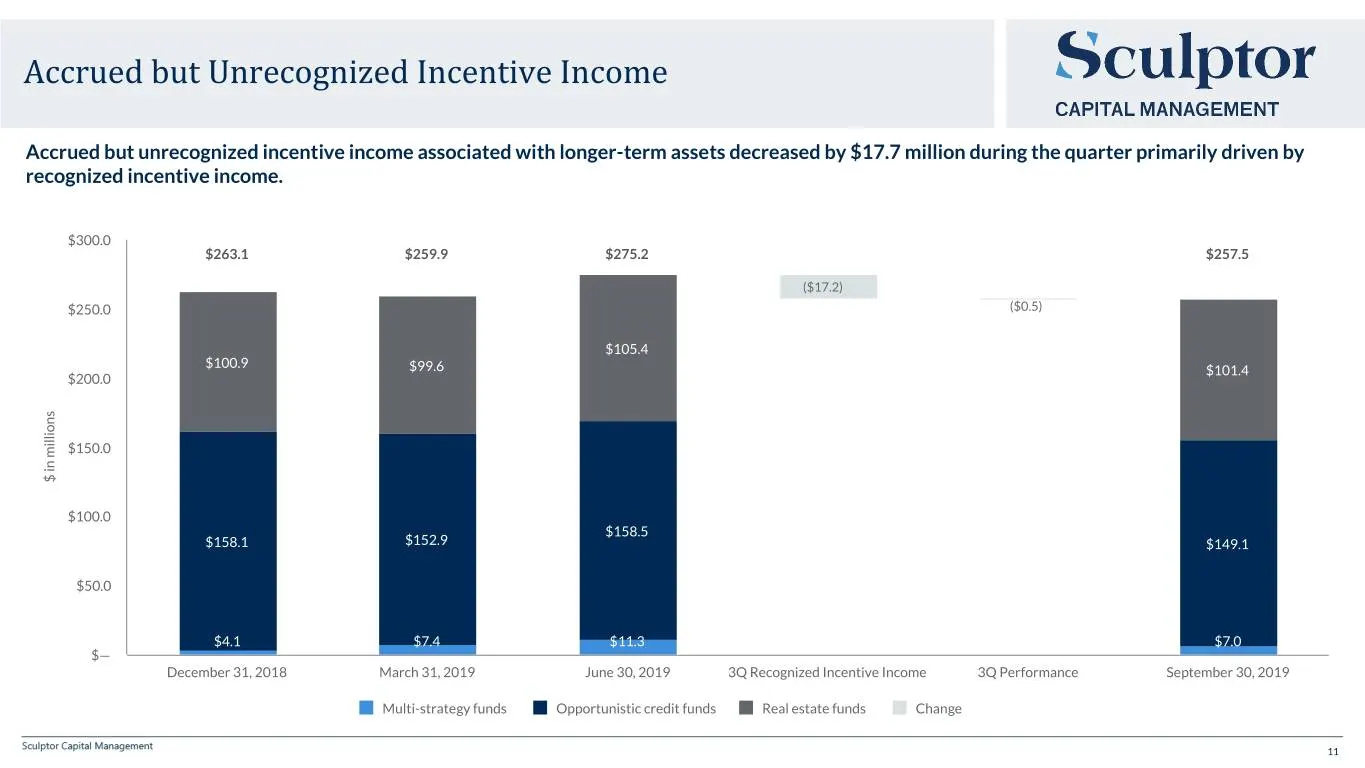
Accrued but Unrecognized Incentive Income Accrued but unrecognized incentive income associated with longer-term assets decreased by $17.7 million during the quarter primarily driven by recognized incentive income. $300.0 $263.1 $259.9 $275.2 $257.5 ($17.2) $250.0 ($0.5) $105.4 $100.9 $99.6 $101.4 $2
Slide 12: Balance Sheet Highlights
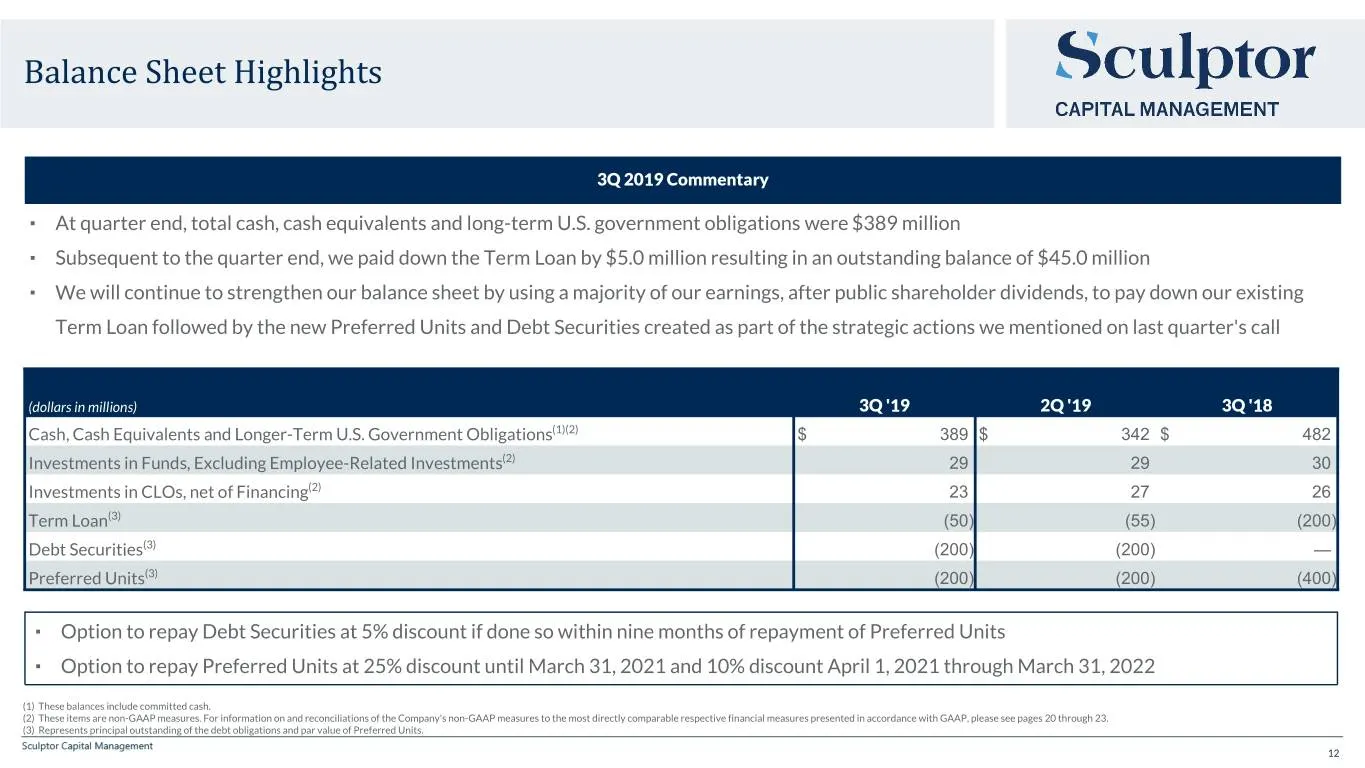
Balance Sheet Highlights 3Q 2019 Commentary ▪ At quarter end, total cash, cash equivalents and long-term U.S. government obligations were $389 million ▪ Subsequent to the quarter end, we paid down the Term Loan by $5.0 million resulting in an outstanding balance of $45.0 million ▪ We will continue t
Slide 13: Appendix, Reconciliations and Disclosures
Appendix, Reconciliations and Disclosures 13
Slide 14: Fund Information
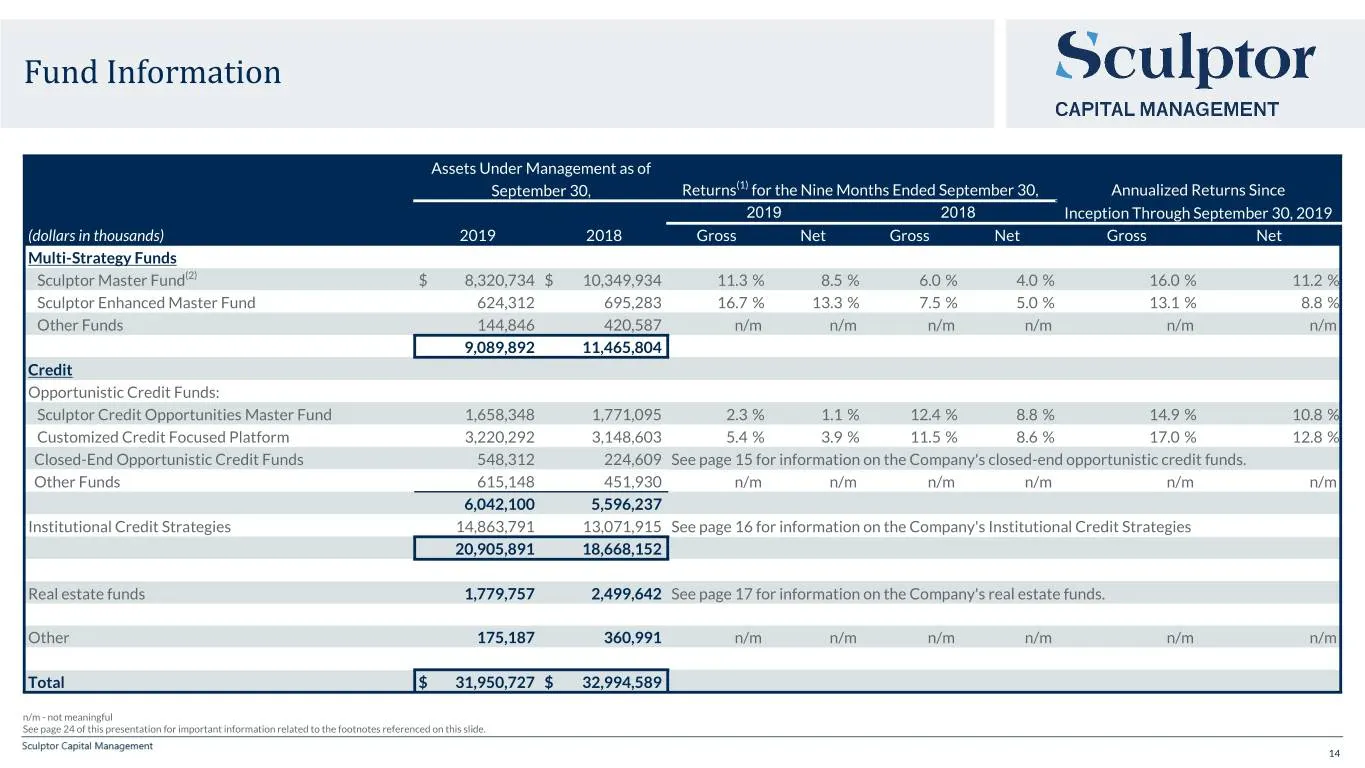
Fund Information Assets Under Management as of September 30, Returns(1) for the Nine Months Ended September 30, Annualized Returns Since 2019 2018 Inception Through September 30, 2019 (dollars in thousands) 2019 2018 Gross Net Gross Net Gross Net Multi-Strategy Funds Sculptor Master Fund(2) $ 8,320,
Slide 15: Fund Information (cont.) Closed-end Opportunistic Credit Funds
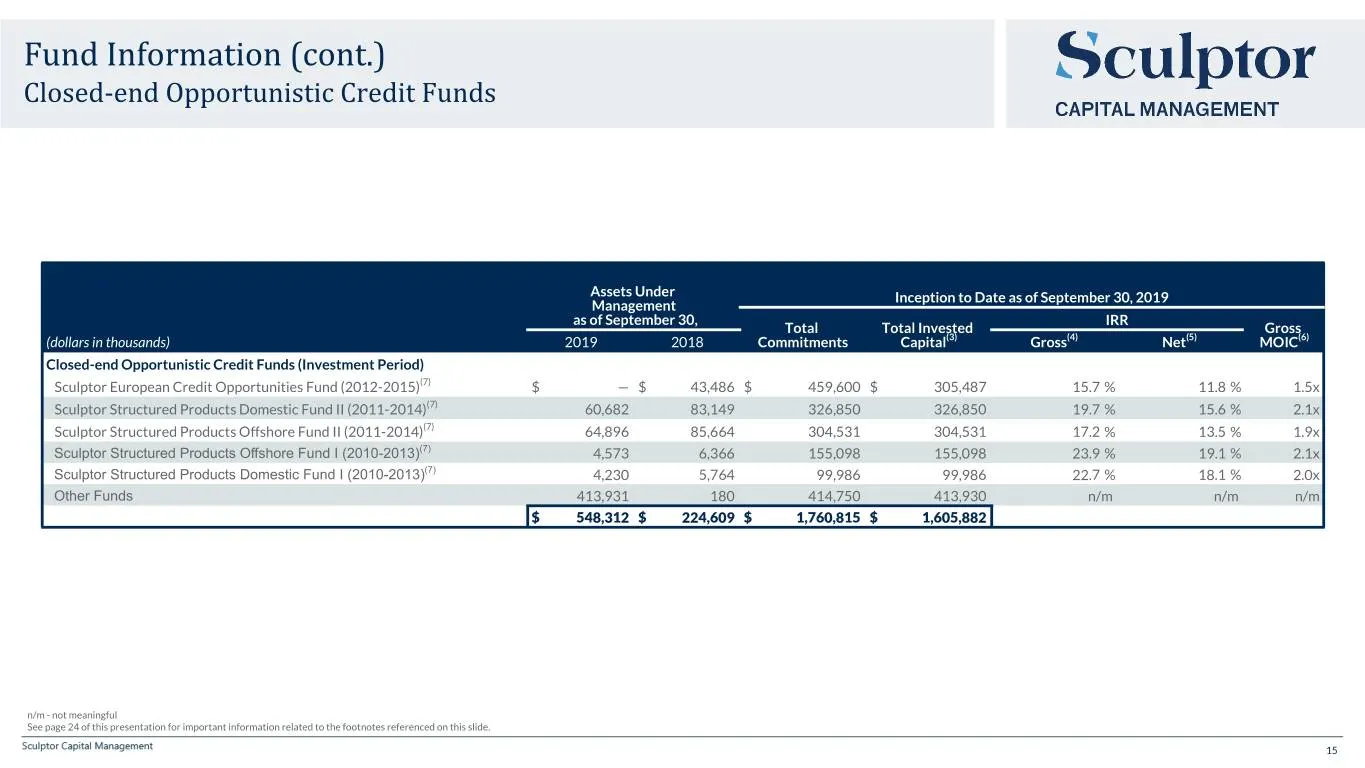
Fund Information (cont.) Closed-end Opportunistic Credit Funds Assets Under Inception to Date as of September 30, 2019 Management as of September 30, IRR Total Total Invested Gross (dollars in thousands) 2019 2018 Commitments Capital(3) Gross(4) Net(5) MOIC(6) Closed-end Opportunistic Credit Funds (
Slide 16: Fund Information (cont.) Institutional Credit Strategies
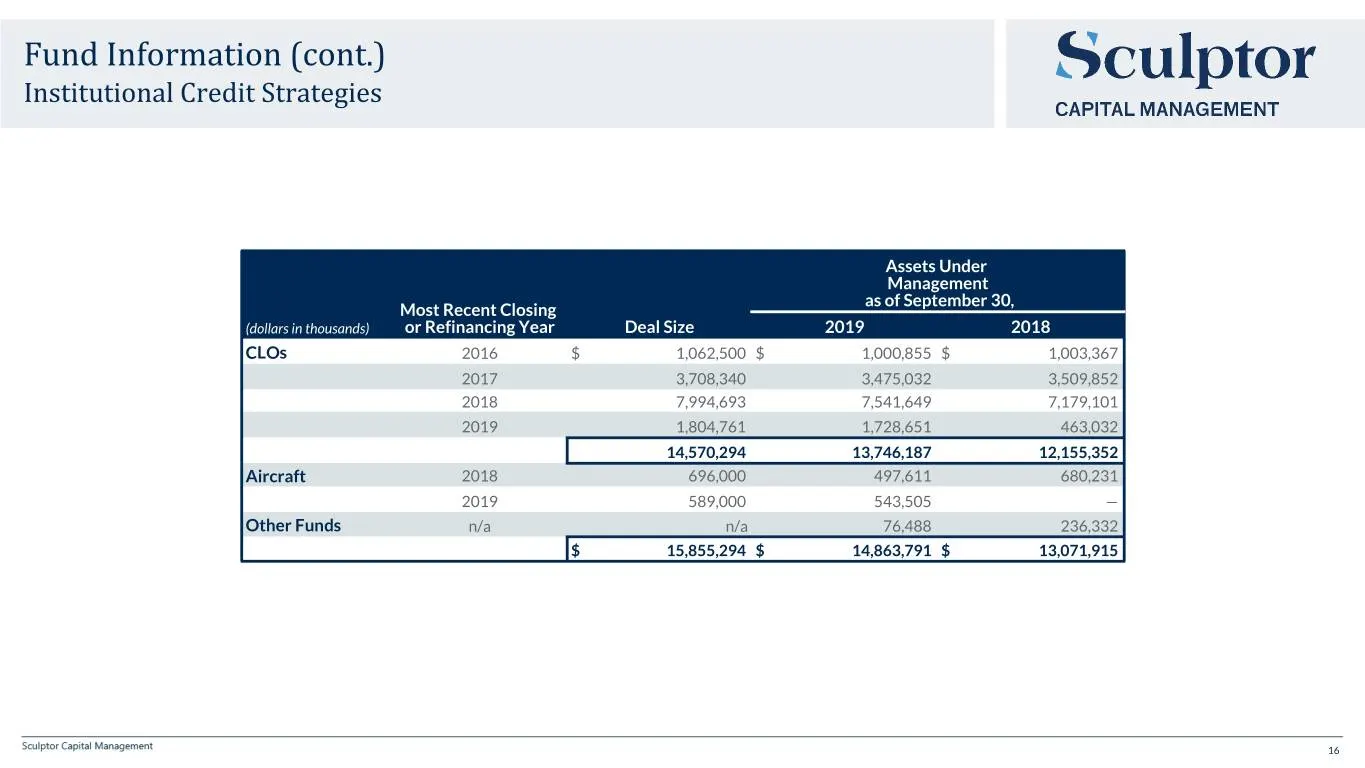
Fund Information (cont.) Institutional Credit Strategies Assets Under Management as of September 30, Most Recent Closing (dollars in thousands) or Refinancing Year Deal Size 2019 2018 CLOs 2016 $ 1,062,500 $ 1,000,855 $ 1,003,367 2017 3,708,340 3,475,032 3,509,852 2018 7,994,693 7,541,649 7,179,101
Slide 17: Fund Information (cont.) Real Estate Funds
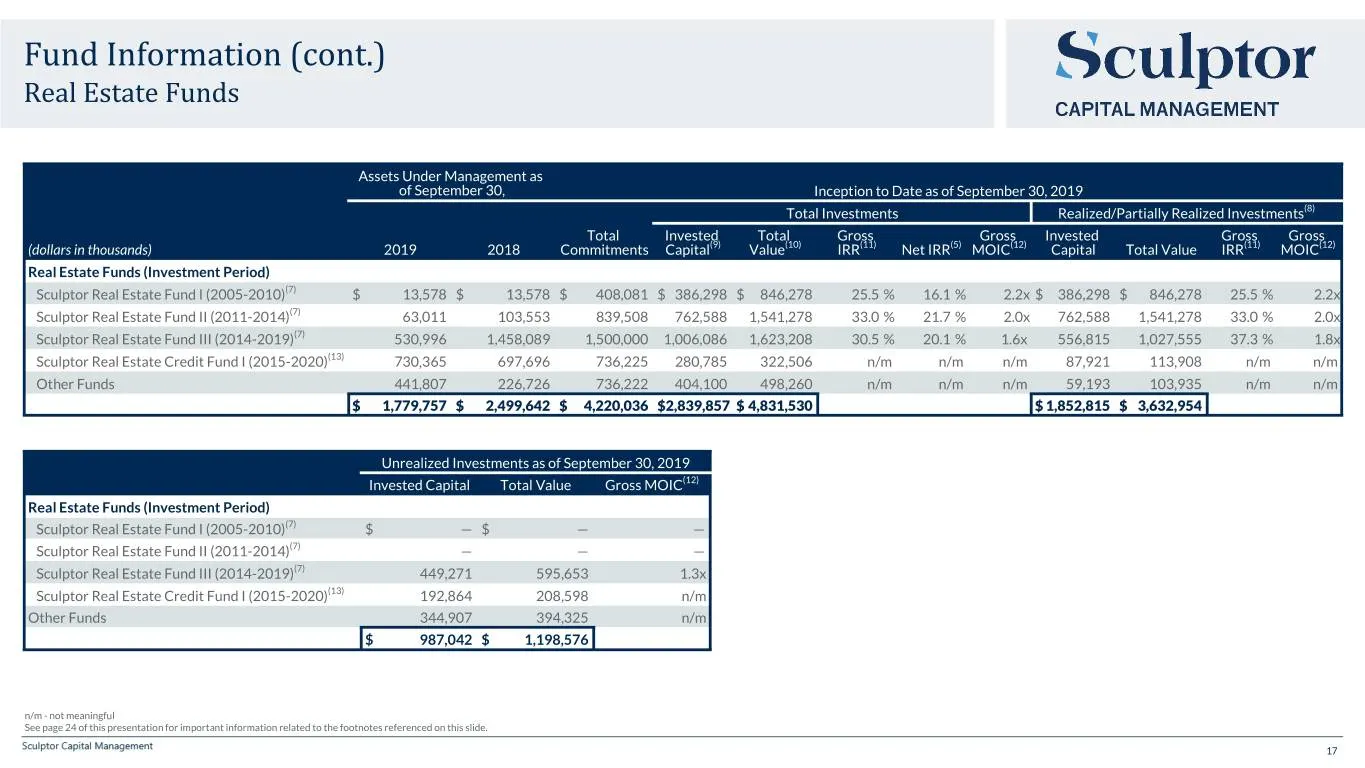
Fund Information (cont.) Real Estate Funds Assets Under Management as of September 30, Inception to Date as of September 30, 2019 Total Investments Realized/Partially Realized Investments(8) Total Invested Total Gross Gross Invested Gross Gross (dollars in thousands) 2019 2018 Commitments Capital(9)
Slide 18: GAAP Consolidated Statement of Comprehensive Income (Loss) - Unaudited
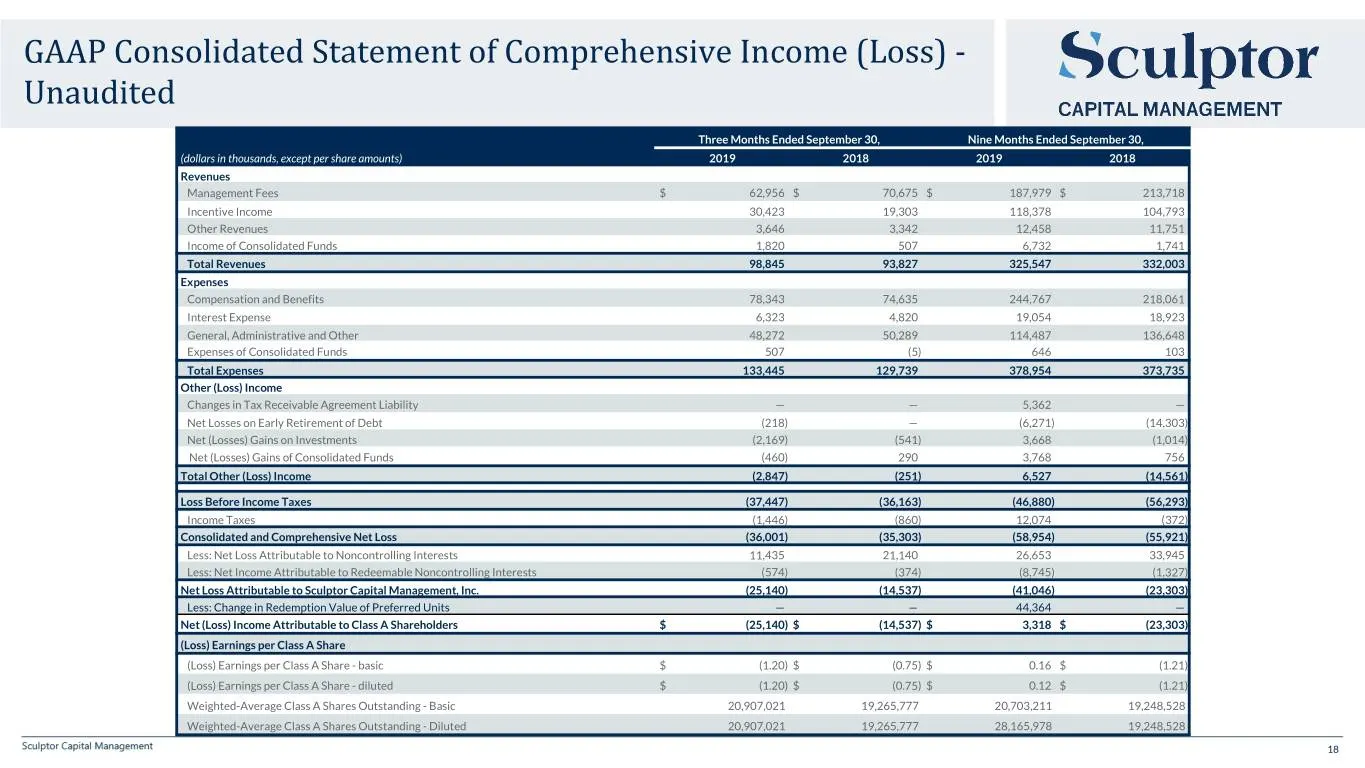
GAAP Consolidated Statement of Comprehensive Income (Loss) - Unaudited Three Months Ended September 30, Nine Months Ended September 30, (dollars in thousands, except per share amounts) 2019 2018 2019 2018 Revenues Management Fees $ 62,956 $ 70,675 $ 187,979 $ 213,718 Incentive Income 30,423 19,303 1
Slide 19: GAAP Consolidated Balance Sheet - Unaudited
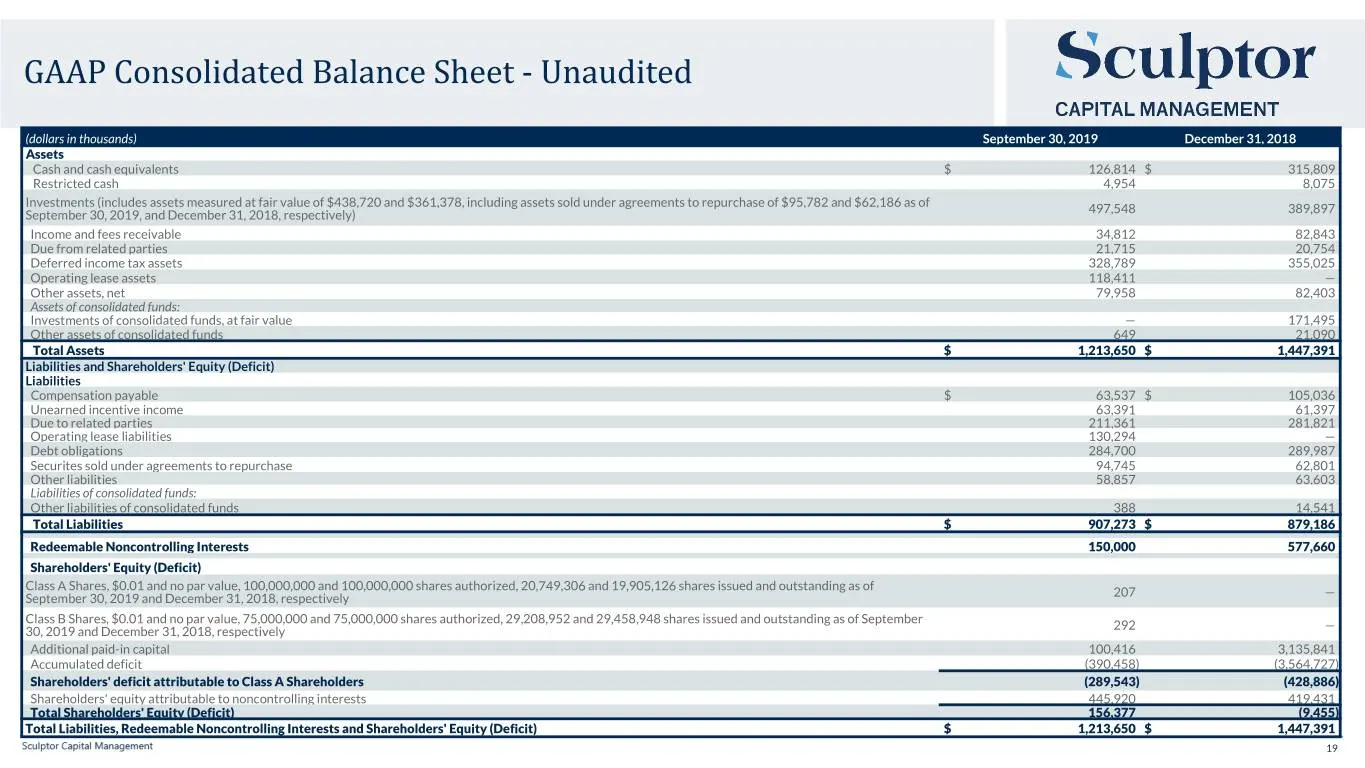
GAAP Consolidated Balance Sheet - Unaudited (dollars in thousands) September 30, 2019 December 31, 2018 Assets Cash and cash equivalents $ 126,814 $ 315,809 Restricted cash 4,954 8,075 Investments (includes assets measured at fair value of $438,720 and $361,378, including assets sold under agreement
Slide 20: Reconciliation of Non-GAAP Measures to the Respective GAAP Measures - Unaudited
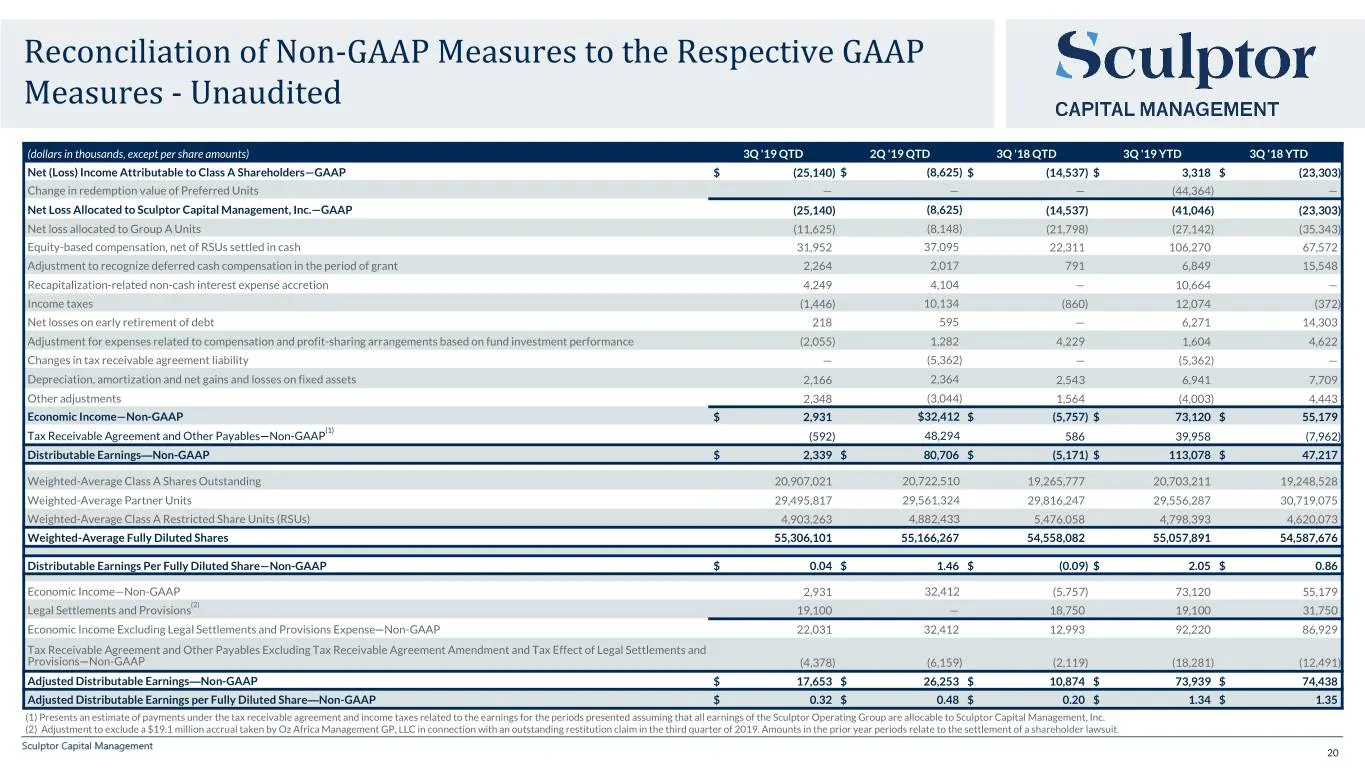
Reconciliation of Non-GAAP Measures to the Respective GAAP Measures - Unaudited (dollars in thousands, except per share amounts) 3Q '19 QTD 2Q '19 QTD 3Q '18 QTD 3Q '19 YTD 3Q '18 YTD Net (Loss) Income Attributable to Class A Shareholders—GAAP $ (25,140) $ (8,625) $ (14,537) $ 3,318 $ (23,303) Chang
Slide 21: Reconciliation of Non-GAAP Measures to the Respective GAAP Measures (cont.)
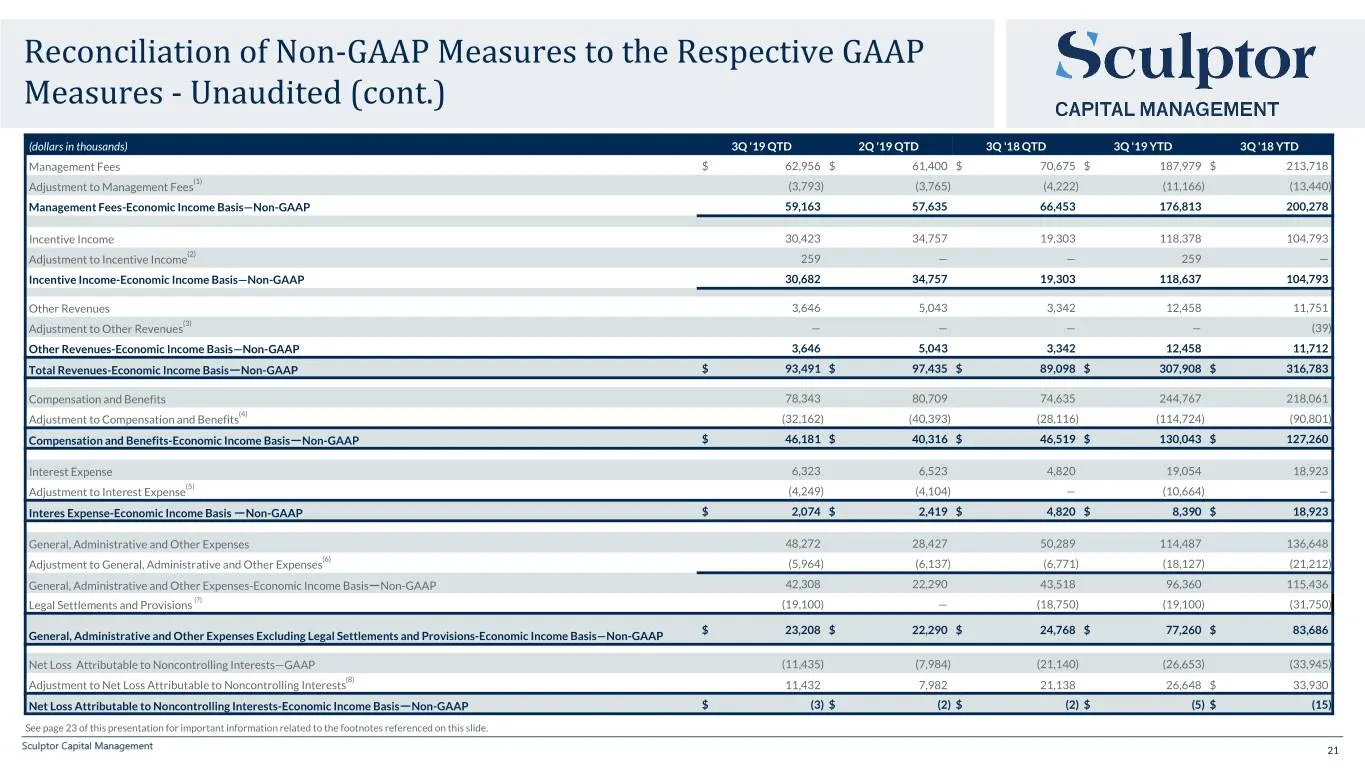
Reconciliation of Non-GAAP Measures to the Respective GAAP Measures - Unaudited (cont.) (dollars in thousands) 3Q '19 QTD 2Q '19 QTD 3Q '18 QTD 3Q '19 YTD 3Q '18 YTD Management Fees $ 62,956 $ 61,400 $ 70,675 $ 187,979 $ 213,718 (1) Adjustment to Management Fees (3,793) (3,765) (4,222) (11,166) (13,
Slide 22: Reconciliation of Non-GAAP Measures to the Respective GAAP Measures (cont.)
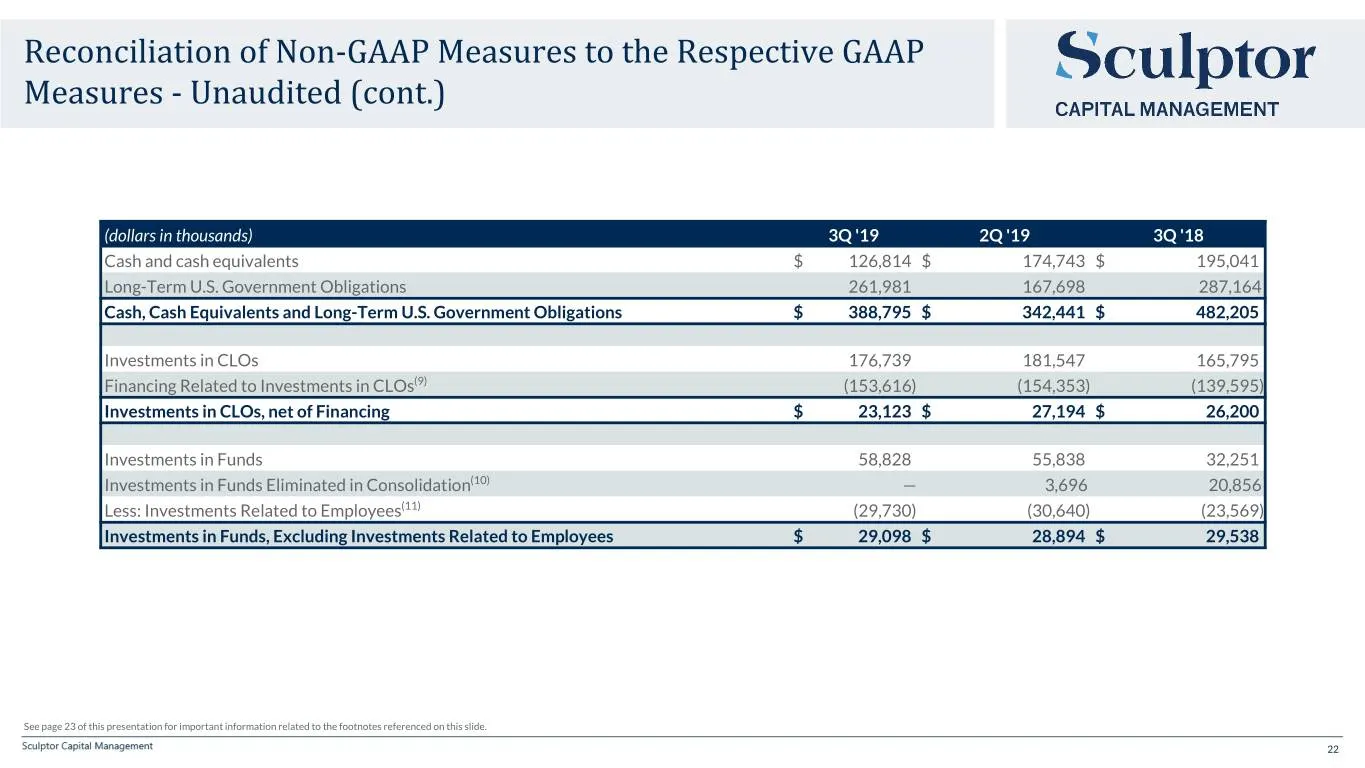
Reconciliation of Non-GAAP Measures to the Respective GAAP Measures - Unaudited (cont.) (dollars in thousands) 3Q '19 2Q '19 3Q '18 Cash and cash equivalents $ 126,814 $ 174,743 $ 195,041 Long-Term U.S. Government Obligations 261,981 167,698 287,164 Cash, Cash Equivalents and Long-Term U.S. Governme
Slide 23: Footnotes to Non-GAAP Reconciliations
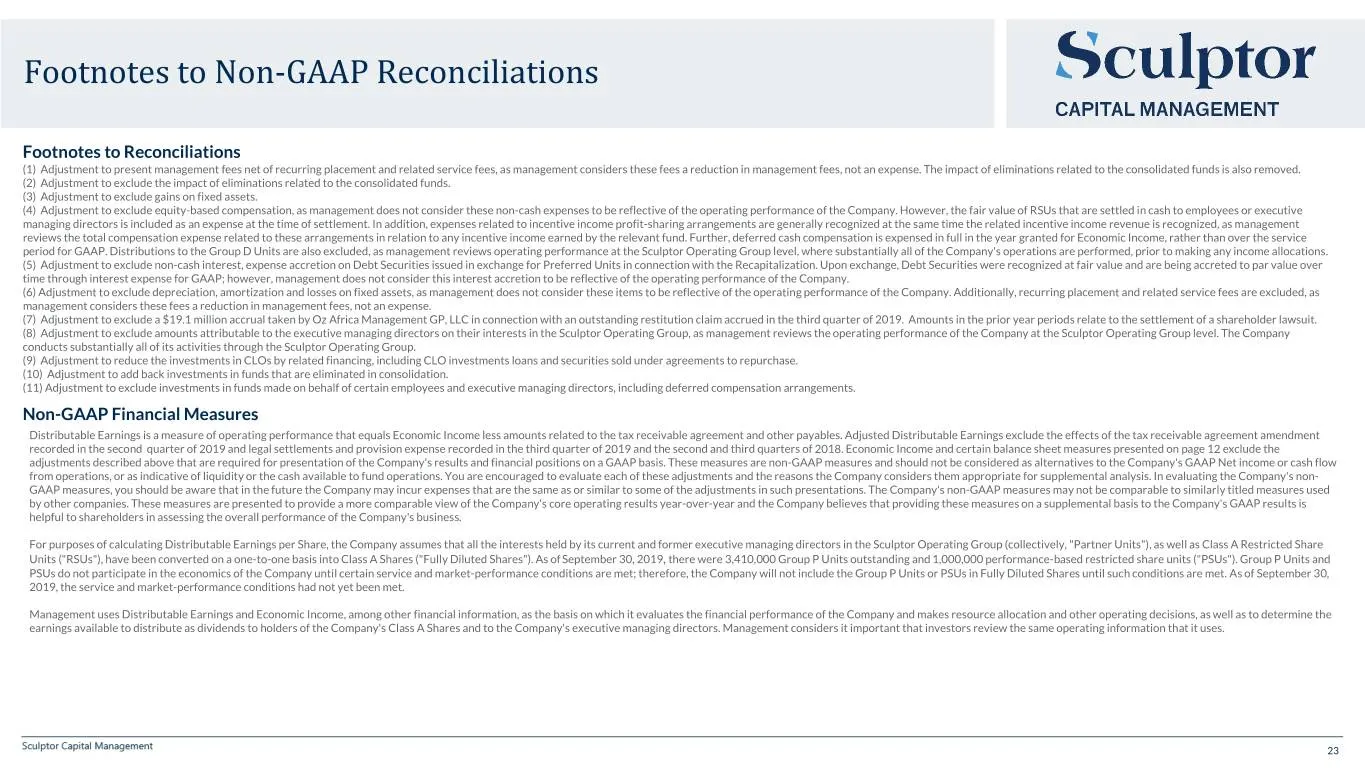
Footnotes to Non-GAAP Reconciliations Footnotes to Reconciliations (1) Adjustment to present management fees net of recurring placement and related service fees, as management considers these fees a reduction in management fees, not an expense. The impact of eliminations related to the consolidated
Slide 24: Fund Information – Footnotes
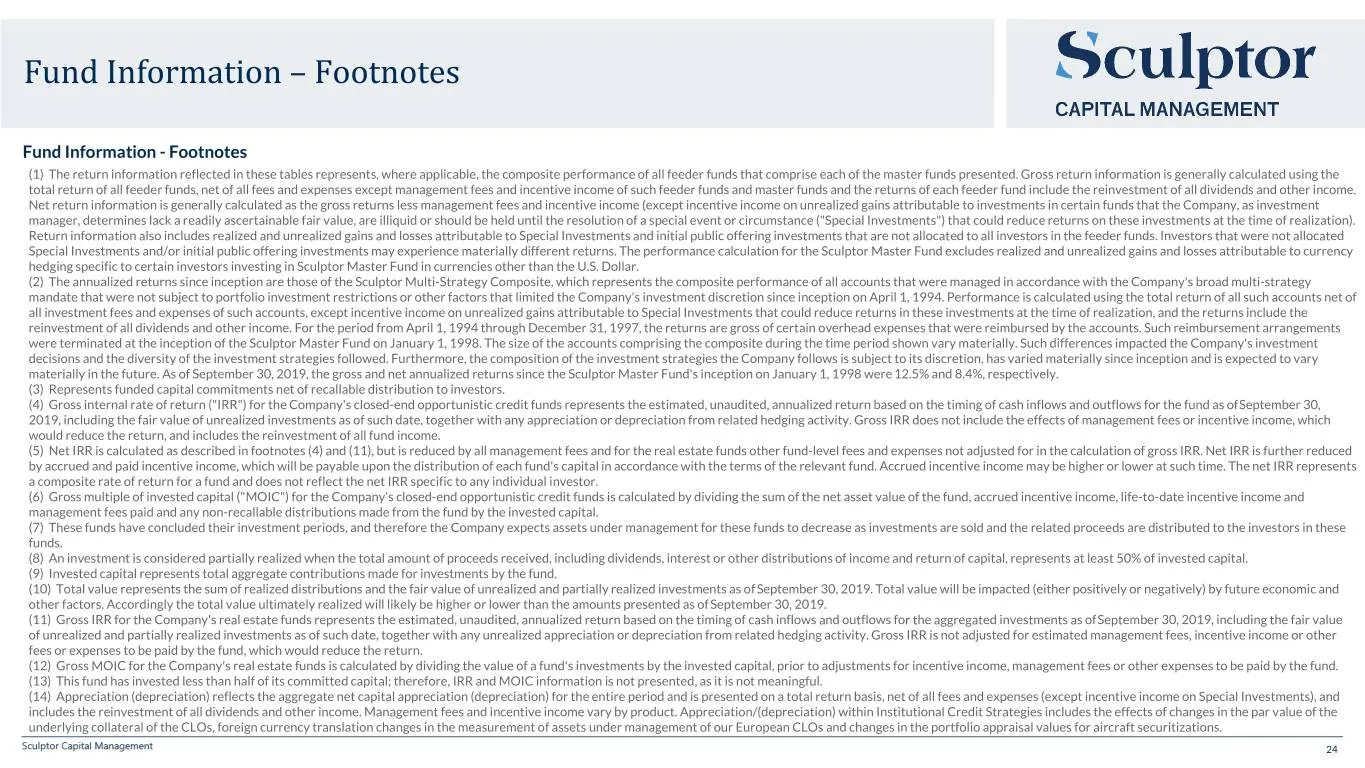
Fund Information – Footnotes Fund Information - Footnotes (1) The return information reflected in these tables represents, where applicable, the composite performance of all feeder funds that comprise each of the master funds presented. Gross return information is generally calculated using the tota
Slide 25: Forward-Looking Statements
Forward-Looking Statements This press release and earnings presentation contain forward-looking statements within the meaning of Section 27A of the Securities Act of 1933, as amended, and Section 21E of the Securities Exchange Act of 1934, as amended, that reflect the Company's current views with re
Source: SEC EDGAR · 8-K filed Nov 7, 2019
More decks from Sculptor Capital Management Inc
 Q3 2023 Earnings Presentation33 slides · Nov 8, 2023
 Merger or Acquisition (October 2023)22 slides · Oct 25, 2023
 Q2 2023 Earnings Presentation33 slides · Aug 8, 2023
 Q1 2023 Earnings Presentation34 slides · May 4, 2023
 FY2022 Earnings Presentation33 slides · Feb 28, 2023
 Q3 2022 Earnings Presentation33 slides · Nov 8, 2022