HKT Trust and HKT Ltd · HKEX:6823
HKT Trust and HKT — FY2015 Earnings Presentation
37 slides from HKT Trust and HKT's earnings presentation, Feb 25, 2016
Slide 1: 2015 Annual Results
2015 Annual Results For the year ended December 31, 2015 February 25, 2016 – Hong Kong
Slide 2: Forward-Looking Statements
Forward-Looking Statements This presentation may contain "forward-looking statements" that are not historical in nature. These forward-looking statements, which include, without limitation, statements regarding HKT’s future results of operations, financial condition or business prospects, are based
Slide 3: Overview
Overview Alex Arena Group Managing Director 2
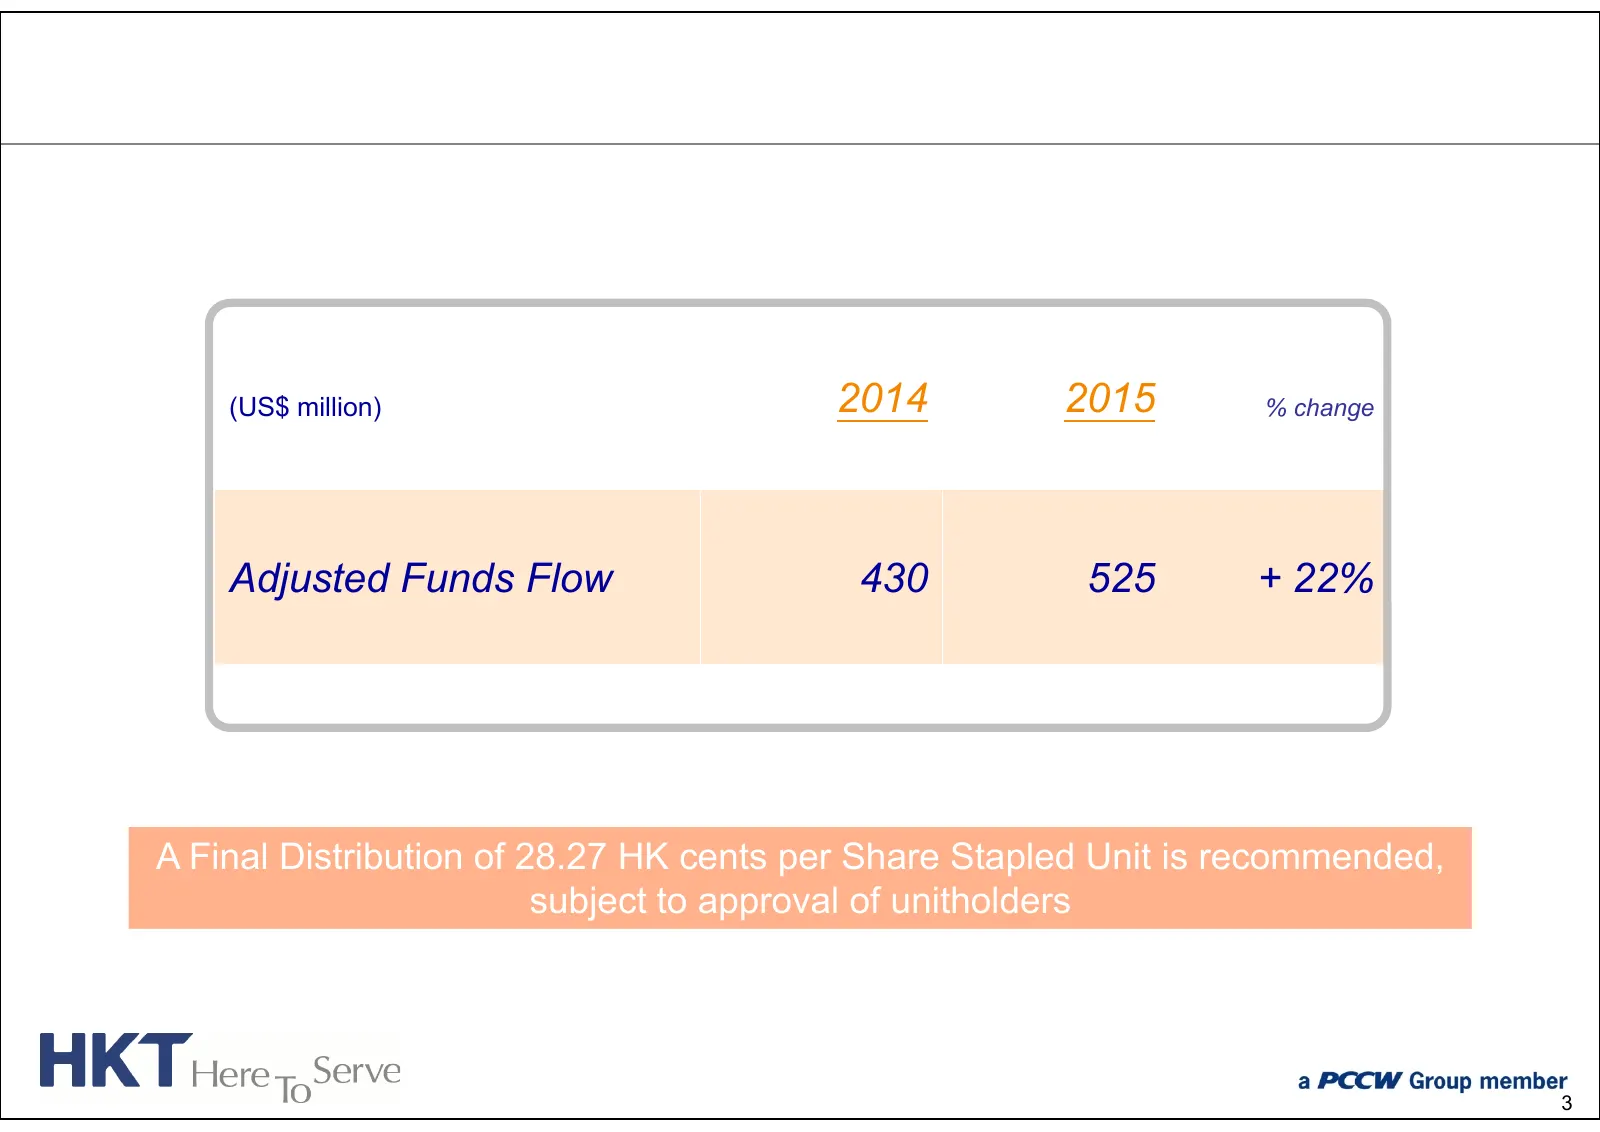
Slide 4: Adjusted Funds Flow: Final Distribution of 28.27 HK cents per Share Stapled Unit
(US$ million) 2014 2015 % change Adjusted Funds Flow 430 525 + 22% A Final Distribution of 28.27 HK cents per Share Stapled Unit is recommended, subject to approval of unitholders 3
Slide 5: Financial Review
Financial Review Susanna Hui Group Chief Financial Officer 4
Slide 6: Solid Growth in EBITDA and AFF
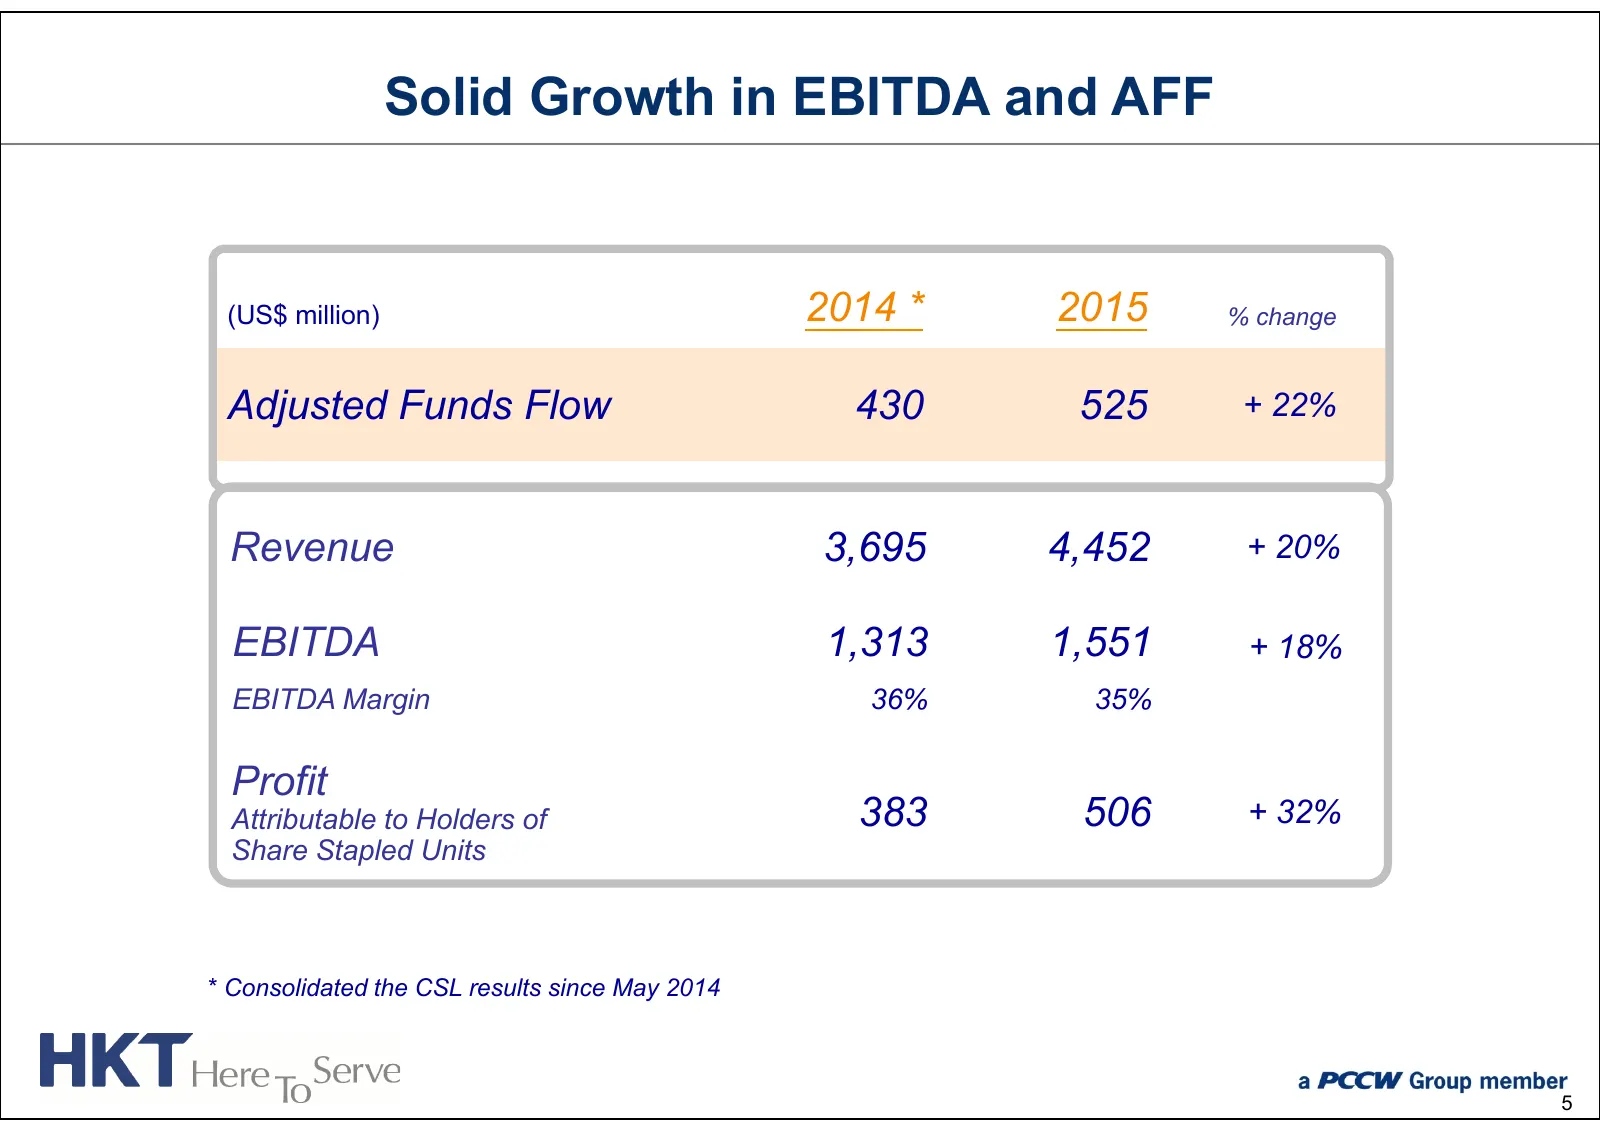
Solid Growth in EBITDA and AFF (US$ million) 2014 * 2015 % change Adjusted Funds Flow 430 525 + 22% Revenue 3,695 4,452 + 20% EBITDA 1,313 1,551 + 18% EBITDA Margin 36% 35% Profit Attributable to Holders of 383 506 + 32% Share Stapled Units * Consolidated the CSL results since May 2014 5
Slide 7: Leading Mobile Operation Extracting Significant Cost Efficiencies
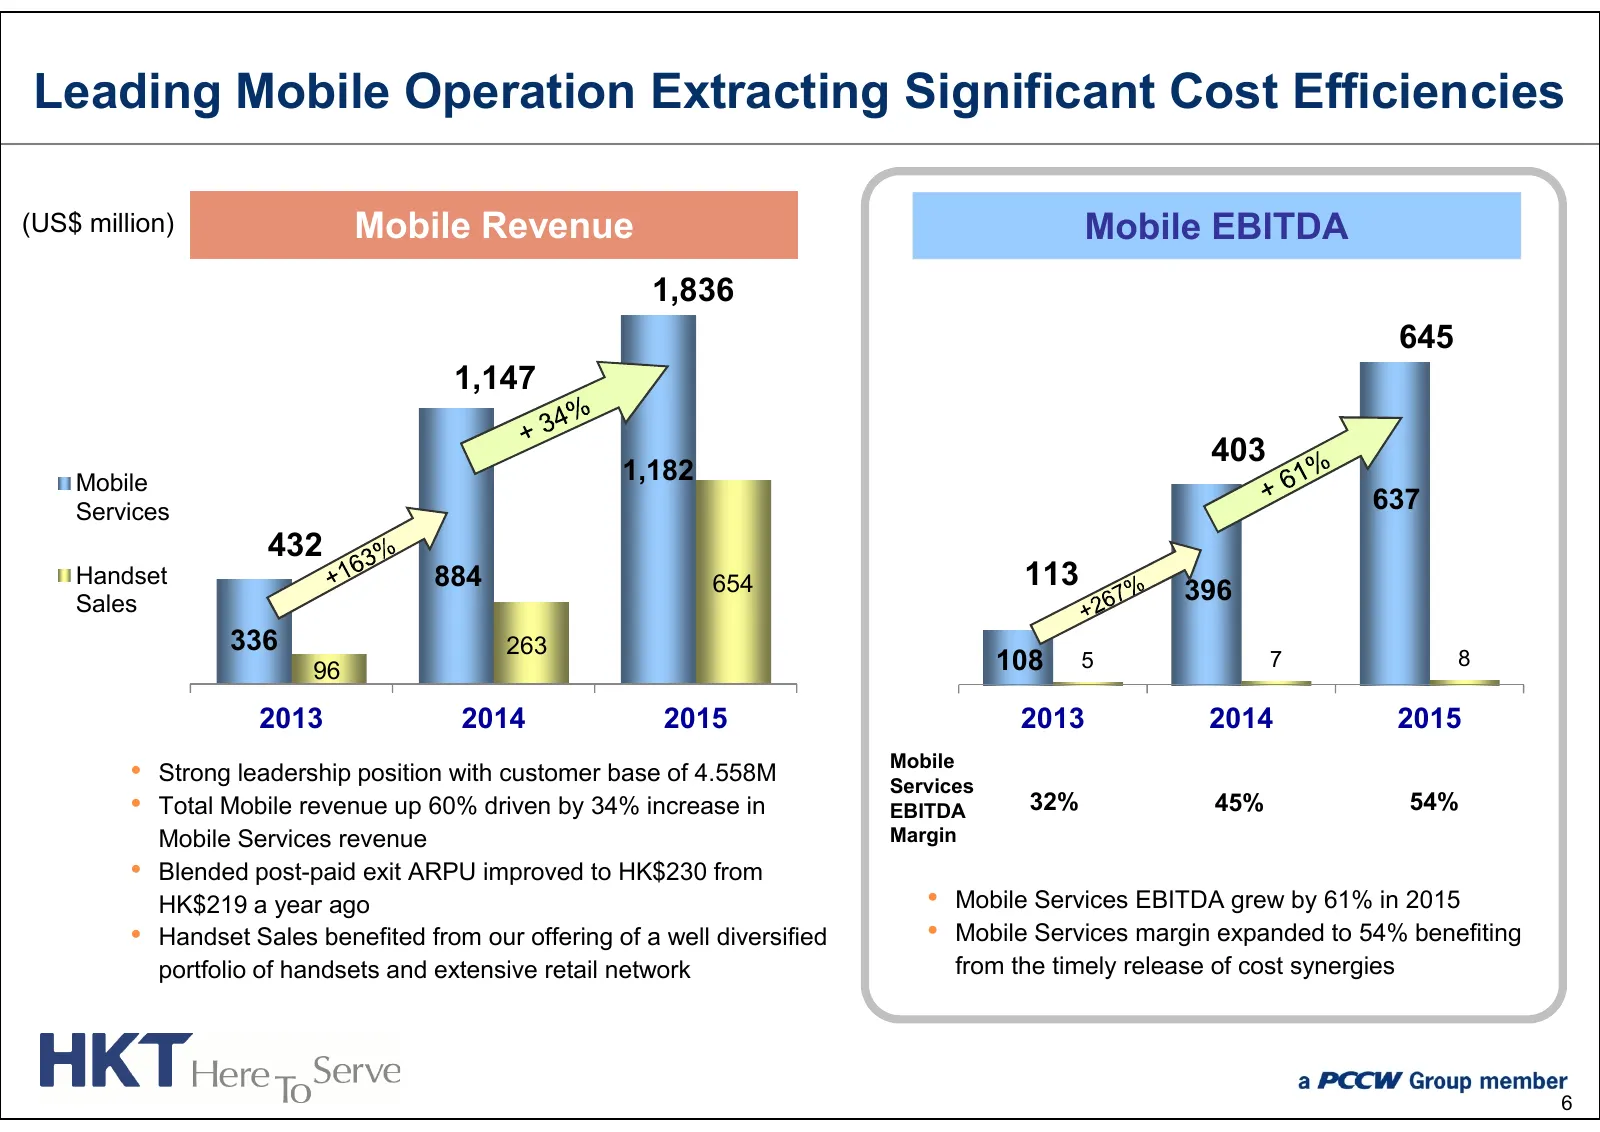
Leading Mobile Operation Extracting Significant Cost Efficiencies (US$ million) Mobile Revenue Mobile EBITDA 1,836 645 1,147 403 Mobile 1,182 Services 637 432 Handset 884 654 113 396 Sales 336 263 96 108 5 7 8 2013 2014 2015 2013 2014 2015 Mobile • Strong leadership position with customer base of 4.
Slide 8: TSS Maintains Steady Growth
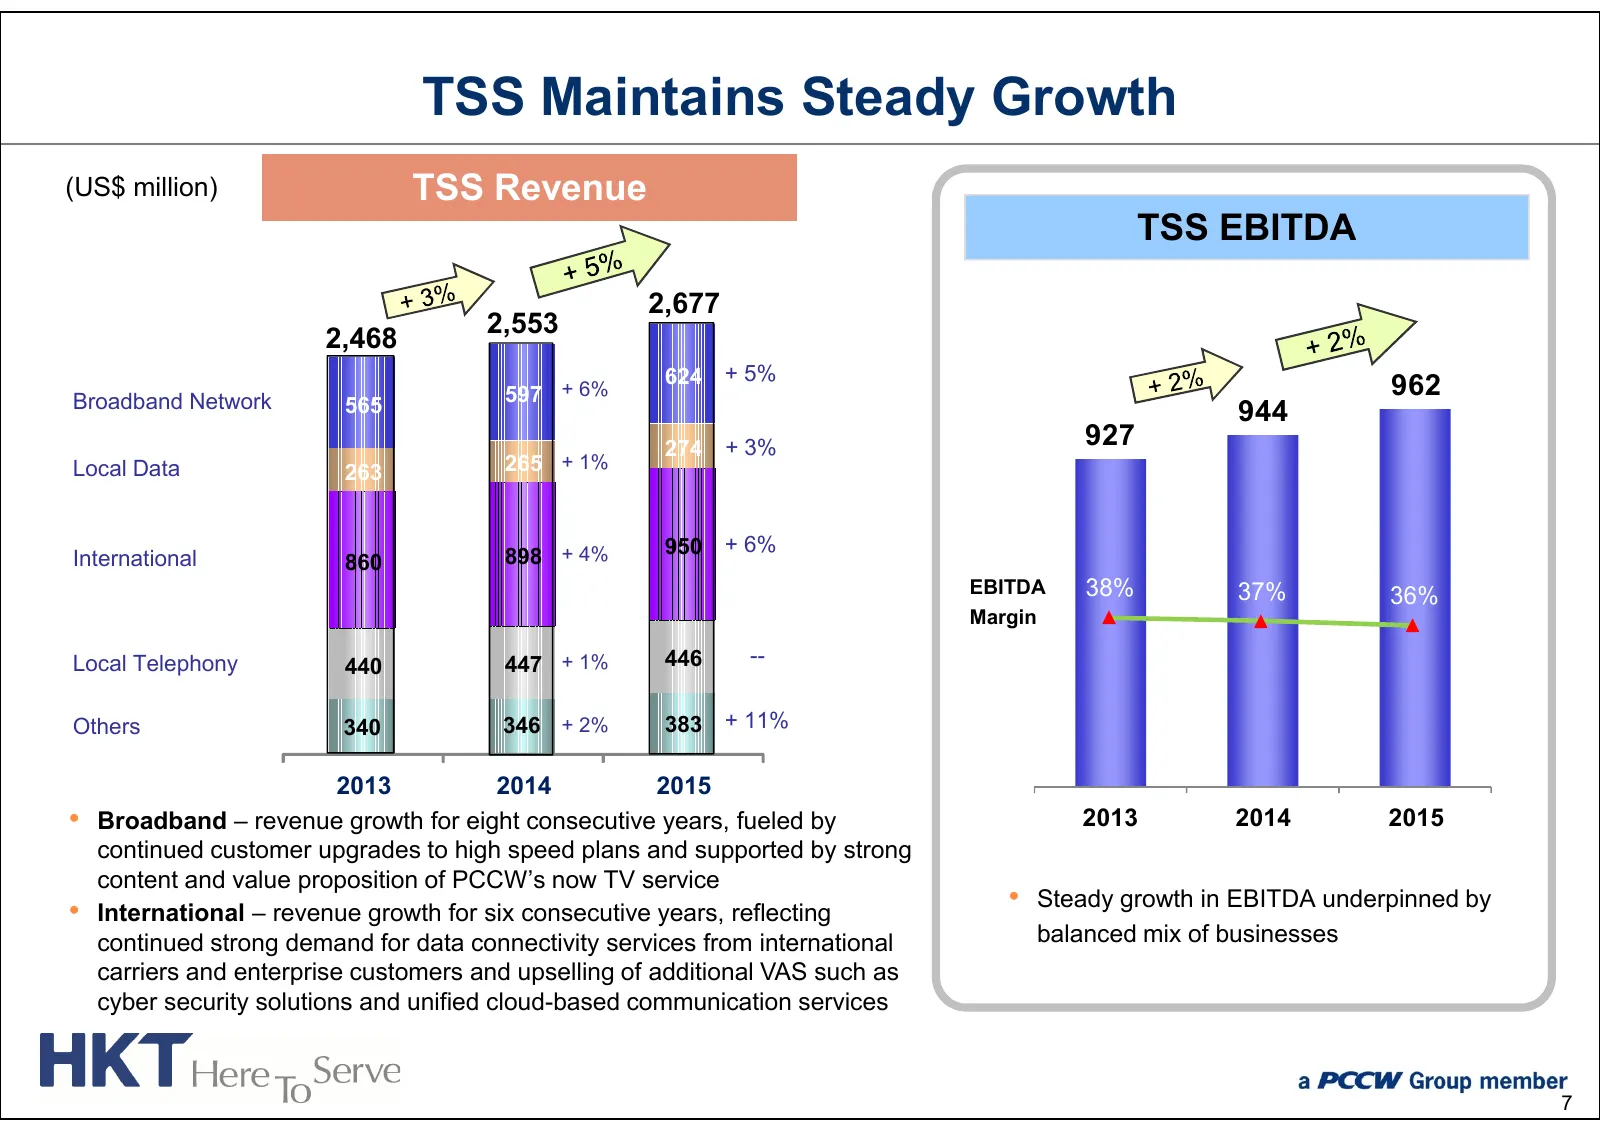
TSS Maintains Steady Growth (US$ million) TSS Revenue TSS EBITDA 2,677 2,553 2,468 624 + 5% 962 Broadband Network 565 597 + 6% 944 274 + 3% 927 Local Data 263 265 + 1% 898 + 4% 950 + 6% International 860 EBITDA 38% 37% 36% Margin Local Telephony 440 447 + 1% 446 -- Others 340 346 + 2% 383 + 11% 2013
Slide 9: More Effective Use of Opex to Drive Business
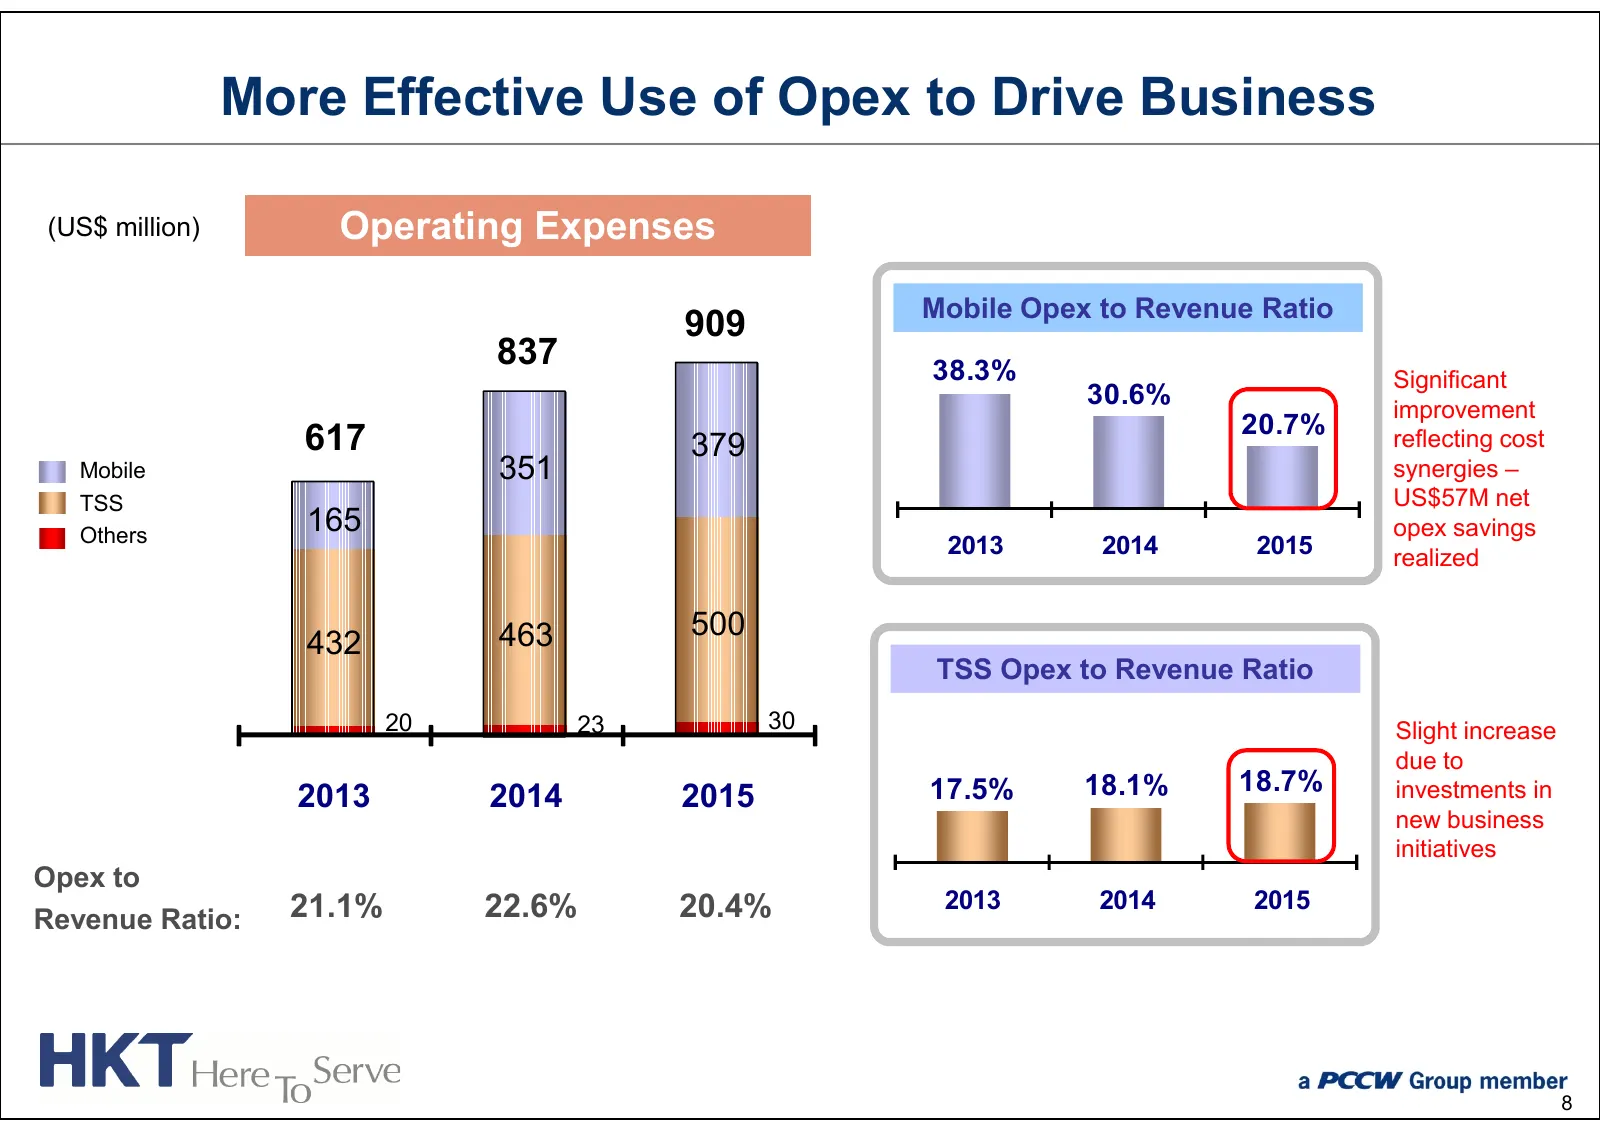
More Effective Use of Opex to Drive Business (US$ million) Operating Expenses Mobile Opex to Revenue Ratio 909 837 38.3% Significant 30.6% improvement 20.7% 617 379 reflecting cost Mobile 351 synergies – TSS US$57M net Others 165 opex savings 2013 2014 2015 realized 463 500 432 TSS Opex to Revenue R
Slide 10: Customer Acquisition Costs Support Business Growth
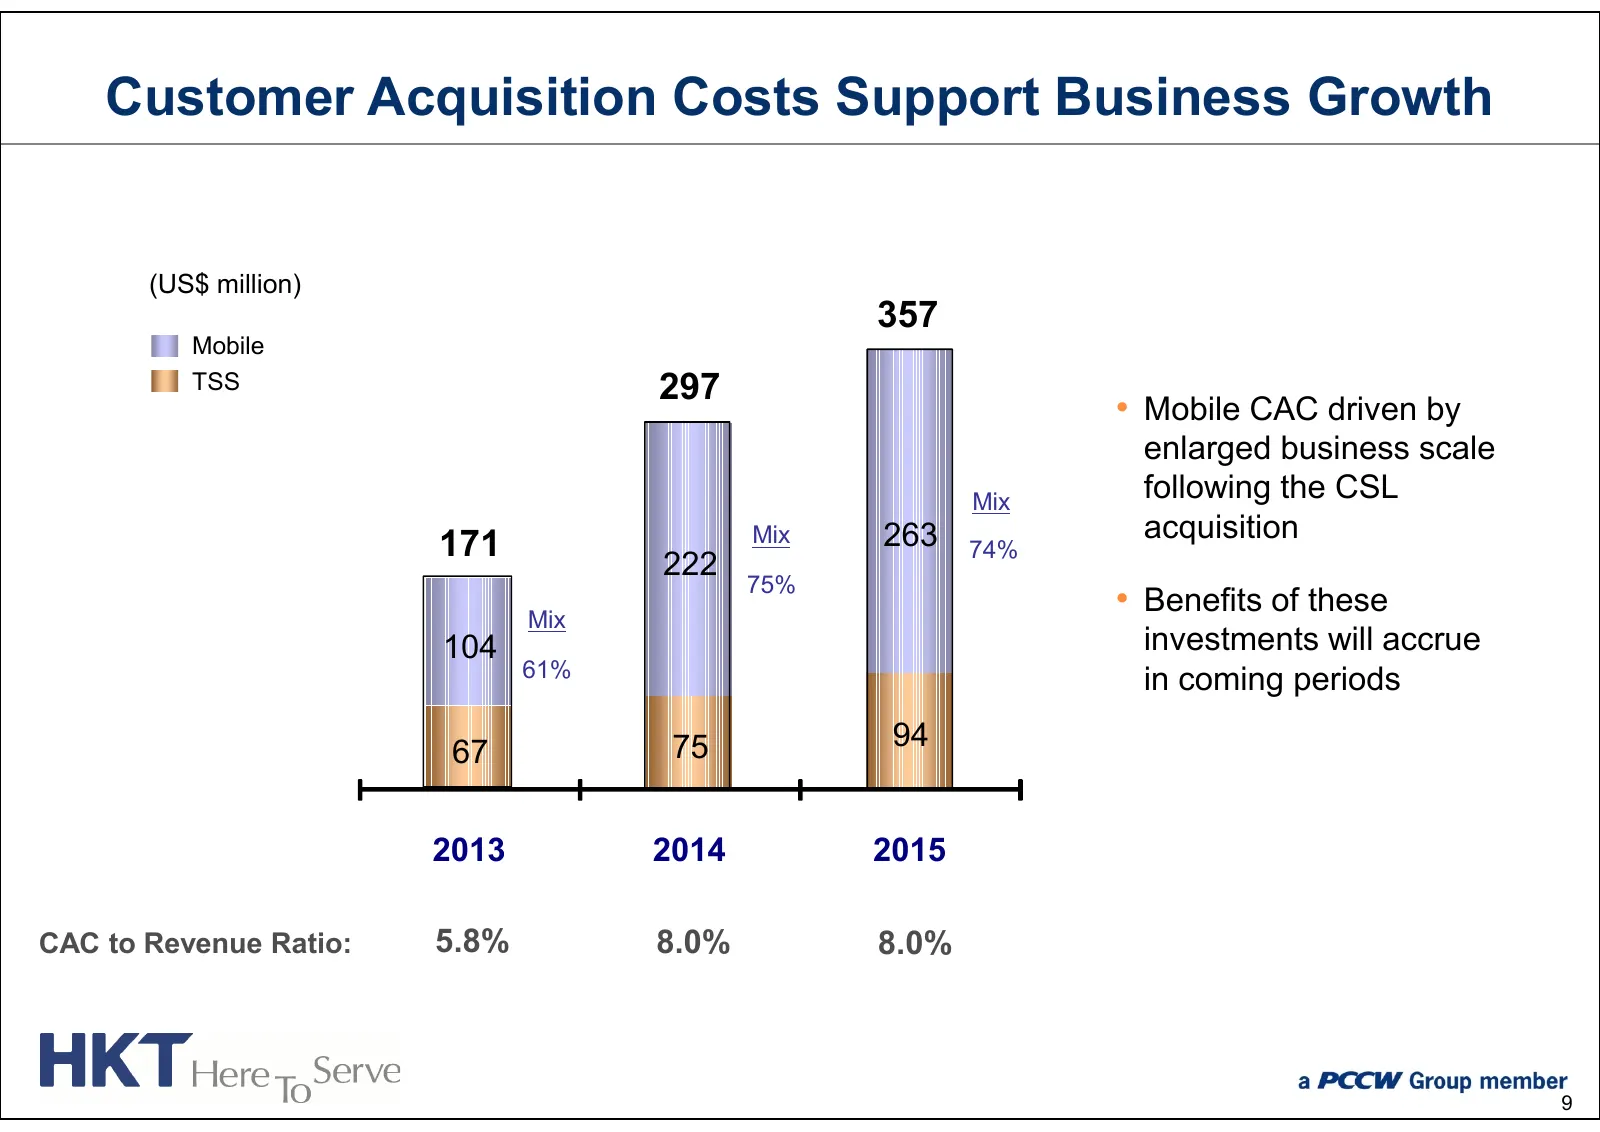
Customer Acquisition Costs Support Business Growth (US$ million) 357 Mobile TSS 297 • Mobile CAC driven by enlarged business scale Mix following the CSL 263 acquisition 171 Mix 74% 222 75% Mix • Benefits of these 104 investments will accrue 61% in coming periods 75 94 67 2013 2014 2015 CAC to Revenu
Slide 11: Optimizing Capex Investments for Better Networks
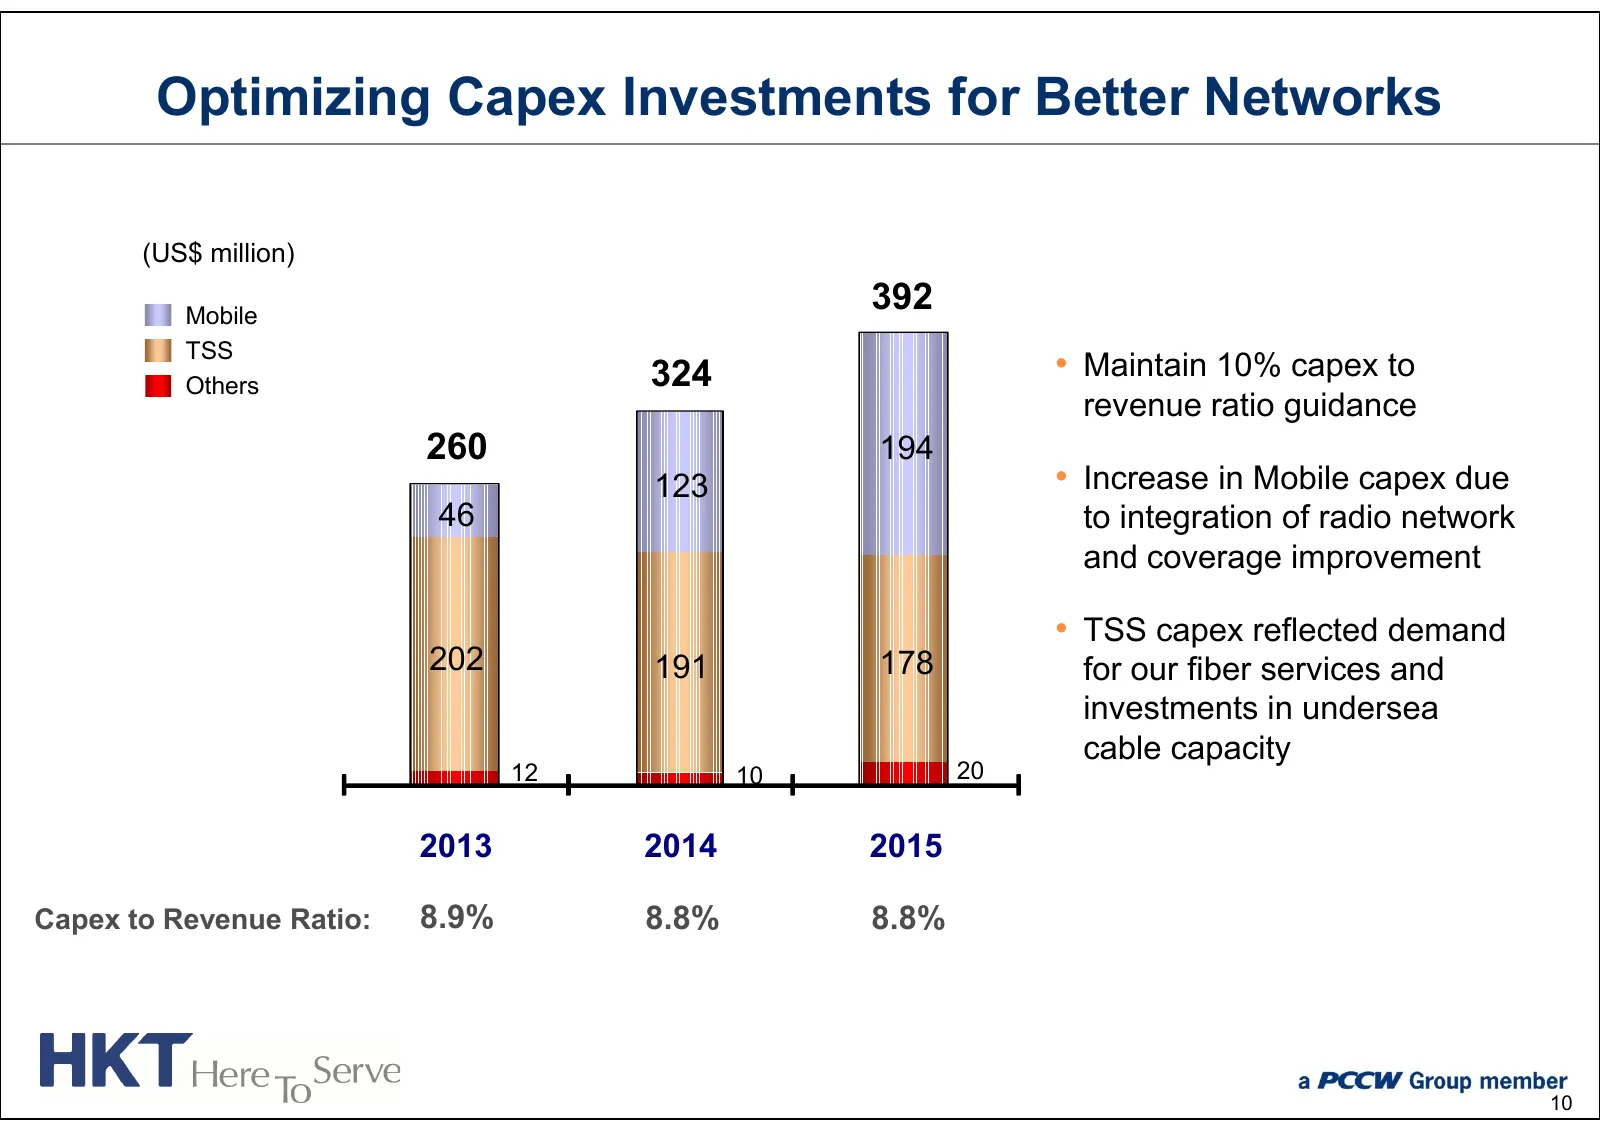
Optimizing Capex Investments for Better Networks (US$ million) Mobile 392 TSS Others 324 • Maintain 10% capex to revenue ratio guidance 260 194 123 • Increase in Mobile capex due 46 to integration of radio network and coverage improvement • TSS capex reflected demand 202 191 178 for our fiber servic
Slide 12: Adjusted Funds Flow
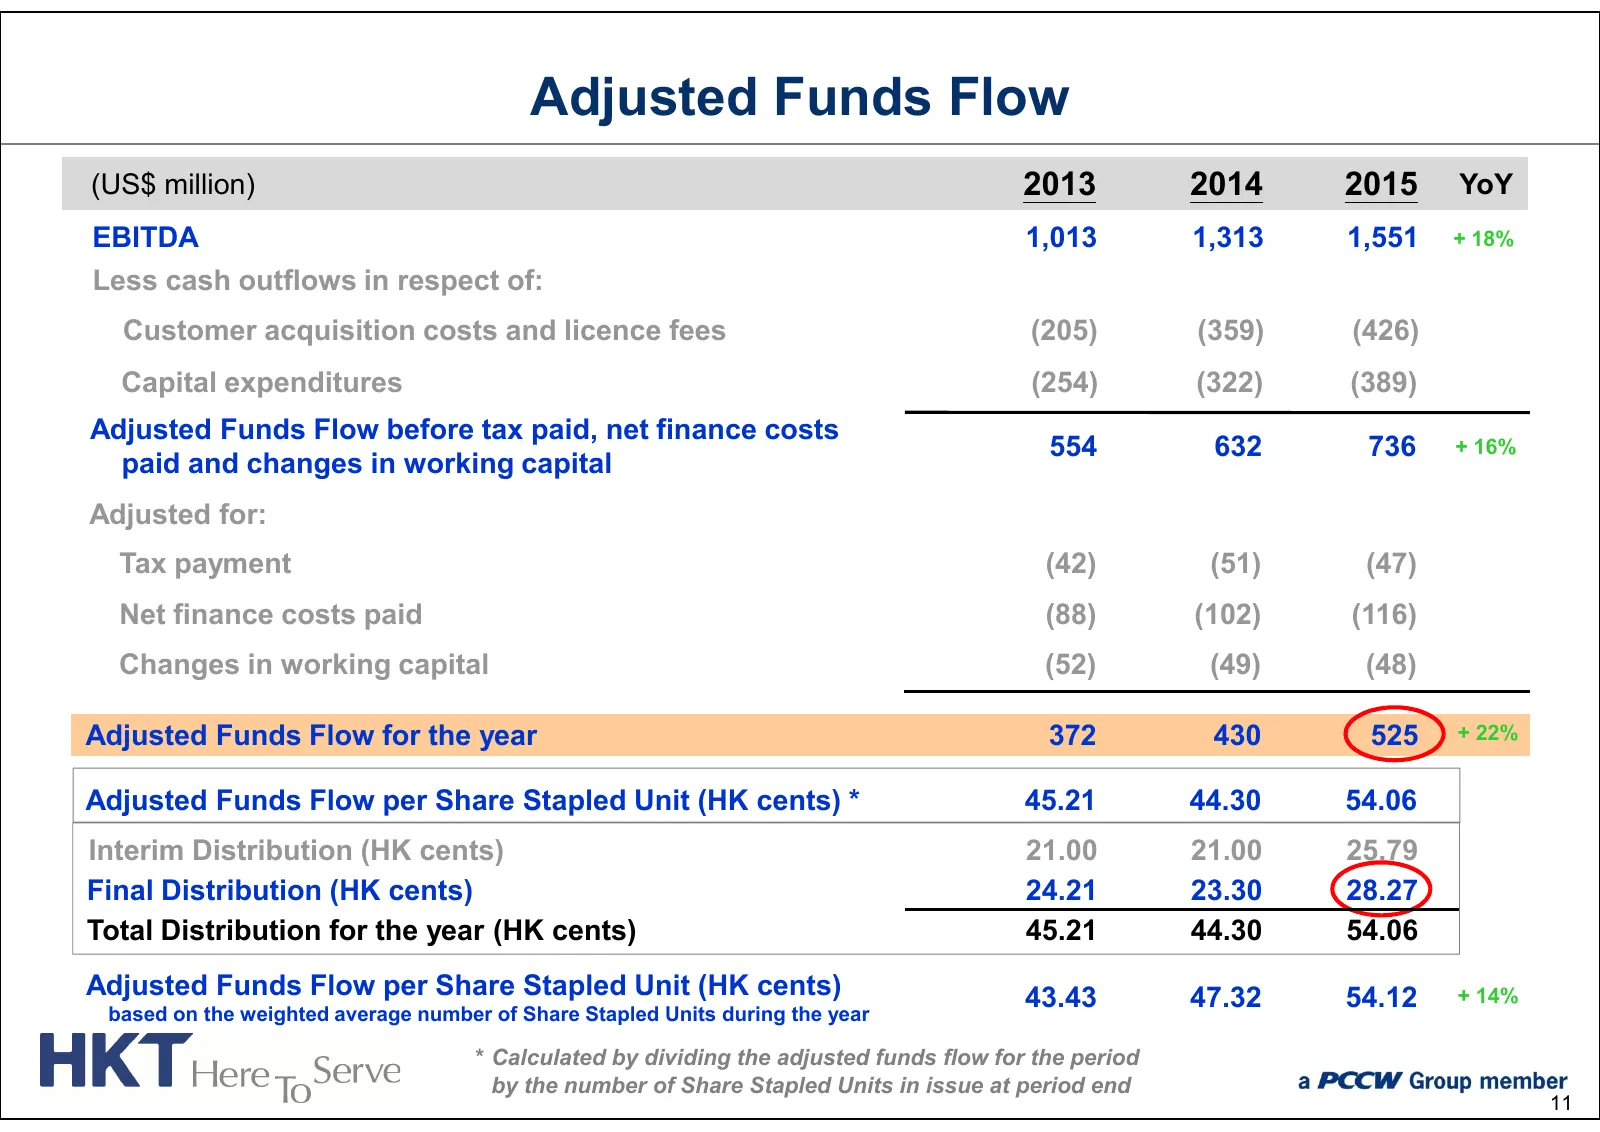
Adjusted Funds Flow (US$ million) 2013 2014 2015 YoY EBITDA 1,013 1,313 1,551 + 18% Less cash outflows in respect of: Customer acquisition costs and licence fees (205) (359) (426) Capital expenditures (254) (322) (389) Adjusted Funds Flow before tax paid, net finance costs 554 632 736 + 16% paid and
Slide 13: Income Statement
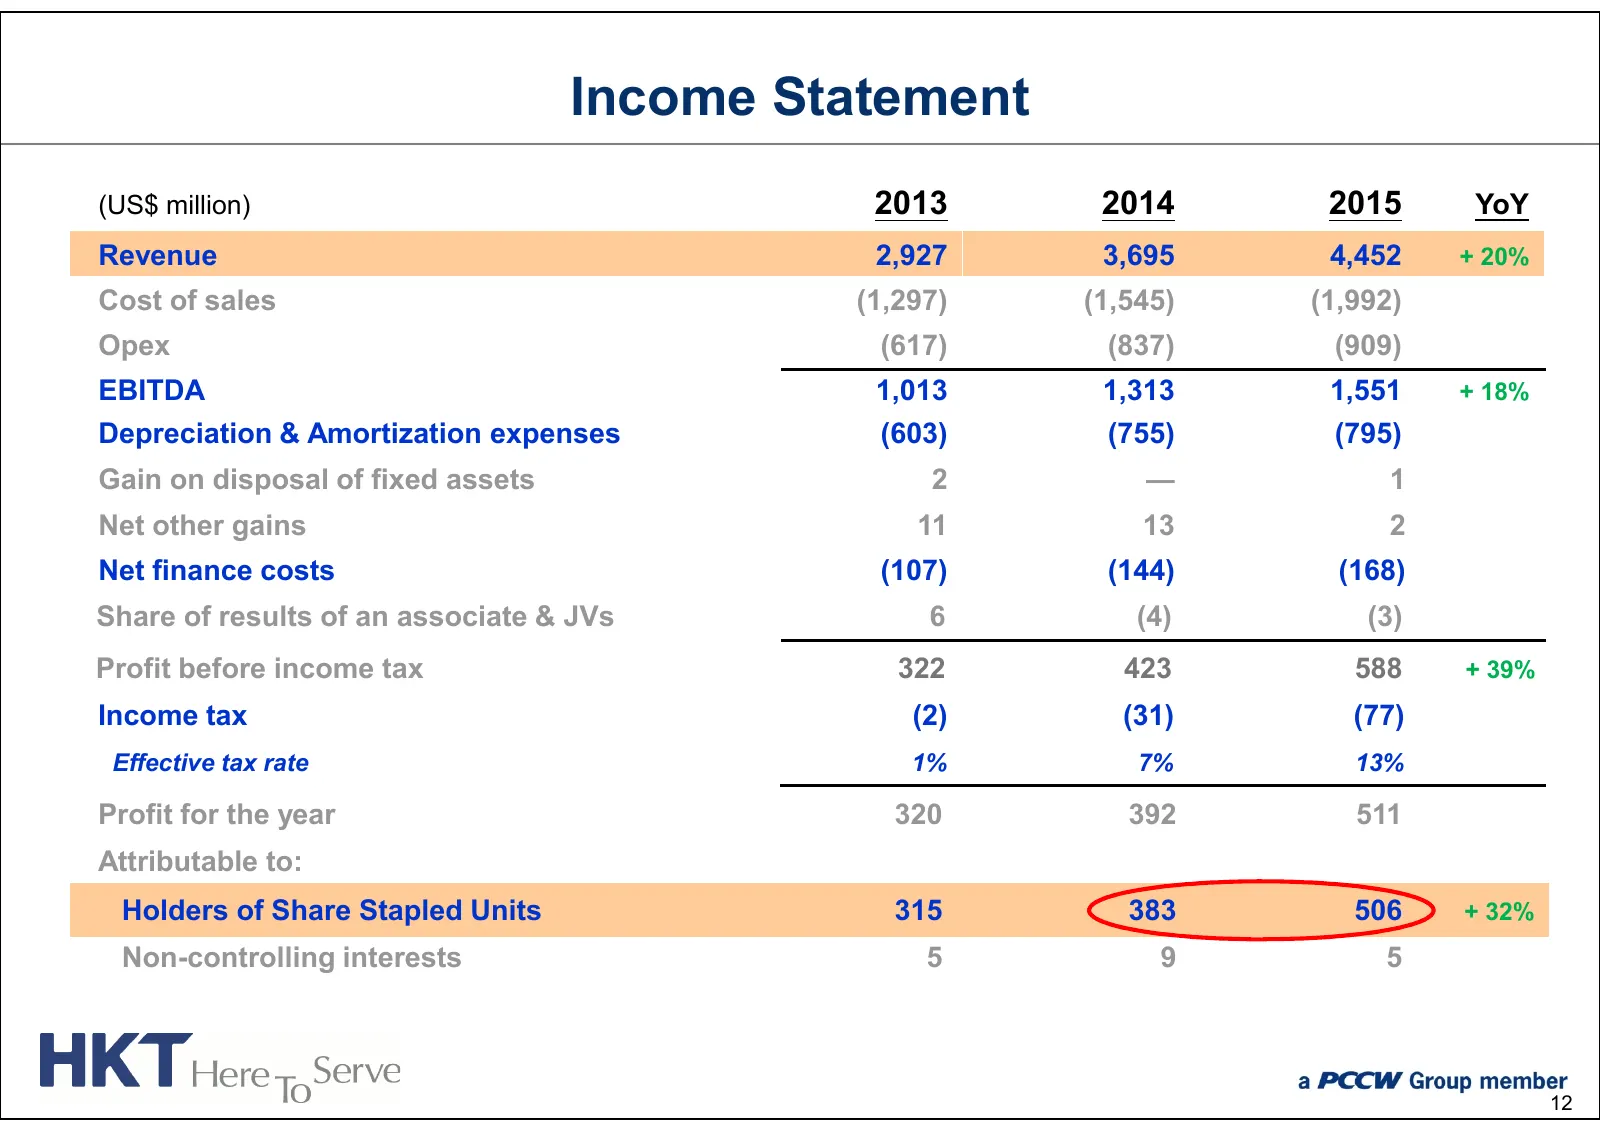
Income Statement (US$ million) 2013 2014 2015 YoY Revenue 2,927 3,695 4,452 + 20% Cost of sales (1,297) (1,545) (1,992) Opex (617) (837) (909) EBITDA 1,013 1,313 1,551 + 18% Depreciation & Amortization expenses (603) (755) (795) Gain on disposal of fixed assets 2 — 1 Net other gains 11 13 2 Net fina
Slide 14: Maintaining a Solid Financial Position
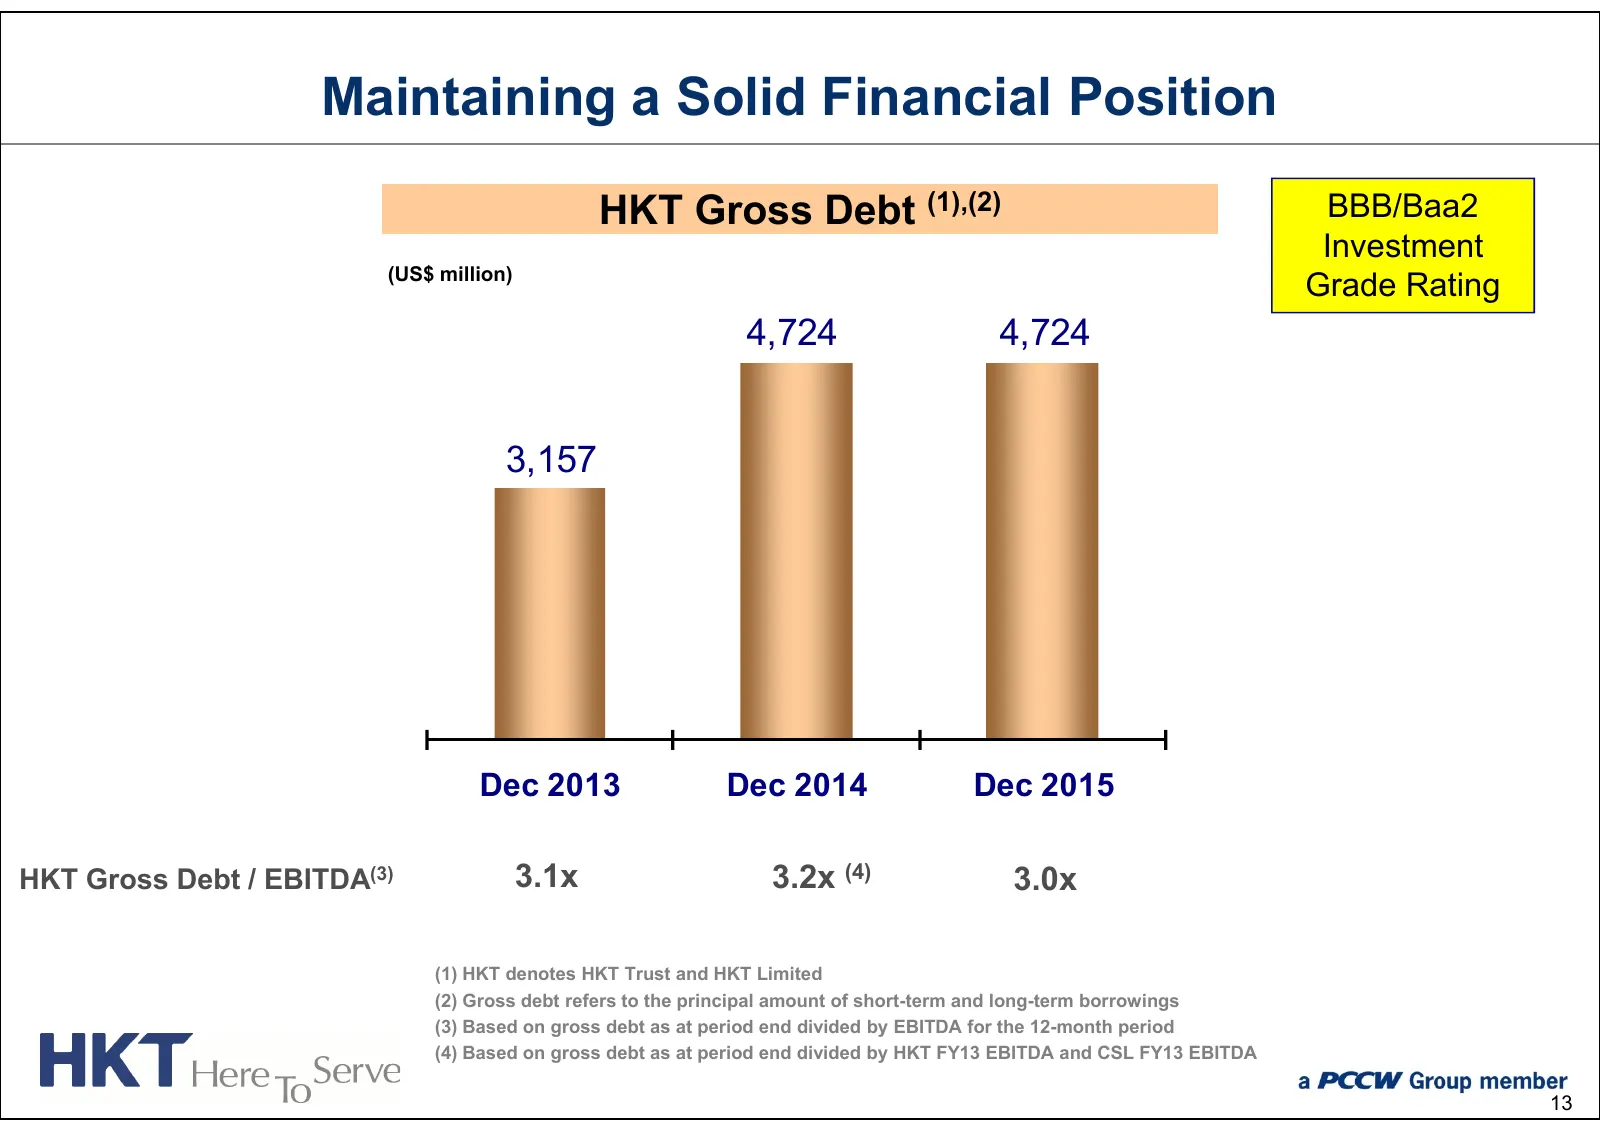
Maintaining a Solid Financial Position HKT Gross Debt (1),(2) BBB/Baa2 Investment (US$ million) Grade Rating 4,724 4,724 3,157 Dec 2013 Dec 2014 Dec 2015 HKT Gross Debt / EBITDA(3) 3.1x 3.2x (4) 3.0x (1) HKT denotes HKT Trust and HKT Limited (2) Gross debt refers to the principal amount of short-ter
Slide 15: Debt Maturity Profile
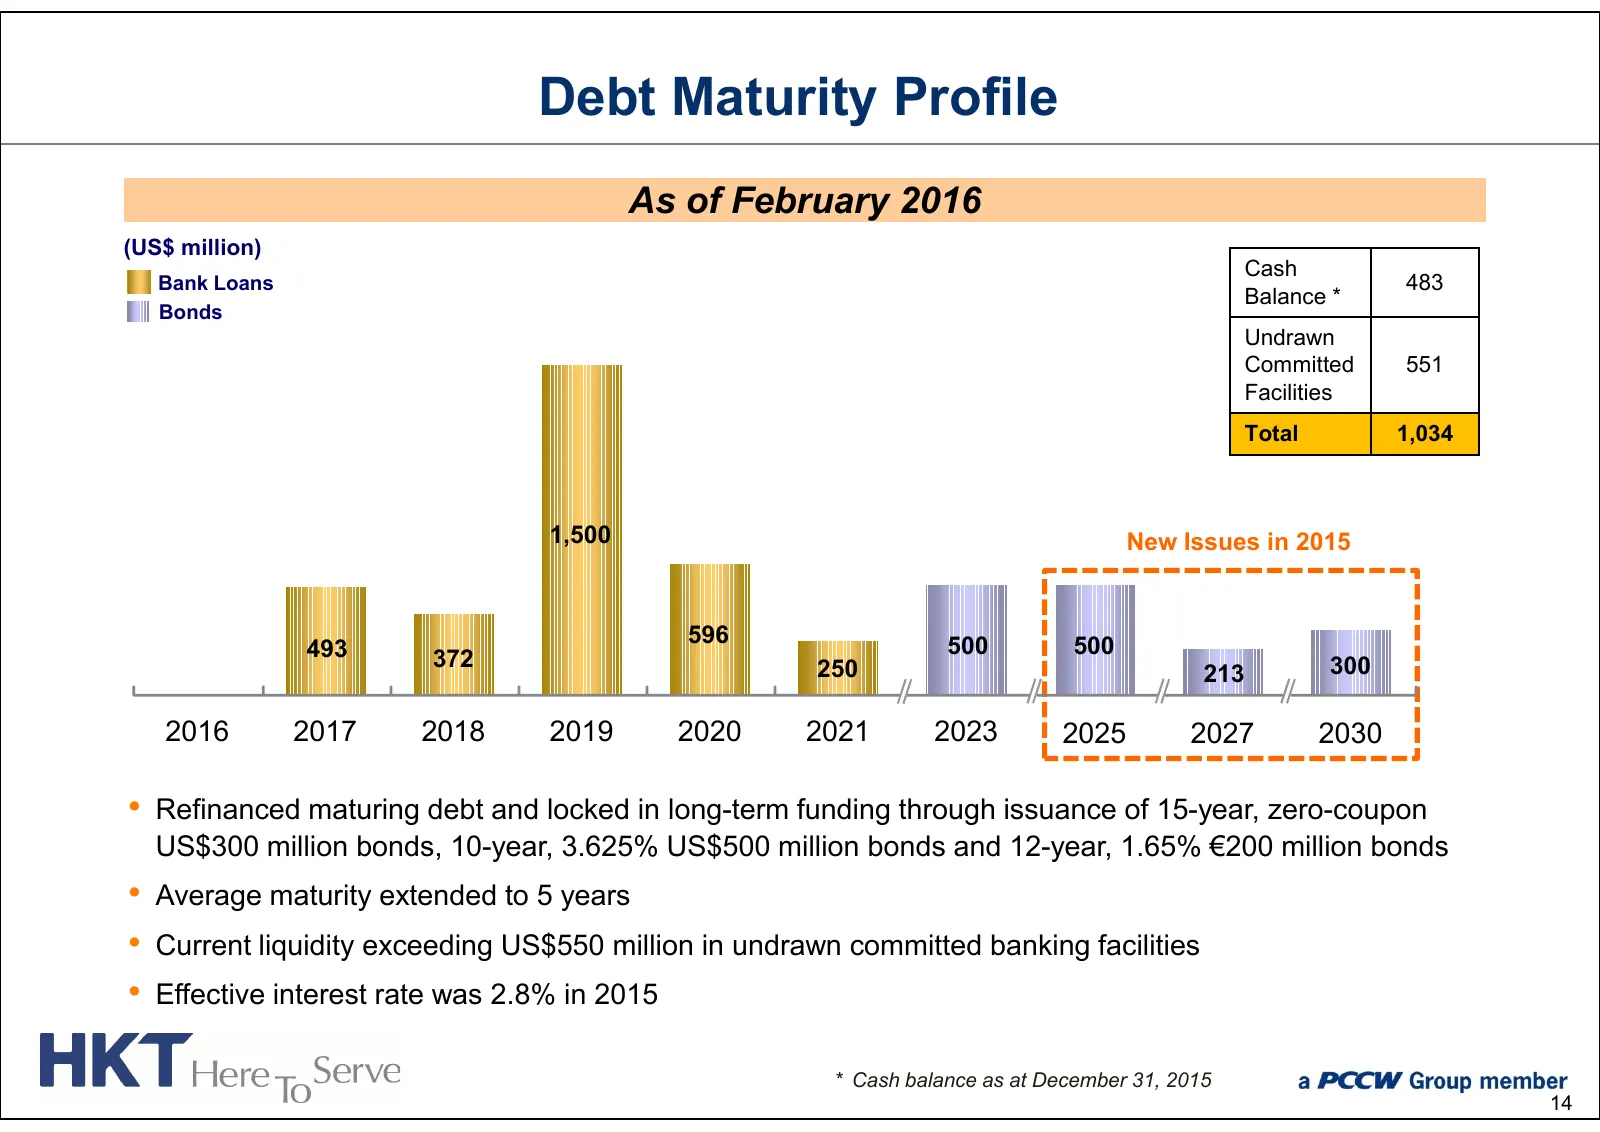
Debt Maturity Profile As of February 2016 (US$ million) Cash Bank Loans 483 Balance * Bonds Undrawn Committed 551 Facilities Total 1,034 1,500 New Issues in 2015 596 500 500 493 372 250 213 300 2016 2017 2018 2019 2020 2021 2023 2025 2027 2030 • Refinanced maturing debt and locked in long-term fundi
Slide 16: Business Review
Business Review Alex Arena Group Managing Director 15
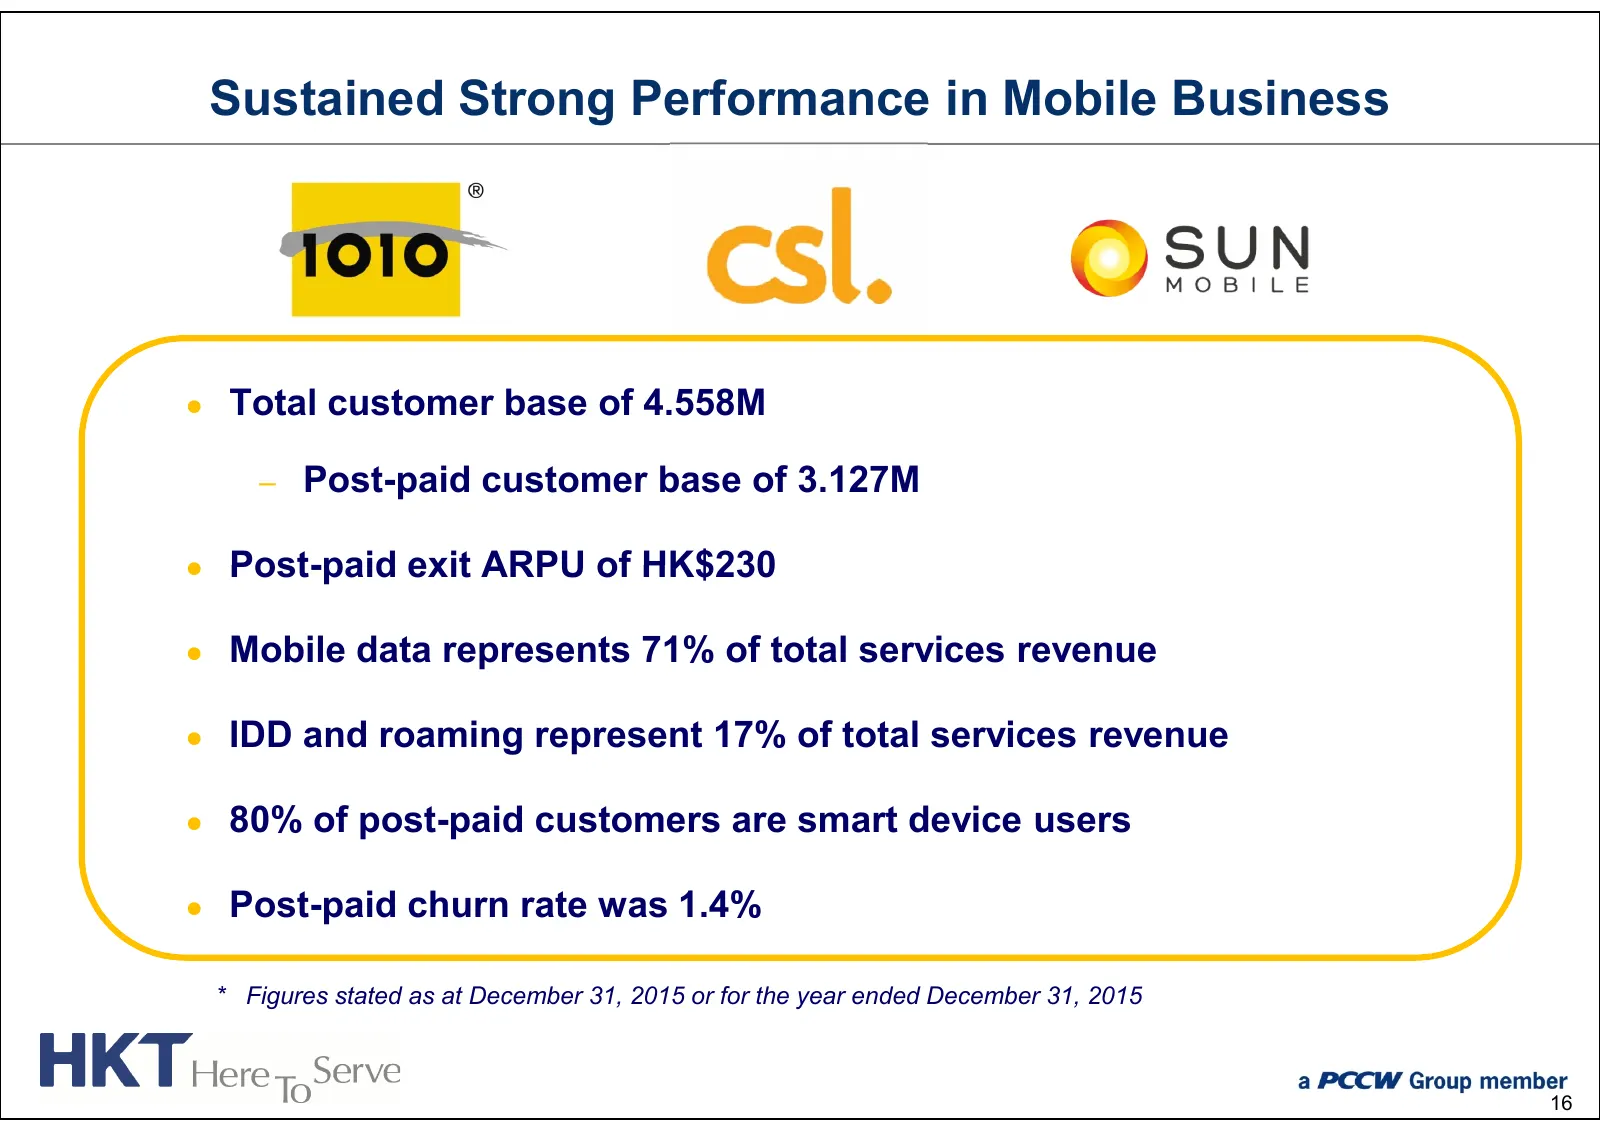
Slide 17: Sustained Strong Performance in Mobile Business
Sustained Strong Performance in Mobile Business ● Total customer base of 4.558M – Post-paid customer base of 3.127M ● Post-paid exit ARPU of HK$230 ● Mobile data represents 71% of total services revenue ● IDD and roaming represent 17% of total services revenue ● 80% of post-paid customers are smart
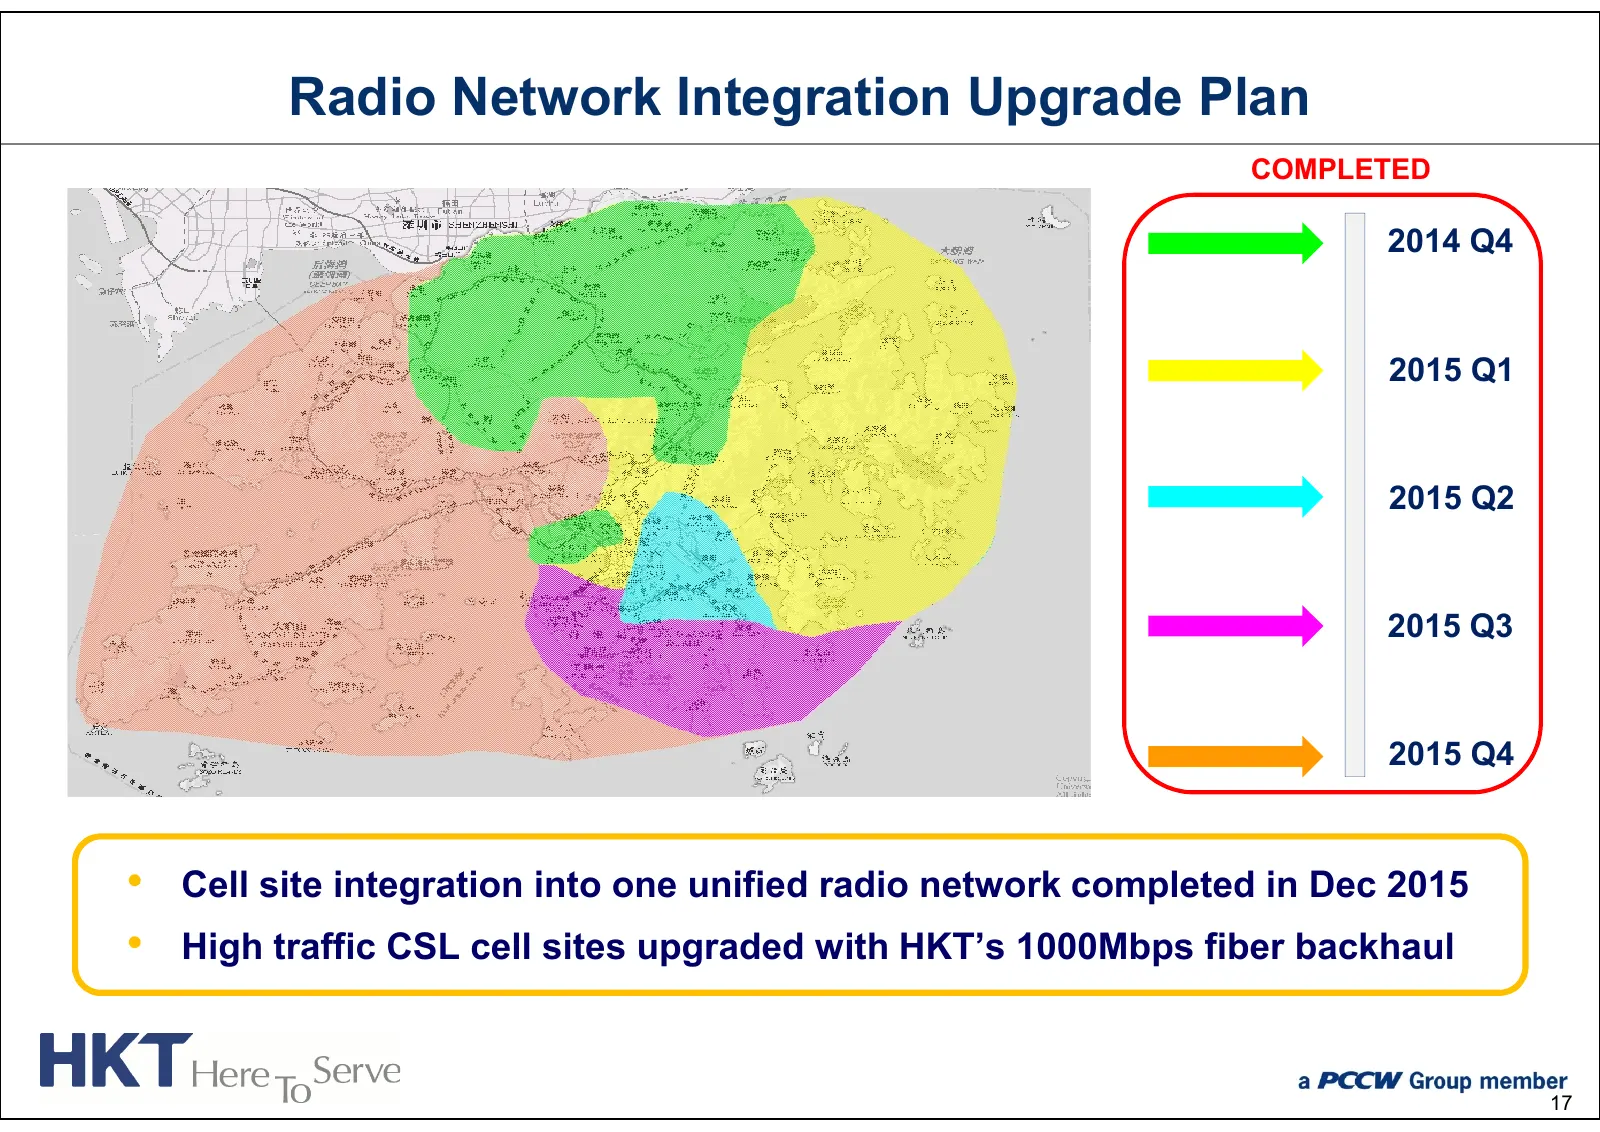
Slide 18: Radio Network Integration Upgrade Plan
Radio Network Integration Upgrade Plan COMPLETED 2014 Q4 2015 Q1 2015 Q2 2015 Q3 2015 Q4 • Cell site integration into one unified radio network completed in Dec 2015 • High traffic CSL cell sites upgraded with HKT’s 1000Mbps fiber backhaul 17
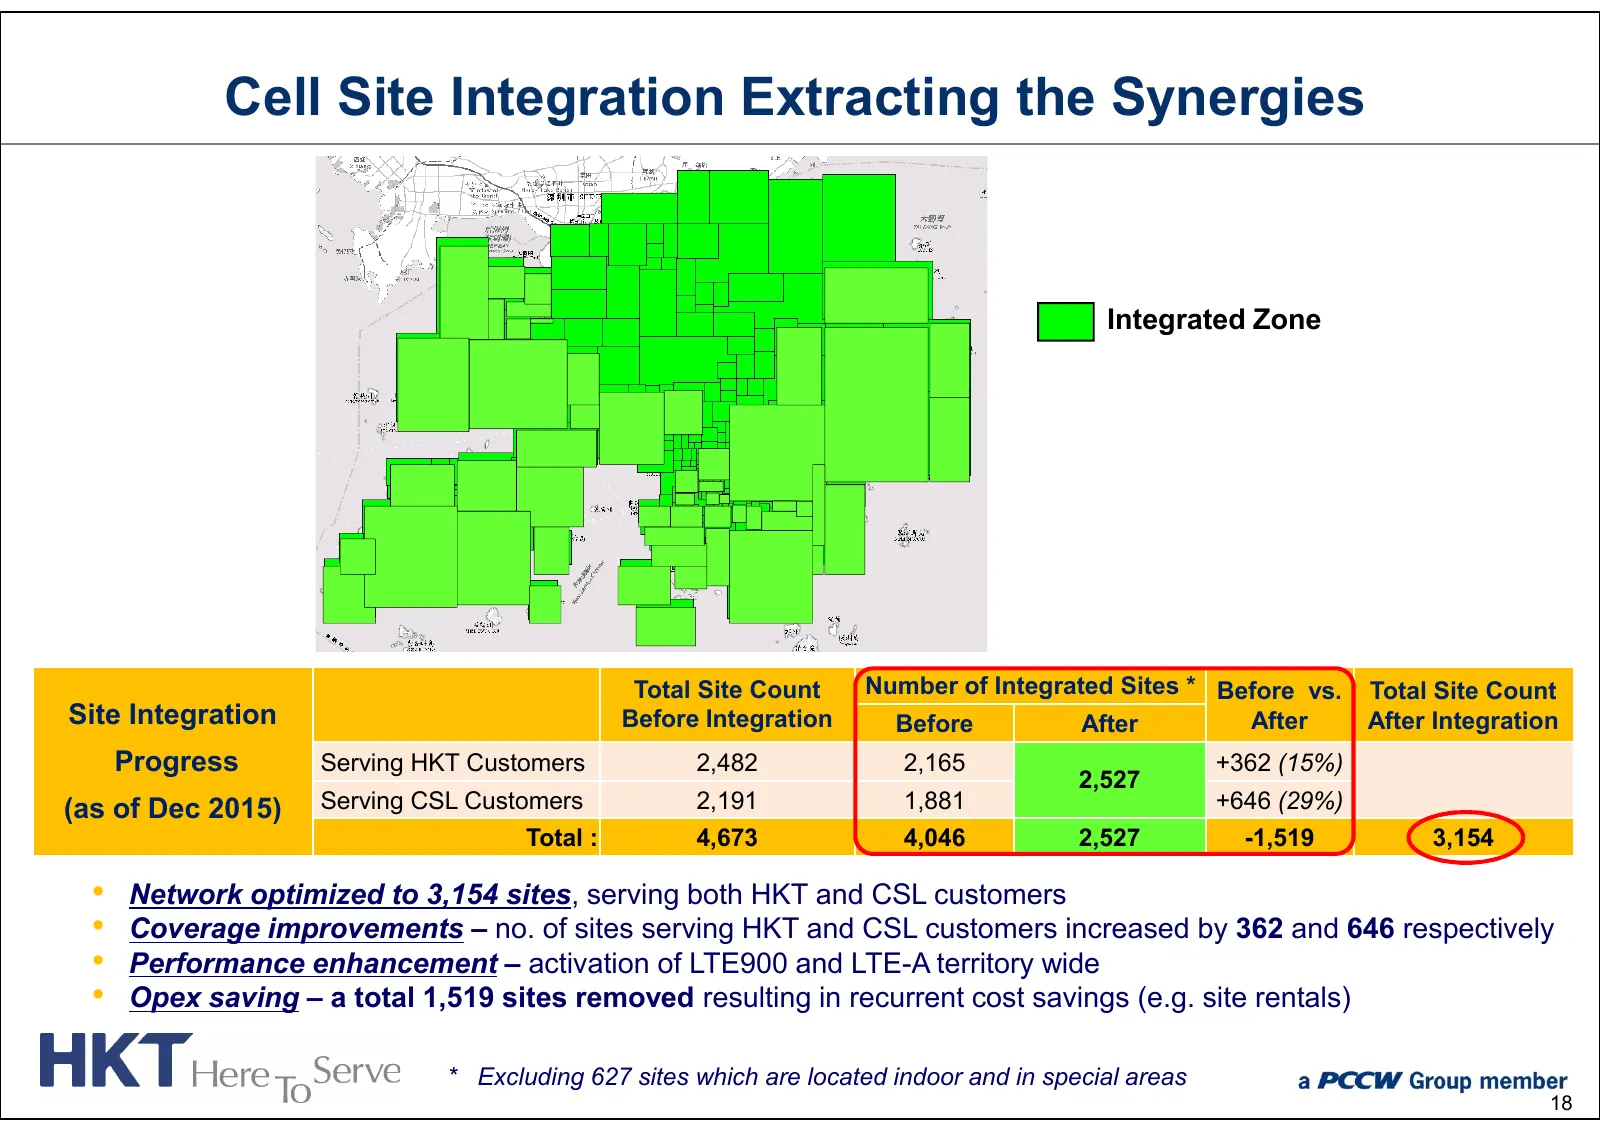
Slide 19: Cell Site Integration Extracting the Synergies
Cell Site Integration Extracting the Synergies Integrated Zone Turn Green in 2H 2015 Total Site Count Number of Integrated Sites * Before vs. Total Site Count Site Integration Before Integration Before After After After Integration Progress Serving HKT Customers 2,482 2,165 +362 (15%) 2,527 (as of D
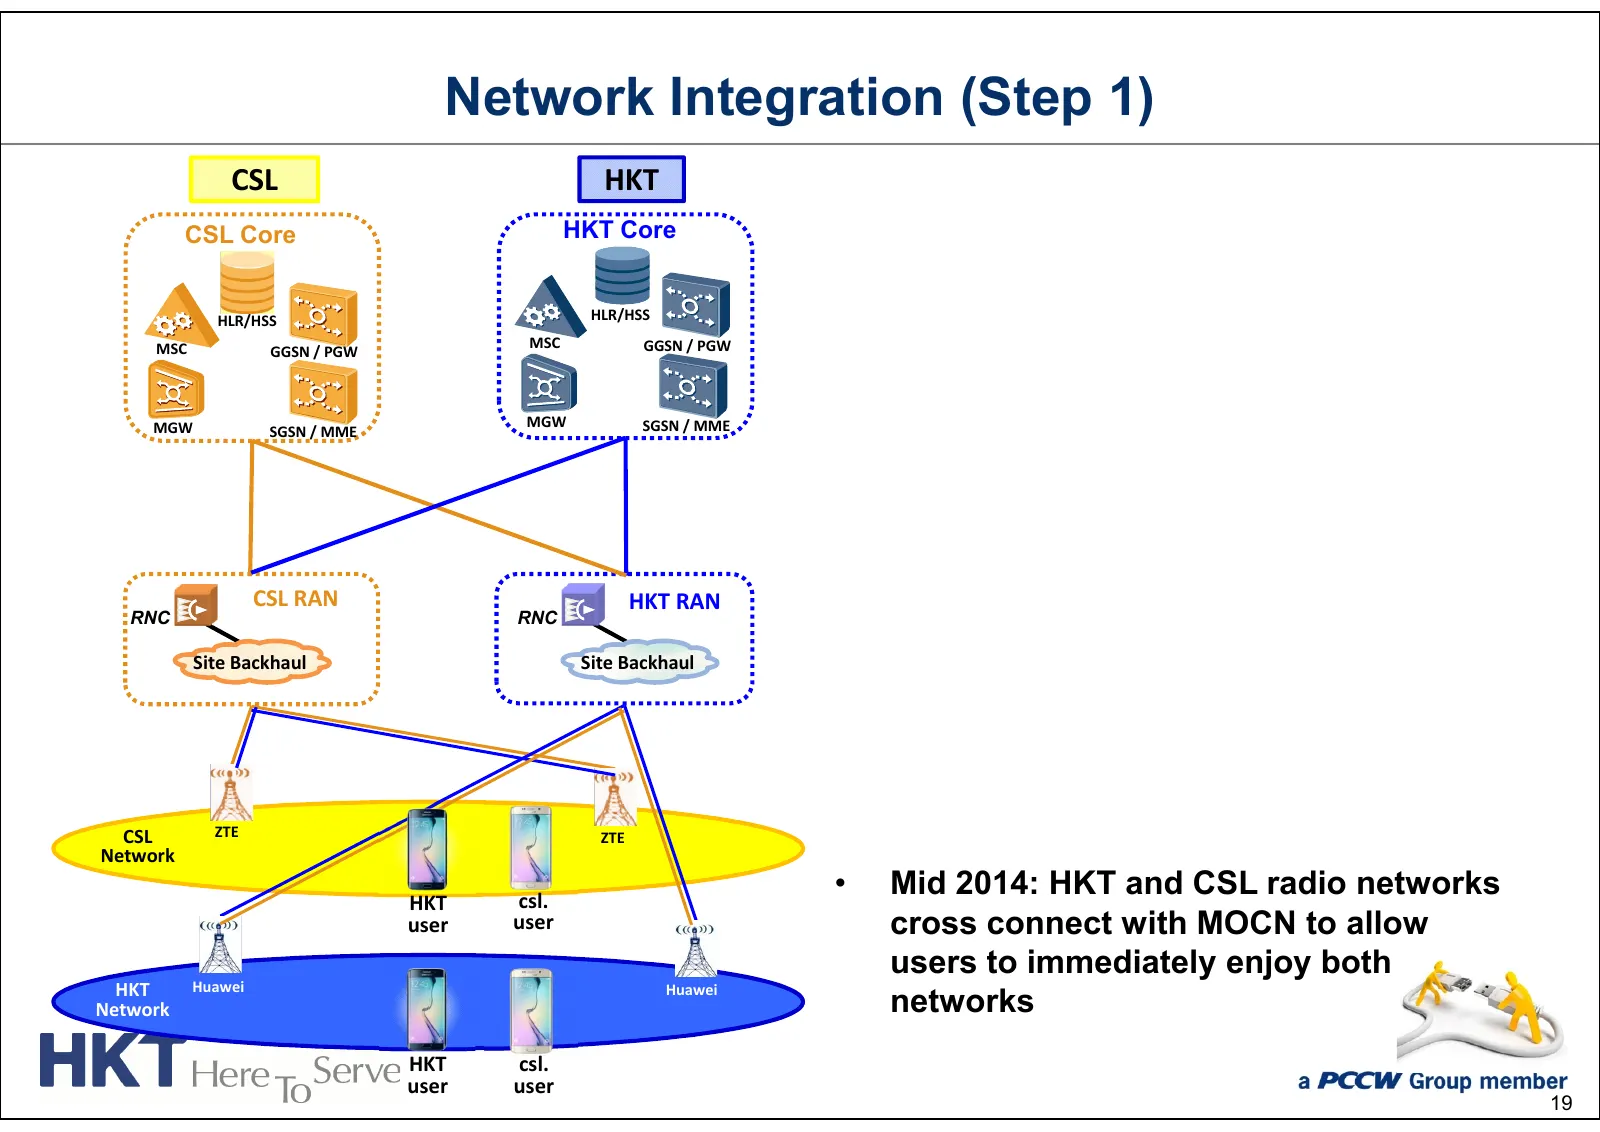
Slide 20: Network Integration (Step 1)
Network Integration (Step 1) CSL HKT CSL Core HKT Core HLR/HSS HLR/HSS MSC MSC GGSN / PGW GGSN / PGW MGW MGW SGSN / MME SGSN / MME CSL RAN HKT RAN RNC RNC Site Backhaul Site Backhaul CSL ZTE ZTE Network HKT csl. • Mid 2014: HKT and CSL radio networks user user cross connect with MOCN to allow users
Slide 21: Network Integration (Step 2)
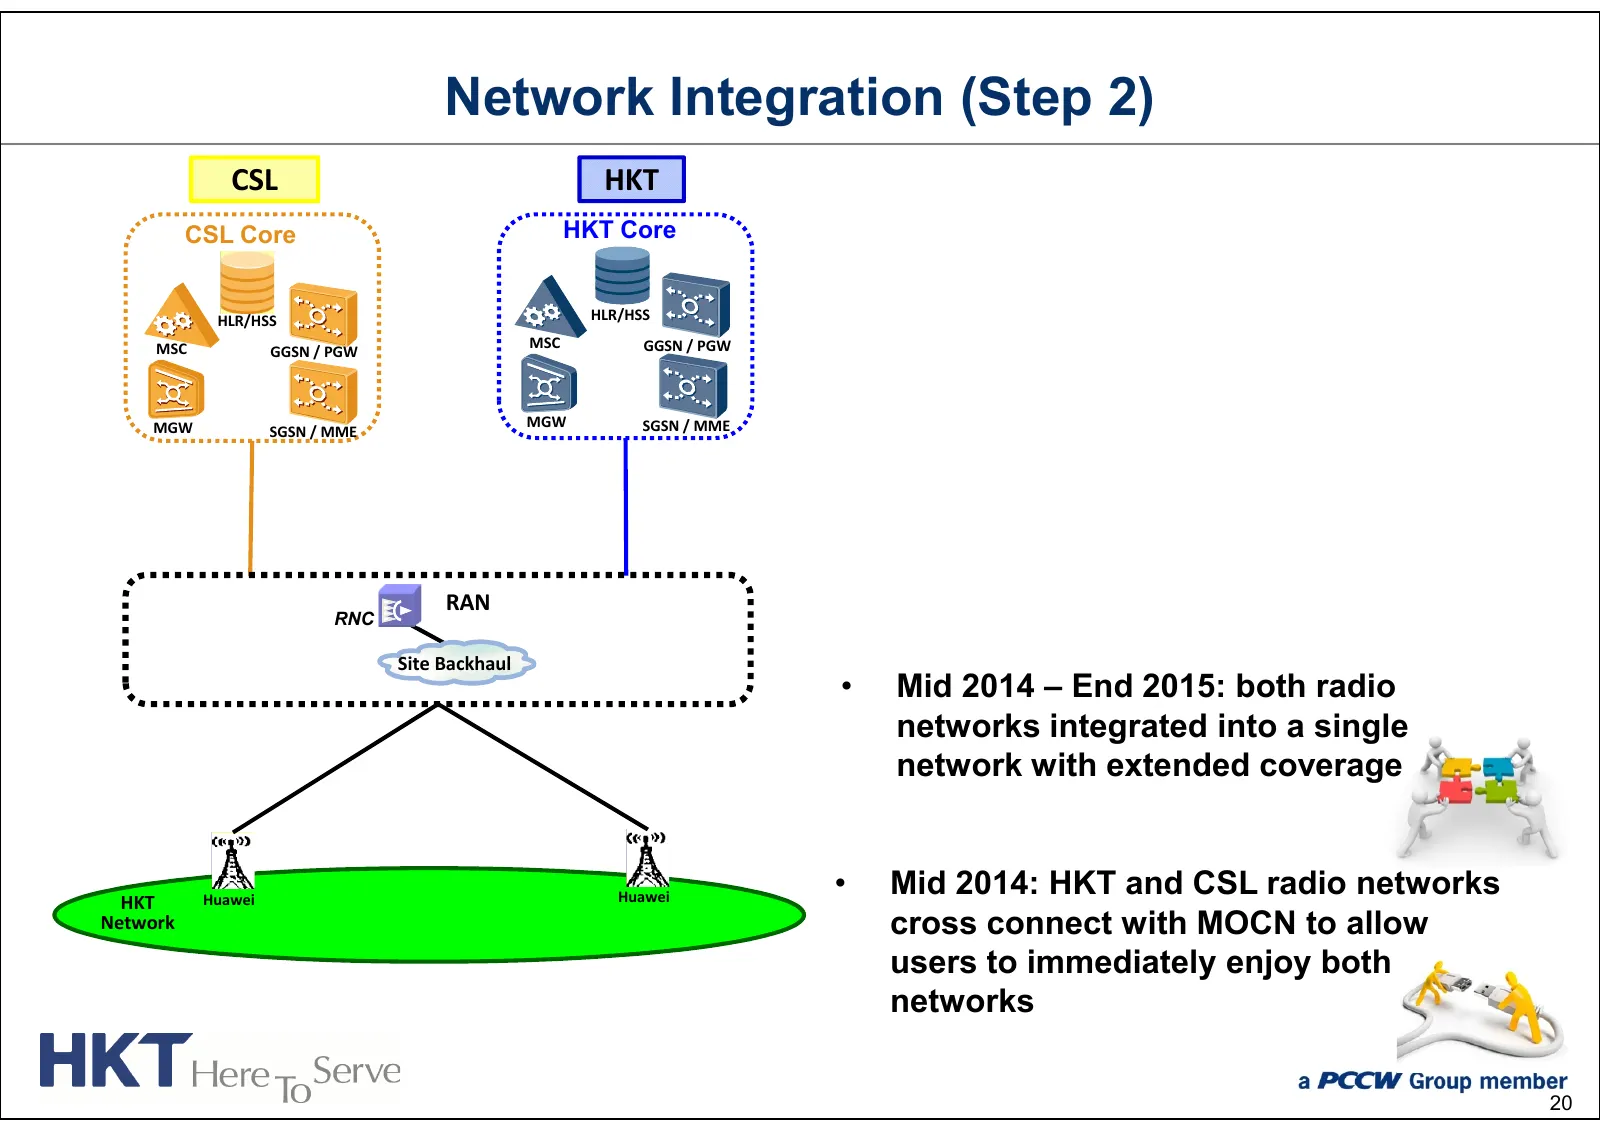
Network Integration (Step 2) CSL HKT CSL Core HKT Core HLR/HSS HLR/HSS MSC MSC GGSN / PGW GGSN / PGW MGW MGW SGSN / MME SGSN / MME RAN RNC Site Backhaul • Mid 2014 – End 2015: both radio networks integrated into a single network with extended coverage HKT Huawei Huawei • Mid 2014: HKT and CSL radio
Slide 22: Network Integration (Step 3)
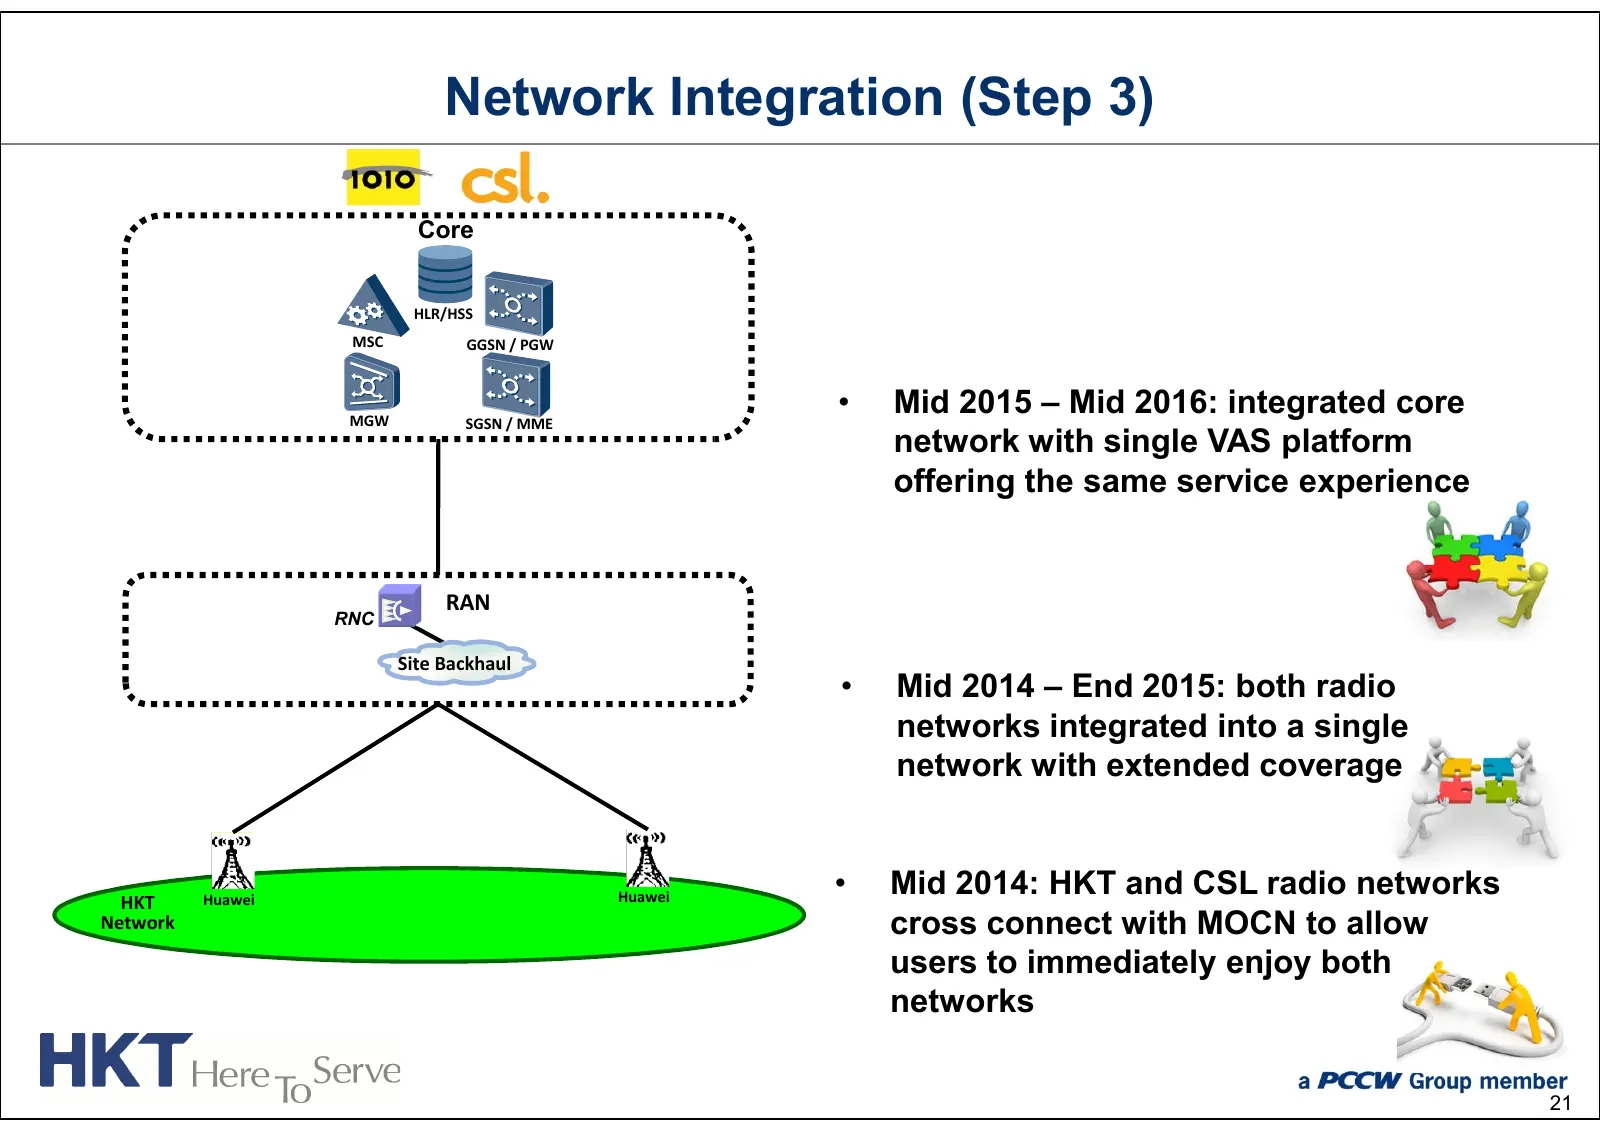
Network Integration (Step 3) Core HLR/HSS MSC GGSN / PGW MGW • Mid 2015 – Mid 2016: integrated core SGSN / MME network with single VAS platform offering the same service experience RAN RNC Site Backhaul • Mid 2014 – End 2015: both radio networks integrated into a single network with extended coverag
Slide 23: Network Integration (Step 4)
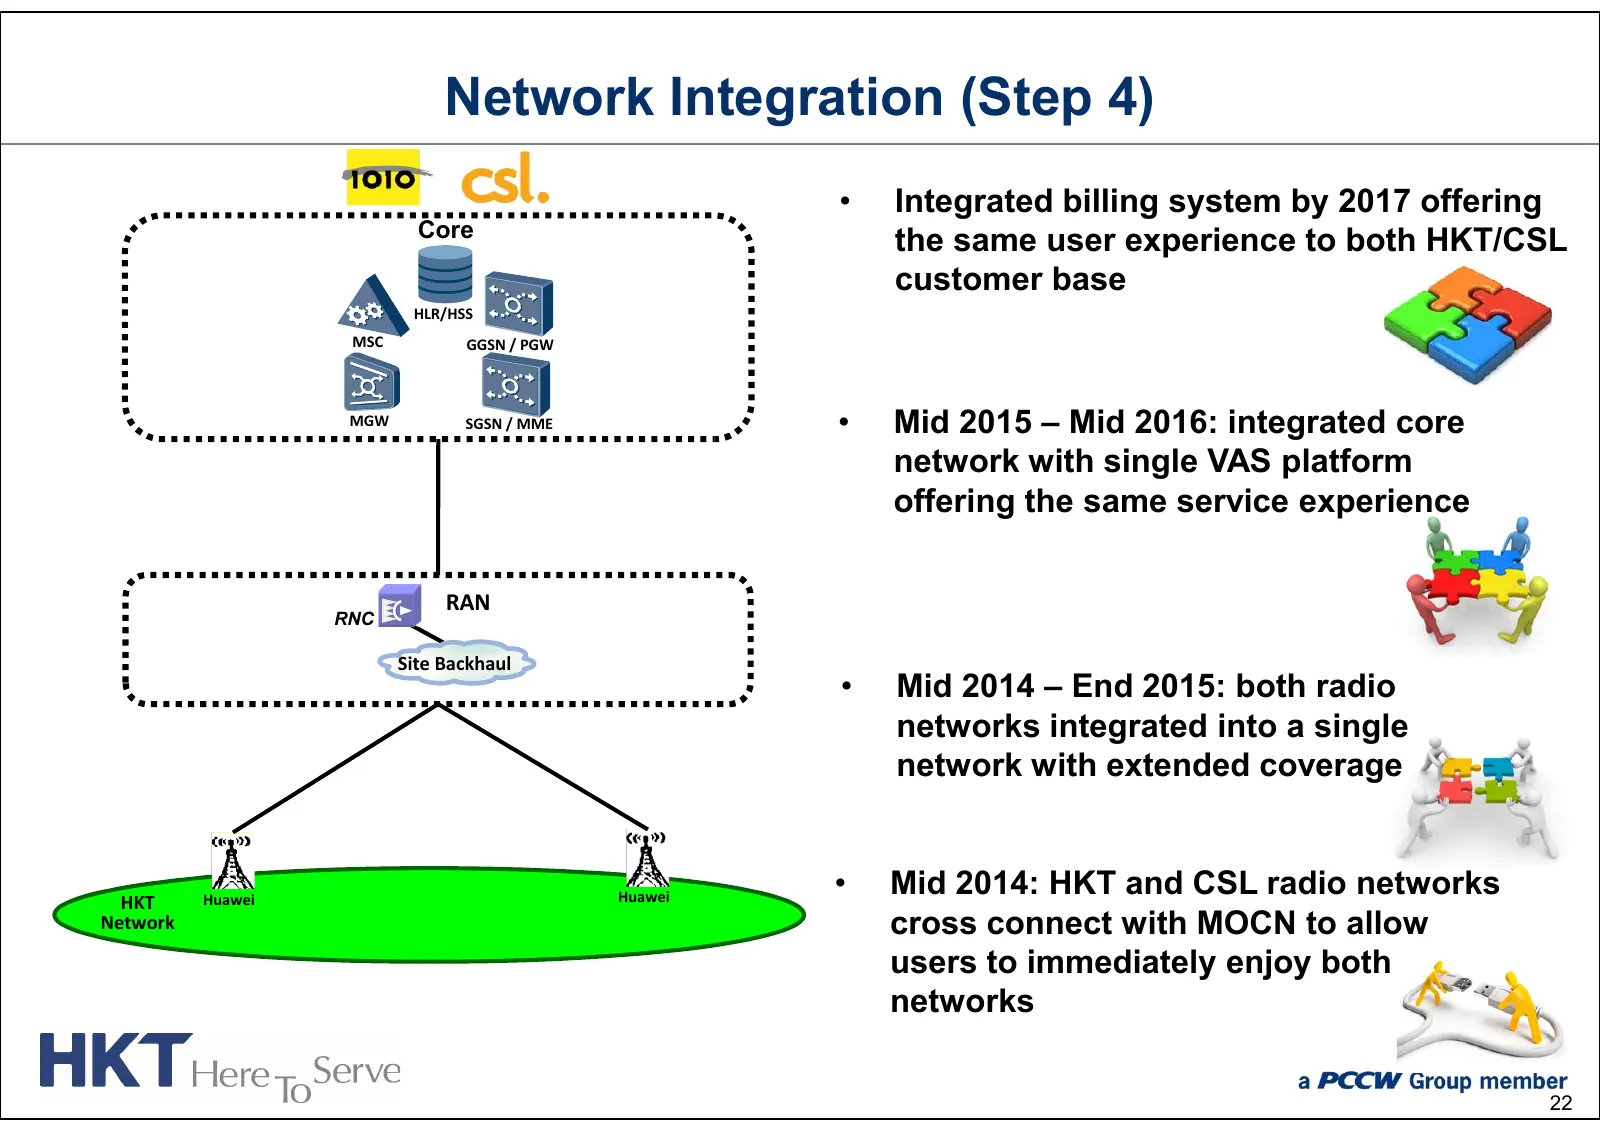
Network Integration (Step 4) • Integrated billing system by 2017 offering Core the same user experience to both HKT/CSL customer base HLR/HSS MSC GGSN / PGW MGW SGSN / MME • Mid 2015 – Mid 2016: integrated core network with single VAS platform offering the same service experience RAN RNC Site Backha
Slide 24: Leading the World in Mobile Broadband Development
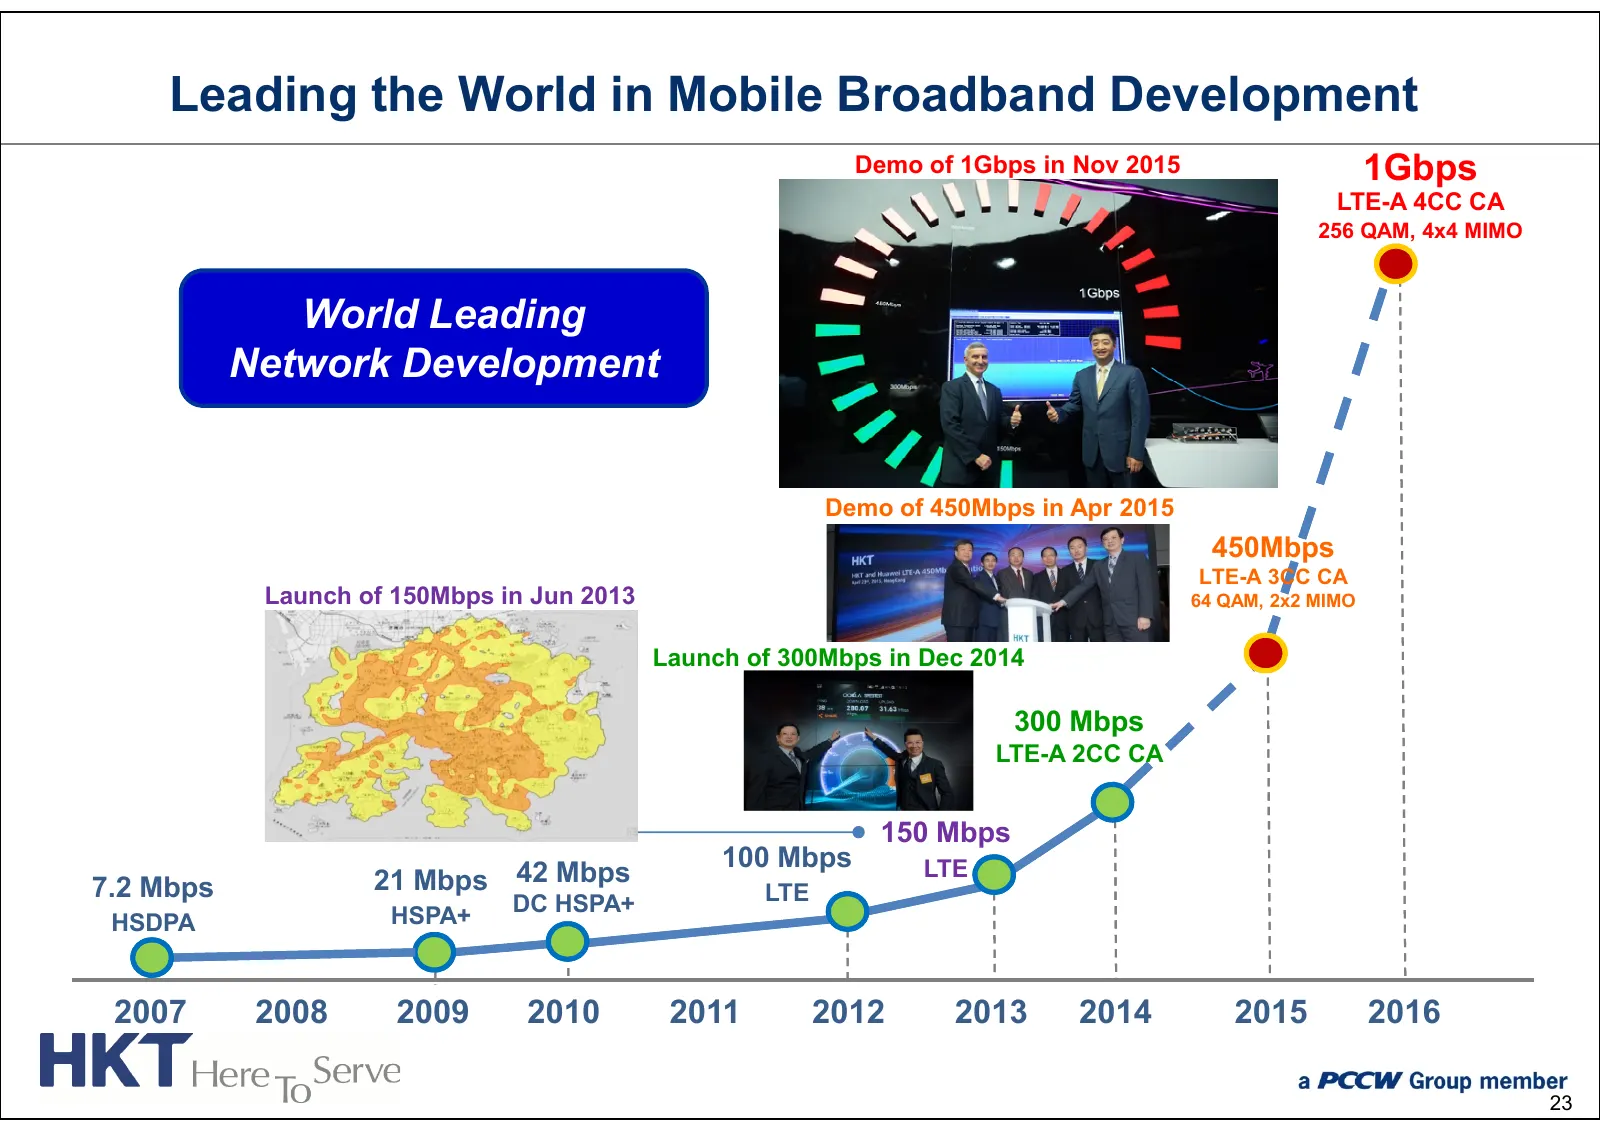
Leading the World in Mobile Broadband Development Demo of 1Gbps in Nov 2015 1Gbps LTE-A 4CC CA 256 QAM, 4x4 MIMO World Leading Network Development Demo of 450Mbps in Apr 2015 450Mbps LTE-A 3CC CA Launch of 150Mbps in Jun 2013 64 QAM, 2x2 MIMO Launch of 300Mbps in Dec 2014 300 Mbps LTE-A 2CC CA 150 M
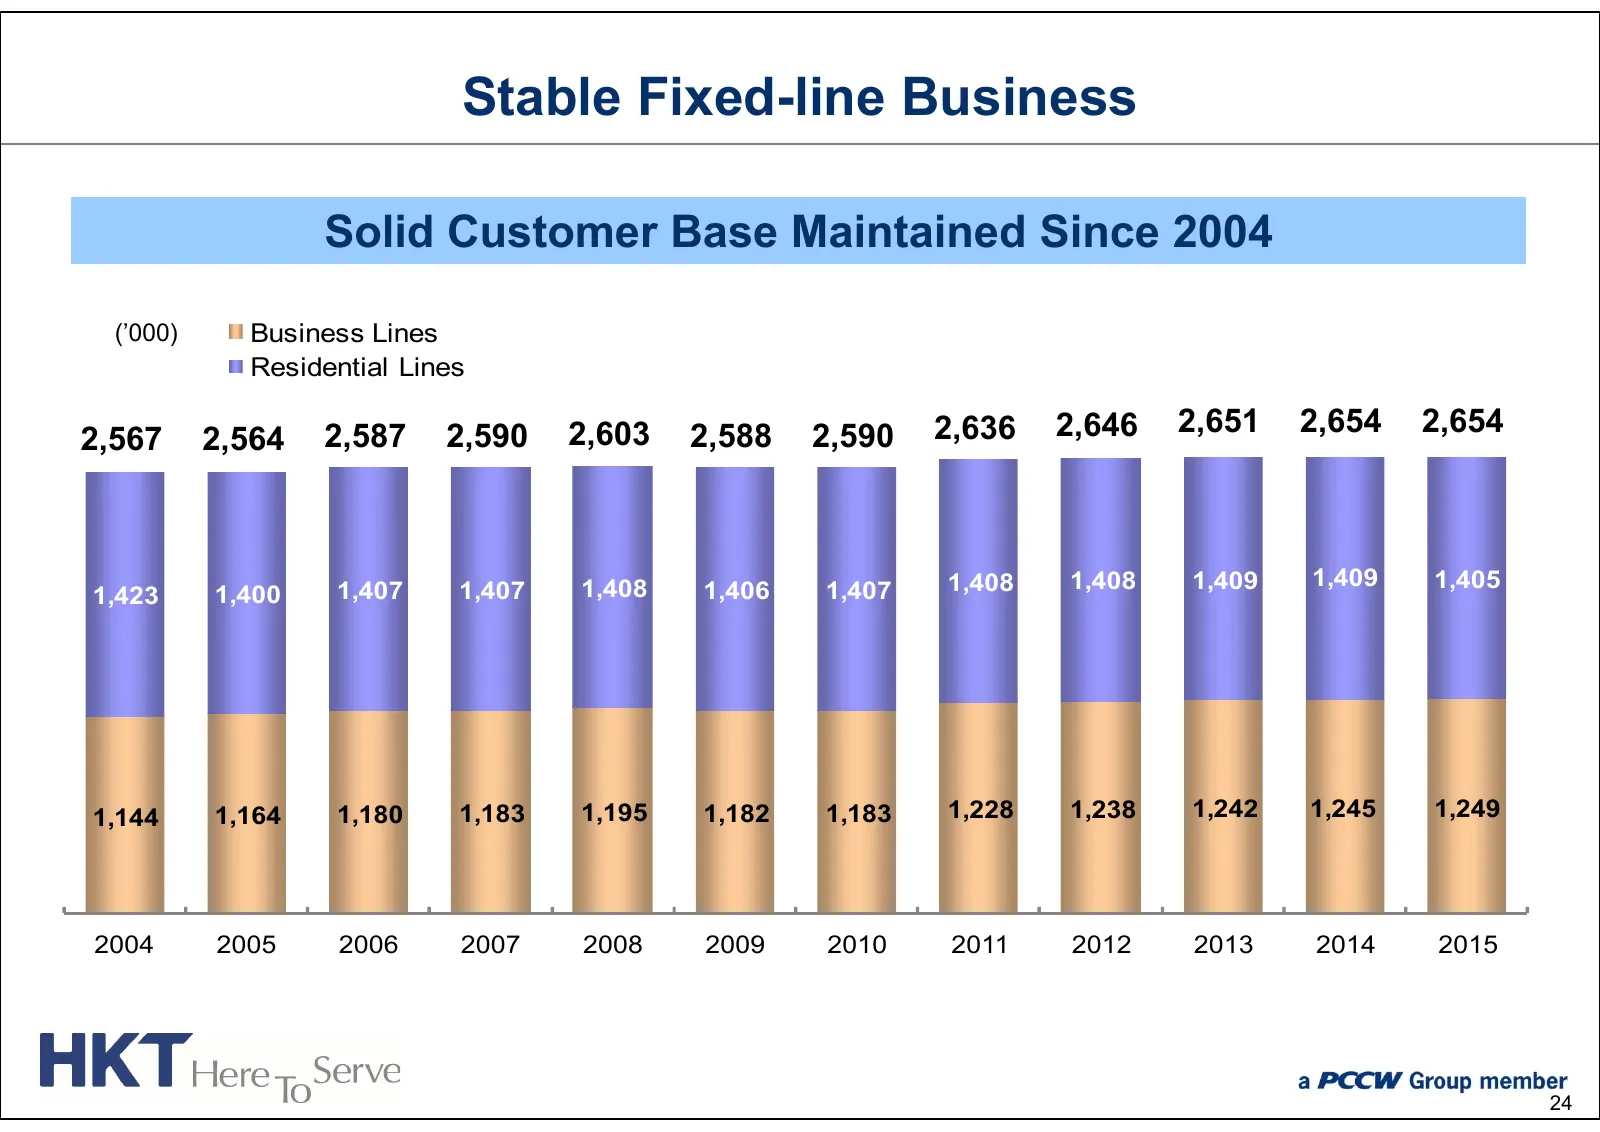
Slide 25: Stable Fixed-line Business
Stable Fixed-line Business Solid Customer Base Maintained Since 2004 (’000) Business Lines Residential Lines 2,587 2,590 2,603 2,588 2,590 2,636 2,646 2,651 2,654 2,654 2,567 2,564 1,408 1,408 1,408 1,409 1,409 1,405 1,423 1,400 1,407 1,407 1,406 1,407 1,144 1,164 1,180 1,183 1,195 1,182 1,183 1,228
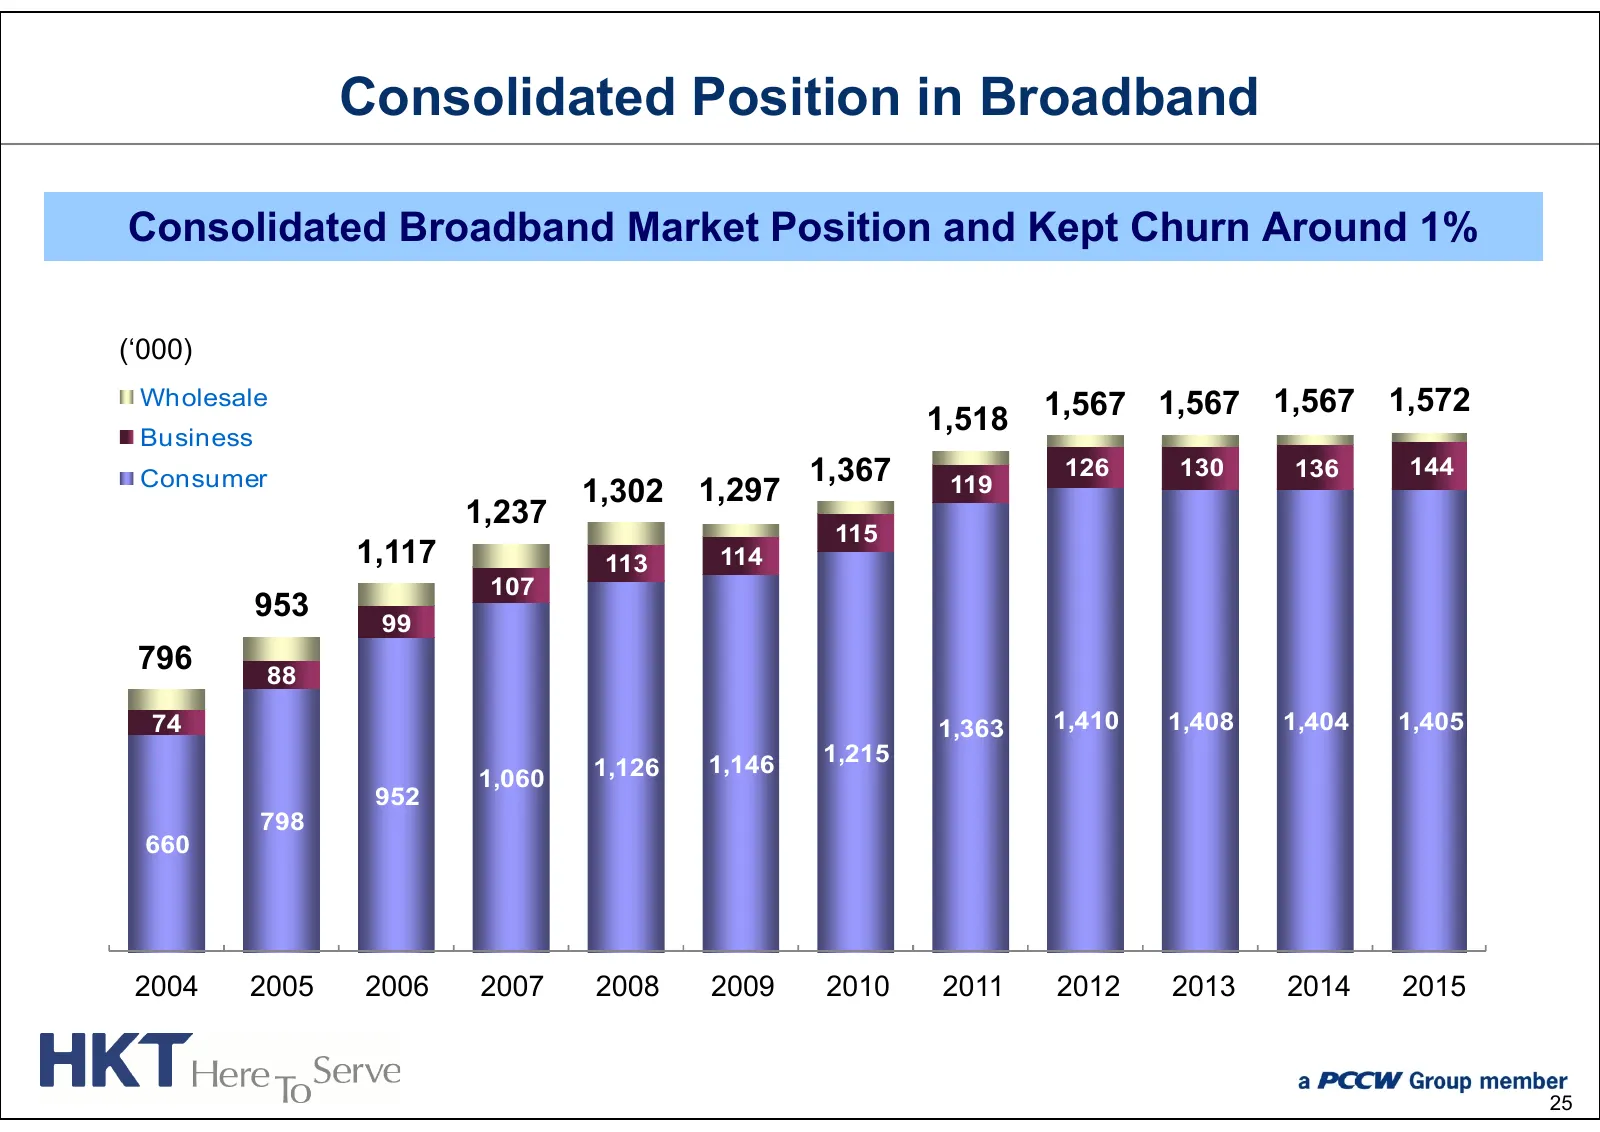
Slide 26: Consolidated Position in Broadband
Consolidated Position in Broadband Consolidated Broadband Market Position and Kept Churn Around 1% (‘000) Wholesale 1,567 1,567 1,567 1,572 Business 1,518 Consumer 1,367 126 130 136 144 1,302 1,297 119 1,237 115 1,117 113 114 107 953 99 796 88 74 1,363 1,410 1,408 1,404 1,405 1,146 1,215 1,060 1,126
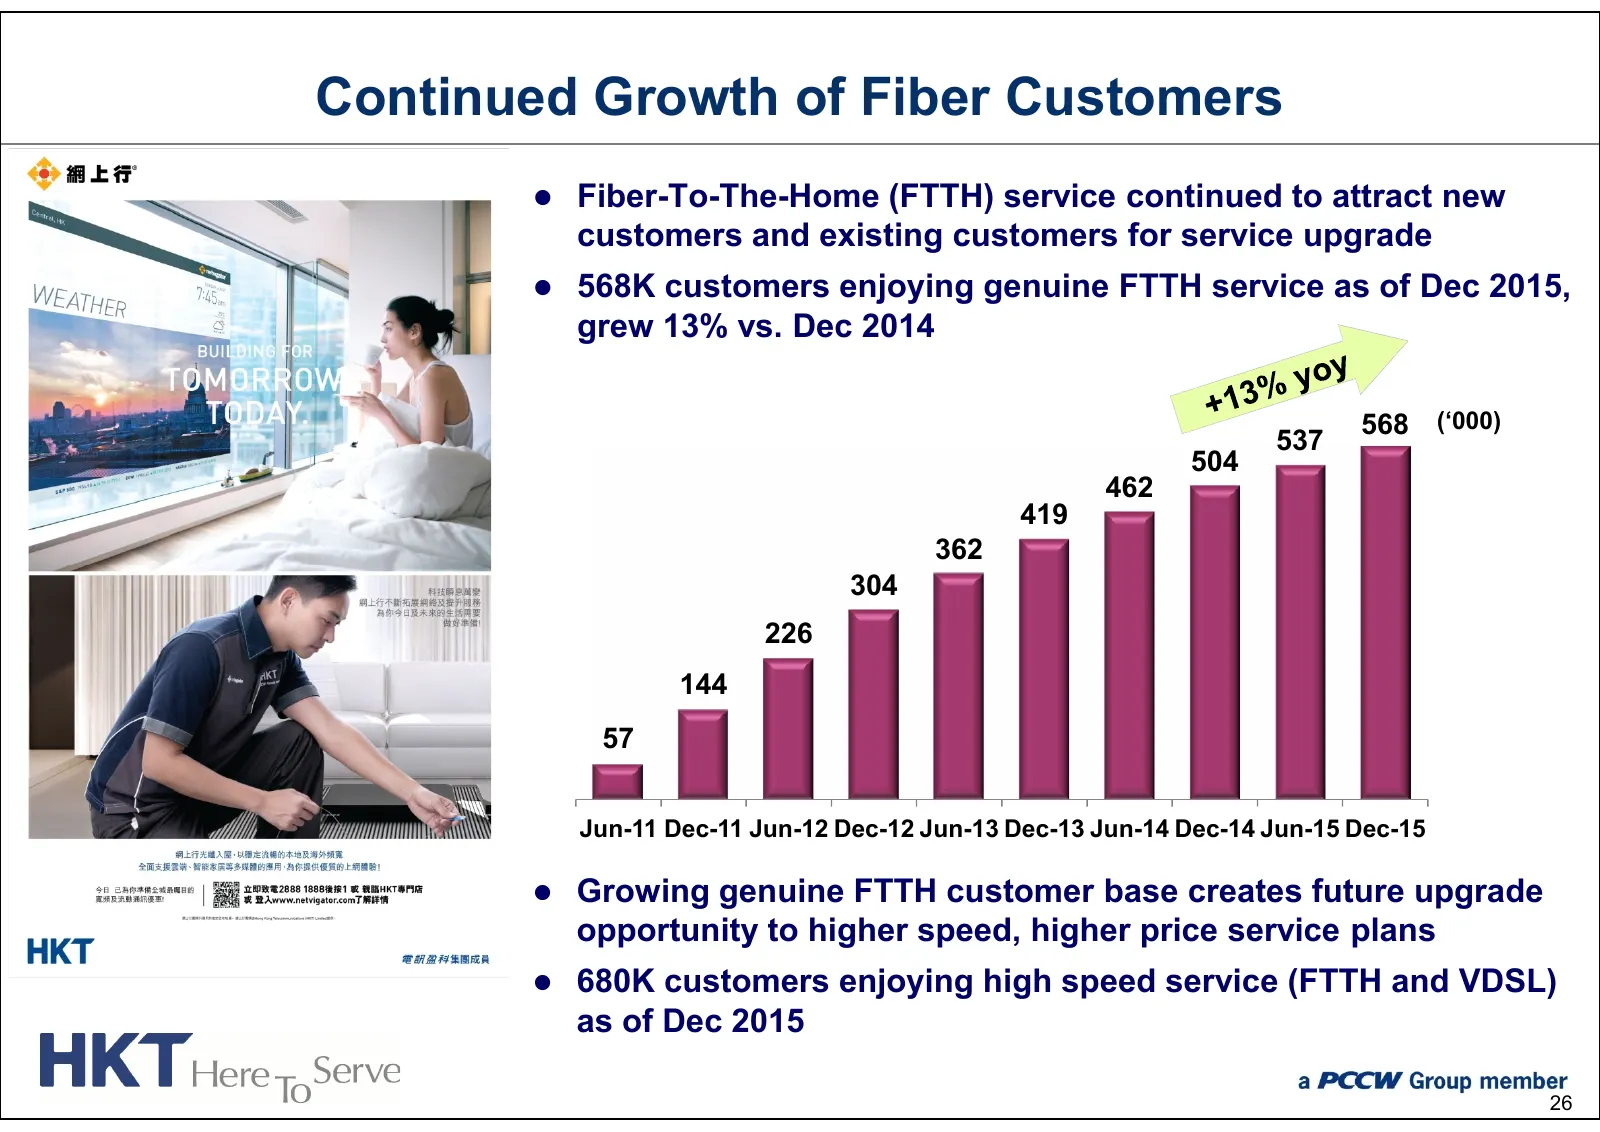
Slide 27: Continued Growth of Fiber Customers
Continued Growth of Fiber Customers Fiber-To-The-Home (FTTH) service continued to attract new customers and existing customers for service upgrade 568K customers enjoying genuine FTTH service as of Dec 2015, grew 13% vs. Dec 2014 568 (‘000) 537 504 462 419 362 304 226 144 57 Jun-11 Dec-11 Jun-12
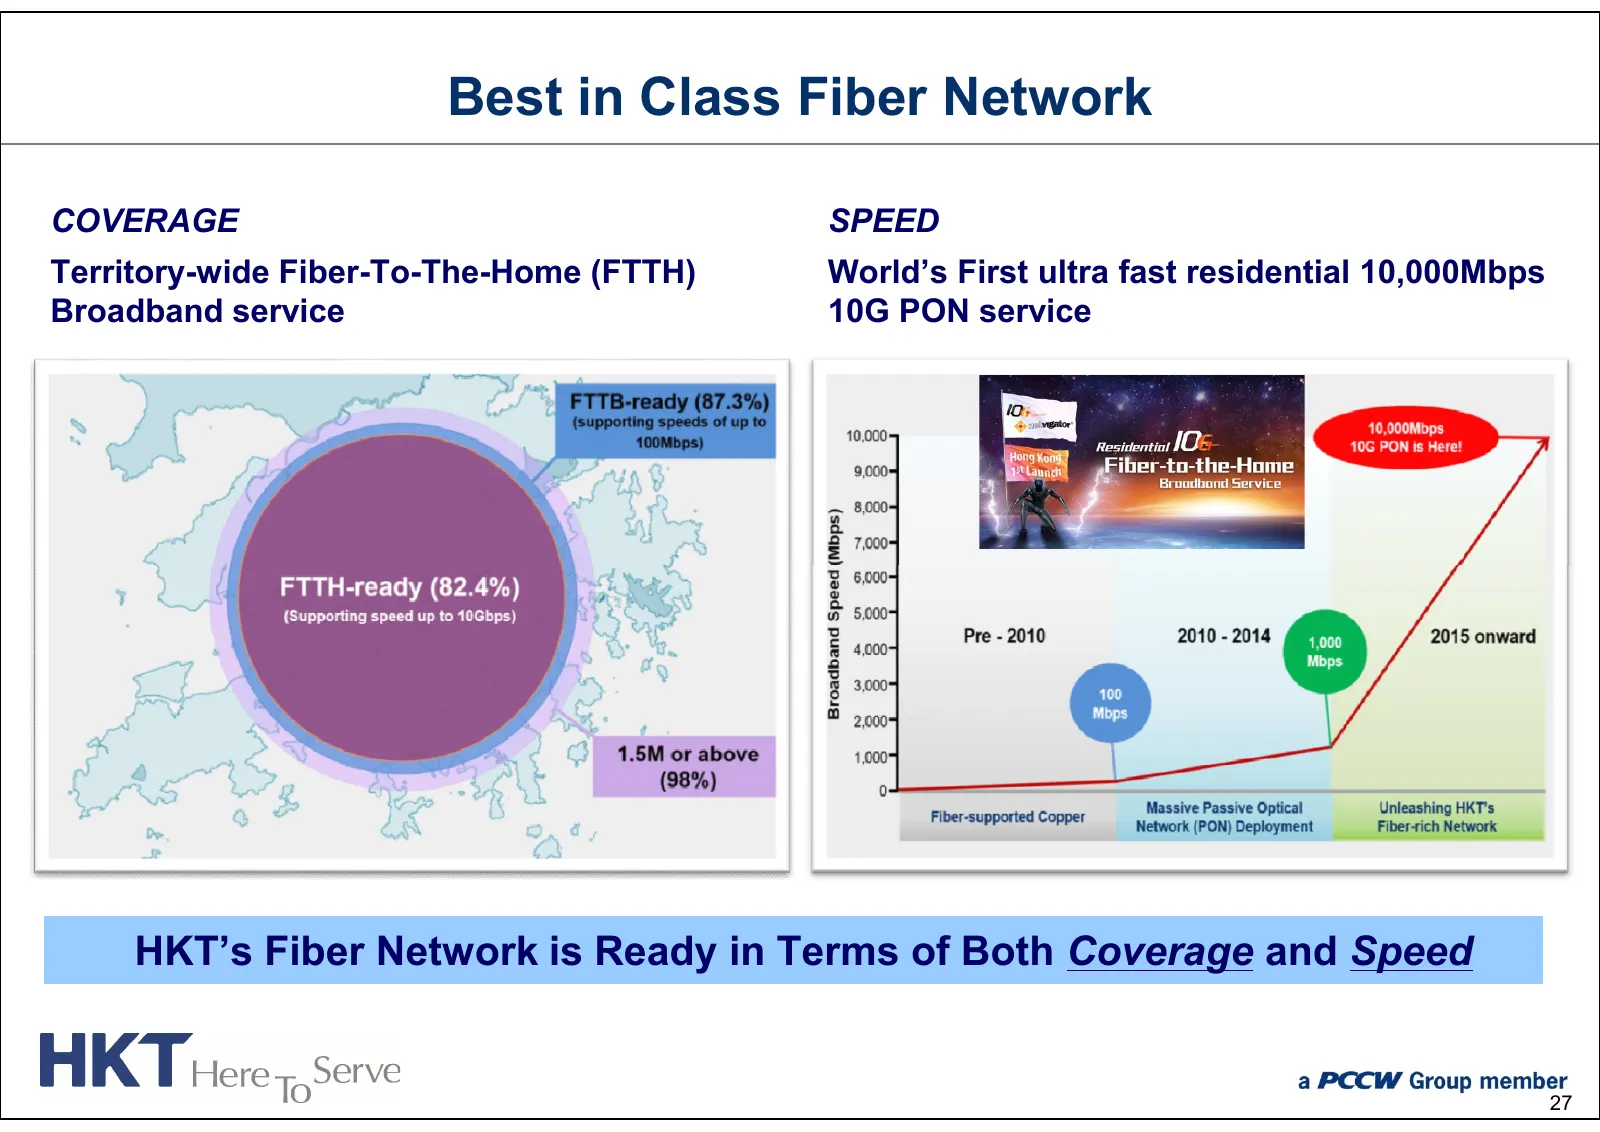
Slide 28: Best in Class Fiber Network
Best in Class Fiber Network COVERAGE SPEED Territory-wide Fiber-To-The-Home (FTTH) World’s First ultra fast residential 10,000Mbps Broadband service 10G PON service HKT’s Fiber Network is Ready in Terms of Both Coverage and Speed 27
Slide 29: Fiber-Rich Broadband Infrastructure
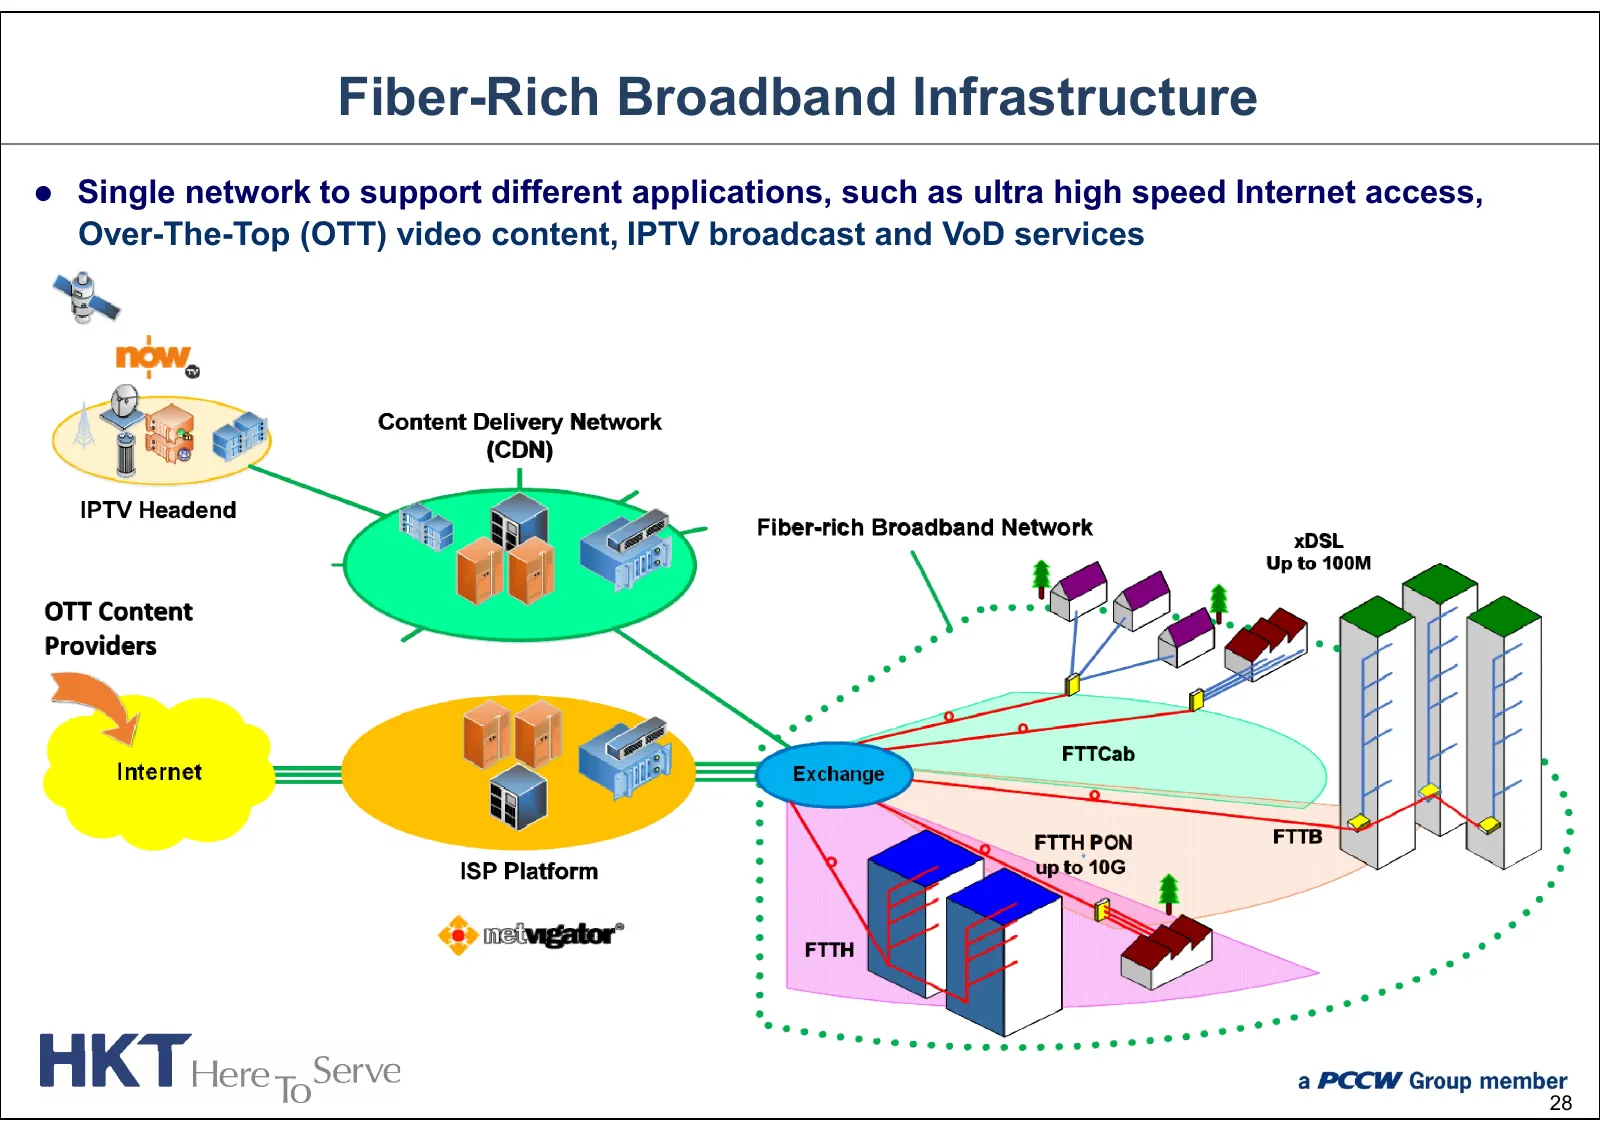
Fiber-Rich Broadband Infrastructure Single network to support different applications, such as ultra high speed Internet access, Over-The-Top (OTT) video content, IPTV broadcast and VoD services Content Delivery Network (CDN) IPTV Headend Fiber-rich Broadband Network xDSL Up to 100M OTT Content Pro
Slide 30: Internet-of-Things (IoT)
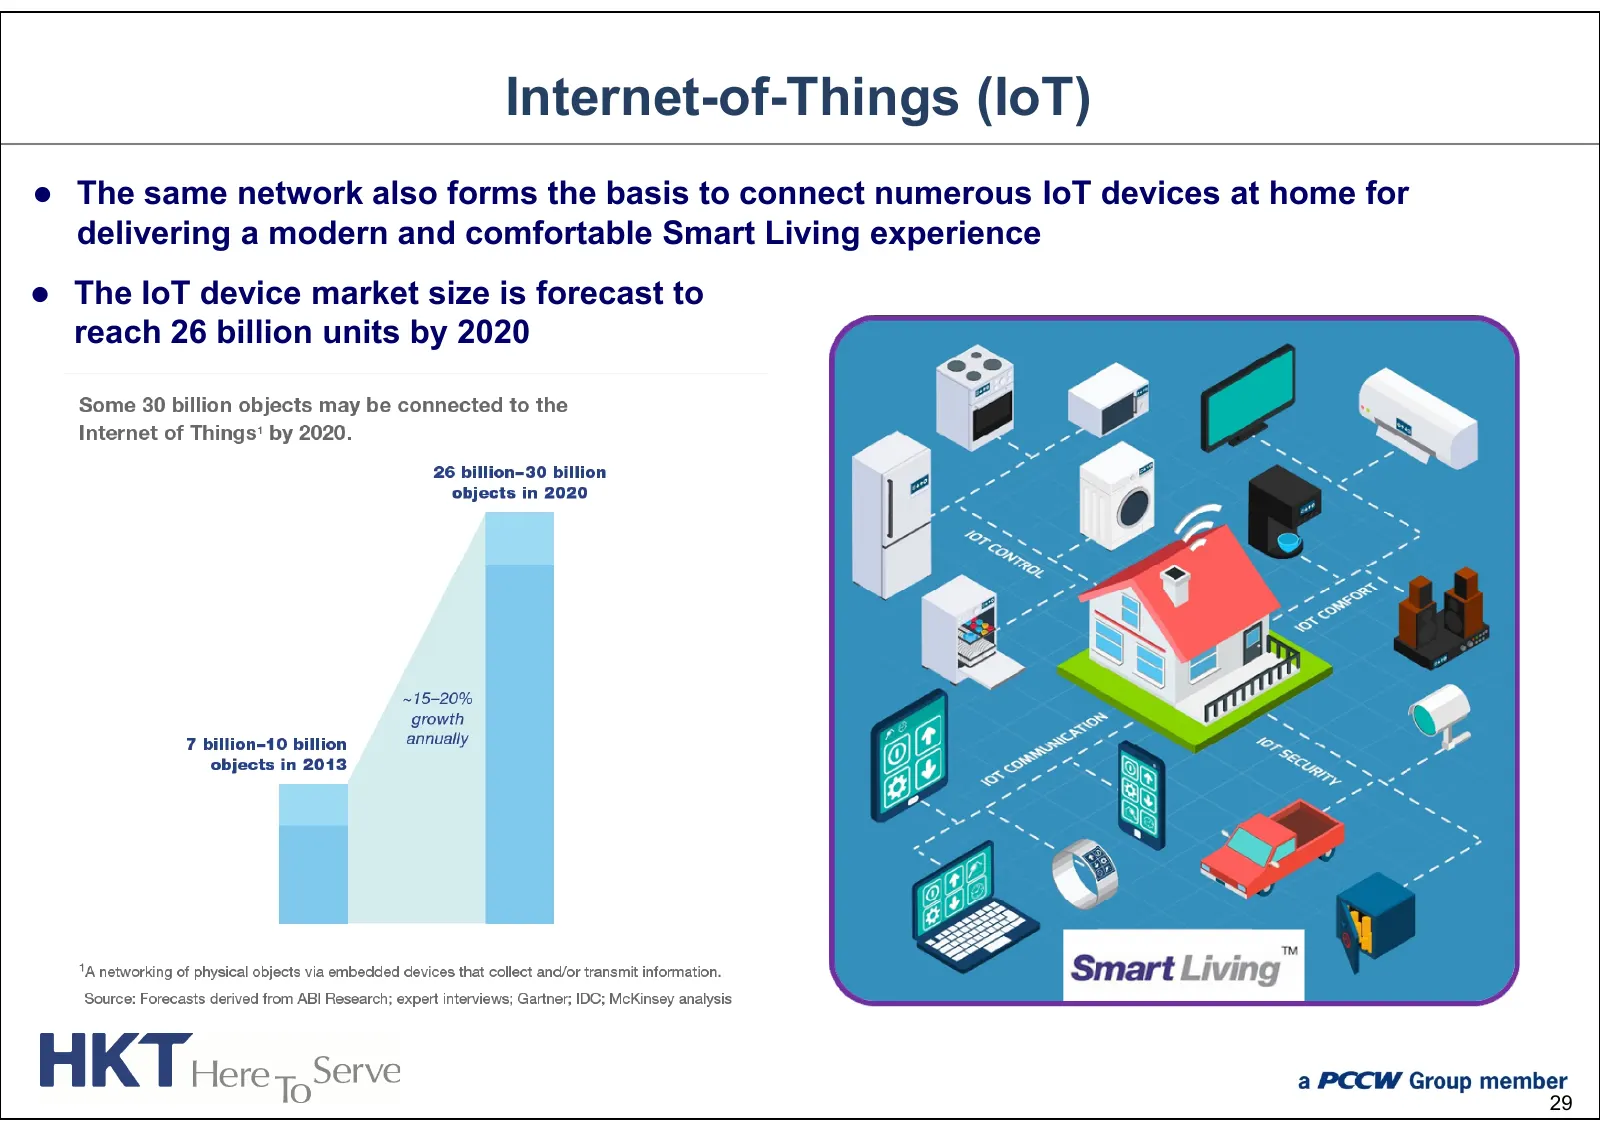
Internet-of-Things (IoT) The same network also forms the basis to connect numerous IoT devices at home for delivering a modern and comfortable Smart Living experience The IoT device market size is forecast to reach 26 billion units by 2020 29
Slide 31: Netvigator's Internet Traffic Growth
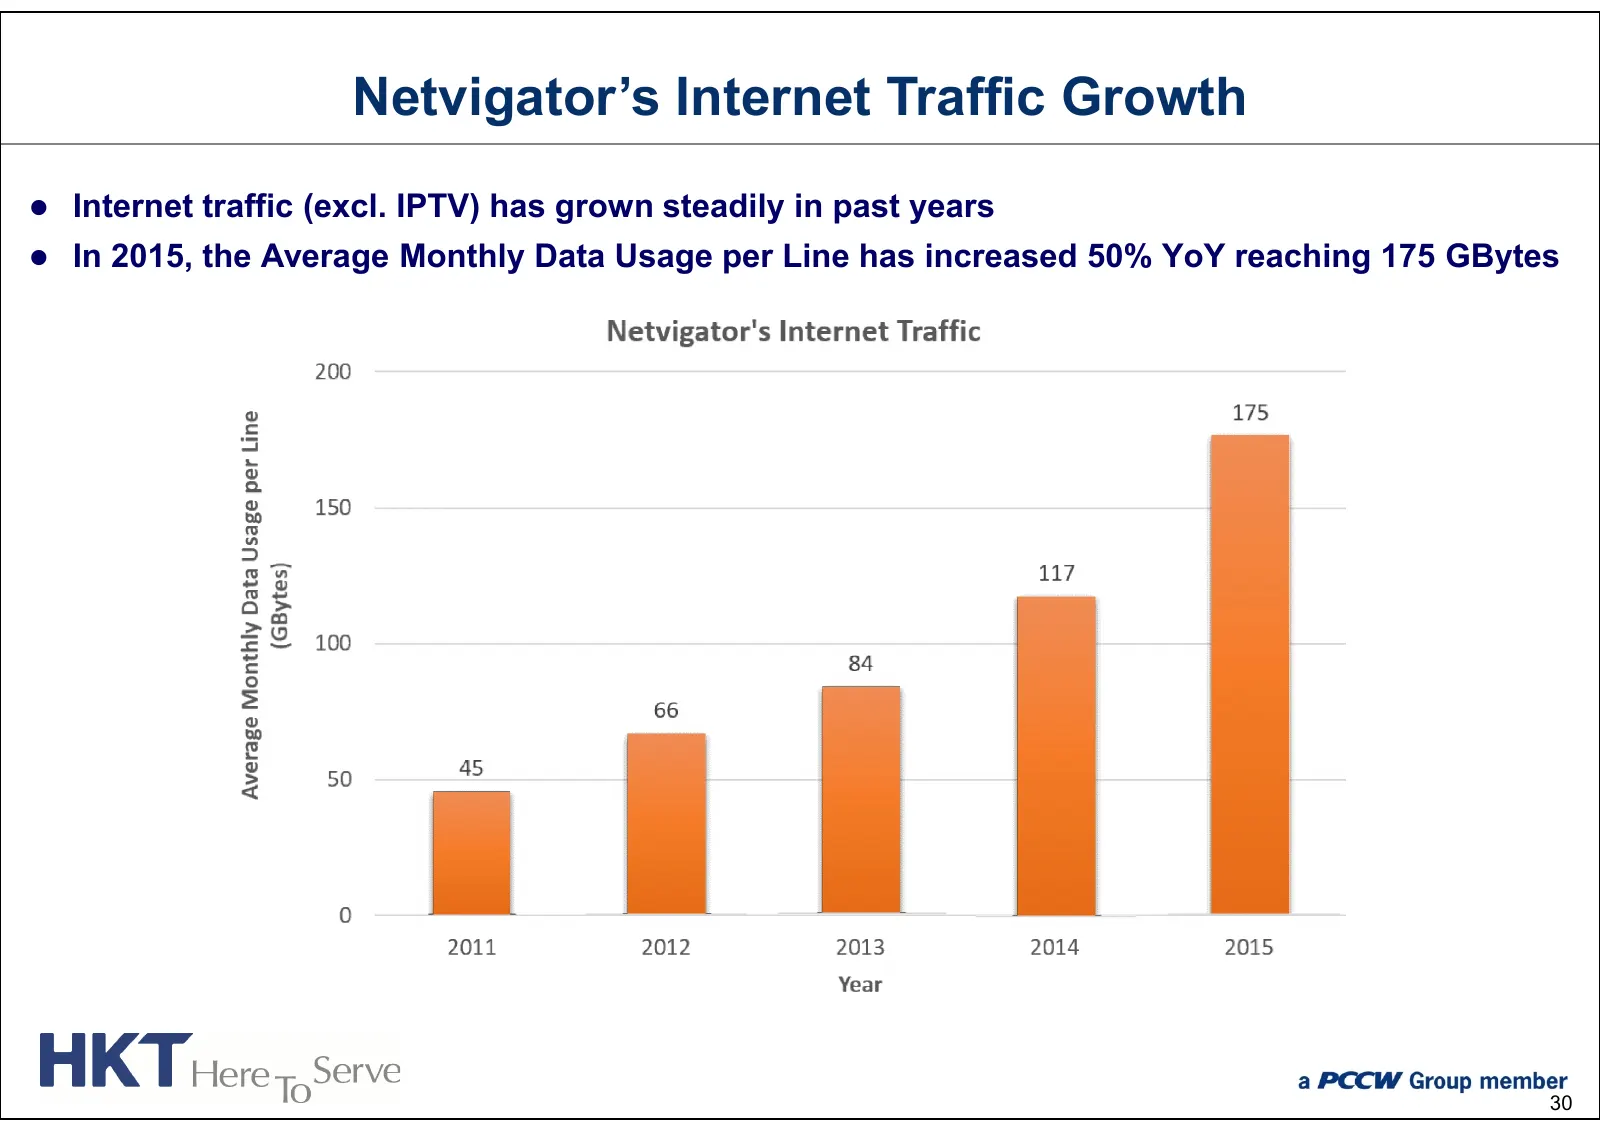
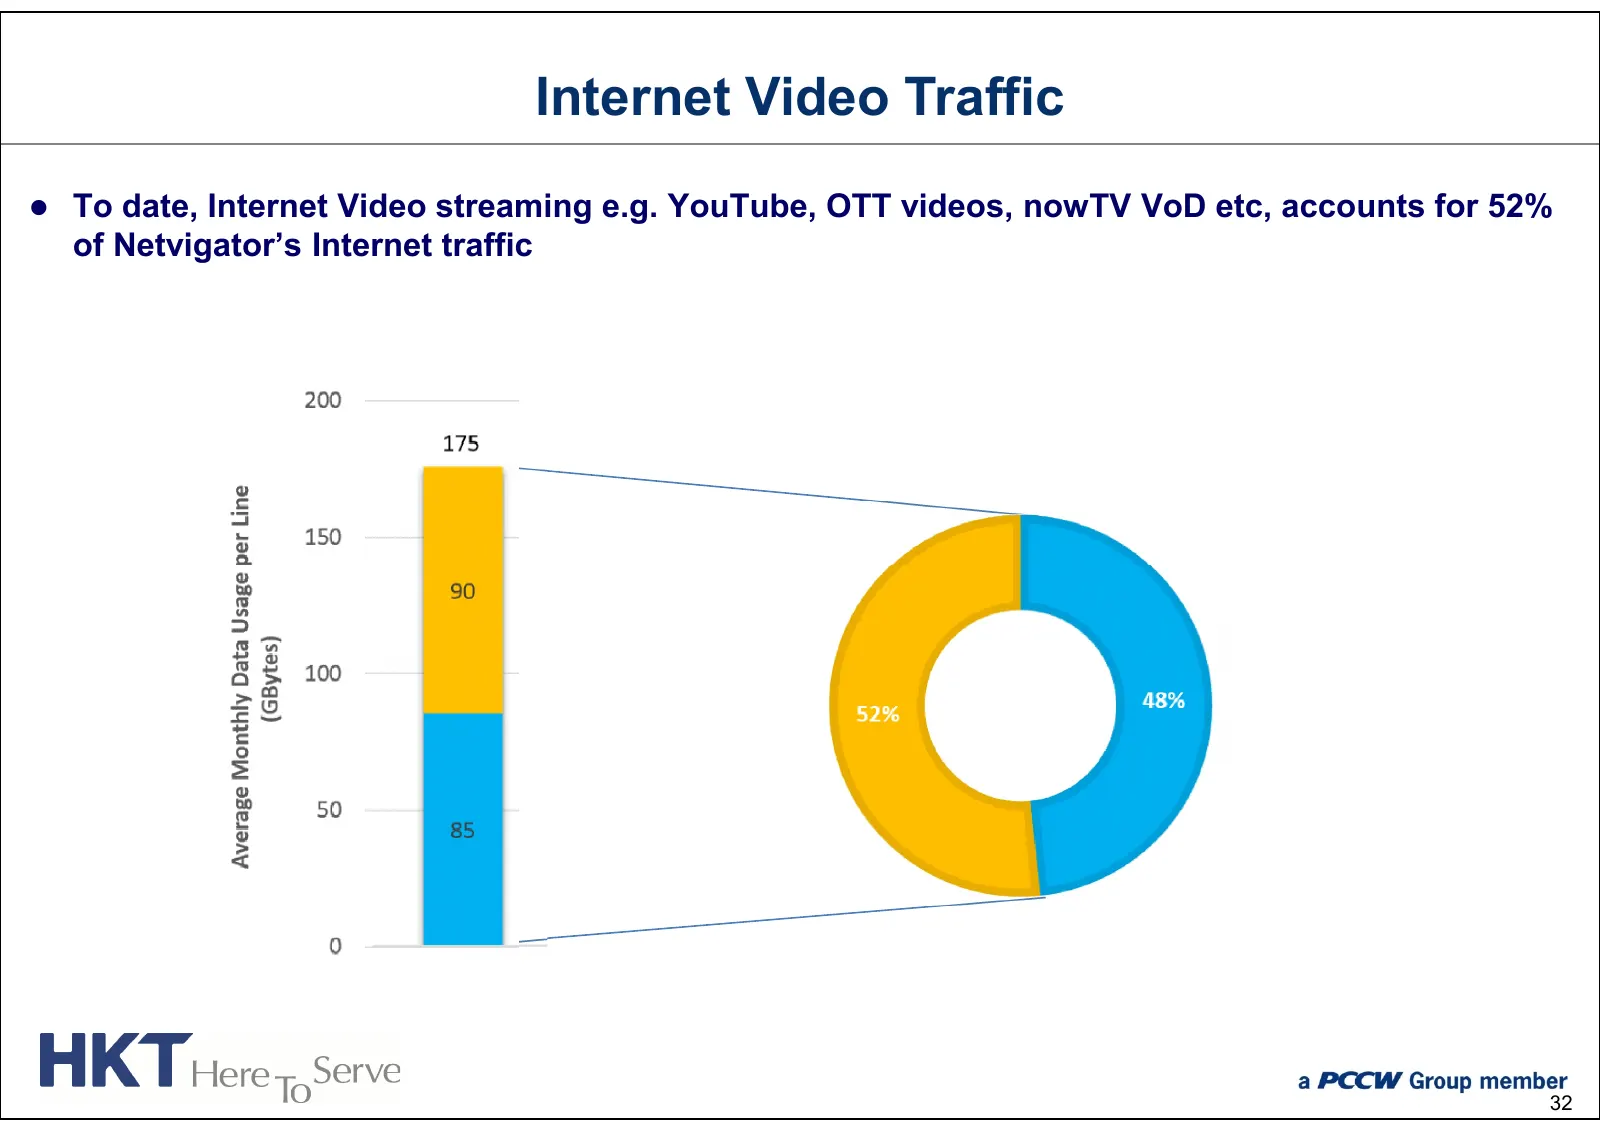
Netvigator’s Internet Traffic Growth Internet traffic (excl. IPTV) has grown steadily in past years In 2015, the Average Monthly Data Usage per Line has increased 50% YoY reaching 175 GBytes 30
Slide 32: Comparison with Other Places in the World
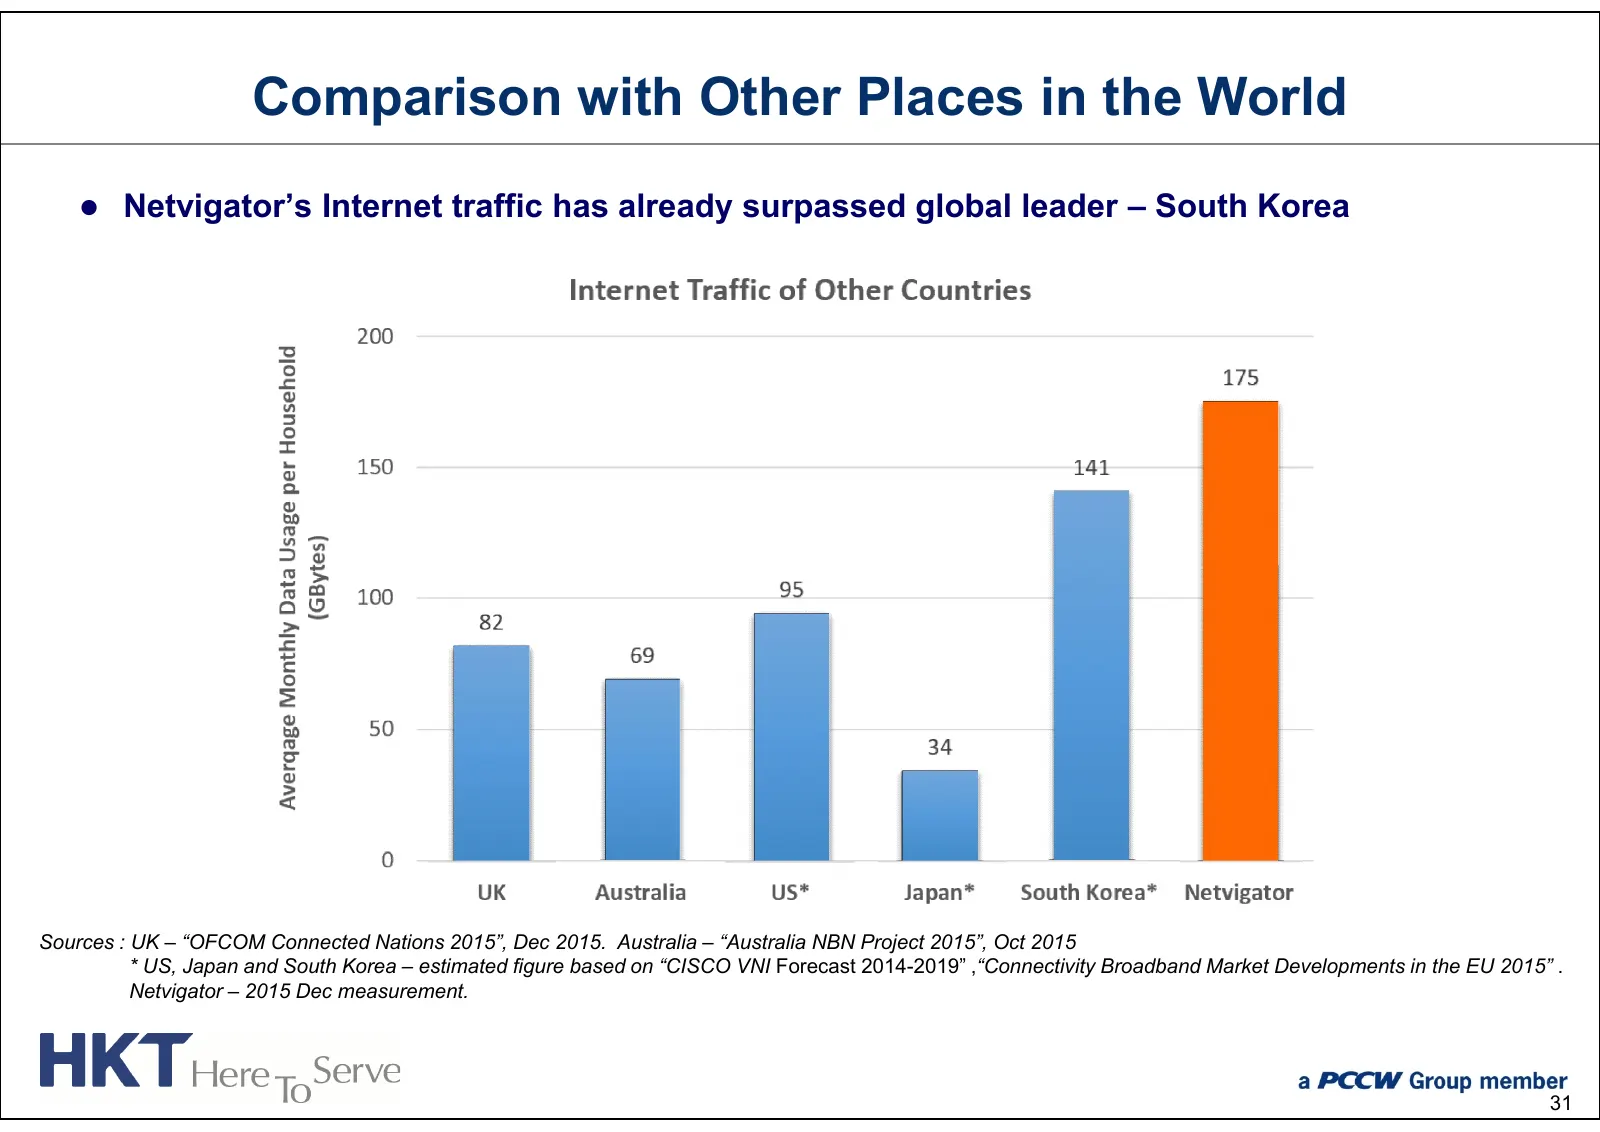
Comparison with Other Places in the World Netvigator’s Internet traffic has already surpassed global leader – South Korea Sources : UK – “OFCOM Connected Nations 2015”, Dec 2015. Australia – “Australia NBN Project 2015”, Oct 2015 * US, Japan and South Korea – estimated figure based on “CISCO VNI F
Slide 33: Internet Video Traffic
Internet Video Traffic To date, Internet Video streaming e.g. YouTube, OTT videos, nowTV VoD etc, accounts for 52% of Netvigator’s Internet traffic 32
Slide 34: Overall Video Traffic
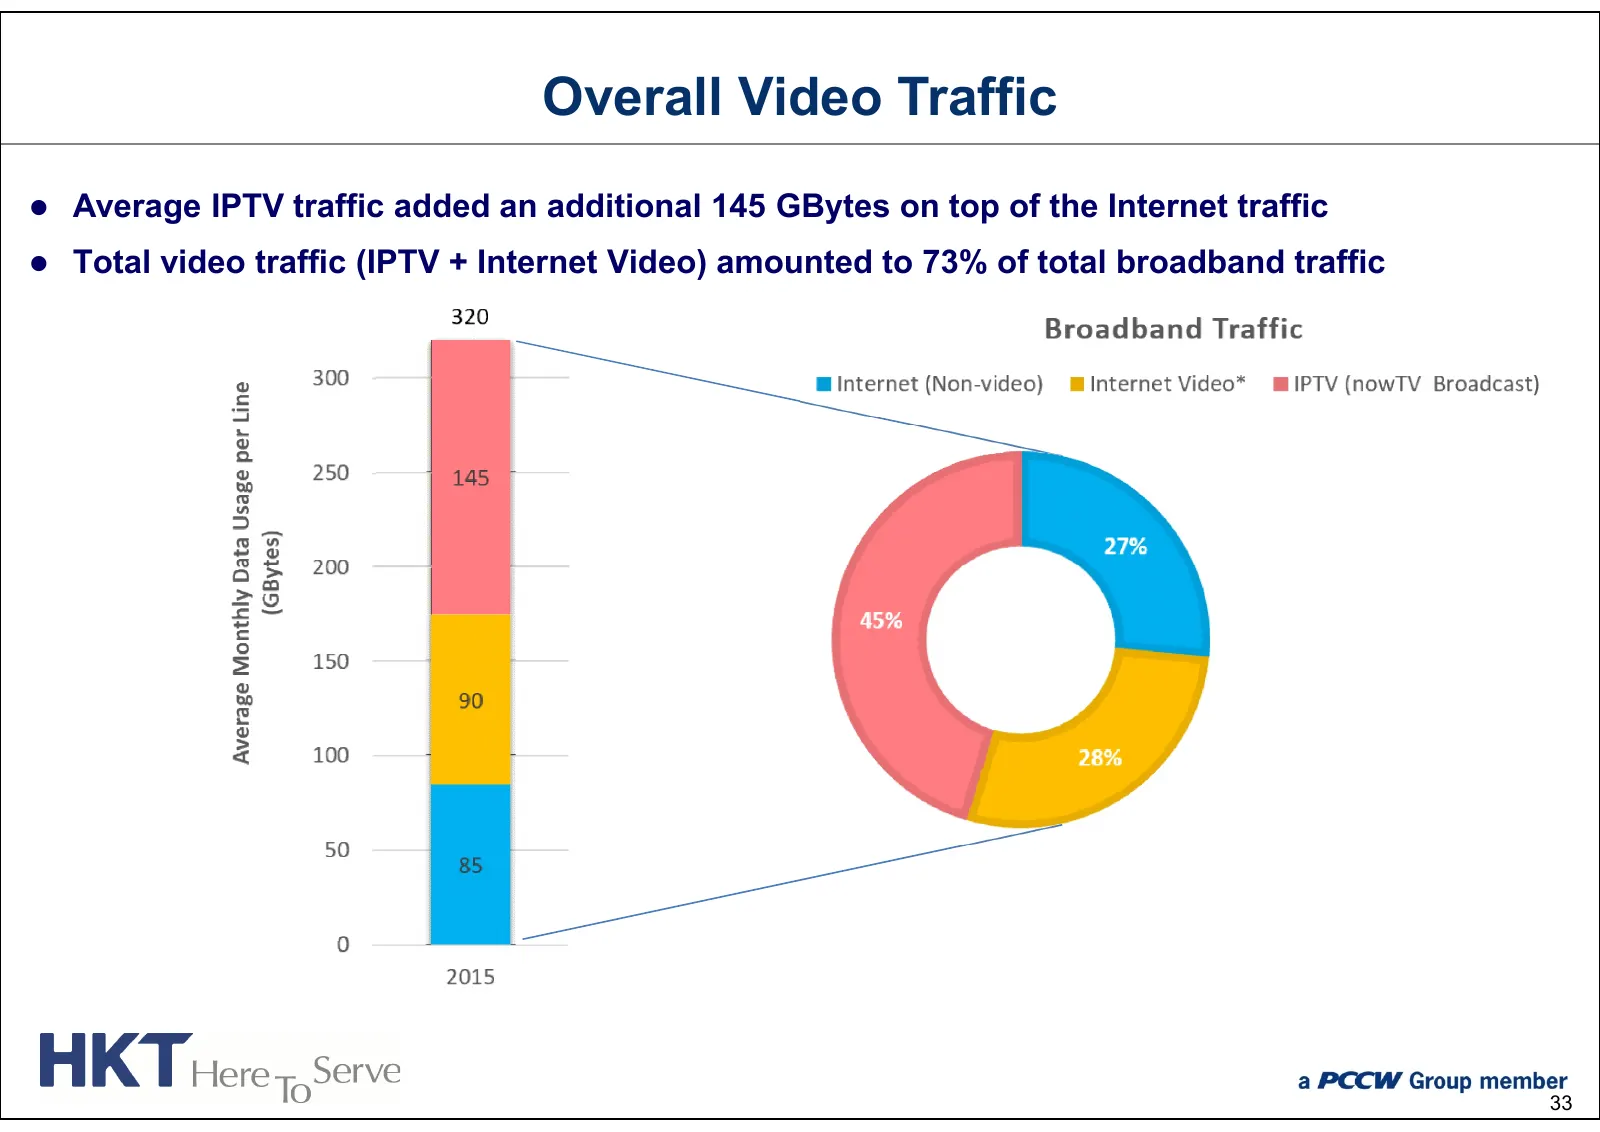
Overall Video Traffic Average IPTV traffic added an additional 145 GBytes on top of the Internet traffic Total video traffic (IPTV + Internet Video) amounted to 73% of total broadband traffic 33
Slide 35: Video Will be the Main Internet Traffic Driver
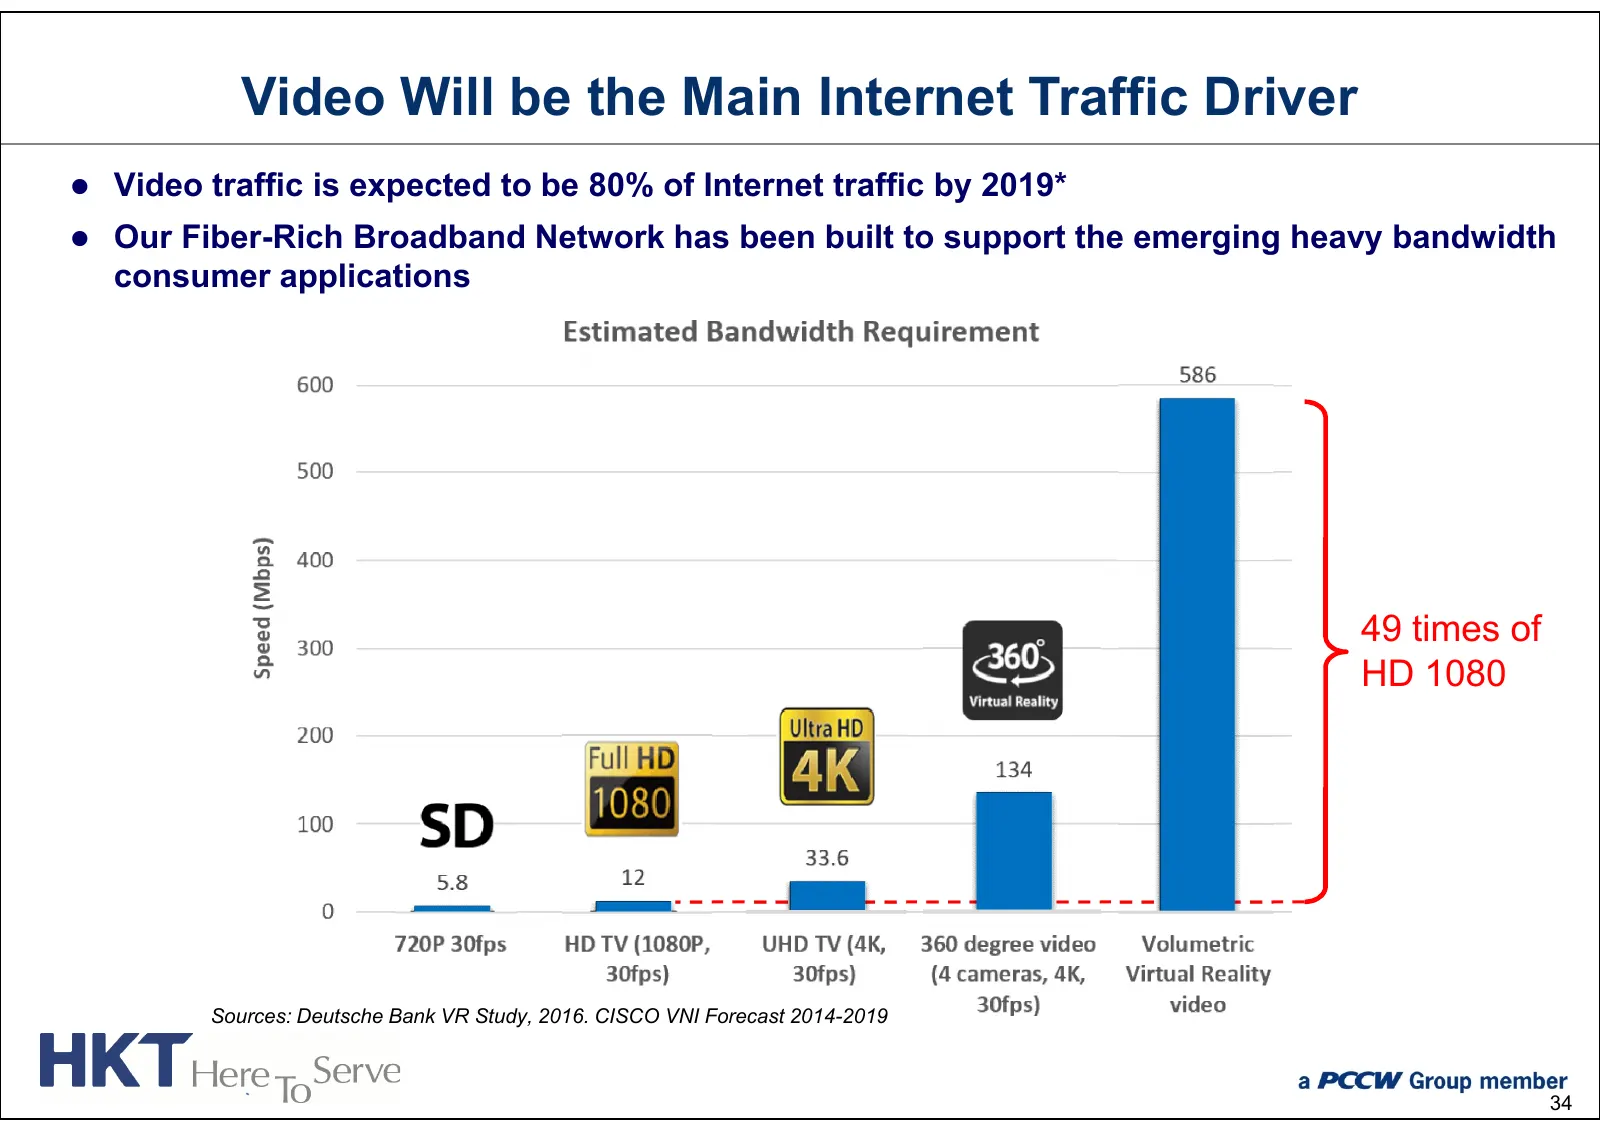
Video Will be the Main Internet Traffic Driver Video traffic is expected to be 80% of Internet traffic by 2019* Our Fiber-Rich Broadband Network has been built to support the emerging heavy bandwidth consumer applications 49 times of HD 1080 Sources: Deutsche Bank VR Study, 2016. CISCO VNI Forec
Slide 36: The Next Wave – 4K Video
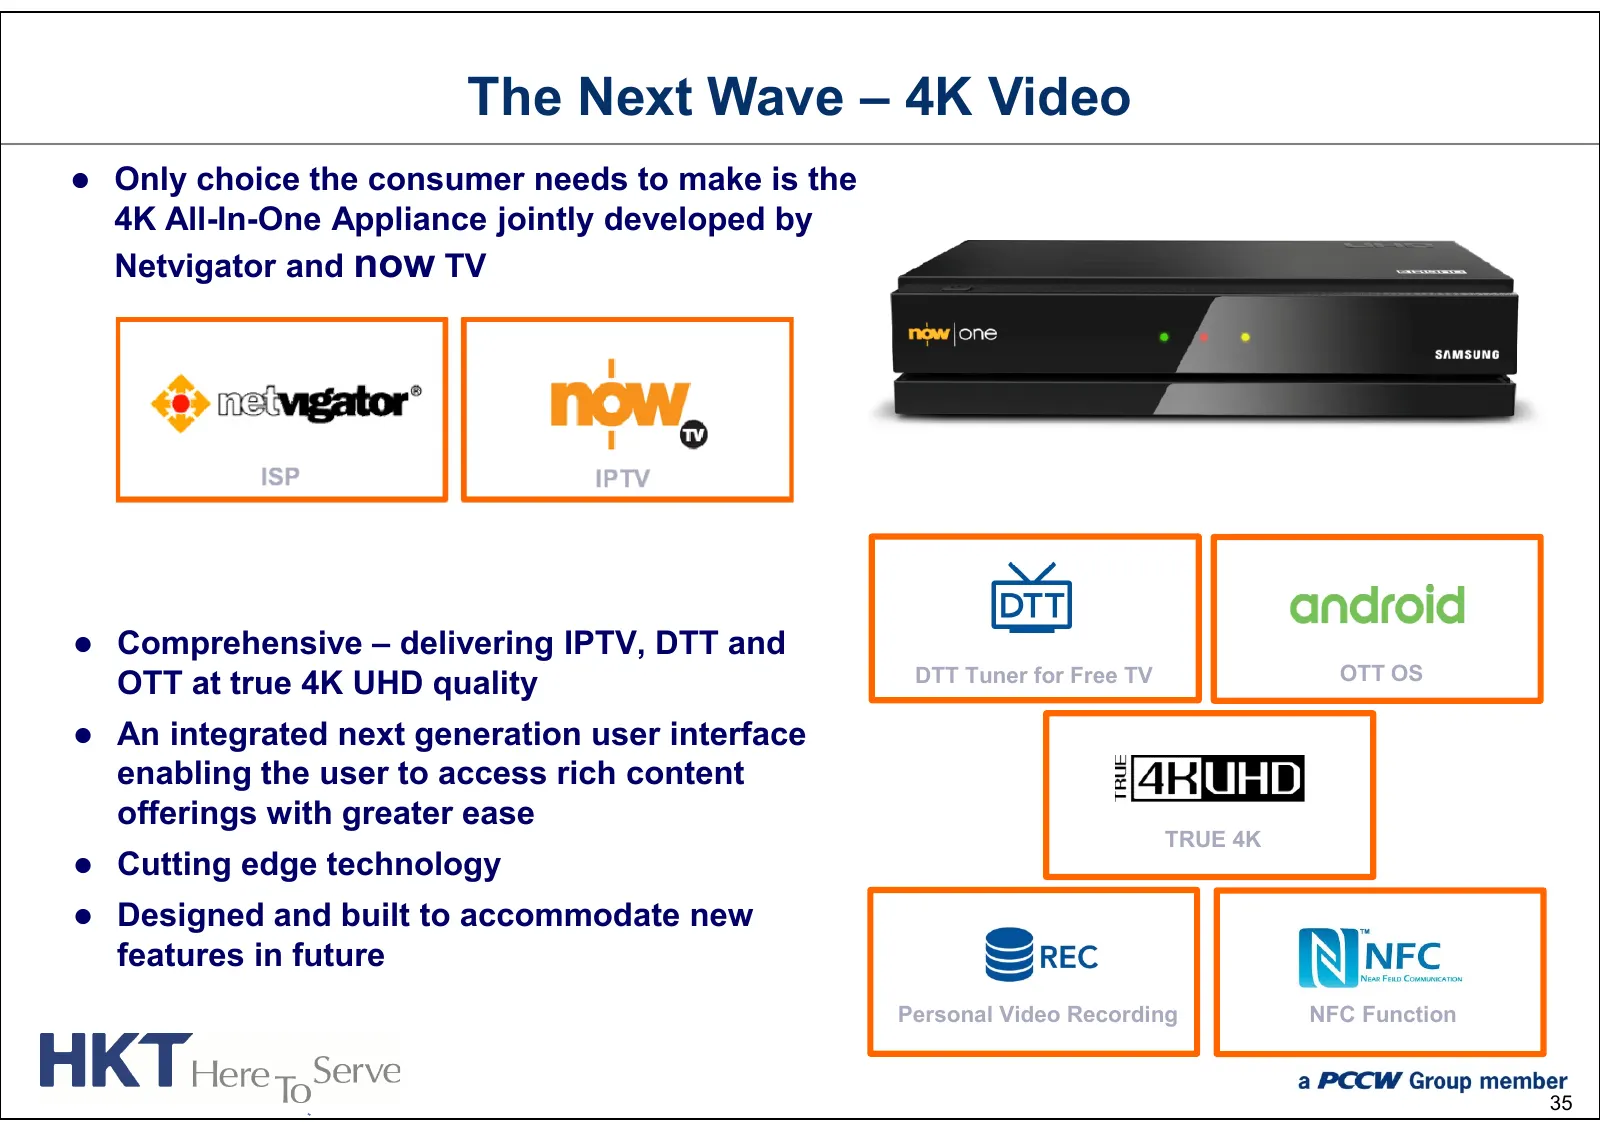
The Next Wave – 4K Video Only choice the consumer needs to make is the 4K All-In-One Appliance jointly developed by Netvigator and now TV Comprehensive – delivering IPTV, DTT and DTT Tuner for Free TV OTT OS OTT at true 4K UHD quality An integrated next generation user interface enabling the u
Slide 37: Highlights
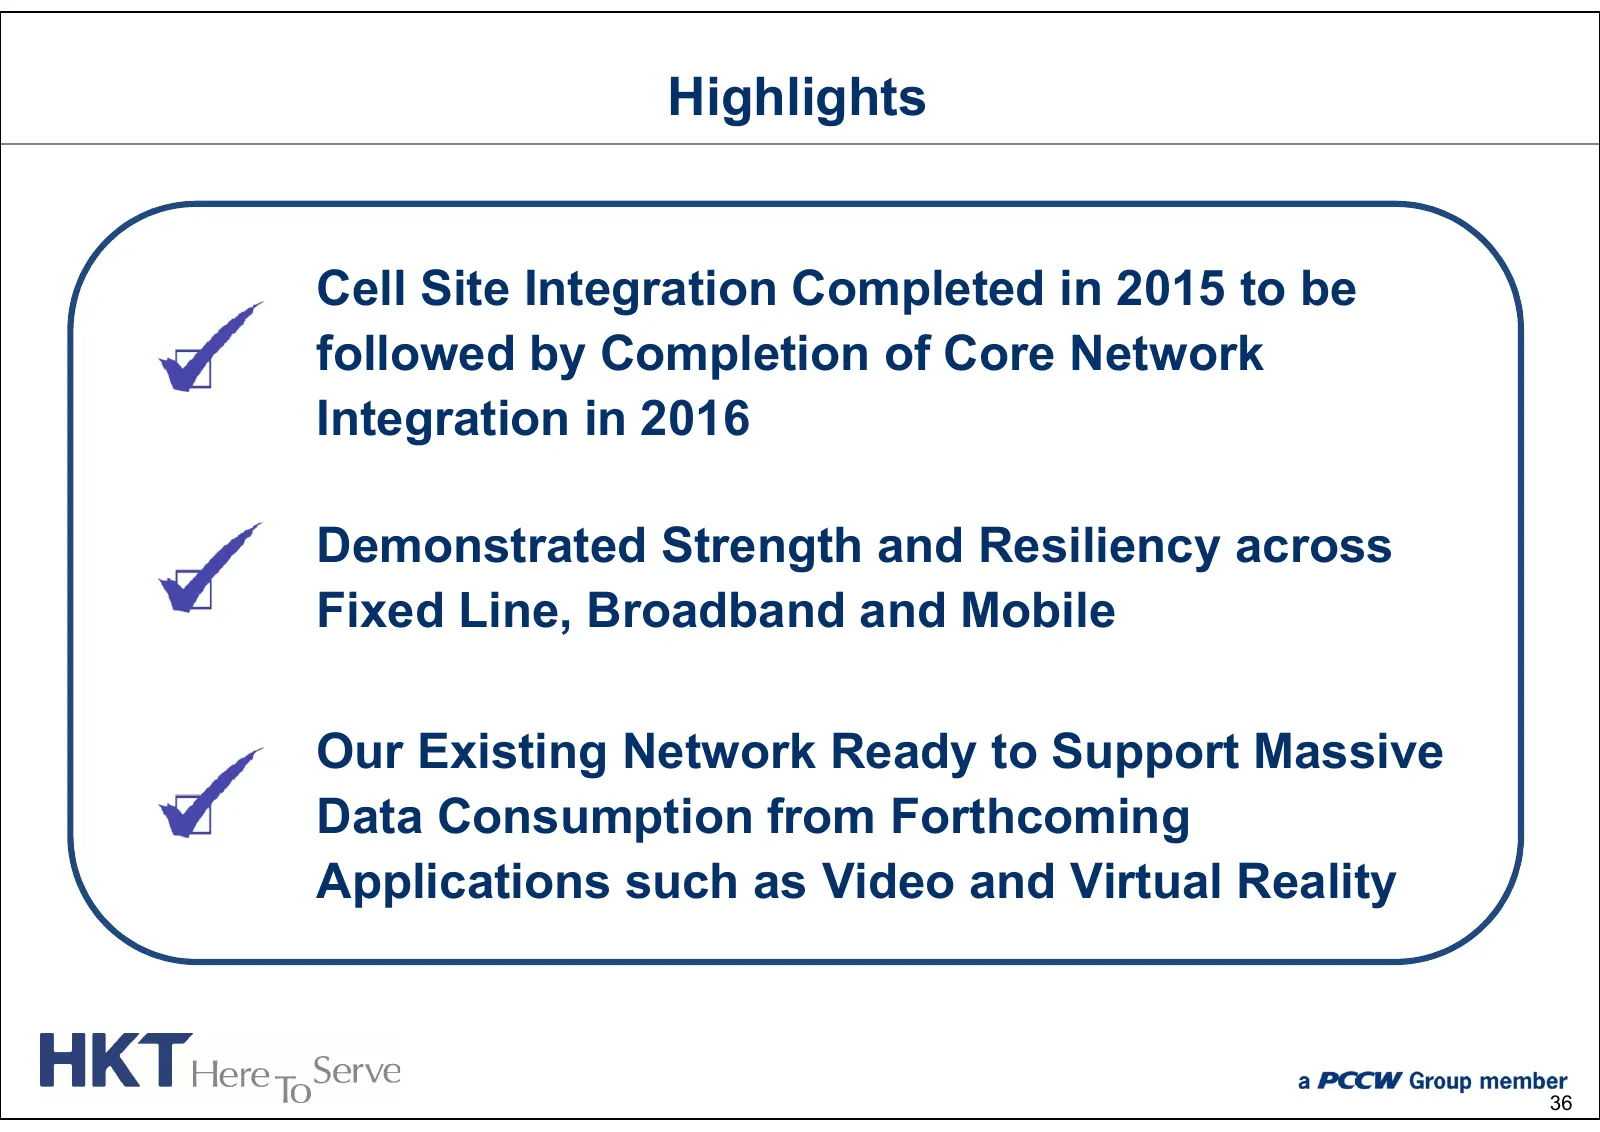
Highlights Cell Site Integration Completed in 2015 to be followed by Completion of Core Network Integration in 2016 Demonstrated Strength and Resiliency across Fixed Line, Broadband and Mobile Our Existing Network Ready to Support Massive Data Consumption from Forthcoming Applications such as Video
Source: Internet Archive copy of hkt.com
More decks from HKT Trust and HKT Ltd
 HKT — H1 2025 Earnings Presentation35 slides · Jul 31, 2025
 FY2024 Earnings Presentation35 slides · Feb 20, 2025
 H1 2024 Earnings Presentation34 slides · Jul 25, 2024
 FY2023 Earnings Presentation36 slides · Feb 22, 2024
 H1 2023 Earnings Presentation32 slides · Aug 2, 2023
 HKT — FY2022 Earnings Presentation32 slides · Feb 23, 2023