First Trust Private Credit Fund (FTPCX) · NASDAQ:FTPCX
First Trust Private Credit Fund (FTPCX) — FT Vest Total Return Income Fund — Investor Presentation (October 2026)
29 slides from First Trust Private Credit Fund (FTPCX)'s investor presentation, October 2026
Slide 1: FT Vest Total Return Income Fund
FT VEST TOTAL RETURN INCOME FUND This document is for informational purposes only and is neither an offer to sell, nor a solicitation of an offer to buy, an interest in any securities. You should consider a fund’s investment objectives, risks, and charges and expenses carefully before investing. Con
Slide 2: Target Outcome & Target Income ETF Growth
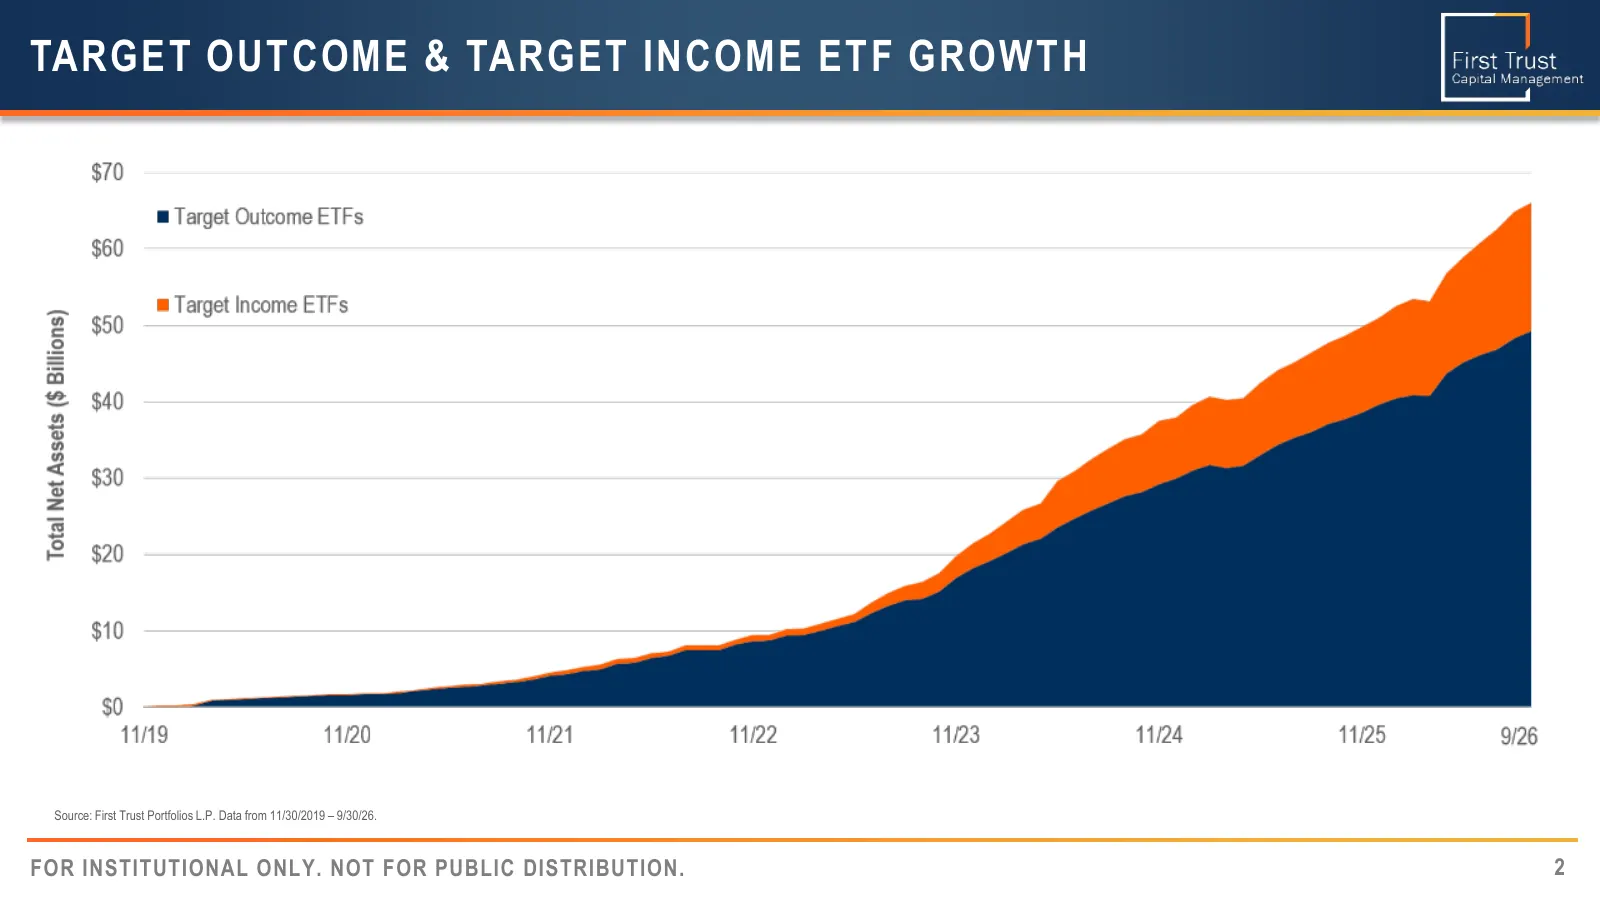
TARGET OUTCOME & TARGET INCOME ETF GROWTH Source: First Trust Portfolios L.P. Data from 11/30/2019 – 9/30/26. FOR INSTITUTIONAL ONLY. NOT FOR PUBLIC DISTRIBUTION. 2
Slide 3: Options-Based Product Growth – Industrywide
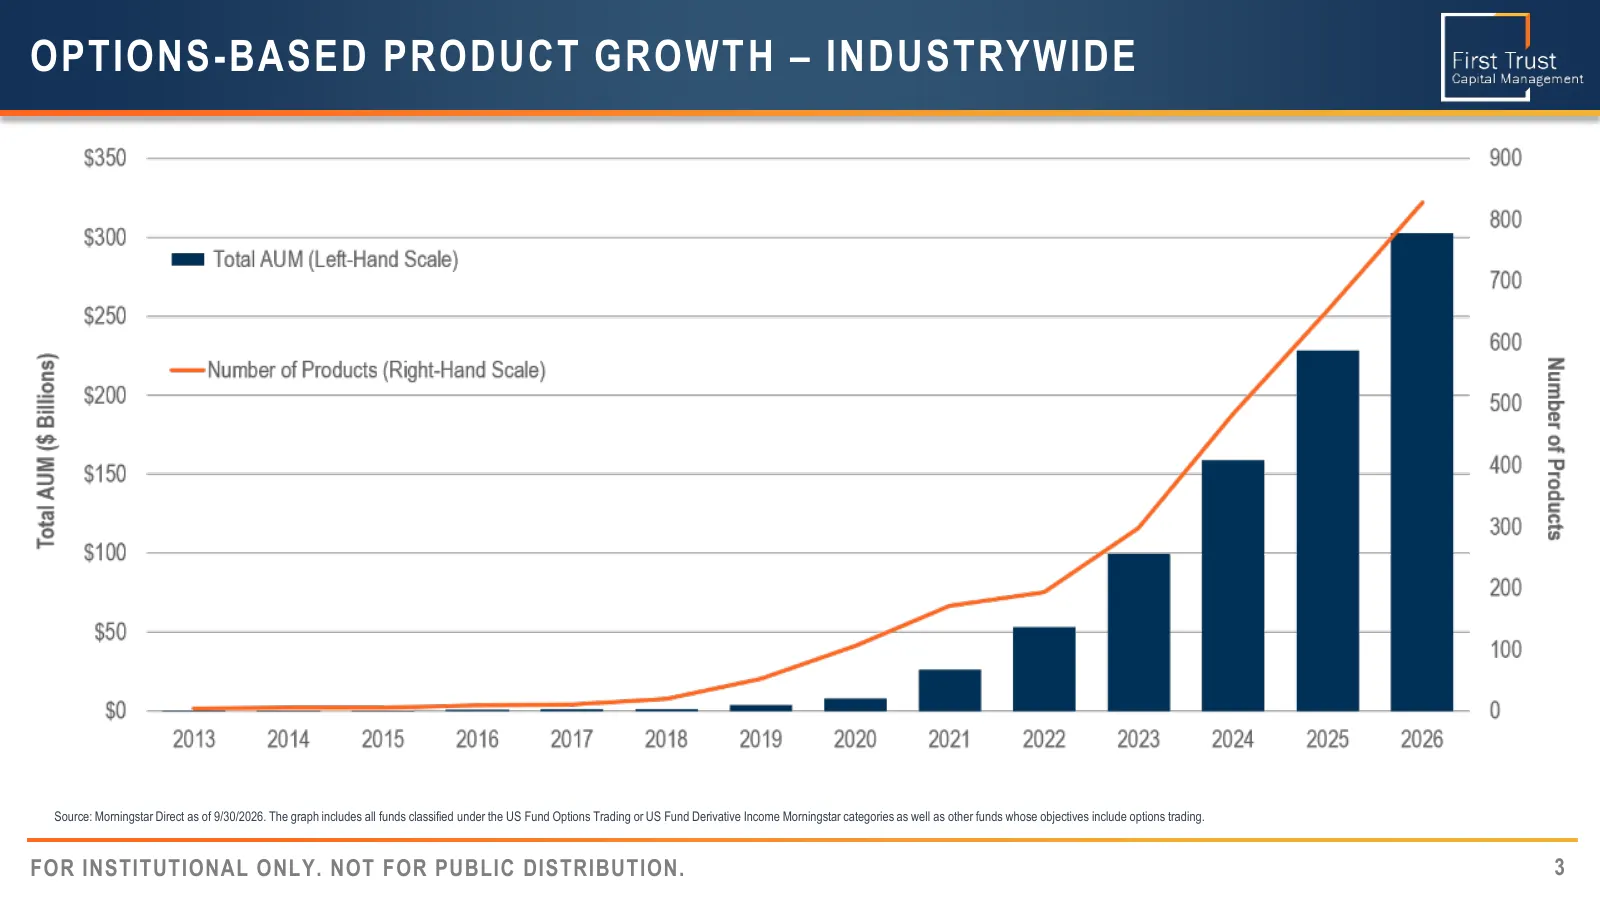
OPTIONS-BASED PRODUCT GROWTH – INDUSTRYWIDE Source: Morningstar Direct as of 9/30/2026. The graph includes all funds classified under the US Fund Options Trading or US Fund Derivative Income Morningstar categories as well as other funds whose objectives include options trading. FOR INSTITUTIONAL ONL
Slide 4: Series A4 Term Sheet
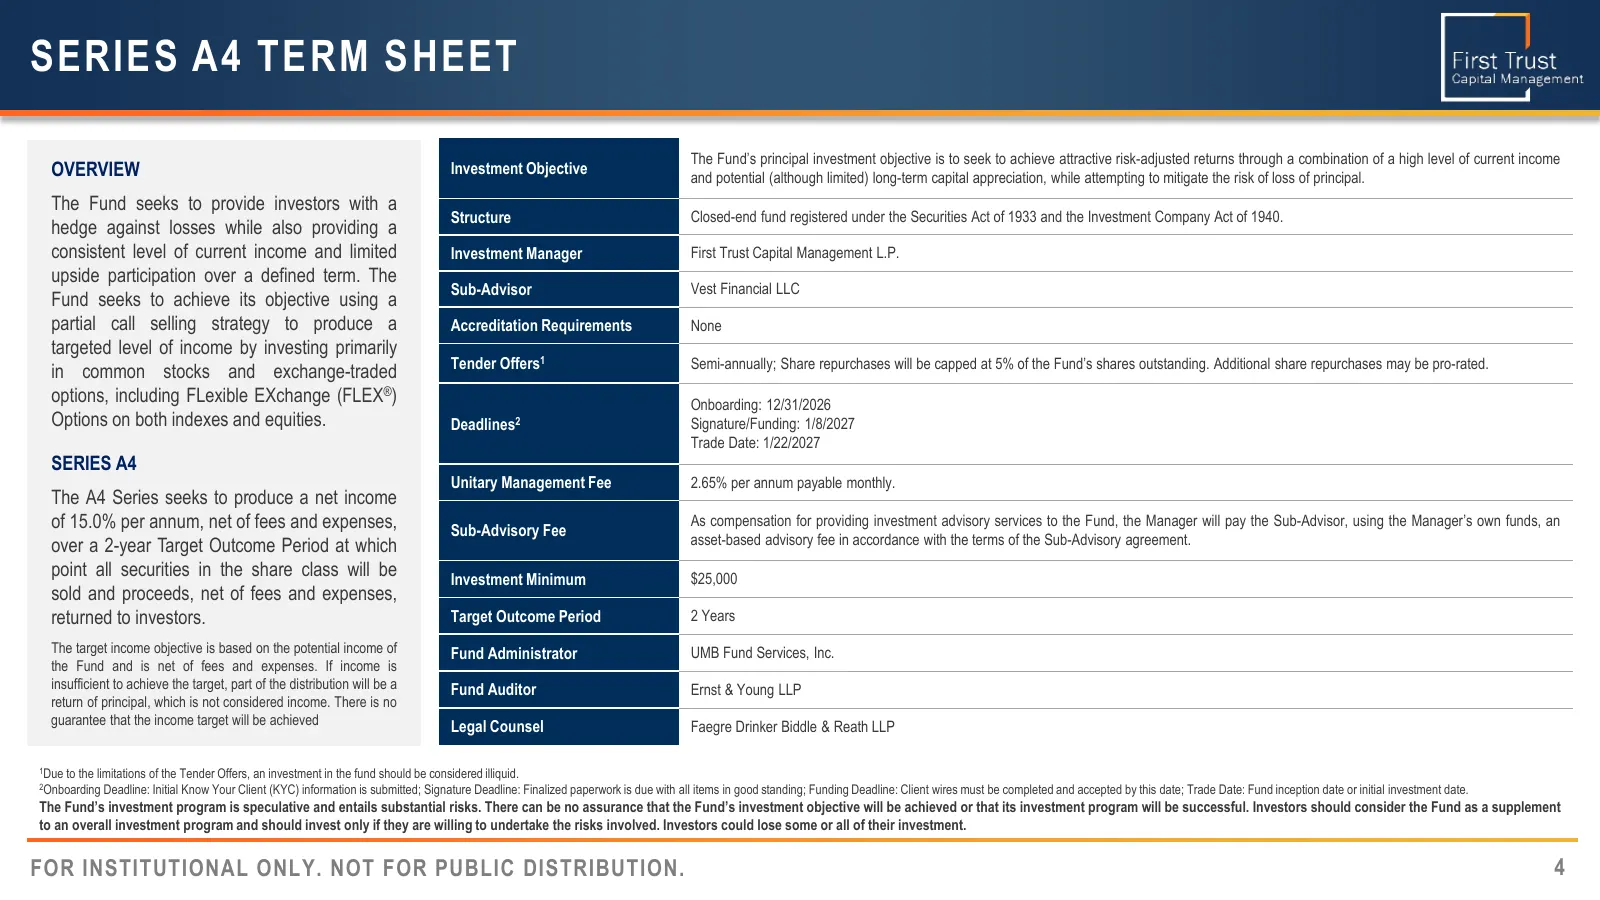
SERIES A4 TERM SHEET The Fund’s principal investment objective is to seek to achieve attractive risk-adjusted returns through a combination of a high level of current income OVERVIEW Investment Objective and potential (although limited) long-term capital appreciation, while attempting to mitigate th
Slide 5: Fund Highlights
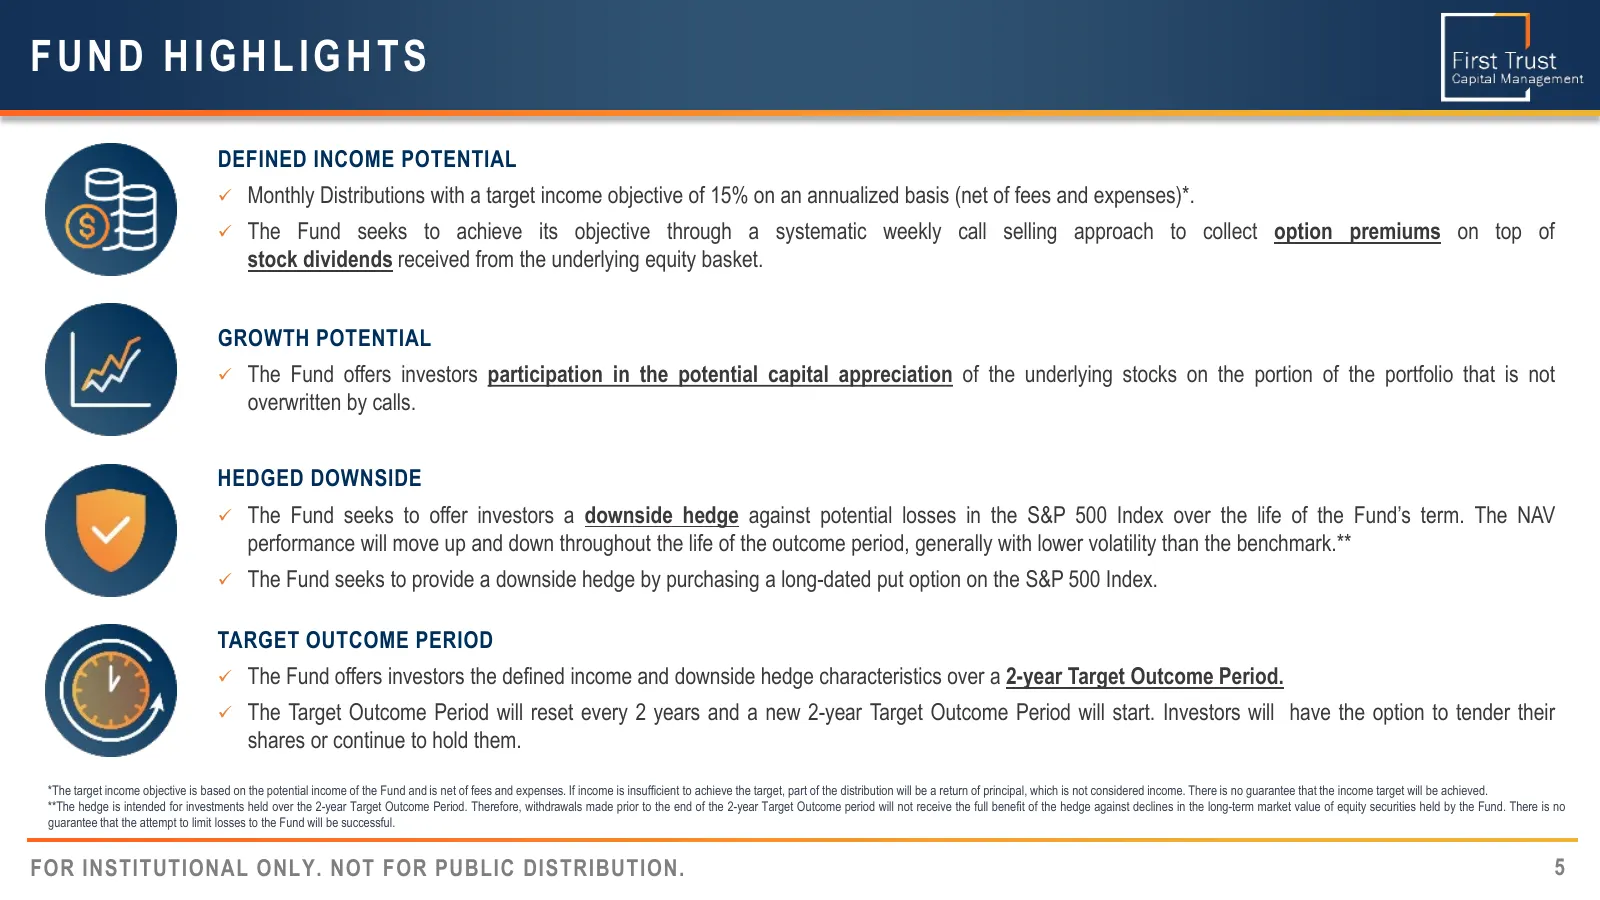
FUND HIGHLIGHTS DEFINED INCOME POTENTIAL Monthly Distributions with a target income objective of 15% on an annualized basis (net of fees and expenses)*. The Fund seeks to achieve its objective through a systematic weekly call selling approach to collect option premiums on top of stock dividends
Slide 6: Why an Options-Based Fund?
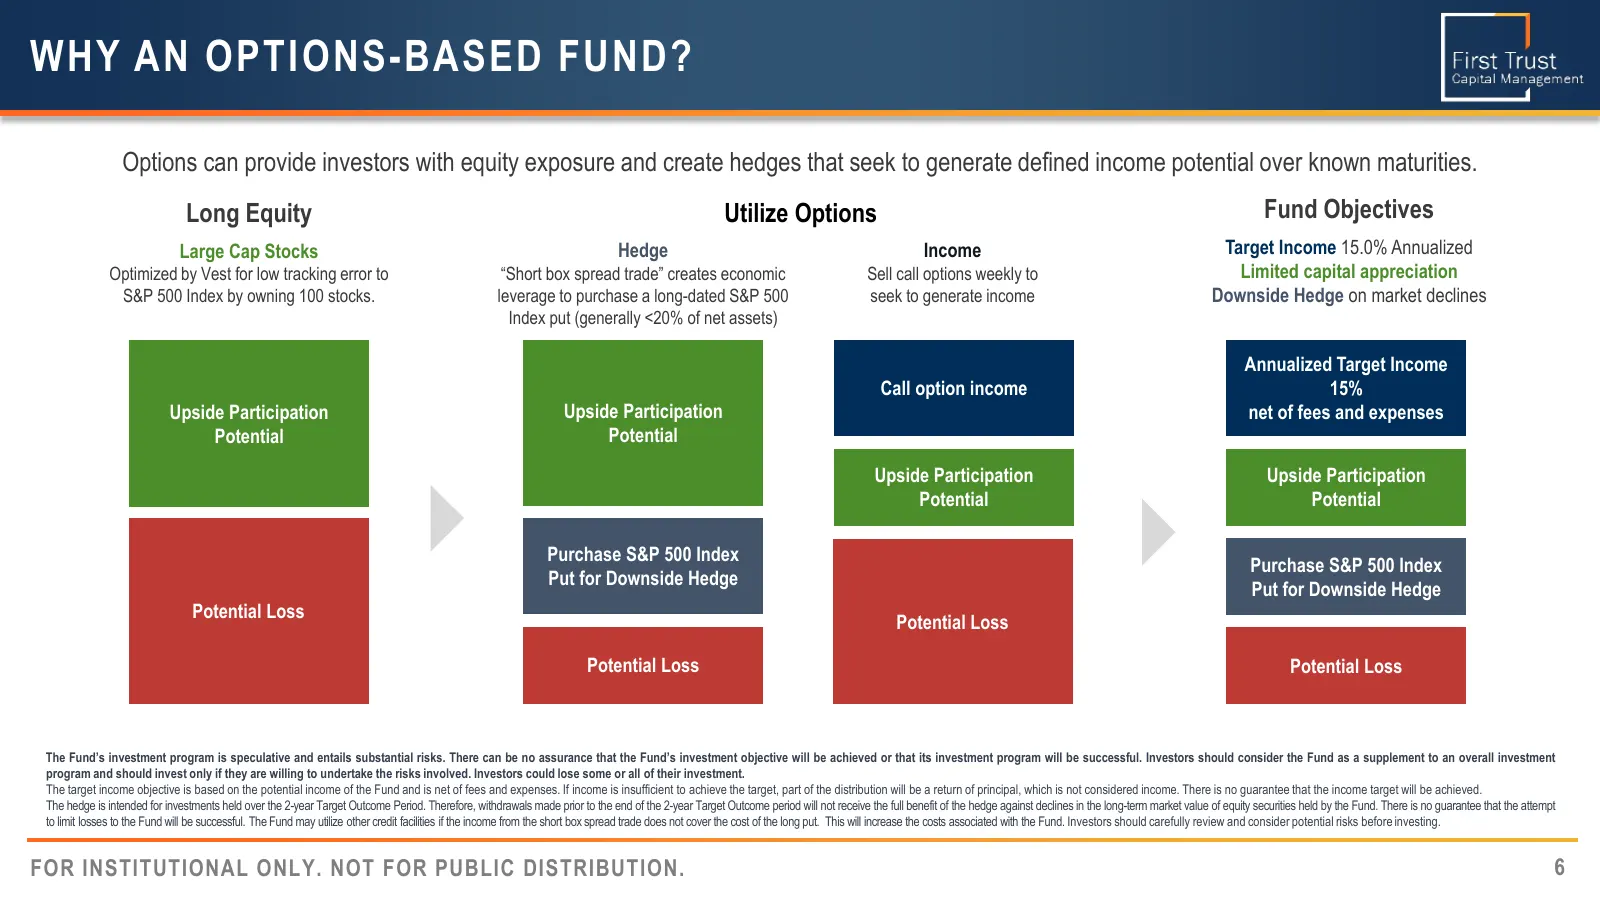
WHY AN OPTIONS-BASED FUND? Options can provide investors with equity exposure and create hedges that seek to generate defined income potential over known maturities. Long Equity Utilize Options Fund Objectives Large Cap Stocks Hedge Income Target Income 15.0% Annualized Optimized by Vest for low tra
Slide 7: Investment Process: Core Equity Exposure
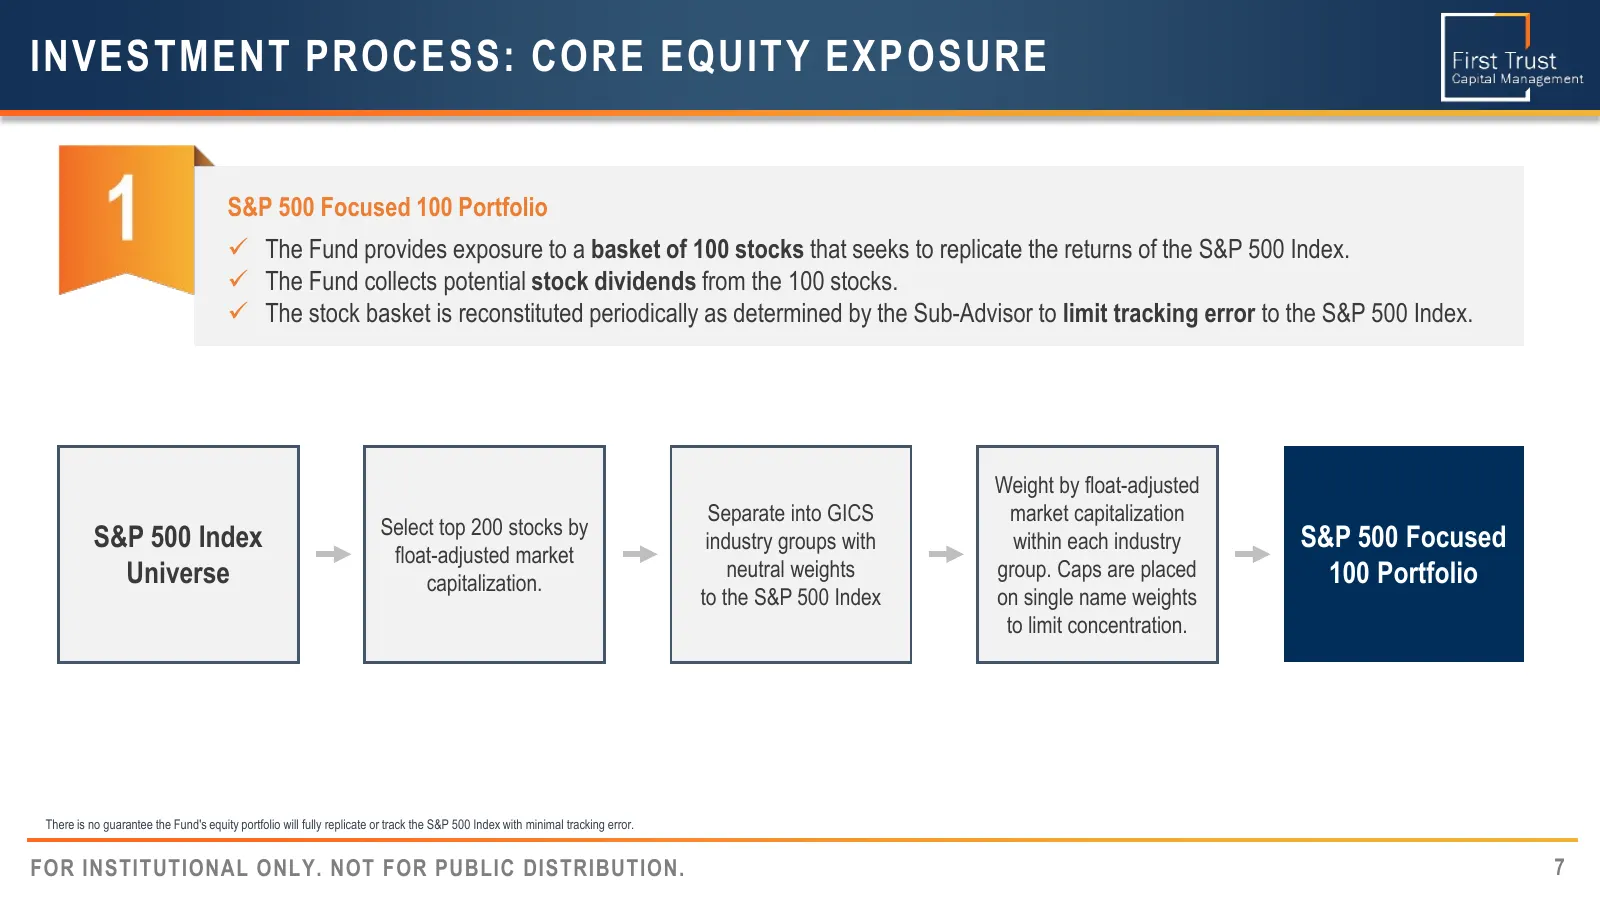
INVESTMENT PROCESS: CORE EQUITY EXPOSURE S&P 500 Focused 100 Portfolio The Fund provides exposure to a basket of 100 stocks that seeks to replicate the returns of the S&P 500 Index. The Fund collects potential stock dividends from the 100 stocks. The stock basket is reconstituted periodically
Slide 8: The Potential Benefit of Weekly Calls
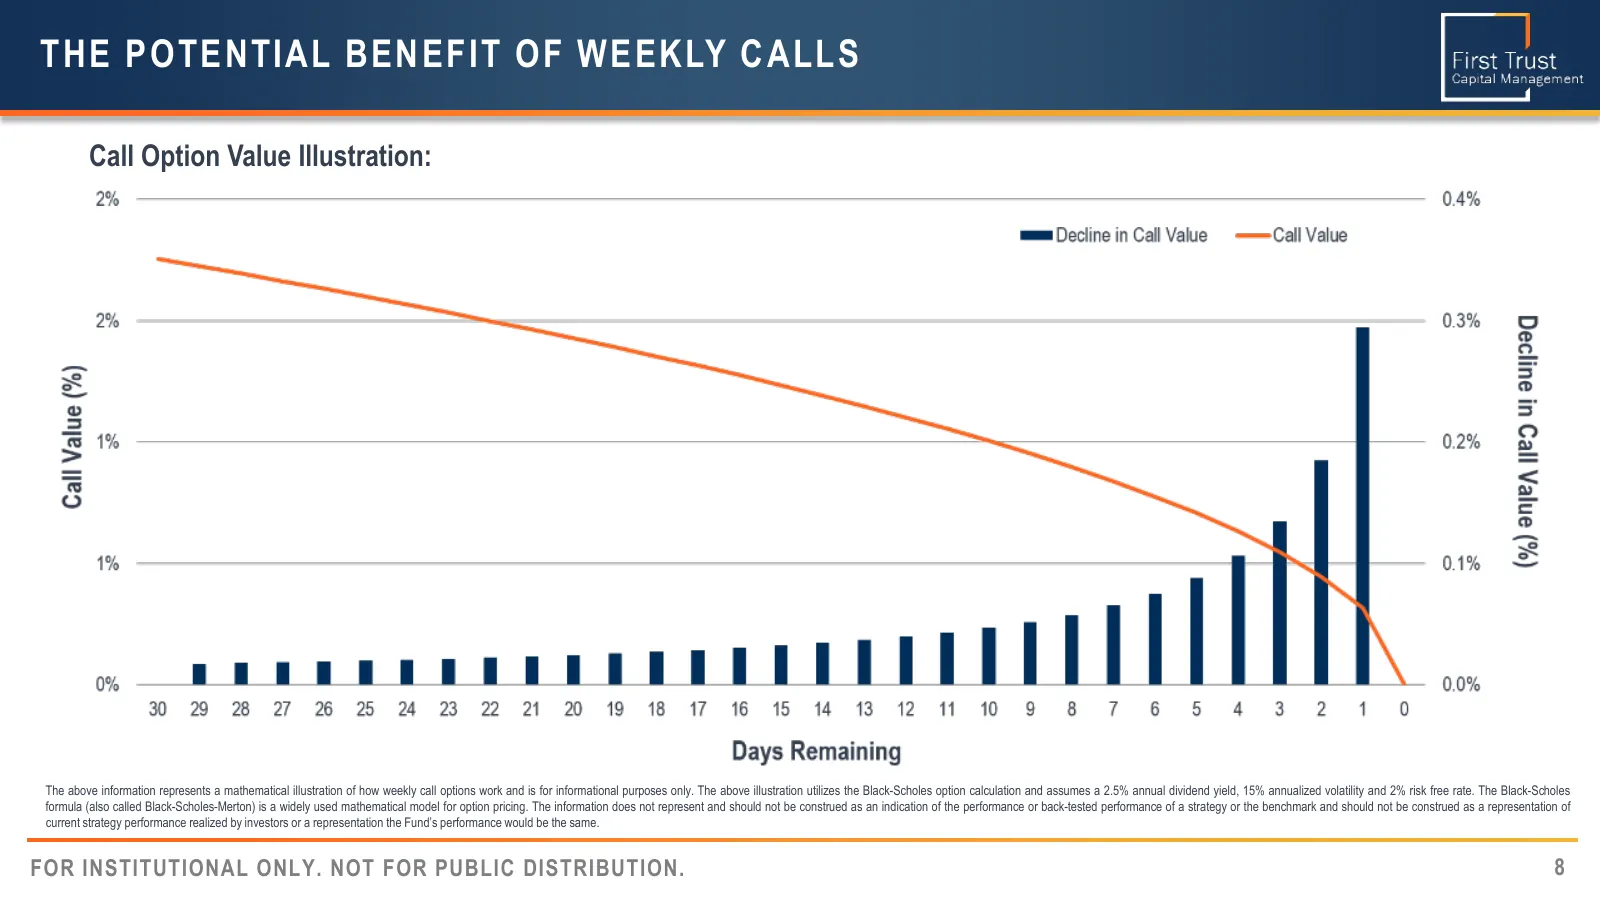
THE POTENTIAL BENEFIT OF WEEKLY CALLS Call Option Value Illustration: The above information represents a mathematical illustration of how weekly call options work and is for informational purposes only. The above illustration utilizes the Black-Scholes option calculation and assumes a 2.5% annual di
Slide 9: Monthly Option vs Weekly Options
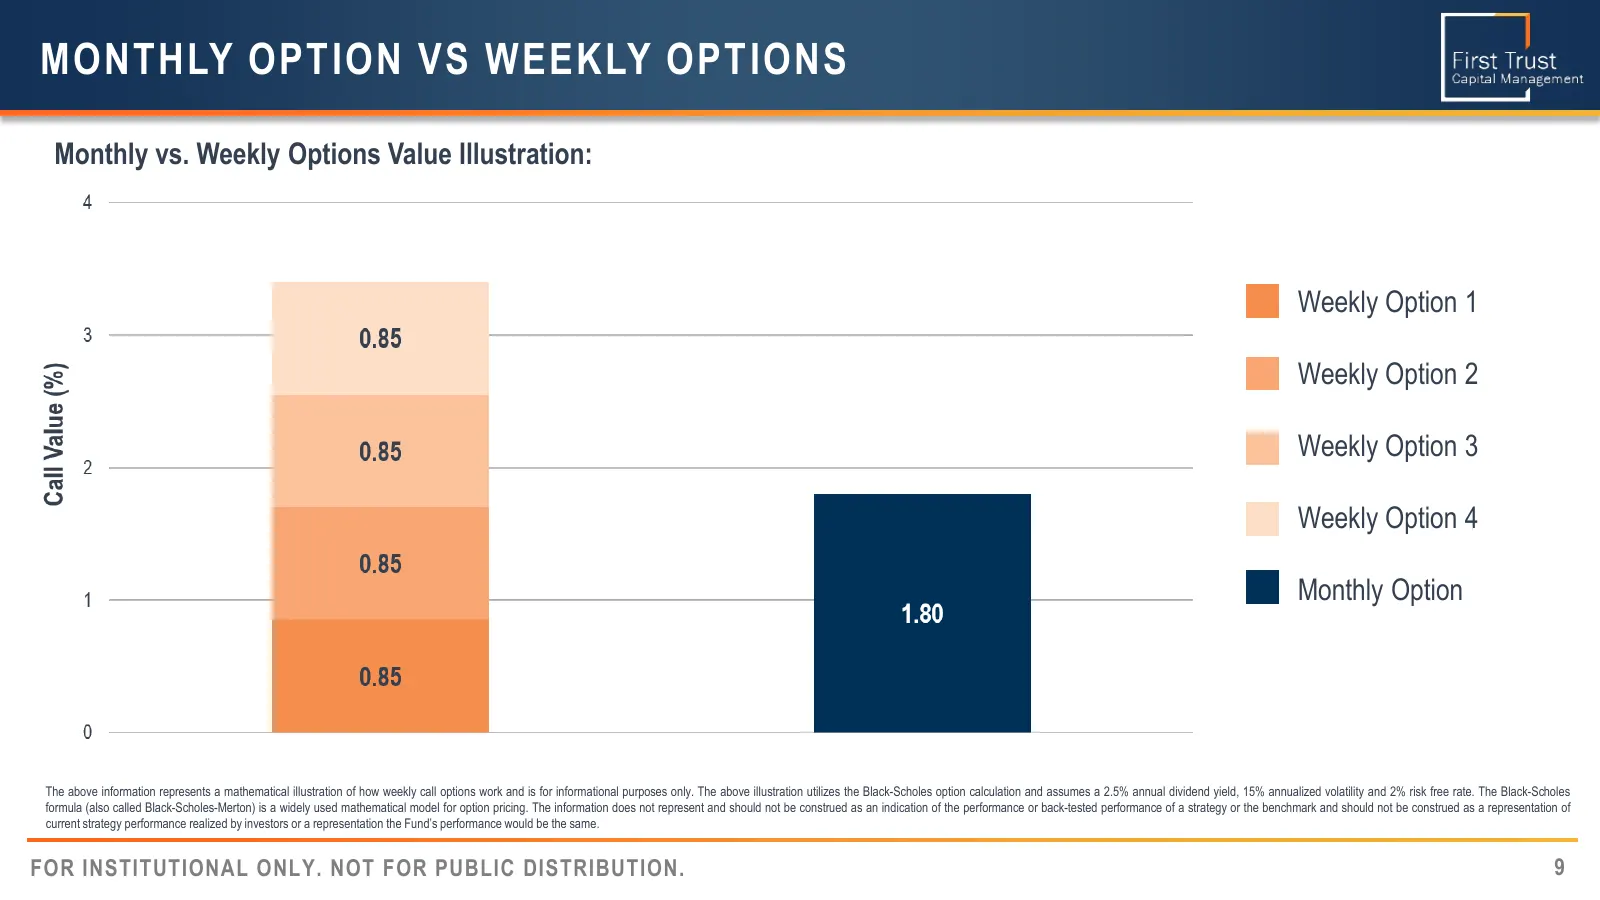
MONTHLY OPTION VS WEEKLY OPTIONS Monthly vs. Weekly Options Value Illustration: Weekly Option 1 Weekly Option 2 Weekly Option 3 Weekly Option 4 Monthly Option The above information represents a mathematical illustration of how weekly call options work and is for informational purposes only. The abov
Slide 10: Illustrative Example: Call Selling
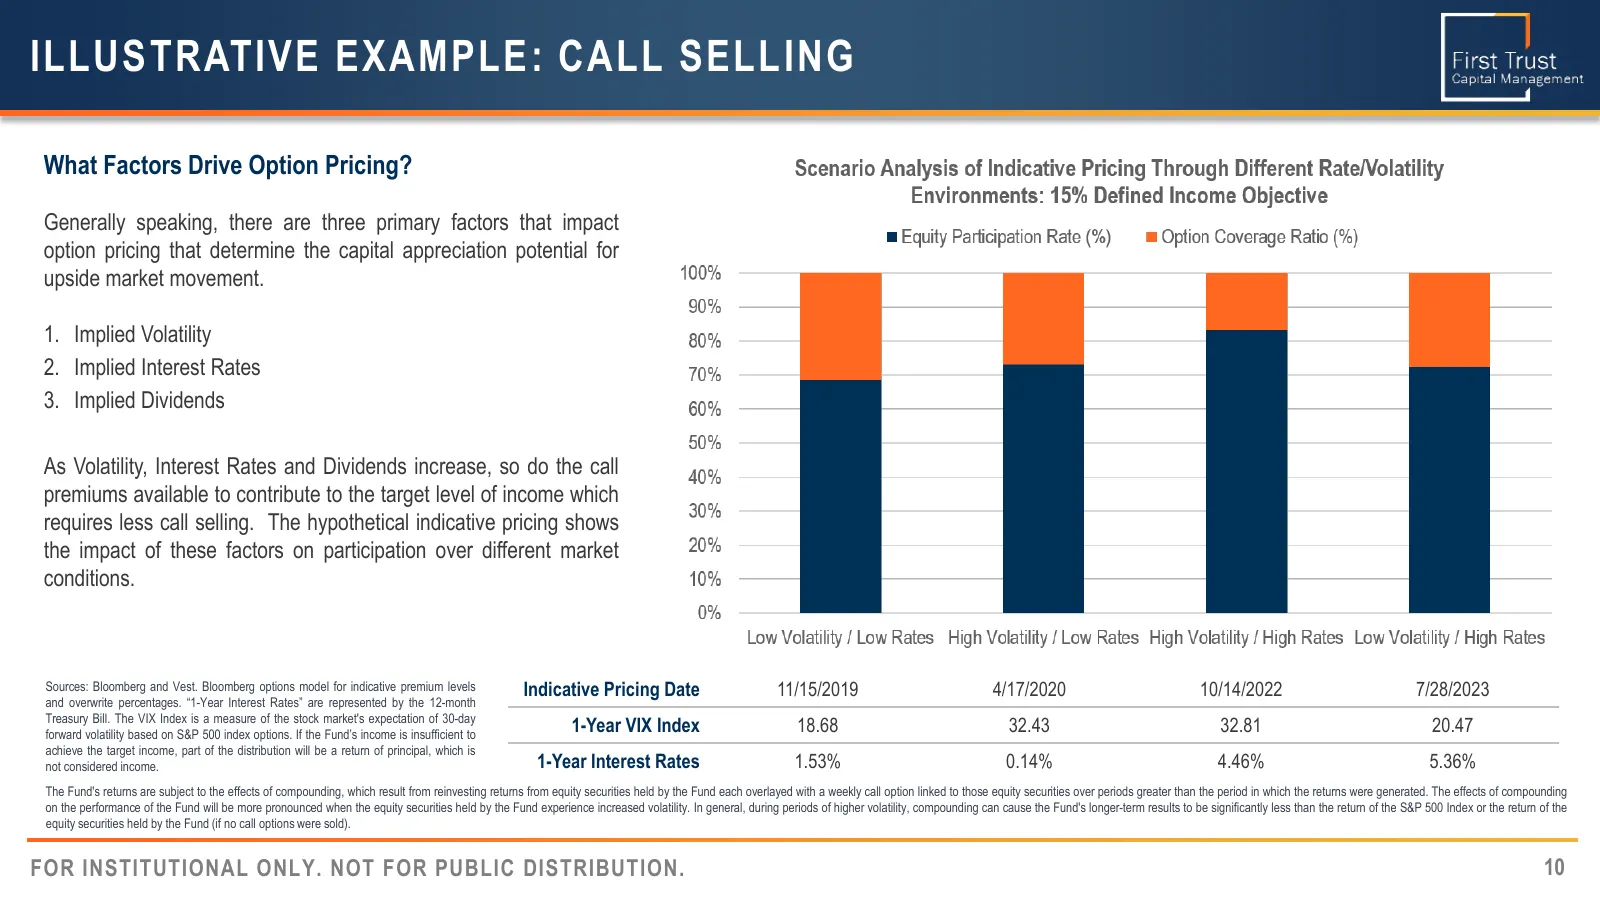
ILLUSTRATIVE EXAMPLE: CALL SELLING What Factors Drive Option Pricing? Generally speaking, there are three primary factors that impact option pricing that determine the capital appreciation potential for upside market movement. 1. Implied Volatility 2. Implied Interest Rates 3. Implied Dividends As V
Slide 11: Investment Process: Downside Hedge
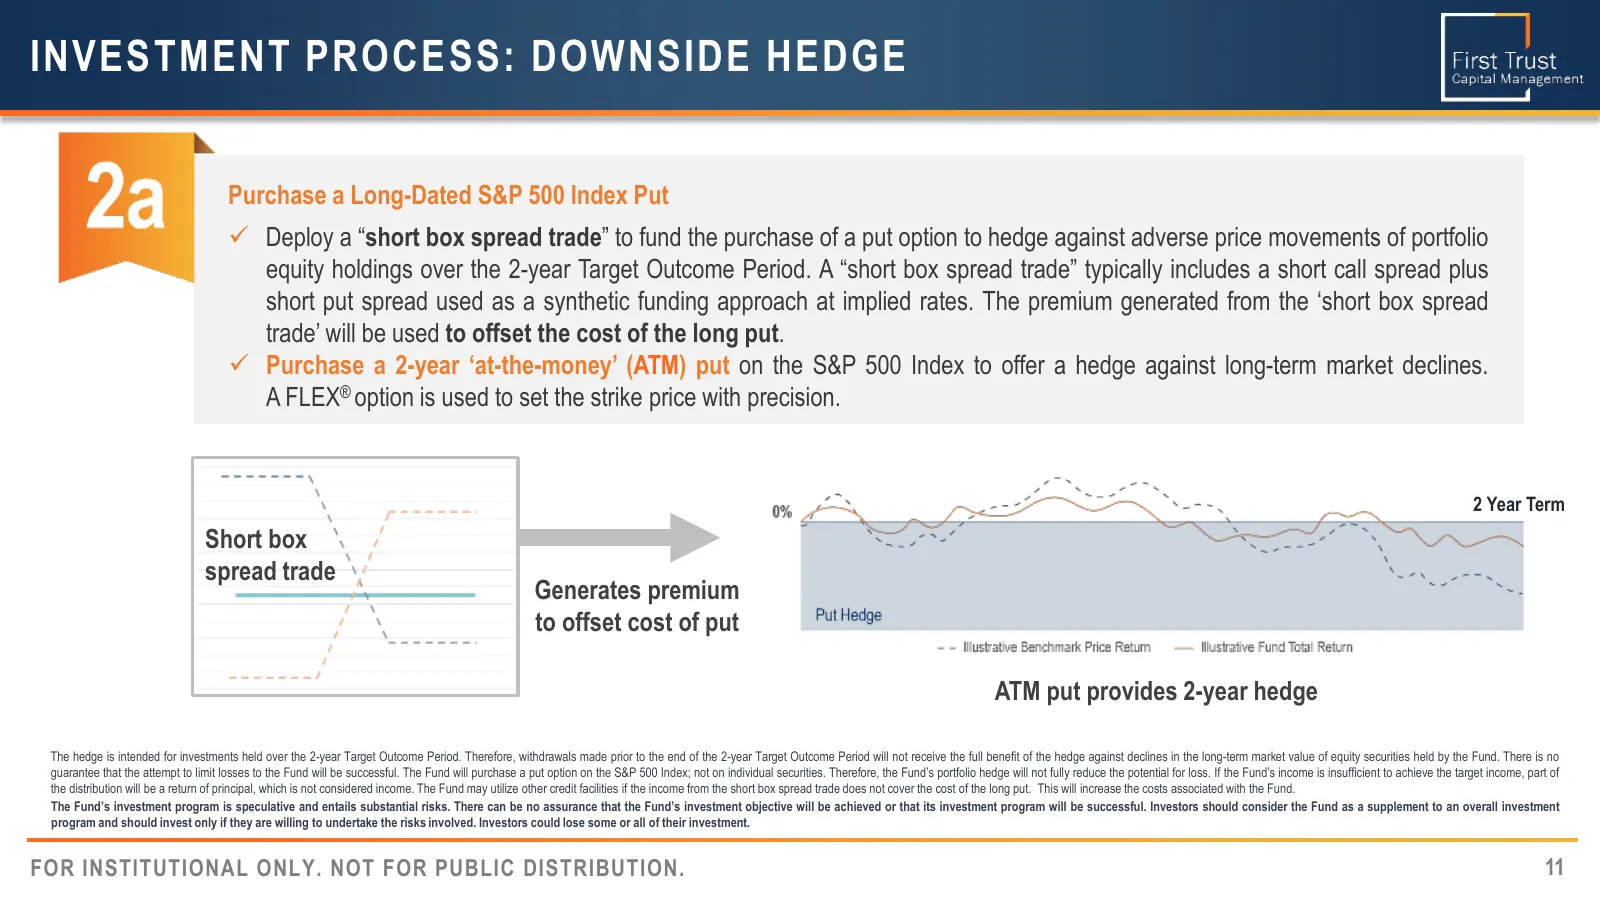
INVESTMENT PROCESS: DOWNSIDE HEDGE Purchase a Long-Dated S&P 500 Index Put Deploy a “short box spread trade” to fund the purchase of a put option to hedge against adverse price movements of portfolio equity holdings over the 2-year Target Outcome Period. A “short box spread trade” typically includ
Slide 12: Investment Process: Box Spread Trade
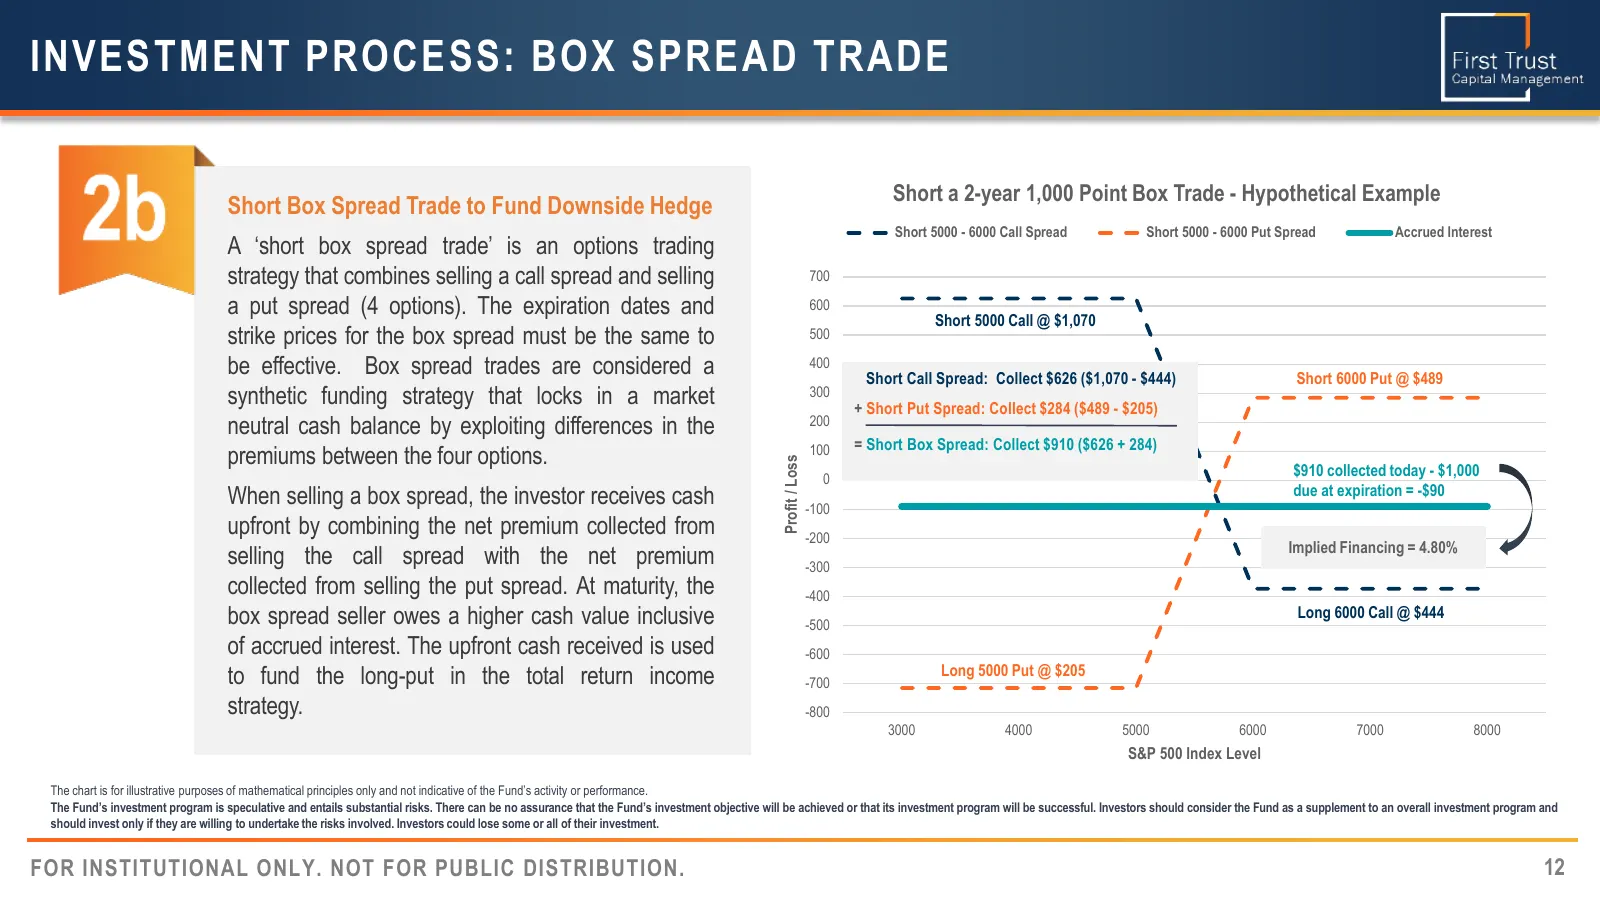
INVESTMENT PROCESS: BOX SPREAD TRADE Short a 2-year 1,000 Point Box Trade - Hypothetical Example Short Box Spread Trade to Fund Downside Hedge Short 5000 - 6000 Call Spread Short 5000 - 6000 Put Spread Accrued Interest A ‘short box spread trade’ is an options trading strategy that combines selling a
Slide 13: Investment Process: Enhanced Target Income
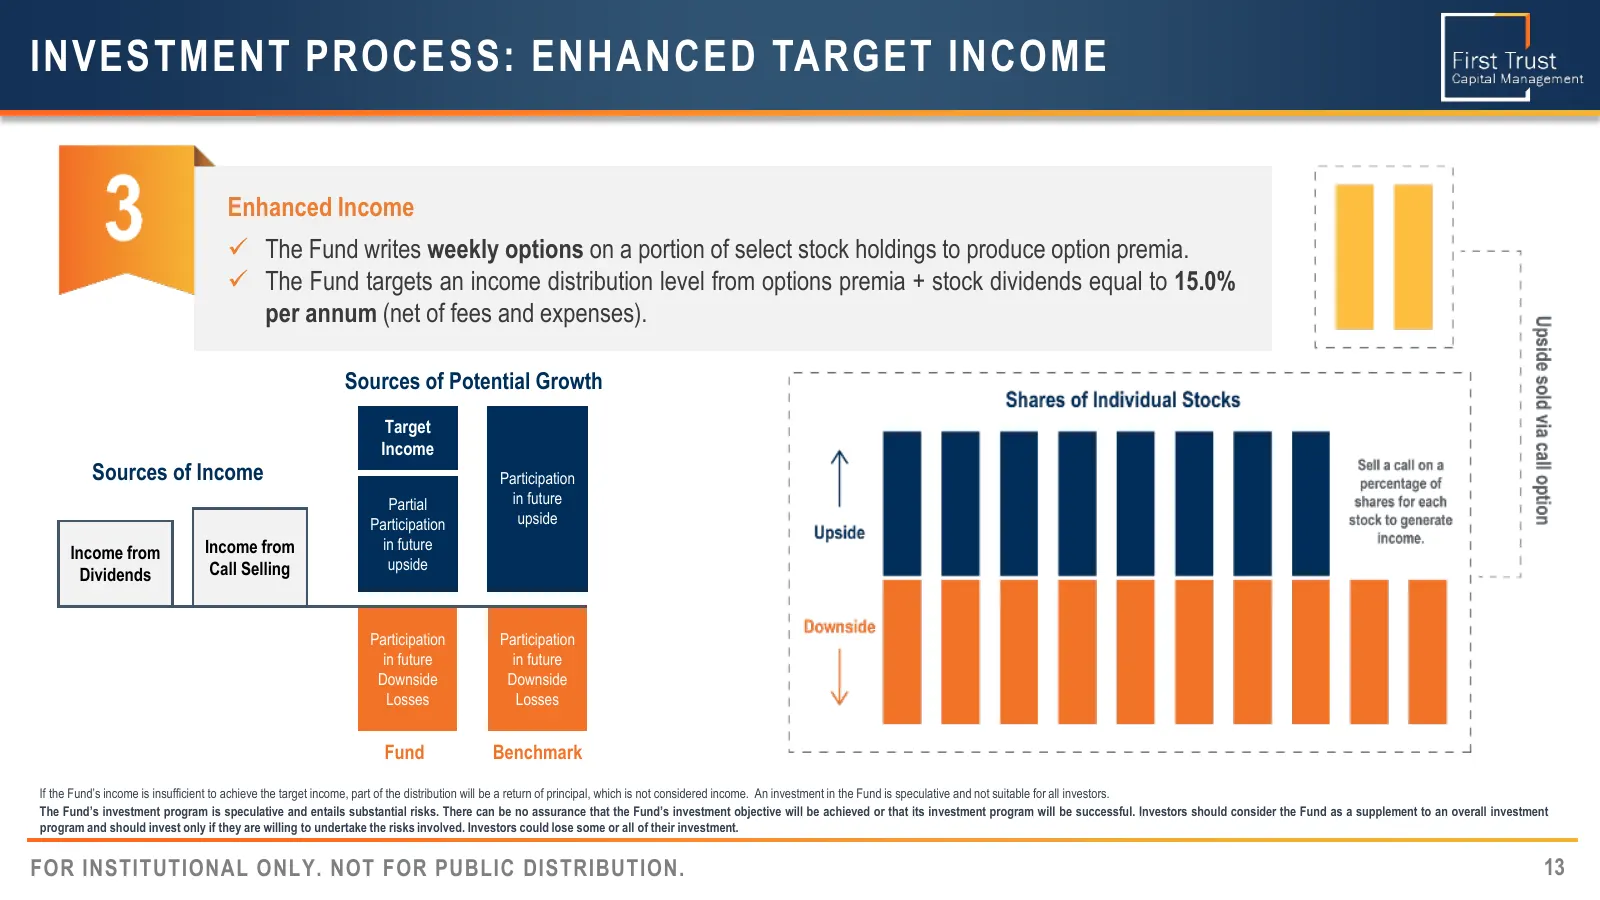
INVESTMENT PROCESS: ENHANCED TARGET INCOME Enhanced Income The Fund writes weekly options on a portion of select stock holdings to produce option premia. The Fund targets an income distribution level from options premia + stock dividends equal to 15.0% per annum (net of fees and expenses). Sourc
Slide 14: Illustrative Example: Trade Structure
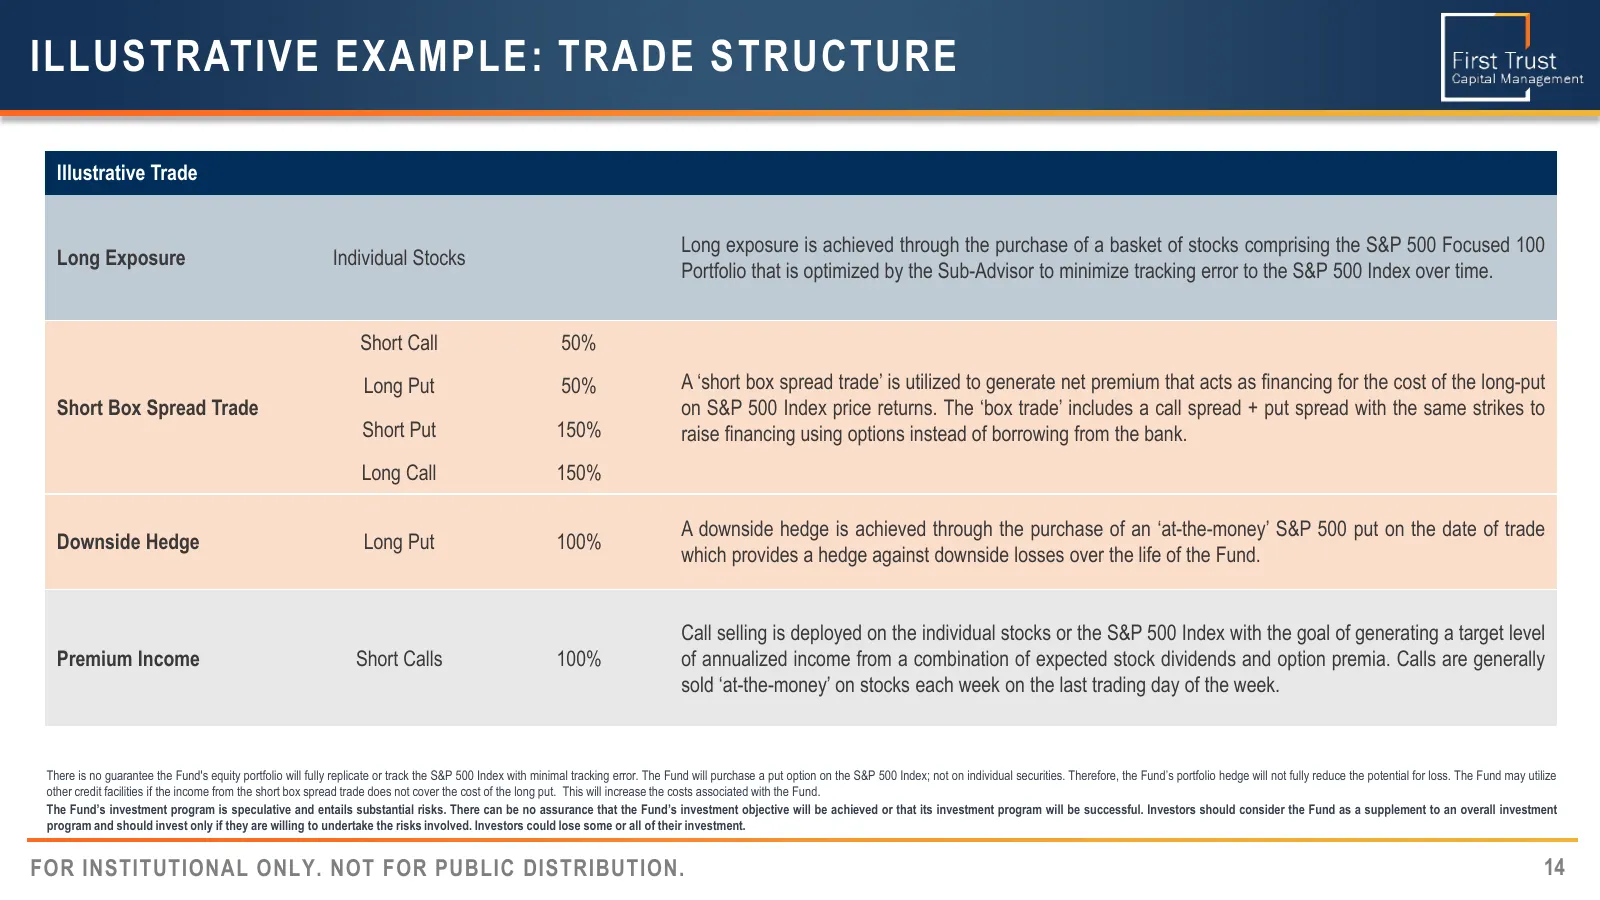
ILLUSTRATIVE EXAMPLE: TRADE STRUCTURE Illustrative Trade Long exposure is achieved through the purchase of a basket of stocks comprising the S&P 500 Focused 100 Long Exposure Individual Stocks Portfolio that is optimized by the Sub-Advisor to minimize tracking error to the S&P 500 Index over time. S
Slide 15: Investment Process: Positive Market Expectations
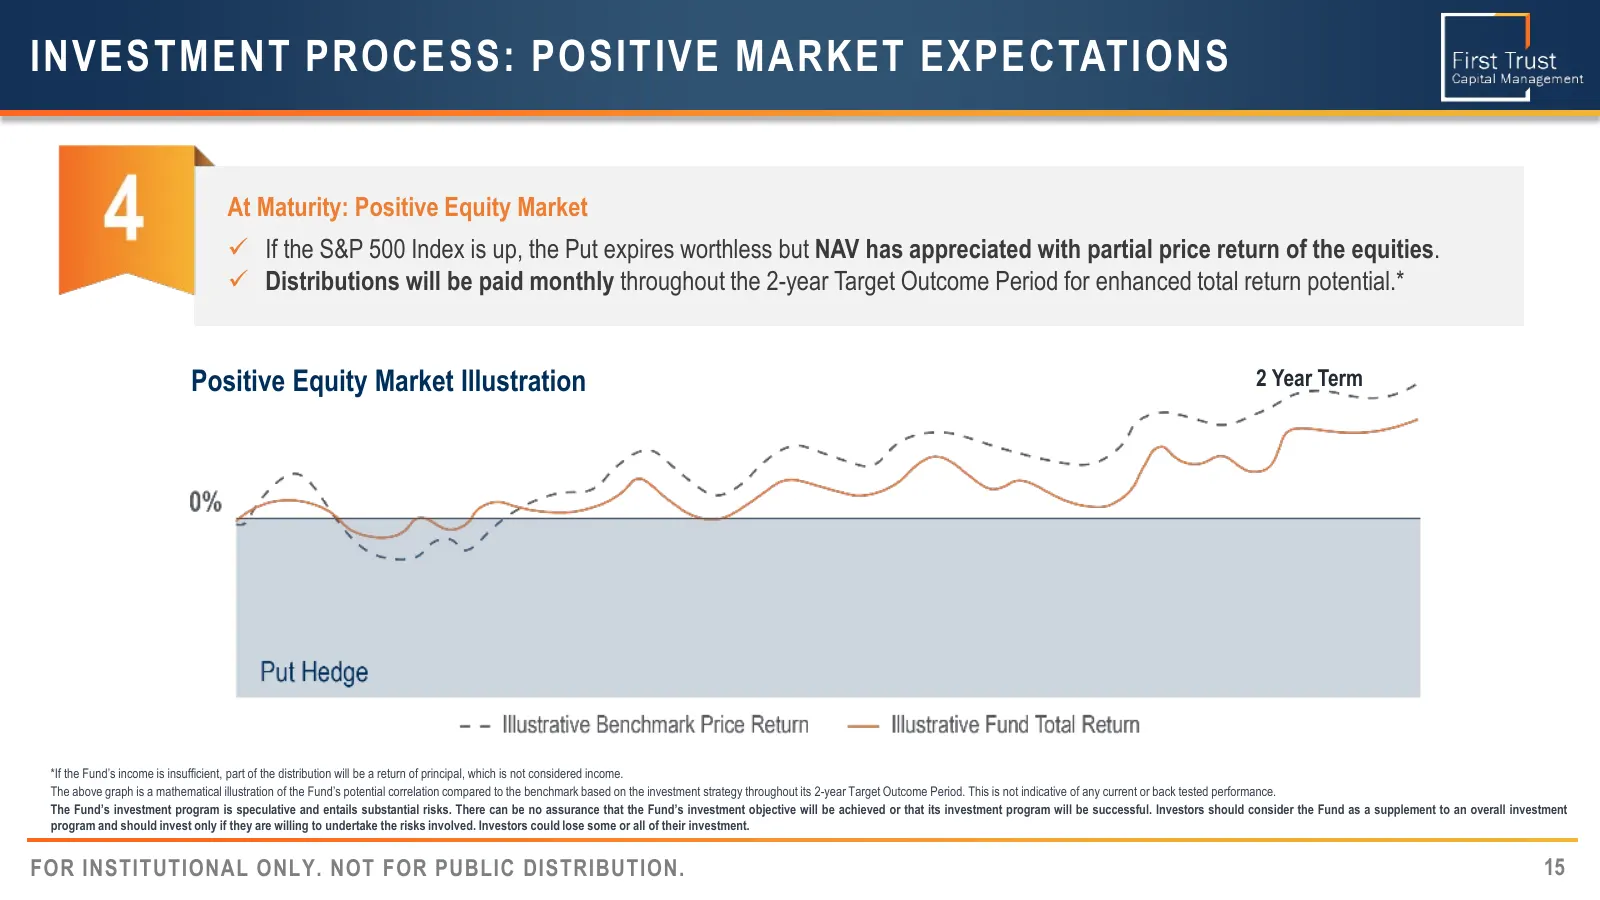
INVESTMENT PROCESS: POSITIVE MARKET EXPECTATIONS At Maturity: Positive Equity Market If the S&P 500 Index is up, the Put expires worthless but NAV has appreciated with partial price return of the equities. Distributions will be paid monthly throughout the 2-year Target Outcome Period for enhance
Slide 16: Investment Process: Negative Market Expectations
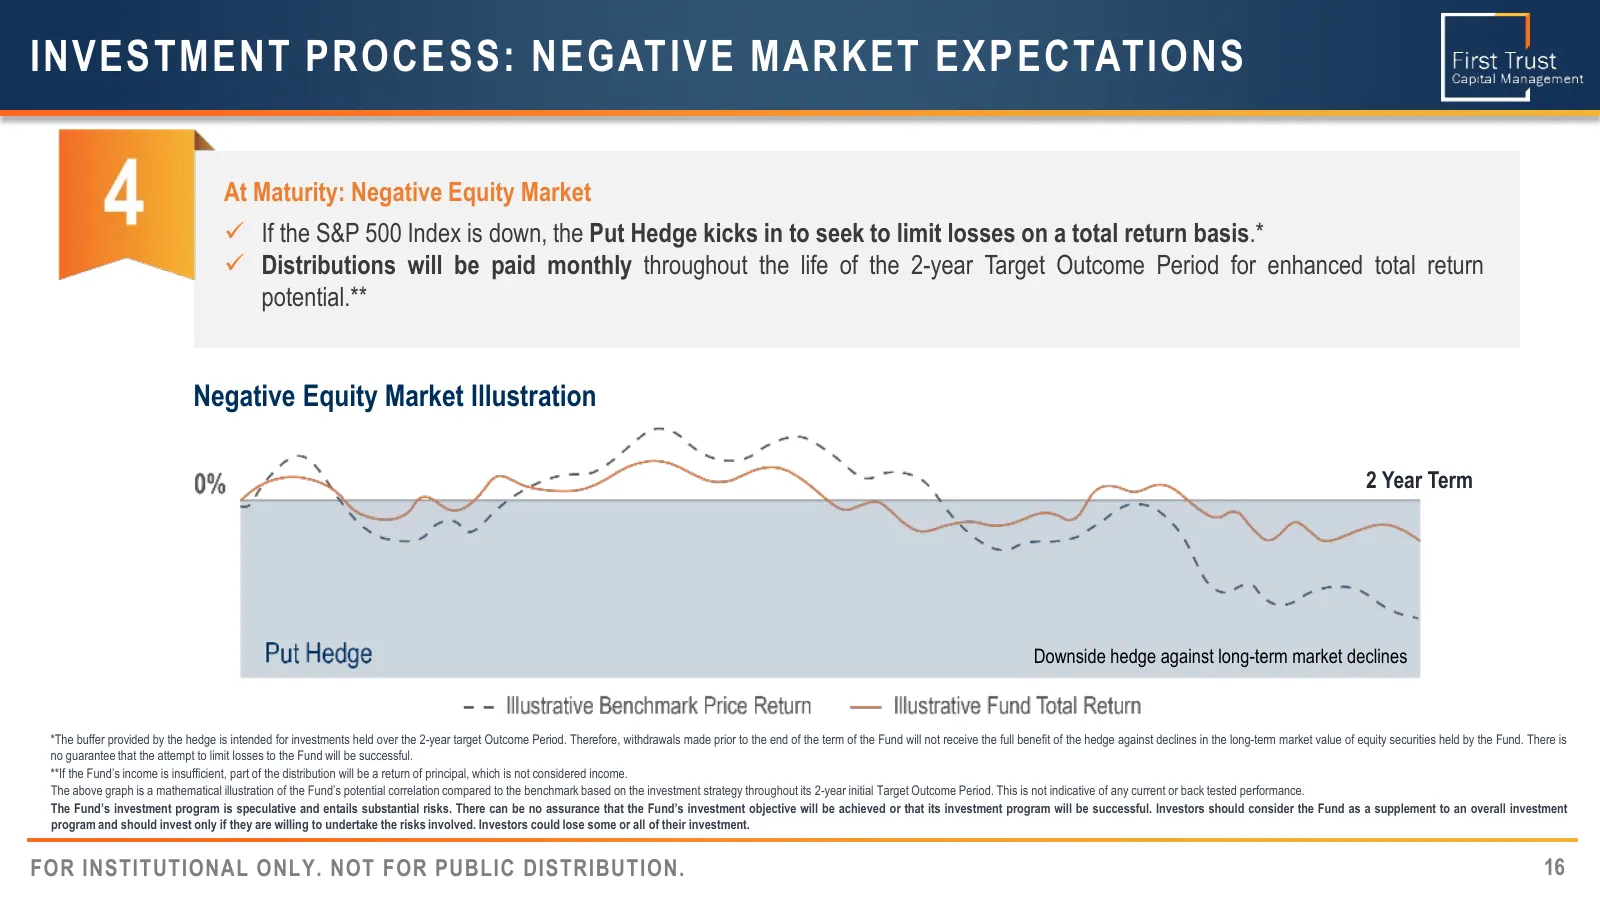
INVESTMENT PROCESS: NEGATIVE MARKET EXPECTATIONS At Maturity: Negative Equity Market If the S&P 500 Index is down, the Put Hedge kicks in to seek to limit losses on a total return basis.* Distributions will be paid monthly throughout the life of the 2-year Target Outcome Period for enhanced tota
Slide 17: Risk/Return Attribution
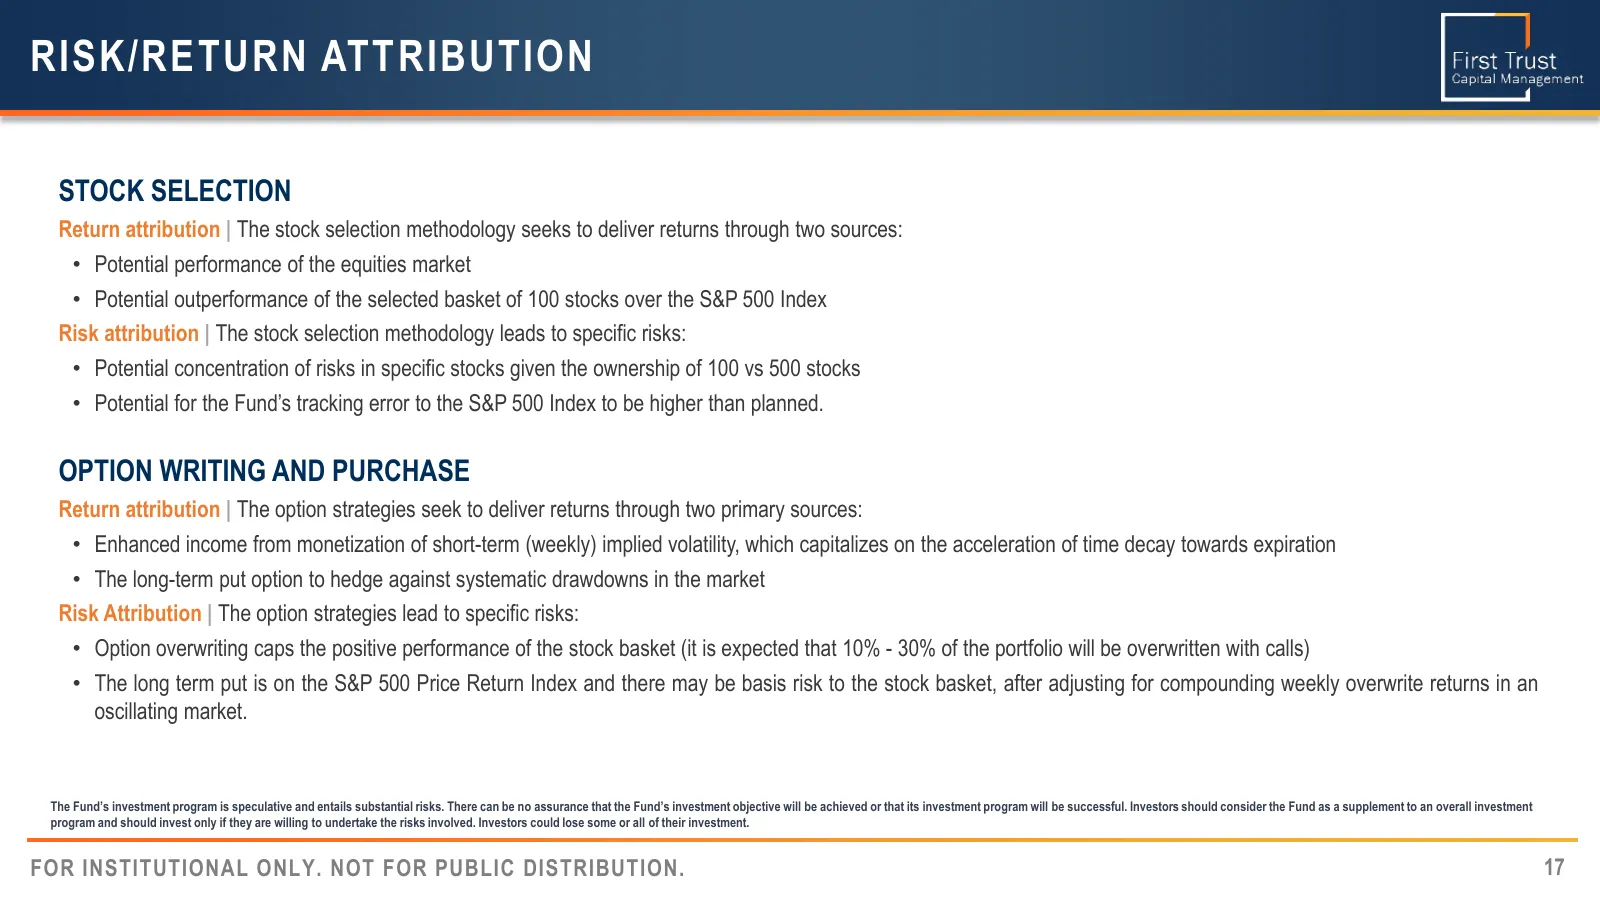
RISK/RETURN ATTRIBUTION STOCK SELECTION Return attribution | The stock selection methodology seeks to deliver returns through two sources: • Potential performance of the equities market • Potential outperformance of the selected basket of 100 stocks over the S&P 500 Index Risk attribution | The stoc
Slide 18: Performance Breakdown Illustration
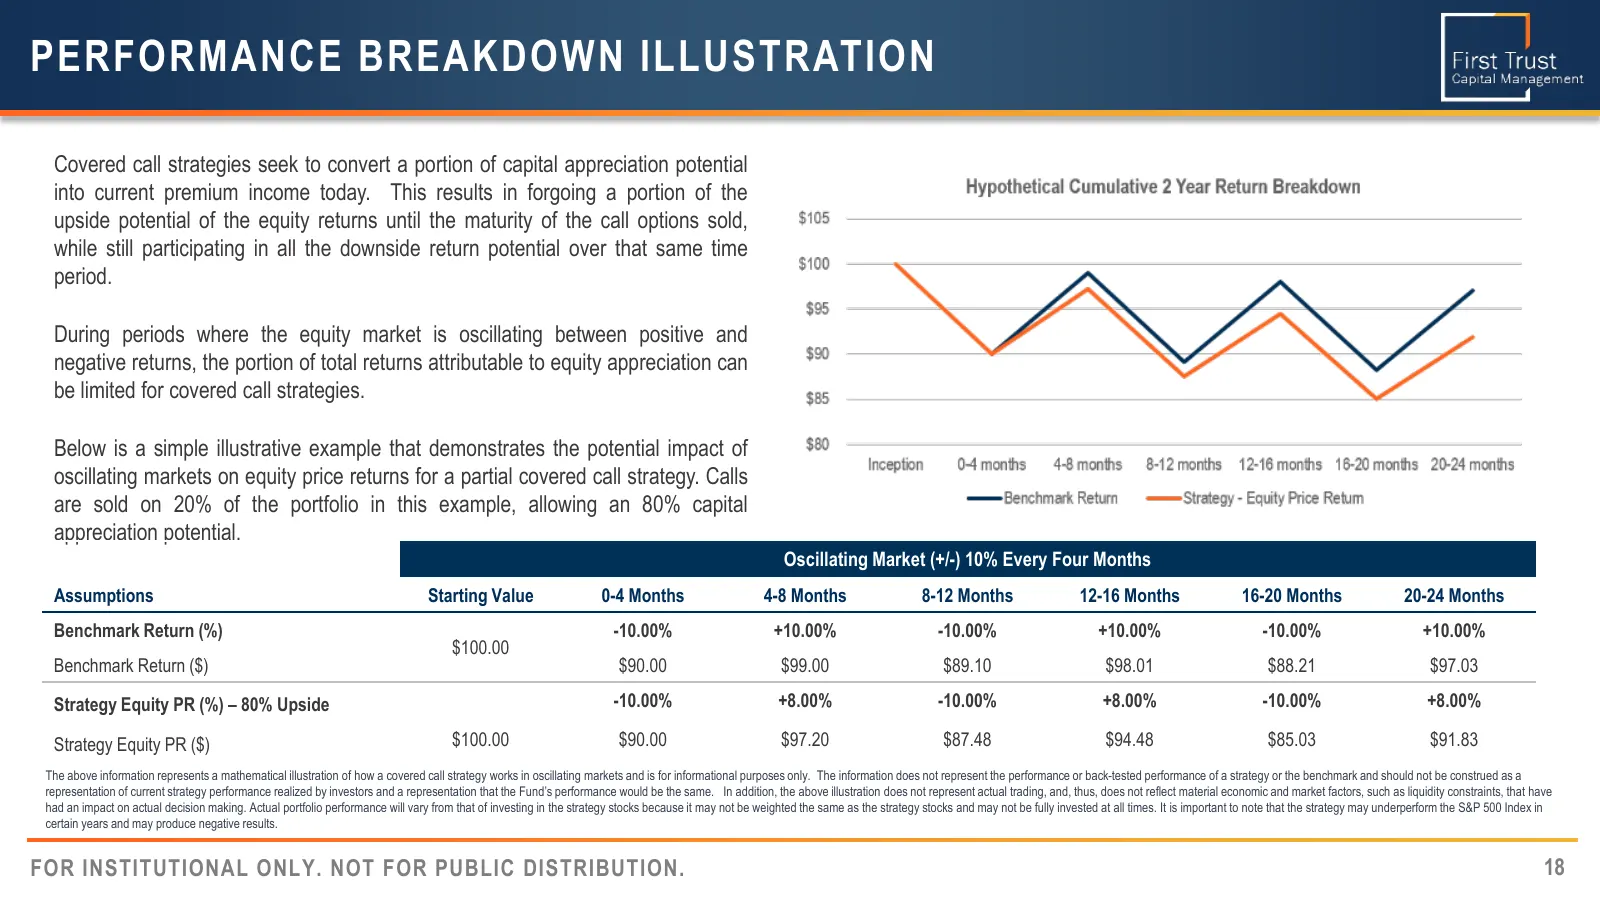
PERFORMANCE BREAKDOWN ILLUSTRATION Covered call strategies seek to convert a portion of capital appreciation potential into current premium income today. This results in forgoing a portion of the upside potential of the equity returns until the maturity of the call options sold, while still particip
Slide 19: Illustrative Example: Positive Equity Market
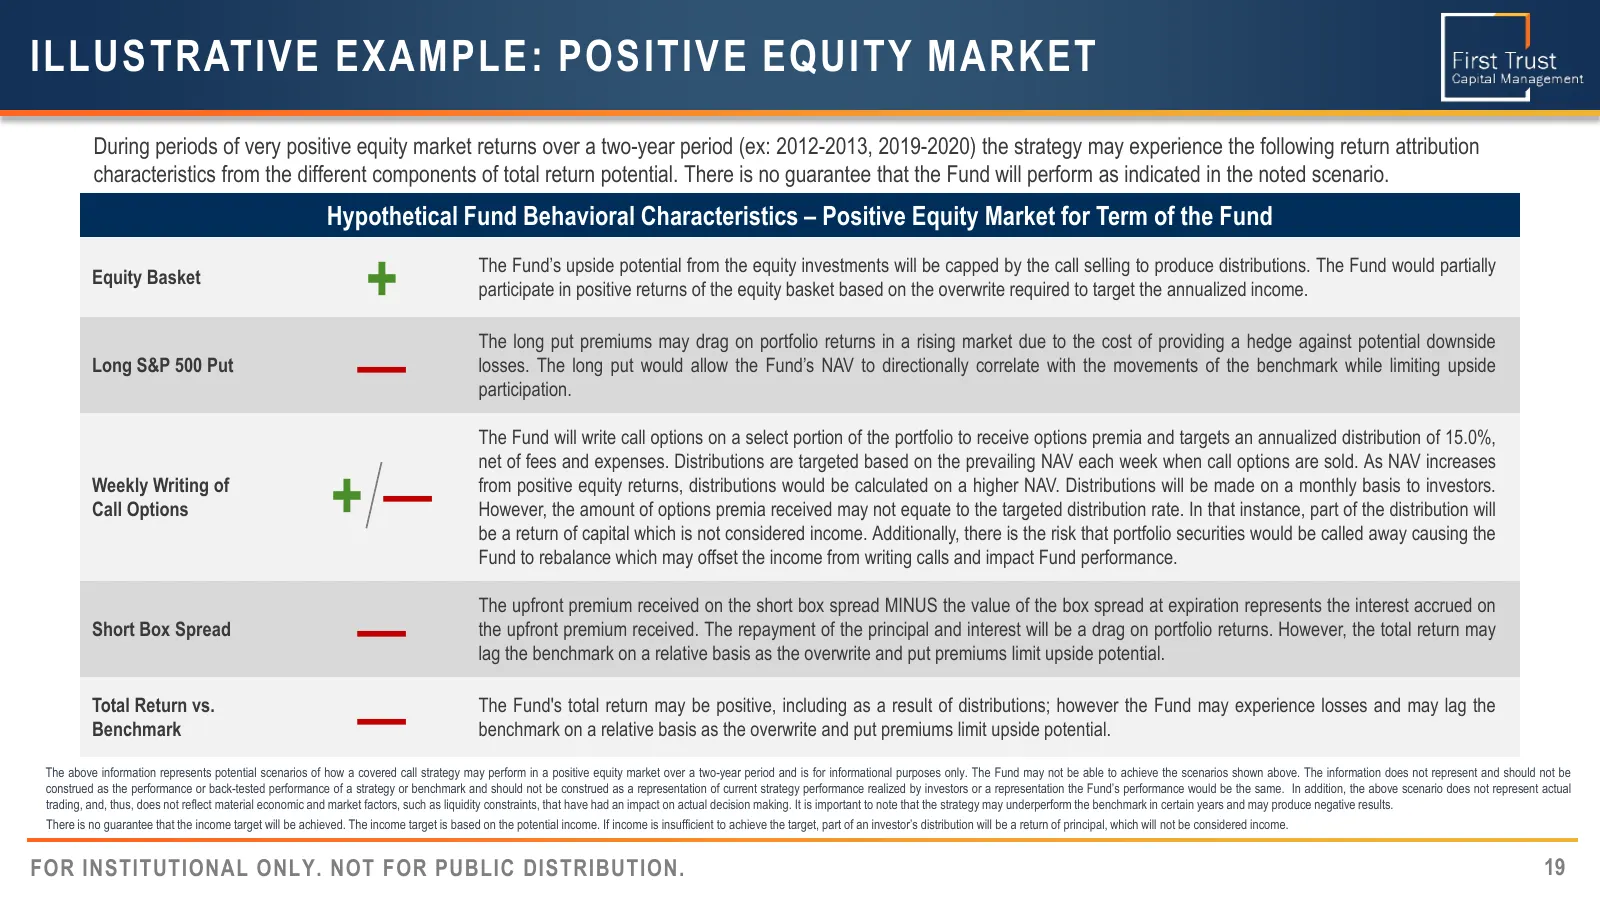
ILLUSTRATIVE EXAMPLE: POSITIVE EQUITY MARKET During periods of very positive equity market returns over a two-year period (ex: 2012-2013, 2019-2020) the strategy may experience the following return attribution characteristics from the different components of total return potential. There is no guara
Slide 20: Illustrative Example: Flat Equity Market
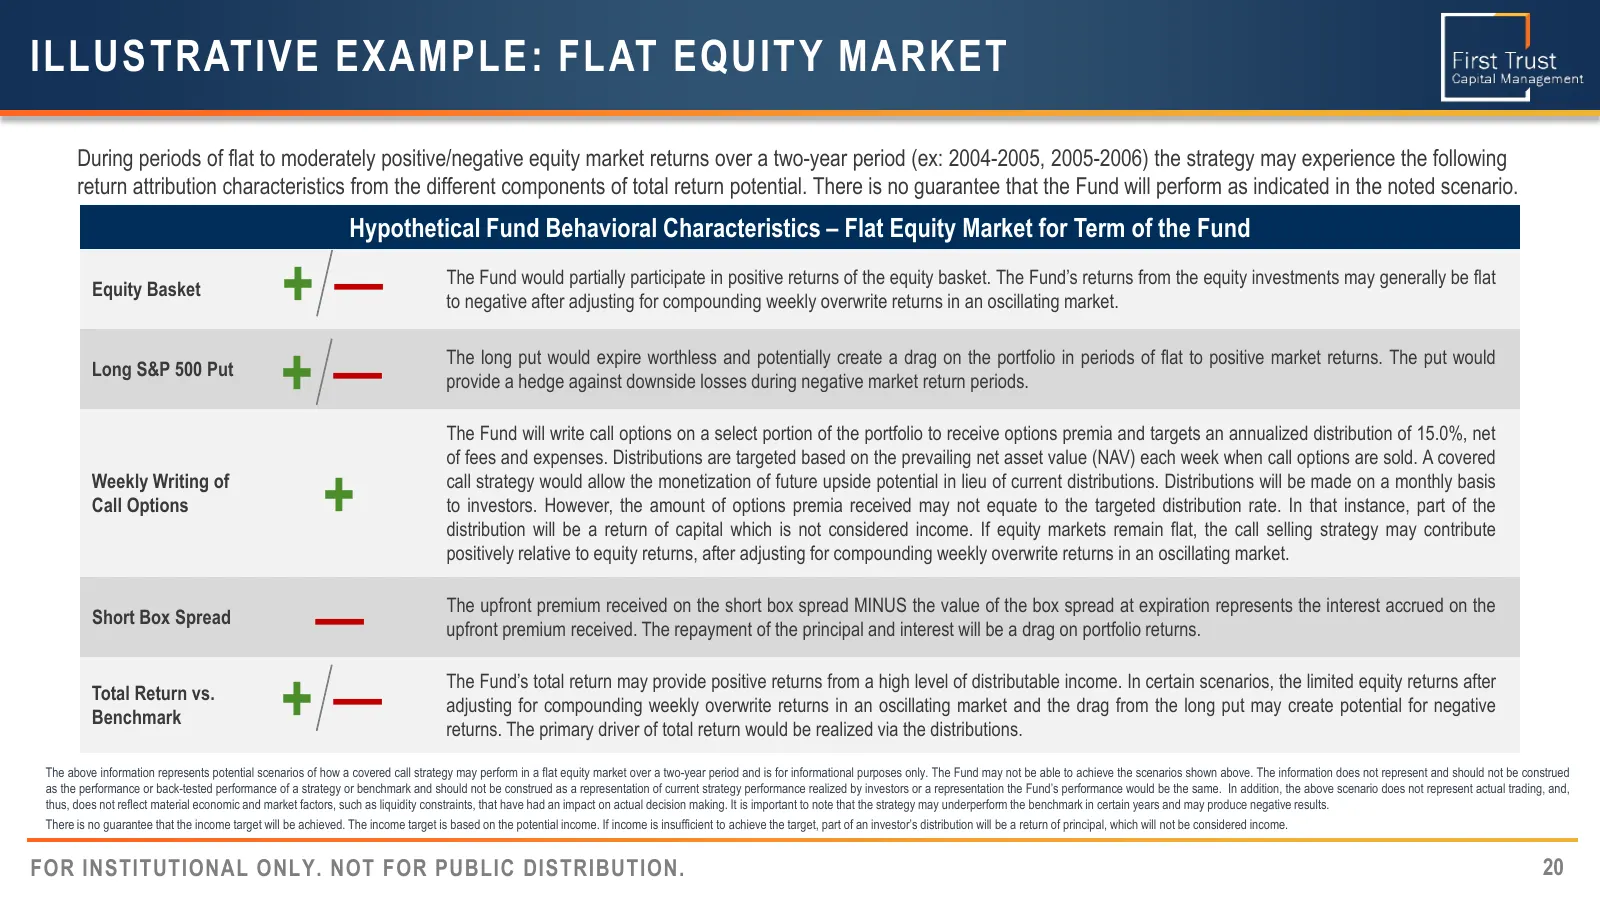
ILLUSTRATIVE EXAMPLE: FLAT EQUITY MARKET During periods of flat to moderately positive/negative equity market returns over a two-year period (ex: 2004-2005, 2005-2006) the strategy may experience the following return attribution characteristics from the different components of total return potential
Slide 21: Illustrative Example: Negative Equity Market
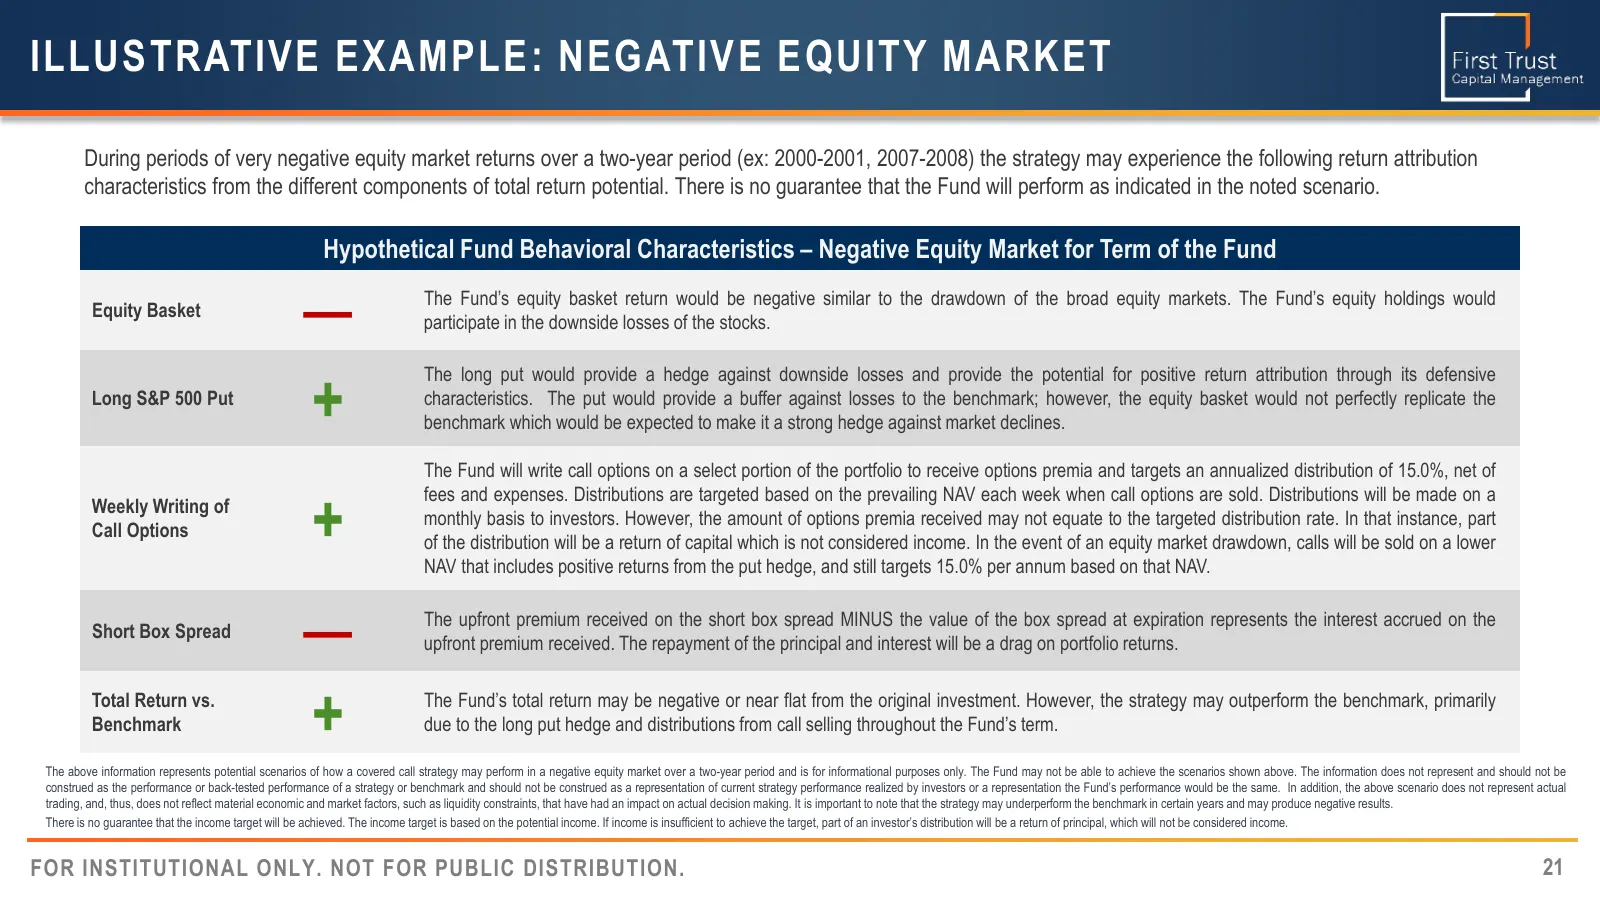
ILLUSTRATIVE EXAMPLE: NEGATIVE EQUITY MARKET During periods of very negative equity market returns over a two-year period (ex: 2000-2001, 2007-2008) the strategy may experience the following return attribution characteristics from the different components of total return potential. There is no guara
Slide 22: Illustrative Example – Impact of No Reinvestments
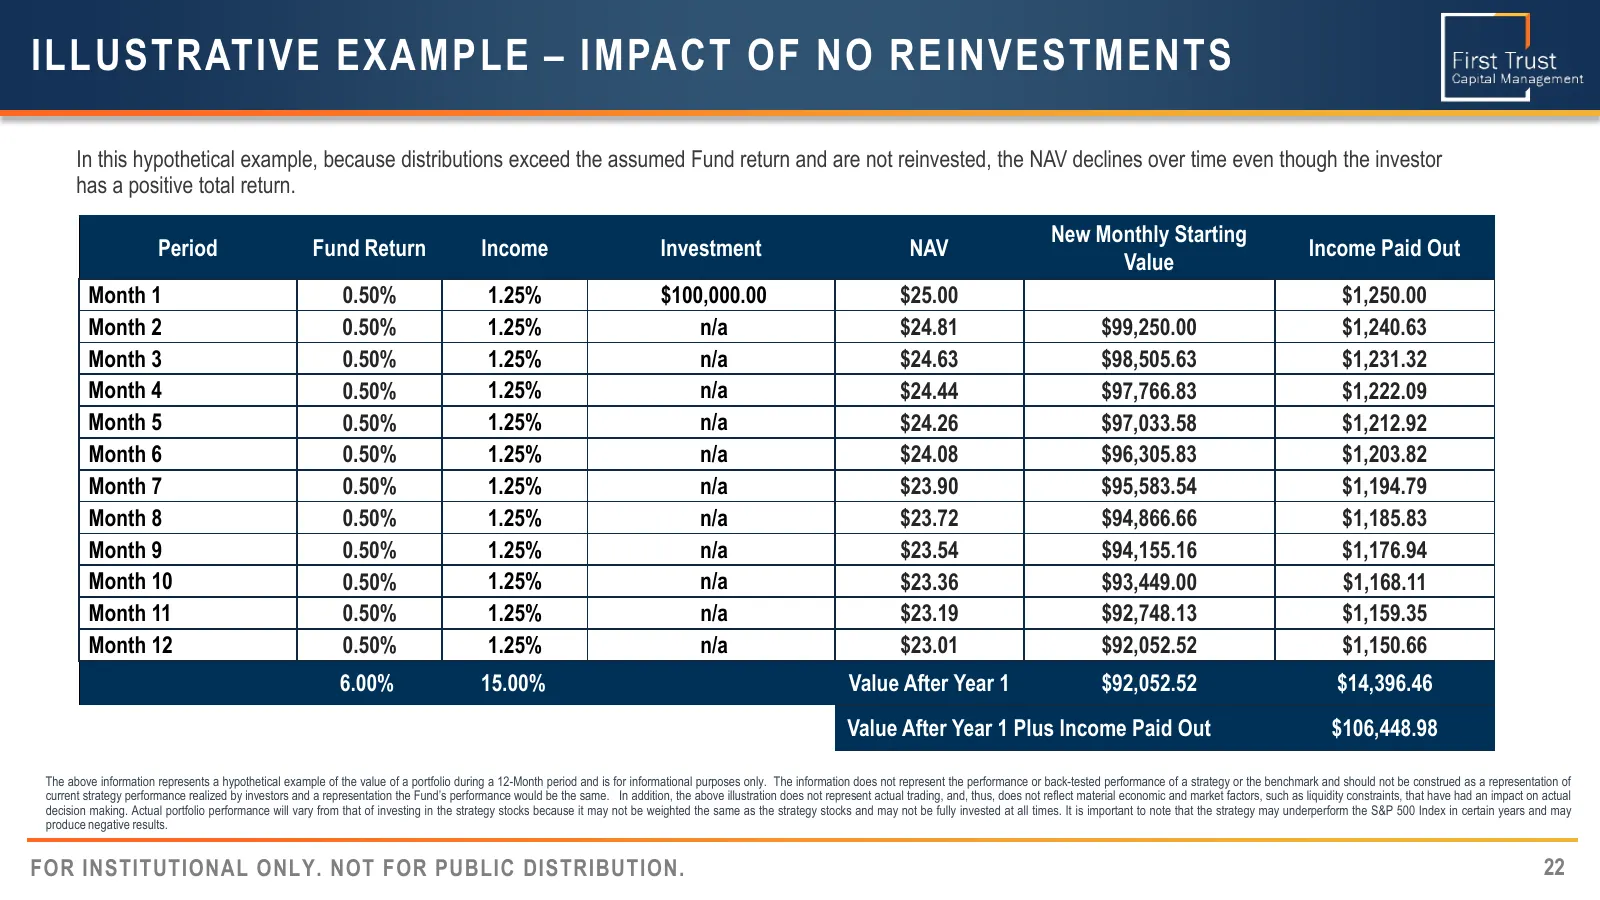
ILLUSTRATIVE EXAMPLE – IMPACT OF NO REINVESTMENTS In this hypothetical example, because distributions exceed the assumed Fund return and are not reinvested, the NAV declines over time even though the investor has a positive total return. New Monthly Starting Period Fund Return Income Investment NAV
Slide 23: Why This Approach?
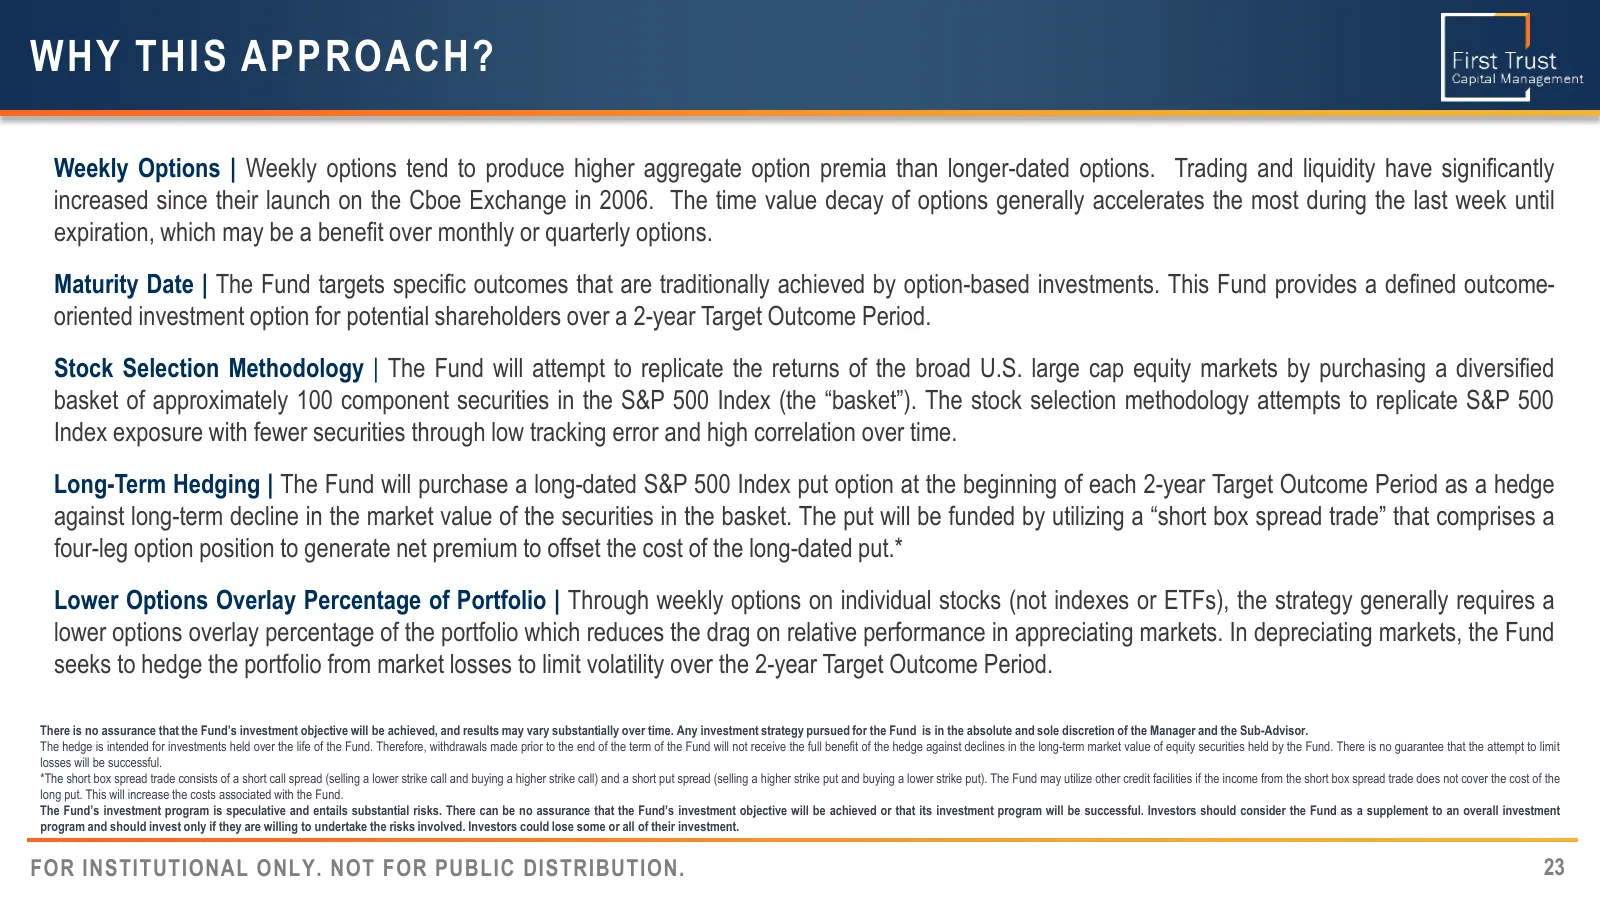
WHY THIS APPROACH? Weekly Options | Weekly options tend to produce higher aggregate option premia than longer-dated options. Trading and liquidity have significantly increased since their launch on the Cboe Exchange in 2006. The time value decay of options generally accelerates the most during the l
Slide 24: First Trust Capital Management L.P. Overview
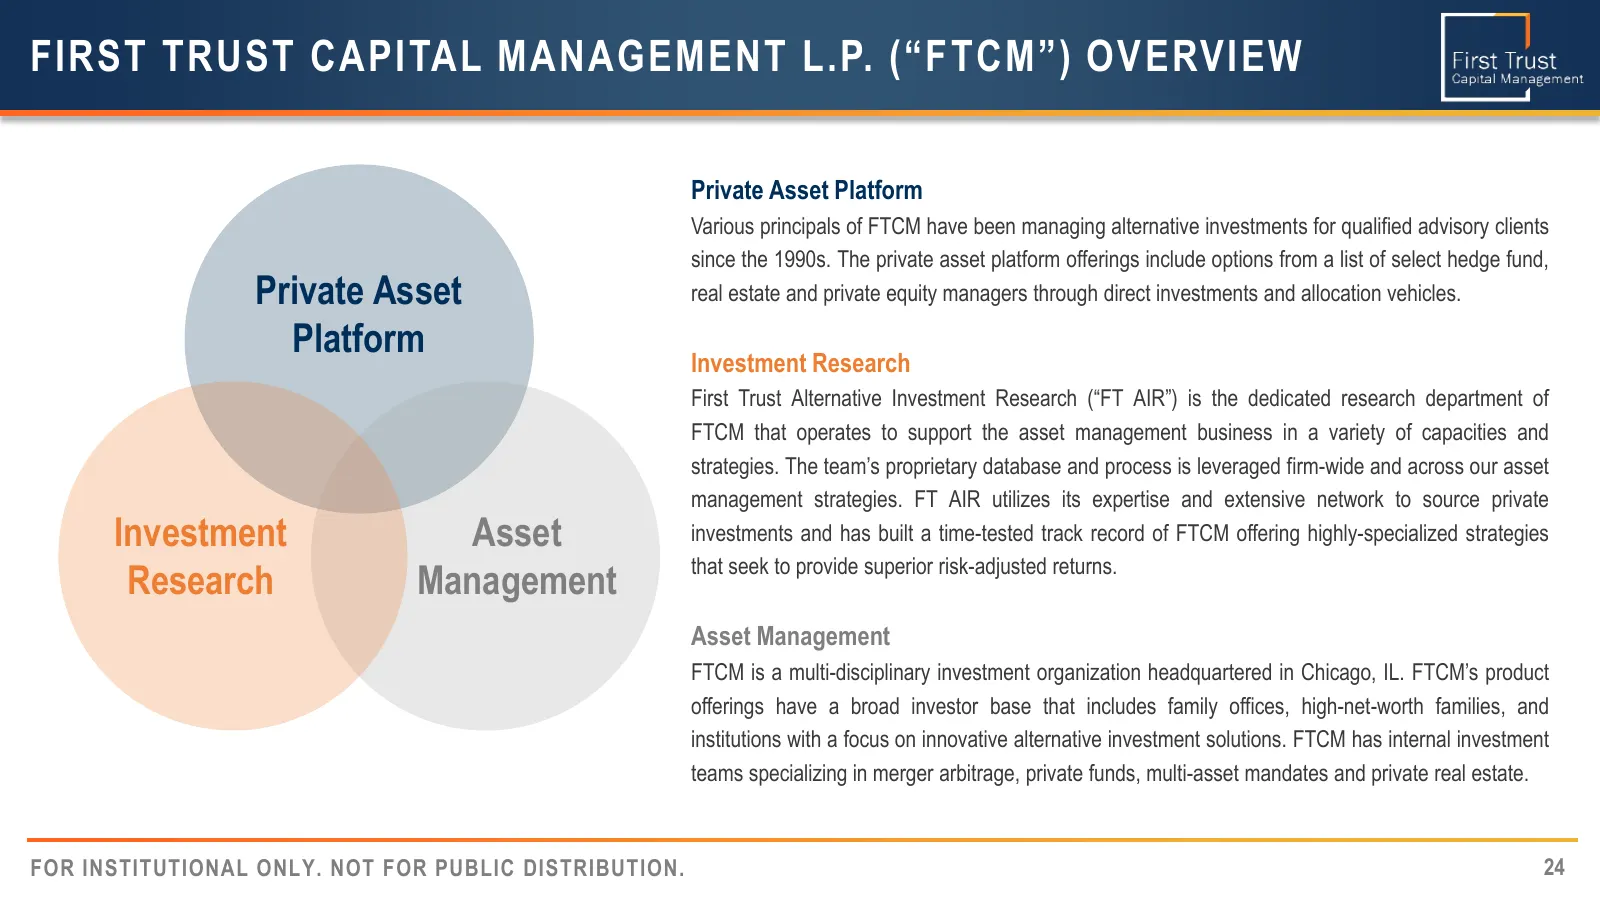
FIRST TRUST CAPITAL MANAGEMENT L.P. (“FTCM”) OVERVIEW Private Asset Platform Various principals of FTCM have been managing alternative investments for qualified advisory clients since the 1990s. The private asset platform offerings include options from a list of select hedge fund, Private Asset real
Slide 25: Sub-Advisor Profile
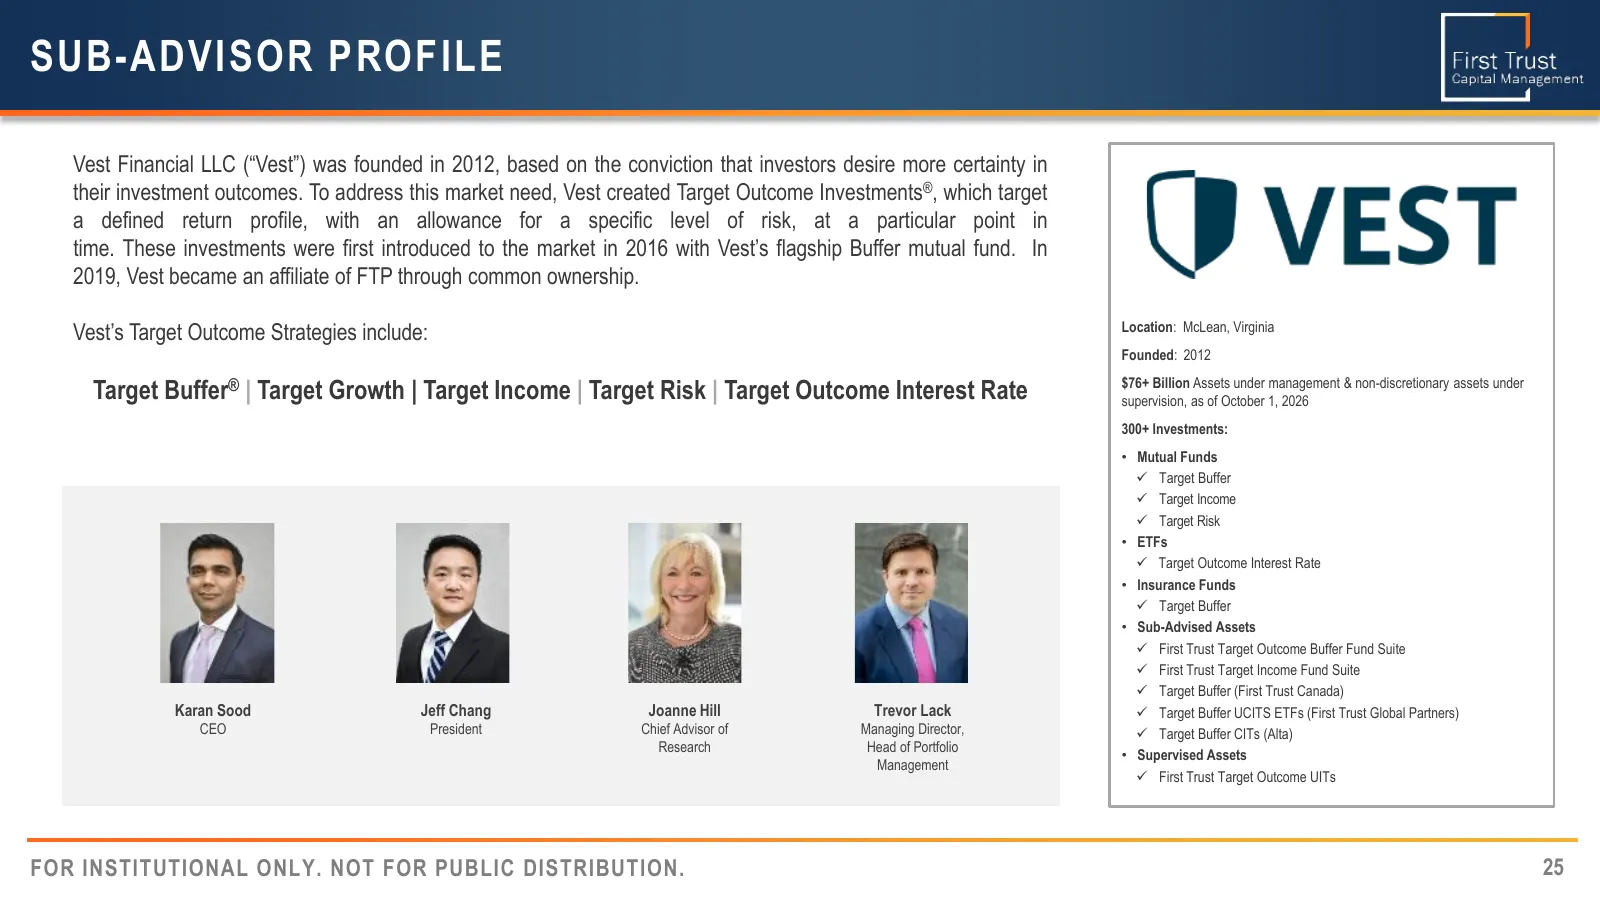
SUB-ADVISOR PROFILE Vest Financial LLC (“Vest”) was founded in 2012, based on the conviction that investors desire more certainty in their investment outcomes. To address this market need, Vest created Target Outcome Investments®, which target a defined return profile, with an allowance for a specif
Slide 26: Sub-Advisor Profile: Vest Timeline
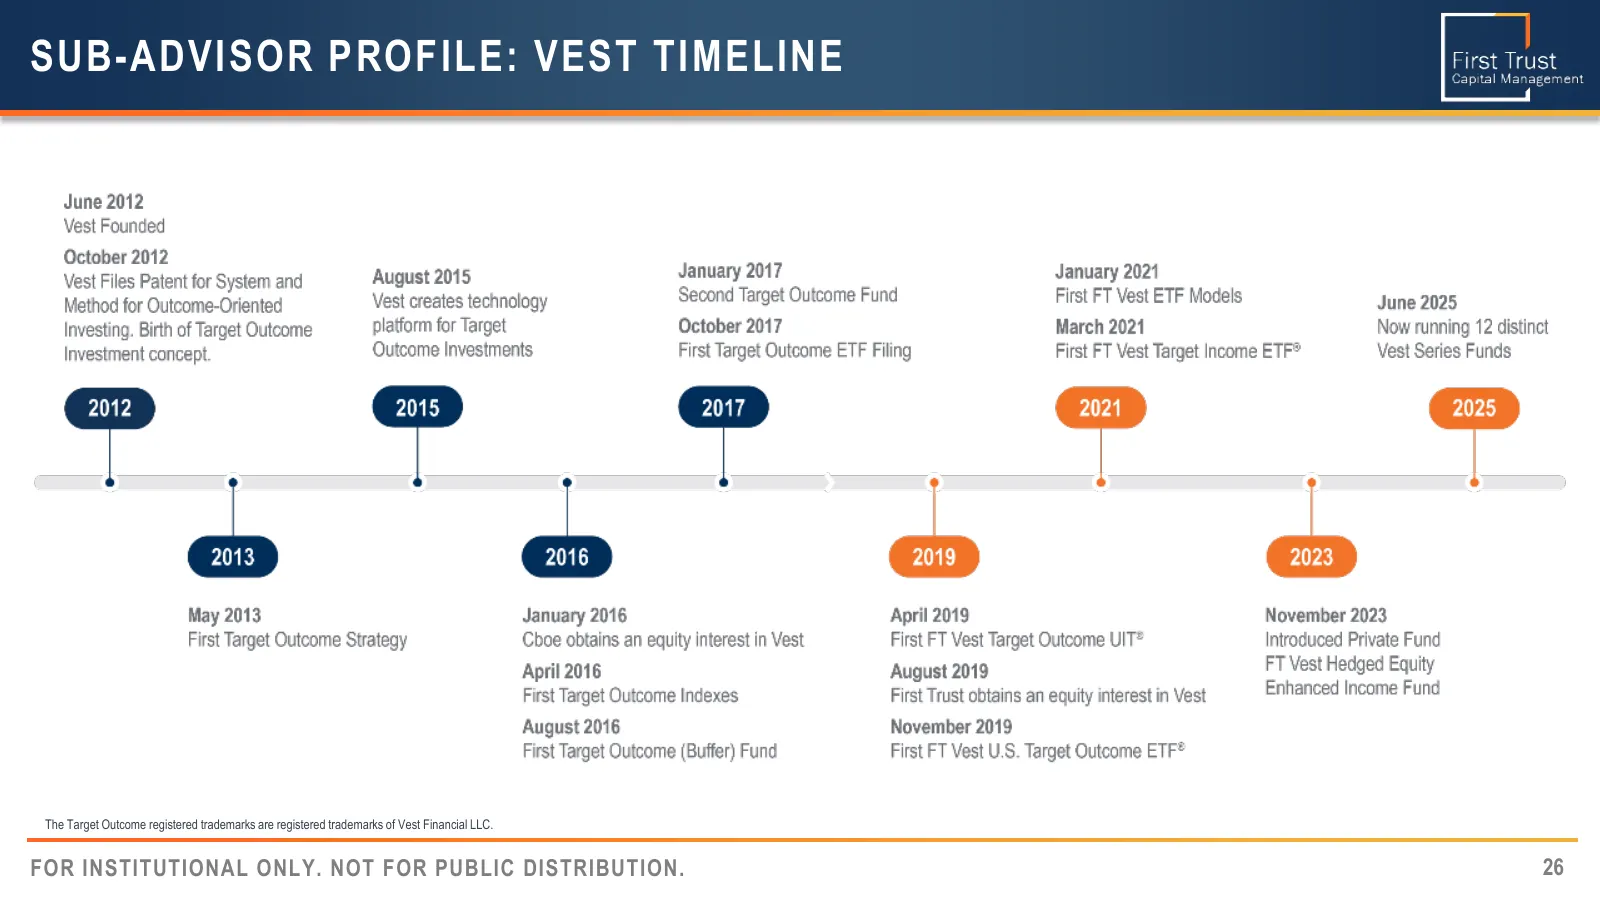
SUB-ADVISOR PROFILE: VEST TIMELINE The Target Outcome registered trademarks are registered trademarks of Vest Financial LLC. FOR INSTITUTIONAL ONLY. NOT FOR PUBLIC DISTRIBUTION. 26
Slide 27: Risk Considerations
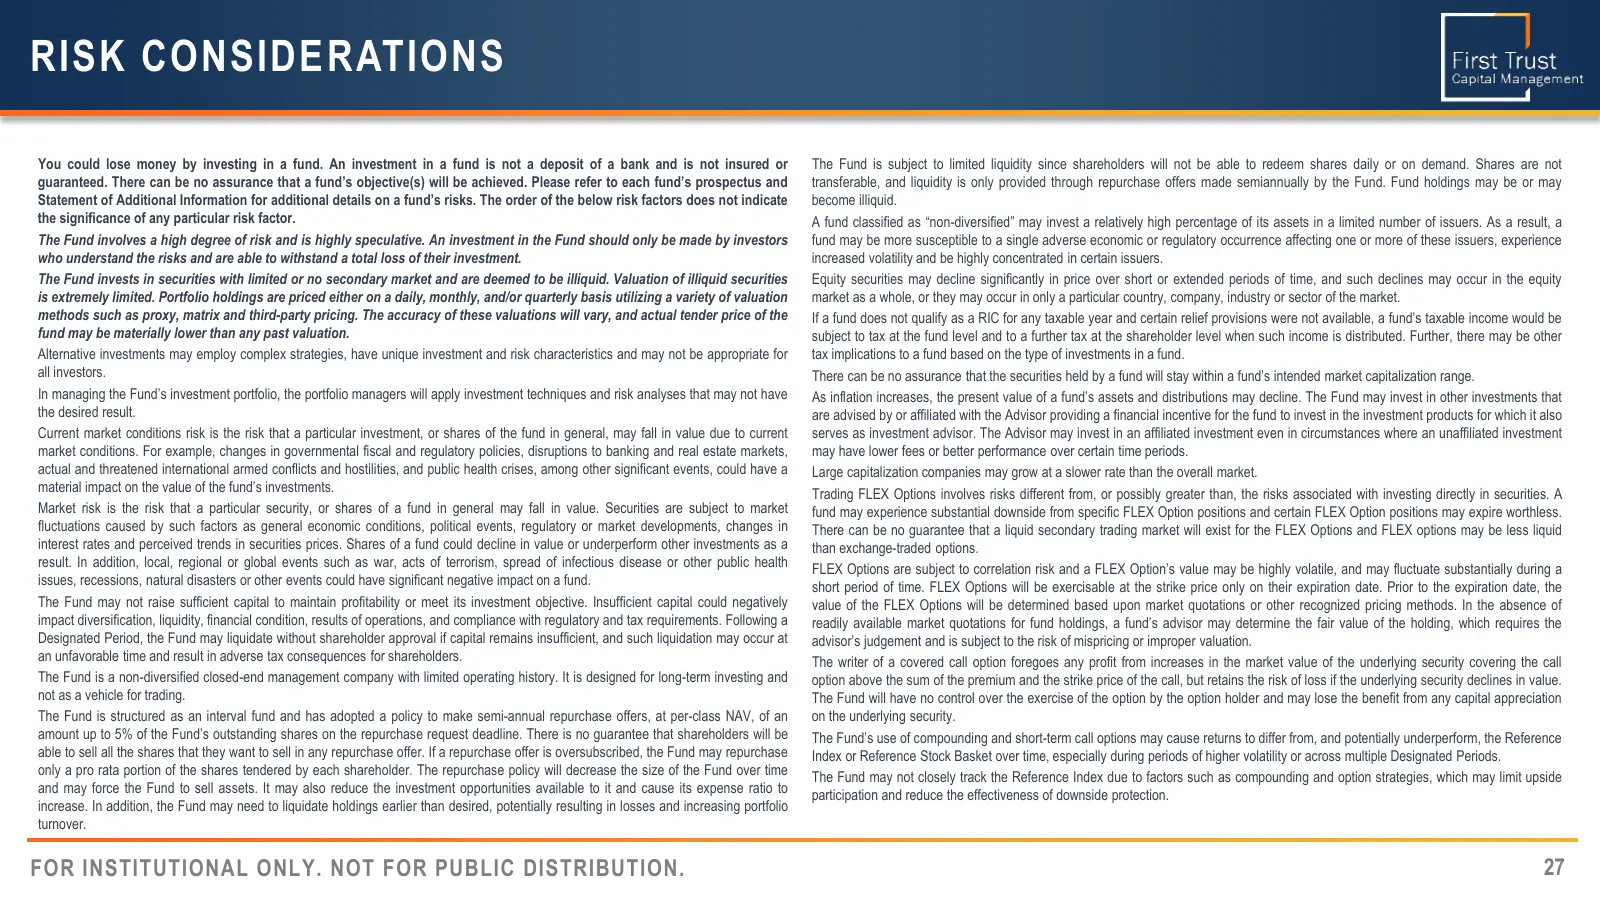
RISK CONSIDERATIONS You could lose money by investing in a fund. An investment in a fund is not a deposit of a bank and is not insured or The Fund is subject to limited liquidity since shareholders will not be able to redeem shares daily or on demand. Shares are not guaranteed. There can be no assur
Slide 28: Risk Considerations (Continued)
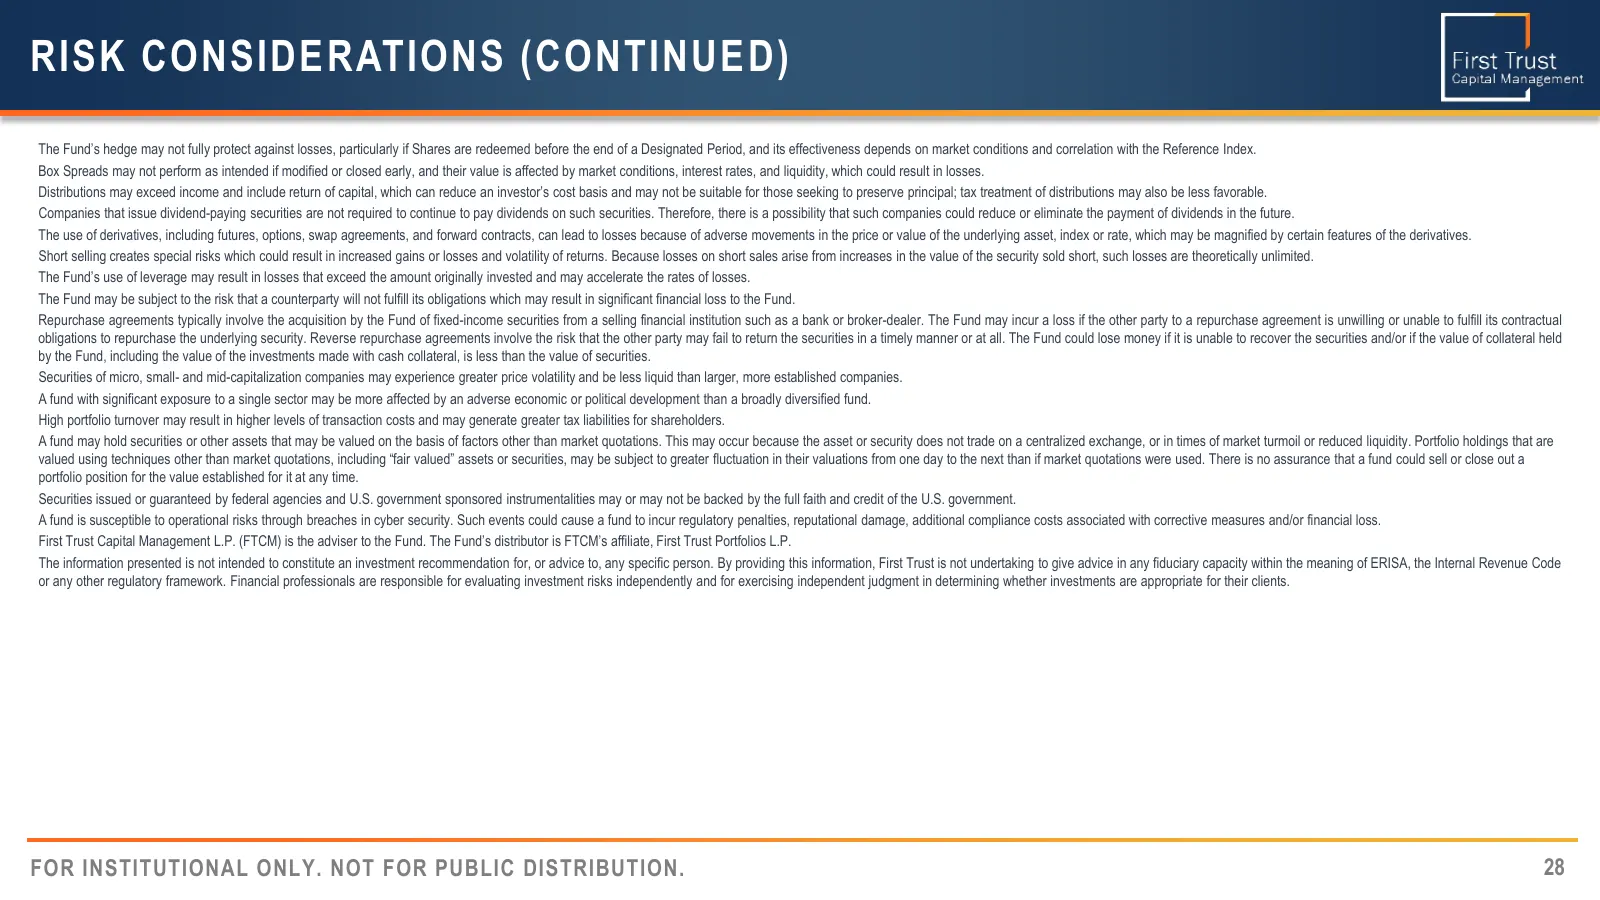
RISK CONSIDERATIONS (CONTINUED) The Fund’s hedge may not fully protect against losses, particularly if Shares are redeemed before the end of a Designated Period, and its effectiveness depends on market conditions and correlation with the Reference Index. Box Spreads may not perform as intended if mo
Slide 29: Disclaimer and contact information
This document is for informational purposes only and is neither an offer to sell, nor a solicitation of an offer to buy, an interest in any securities. You should consider a fund’s investment objectives, risks, and charges and expenses carefully before investing. Contact First Trust Capital Manageme
Source: company website
More decks from First Trust Private Credit Fund (FTPCX)
 First Trust Private Assets Fund — Investor Presentation (November 2026)21 slides · November 2026
 First Trust Enhanced Private Credit Fund — Investor Presentation (October 2026)32 slides · October 2026
 First Trust Multi-Strategy Fund — Investor Presentation (October 2026)23 slides · October 2026
 First Trust Multi-Strategy Fund (FTMIX) — Investor Presentation (October 2026)21 slides · October 2026
 First Trust Private Credit Fund — Investor Presentation (October 2026)26 slides · October 2026
 First Trust Merger Arbitrage Fund — Investor Presentation (October 2026)29 slides · October 2026