Mr. Cooper — KBW Virtual Real Estate Finance & Technology Conference 2020
29 slides from Mr. Cooper's conference presentation, May 28, 2020

Slide 1: KBW Virtual Real Estate Finance & Technology Conference Investor Presentation 1Q 2020
KBW Virtual Real Estate Finance & Technology Conference Investor Presentation 1Q 2020 May 28, 2020
Slide 2: Forward Looking Statements
This presentation contains summarized information concerning Mr. Cooper Group Inc. (the “Company”) and the Company’s business, operations, financial performance and trends. No representation is made that the information in this presentation is complete. For additional financial, statistical and busi
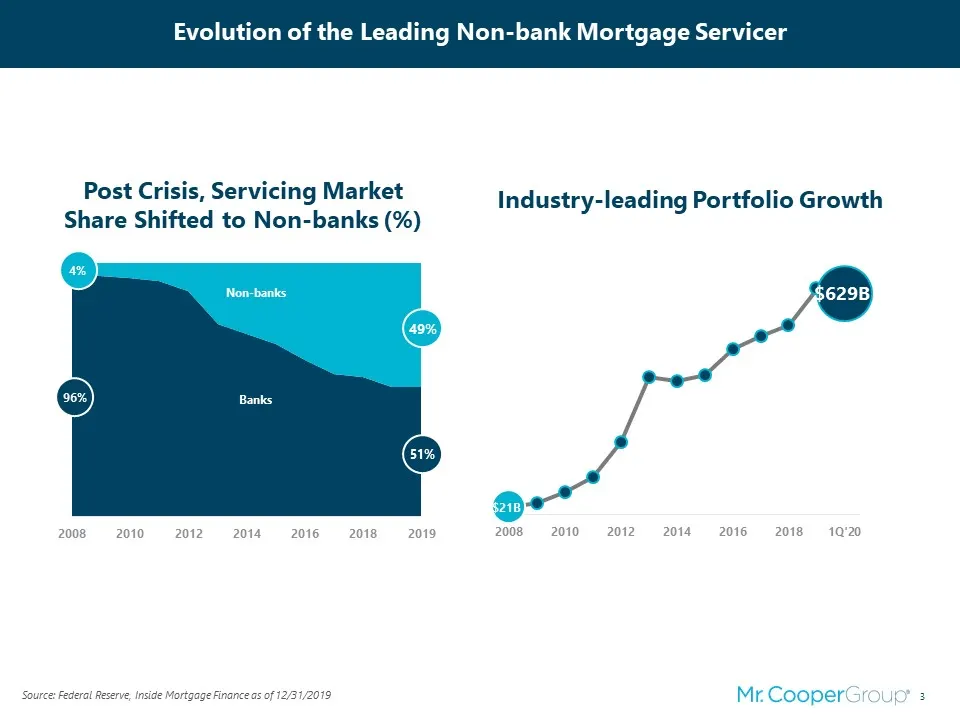
Slide 3: Evolution of the Leading Non-bank Mortgage Servicer
Post Crisis, Servicing Market Share Shifted to Non-banks (%) Industry-leading Portfolio Growth Source: Federal Reserve, Inside Mortgage Finance as of 12/31/2019 Evolution of the Leading Non-bank Mortgage Servicer
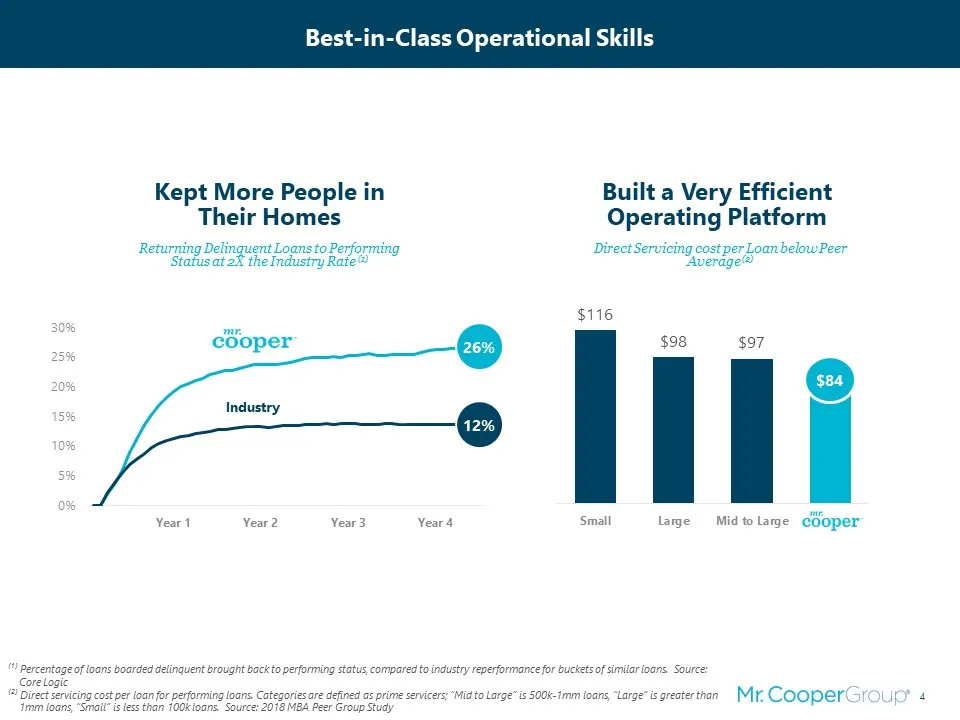
Slide 4: Best-in-Class Operational Skills
⁽¹⁾ Percentage of loans boarded delinquent brought back to performing status, compared to industry reperformance for buckets of similar loans. Source: Core Logic ⁽²⁾ Direct servicing cost per loan for performing loans. Categories are defined as prime servicers; “Mid to Large” is 500k-1mm loans, “Lar
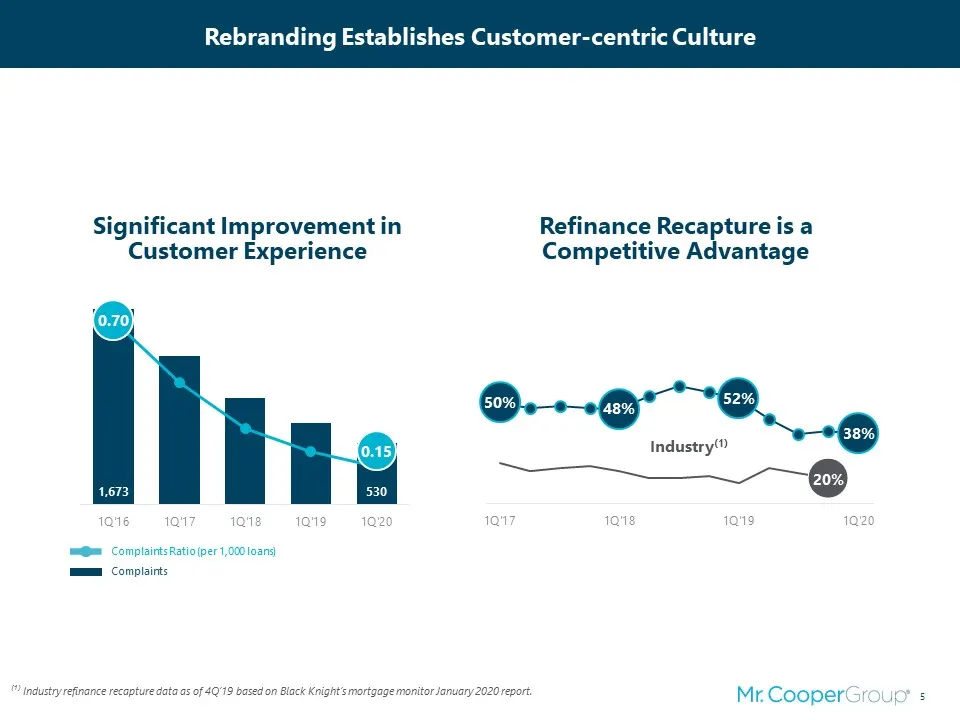
Slide 5: Significant Improvement in Customer Experience
Industry(1) Significant Improvement in Customer Experience Refinance Recapture is a Competitive Advantage Rebranding Establishes Customer-centric Culture Complaints Ratio (per 1,000 loans) Complaints ⁽¹⁾ Industry refinance recapture data as of 4Q’19 based on Black Knight’s mortgage monitor January 2
Slide 6: First Quarter Highlights
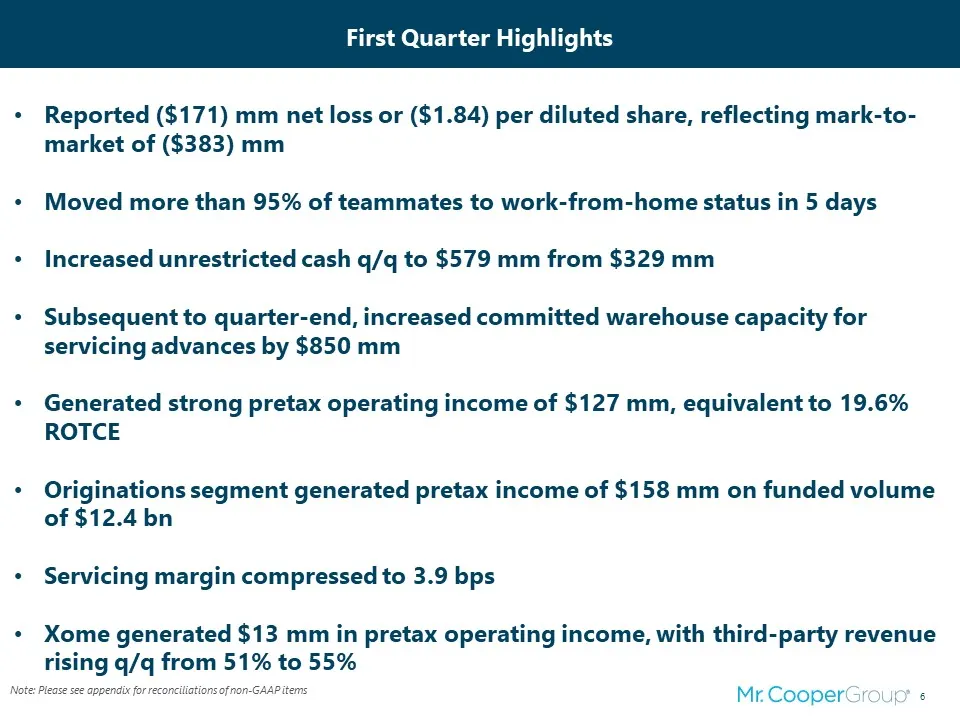
Note: Please see appendix for reconciliations of non-GAAP items First Quarter Highlights Reported ($171) mm net loss or ($1.84) per diluted share, reflecting mark-to-market of ($383) mmMoved more than 95% of teammates to work-from-home status in 5 daysIncreased unrestricted cash q/q to $579 mm from
Slide 7: Forbearance Update
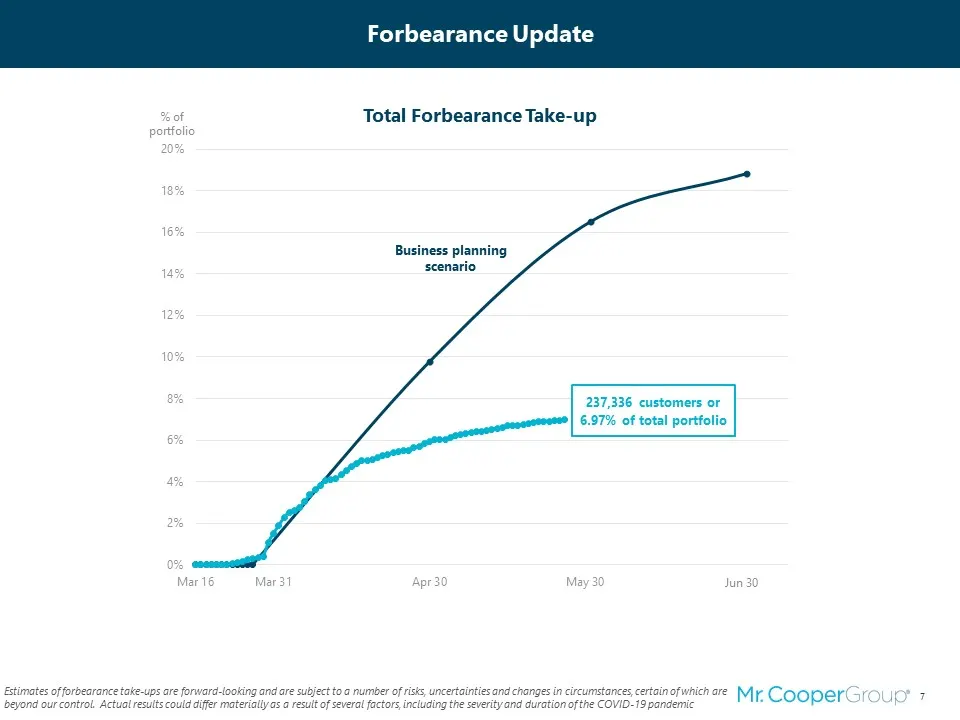
Total Forbearance Take-up Business planning scenario % of portfolio Forbearance Update Estimates of forbearance take-ups are forward-looking and are subject to a number of risks, uncertainties and changes in circumstances, certain of which are beyond our control. Actual results could differ material
Slide 8: Strategic Priorities during the COVID-19 Pandemic
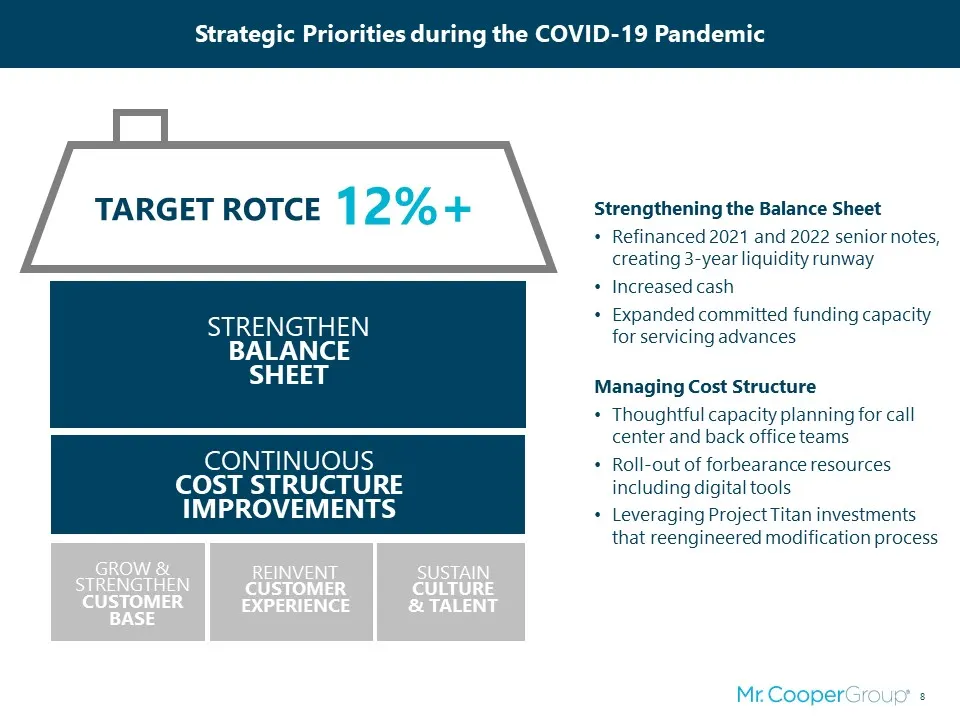
Strategic Priorities during the COVID-19 Pandemic TARGET ROTCE 12%+ STRENGTHENBALANCESHEET CONTINUOUSCOST STRUCTUREIMPROVEMENTS GROW & STRENGTHENCUSTOMERBASE REINVENTCUSTOMEREXPERIENCE SUSTAINCULTURE& TALENT Strengthening the Balance SheetRefinanced 2021 and 2022 senior notes, creating 3-year liquid
Slide 9: Summary 1Q'20 Financial Results
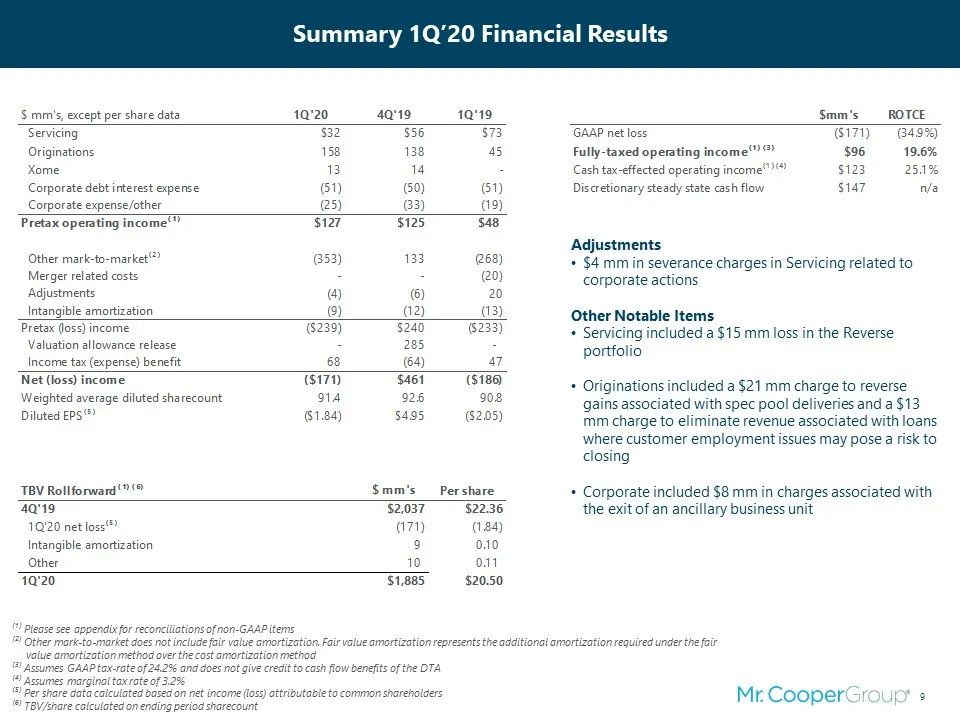
Summary 1Q’20 Financial Results ⁽¹⁾ Please see appendix for reconciliations of non-GAAP items⁽²⁾ Other mark-to-market does not include fair value amortization. Fair value amortization represents the additional amortization required under the fair value amortization method over the cost amortization
Slide 10: MSR Value Pressured by Lower Rates
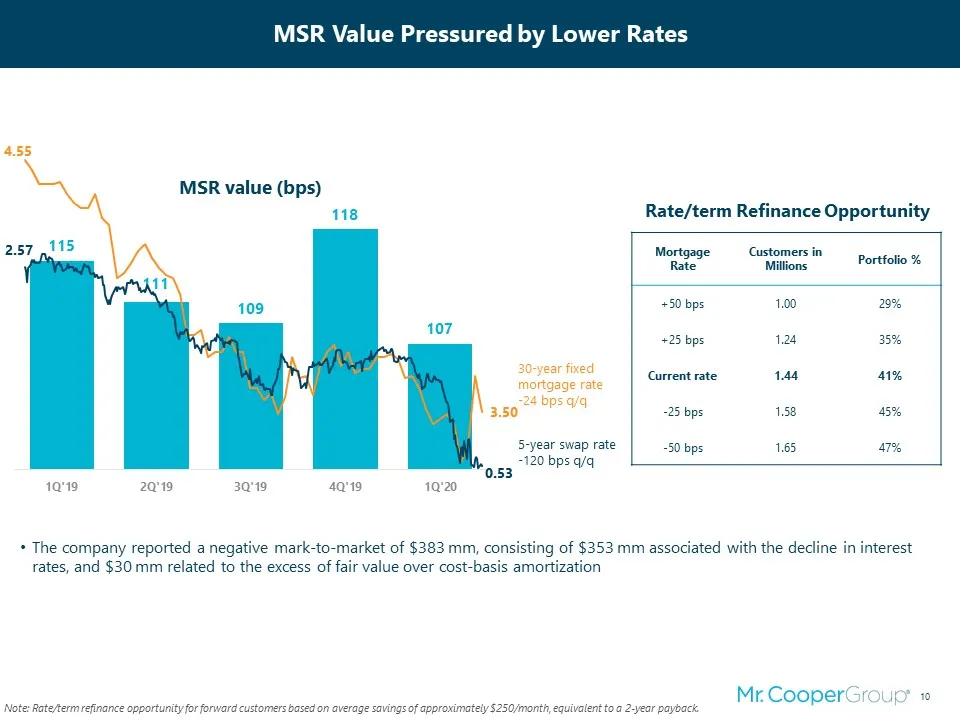
MSR Value Pressured by Lower Rates The company reported a negative mark-to-market of $383 mm, consisting of $353 mm associated with the decline in interest rates, and $30 mm related to the excess of fair value over cost-basis amortization Mortgage Rate Customers in Millions Portfolio % +50 bps 1.00
Slide 11: Originations Profits Remain Strong
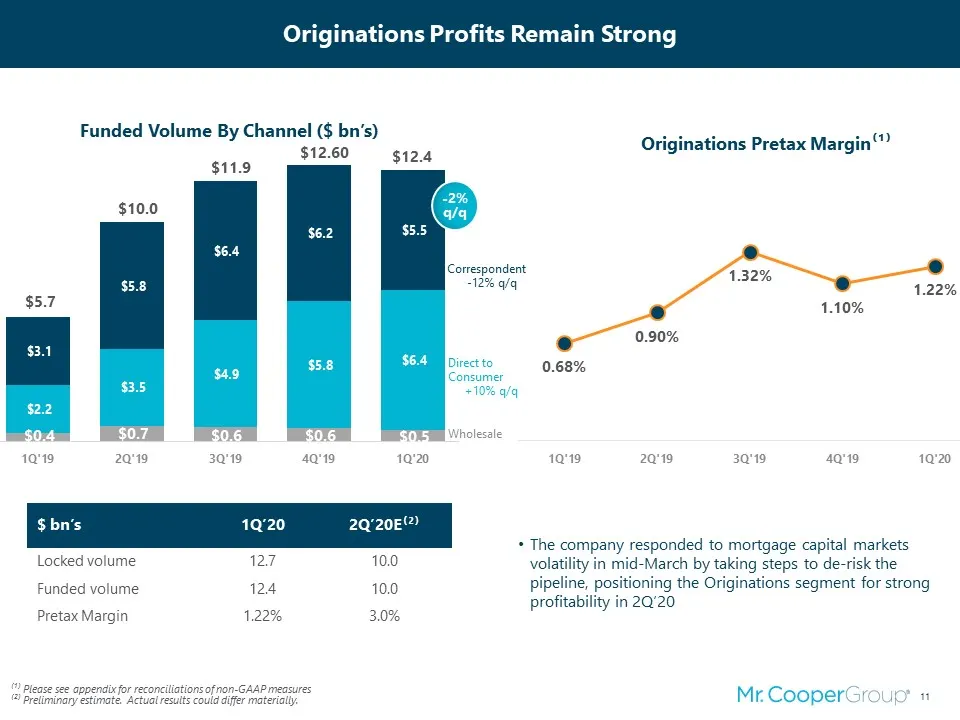
The company responded to mortgage capital markets volatility in mid-March by taking steps to de-risk the pipeline, positioning the Originations segment for strong profitability in 2Q’20 ⁽¹⁾ Please see appendix for reconciliations of non-GAAP measures⁽²⁾ Preliminary estimate. Actual results could dif
Slide 12: Servicing Portfolio Remained Roughly Stable
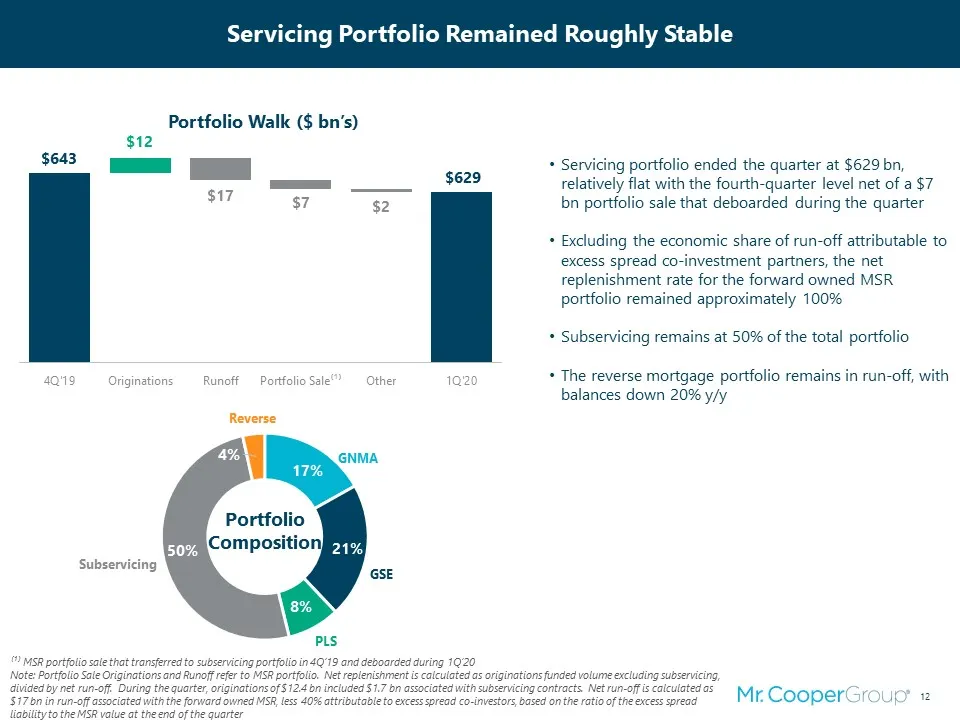
Servicing Portfolio Remained Roughly Stable Servicing portfolio ended the quarter at $629 bn, relatively flat with the fourth-quarter level net of a $7 bn portfolio sale that deboarded during the quarter Excluding the economic share of run-off attributable to excess spread co-investment partners, th
Slide 13: Servicing Margin Impacted by Amortization and Reverse
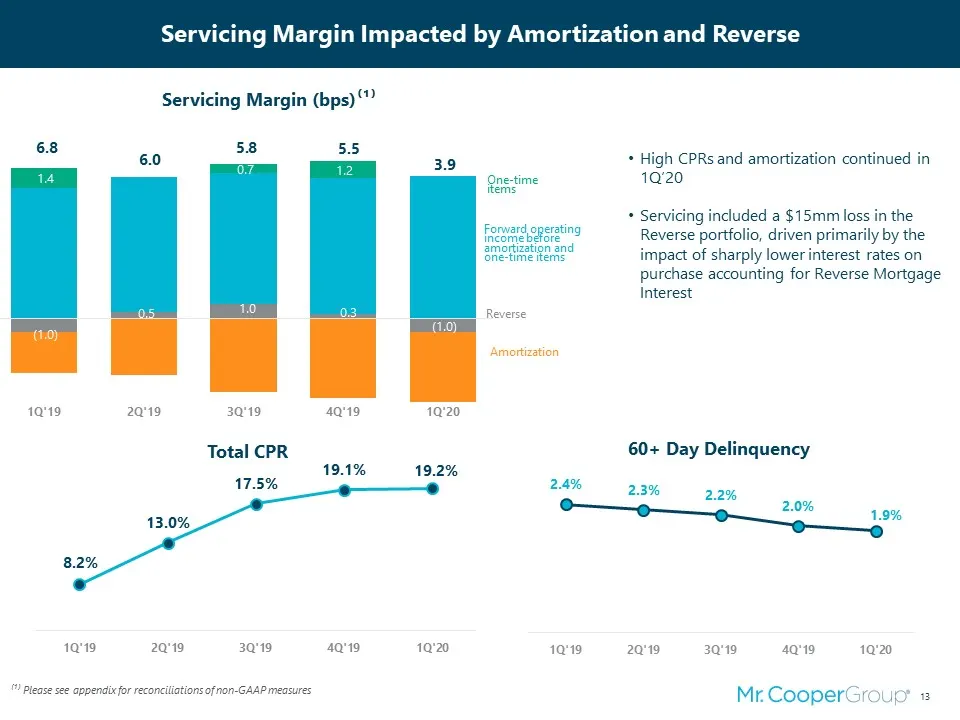
Forward operating income before amortization and one-time items Servicing Margin (bps)⁽¹⁾ Servicing Margin Impacted by Amortization and Reverse High CPRs and amortization continued in 1Q’20Servicing included a $15mm loss in the Reverse portfolio, driven primarily by the impact of sharply lower inter
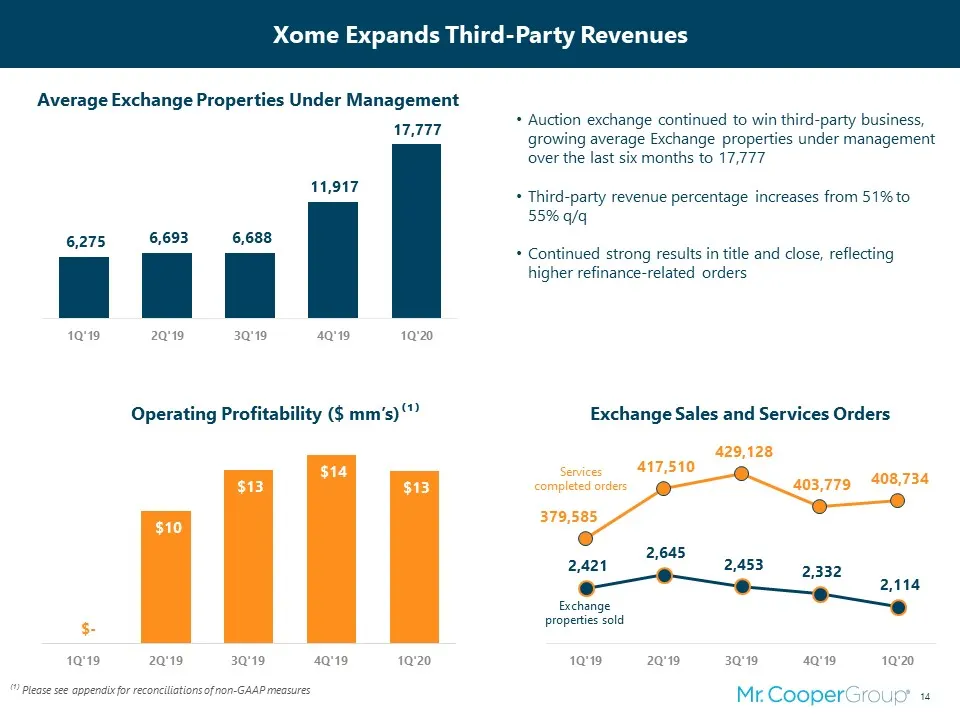
Slide 14: Xome Expands Third-Party Revenues
Auction exchange continued to win third-party business, growing average Exchange properties under management over the last six months to 17,777Third-party revenue percentage increases from 51% to 55% q/qContinued strong results in title and close, reflecting higher refinance-related orders ⁽¹⁾ Pleas
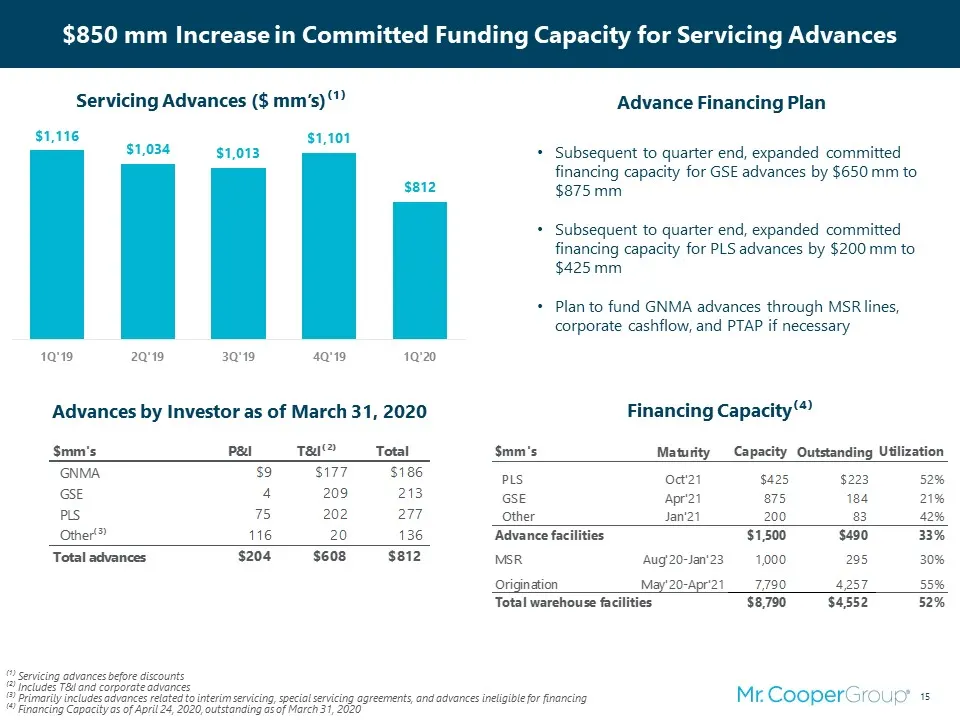
Slide 15: $850 mm Increase in Committed Funding Capacity for Servicing Advances
$850 mm Increase in Committed Funding Capacity for Servicing Advances Subsequent to quarter end, expanded committed financing capacity for GSE advances by $650 mm to $875 mm Subsequent to quarter end, expanded committed financing capacity for PLS advances by $200 mm to $425 mmPlan to fund GNMA advan
Slide 16: Appendix
vd Mr Cooper: Appendix
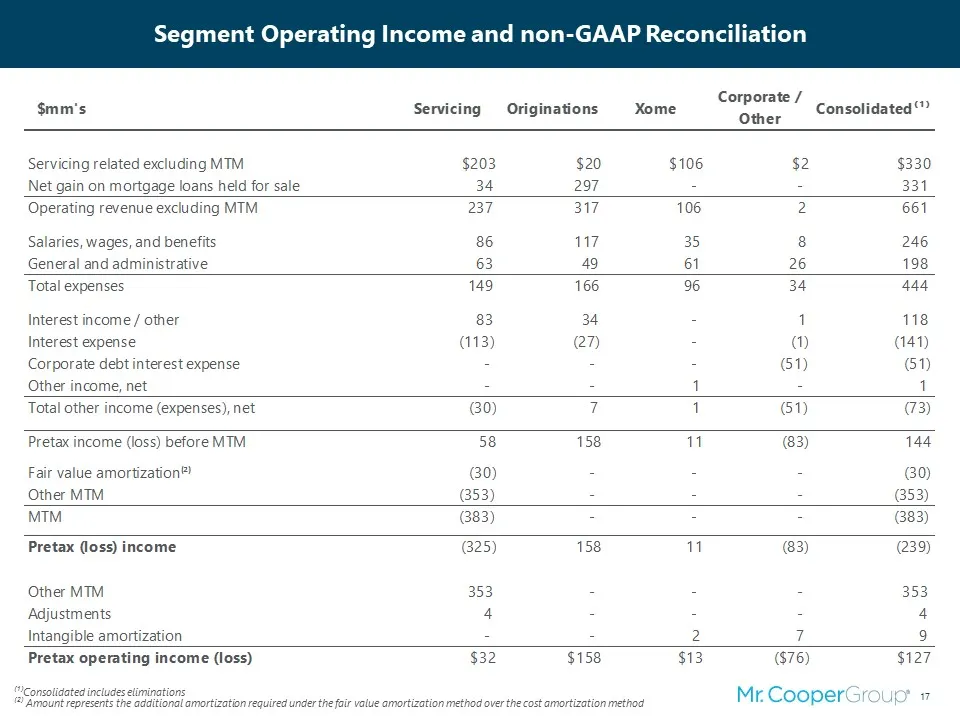
Slide 17: Segment Operating Income and non-GAAP Reconciliation
Segment Operating Income and non-GAAP Reconciliation ⁽¹⁾Consolidated includes eliminations⁽²⁾ Amount represents the additional amortization required under the fair value amortization method over the cost amortization method
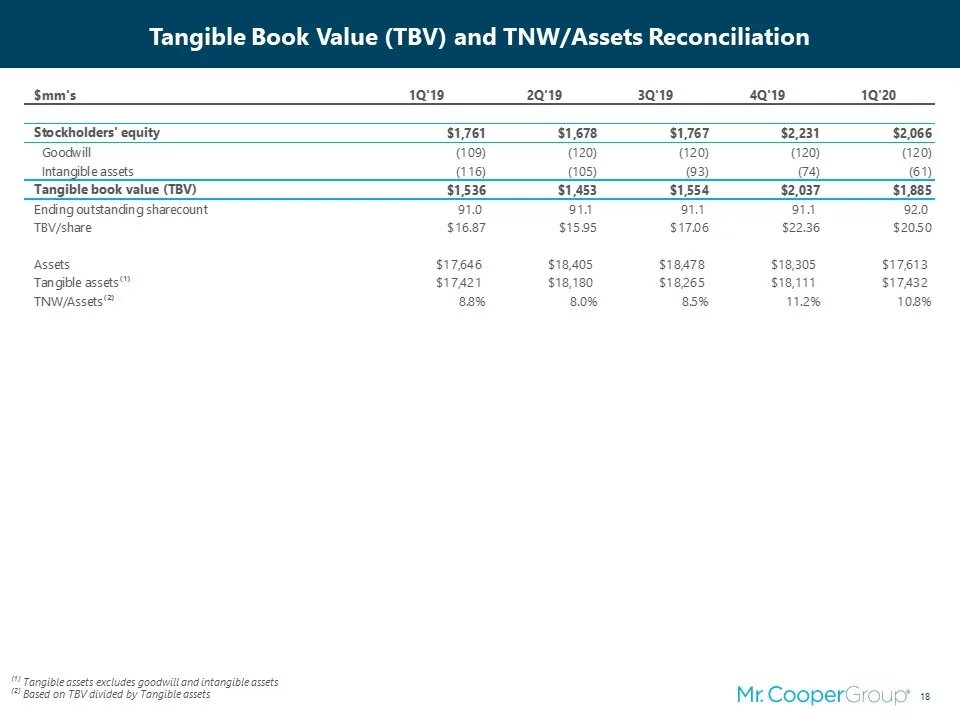
Slide 18: Tangible Book Value (TBV) and TNW/Assets Reconciliation
Tangible Book Value (TBV) and TNW/Assets Reconciliation ⁽¹⁾ Tangible assets excludes goodwill and intangible assets ⁽²⁾ Based on TBV divided by Tangible assets
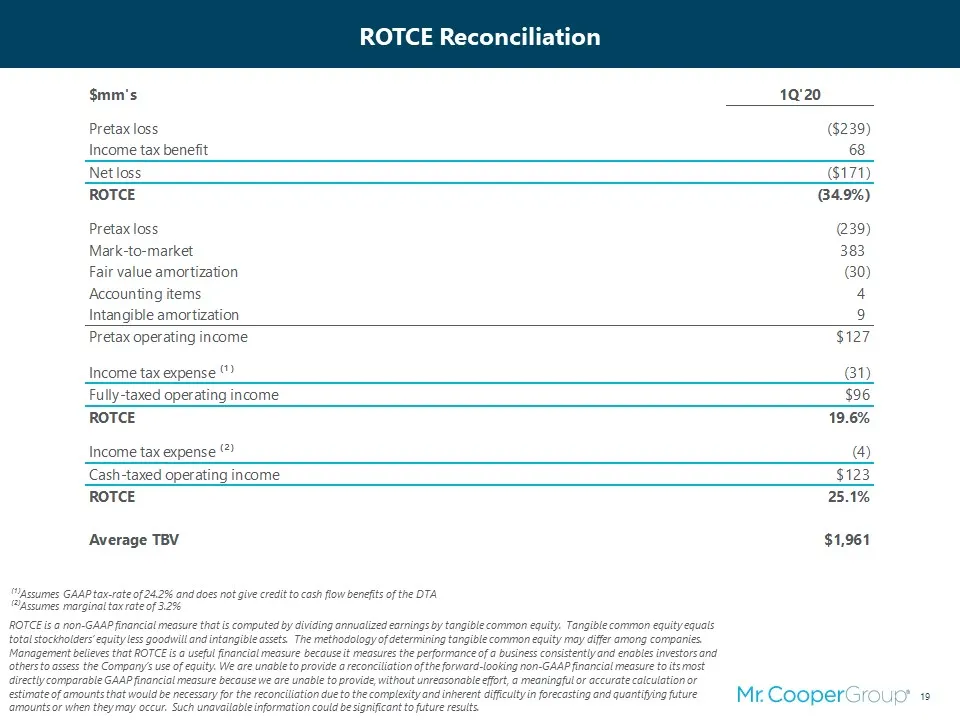
Slide 19: ROTCE Reconciliation
ROTCE Reconciliation ⁽¹⁾Assumes GAAP tax-rate of 24.2% and does not give credit to cash flow benefits of the DTA⁽²⁾Assumes marginal tax rate of 3.2% ROTCE is a non-GAAP financial measure that is computed by dividing annualized earnings by tangible common equity. Tangible common equity equals total s
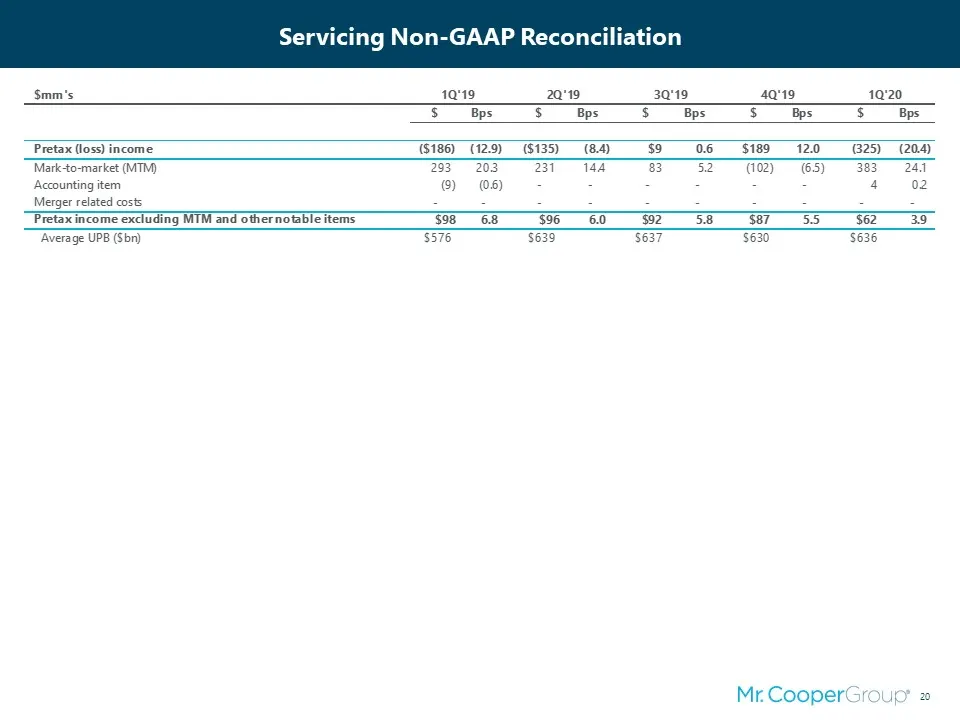
Slide 20: Servicing Non-GAAP Reconciliation
Servicing Non-GAAP Reconciliation
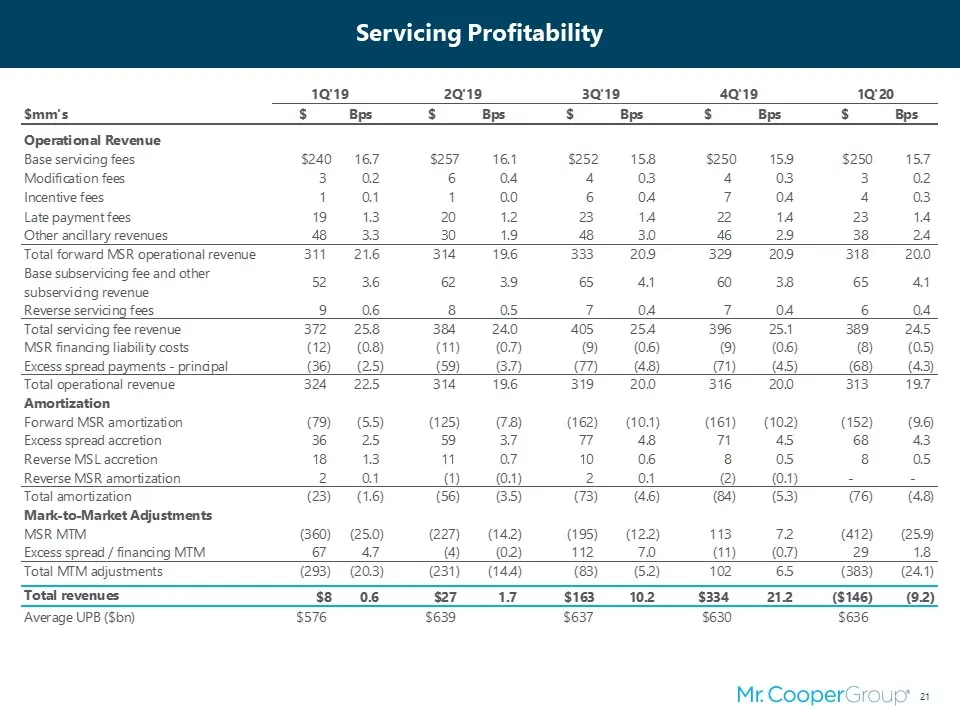
Slide 21: Servicing Profitability
Servicing Profitability Smm's $ Bps $ Bps A Bps $ Bps $ Bps Operational Revenue Base servicing fees $240 167 $257 161 $252 158 $250 159 $250 157 Modification fees 3 02 6 04 4 03 4 03 3 02 Incentive fees 1 4 1 00 6 04 7 04 4 03 Late payment fees 1913 20 12 23 14 2 14 23 14 Other ancillary revenues 43
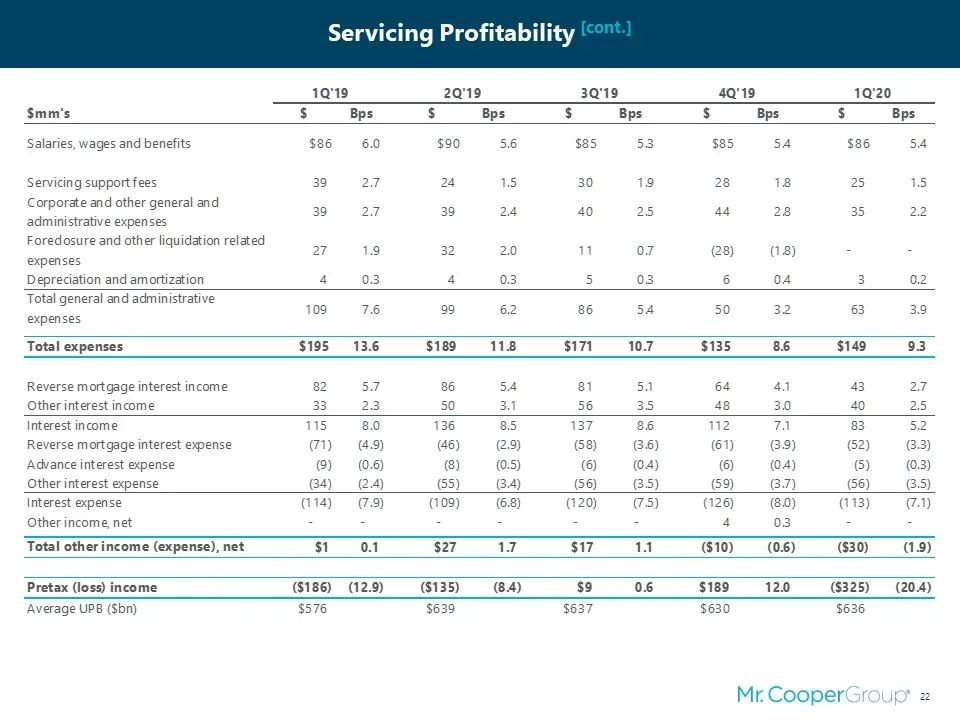
Slide 22: Servicing Profitability [cont.]
Servicing Profitability [cont.]
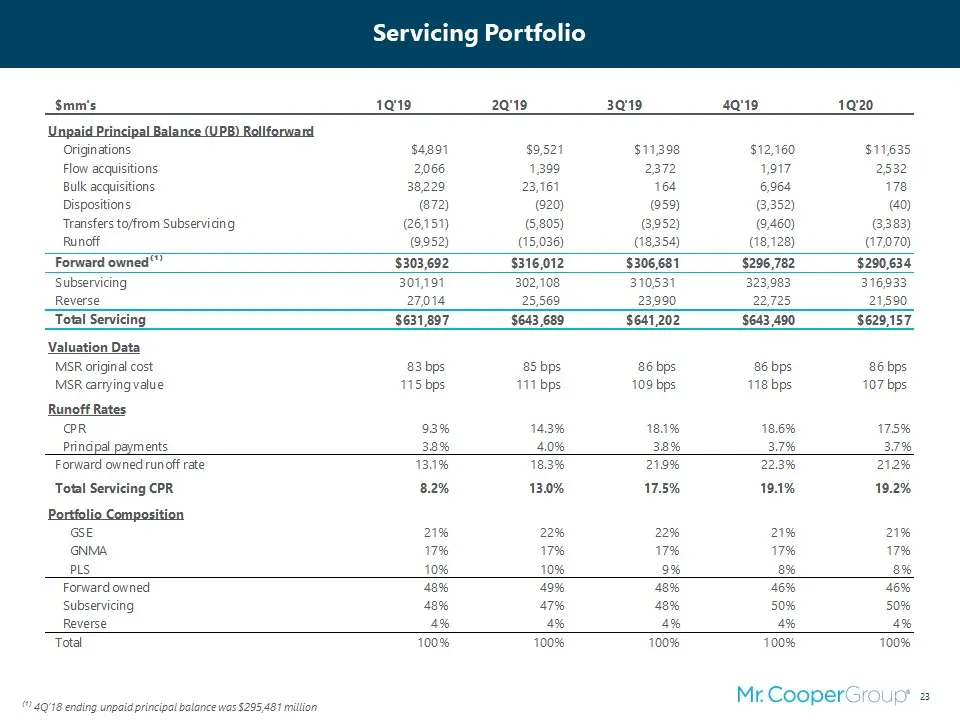
Slide 23: Servicing Portfolio
Servicing Portfolio ⁽¹⁾ 4Q’18 ending unpaid principal balance was $295,481 million
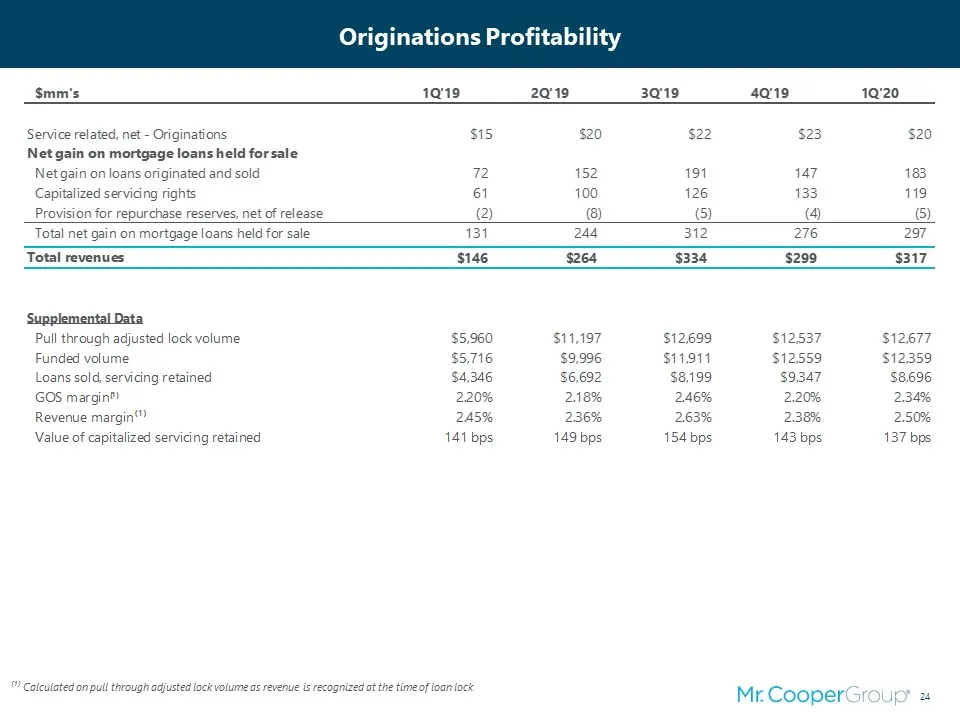
Slide 24: Originations Profitability
Originations Profitability ⁽¹⁾ Calculated on pull through adjusted lock volume as revenue is recognized at the time of loan lock
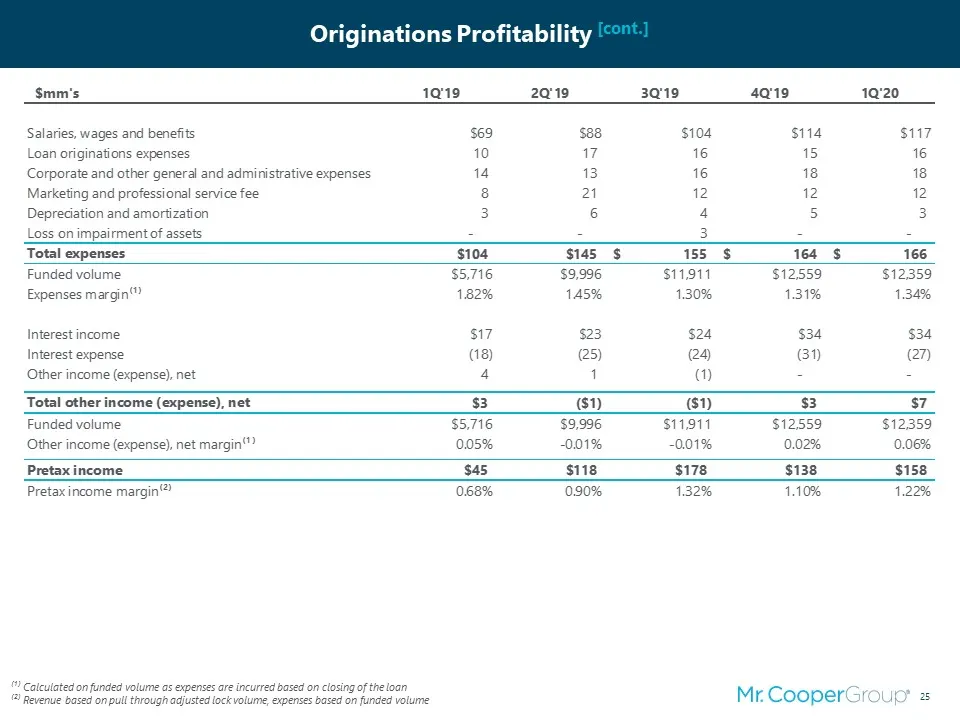
Slide 25: Originations Profitability [cont.]
Originations Profitability [cont.] ⁽¹⁾ Calculated on funded volume as expenses are incurred based on closing of the loan⁽²⁾ Revenue based on pull through adjusted lock volume, expenses based on funded volume
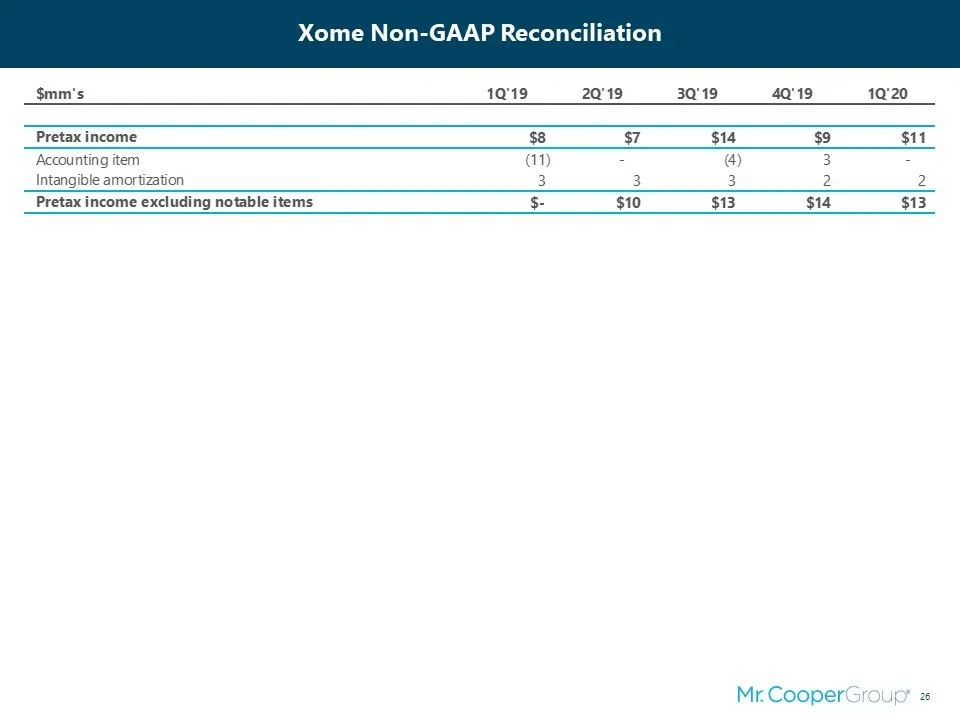
Slide 26: Xome Non-GAAP Reconciliation
Xome Non-GAAP Reconciliation $
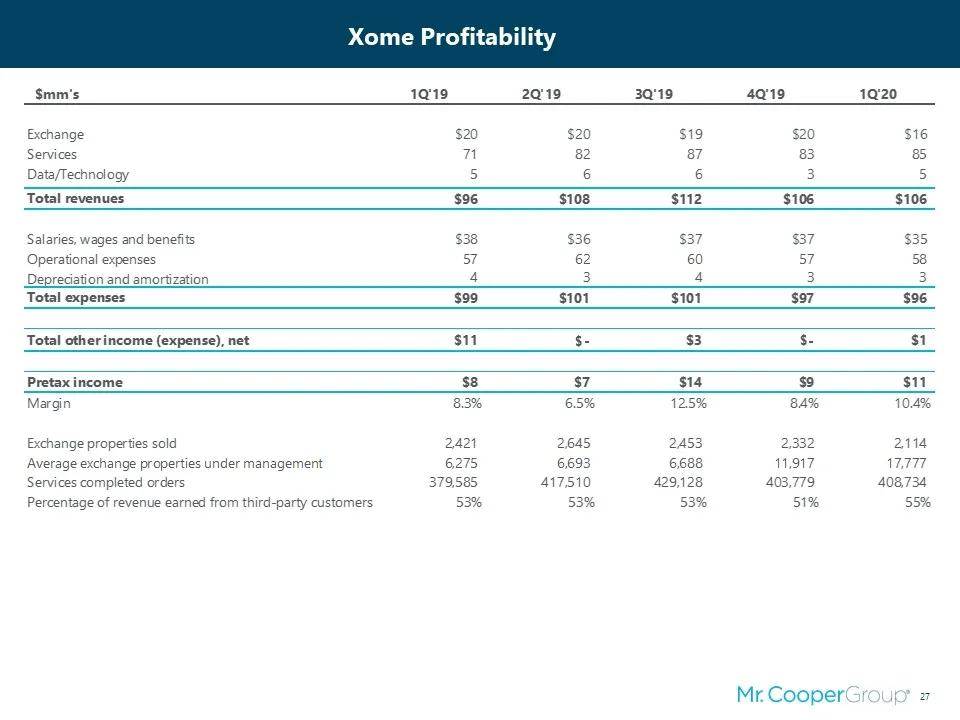
Slide 27: Xome Profitability
Xome Profitability Smm’'s 1919 2019 3Q'19 4a19 1920 Exchange $20 $20 $19 $20 S16 Services a 82 87 83 8 Data/Technology 5 6 6 3 5 Total revenues $96 $108 su2 $106 $106 Salaries, wages and benefits $38 $36 $37 $37 $35 Operational expenses 7 62 60 57 58 Depreciation and amortization 4 3 4 3 3 Total exp
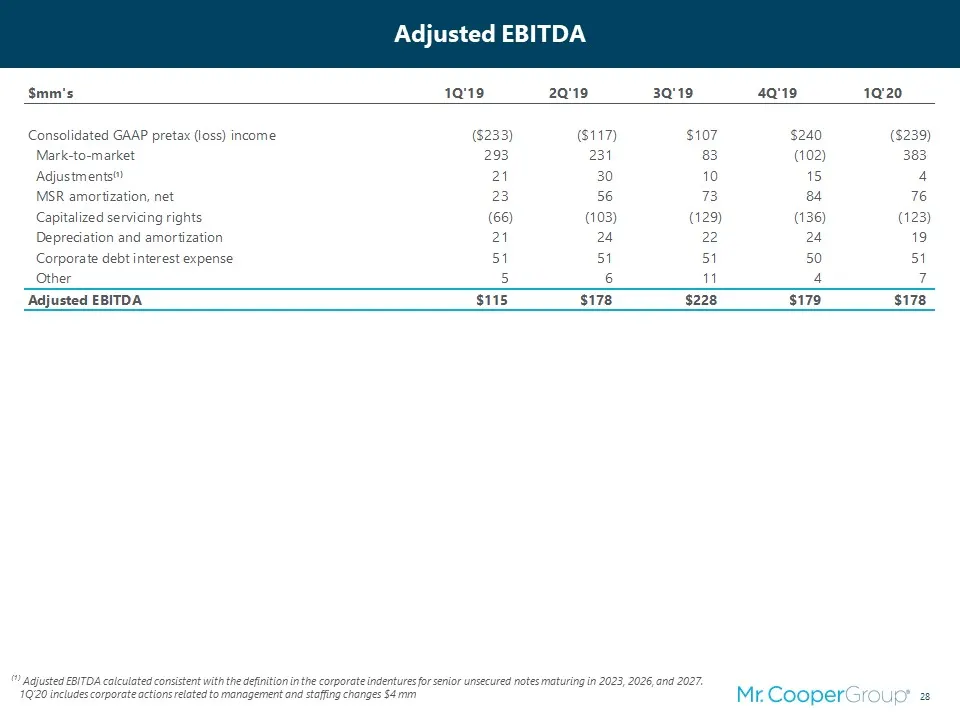
Slide 28: Adjusted EBITDA
Adjusted EBITDA ⁽¹⁾ Adjusted EBITDA calculated consistent with the definition in the corporate indentures for senior unsecured notes maturing in 2023, 2026, and 2027. 1Q’20 includes corporate actions related to management and staffing changes $4 mm
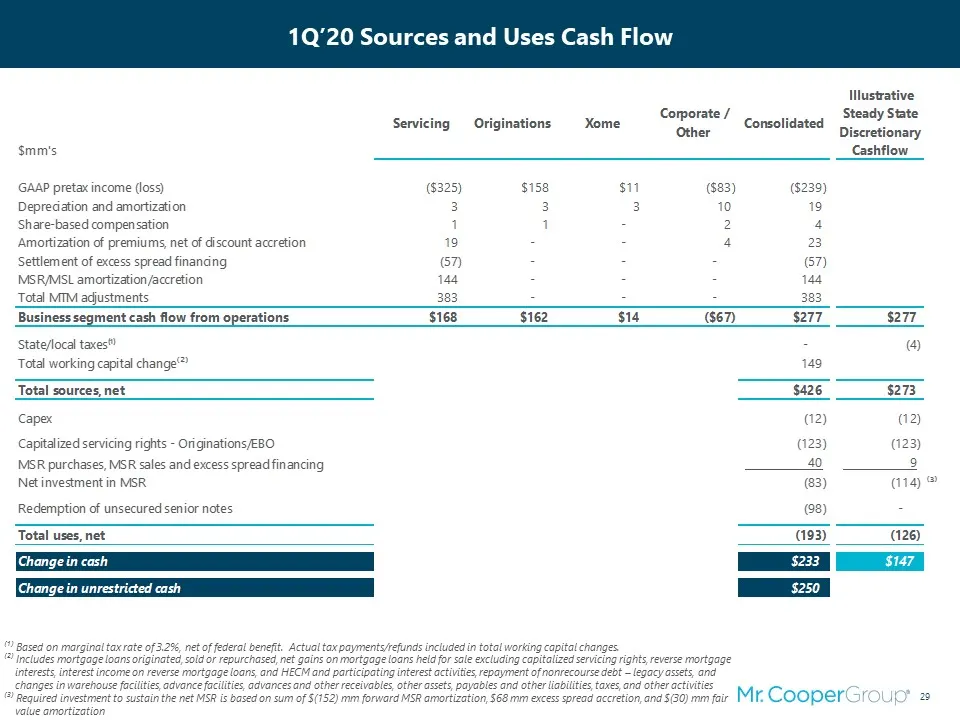
Slide 29: 1Q'20 Sources and Uses Cash Flow
1Q’20 Sources and Uses Cash Flow ⁽¹⁾ Based on marginal tax rate of 3.2%, net of federal benefit. Actual tax payments/refunds included in total working capital changes.⁽²⁾ Includes mortgage loans originated, sold or repurchased, net gains on mortgage loans held for sale excluding capitalized servicin
Source: SEC EDGAR · 8-K filed May 28, 2020
More decks from Mr. Cooper Group Inc
 Q2 2025 Earnings Presentation25 slides · Jul 23, 2025
 Q1 2025 Earnings Presentation24 slides · Apr 23, 2025
 Merger or Acquisition (March 2025)23 slides · Mar 31, 2025
 Q4 2024 Earnings Presentation29 slides · Feb 12, 2025
 Q3 2024 Earnings Presentation29 slides · Oct 23, 2024
 Q2 2024 Earnings Presentation26 slides · Jul 25, 2024