Nayax Ltd. · TASE:NYAX
Nayax — Q3 2026 Earnings Presentation
32 slides from Nayax's earnings presentation, Nov 12, 2026
Slide 1: Third Quarter 2026 Results
1 Third Quarter 2026 Results November 11, 2026
Slide 2: Important Disclosure
2 Important Disclosure • This presentation is intended to provide general information only and is not, and should not be considered, as an offer to purchase or sell the Company’s securities, or a proposal to receive such offers. In addition, this presentation is not an offer to the public of the Com
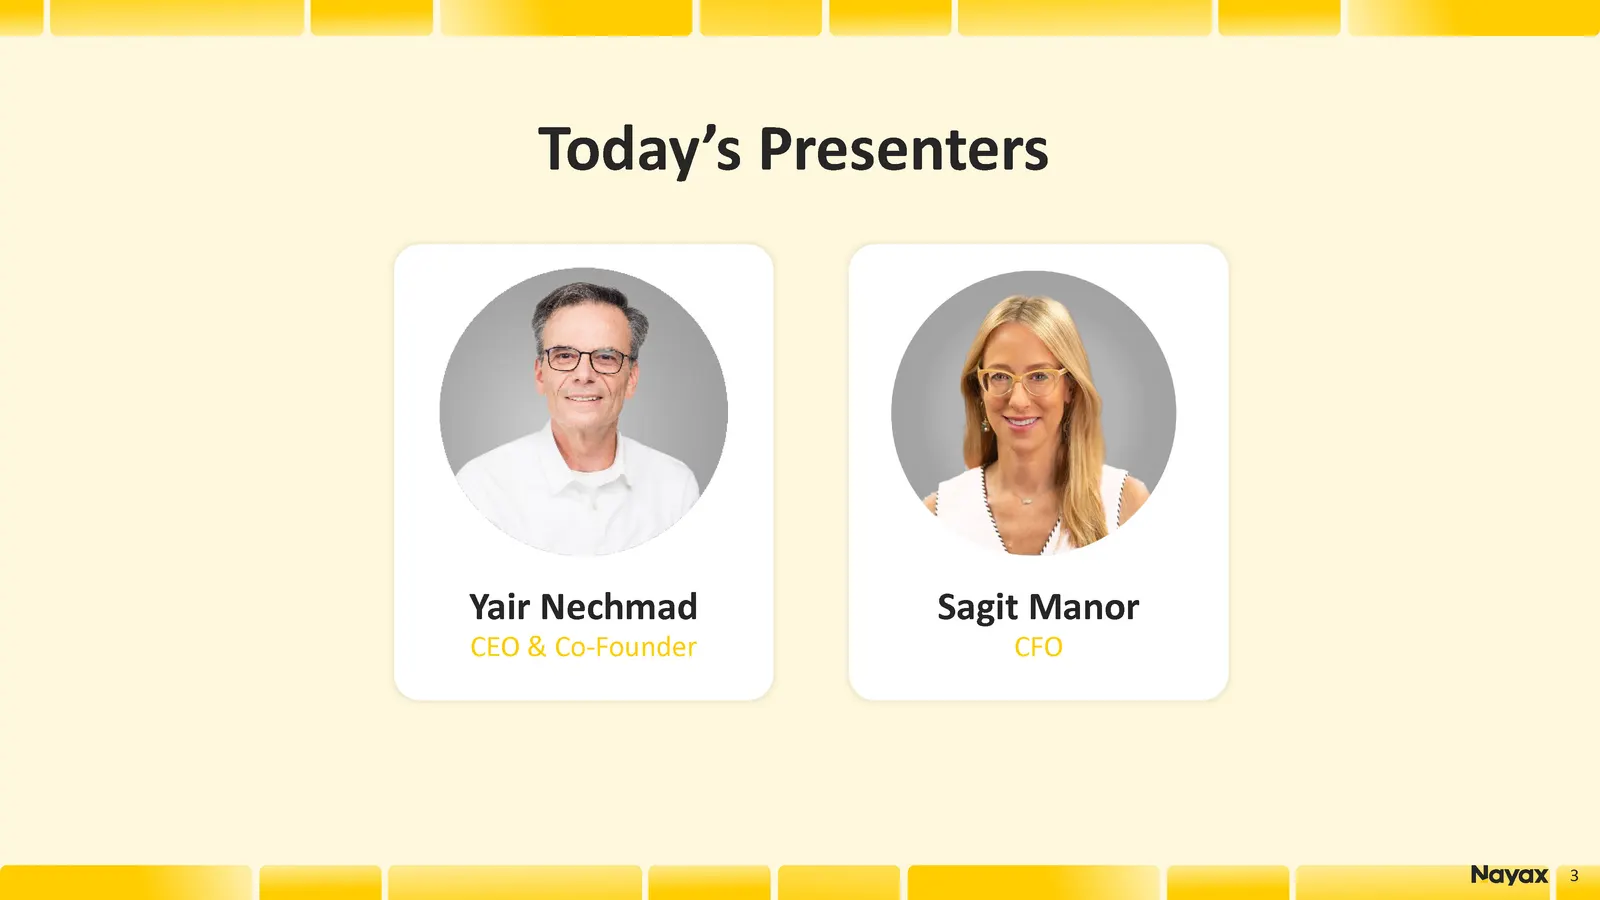
Slide 3: Today's Presenters
3 Today’s Presenters 3 Yair Nechmad CEO & Co - Founder Sagit Manor CFO 3
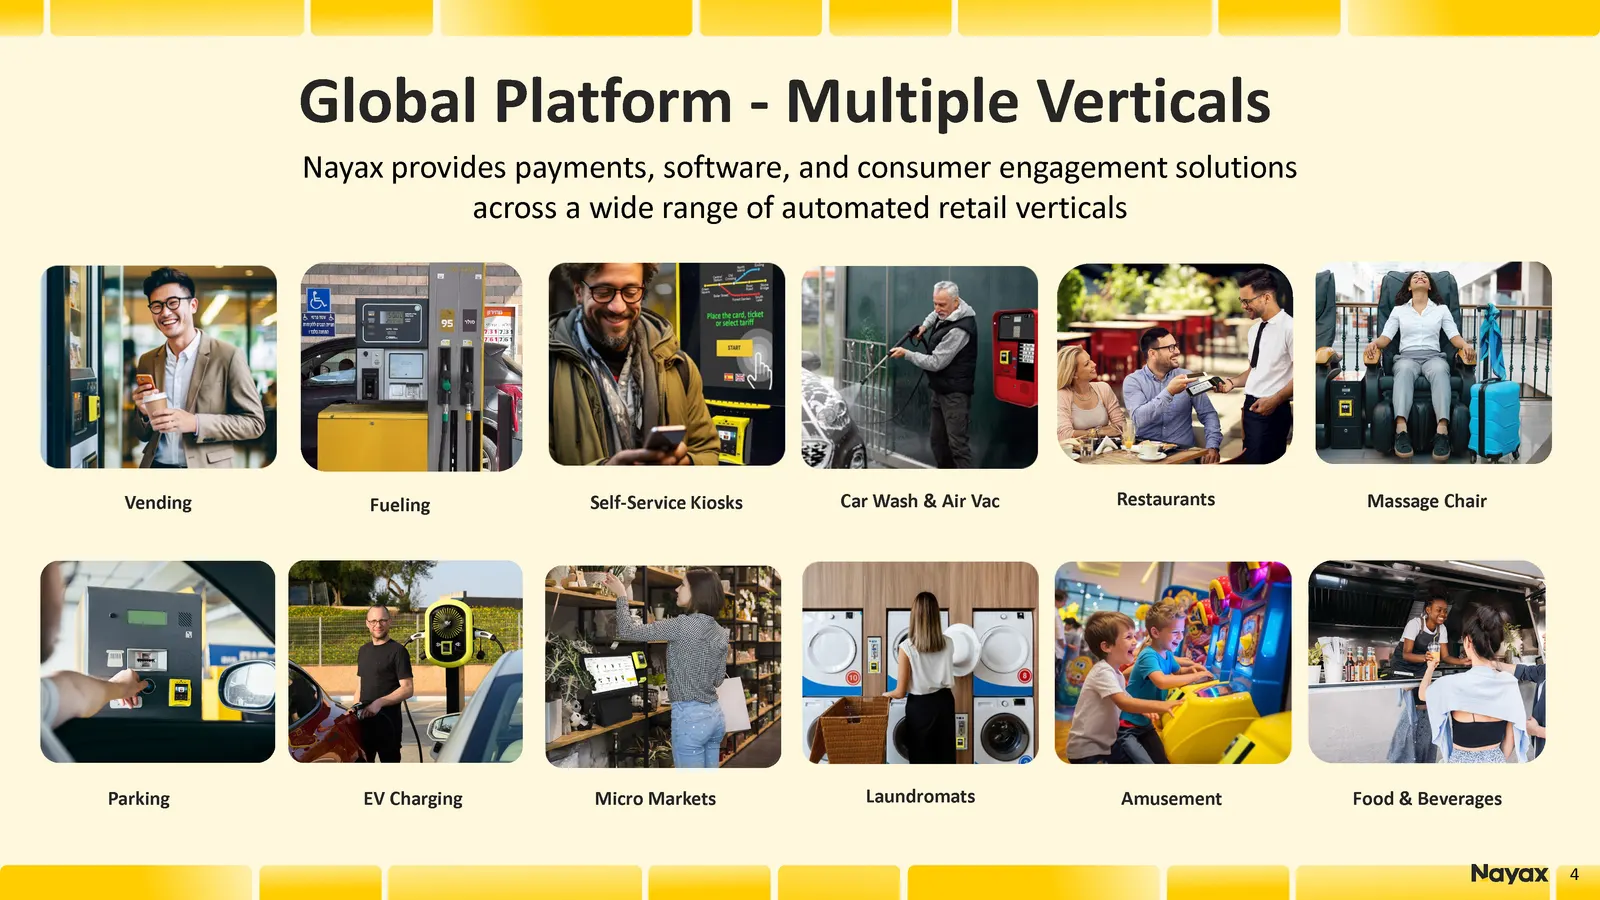
Slide 4: Payments, software and consumer engagement across automated retail verticals
4 Nayax provides payments, software, and consumer engagement solutions across a wide range of automated retail verticals Global Platform - Multiple Verticals Massage Chair Fueling Self - Service Kiosks Laundromats Car Wash & Air Vac Amusement Food & Beverages Restaurants Micro Markets EV Charging Ve
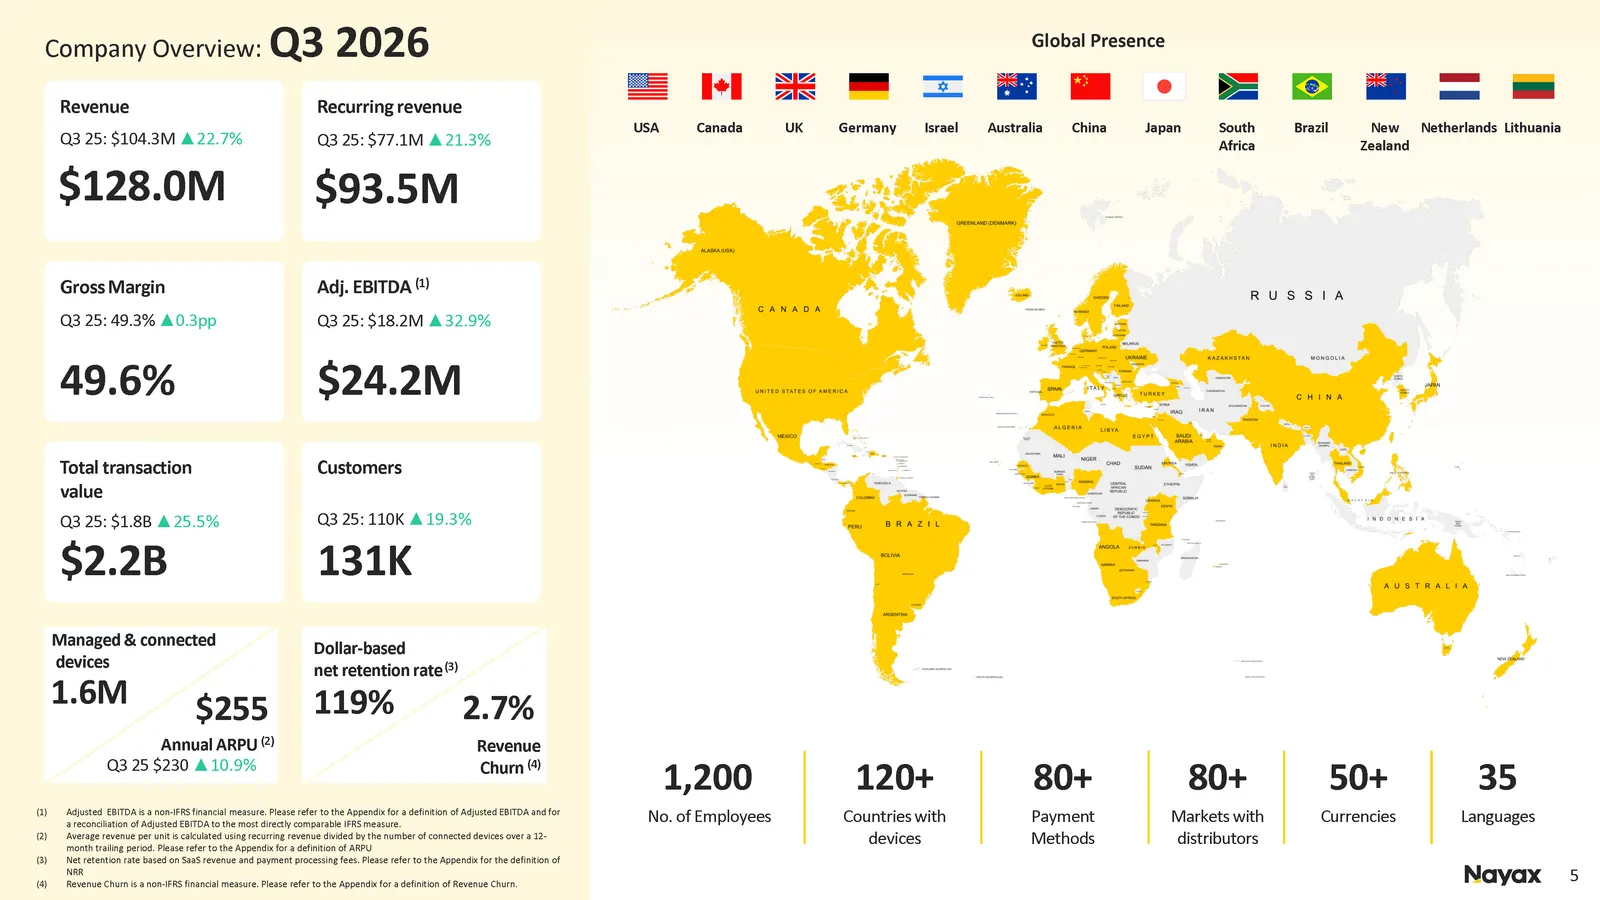
Slide 5: Q3 2026 key metrics
5 Revenue $ 128.0 M Q 3 25 : $ 104.3 M ▲ 22.7 % Recurring revenue $ 93.5 M Q 3 25 : $ 77.1 M ▲ 21.3 % Gross Margin 49.6 % Q 3 25 : 49.3 % ▲ 0.3 pp Adj. EBITDA ( 1 ) $ 24.2 M Q 3 25 : $ 18.2 M ▲ 32.9 % Total transaction value $ 2.2 B Customers 131 K Revenue Churn ( 4 ) 2.7 % Q 3 25 : $ 1.8 B ▲ 25.5 %
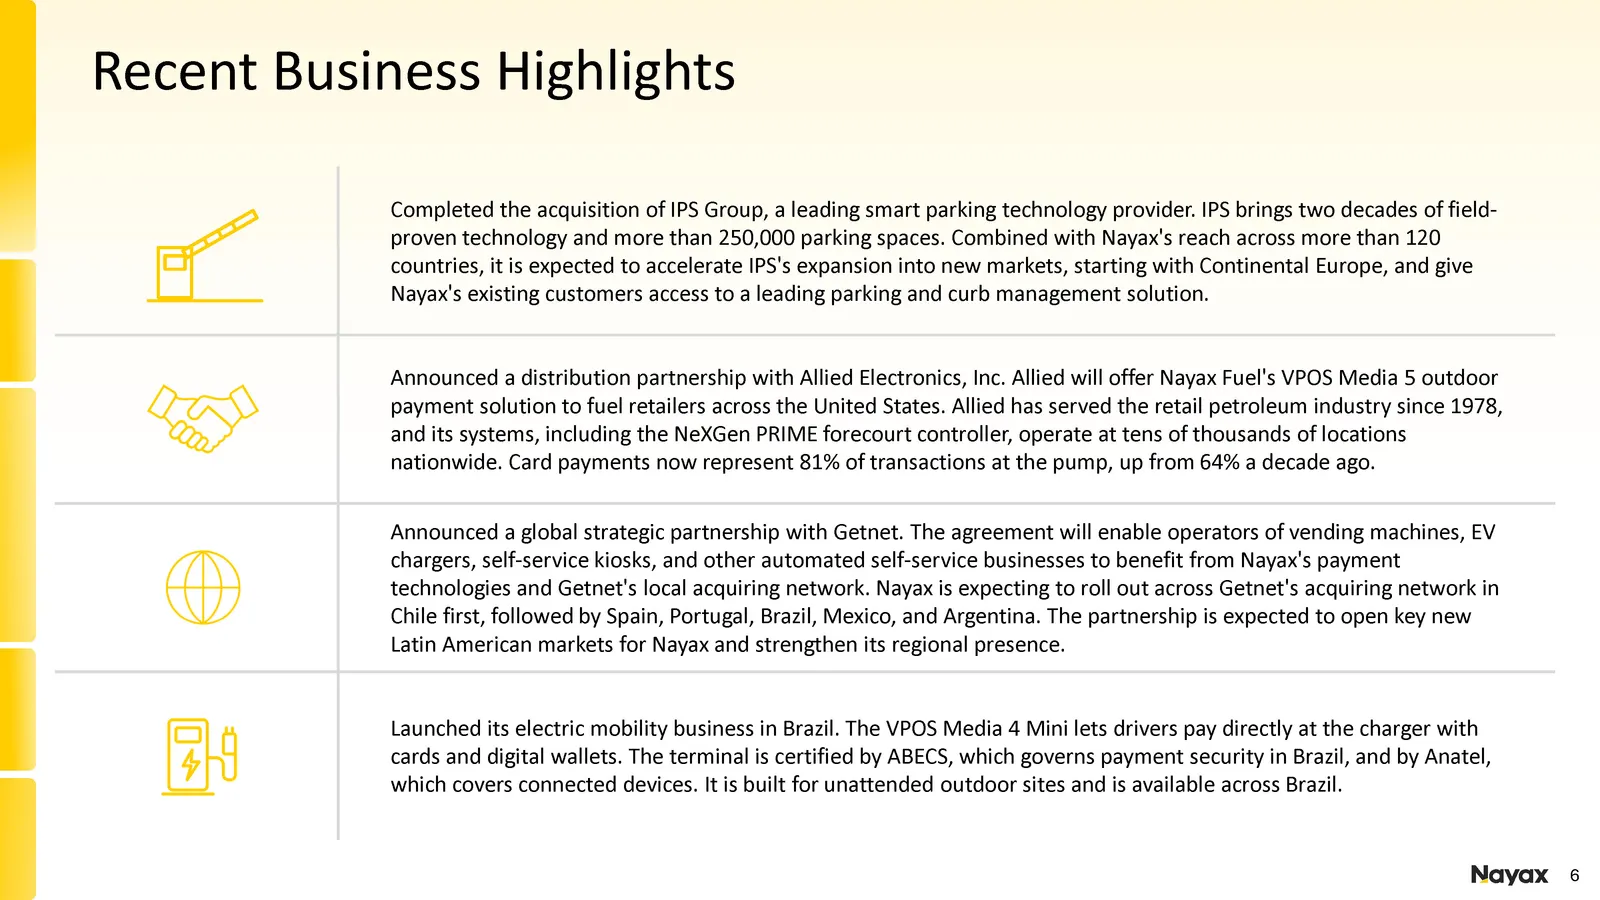
Slide 6: Recent Business Highlights
6 Recent Business Highlights Completed the acquisition of IPS Group, a leading smart parking technology provider. IPS brings two decades of field - proven technology and more than 250,000 parking spaces. Combined with Nayax's reach across more than 120 countries, it is expected to accelerate IPS's e

Slide 7: What's Next?
7 7 What ’ s Next?
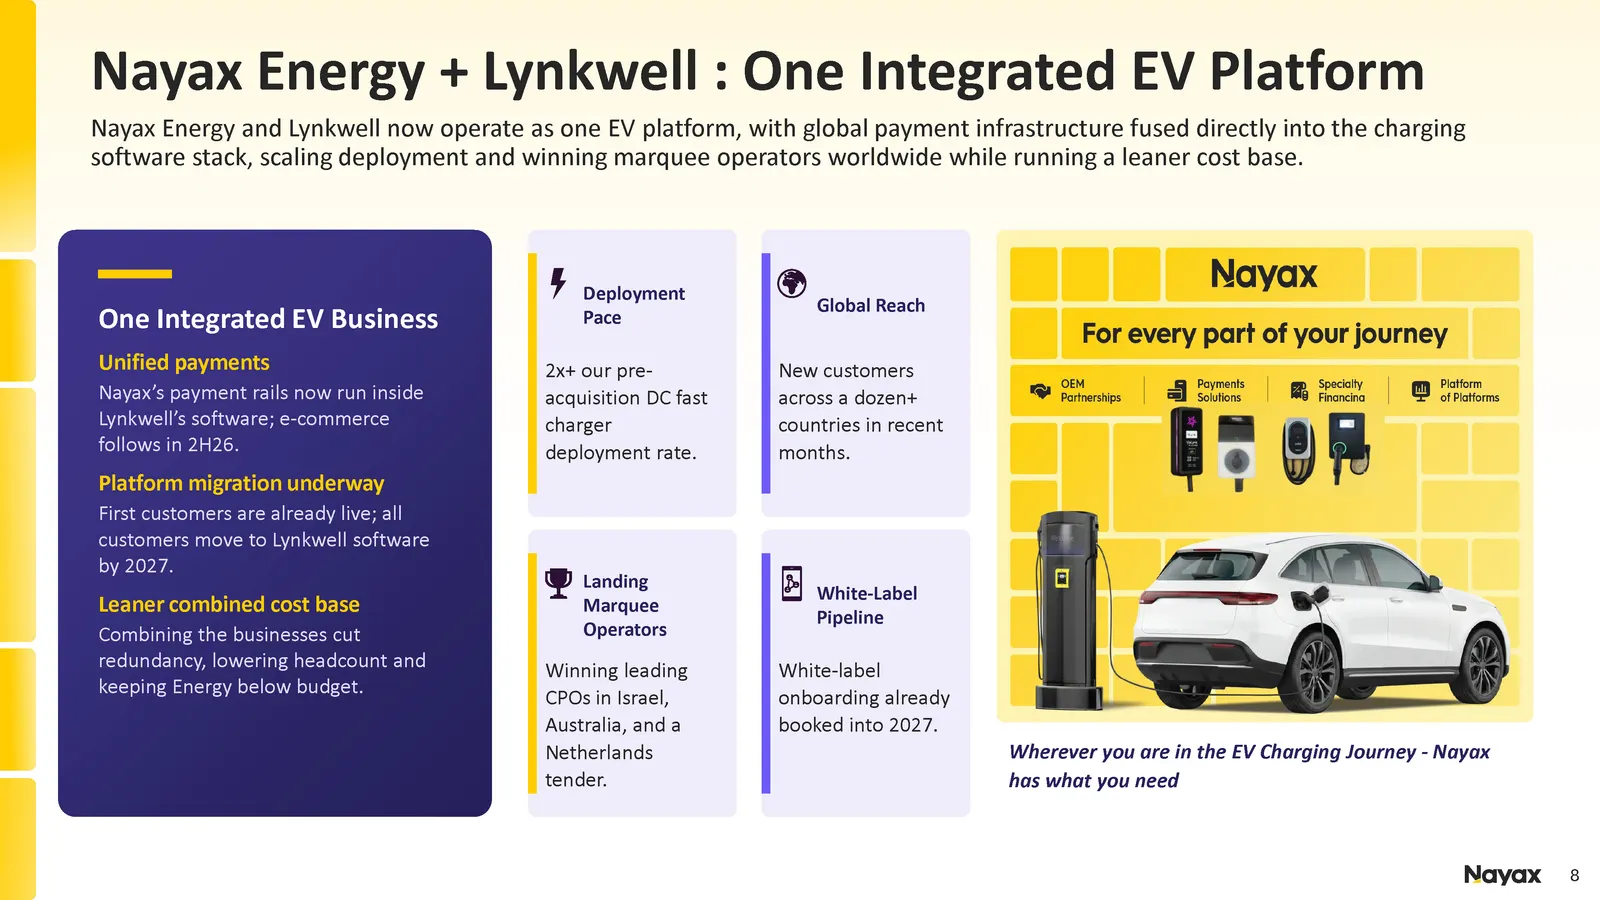
Slide 8: Nayax Energy + Lynkwell: One Integrated EV Platform
8 Nayax Energy + Lynkwell : One Integrated EV Platform Nayax Energy and Lynkwell now operate as one EV platform, with global payment infrastructure fused directly into the charging software stack, scaling deployment and winning marquee operators worldwide while running a leaner cost base. One Integr
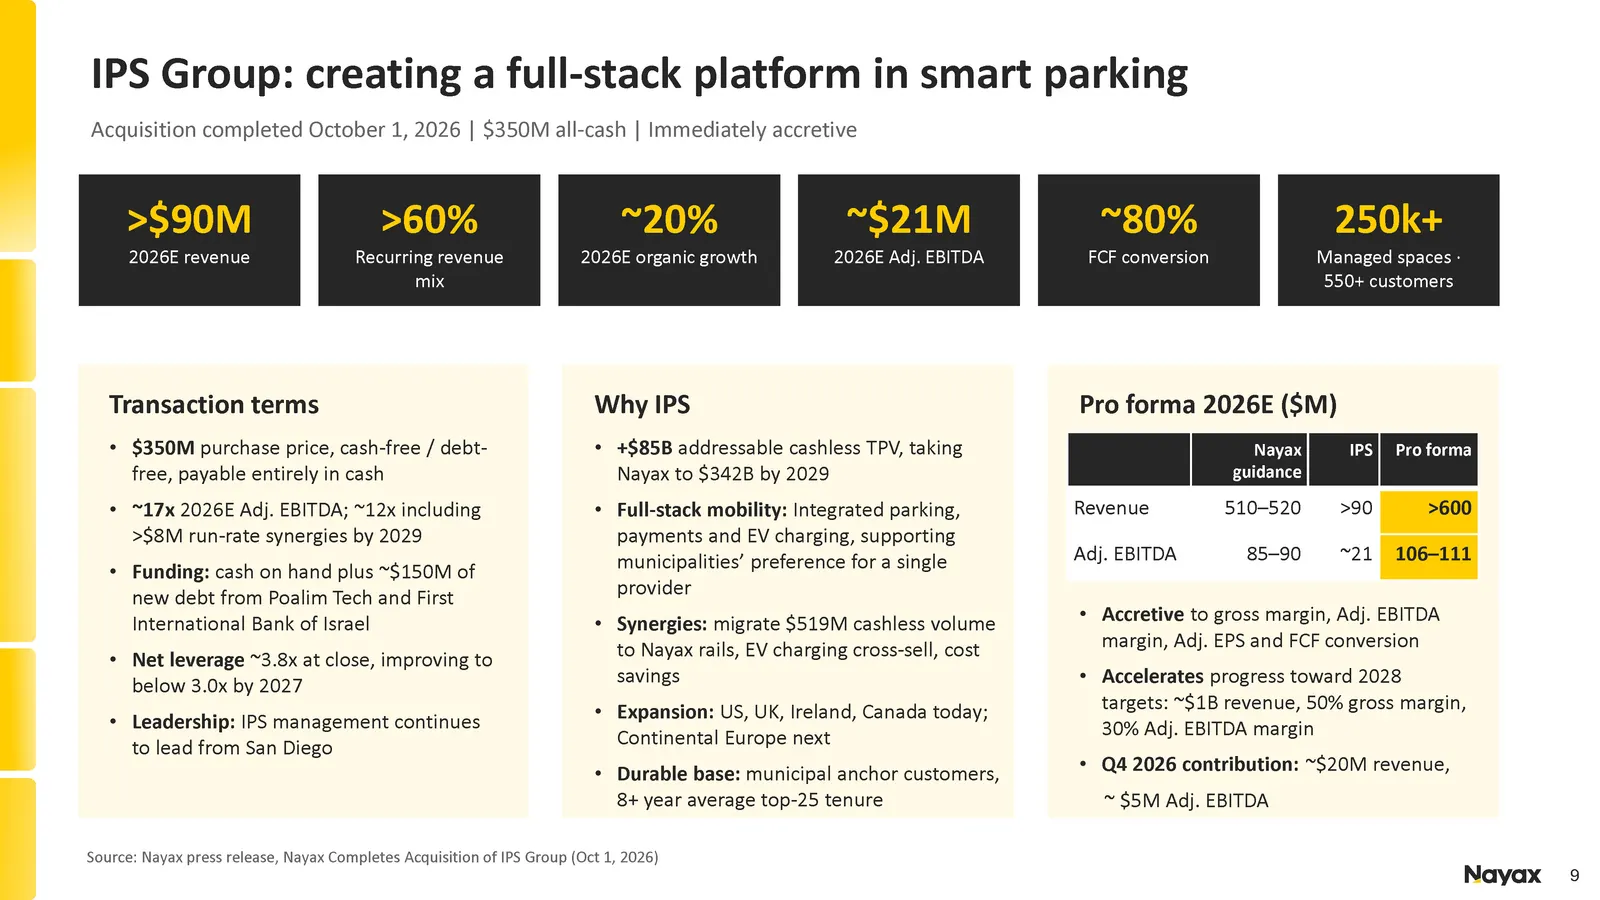
Slide 9: IPS Group: creating a full-stack platform in smart parking
9 IPS Group: creating a full - stack platform in smart parking Acquisition completed October 1 , 2026 | $ 350 M all - cash | Immediately accretive >$ 90 M 2026 E revenue > 60 % Recurring revenue mix ~ 20 % 2026 E organic growth ~$ 21 M 2026 E Adj. EBITDA ~ 80 % FCF conversion 250k+ Managed spaces ·
Slide 10: Expanding Financial Services Across Our Customer Base
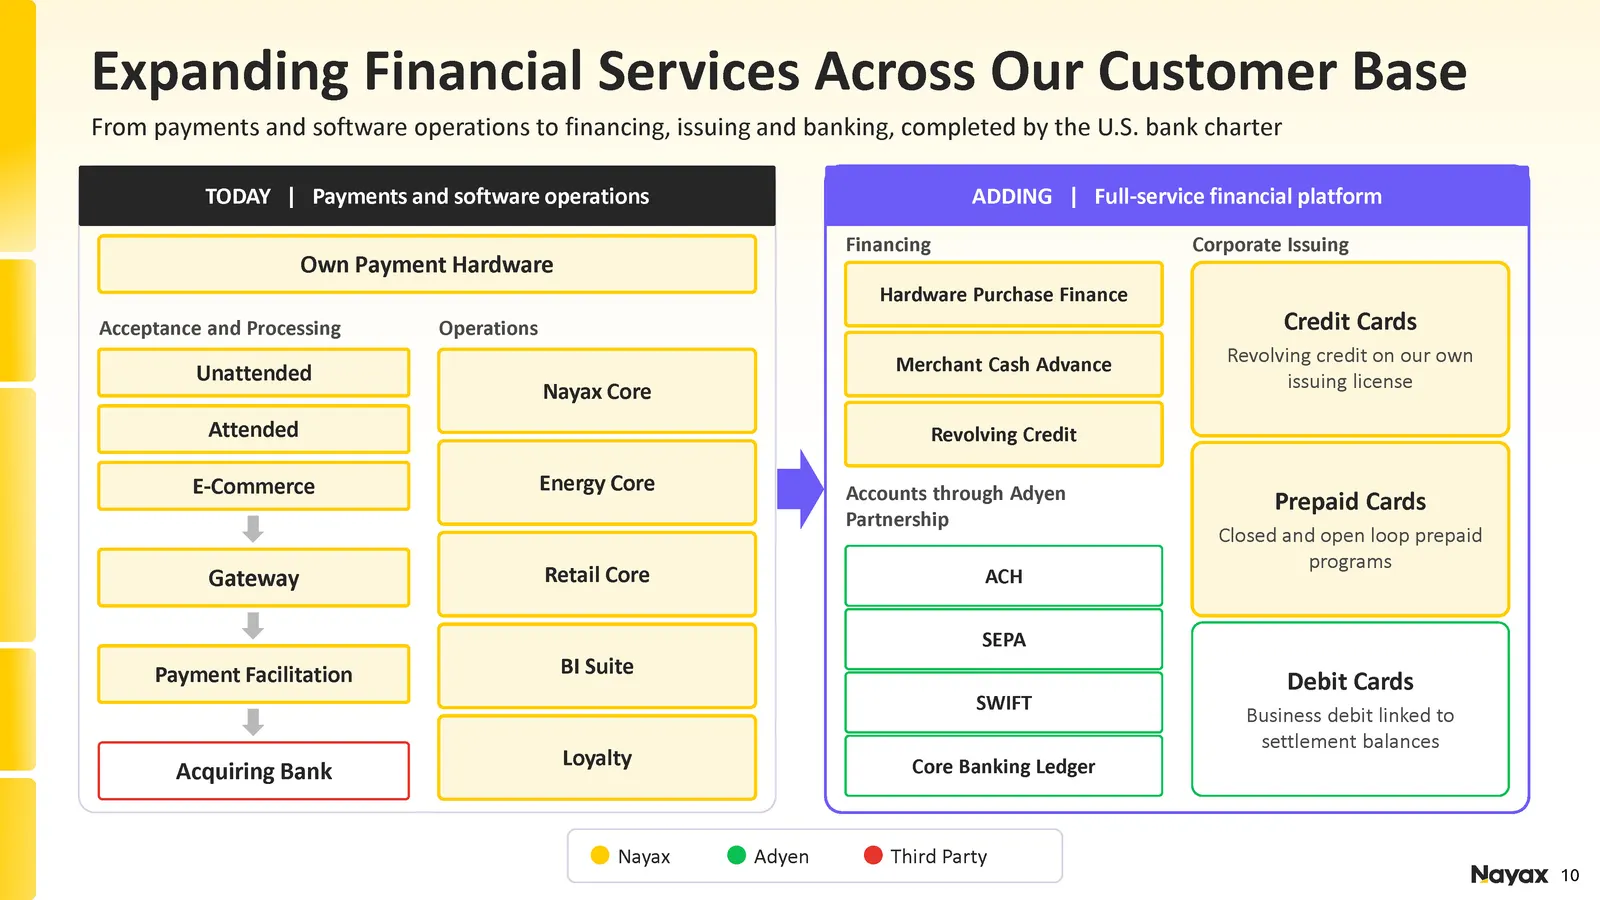
10 Expanding Financial Services Across Our Customer Base From payments and software operations to financing, issuing and banking, completed by the U.S. bank charter TODAY | Payments and software operations ADDING | Full - service financial platform Acceptance and Processing Unattended Attended E - C

Slide 11: Financial Performance & Outlook
11 11 Financial Performance & Outlook
Slide 12: Q3 2026 Key Highlights
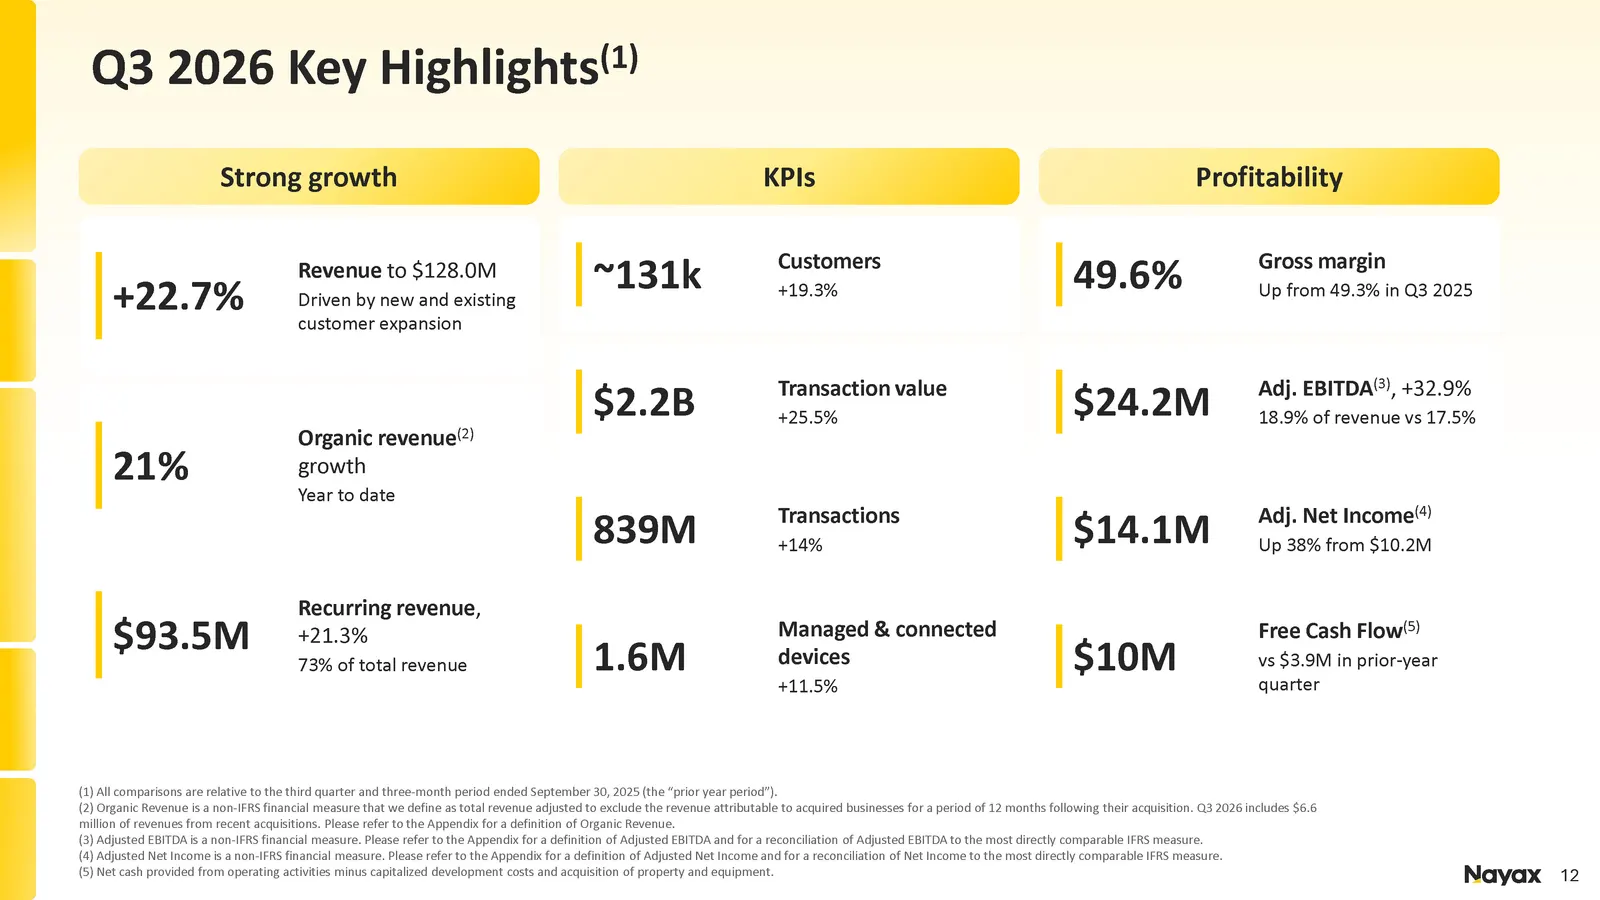
12 Q 3 2026 Key Highlights ( 1 ) Strong growth + 22.7 % Revenue to $128.0M Driven by new and existing customer expansion 21 % Organic revenue (2) growth Year to date $ 93.5 M Recurring revenue , + 21.3 % 73 % of total revenue KPIs ~ 131 k Customers + 19.3 % $2.2B Transaction value + 25.5 % 839M Tran
Slide 13: Revenue growth
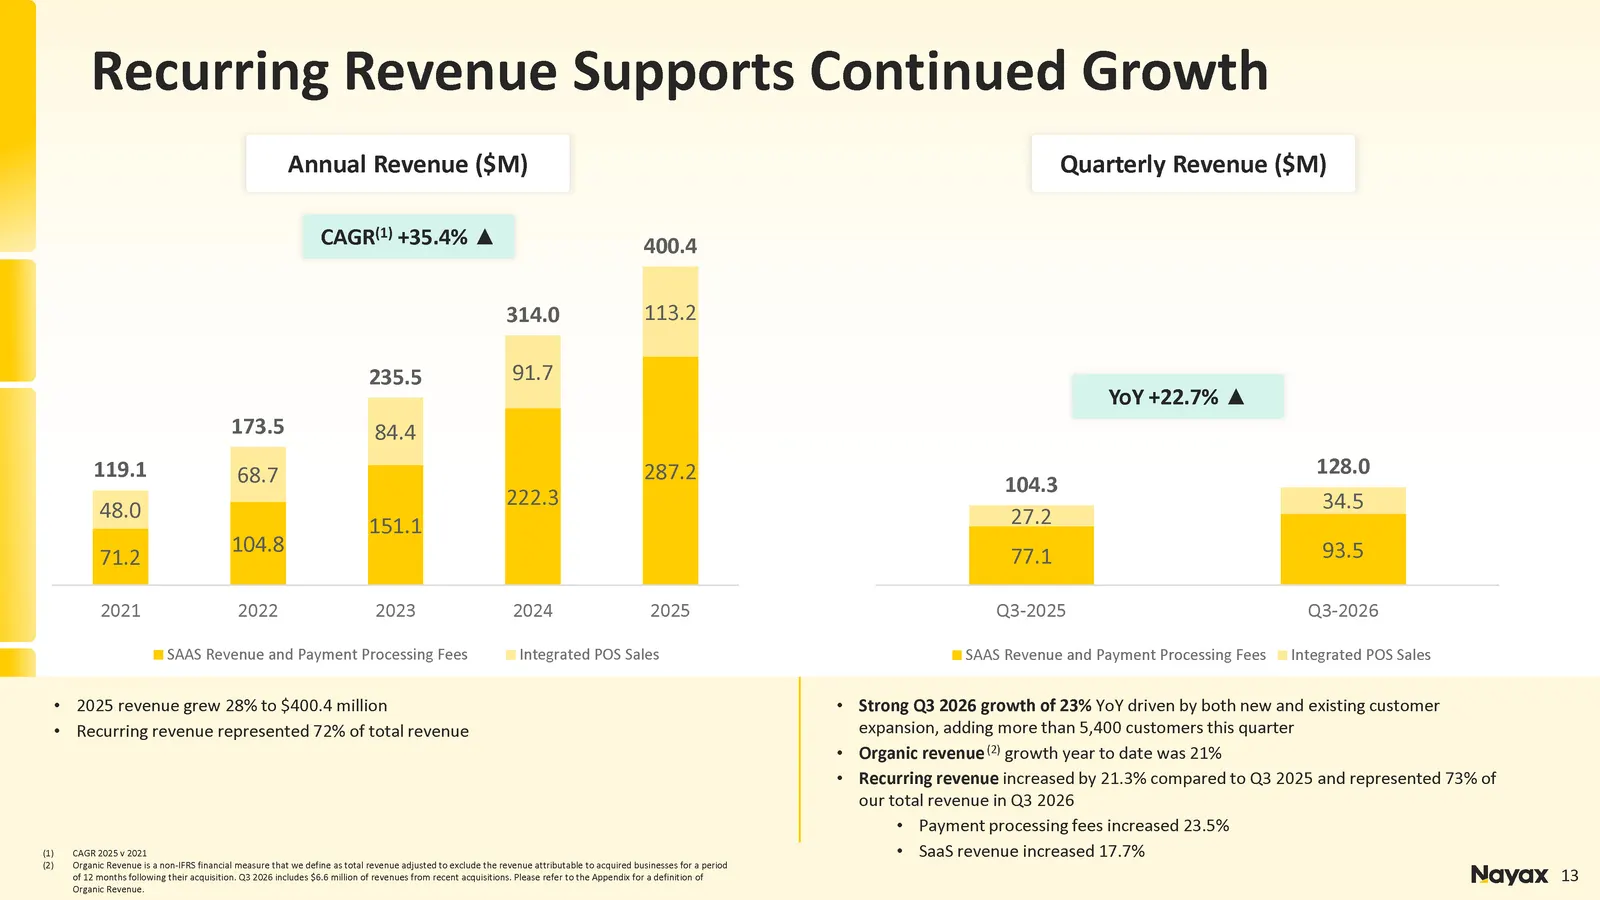
13 • 2025 revenue grew 28 % to $ 400.4 million • Recurring revenue represented 72 % of total revenue (1) CAGR 2025 v 2021 (2) Organic Revenue is a non - IFRS financial measure that we define as total revenue adjusted to exclude the revenue attributable to acquired businesses for a period of 12 month
Slide 14: Payment processing revenue and take rate
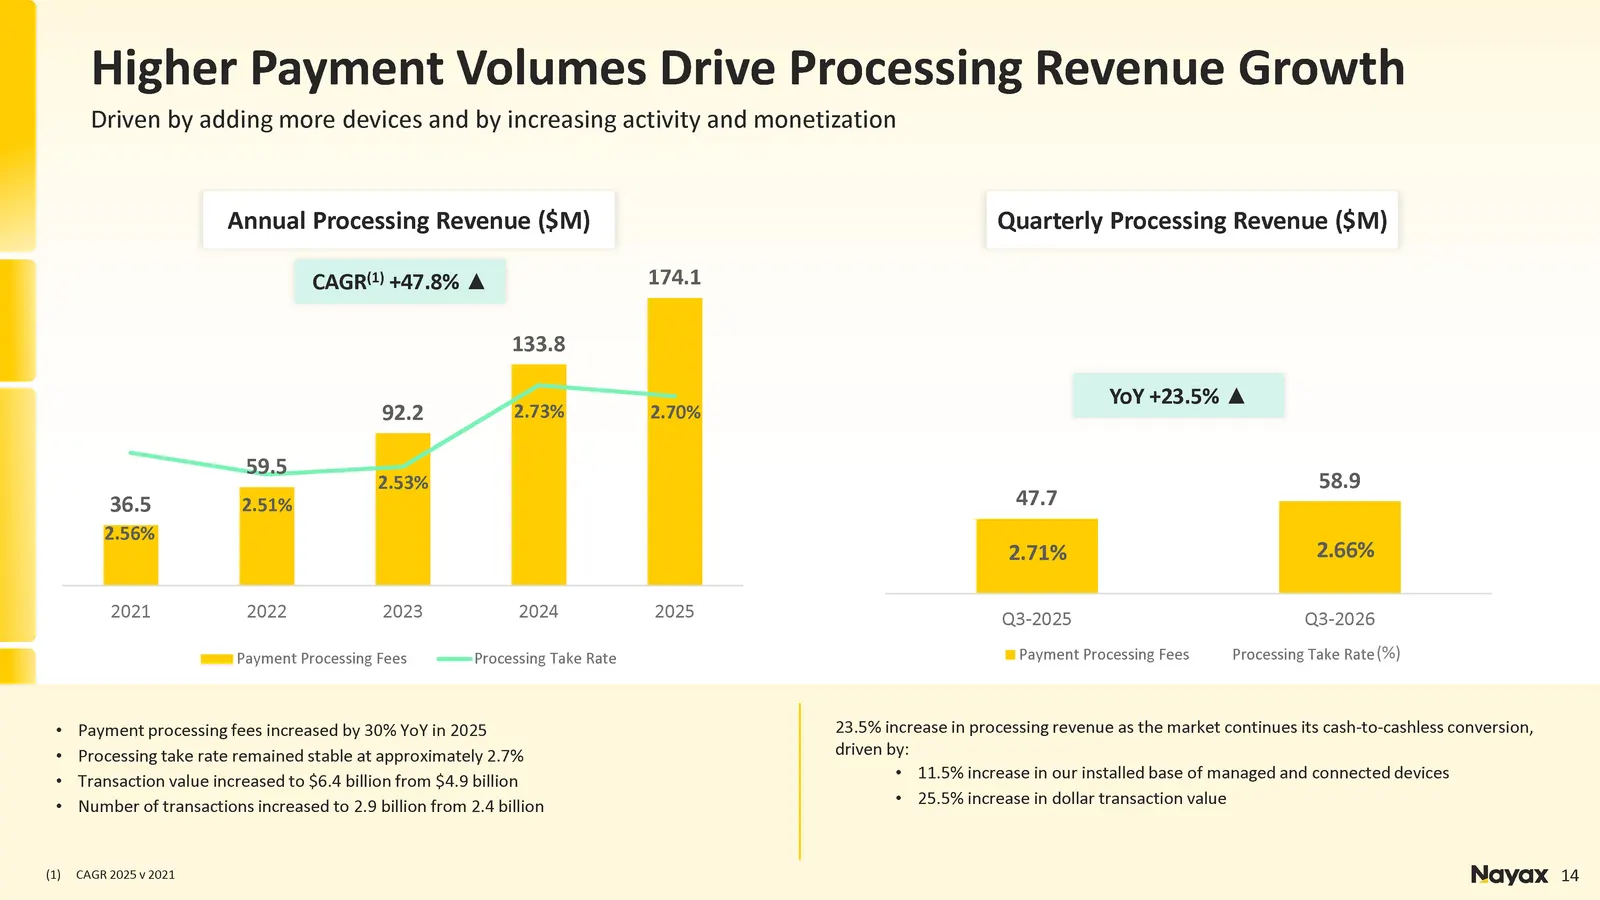
14 36.5 59.5 92.2 133.8 174.1 2.56 % 2.51 % 2.53% 2.73 % 2.70 % 2.20% 2.30% 2.40% 2.50% 2.60% 2.70% 2.80% 2.90% 3.00% (10.0) 10.0 30.0 50.0 70.0 90.0 110.0 130.0 150.0 170.0 190.0 2021 2022 2023 2024 2025 Payment Processing Fees Processing Take Rate 47.7 58.9 2.71 % 2.66 % 0.00% 1.00% 2.00% 3.00% 4.
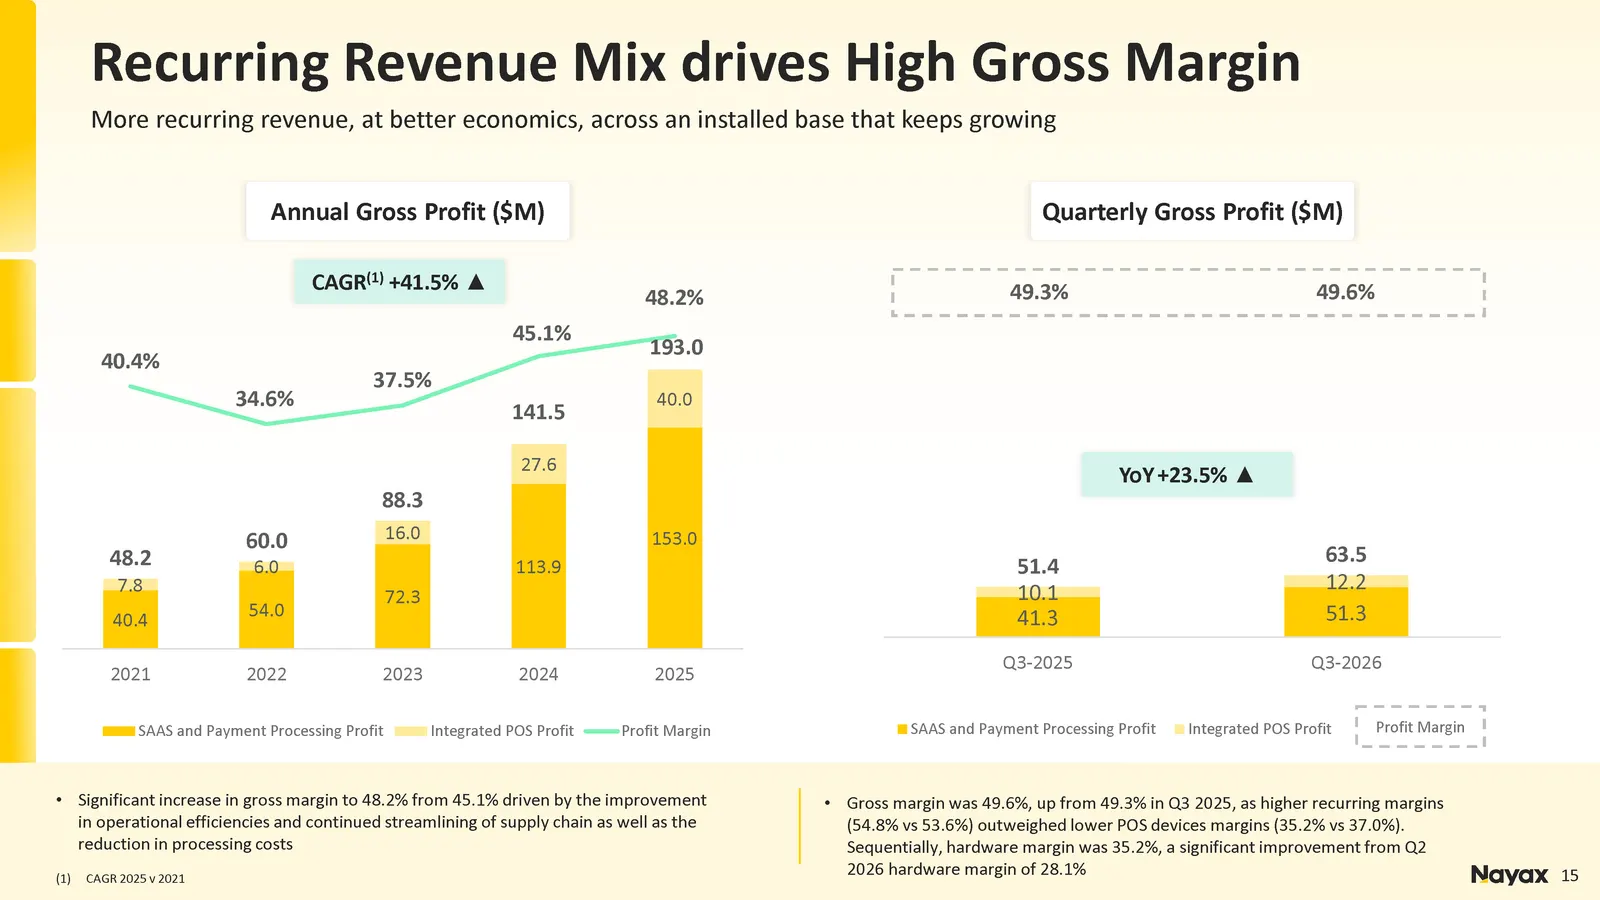
Slide 15: Gross profit
15 41.3 51.3 10.1 12.2 51.4 63.5 (5.0) 5.0 15.0 25.0 35.0 45.0 55.0 65.0 75.0 Q3-2025 Q3-2026 SAAS and Payment Processing Profit Integrated POS Profit CAGR ( 1 ) + 41.5 % ▲ 15 Annual Gross Profit ($M) Quarterly Gross Profit ($M) YoY + 23.5 % ▲ • Significant increase in gross margin to 48.2% from 45.
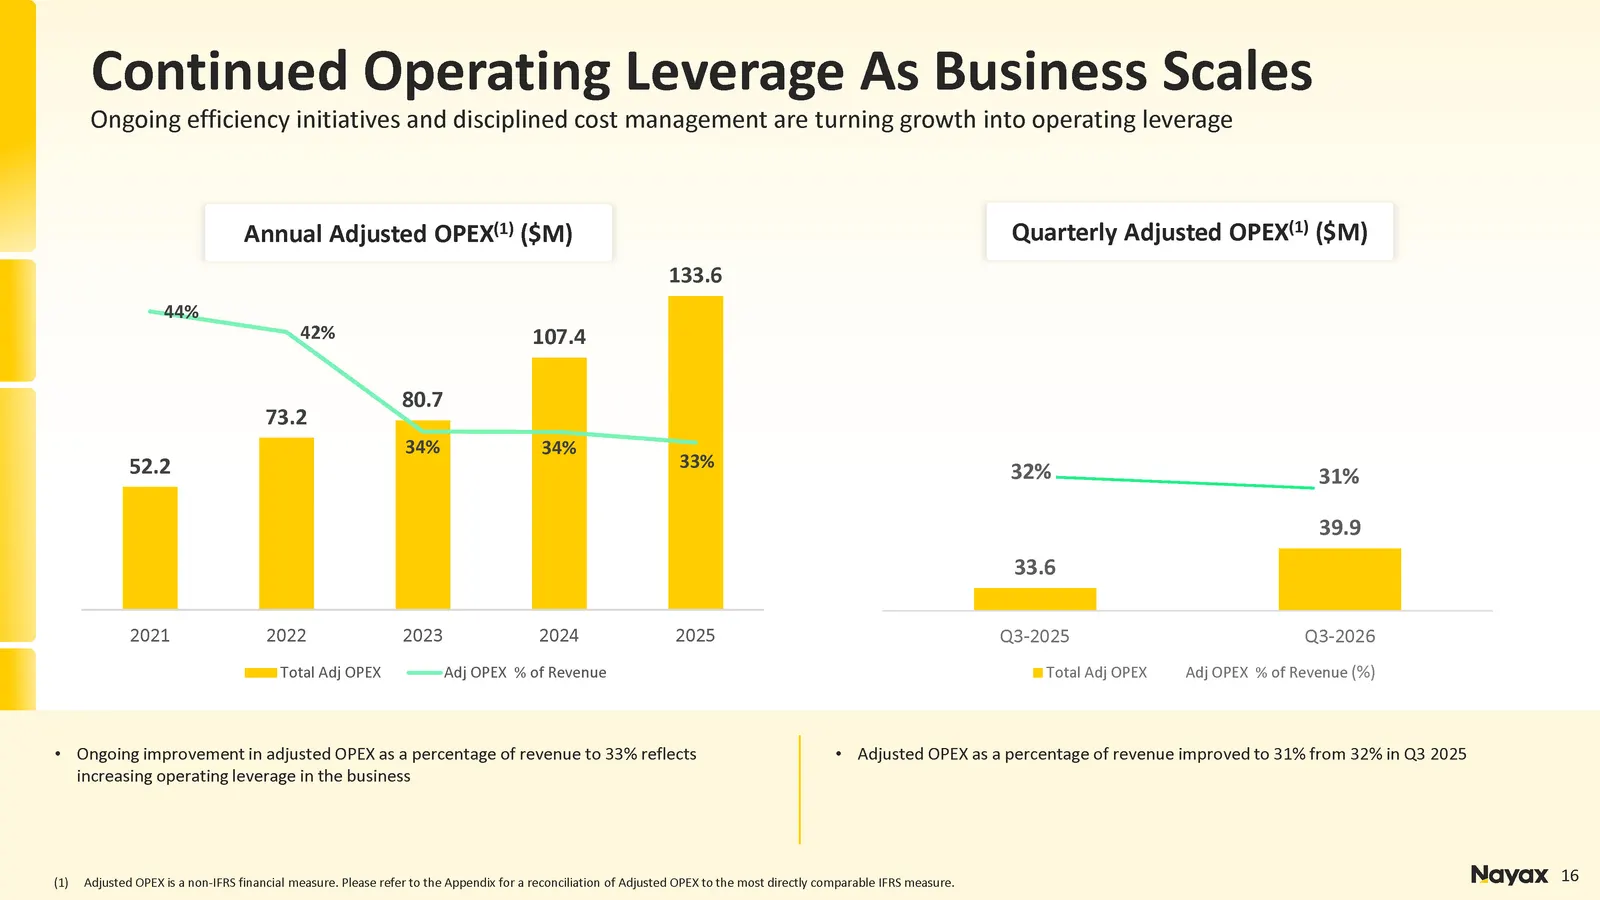
Slide 16: Continued Operating Leverage As Business Scales
16 16 Annual Adjusted OPEX ( 1 ) ($M) Quarterly Adjusted OPEX ( 1 ) ($M) • Ongoing improvement in adjusted OPEX as a percentage of revenue to 33% reflects increasing operating leverage in the business • Adjusted OPEX as a percentage of revenue improved to 31 % from 32 % in Q 3 2025 (1) Adjusted OPEX
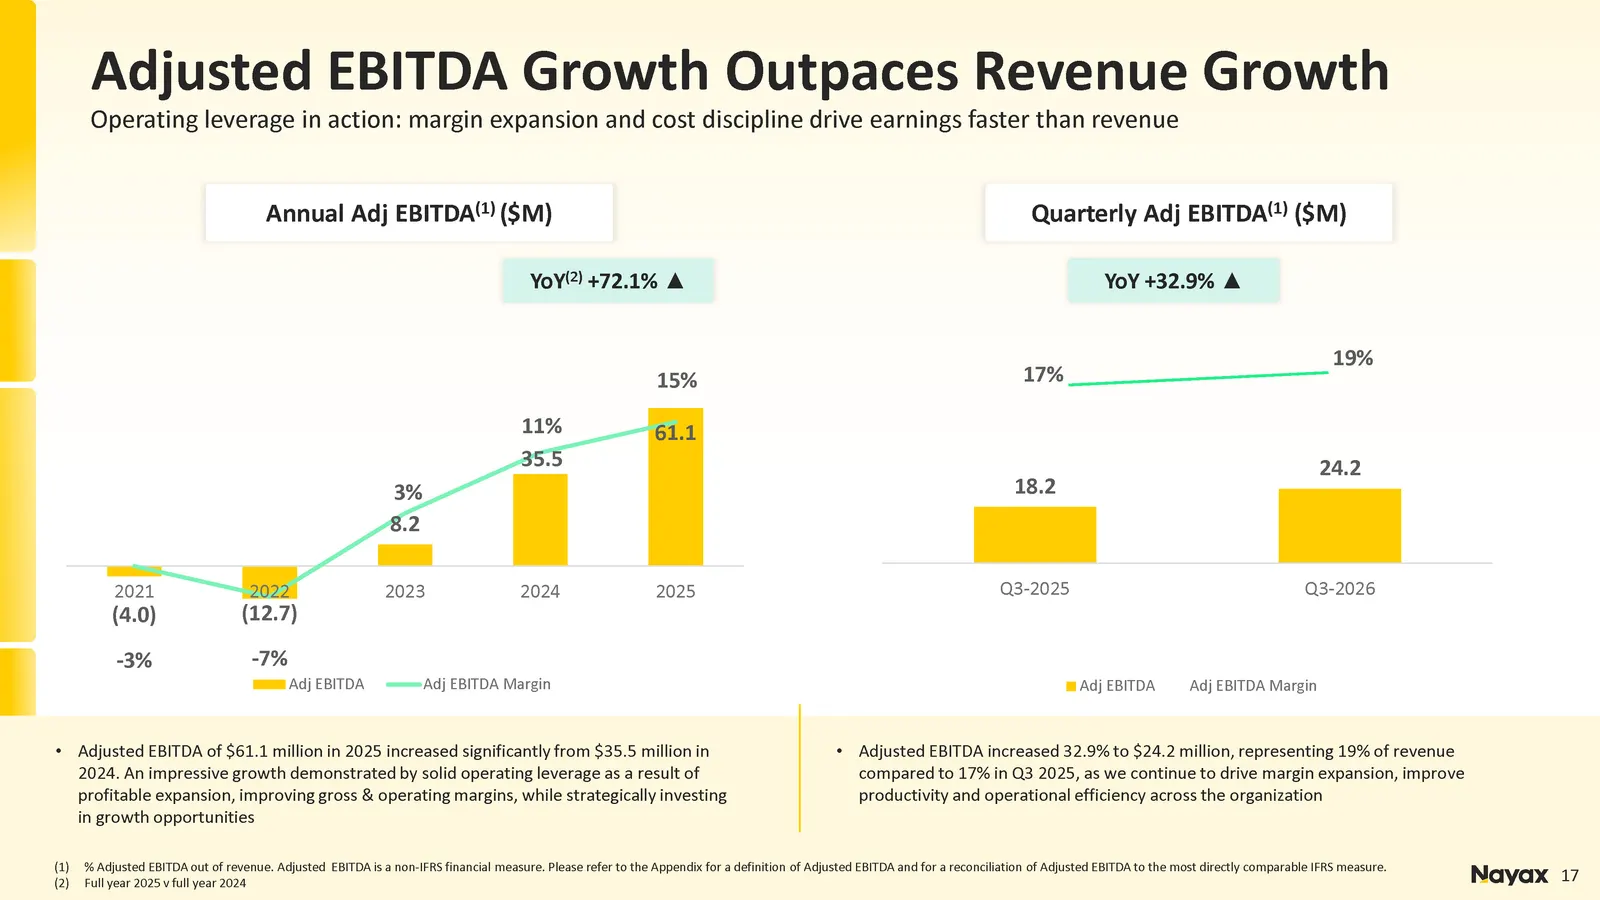
Slide 17: Adjusted EBITDA
17 YoY (2) +72.1% ▲ 17 Annual Adj EBITDA ( 1 ) ($M) Quarterly Adj EBITDA ( 1 ) ($M) YoY + 32.9 % ▲ (1) % Adjusted EBITDA out of revenue. Adjusted EBITDA is a non - IFRS financial measure. Please refer to the Appendix for a definitio n of Adjusted EBITDA and for a reconciliation of Adjusted EBITDA to
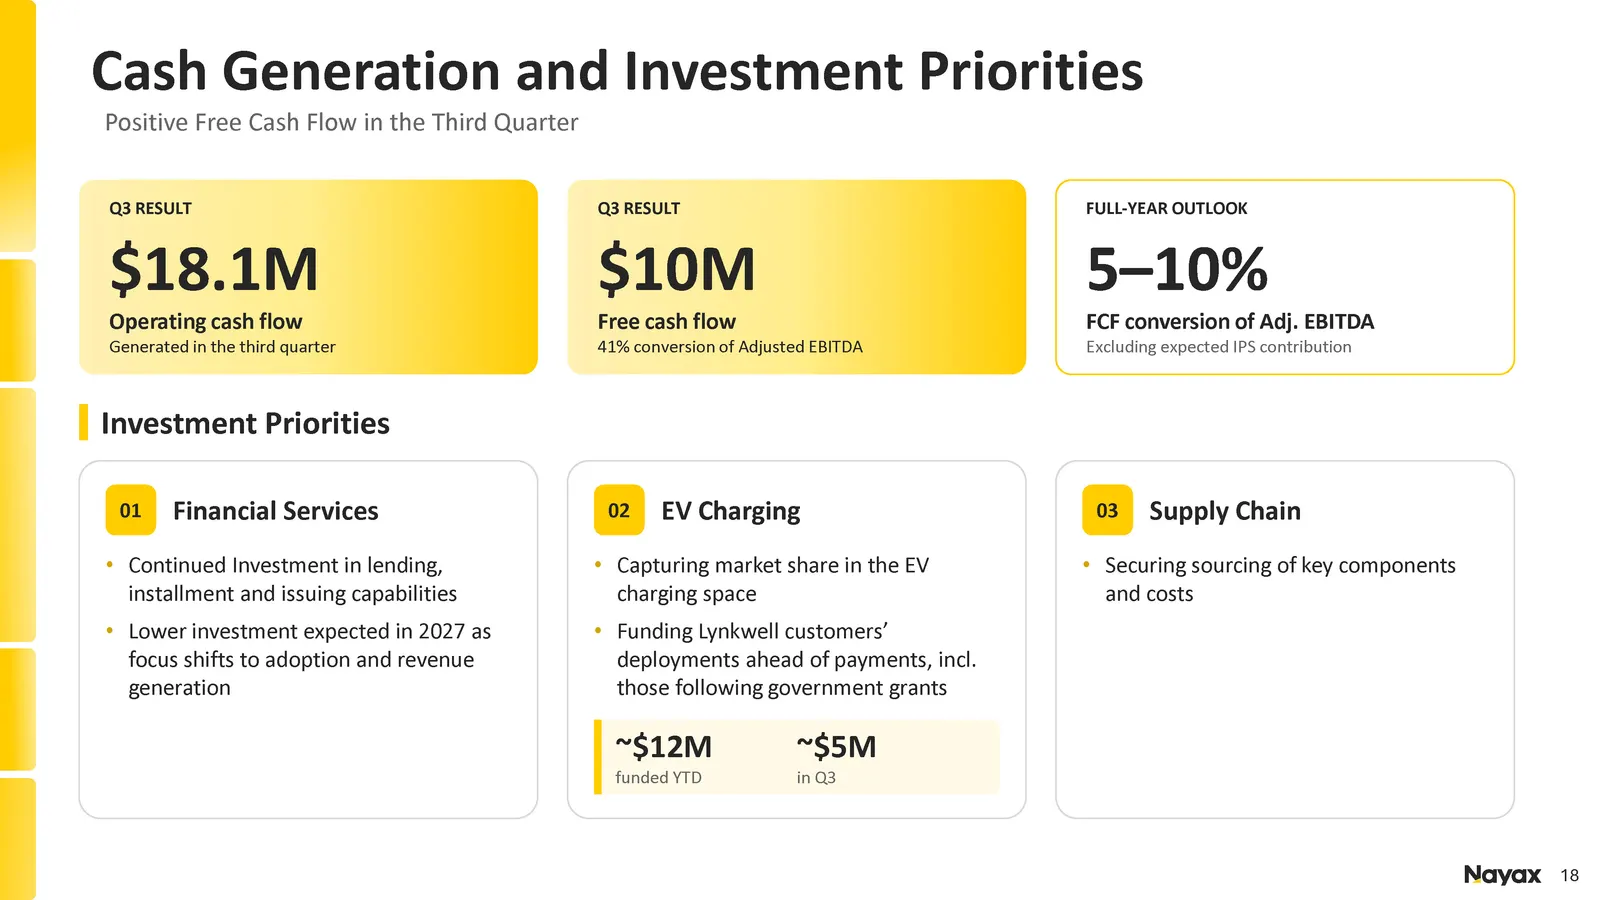
Slide 18: Cash Generation and Investment Priorities
18 Cash Generation and Investment Priorities Positive Free Cash Flow in the Third Quarter Q 3 RESULT $ 18.1 M Operating cash flow Generated in the third quarter Q3 RESULT $ 10 M Free cash flow 41 % conversion of Adjusted EBITDA FULL - YEAR OUTLOOK 5 – 10% FCF conversion of Adj. EBITDA Excluding expe
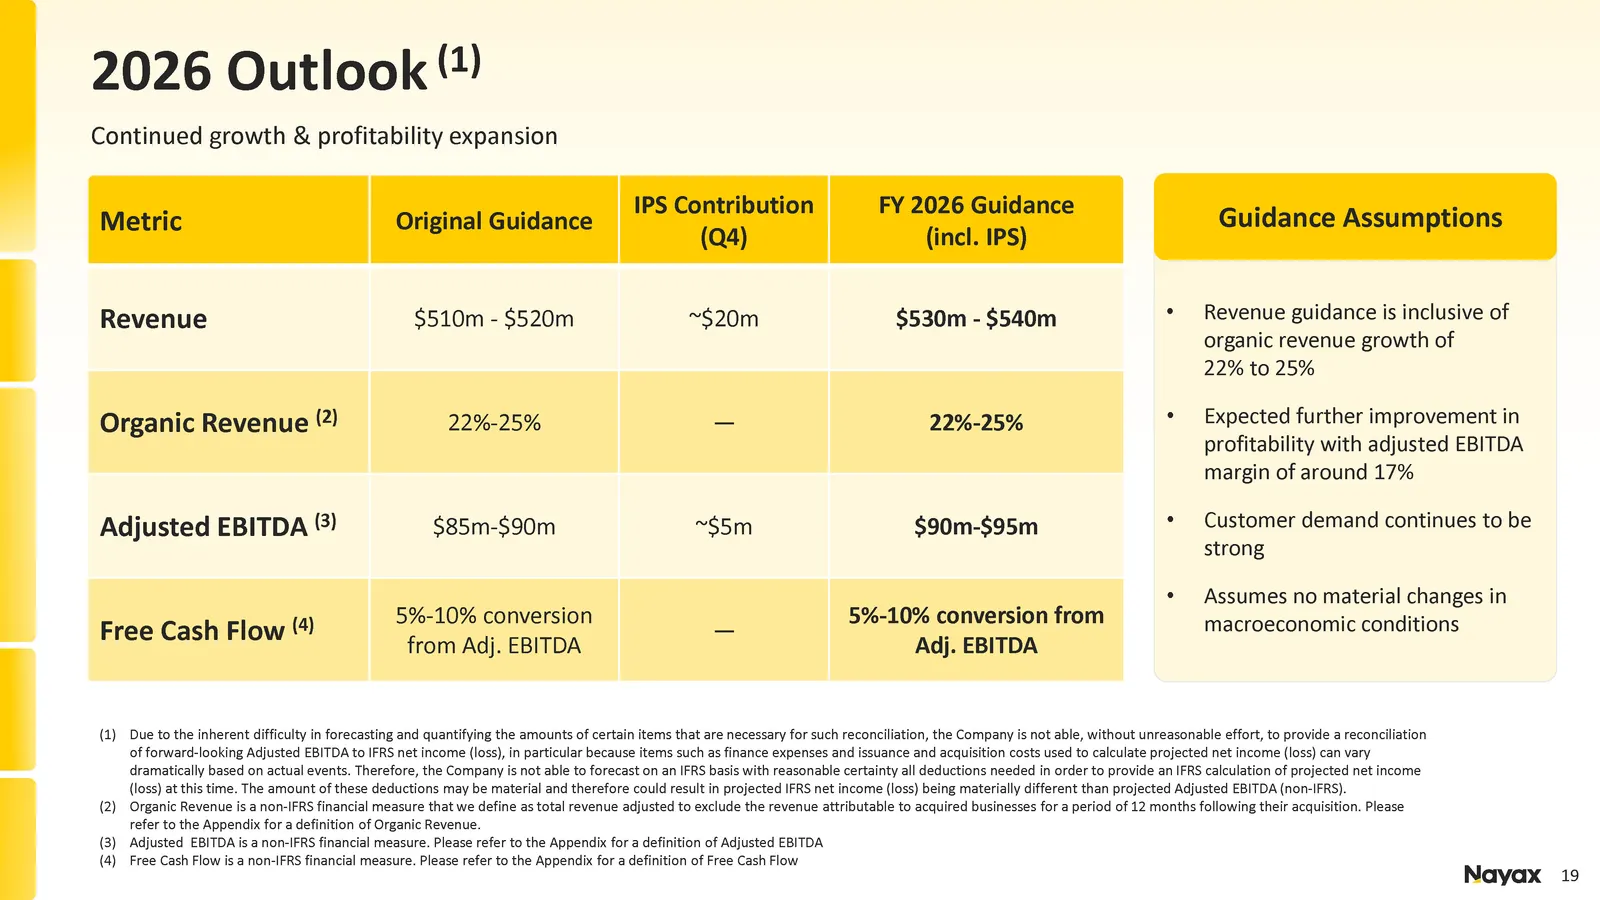
Slide 19: Outlook
19 (1) Due to the inherent difficulty in forecasting and quantifying the amounts of certain items that are necessary for such reconc ili ation, the Company is not able, without unreasonable effort, to provide a reconciliation of forward - looking Adjusted EBITDA to IFRS net income (loss), in particu
Slide 20: Mid-term Outlook
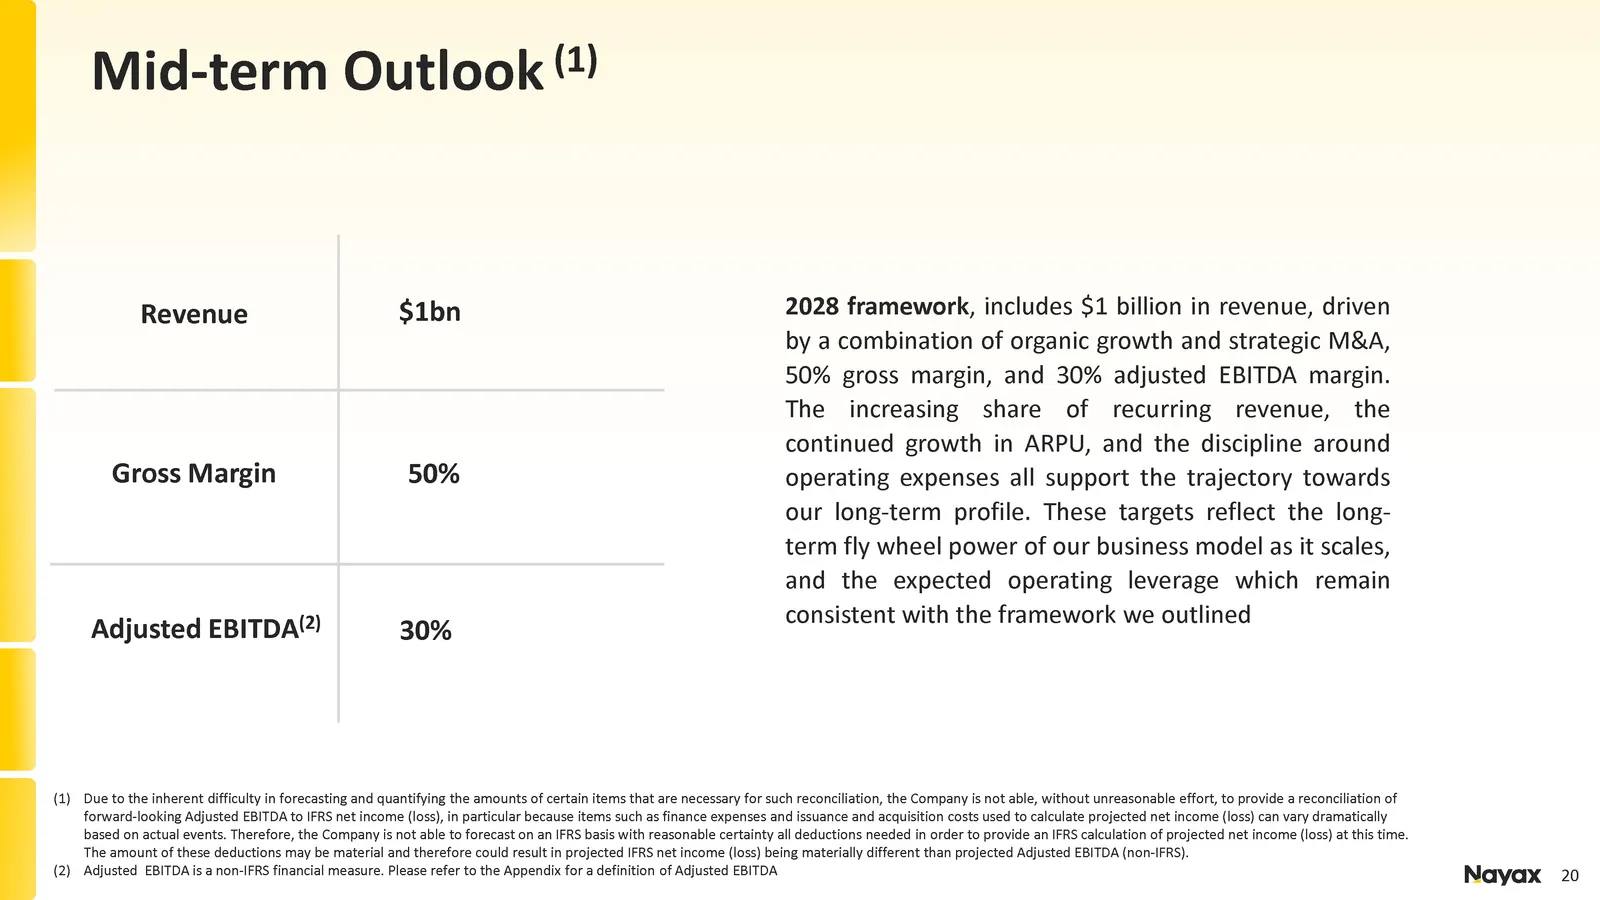
20 Mid - term Outlook (1) Revenue $ 1 bn Gross Margin 50% Adjusted EBITDA ( 2 ) 30 % 2028 framework , includes $ 1 billion in revenue, driven by a combination of organic growth and strategic M&A, 50 % gross margin, and 30 % adjusted EBITDA margin . The increasing share of recurring revenue, the cont
Slide 21: Appendix
21 21 Appendix 21
Slide 22: Highly Attractive Customer Base And Global Reach
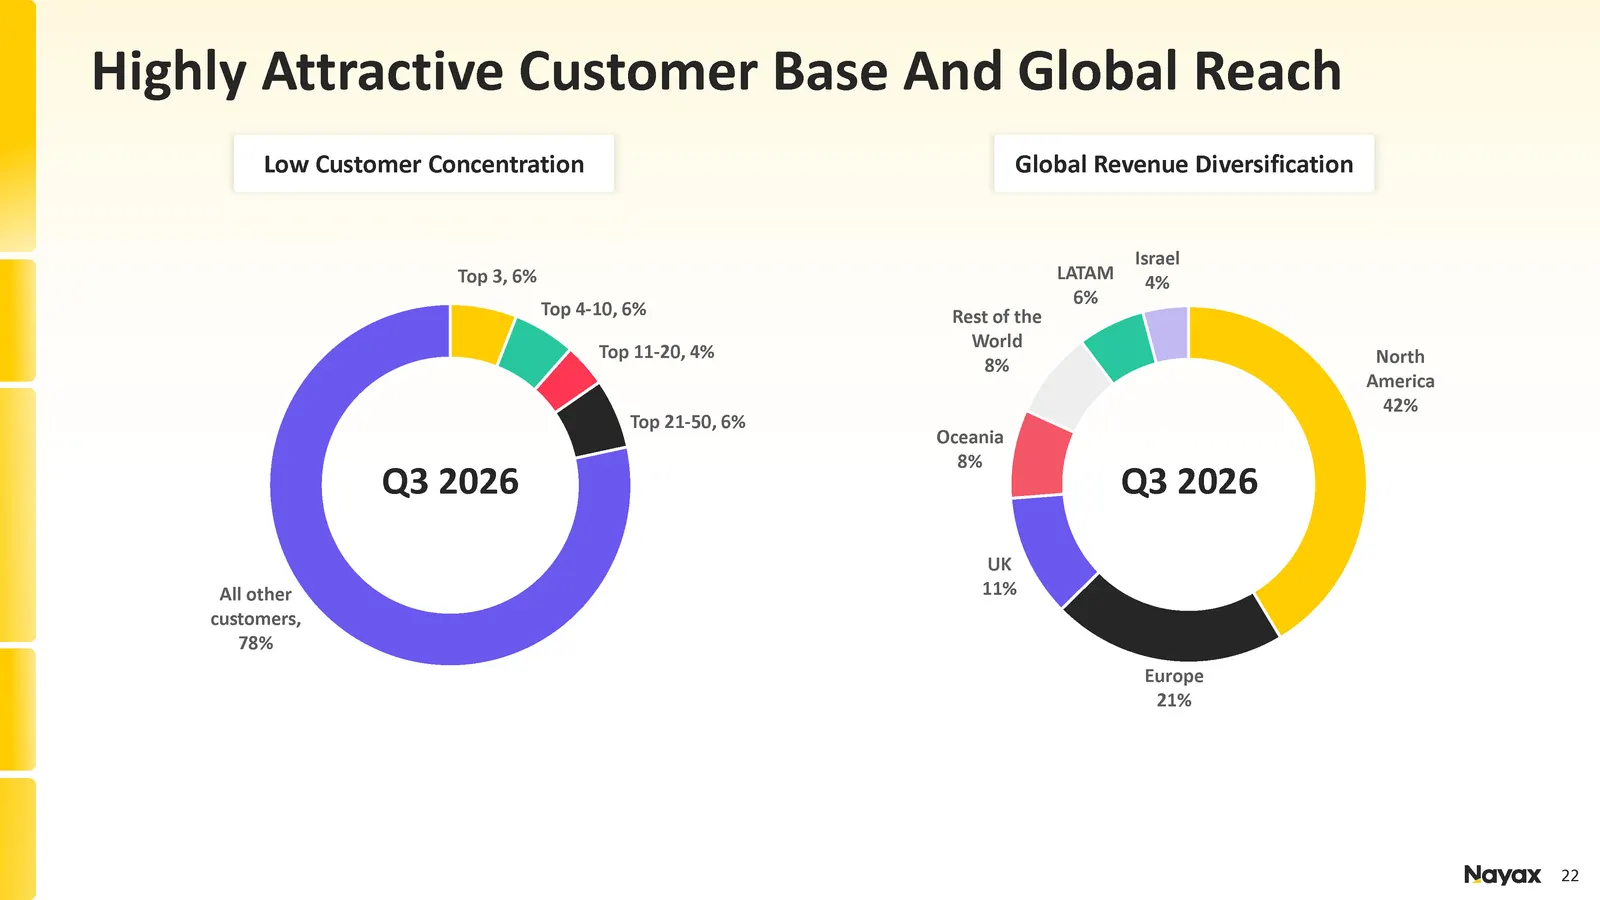
22 North America 42 % Europe 21 % UK 11% Oceania 8% Rest of the World 8 % LATAM 6% Israel 4 % Top 3 , 6% Top 4 - 10 , 6 % Top 11 - 20 , 4 % Top 21 - 50 , 6% All other customers , 78% Highly Attractive Customer Base And Global Reach Low Customer Concentration Global Revenue Diversification Q3 2026 Q
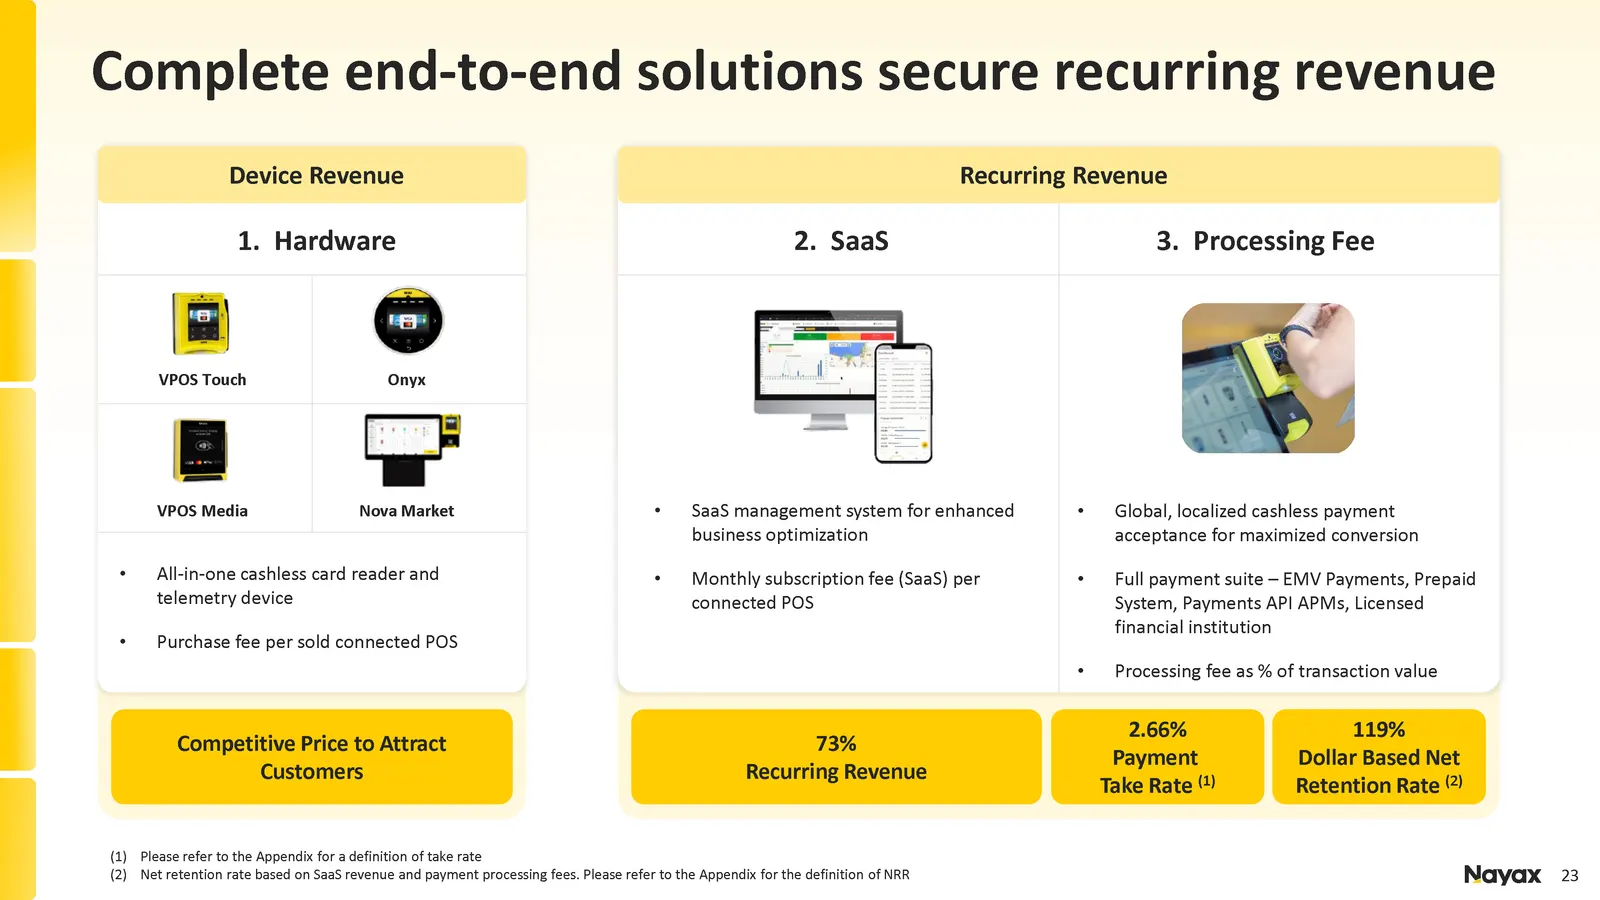
Slide 23: Complete end-to-end solutions: hardware, SaaS, processing
23 Device Revenue VPOS Touch • All - in - one cashless card reader and telemetry device • Purchase fee per sold connected POS Onyx VPOS Media Nova Market Competitive Price to Attract Customers 1 . Hardware 2. SaaS 3. Processing Fee 73 % Recurring Revenue 2.66% Payment Take Rate (1) 119 % Dollar Base
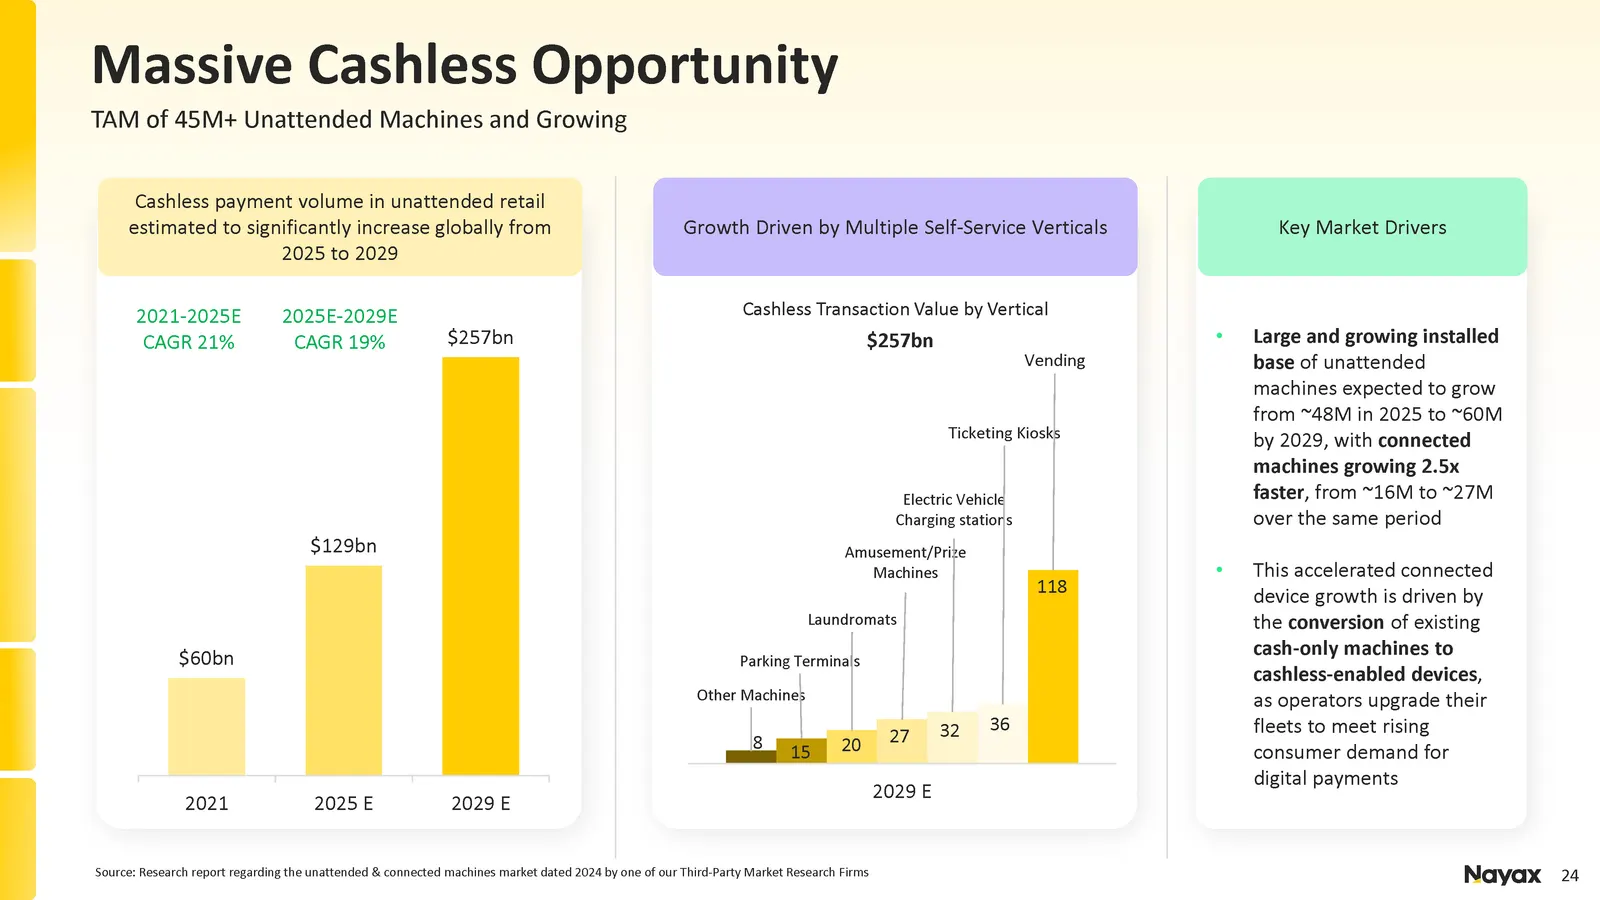
Slide 24: Key Market Drivers
24 Key Market Drivers Growth Driven by Multiple Self - Service Verticals Source: Research report regarding the unattended & connected machines market dated 2024 by one of our Third - Party Market Research Firms Cashless Transaction Value by Vertical • Large and growing installed base of unattended m
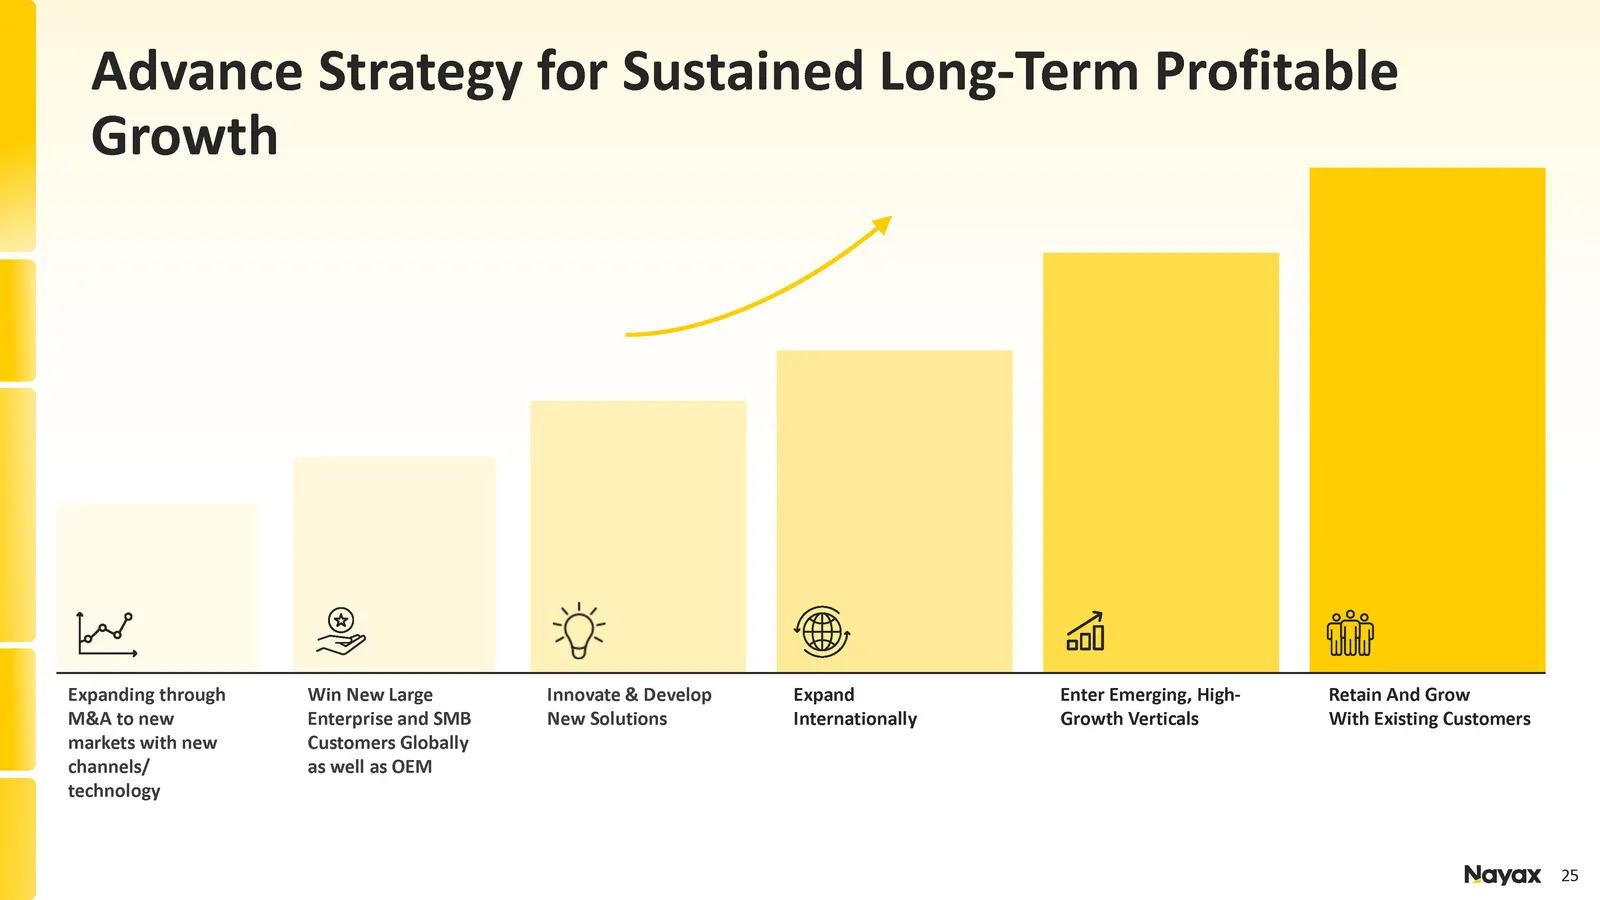
Slide 25: Strategy for Sustained Long-Term Profitable Growth
25 Expand Internationally Enter Emerging, High - Growth Verticals Retain And Grow With Existing Customers Innovate & Develop New Solutions Win New Large Enterprise and SMB Customers Globally as well as OEM Expanding through M&A to new markets with new channels/ technology Advance Strategy for Sustai
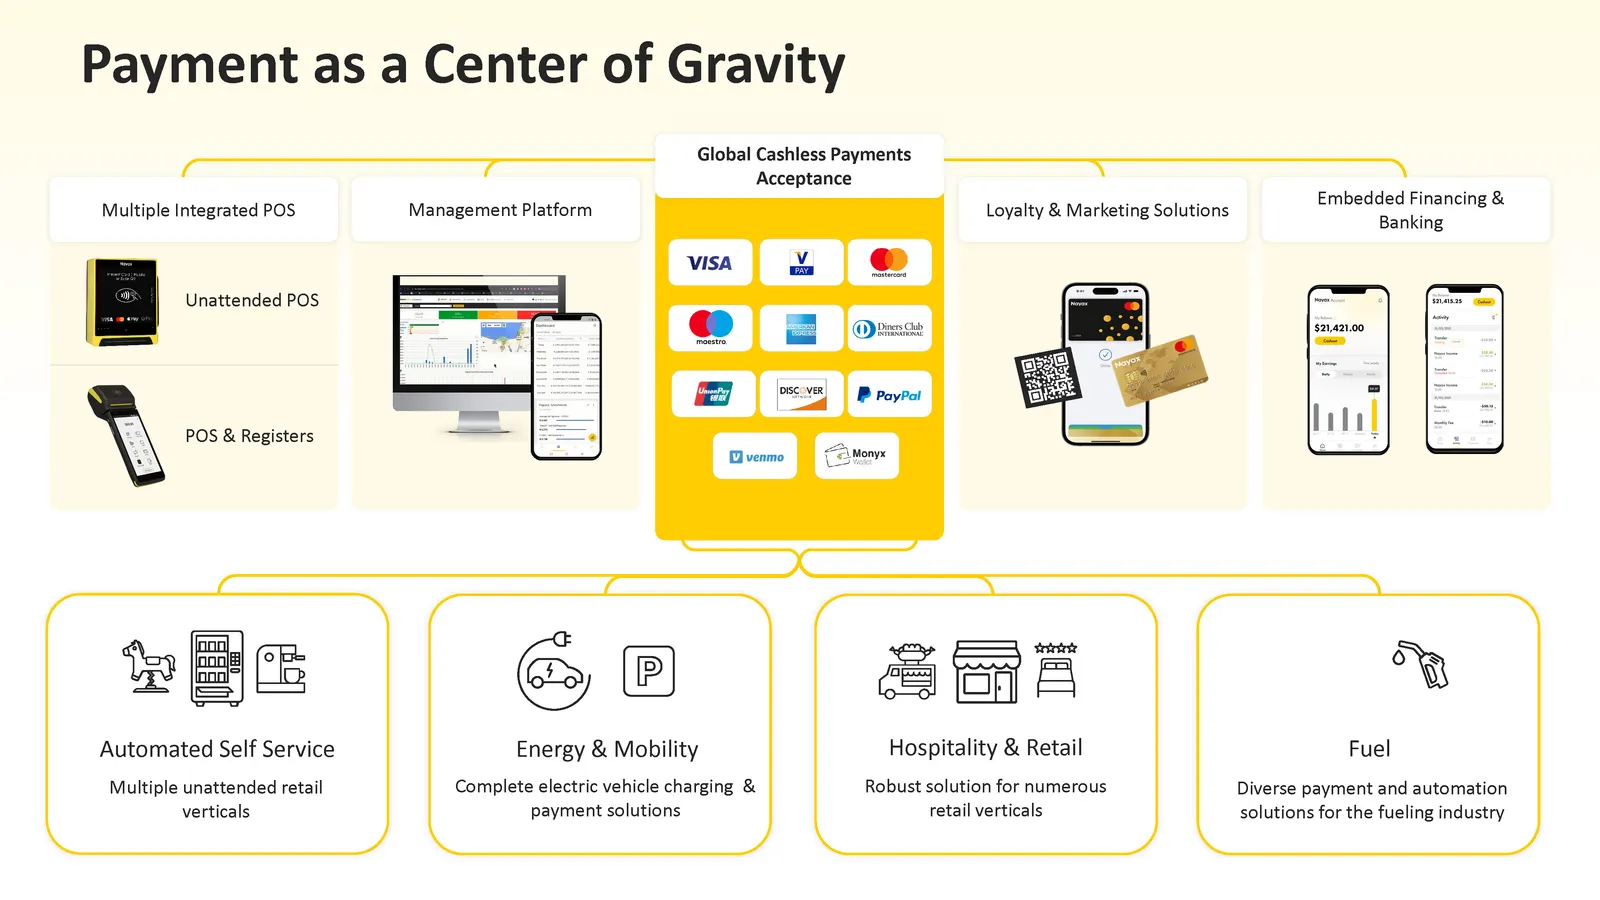
Slide 26: Payment as a Center of Gravity
26 Payment as a Center of Gravity Global Cashless Payments Acceptance Multiple Integrated POS Unattended POS POS & Registers Management Platform Loyalty & Marketing Solutions Embedded Financing & Banking Multiple unattended retail verticals Automated Self Service Hospitality & Retail Robust solution
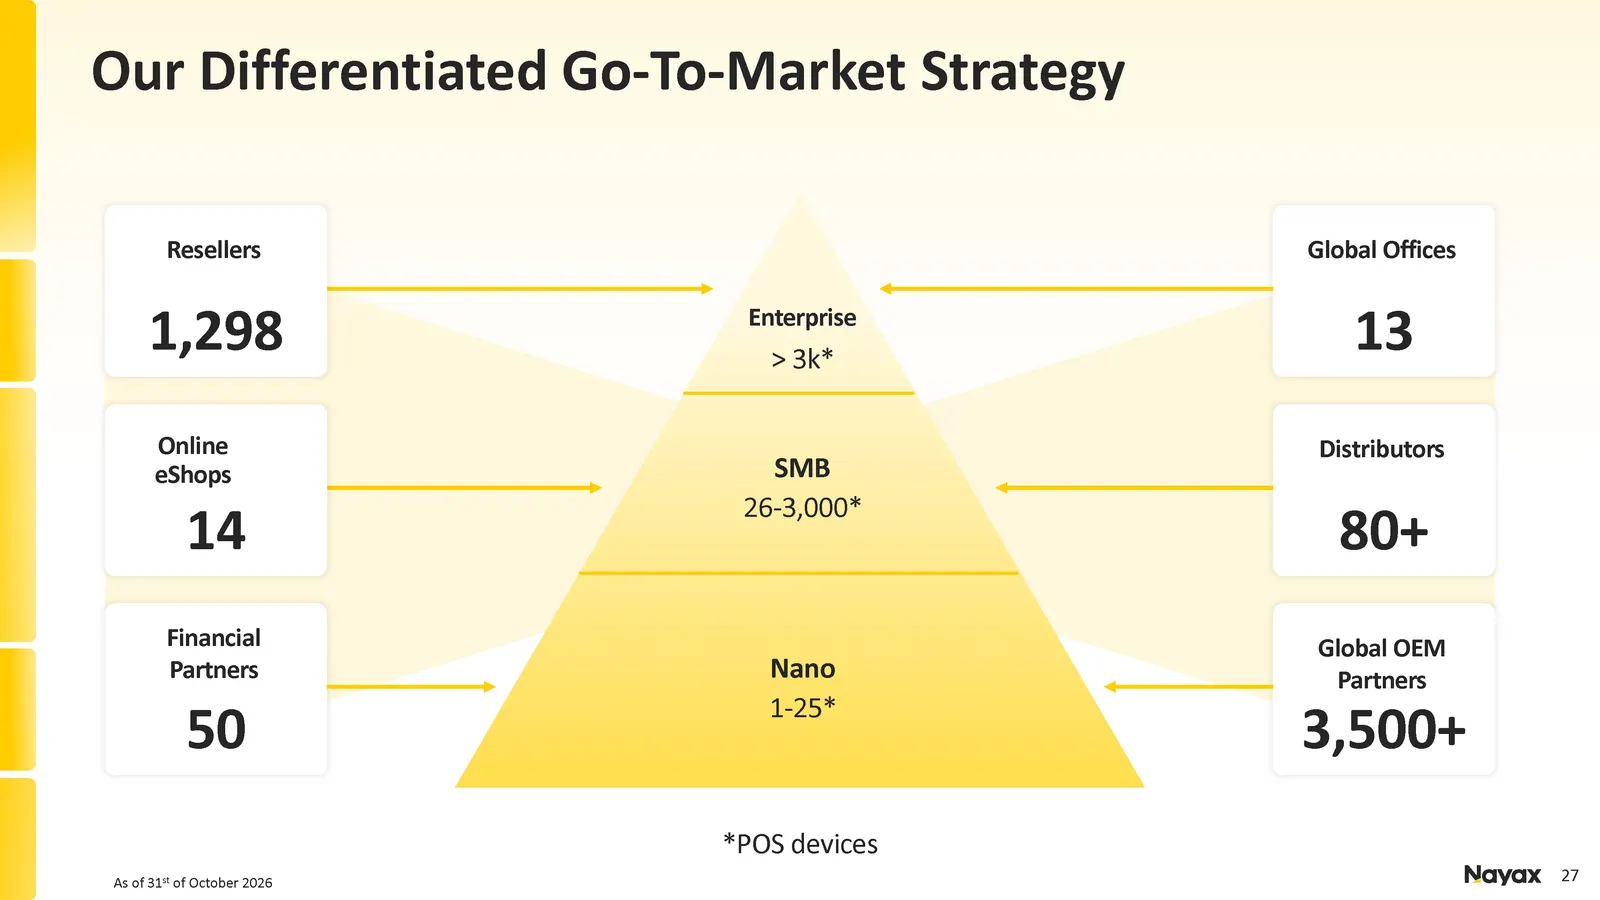
Slide 27: Our Differentiated Go-To-Market Strategy
27 Global Offices 13 *POS devices Distributors 80 + Global OEM Partners 3,500 + Resellers 1,298 Online e Shops 14 Financial Partners 50 Nano 1 - 25 * SMB 26 - 3,000 * Enterprise > 3 k* As of 31 st of October 2026 Our Differentiated Go - To - Market Strategy
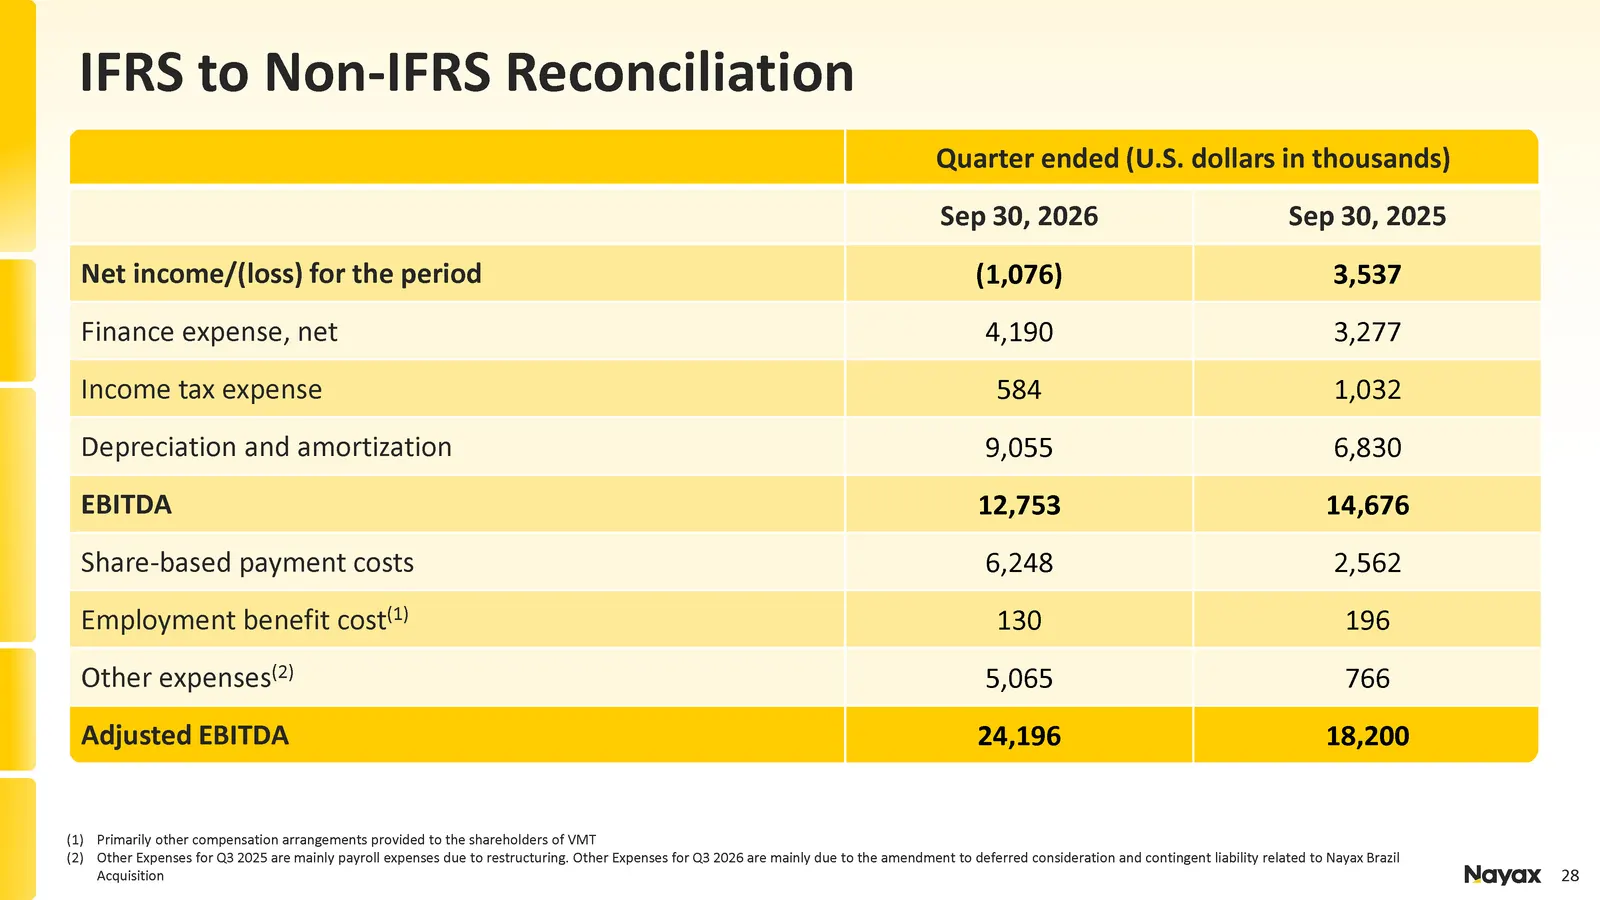
Slide 28: IFRS to Non-IFRS Reconciliation
28 IFRS to Non - IFRS Reconciliation (1) Primarily other compensation arrangements provided to the shareholders of VMT (2) Other Expenses for Q3 2025 are mainly payroll expenses due to restructuring. Other Expenses for Q3 2026 are mainly due to the am endment to deferred consideration and contingent
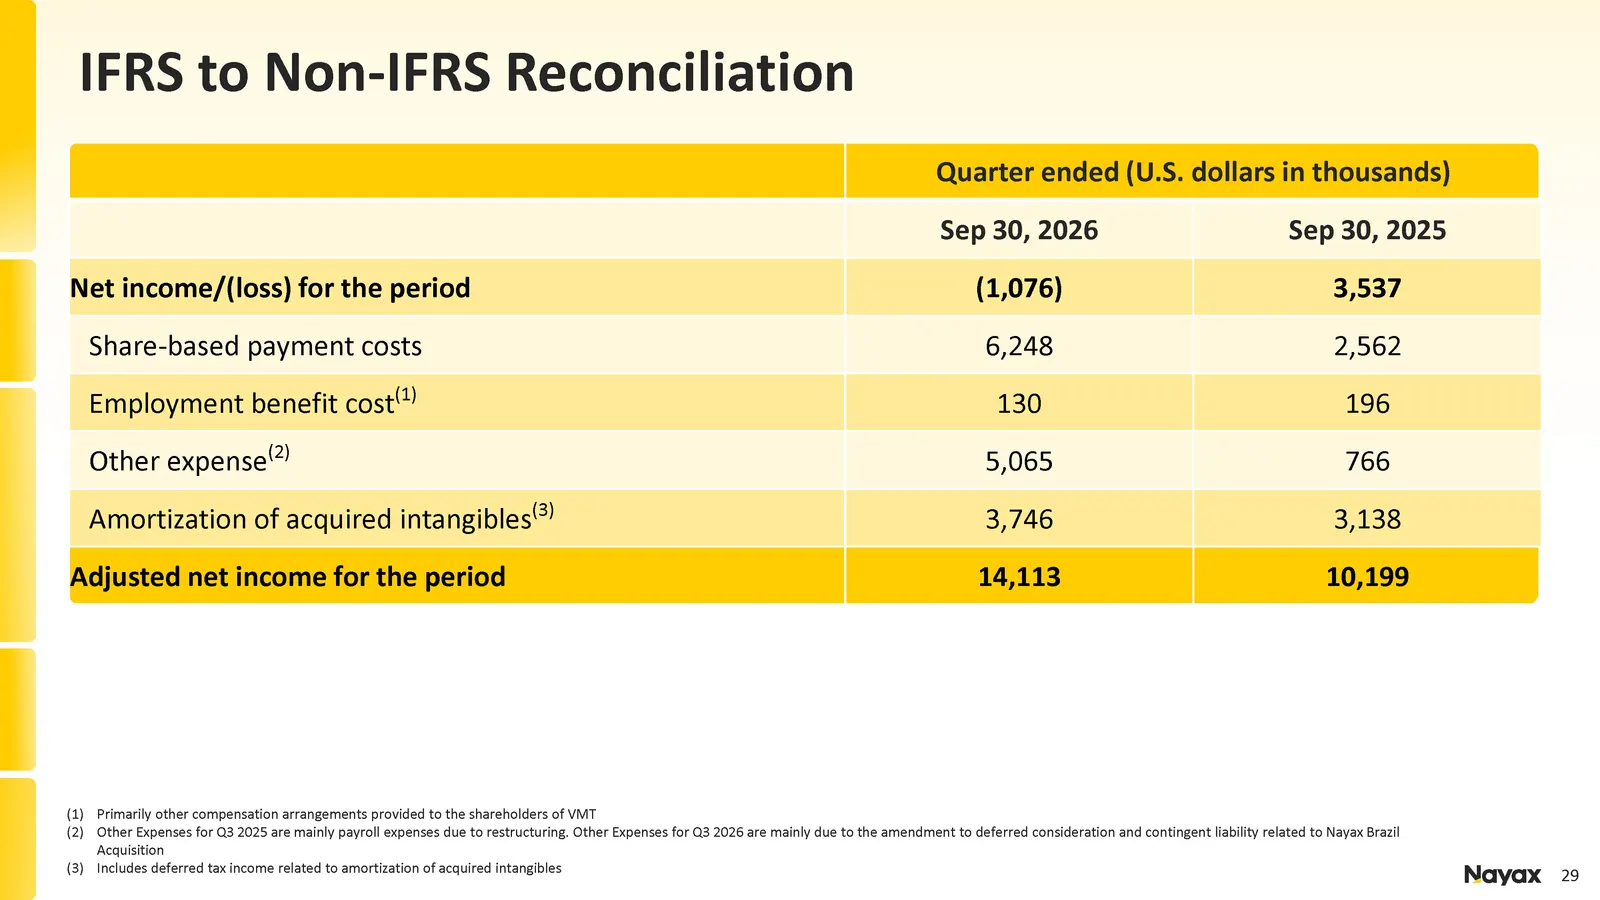
Slide 29: IFRS to Non-IFRS Reconciliation
29 IFRS to Non - IFRS Reconciliation Quarter ended (U.S. dollars in thousands) Sep 30, 2025 Sep 30, 2026 3,537 (1,076) Net income/(loss) for the period 2,562 6,248 Share - based payment costs 196 130 Employment benefit cost (1) 766 5,065 Other expense (2) 3,138 3,746 Amortization of acquired intang
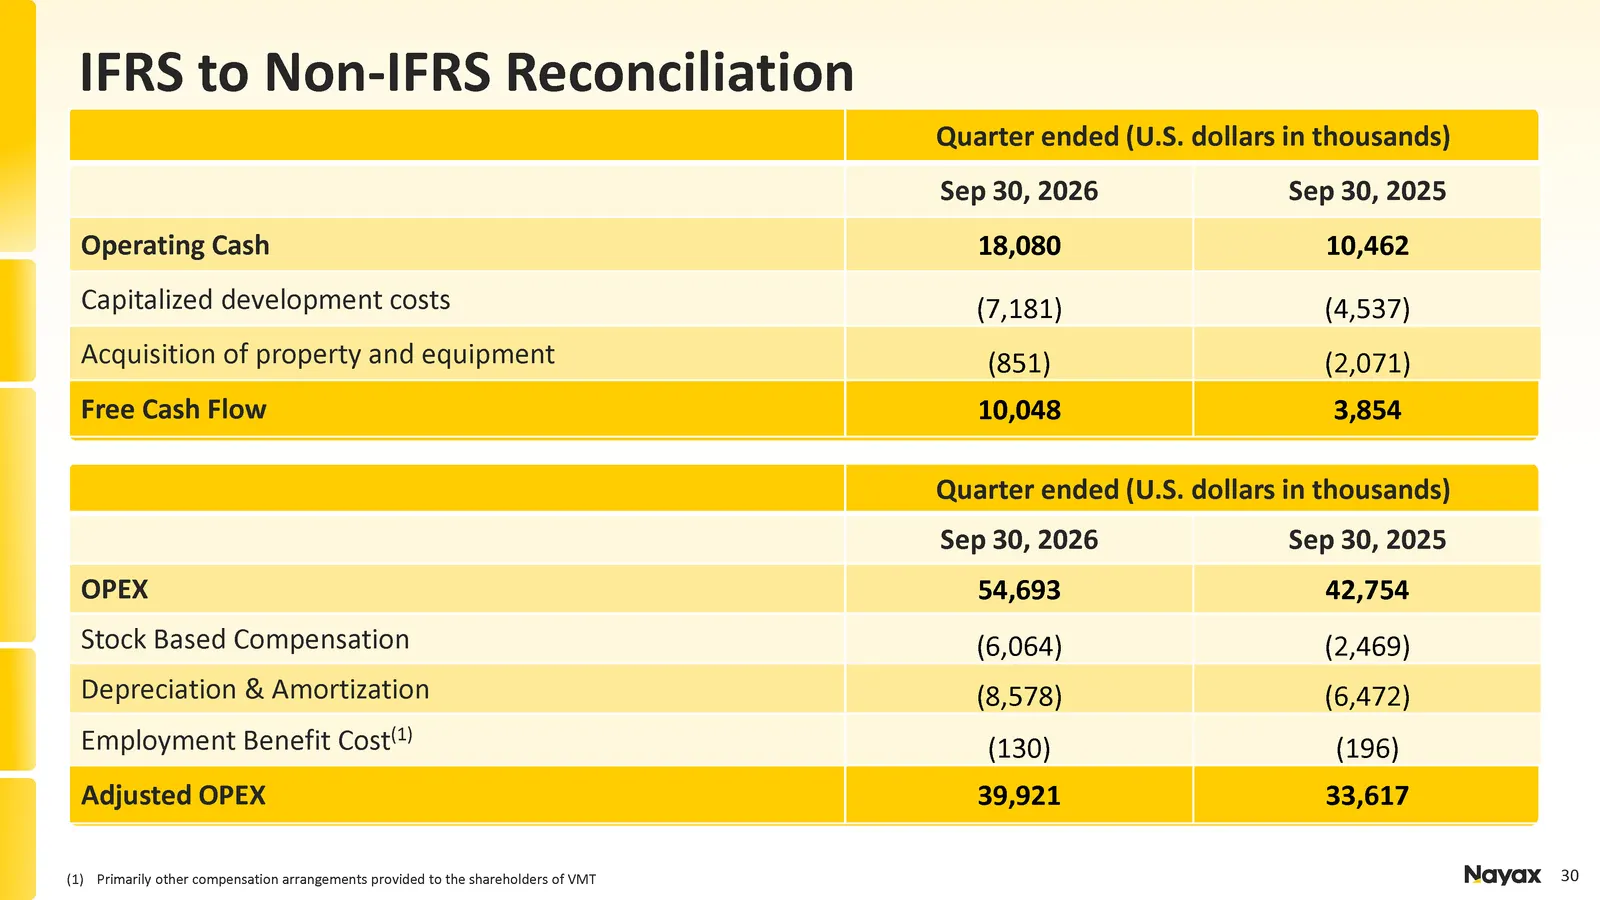
Slide 30: IFRS to Non-IFRS Reconciliation
30 Quarter ended (U.S. dollars in thousands) Sep 30, 2025 Sep 30, 2026 42,754 54,693 OPEX (2,469) (6,064) Stock Based Compensation (6,472) (8,578) Depreciation & Amortization (196) (130) Employment Benefit Cost (1) 33,617 39,921 Adjusted OPEX IFRS to Non - IFRS Reconciliation Quarter ended (U.S. do
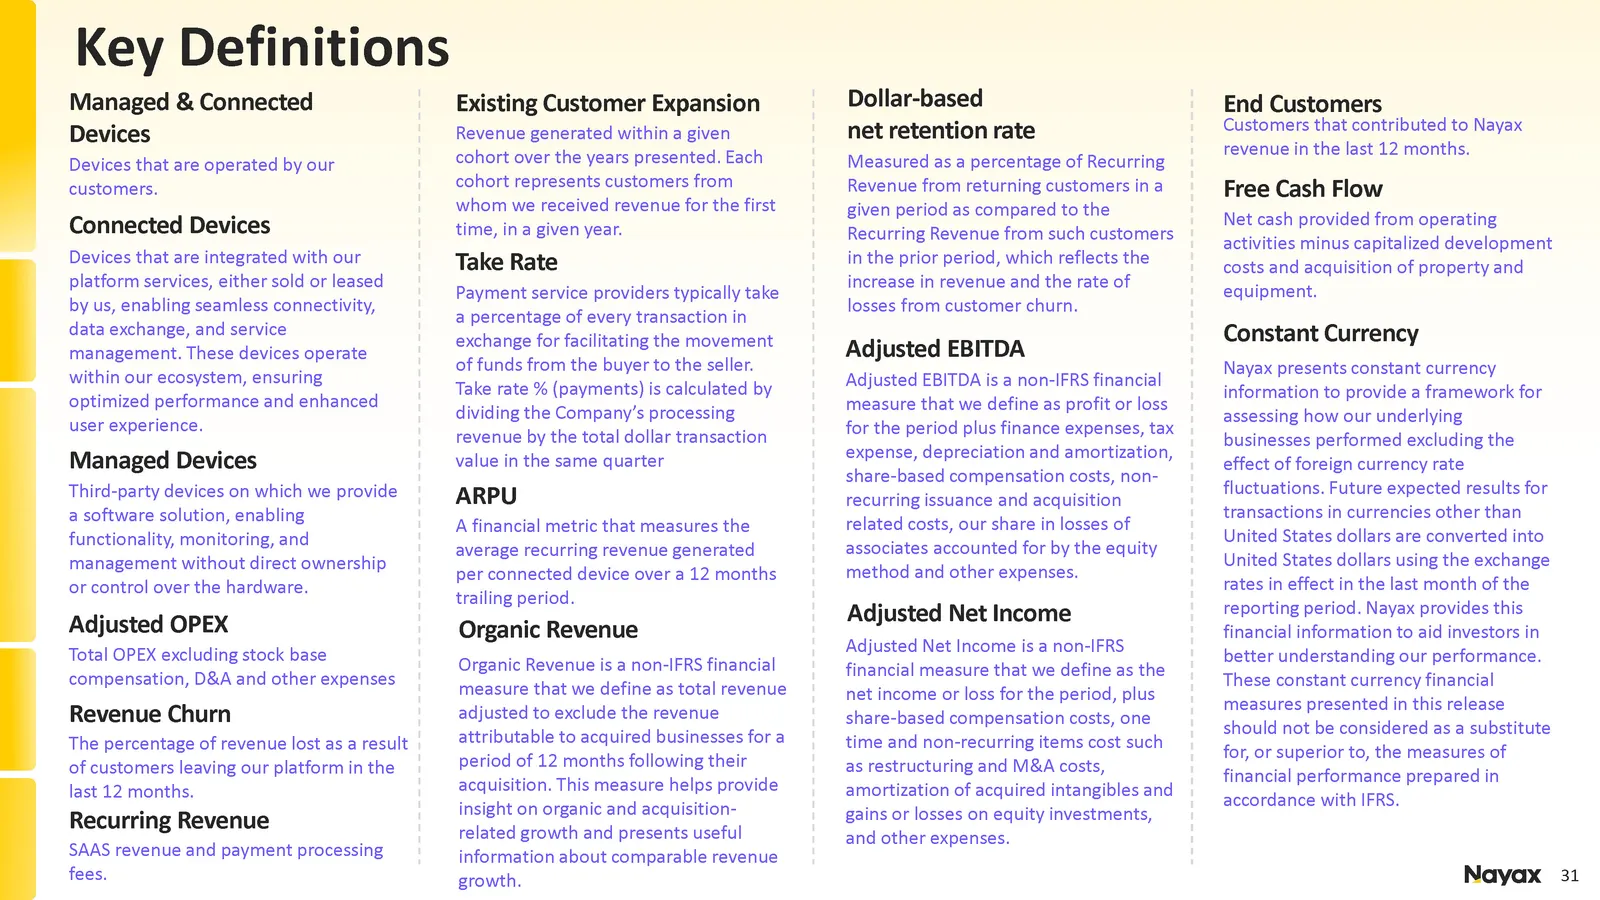
Slide 31: Key Definitions
31 Key Definitions Measured as a percentage of Recurring Revenue from returning customers in a given period as compared to the Recurring Revenue from such customers in the prior period, which reflects the increase in revenue and the rate of losses from customer churn. Dollar - based net retention ra

Slide 32: Today's Speakers and IR Contact
32 Full Name Position Today’s Speakers Full Name Position Aaron Greenberg Chief Strategy Officer ir@nayax.com IR Contact Thank You! ir.nayax.com Website
Source: SEC EDGAR · 6-K filed Nov 12, 2026
More decks from Nayax Ltd.
 Merger or Acquisition (August 2026)14 slides · Aug 25, 2026
 Q2 2026 Earnings Presentation32 slides · Aug 10, 2026
 Q1 2026 Earnings Presentation26 slides · May 12, 2026
 Q4 2025 Earnings Presentation42 slides · Mar 9, 2026
 Q3 2025 Earnings Presentation27 slides · Nov 19, 2025
 Q2 2025 Earnings Presentation27 slides · Aug 13, 2025