American Airlines Group, Inc. · NASDAQ:AAL
American Airlines — Q2 2021 Earnings Presentation
12 slides from American Airlines's earnings presentation, Jul 22, 2021
Slide 1: Investor Presentation Second Quarter 2023
Investor Presentation Second Quarter 2023
Slide 2: Information Related to Forward-Looking Statements
Information Related to Forward-Looking Statements Statements concerning interest rates, portfolio allocation, financing costs, portfolio hedging, prepayments, dividends, book value, utilization of loss carryforwards, any change in long-term tax structures (including any REIT election), use of equity
Slide 3: Q2 2023 Financial Highlights
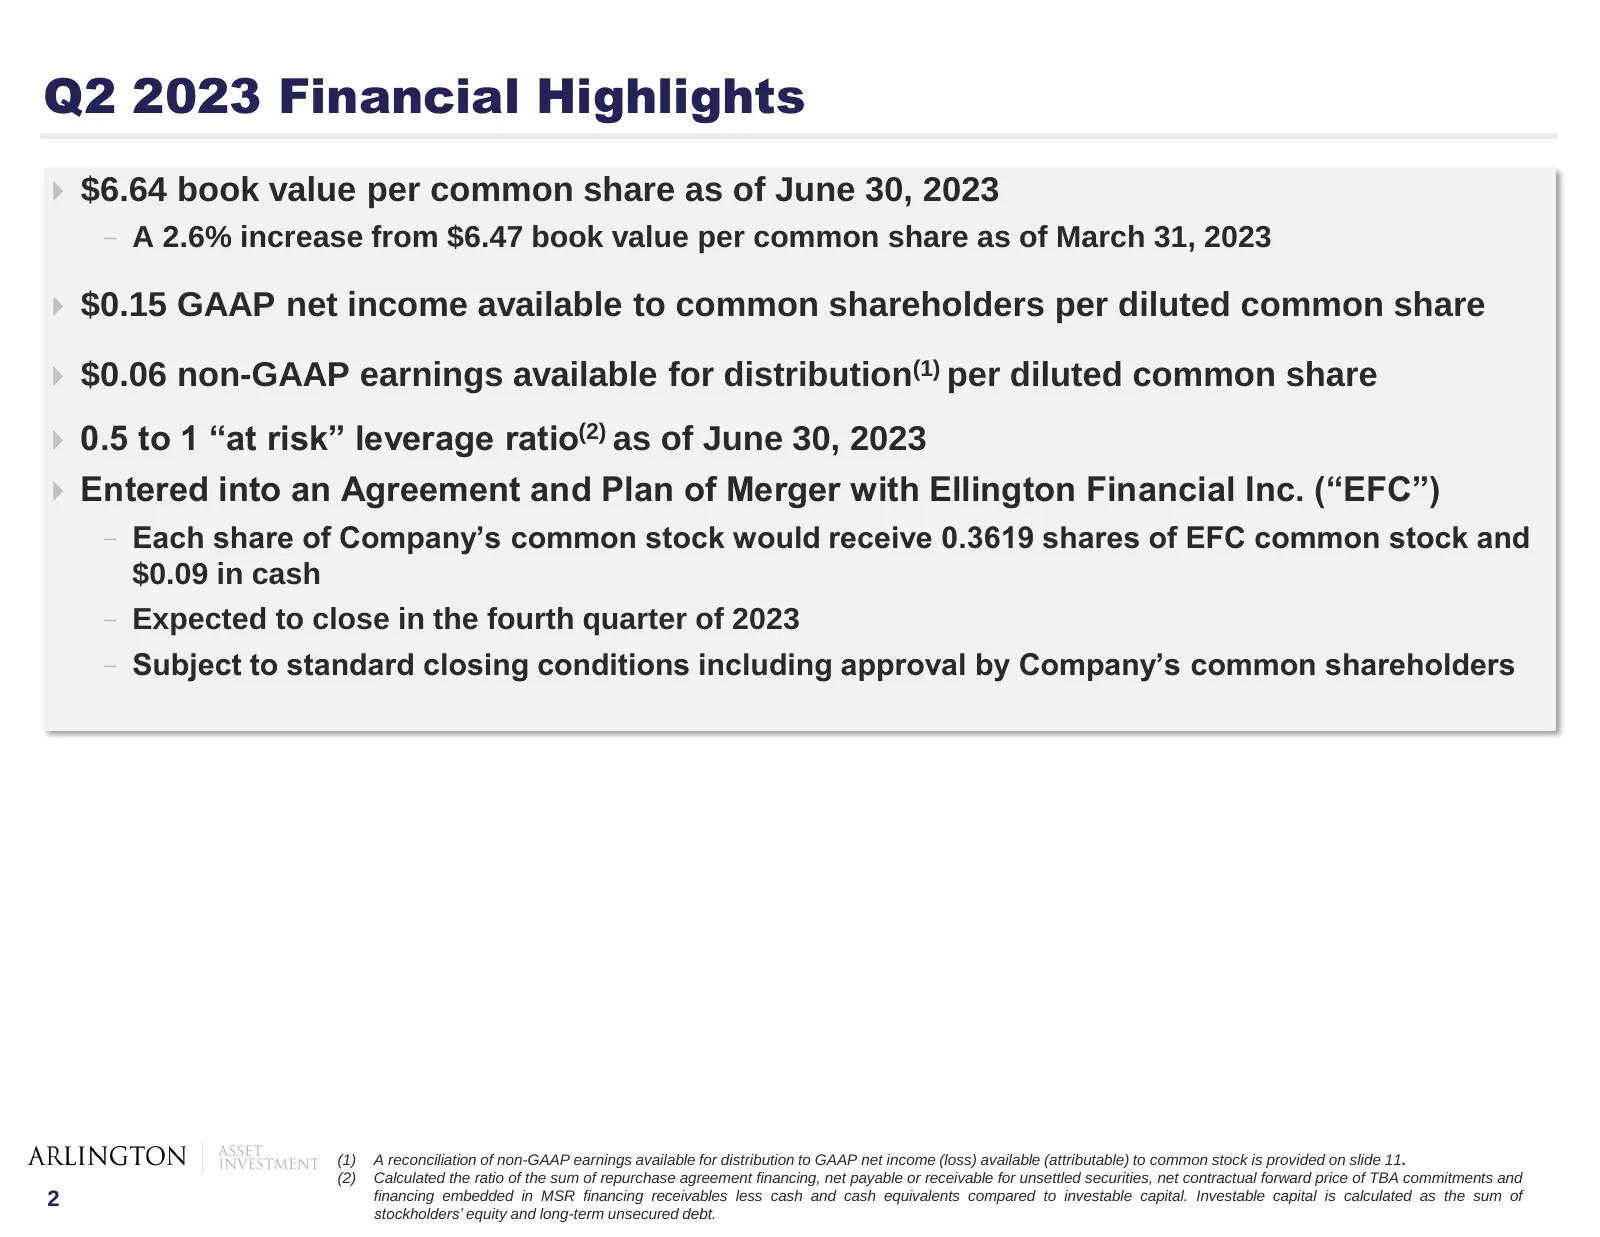
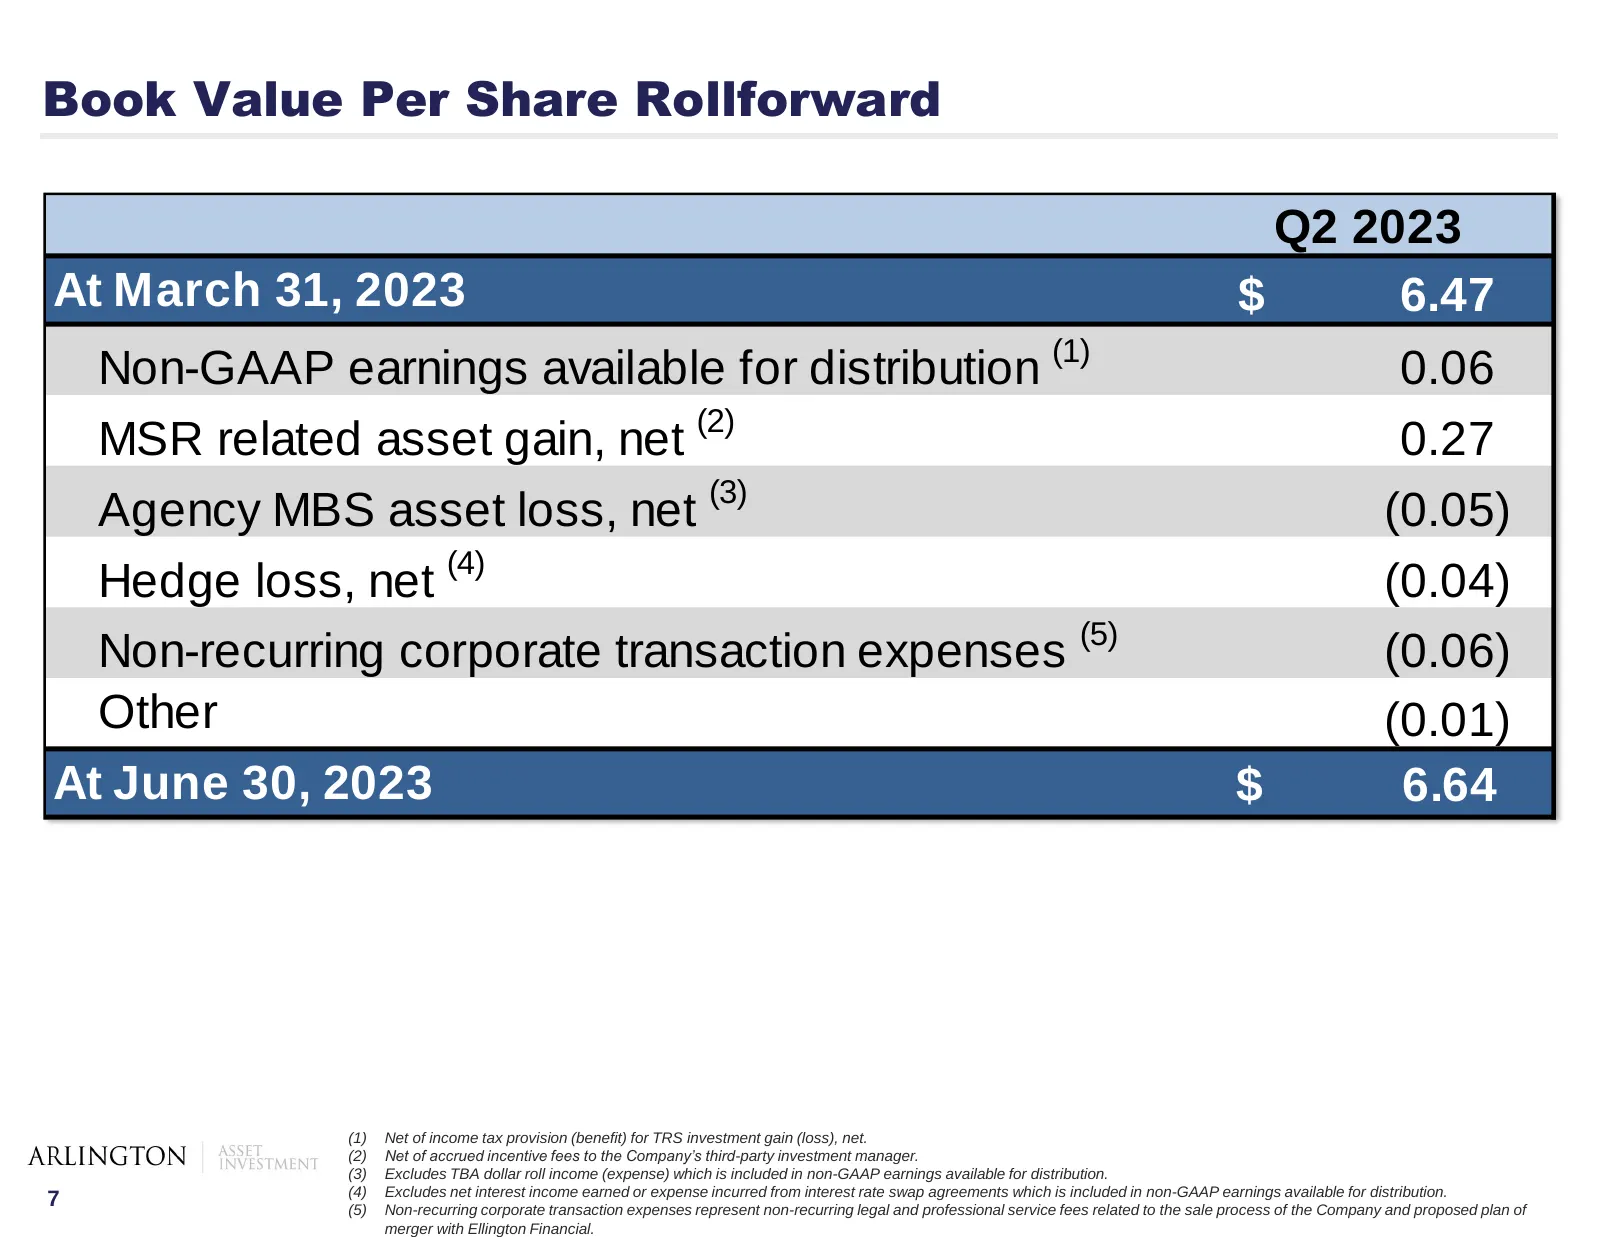
Q2 2023 Financial Highlights $6.64 book value per common share as of June 30, 2023 - A 2.6% increase from $6.47 book value per common share as of March 31, 2023 $0.15 GAAP net income available to common shareholders per diluted common share $0.06 non-GAAP earnings available for distribution(1)
Slide 4: Investment Portfolio Allocation as of June 30, 2023
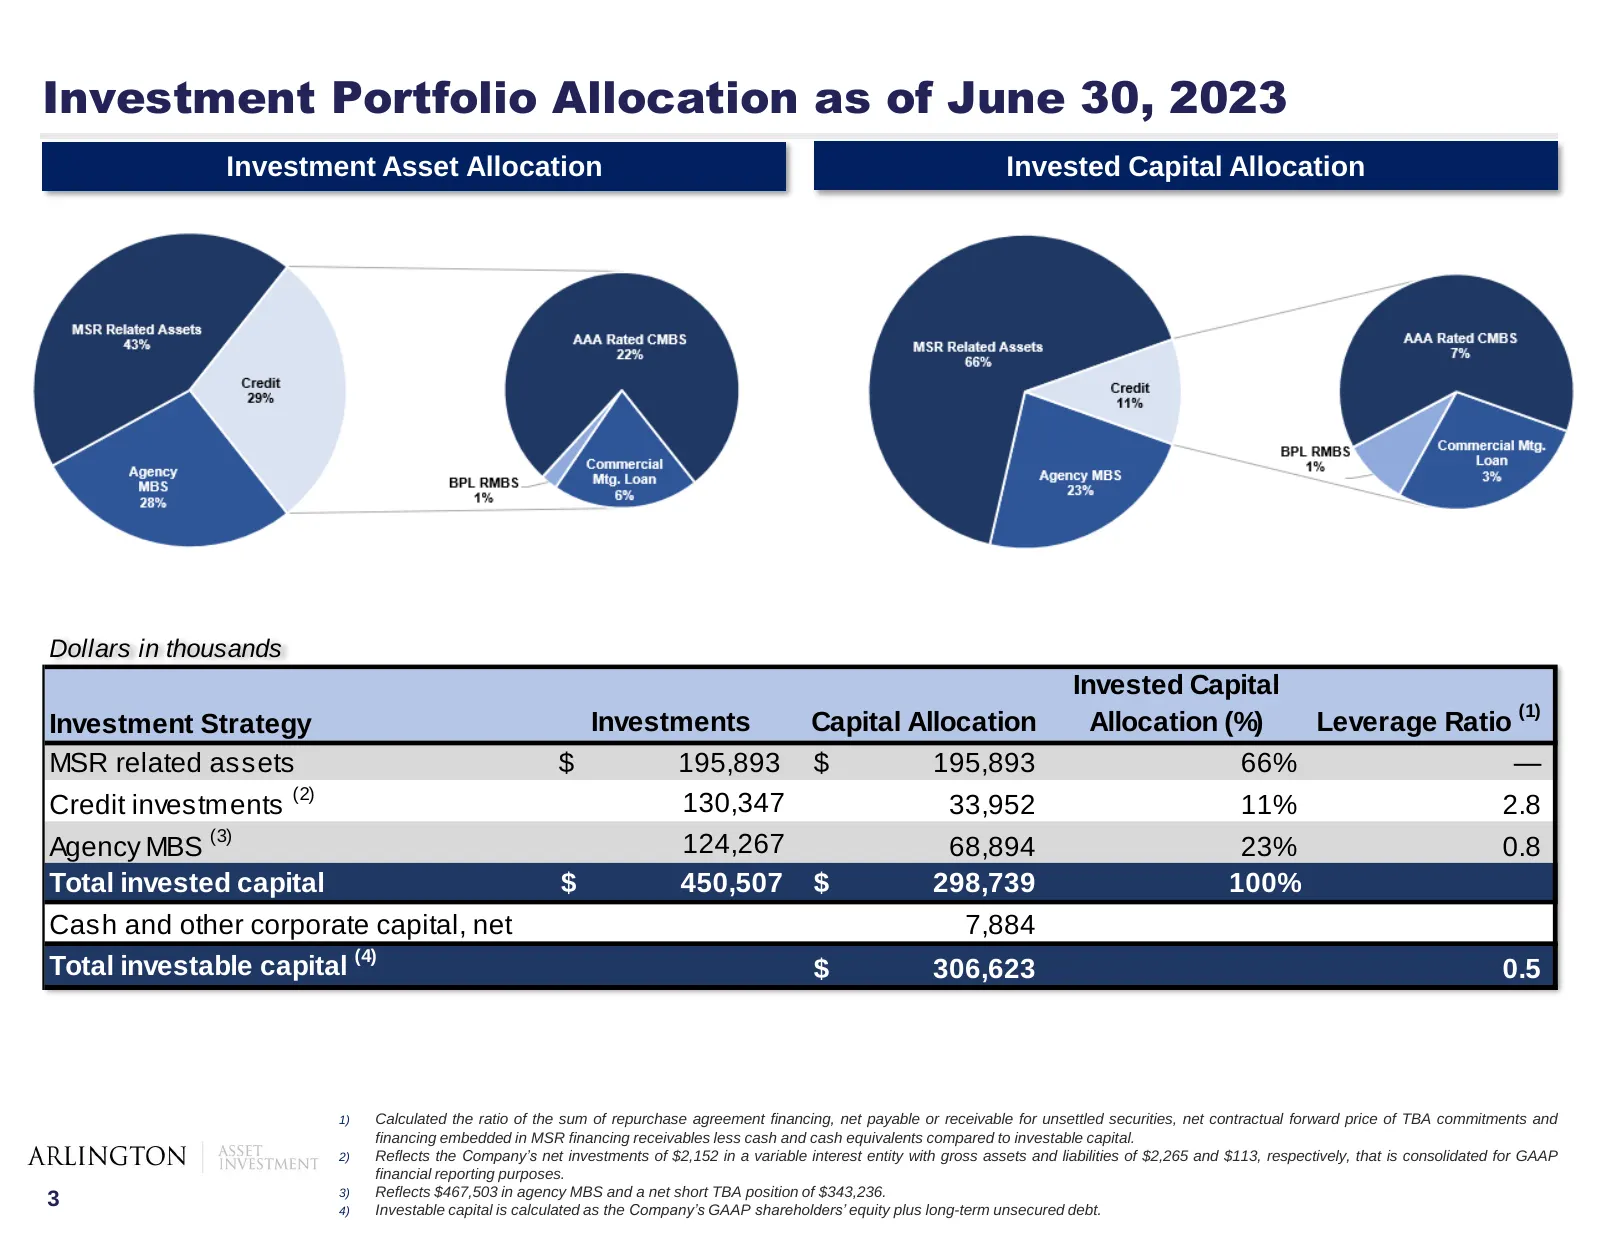
Investment Portfolio Allocation as of June 30, 2023 Investment Asset Allocation Invested Capital Allocation Dollars in thousands Invested Capital (1) Investment Strategy Investments Capital Allocation Allocation (%) Leverage Ratio MSR related assets $ 195,893 $ 195,893 66% — Credit investments (2) 1
Slide 5: MSR Related Assets
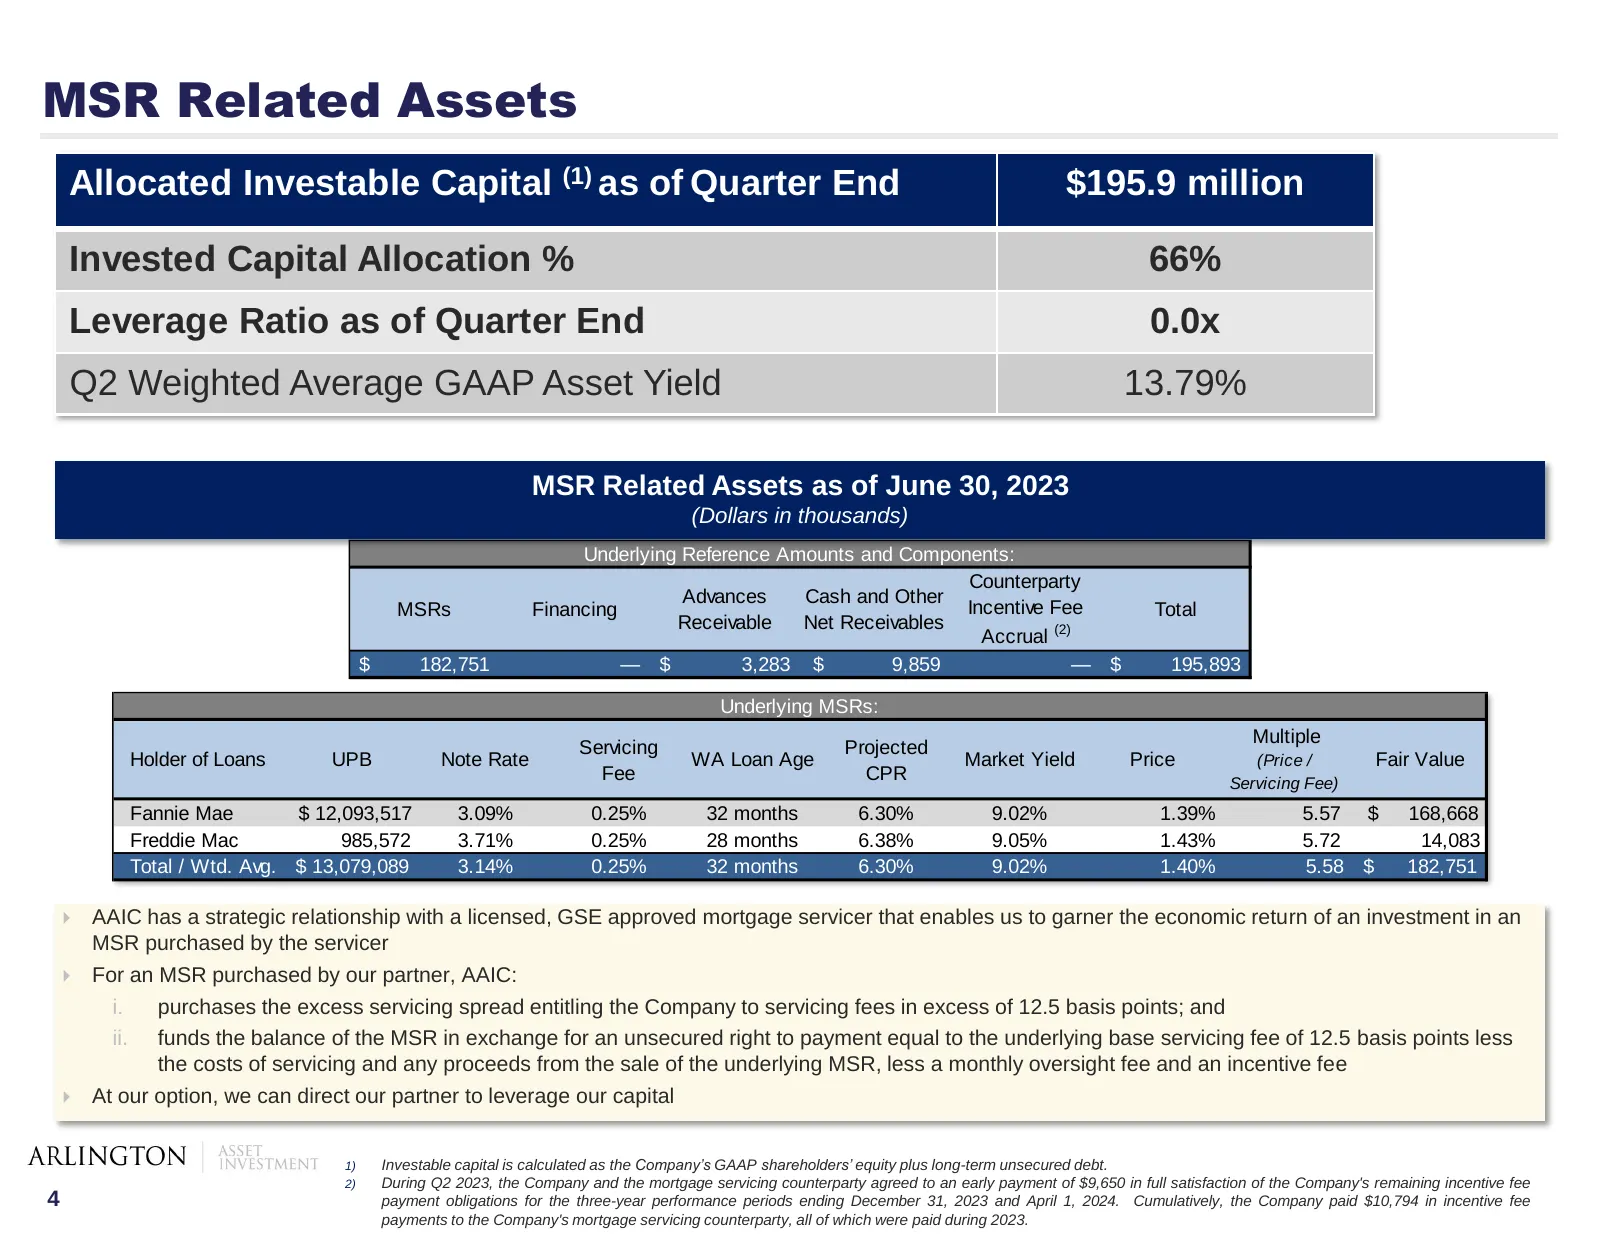
MSR Related Assets Allocated Investable Capital (1) as of Quarter End $195.9 million Invested Capital Allocation % 66% Leverage Ratio as of Quarter End 0.0x Q2 Weighted Average GAAP Asset Yield 13.79% MSR Related Assets as of June 30, 2023 (Dollars in thousands) Underlying Reference Amounts and Comp
Slide 6: Credit Investments
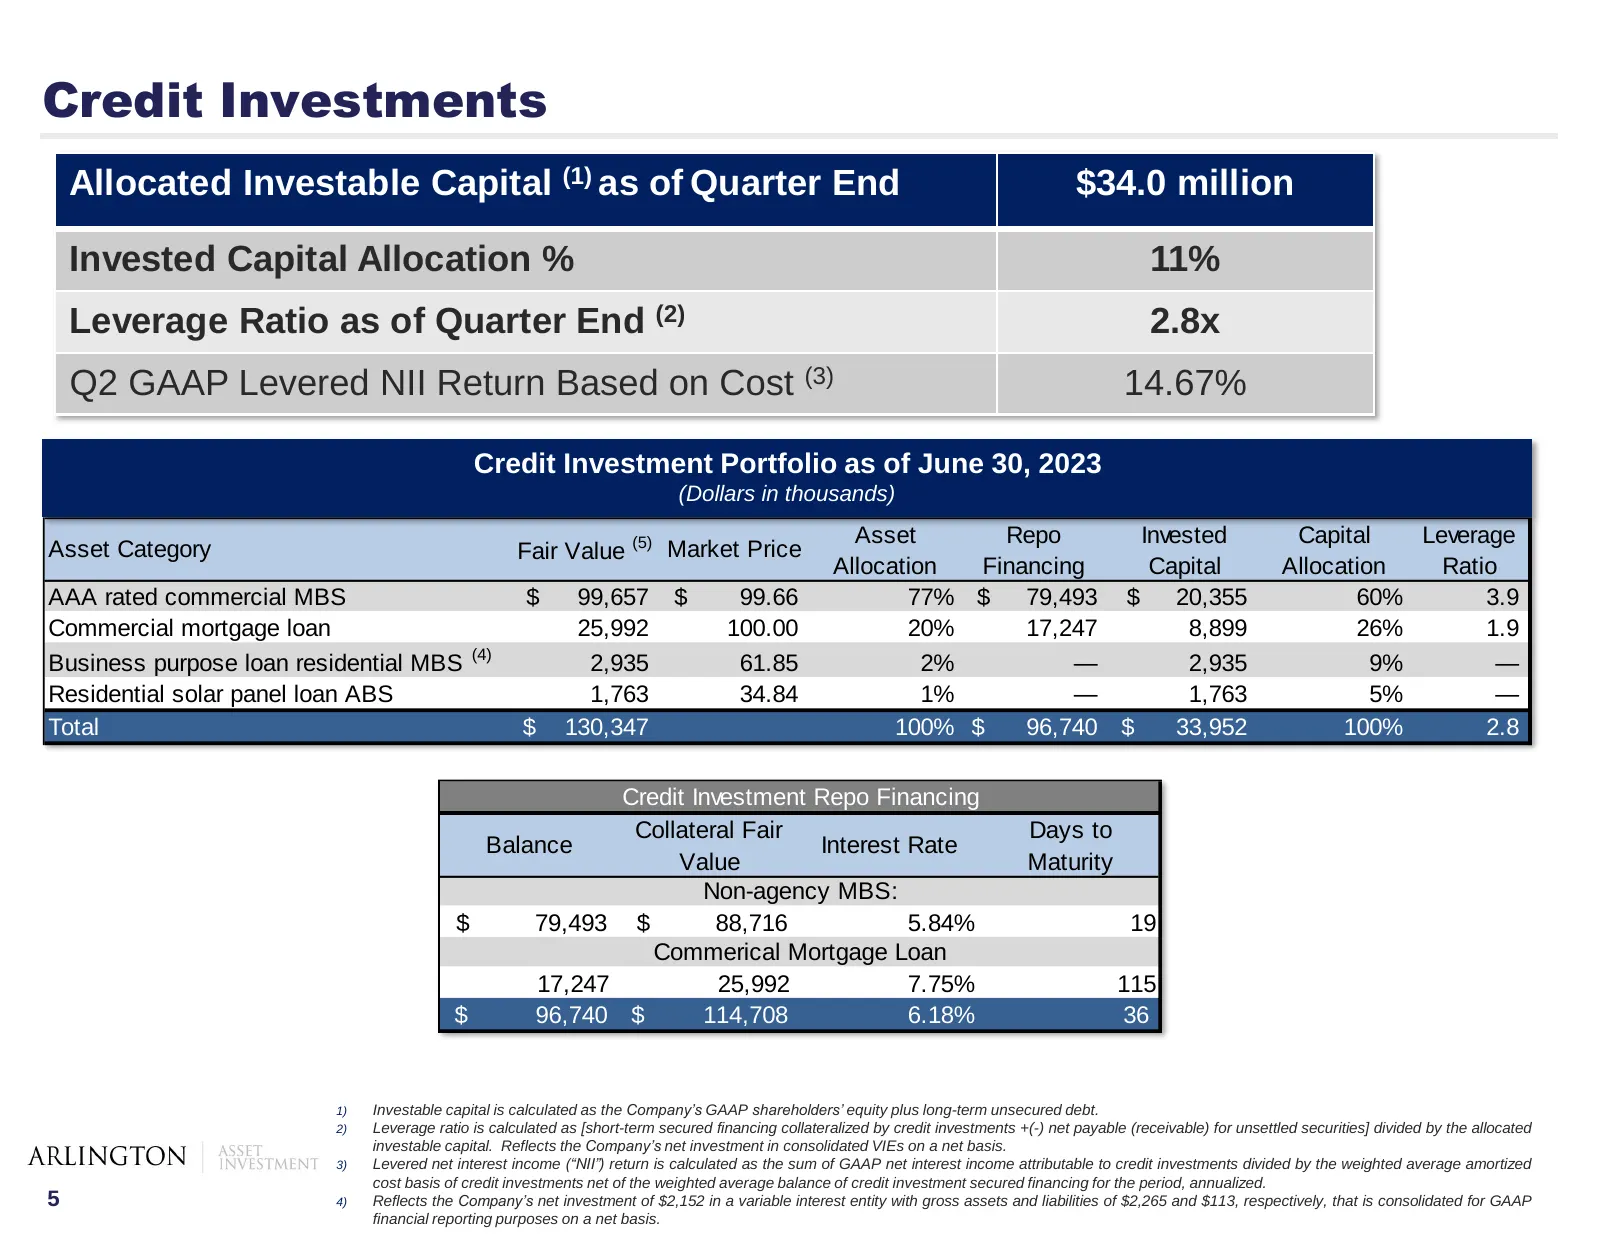
Credit Investments Allocated Investable Capital (1) as of Quarter End $34.0 million Invested Capital Allocation % 11% Leverage Ratio as of Quarter End (2) 2.8x Q2 GAAP Levered NII Return Based on Cost (3) 14.67% Credit Investment Portfolio as of June 30, 2023 (Dollars in thousands) Asset Repo Invest
Slide 7: Agency MBS Investments
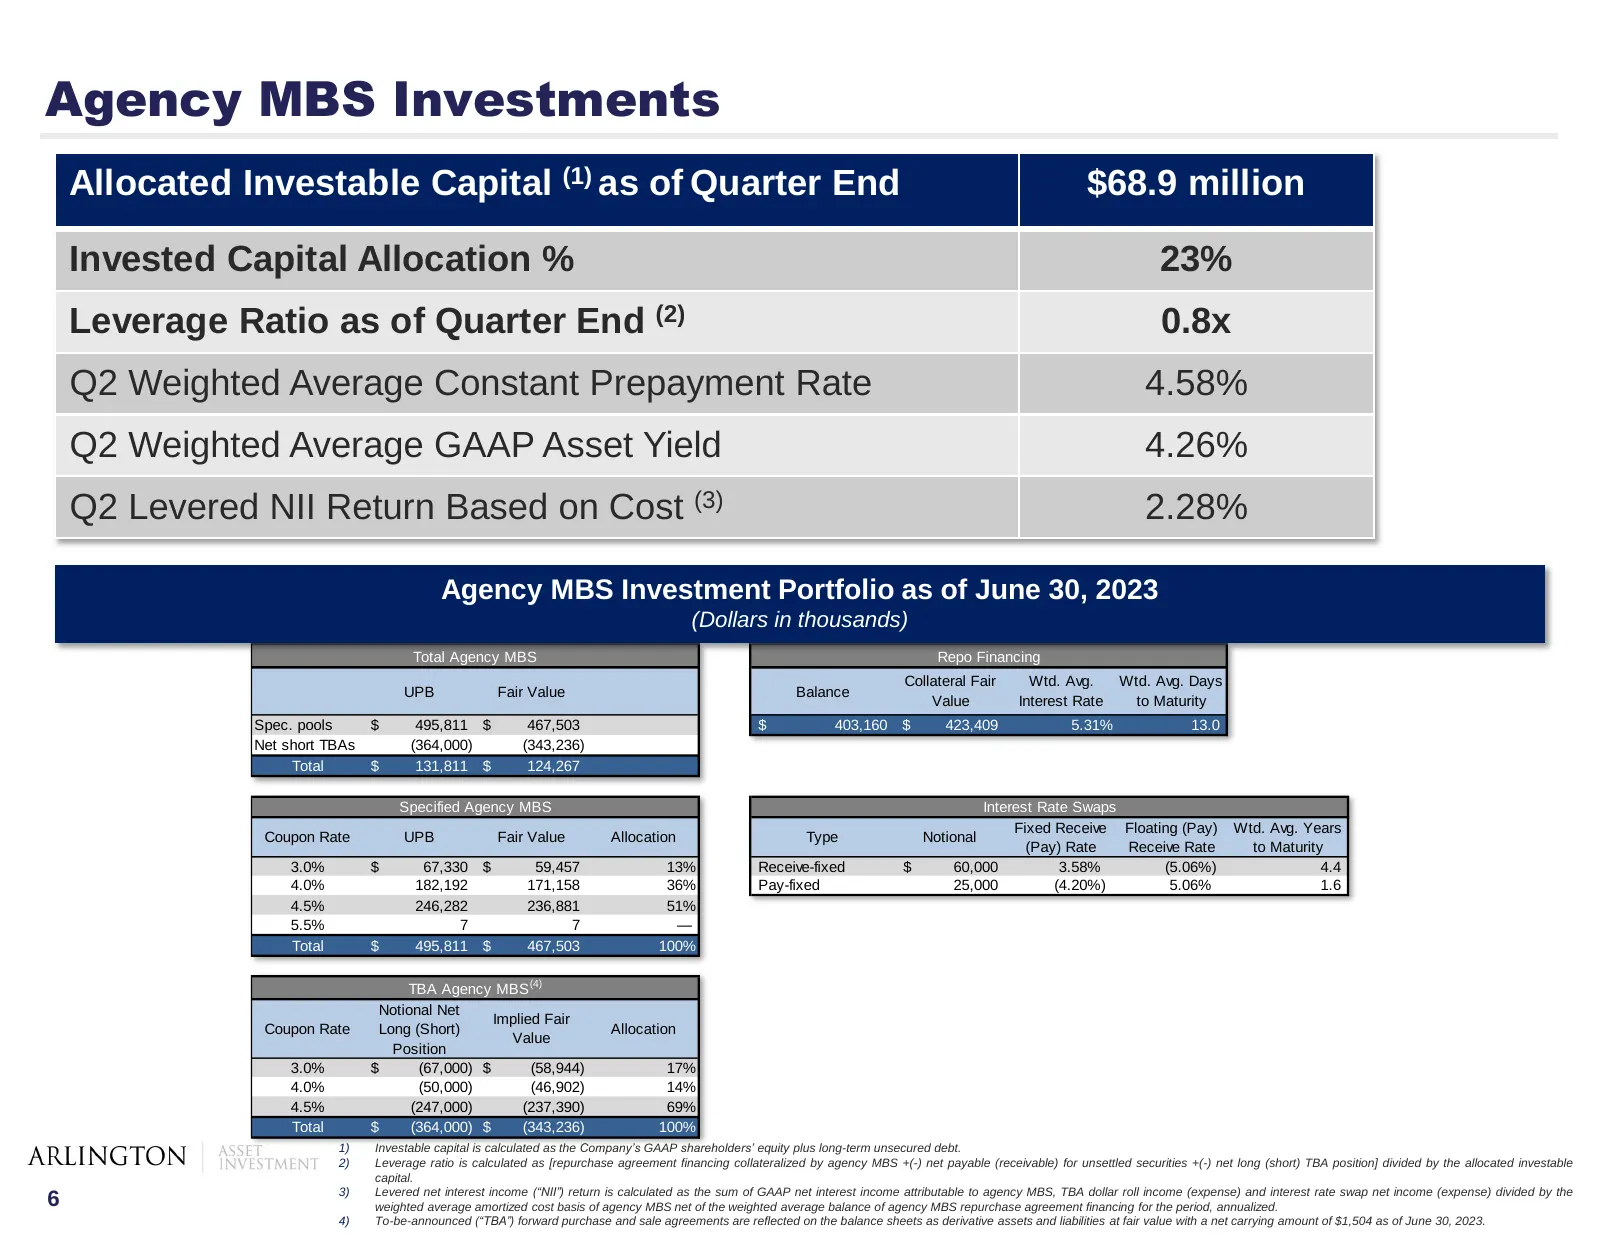
Agency MBS Investments Allocated Investable Capital (1) as of Quarter End $68.9 million Invested Capital Allocation % 23% Leverage Ratio as of Quarter End (2) 0.8x Q2 Weighted Average Constant Prepayment Rate 4.58% Q2 Weighted Average GAAP Asset Yield 4.26% Q2 Levered NII Return Based on Cost (3) 2.
Slide 8: Book Value Per Share Rollforward
Book Value Per Share Rollforward Q2 2023 At March 31, 2023 $ 6.47 Non-GAAP earnings available for distribution (1) 0.06 MSR related asset gain, net (2) 0.27 Agency MBS asset loss, net (3) (0.05) Hedge loss, net (4) (0.04) Non-recurring corporate transaction expenses (5) (0.06) Other (0.01) At June 3
Slide 9: Publicly Traded Capital
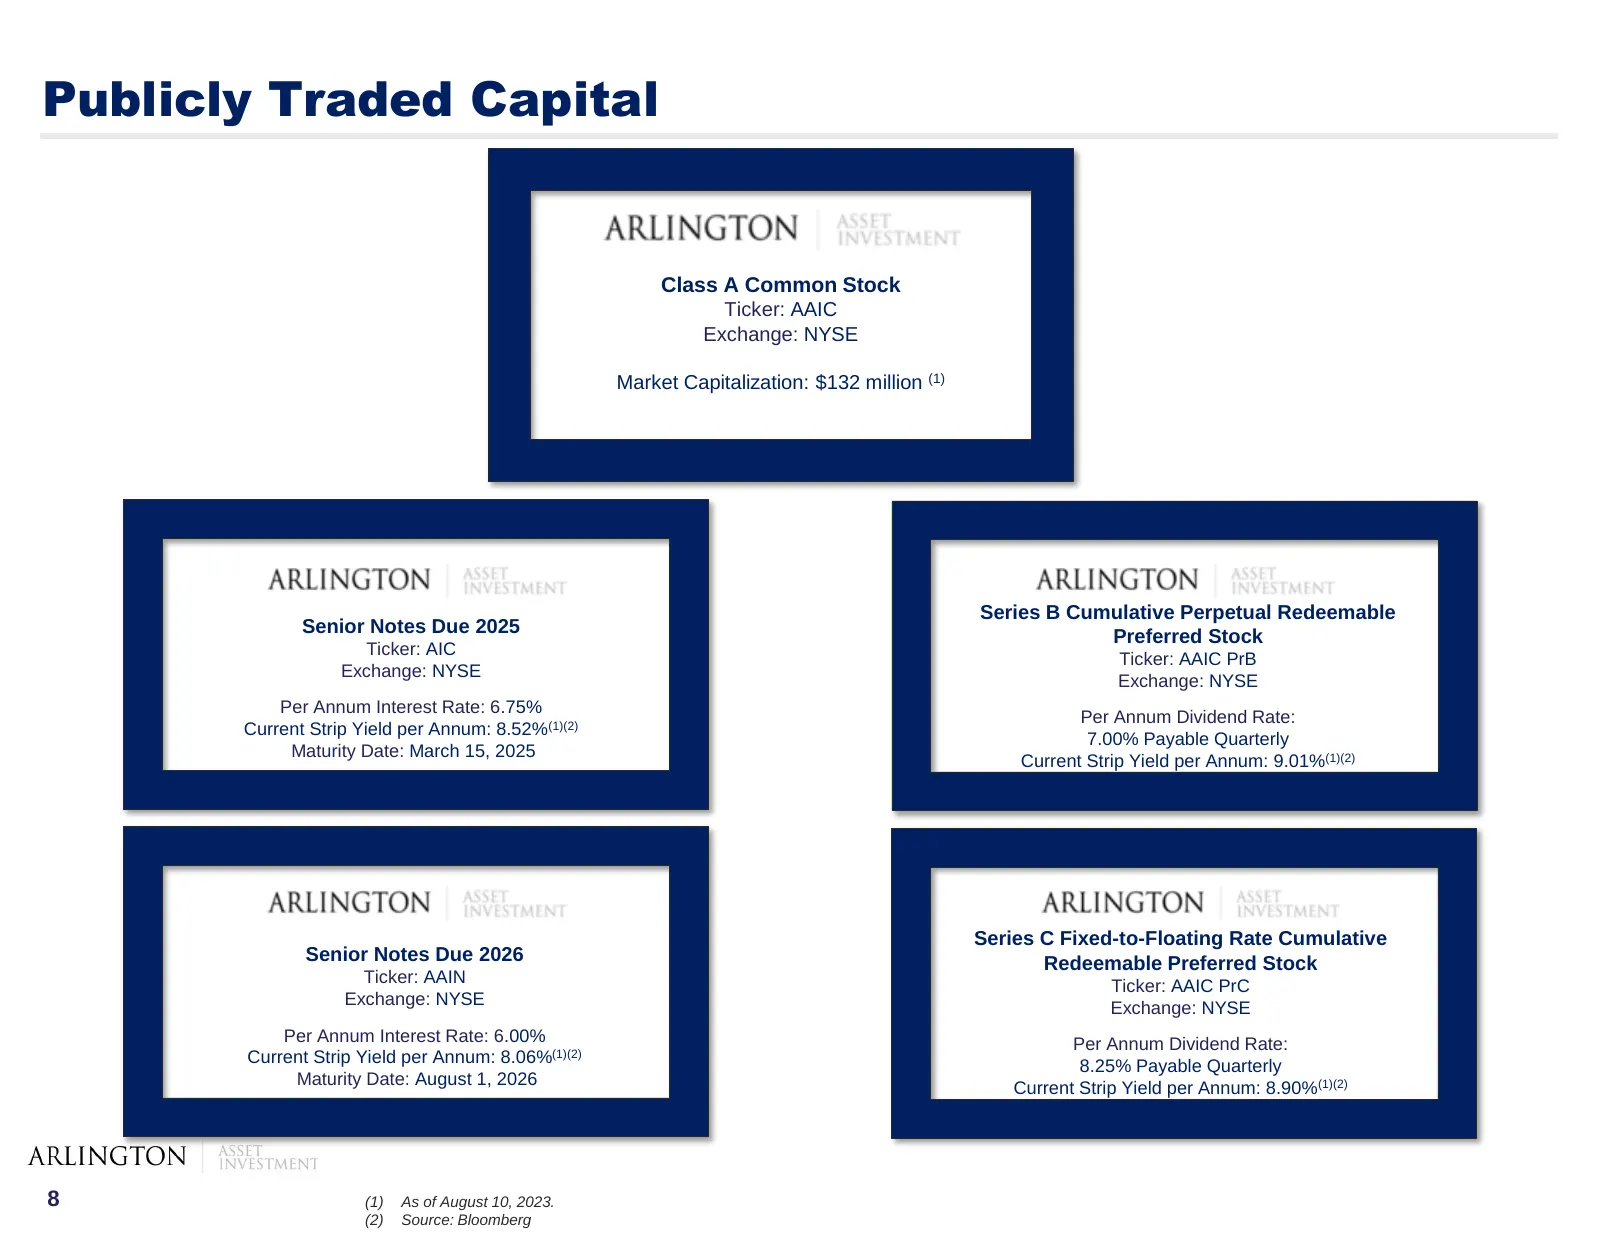
Publicly Traded Capital Class A Common Stock Ticker: AAIC Exchange: NYSE Market Capitalization: $132 million (1) Series B Cumulative Perpetual Redeemable Senior Notes Due 2025 Preferred Stock Ticker: AIC Ticker: AAIC PrB Exchange: NYSE Exchange: NYSE Per Annum Interest Rate: 6.75% Per Annum Dividend
Slide 10: Balance Sheet
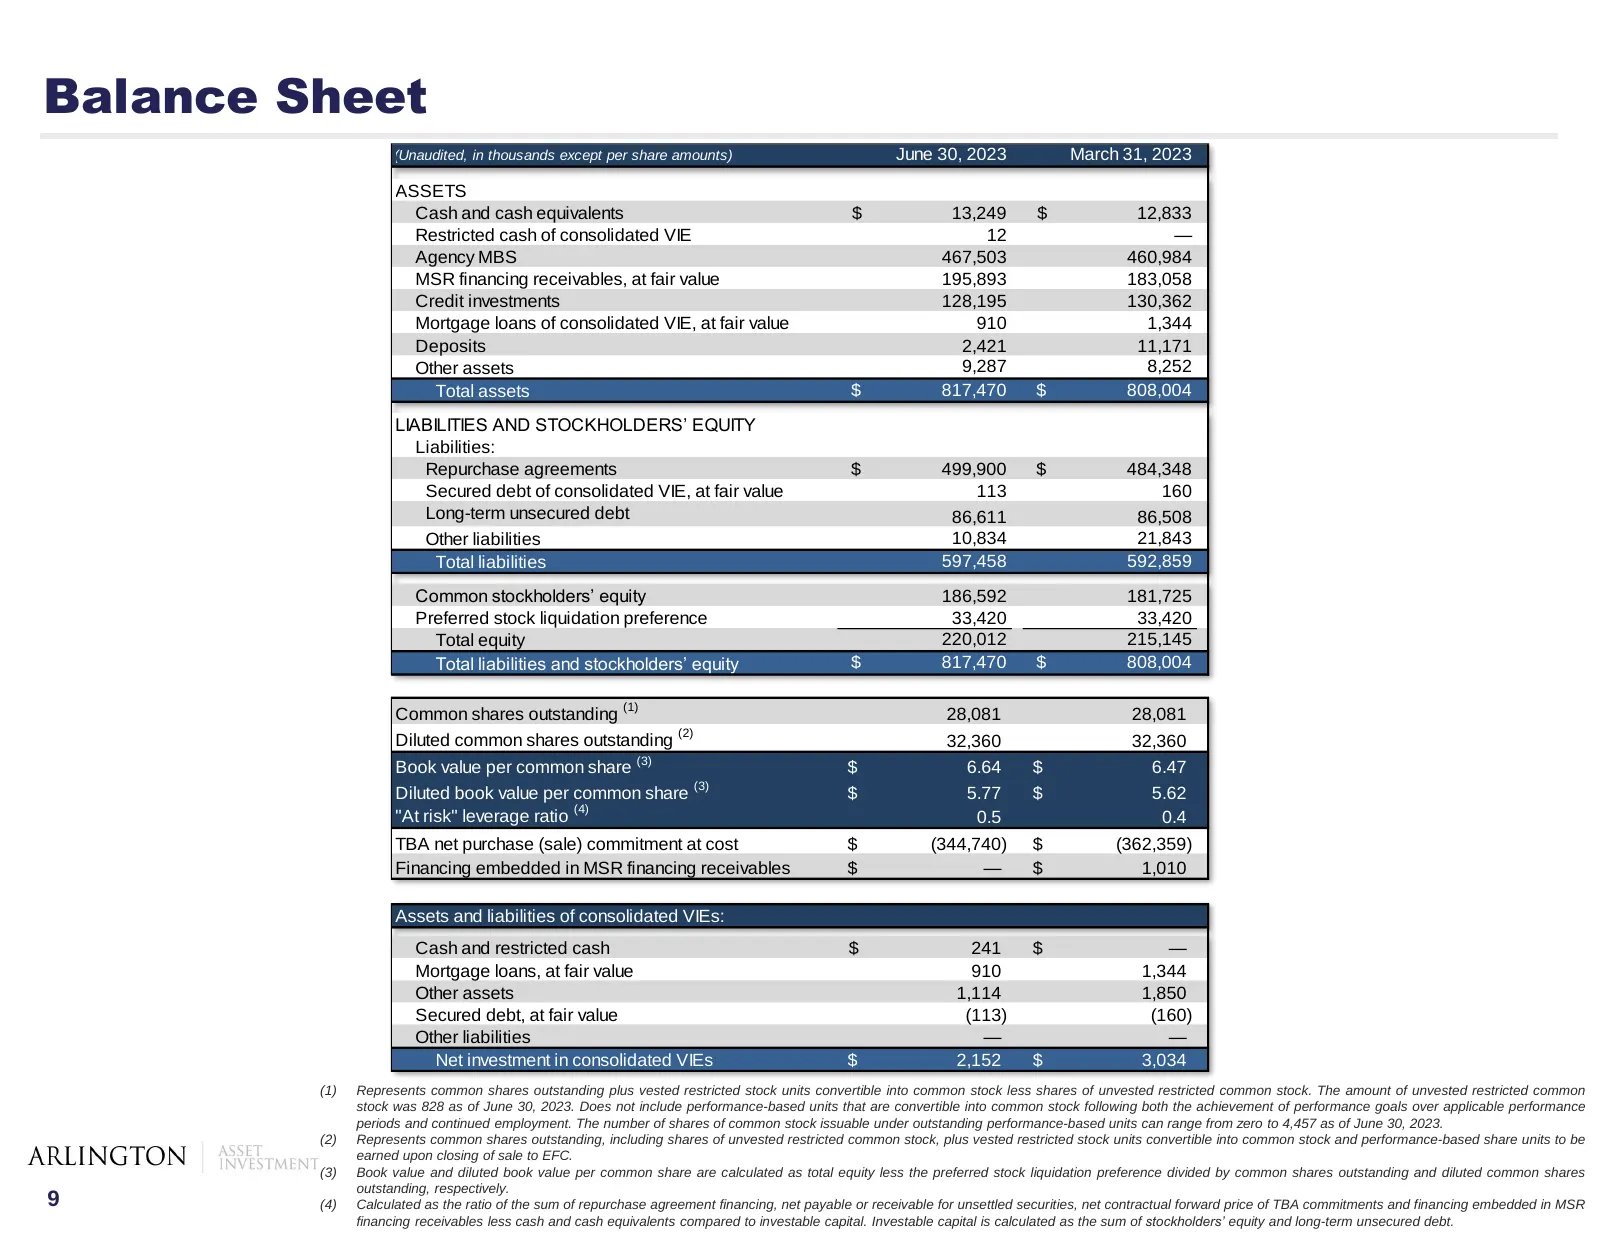
Balance Sheet (Unaudited, in thousands except per share amounts) June 30, 2023 March 31, 2023 ASSETS Cash and cash equivalents $ 13,249 $ 12,833 Restricted cash of consolidated VIE 12 — Agency MBS 467,503 460,984 MSR financing receivables, at fair value 195,893 183,058 Credit investments 128,195 130
Slide 11: Statement of Comprehensive Income
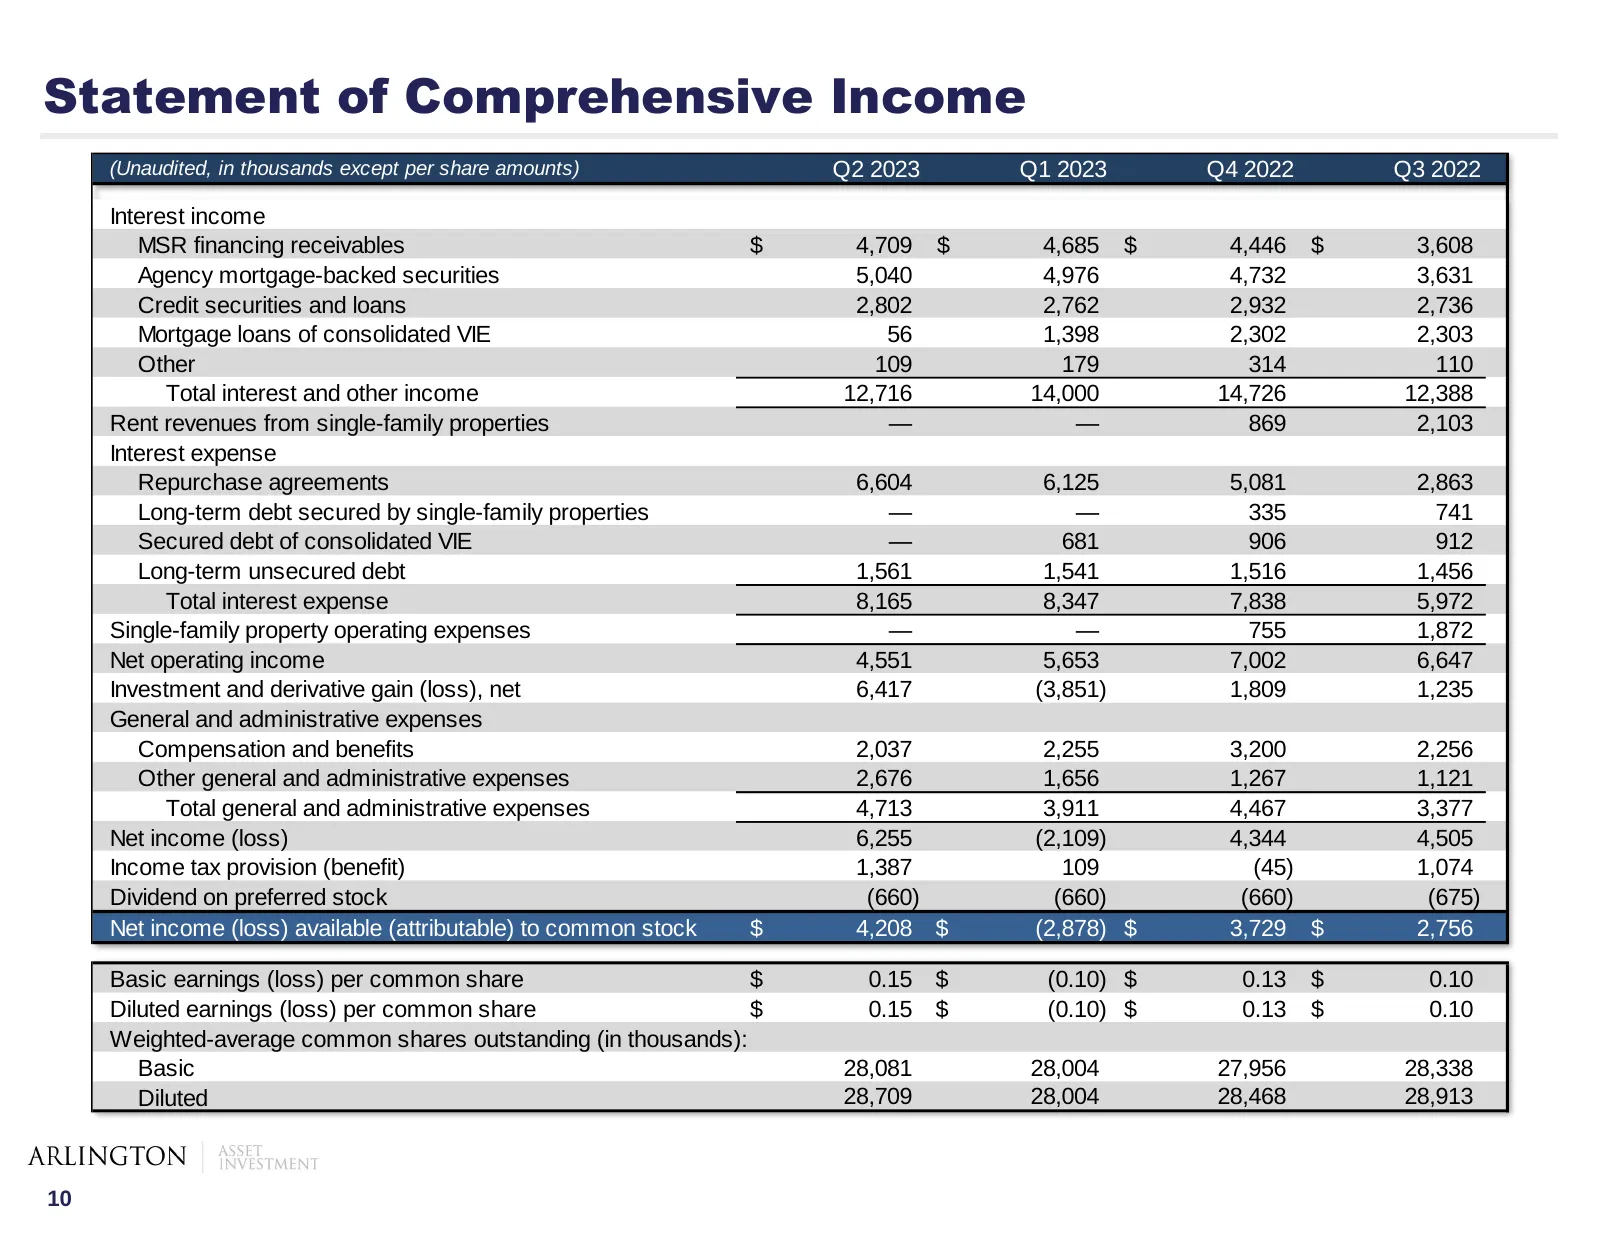
Statement of Comprehensive Income (Unaudited, in thousands except per share amounts) Q2 2023 Q1 2023 Q4 2022 Q3 2022 Interest income MSR financing receivables $ 4,709 $ 4,685 $ 4,446 $ 3,608 Agency mortgage-backed securities 5,040 4,976 4,732 3,631 Credit securities and loans 2,802 2,762 2,932 2,736
Slide 12: Non-GAAP Earnings Available for Distribution
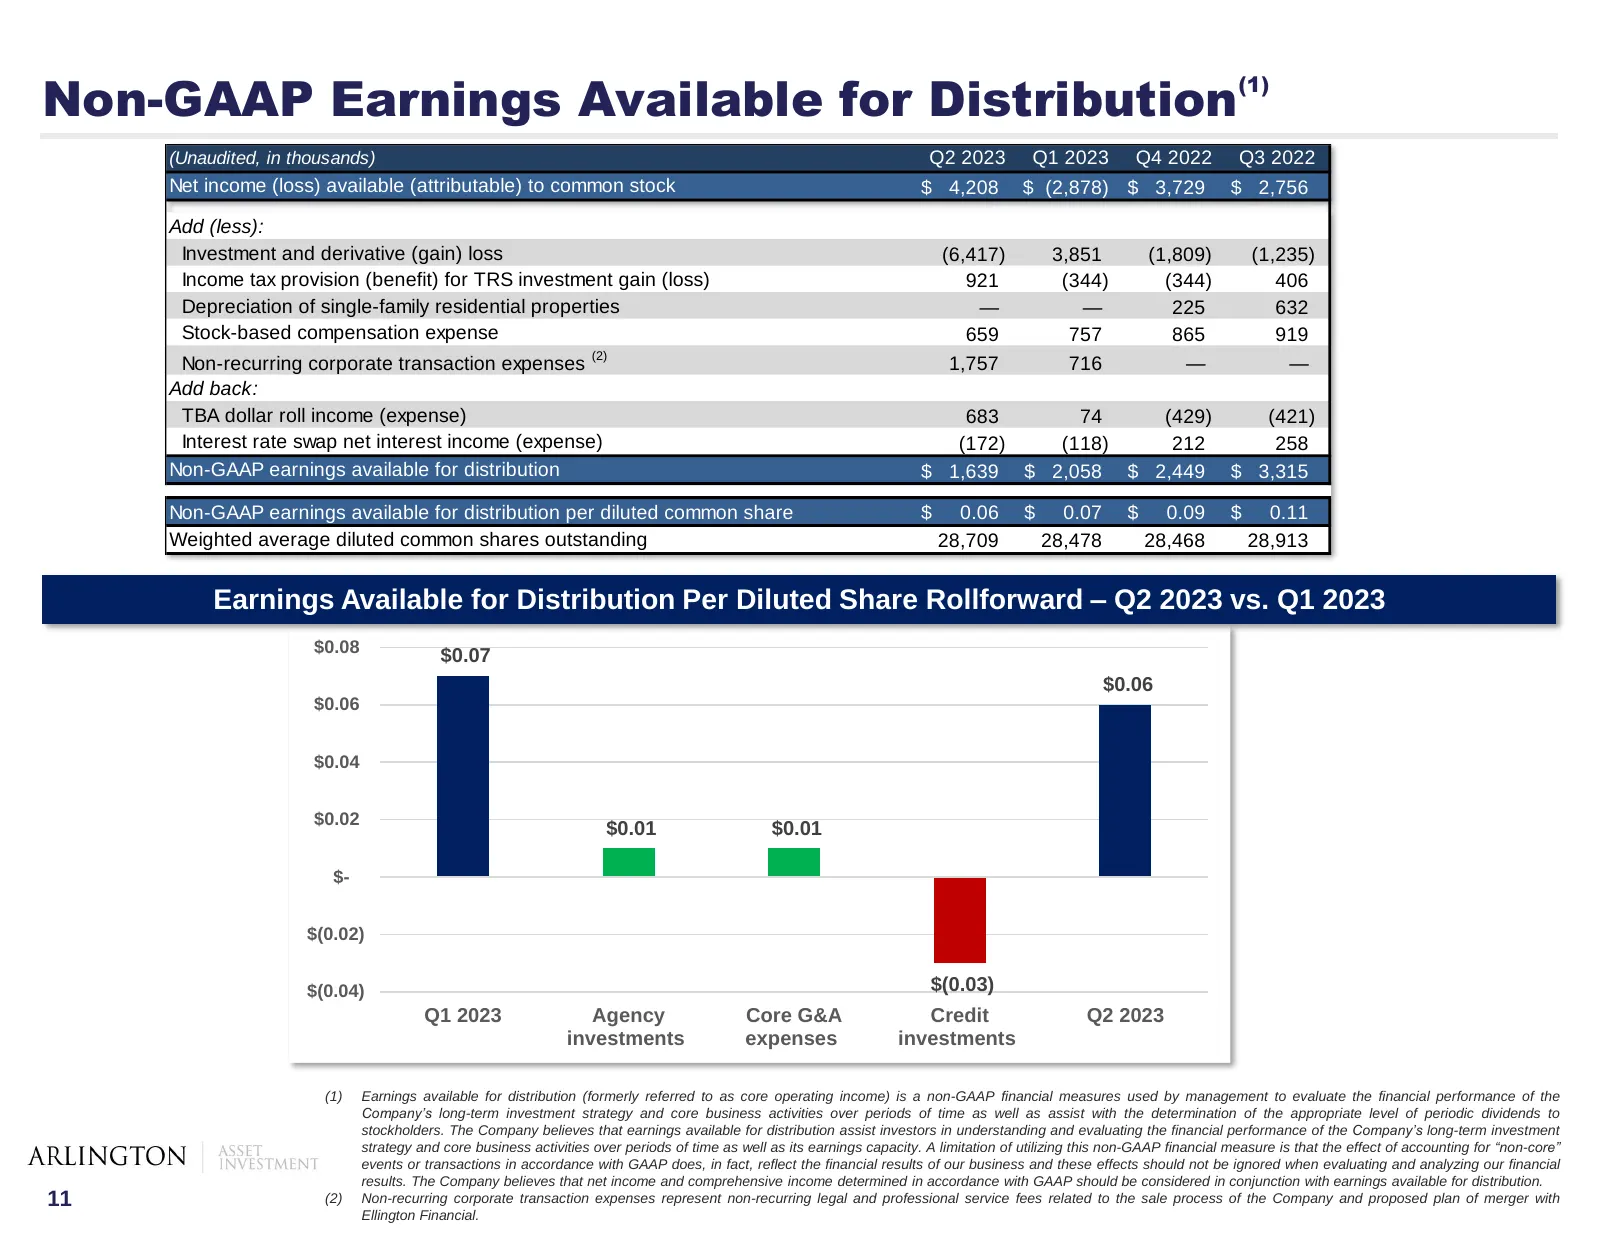
Non-GAAP Earnings Available for Distribution(1) (Unaudited, in thousands) Q2 2023 Q1 2023 Q4 2022 Q3 2022 Net income (loss) available (attributable) to common stock $ 4,208 $ (2,878) $ 3,729 $ 2,756 Add (less): Investment and derivative (gain) loss (6,417) 3,851 (1,809) (1,235) Income tax provision
Source: 6ix earnings call
More decks from American Airlines Group, Inc.
 Q3 2026 Earnings Presentation16 slides · Oct 22, 2026
 IPO Roadshow (July 2026)38 slides · Jul 27, 2026
 Q2 2026 Earnings Presentation14 slides · Jul 23, 2026
 IPO Roadshow (April 2026)39 slides · Apr 27, 2026
 Q1 2026 Earnings Presentation18 slides · Apr 23, 2026
 Q4 2025 Earnings Presentation19 slides · Jan 27, 2026