AMMB Holdings Bhd. · MYX:AMBANK
AMMB Holdings Bhd — FY2019 Earnings Presentation
49 slides from AMMB Holdings Bhd's earnings presentation, May 28, 2019
Slide 1: FY2019 Results Investor Presentation
FY2019 RESULTS INVESTOR PRESENTATION 28 MAY 2019
Slide 2: GCEO Presentation
GCEO PRESENTATION Dato’ Sulaiman Mohd Tahir 3 FY19 Financial snapshot 4 FY19 Recap 5 FY19 in review 6 Outlook for 2019 24 FY20 Financial Agenda
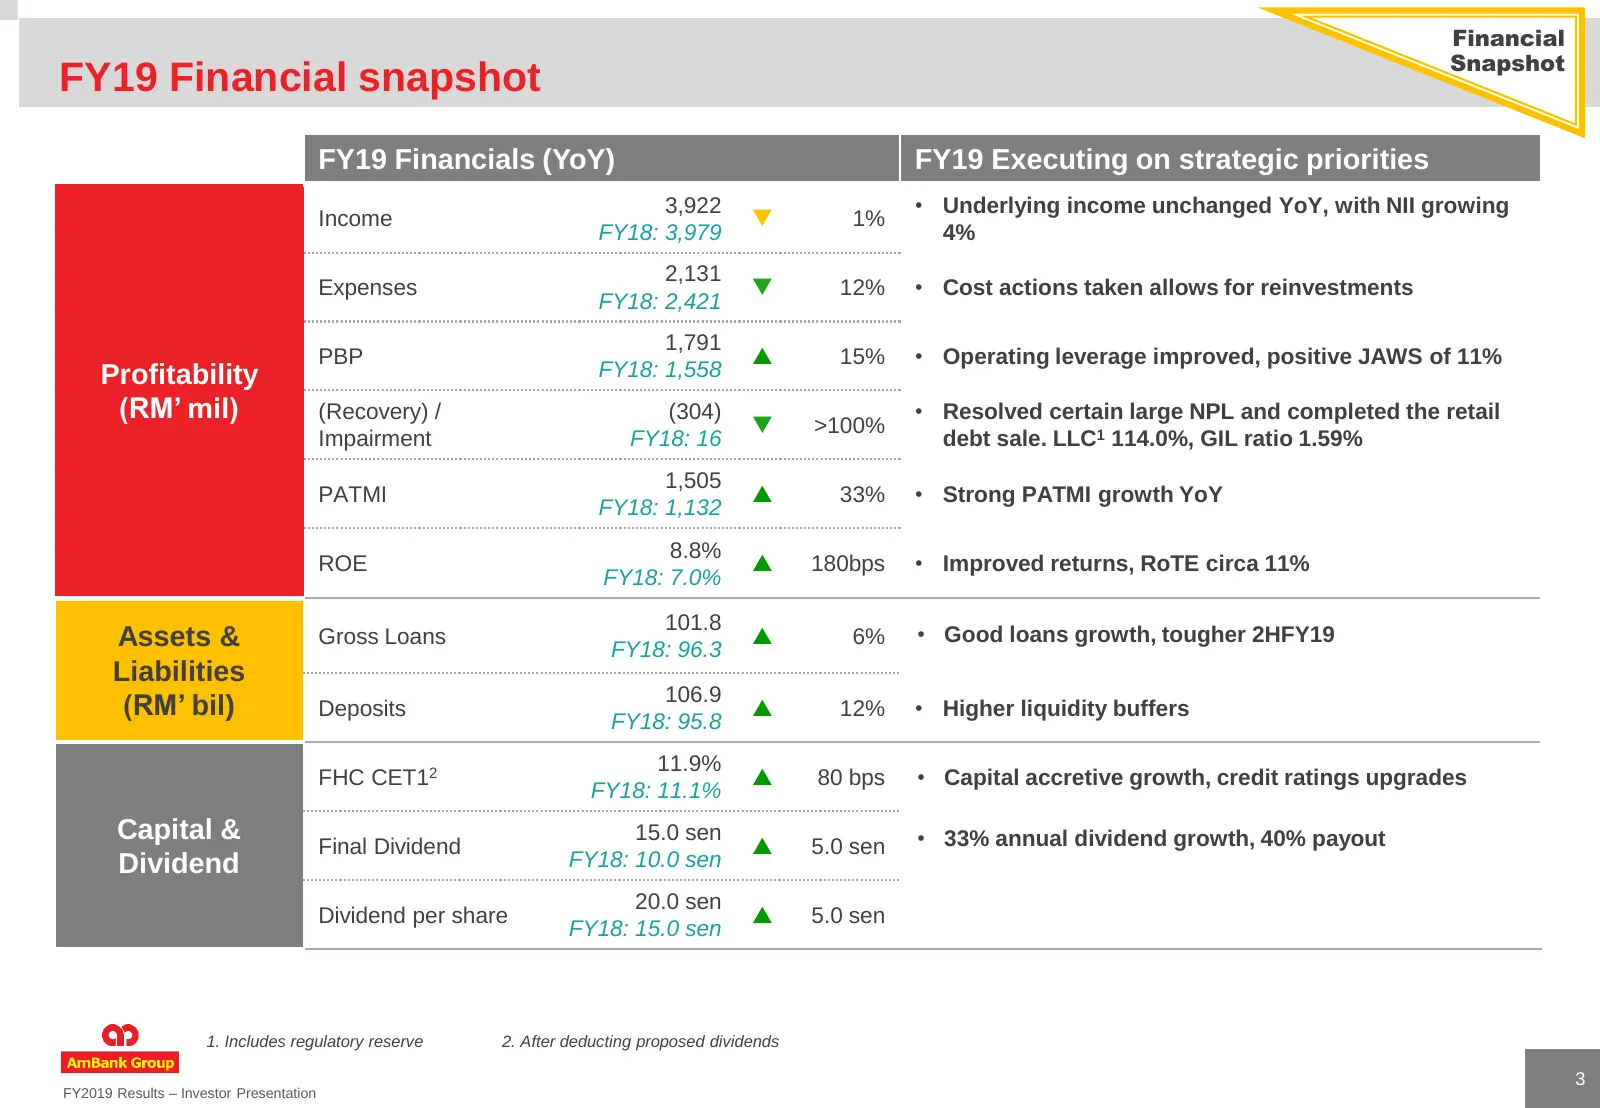
Slide 3: FY19 Financial snapshot
Financial Snapshot FY19 Financial snapshot FY19 Financials (YoY) FY19 Executing on strategic priorities 3,922 • Underlying income unchanged YoY, with NII growing Income 1% FY18: 3,979 4% 2,131 Expenses 12% • Cost actions taken allows for reinvestments FY18: 2,421 1,791 PBP 15% • Operating leve
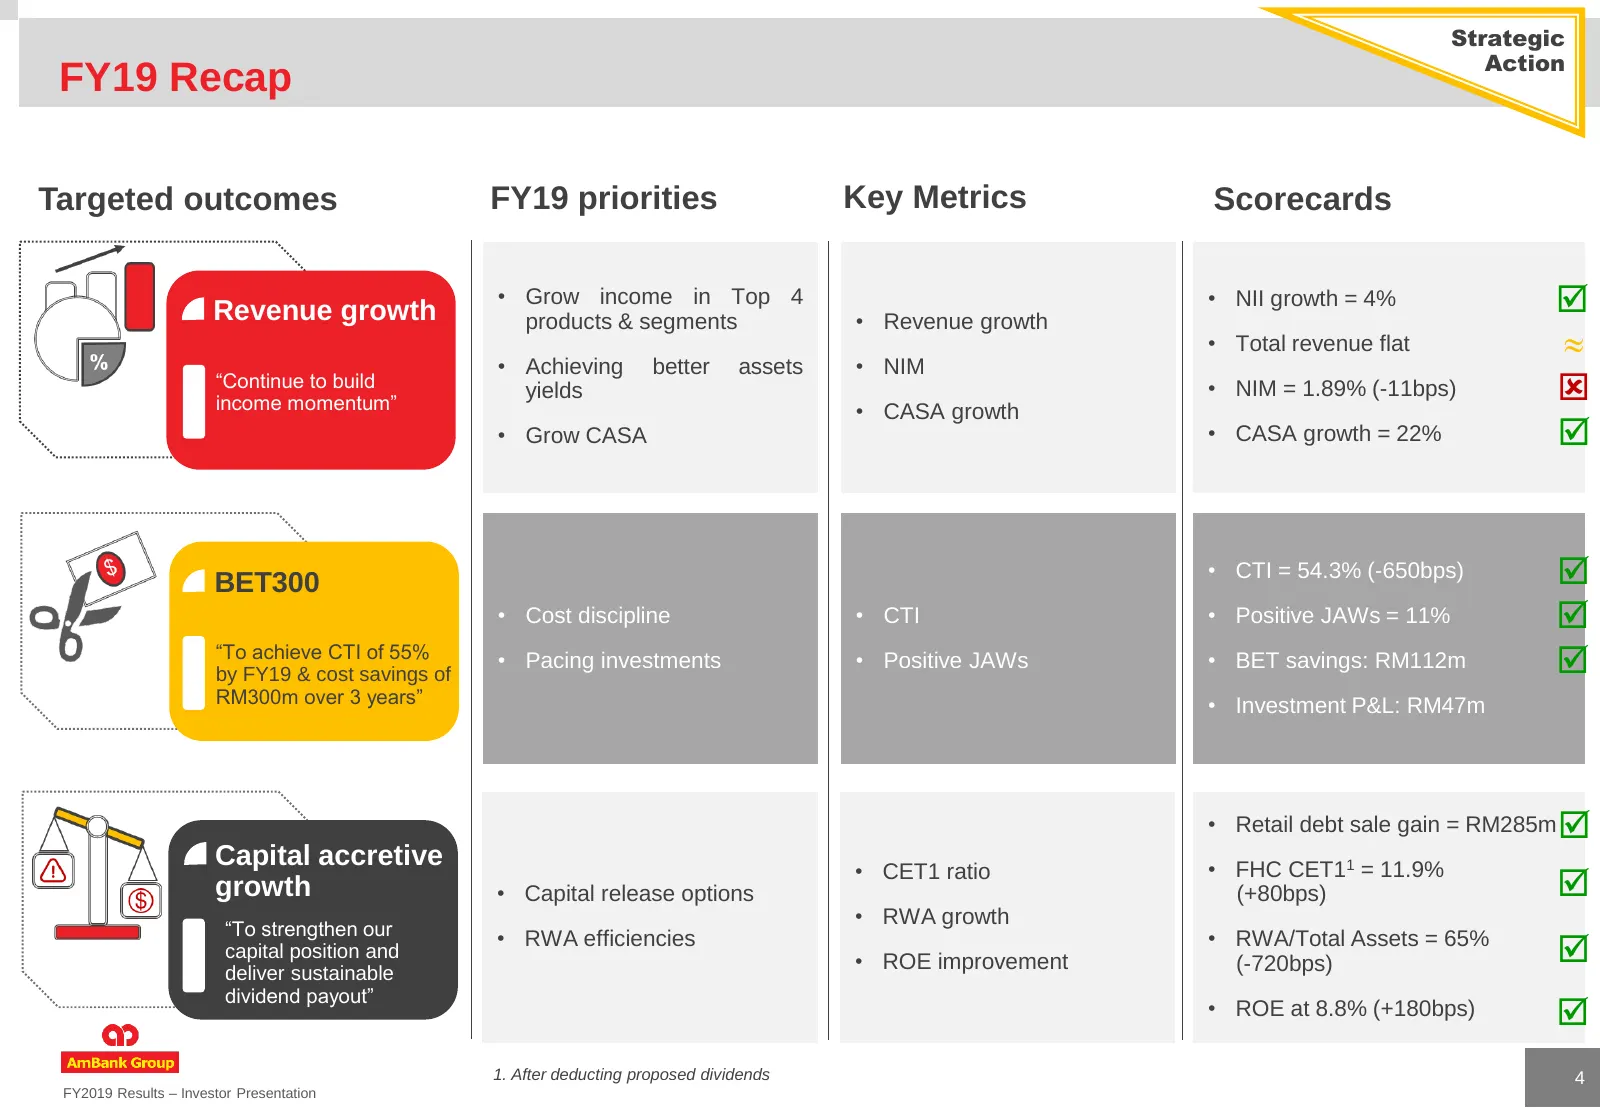
Slide 4: FY19 Recap
Strategic Action FY19 Recap Targeted outcomes FY19 priorities Key Metrics Scorecards Revenue growth • Grow income in Top 4 products & segments • Revenue growth • NII growth = 4% • Total revenue flat • Achieving better assets • NIM “Continue to build income momentum” yields • NIM = 1.89% (-11bps)
Slide 5: FY19 in review
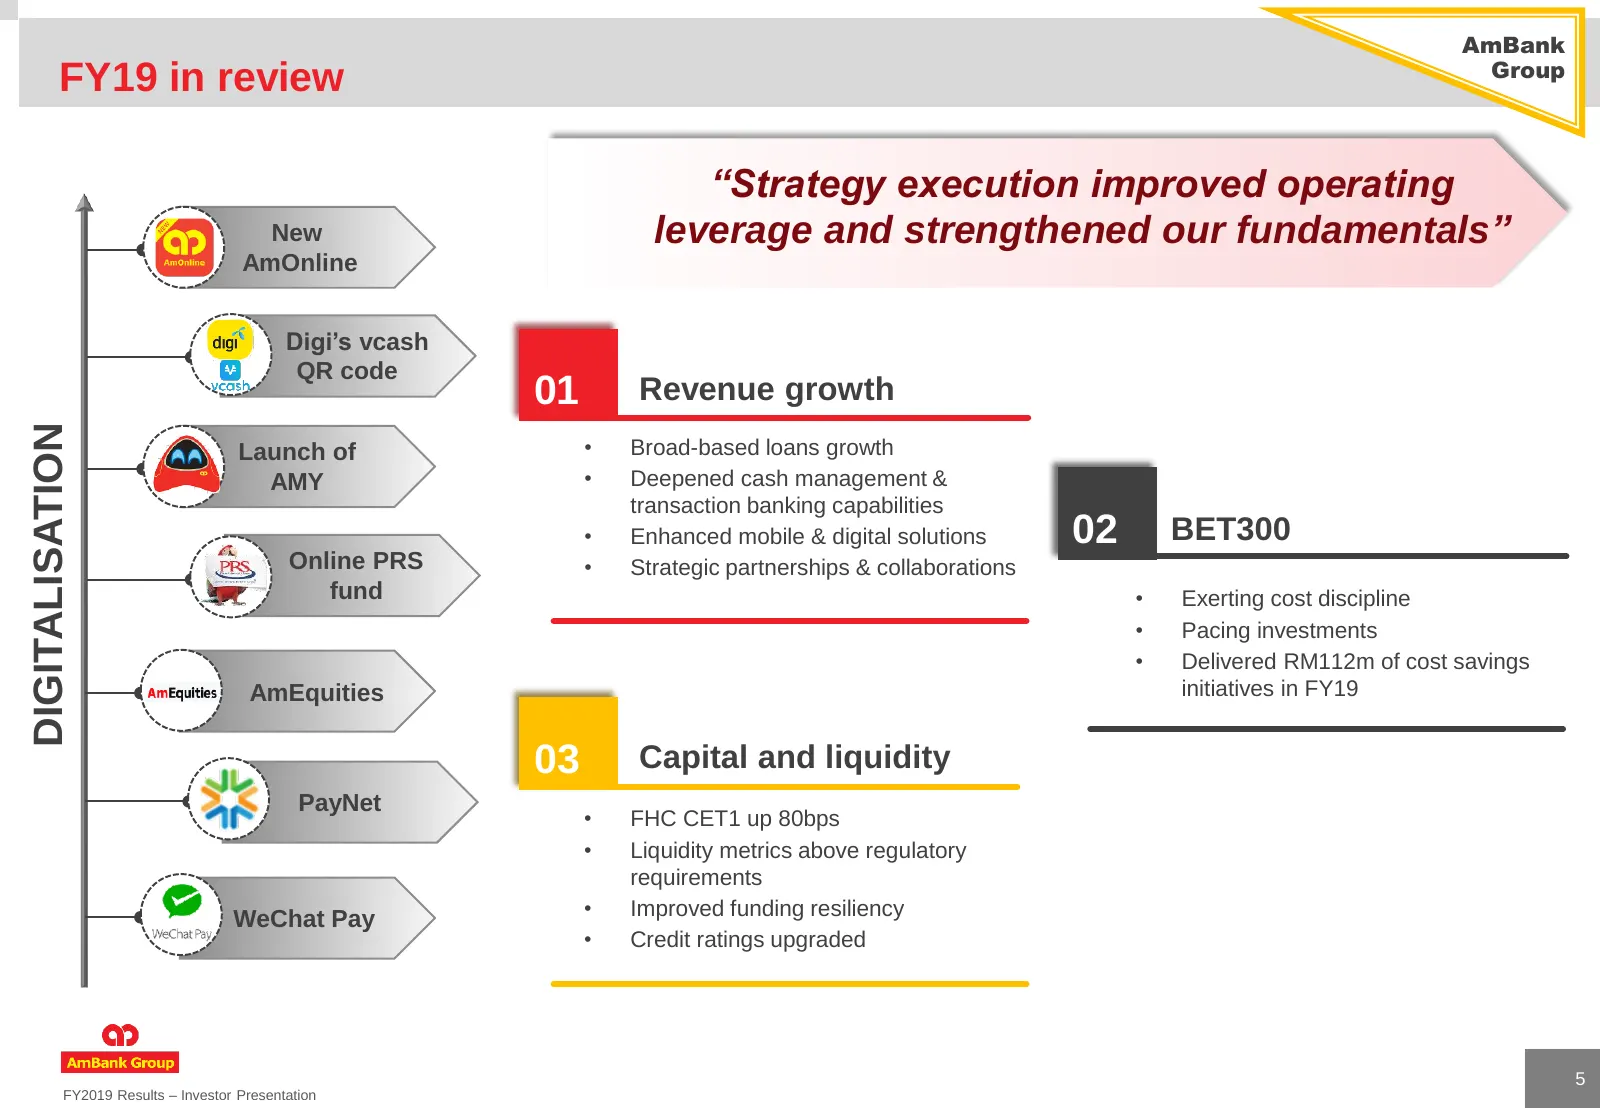
AmBank Group FY19 in review “Strategy execution improved operating New leverage and strengthened our fundamentals” AmOnline Digi’s vcash QR code 01 Revenue growth DIGITALISATION Launch of • Broad-based loans growth AMY • Deepened cash management & transaction banking capabilities • Enhanced mobile &
Slide 6: Outlook for 2019
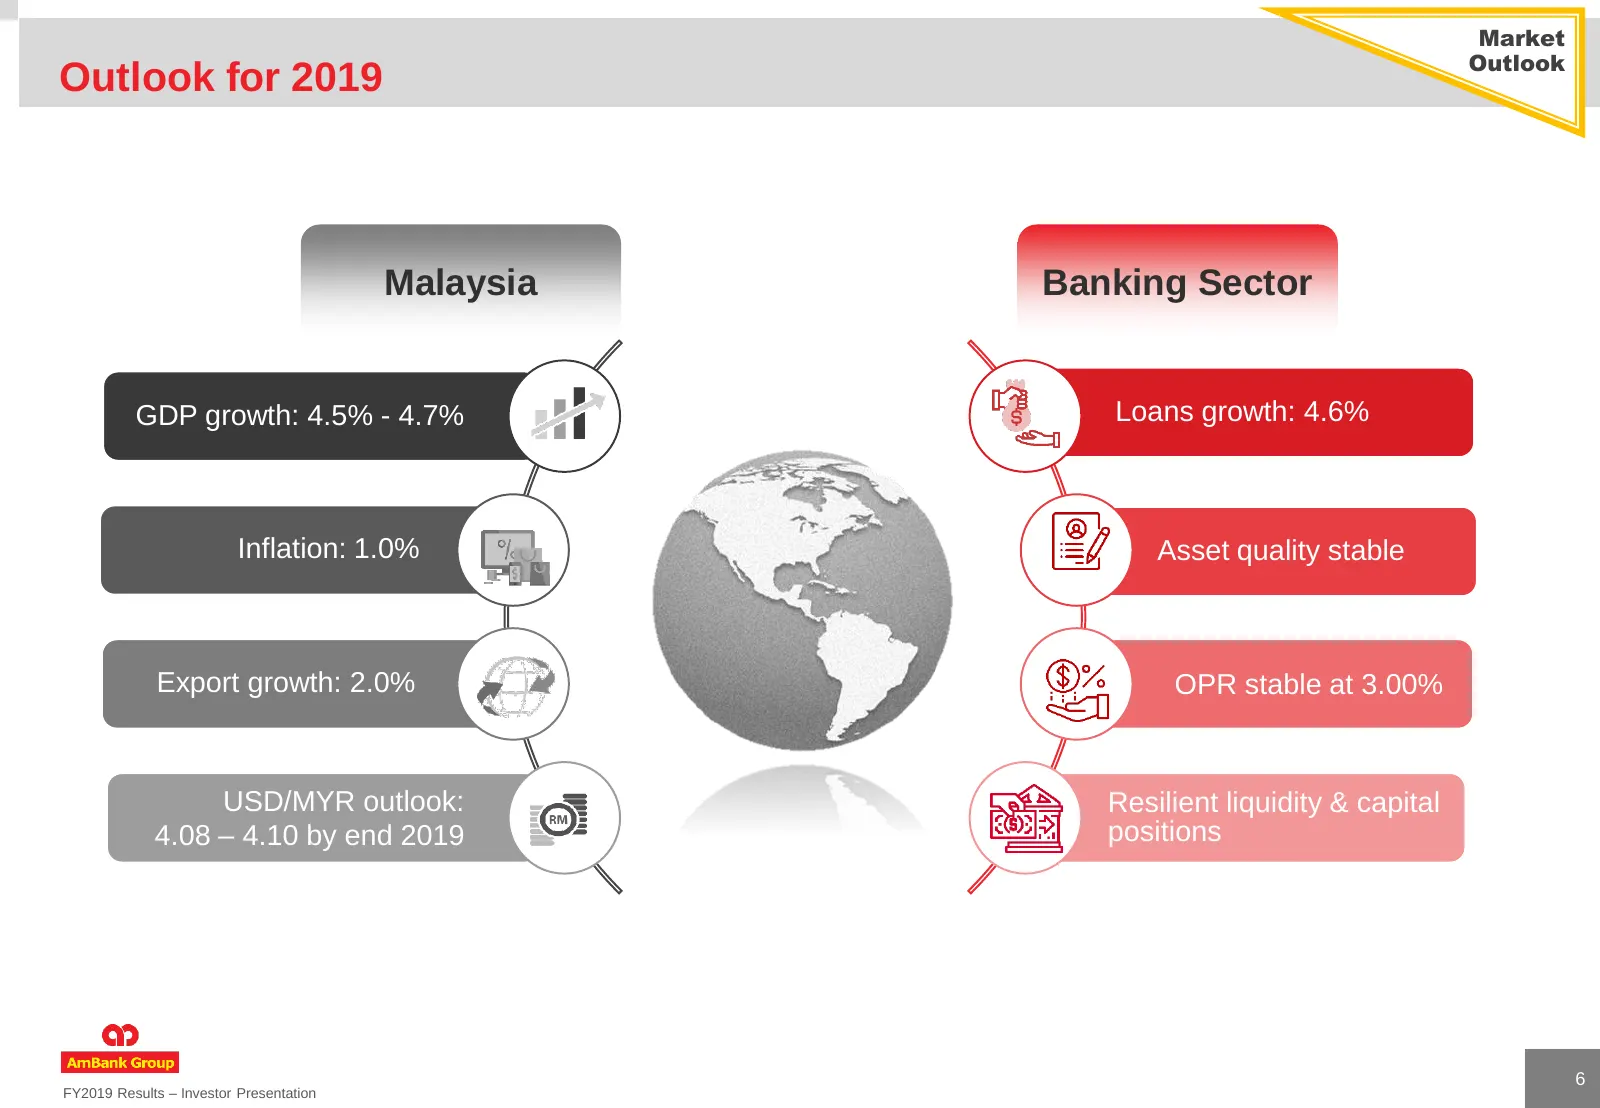
Market Outlook Outlook for 2019 Malaysia Banking Sector GDP growth: 4.5% - 4.7% Loans growth: 4.6% Inflation: 1.0% Asset quality stable Export growth: 2.0% OPR stable at 3.00% USD/MYR outlook: Resilient liquidity & capital 4.08 – 4.10 by end 2019 positions 6 FY2019 Results – Investor Presentation

Slide 7: GCFO Presentation
GCFO Presentation Jamie Ling 8-22 Financial overview 23 Guidance & Expectations
Slide 8: Q4FY19 Financial overview
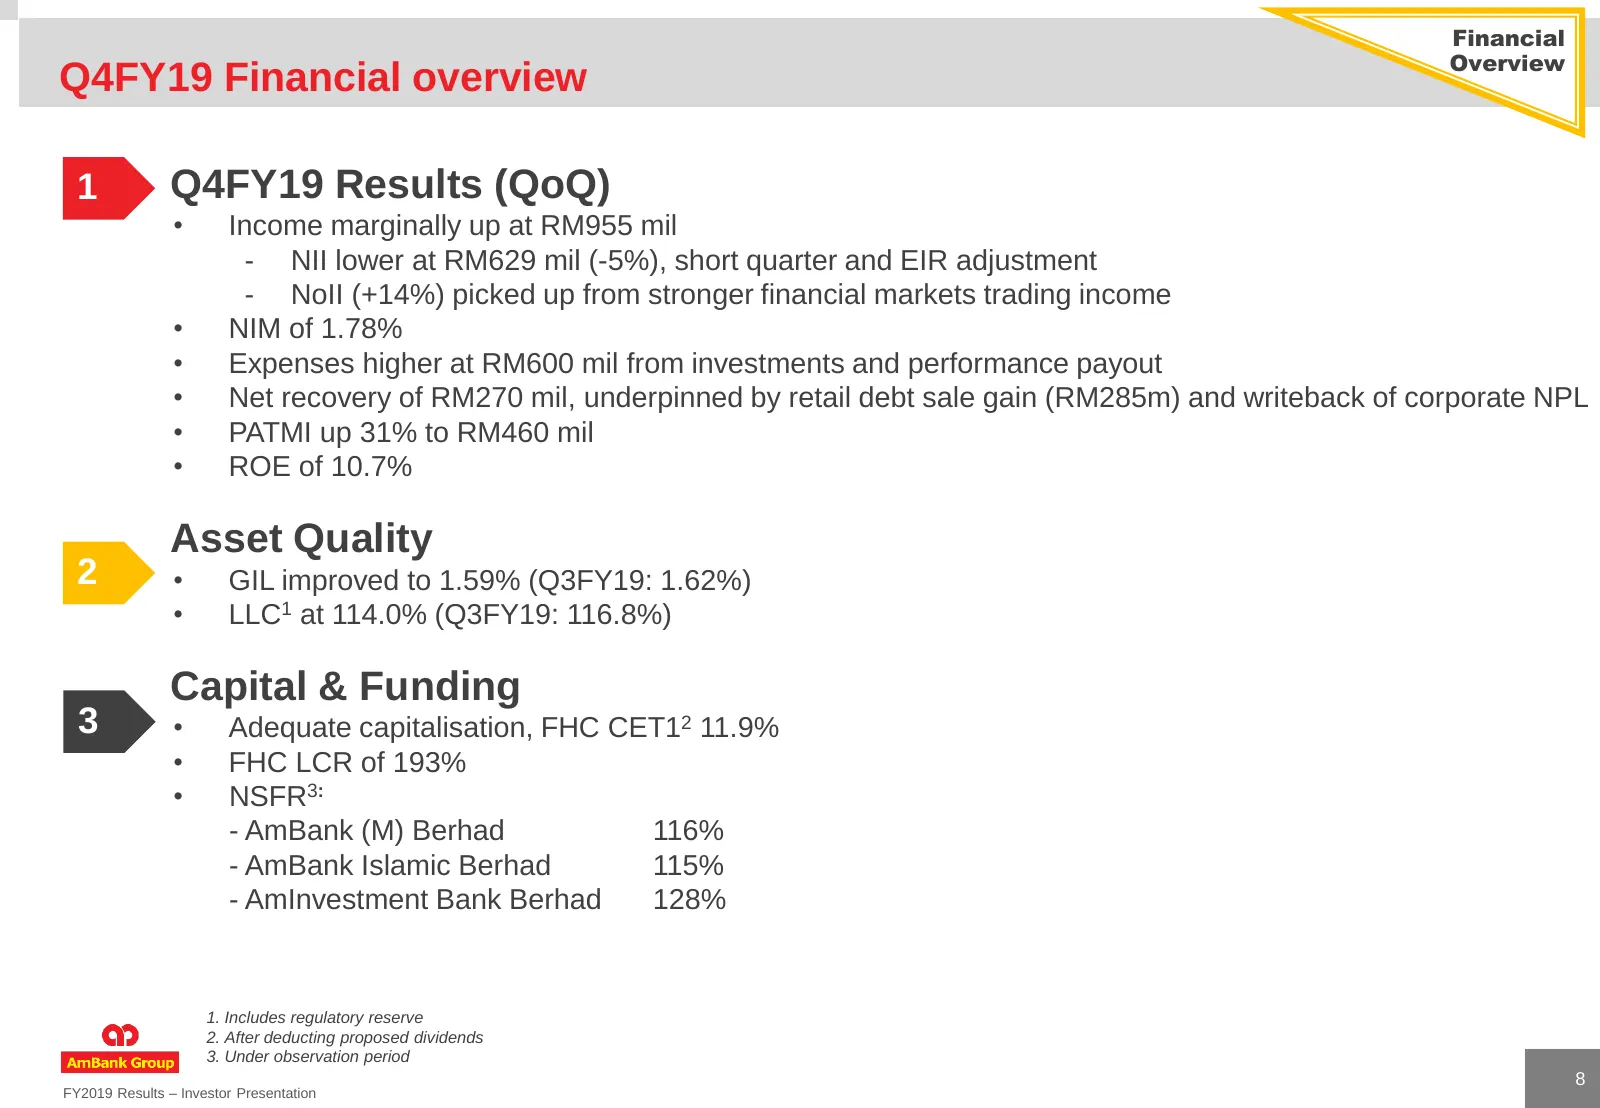
Financial Overview Q4FY19 Financial overview 1 Q4FY19 Results (QoQ) • Income marginally up at RM955 mil - NII lower at RM629 mil (-5%), short quarter and EIR adjustment - NoII (+14%) picked up from stronger financial markets trading income • NIM of 1.78% • Expenses higher at RM600 mil from investmen
Slide 9: FY19 Performance summary – P&L
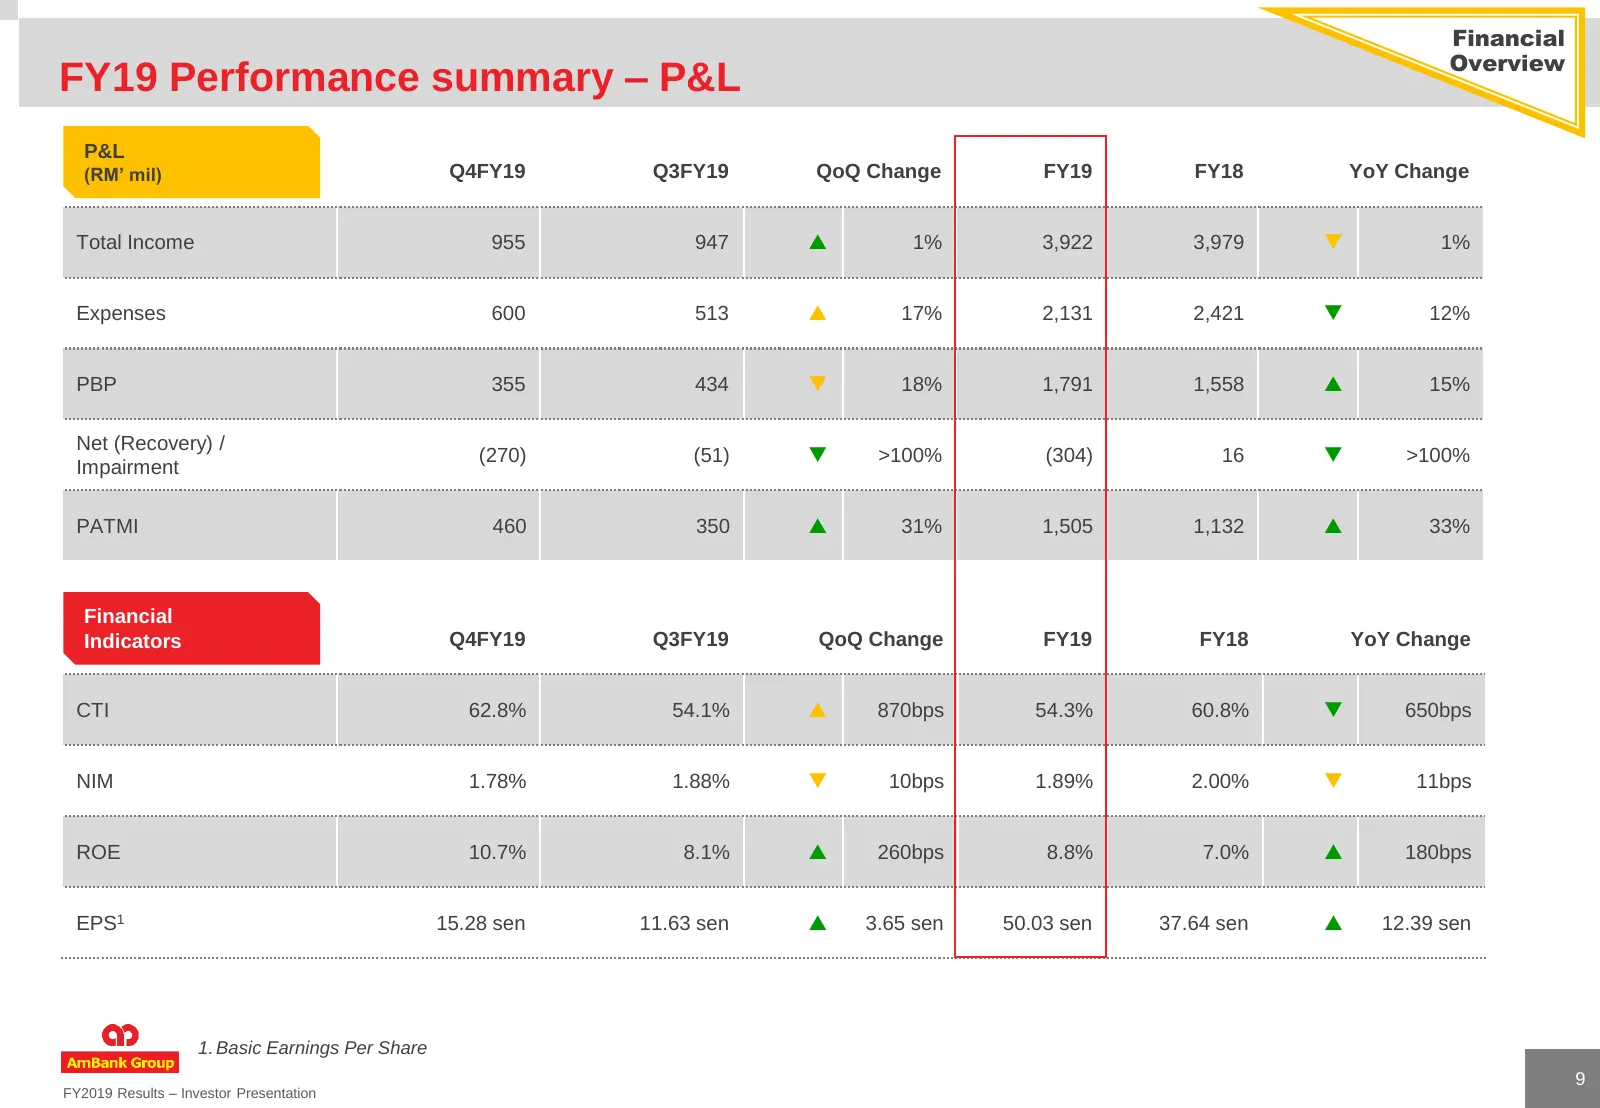
Financial Overview FY19 Performance summary – P&L P&L (RM’ mil) Q4FY19 Q3FY19 QoQ Change FY19 FY18 YoY Change Total Income 955 947 1% 3,922 3,979 1% Expenses 600 513 17% 2,131 2,421 12% PBP 355 434 18% 1,791 1,558 15% Net (Recovery) / (270) (51) >100% (304) 16 >100% Impairment PATMI
Slide 10: FY19 Performance summary – balance sheet
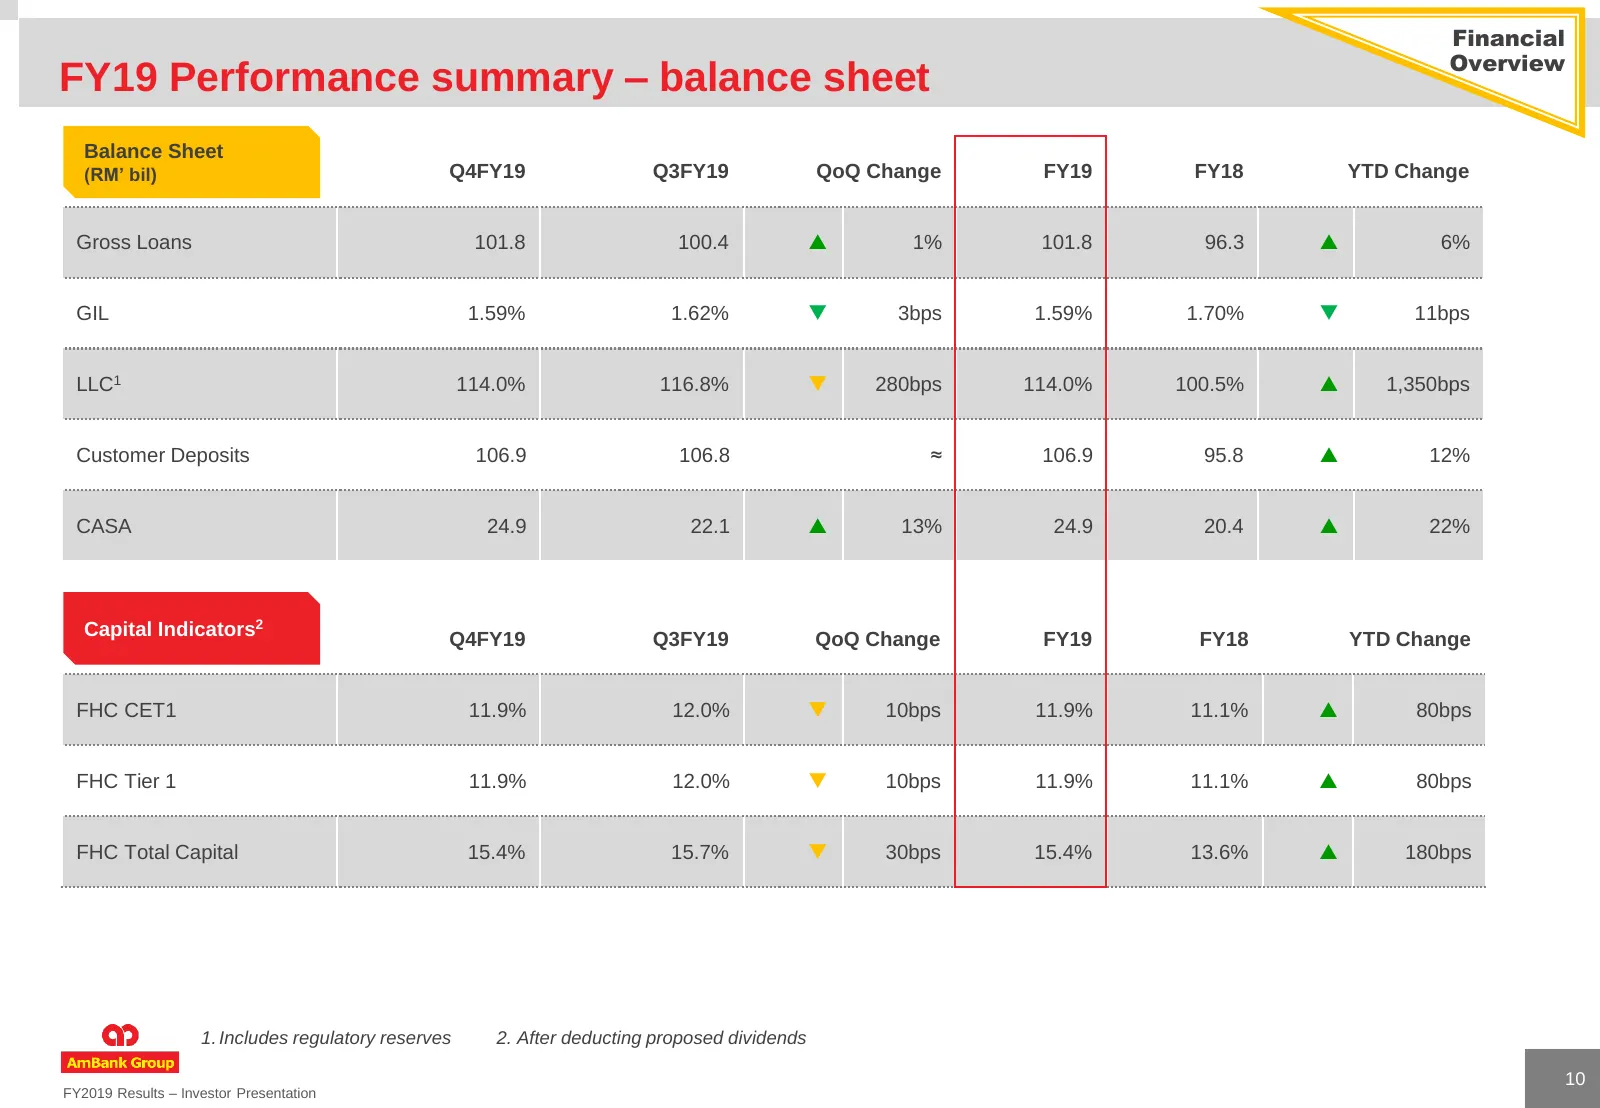
Financial Overview FY19 Performance summary – balance sheet Balance Sheet (RM’ bil) Q4FY19 Q3FY19 QoQ Change FY19 FY18 YTD Change Gross Loans 101.8 100.4 1% 101.8 96.3 6% GIL 1.59% 1.62% 3bps 1.59% 1.70% 11bps LLC1 114.0% 116.8% 280bps 114.0% 100.5% 1,350bps Customer Deposits 106.9 106.8
Slide 11: Income at similar level to last year
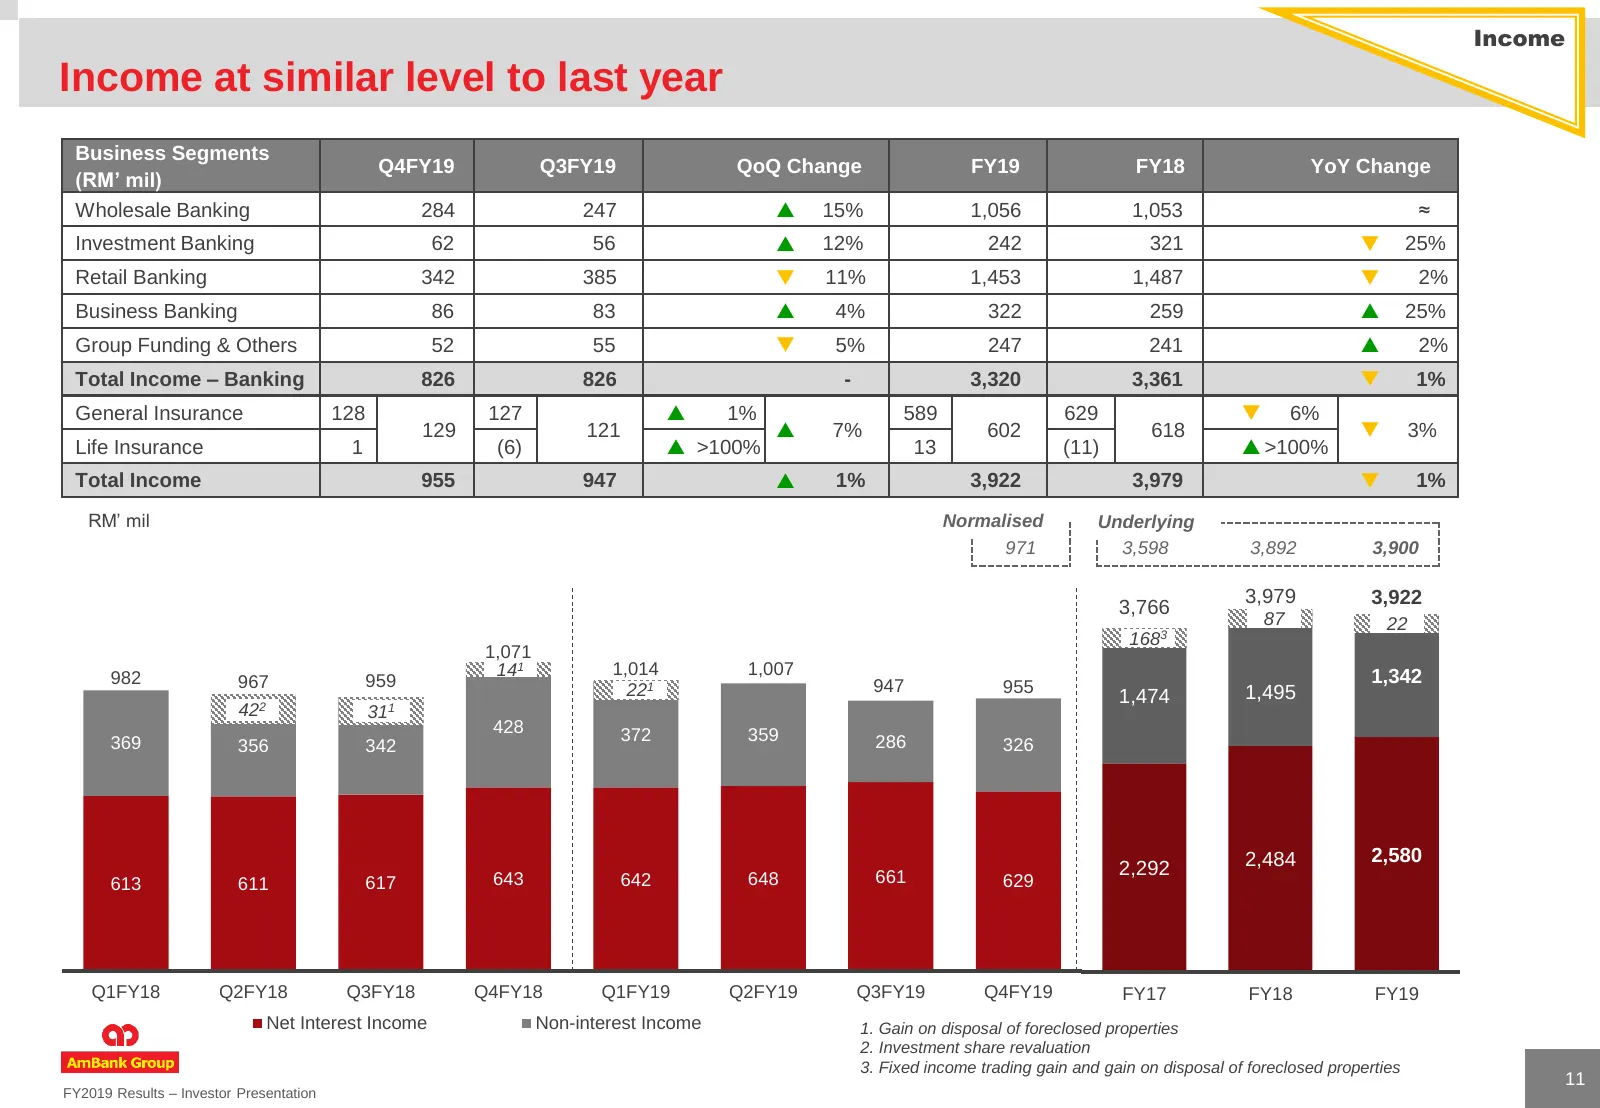
Income Income at similar level to last year Business Segments Q4FY19 Q3FY19 QoQ Change FY19 FY18 YoY Change (RM’ mil) Wholesale Banking 284 247 15% 1,056 1,053 ≈ Investment Banking 62 56 12% 242 321 25% Retail Banking 342 385 11% 1,453 1,487 2% Business Banking 86 83 4% 322 259 25% Gro
Slide 12: Better operating leverage, profit before provision up 15%
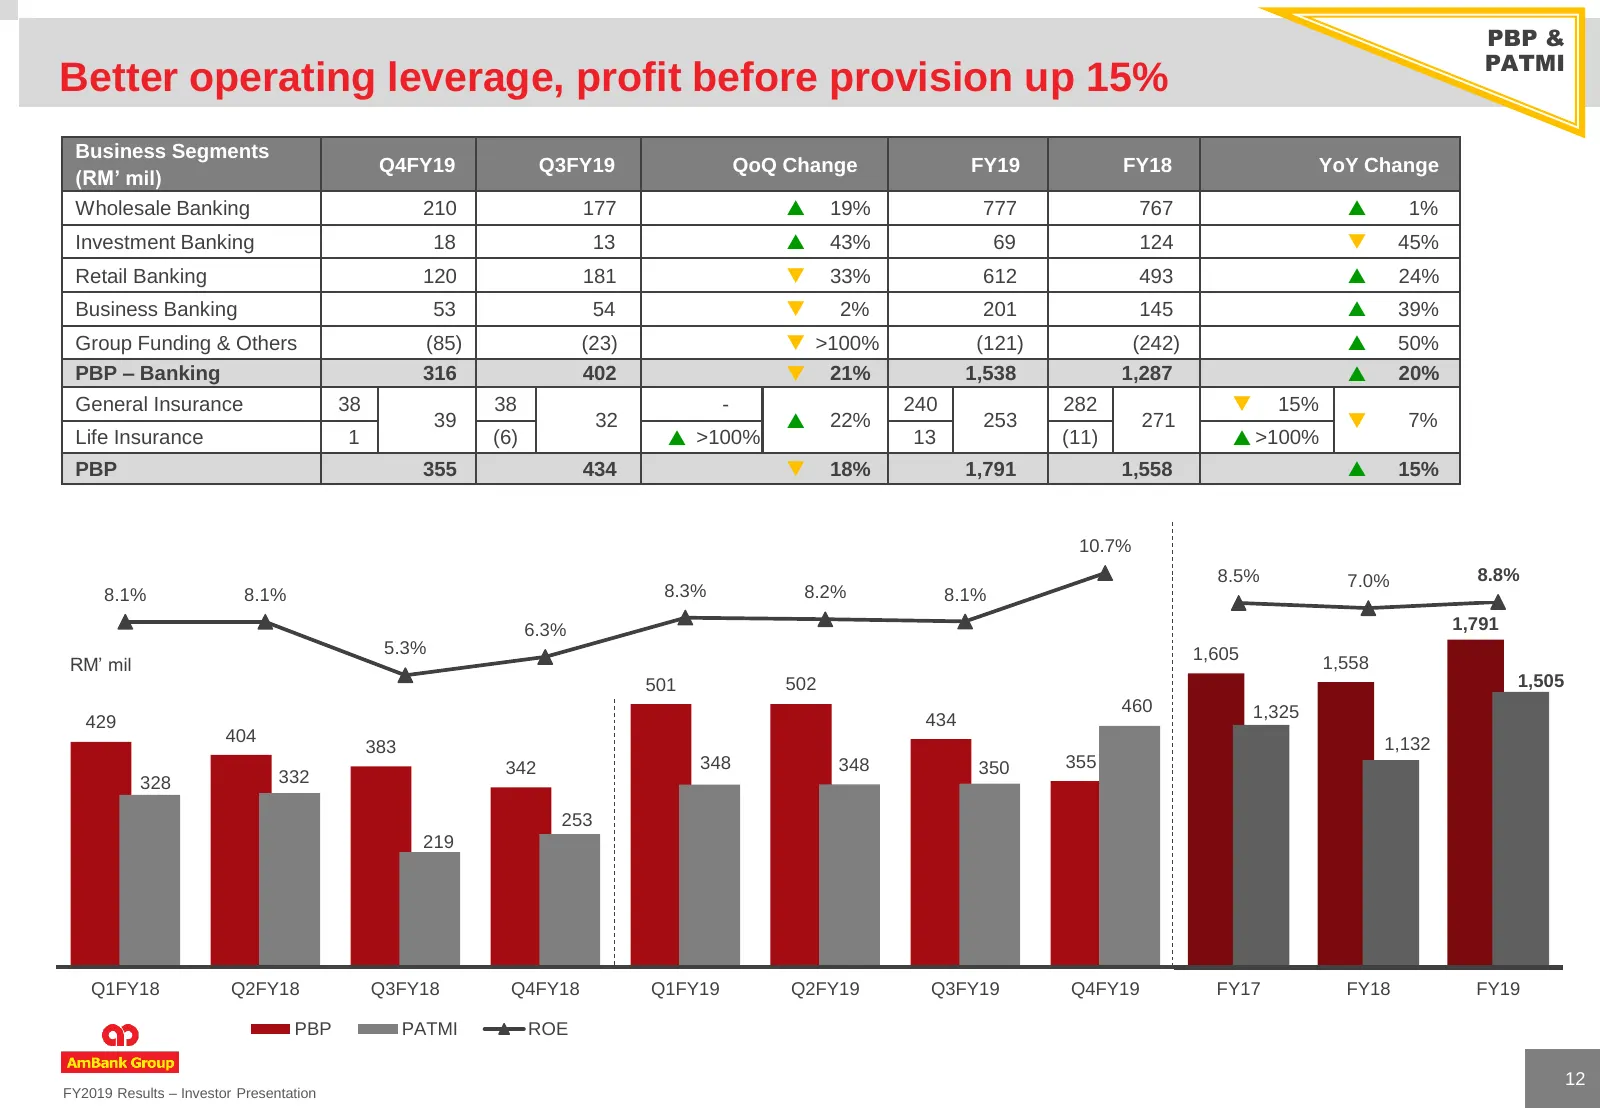
PBP & PATMI Better operating leverage, profit before provision up 15% Business Segments Q4FY19 Q3FY19 QoQ Change FY19 FY18 YoY Change (RM’ mil) Wholesale Banking 210 177 19% 777 767 1% Investment Banking 18 13 43% 69 124 45% Retail Banking 120 181 33% 612 493 24% Business Banking 53 54
Slide 13: Profit underpinned by good NII growth, cost actions and recoveries
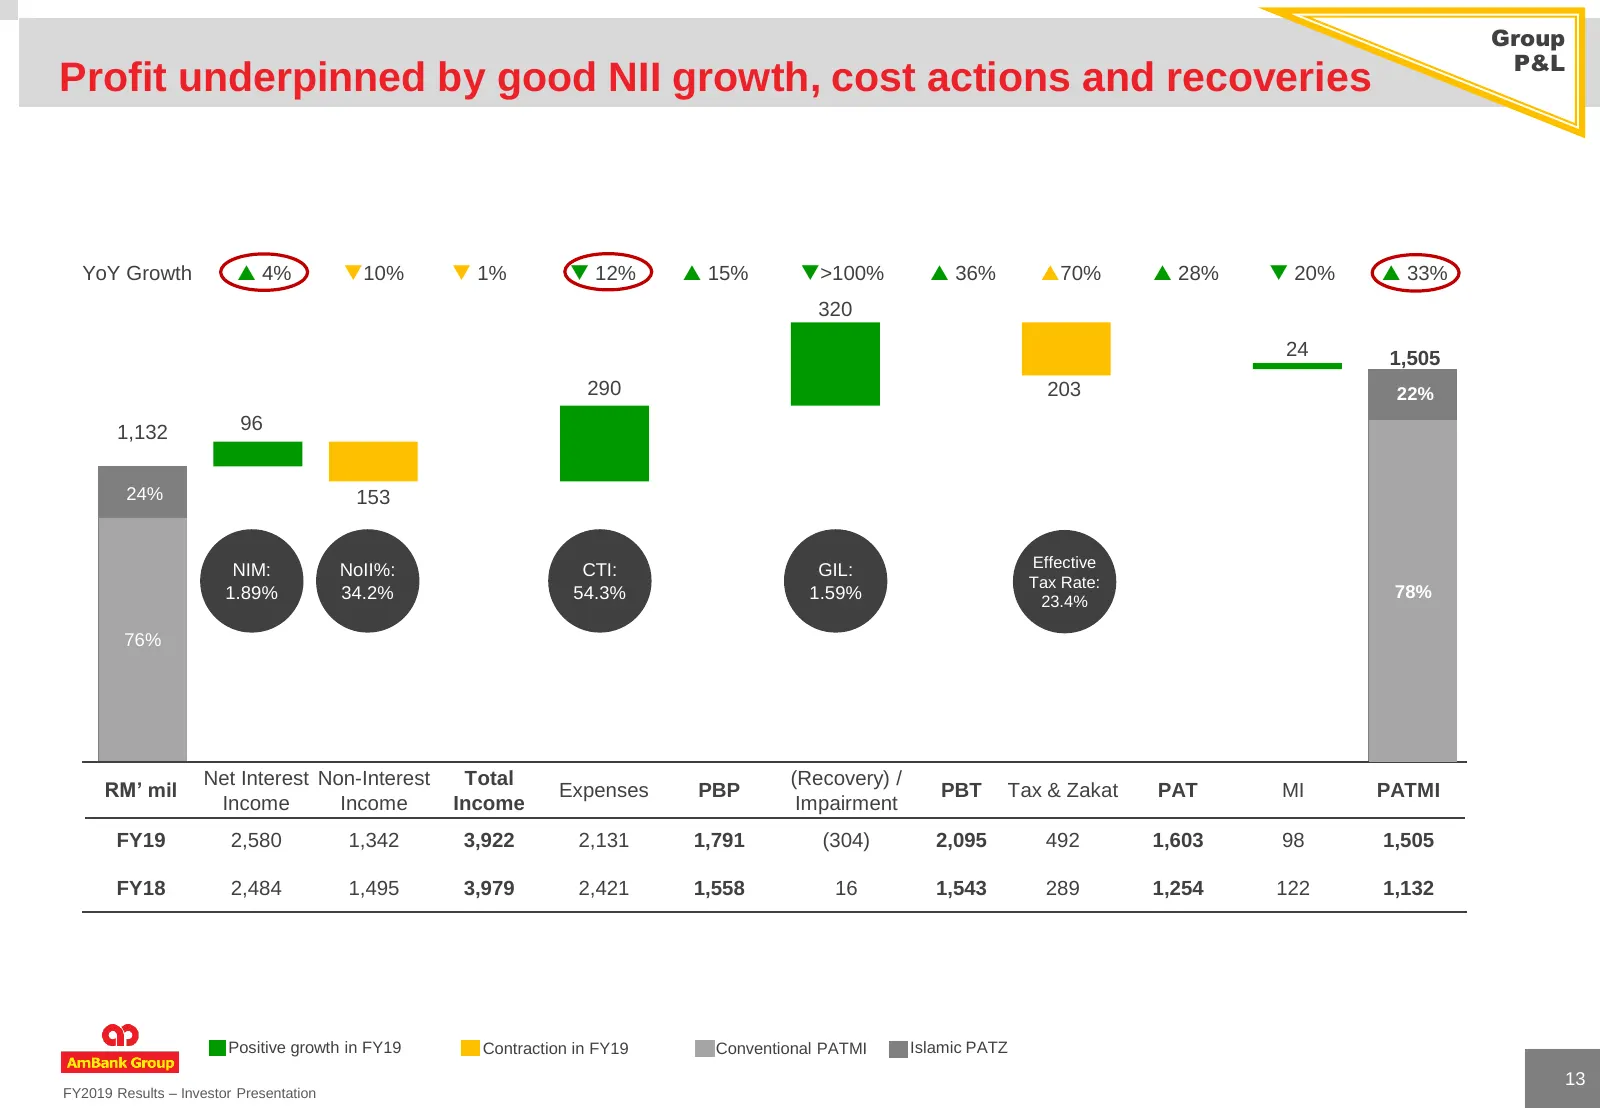
Group P&L Profit underpinned by good NII growth, cost actions and recoveries YoY Growth 4% 10% 1% 12% 15% >100% 36% 70% 28% 20% 33% 320 24 1,505 290 203 22% 1,132 96 24% 153 Effective NIM: NoII%: CTI: GIL: Tax Rate: 1.89% 34.2% 54.3% 1.59% 78% 23.4% 76% Net Interest Non-Interest T
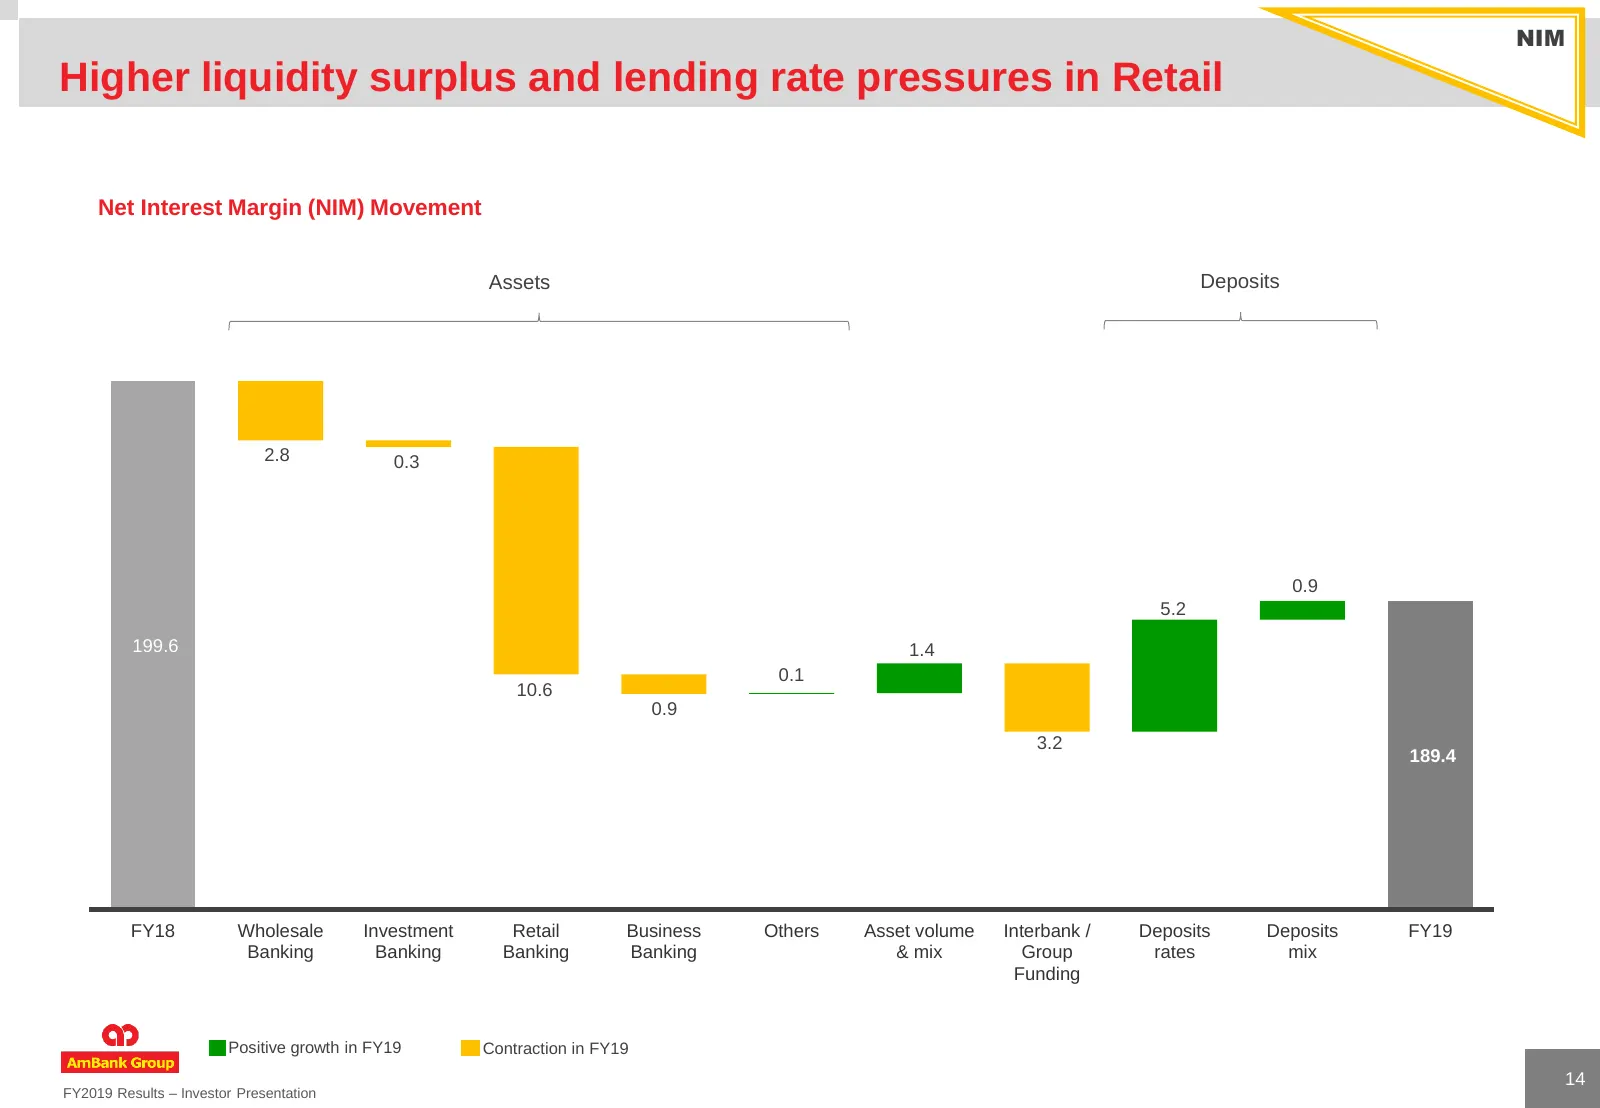
Slide 14: Higher liquidity surplus and lending rate pressures in Retail
NIM Higher liquidity surplus and lending rate pressures in Retail Net Interest Margin (NIM) Movement Assets Deposits 2.8 0.3 0.9 5.2 199.6 1.4 0.1 10.6 0.9 3.2 189.4 FY18 Wholesale Investment Retail Business Others Asset volume Interbank / Deposits Deposits FY19 Banking Banking Banking Banking & mix
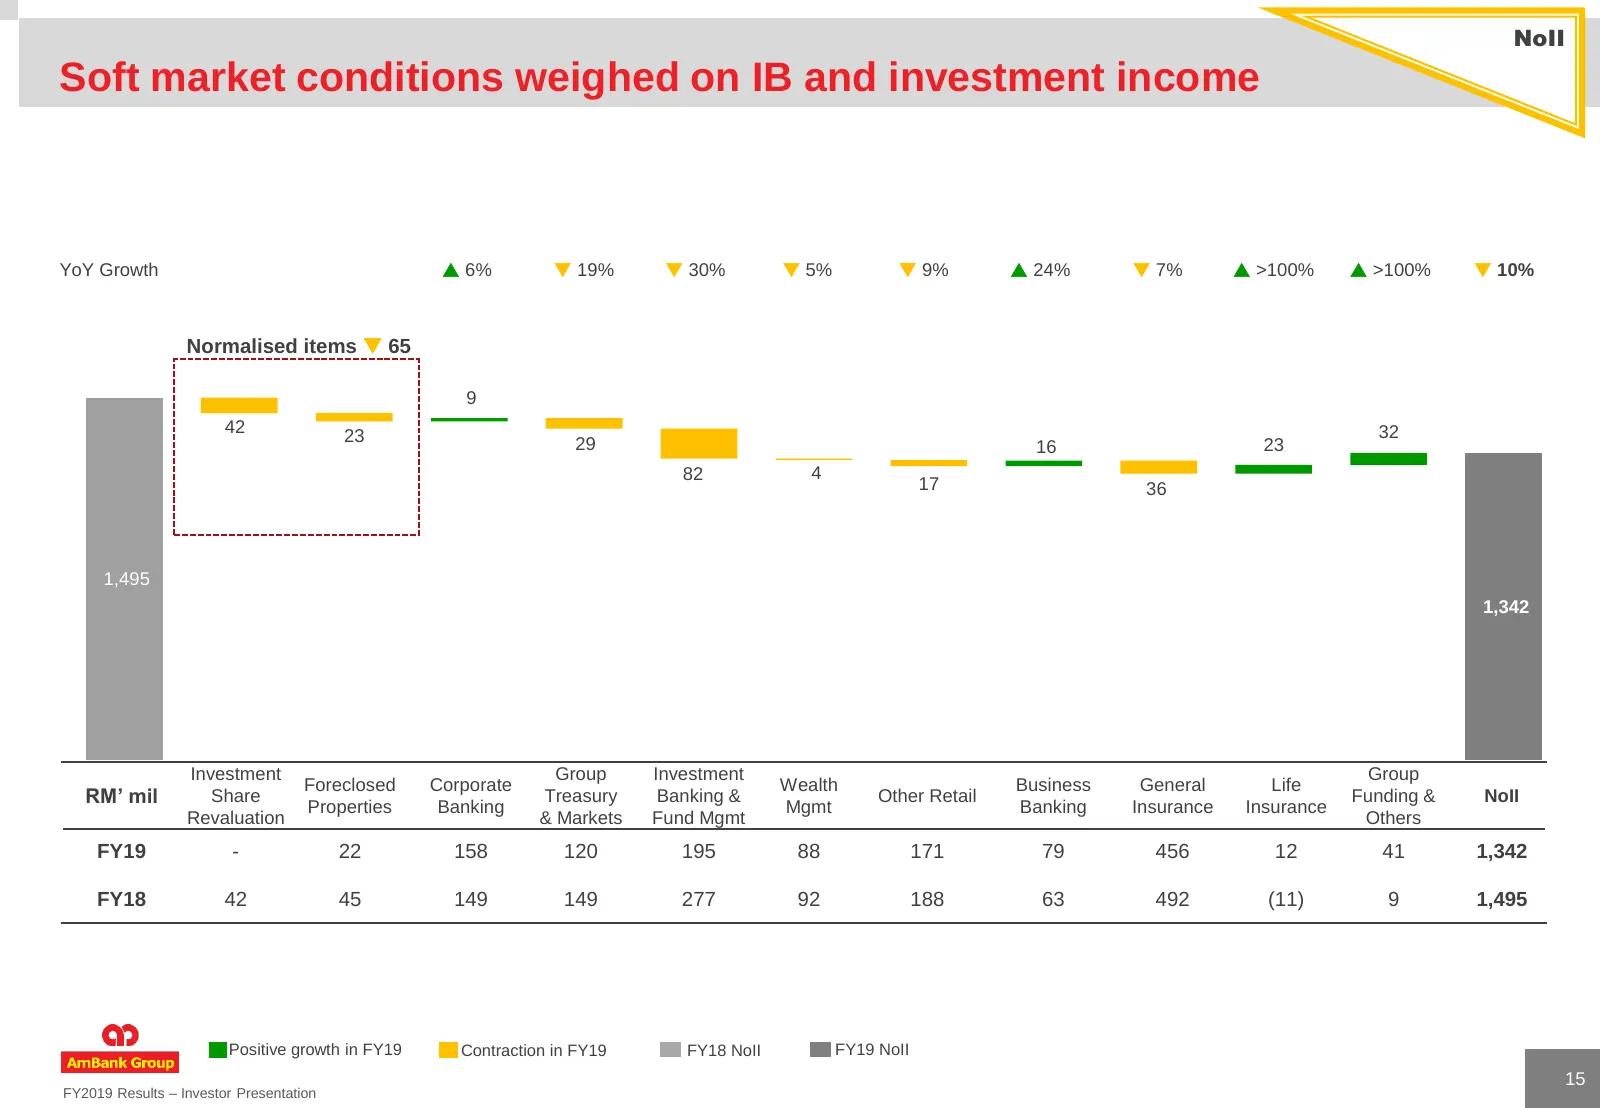
Slide 15: Soft market conditions weighed on IB and investment income
NoII Soft market conditions weighed on IB and investment income YoY Growth 6% 19% 30% 5% 9% 24% 7% >100% >100% 10% Normalised items 65 9 42 23 32 29 16 23 82 4 17 36 1,495 1,342 Investment Group Investment Group Foreclosed Corporate Wealth Business General Life RM’ mil Share Tr
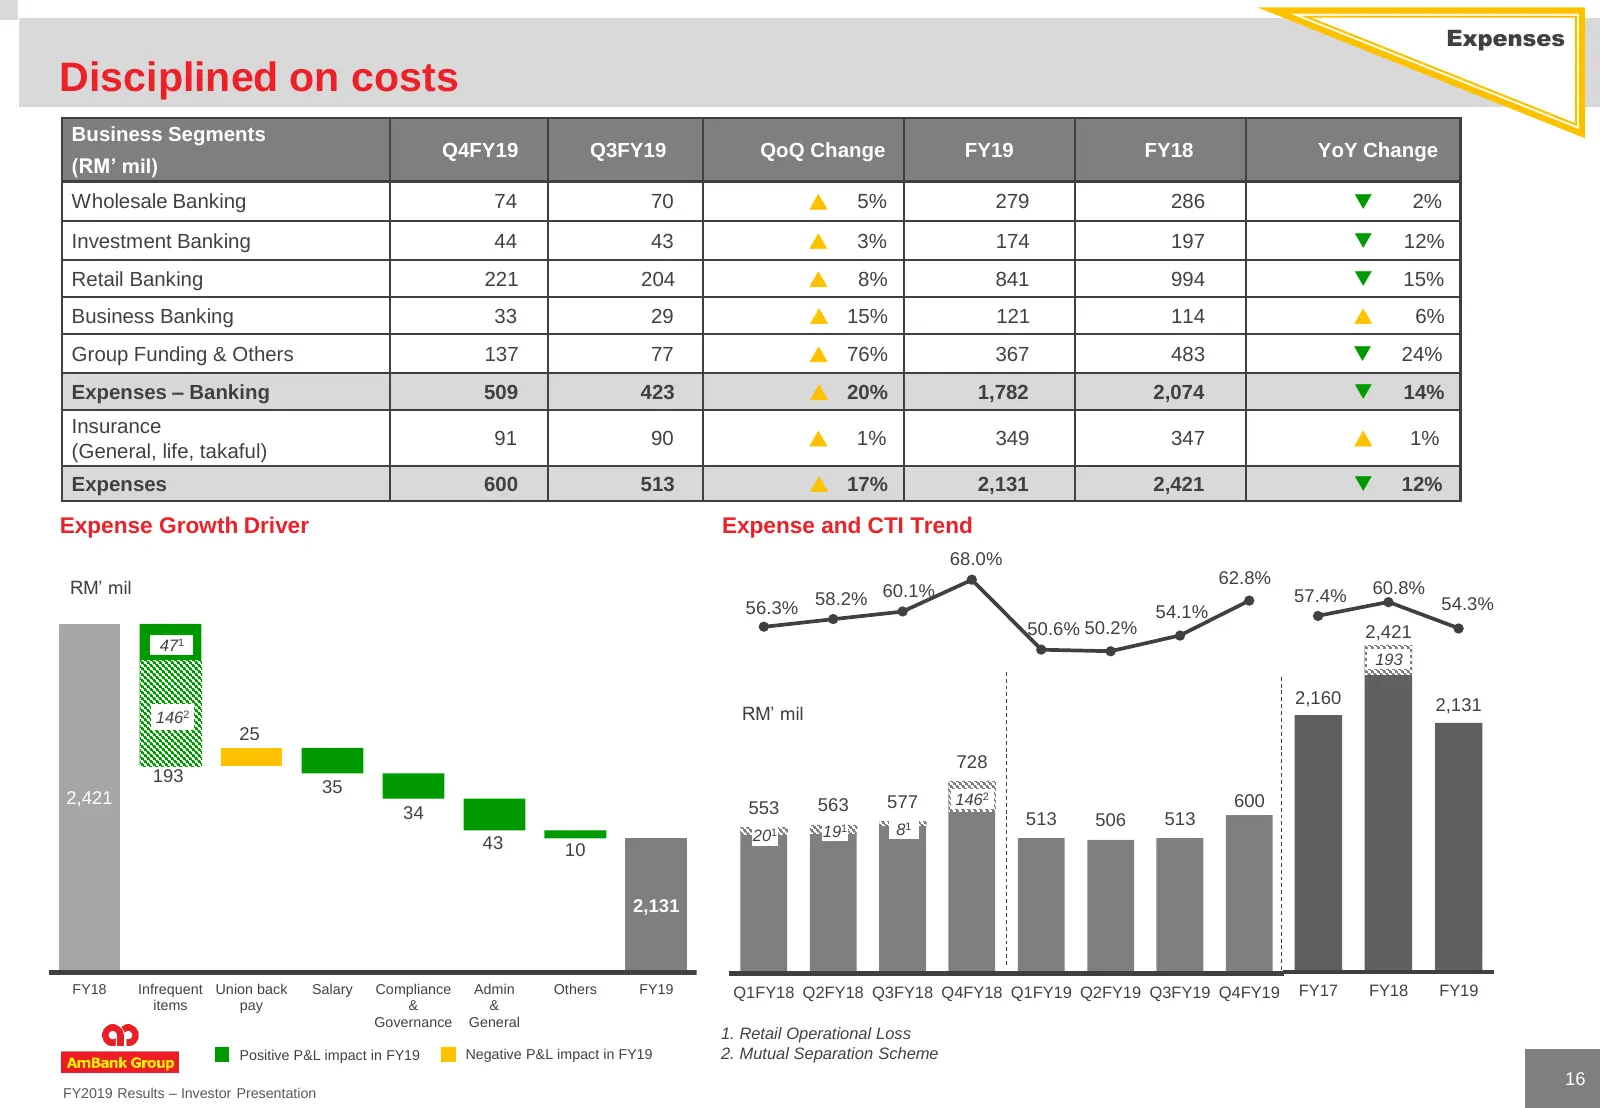
Slide 16: Disciplined on costs
Expenses Disciplined on costs Business Segments Q4FY19 Q3FY19 QoQ Change FY19 FY18 YoY Change (RM’ mil) Wholesale Banking 74 70 5% 279 286 2% Investment Banking 44 43 3% 174 197 12% Retail Banking 221 204 8% 841 994 15% Business Banking 33 29 15% 121 114 6% Group Funding & Others 137
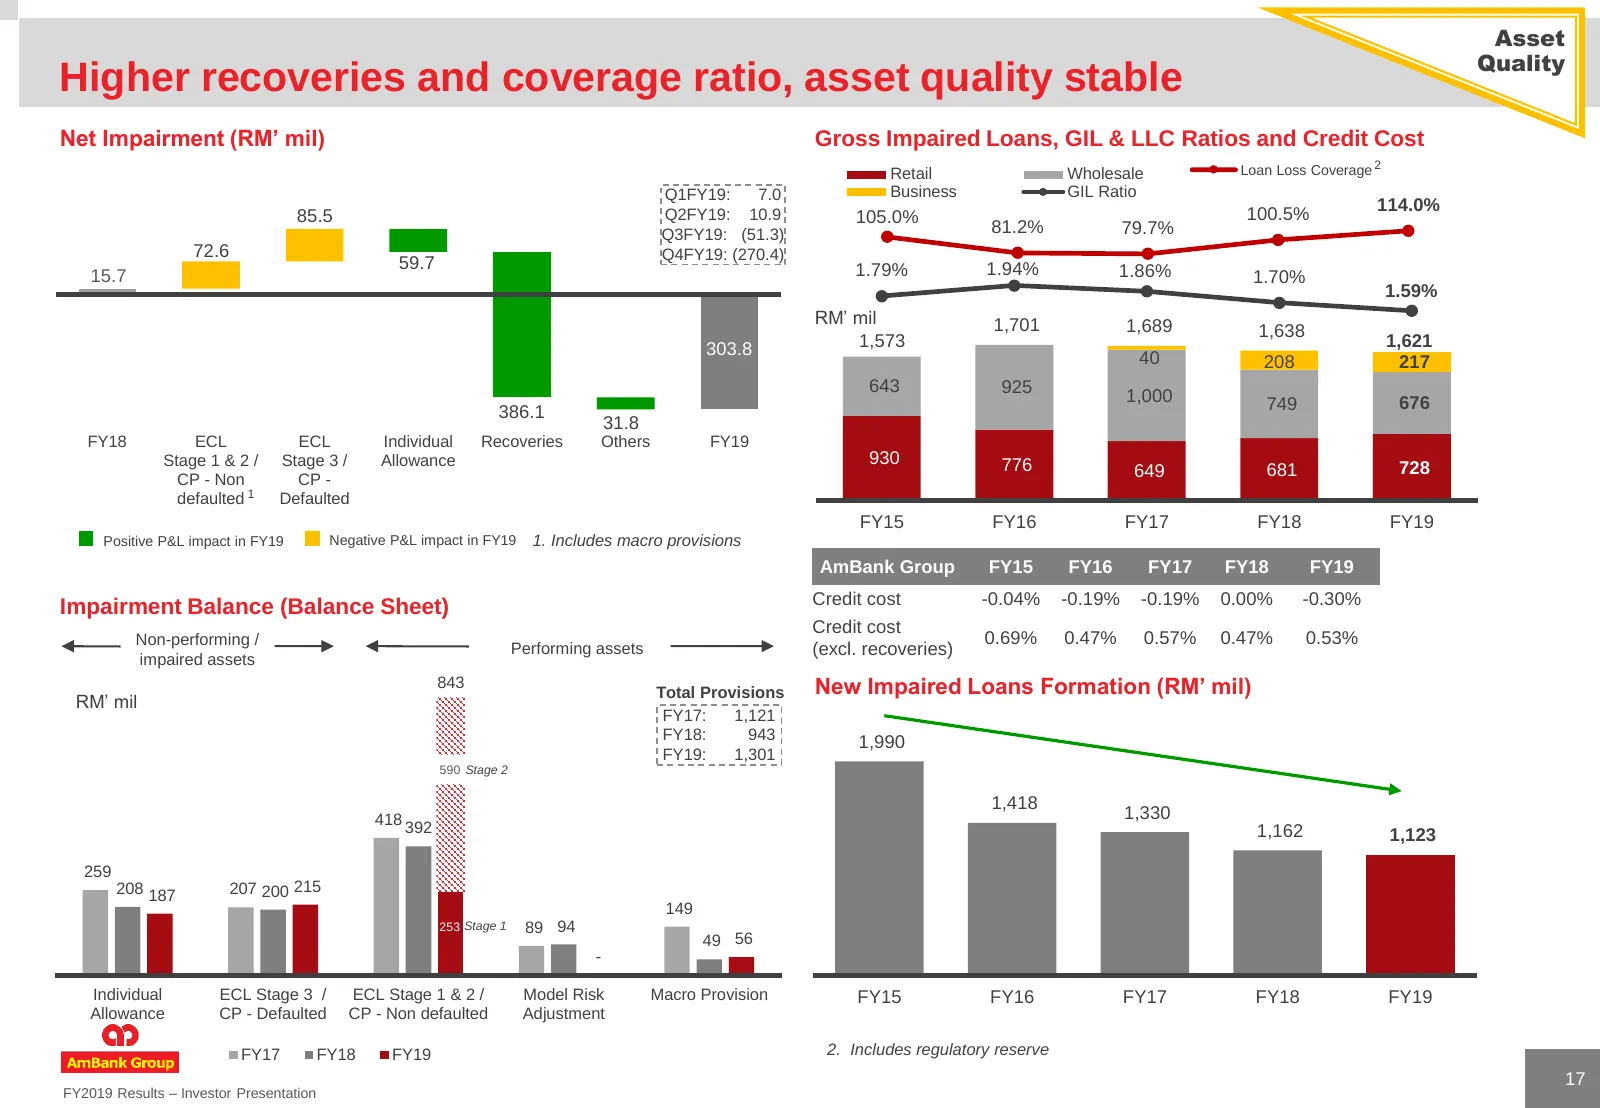
Slide 17: Higher recoveries and coverage ratio, asset quality stable
Asset Quality Higher recoveries and coverage ratio, asset quality stable Net Impairment (RM’ mil) Gross Impaired Loans, GIL & LLC Ratios and Credit Cost Retail Wholesale Loan Loss Coverage 2 Q1FY19: 7.0 Business GIL Ratio Q2FY19: 10.9 100.5% 114.0% 85.5 105.0% Q3FY19: (51.3) 81.2% 79.7% 72.6 Q4FY19:
Slide 18: Stable asset quality
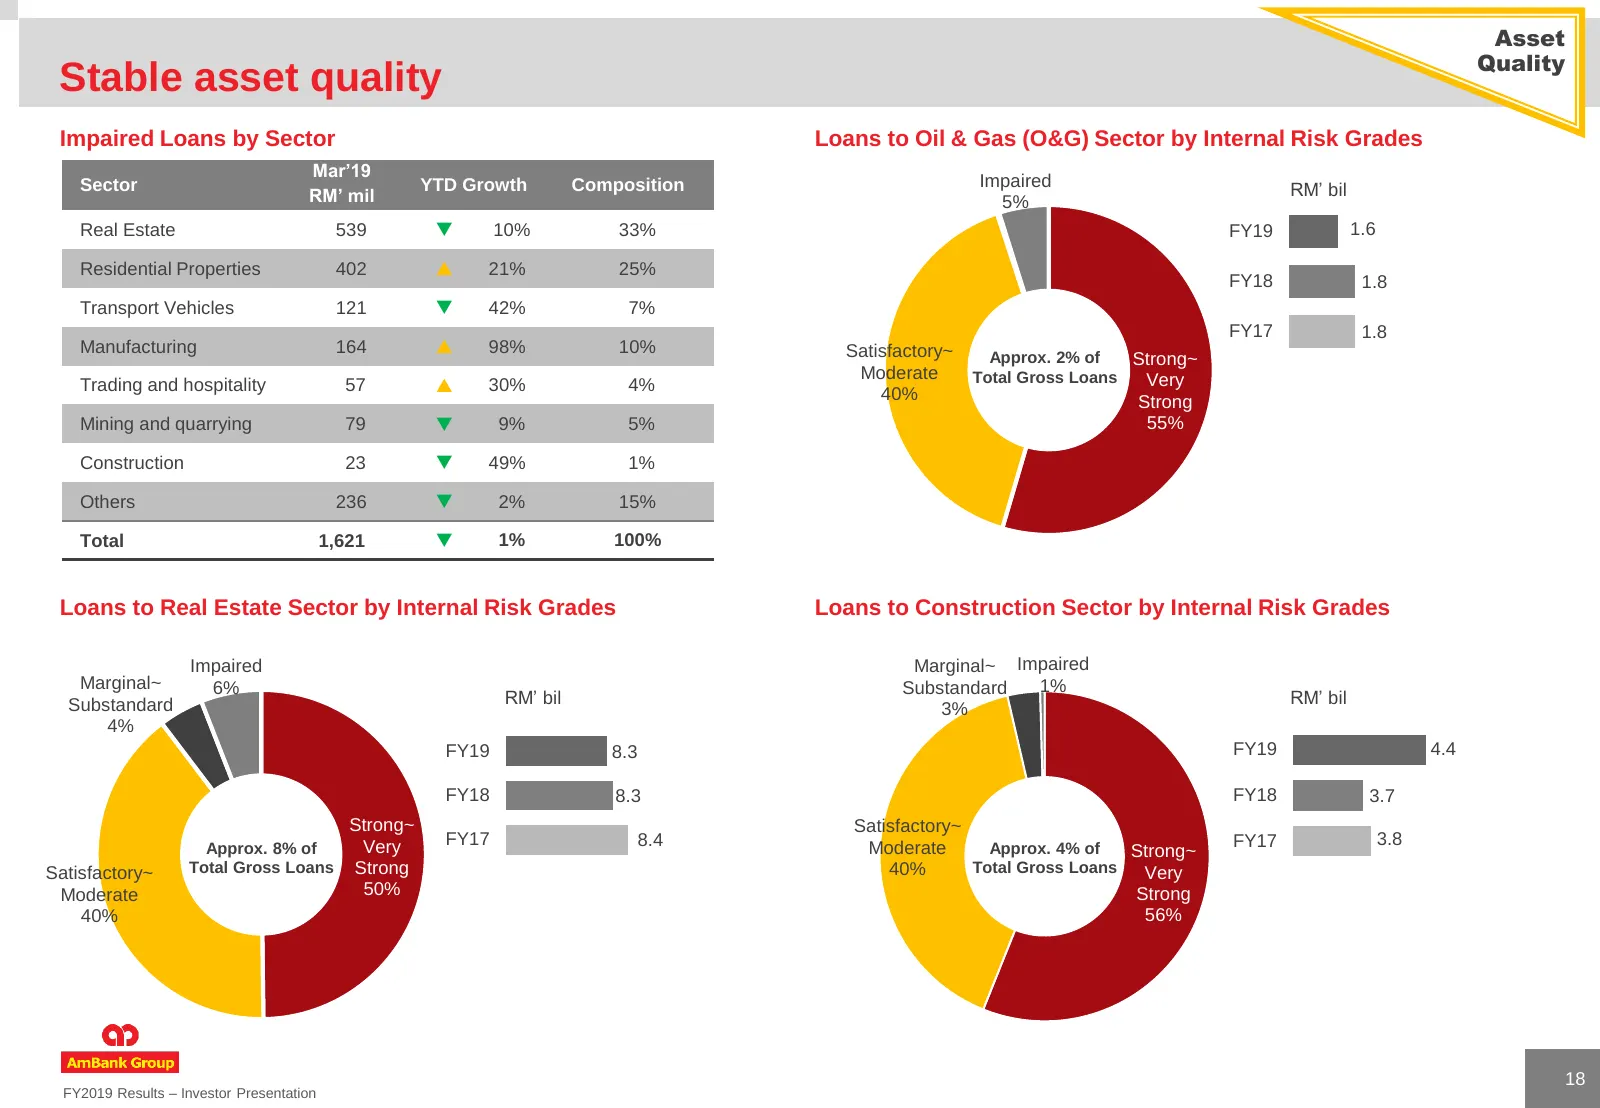
Asset Quality Stable asset quality Impaired Loans by Sector Loans to Oil & Gas (O&G) Sector by Internal Risk Grades Mar’19 Sector YTD Growth Composition Impaired RM’ mil RM’ bil 5% Real Estate 539 10% 33% FY19 1.6 Residential Properties 402 21% 25% FY18 1.8 Transport Vehicles 121 42% 7% FY17 1
Slide 19: Unpacking the normalised items – FY19
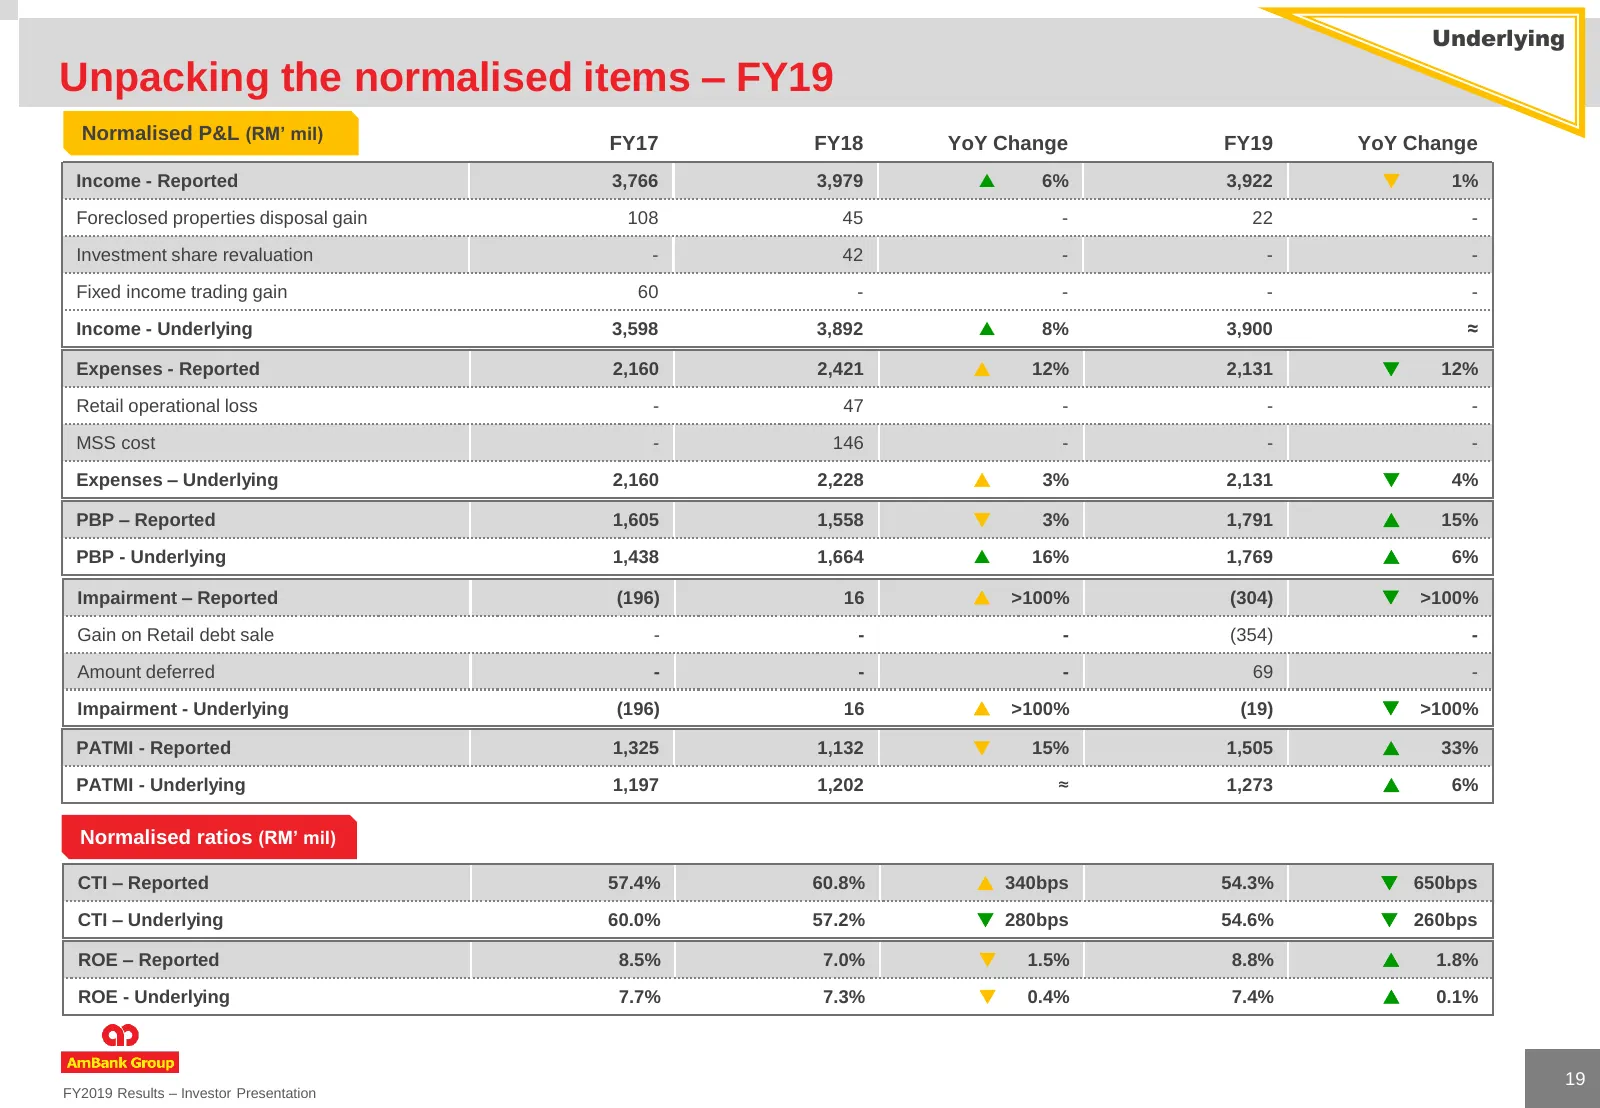
Underlying Unpacking the normalised items – FY19 Normalised P&L (RM’ mil) FY17 FY18 YoY Change FY19 YoY Change Income - Reported 3,766 3,979 6% 3,922 1% Foreclosed properties disposal gain 108 45 - 22 - Investment share revaluation - 42 - - - Fixed income trading gain 60 - - - - Income - Underly
Slide 20: Good loans growth in targeted segments
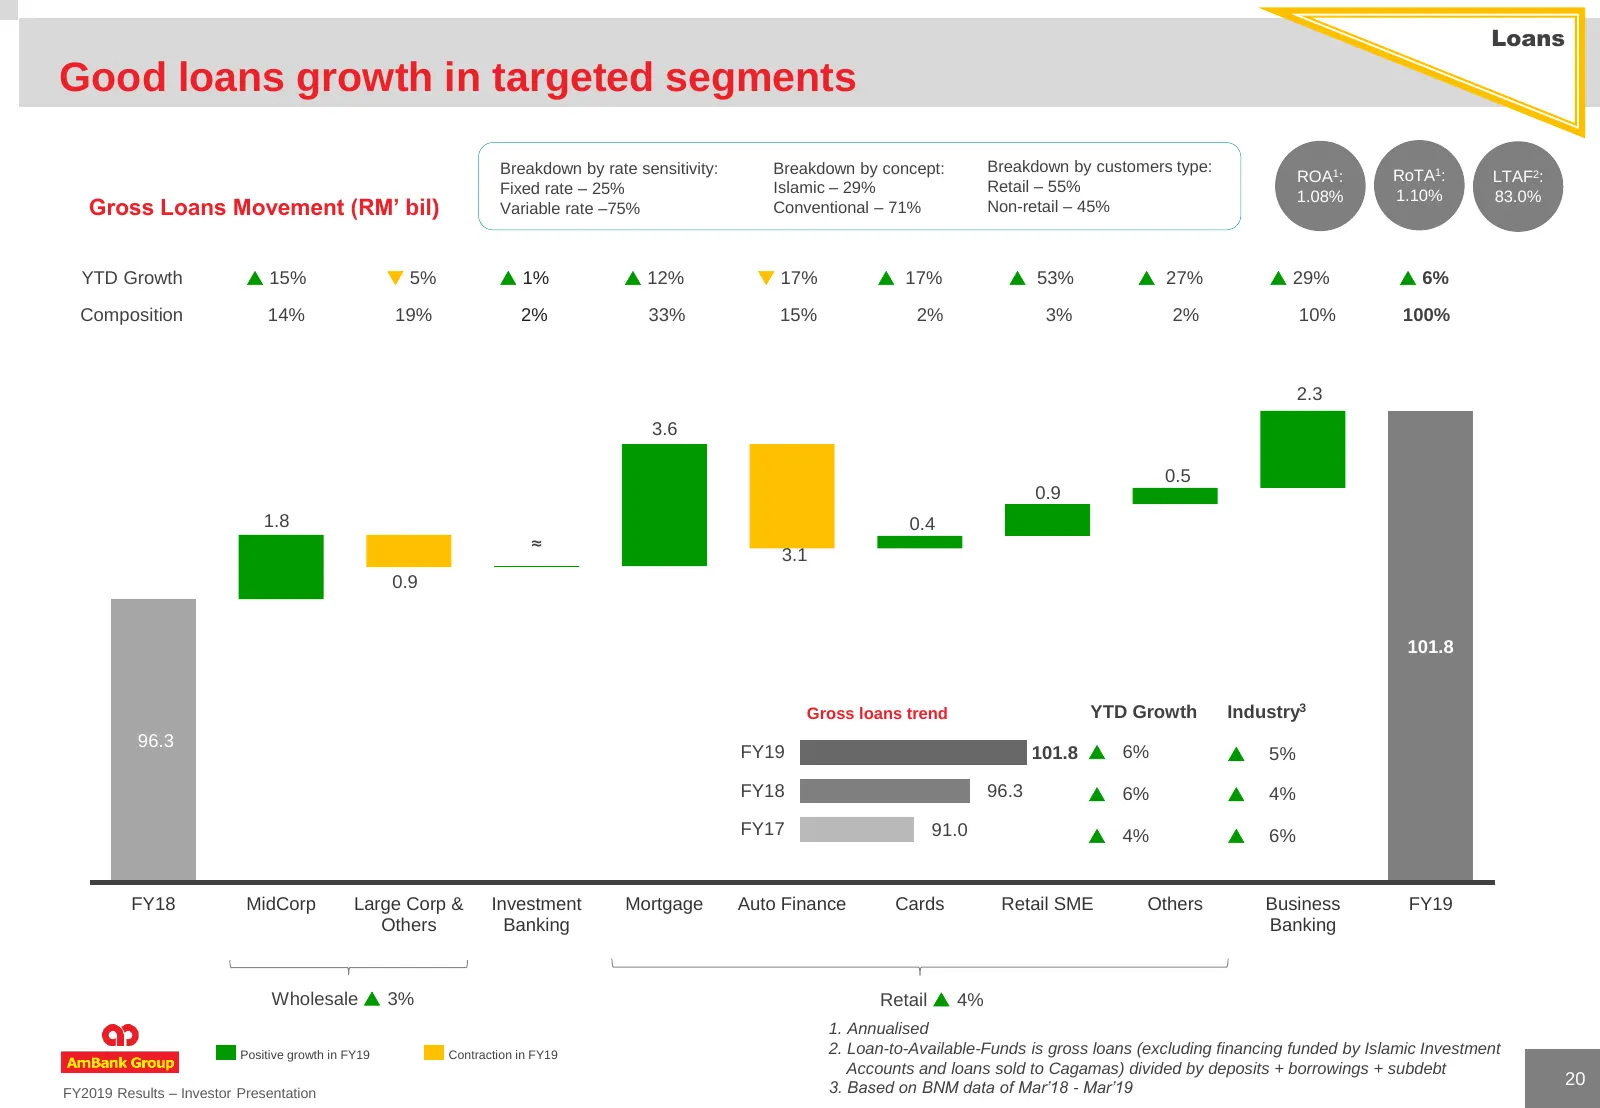
Loans Good loans growth in targeted segments Breakdown by rate sensitivity: Breakdown by concept: Breakdown by customers type: ROA1: RoTA1: LTAF2: Fixed rate – 25% Islamic – 29% Retail – 55% 1.08% 1.10% 83.0% Gross Loans Movement (RM’ bil) Variable rate –75% Conventional – 71% Non-retail – 45% YTD G
Slide 21: Strong deposits growth
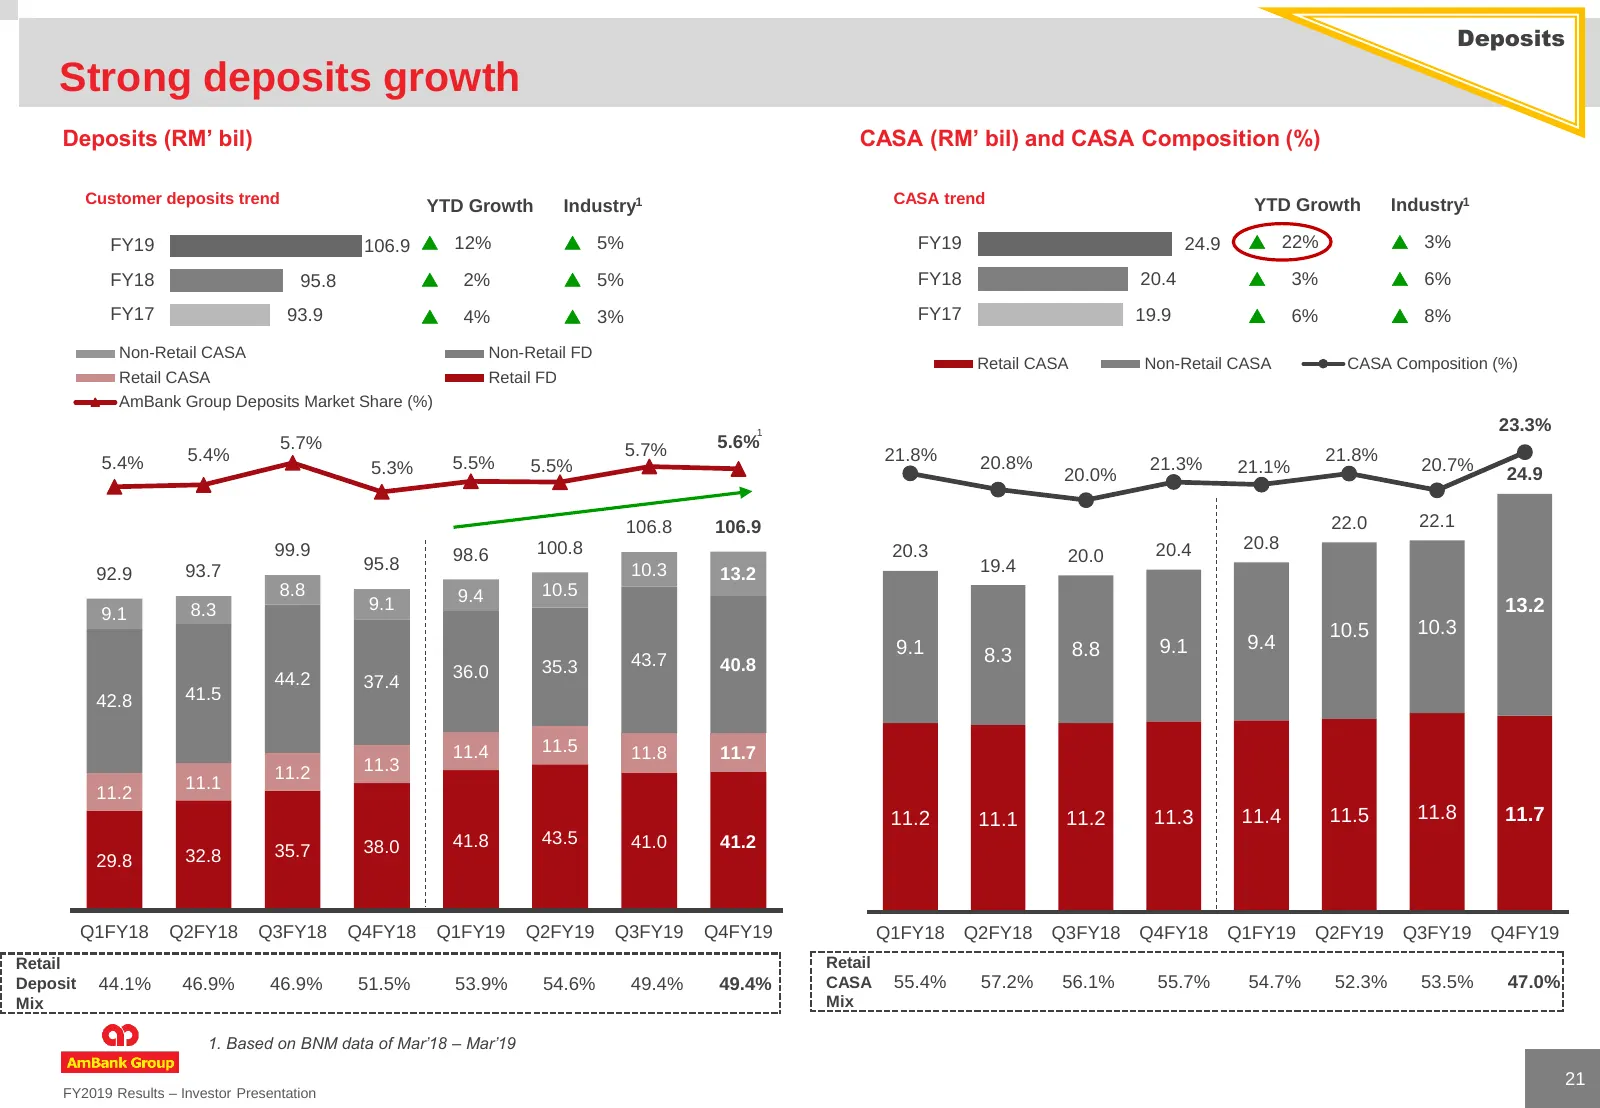
Deposits Strong deposits growth Deposits (RM’ bil) CASA (RM’ bil) and CASA Composition (%) Customer deposits trend CASA trend Industry1 YTD Growth Industry1 YTD Growth FY19 106.9 12% 5% FY19 24.9 22% 3% FY18 95.8 2% 5% FY18 20.4 3% 6% FY17 93.9 4% 3% FY17 19.9 6% 8% Non-Retai
Slide 22: Capital accretive
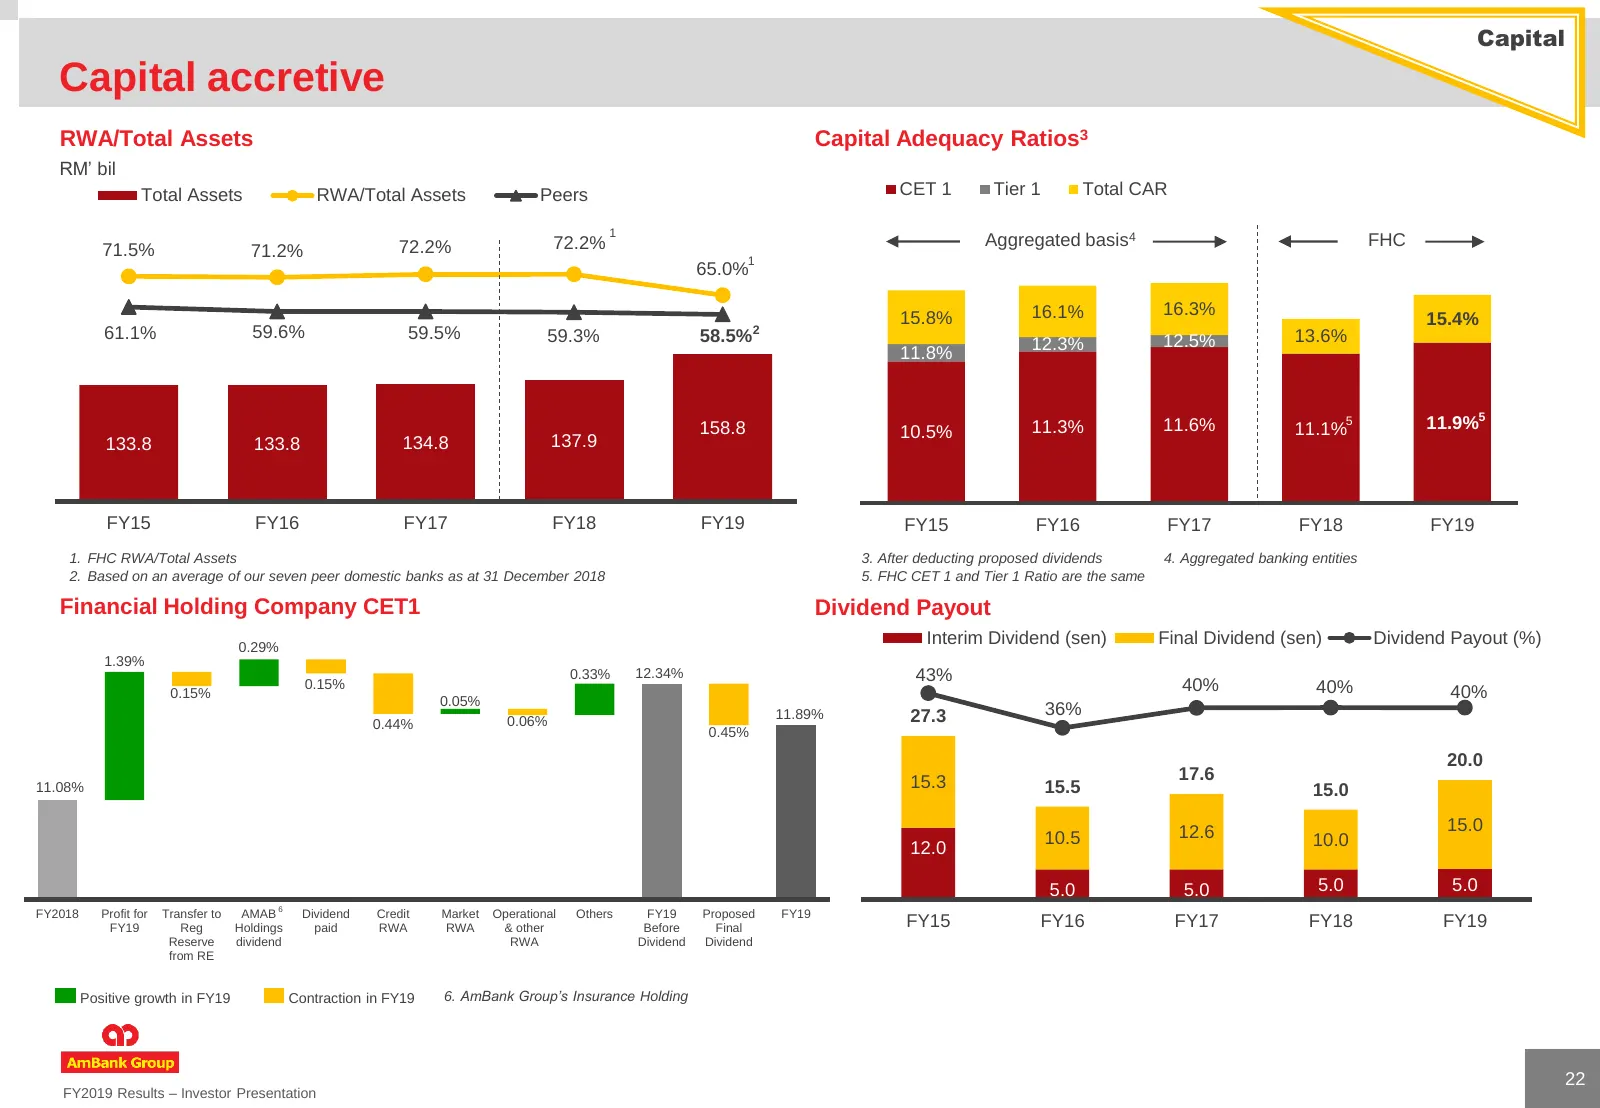
Capital Capital accretive RWA/Total Assets Capital Adequacy Ratios3 RM’ bil Total Assets RWA/Total Assets Peers CET 1 Tier 1 Total CAR 1 71.5% 72.2% 72.2% Aggregated basis4 FHC 71.2% 1 65.0% 15.8% 16.1% 16.3% 15.4% 61.1% 59.6% 59.5% 59.3% 58.5%2 12.5% 13.6% 11.8% 12.3% 158.8 11.3% 11.6% 11.1%5 11.9%
Slide 23: Guidance & Expectations
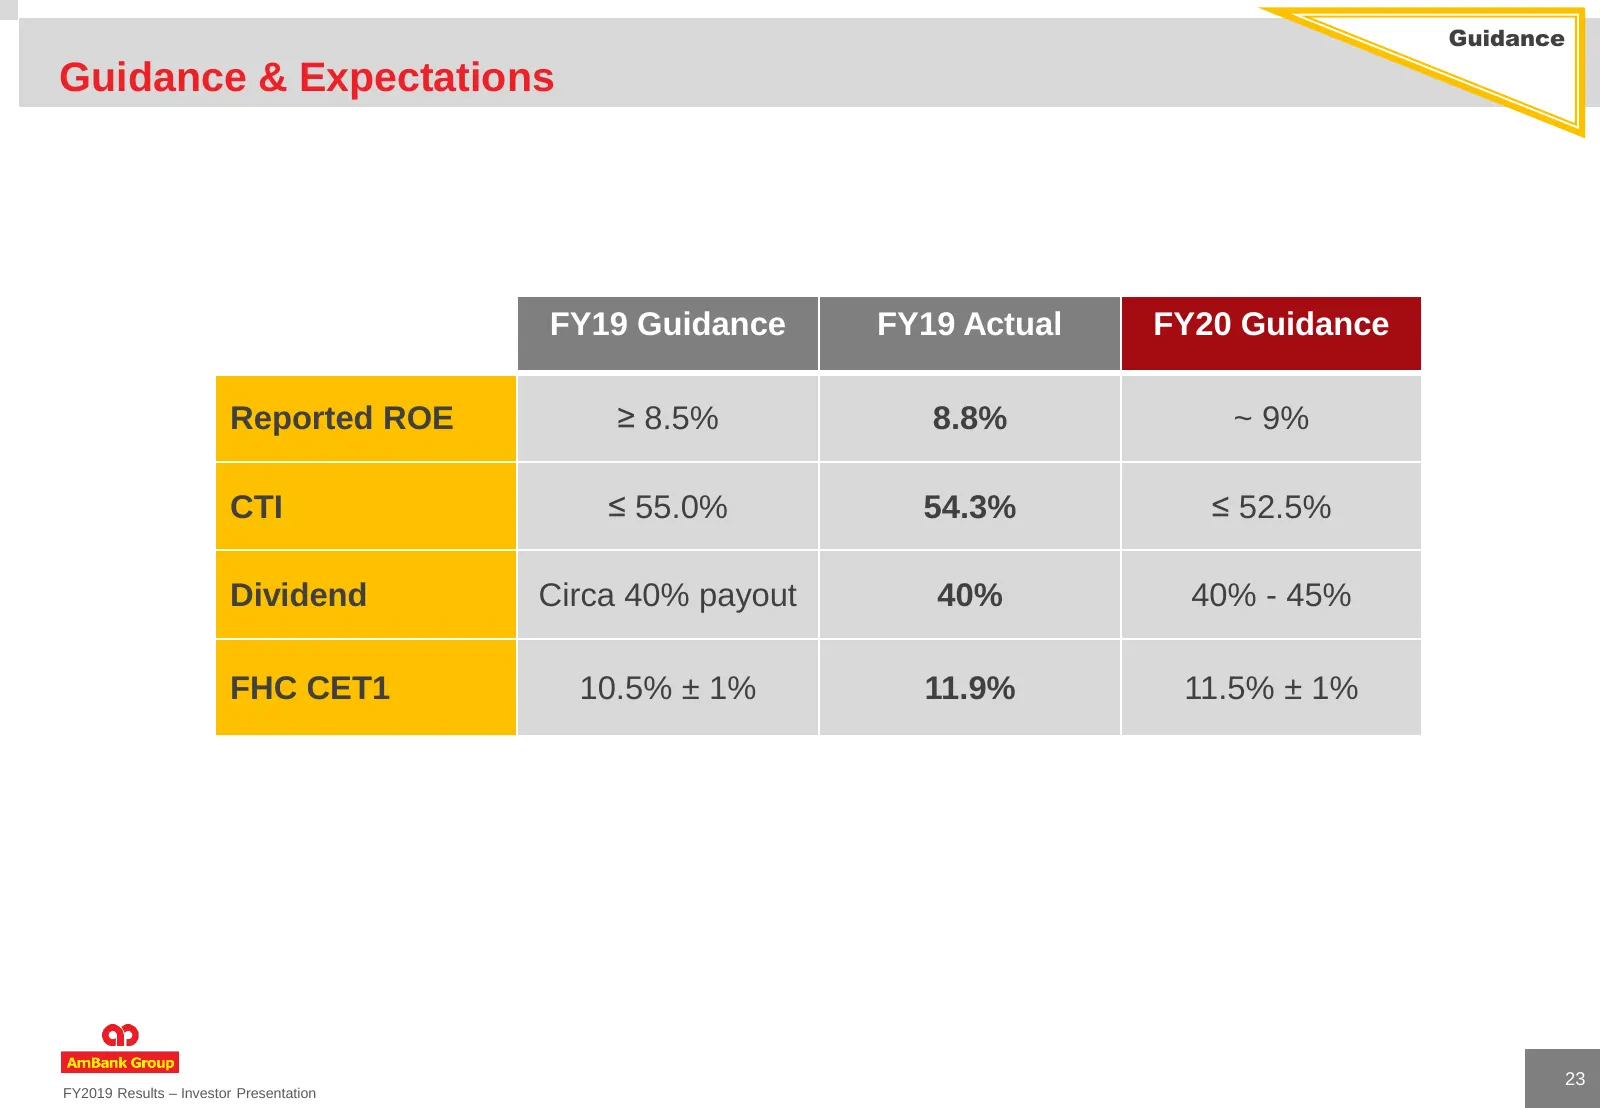
Guidance Guidance & Expectations FY19 Guidance FY19 Actual FY20 Guidance Reported ROE ≥ 8.5% 8.8% ~ 9% CTI ≤ 55.0% 54.3% ≤ 52.5% Dividend Circa 40% payout 40% 40% - 45% FHC CET1 10.5% ± 1% 11.9% 11.5% ± 1% 23 FY2019 Results – Investor Presentation
Slide 24: FY20 Financial agenda
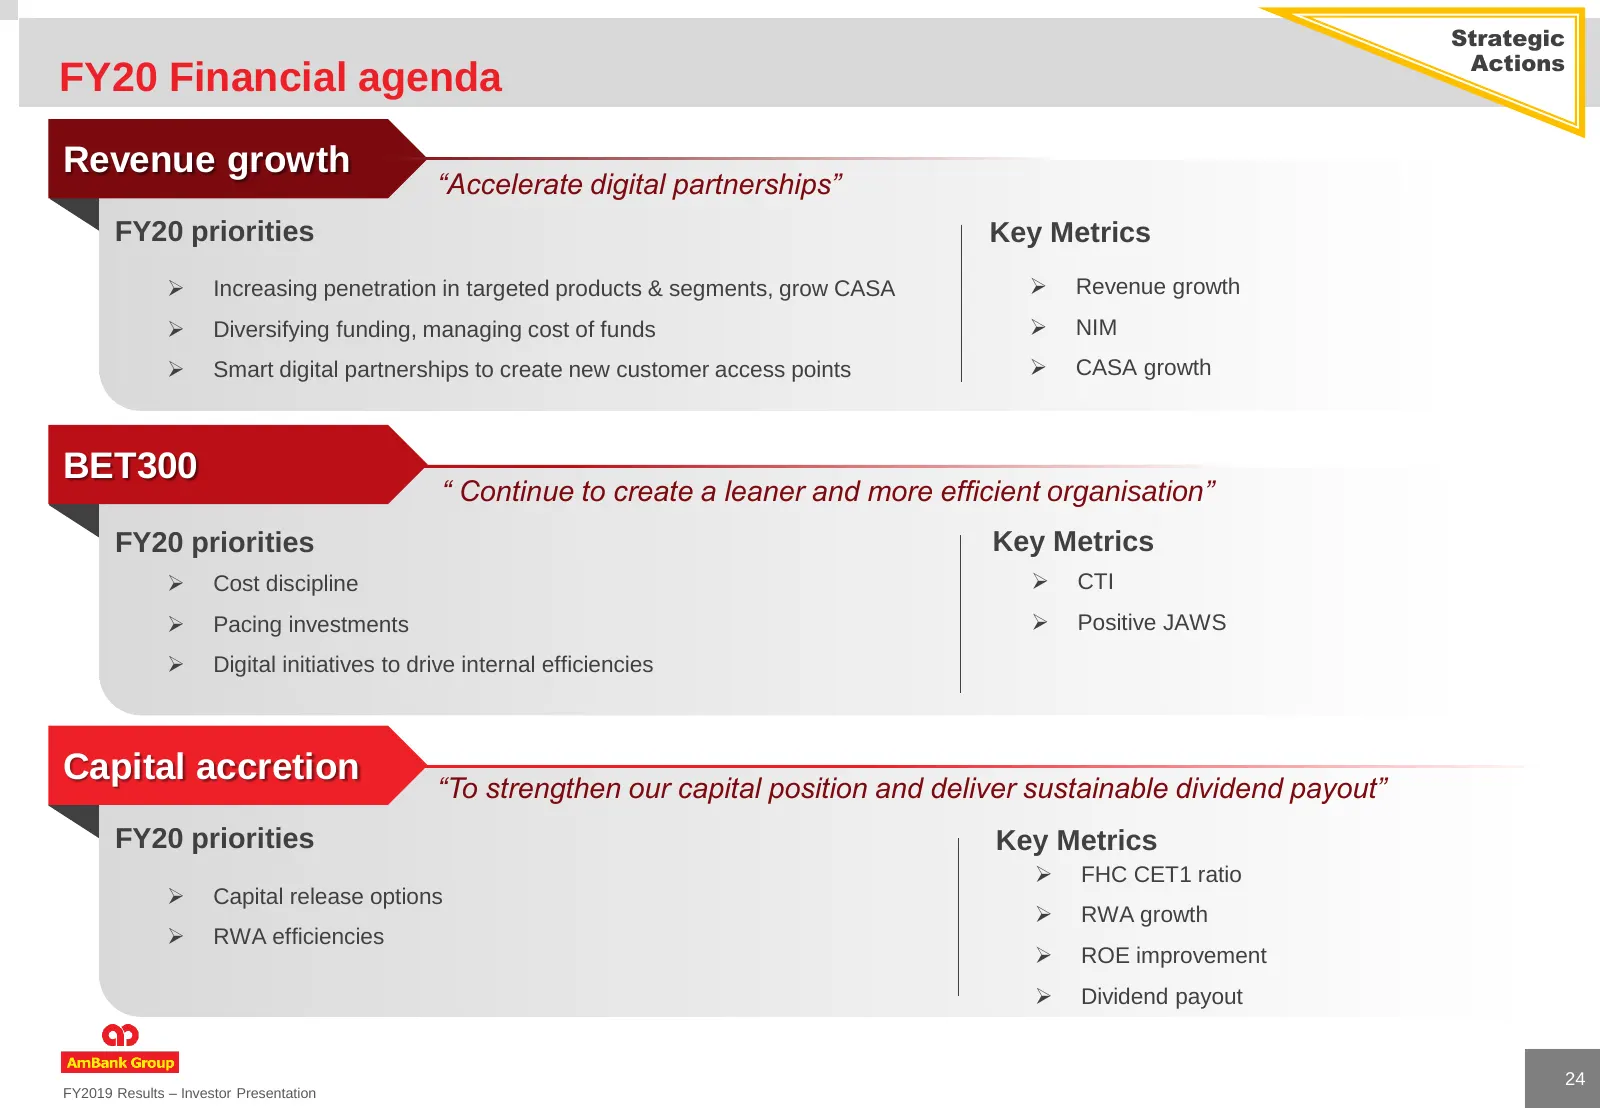
Strategic Actions FY20 Financial agenda Revenue growth “Accelerate digital partnerships” FY20 priorities Key Metrics ➢ Increasing penetration in targeted products & segments, grow CASA ➢ Revenue growth ➢ Diversifying funding, managing cost of funds ➢ NIM ➢ Smart digital partnerships to create new cu

Slide 25: Thank You
Thank You

Slide 26: Group Performance
Group Performance
Slide 27: Yearly performance
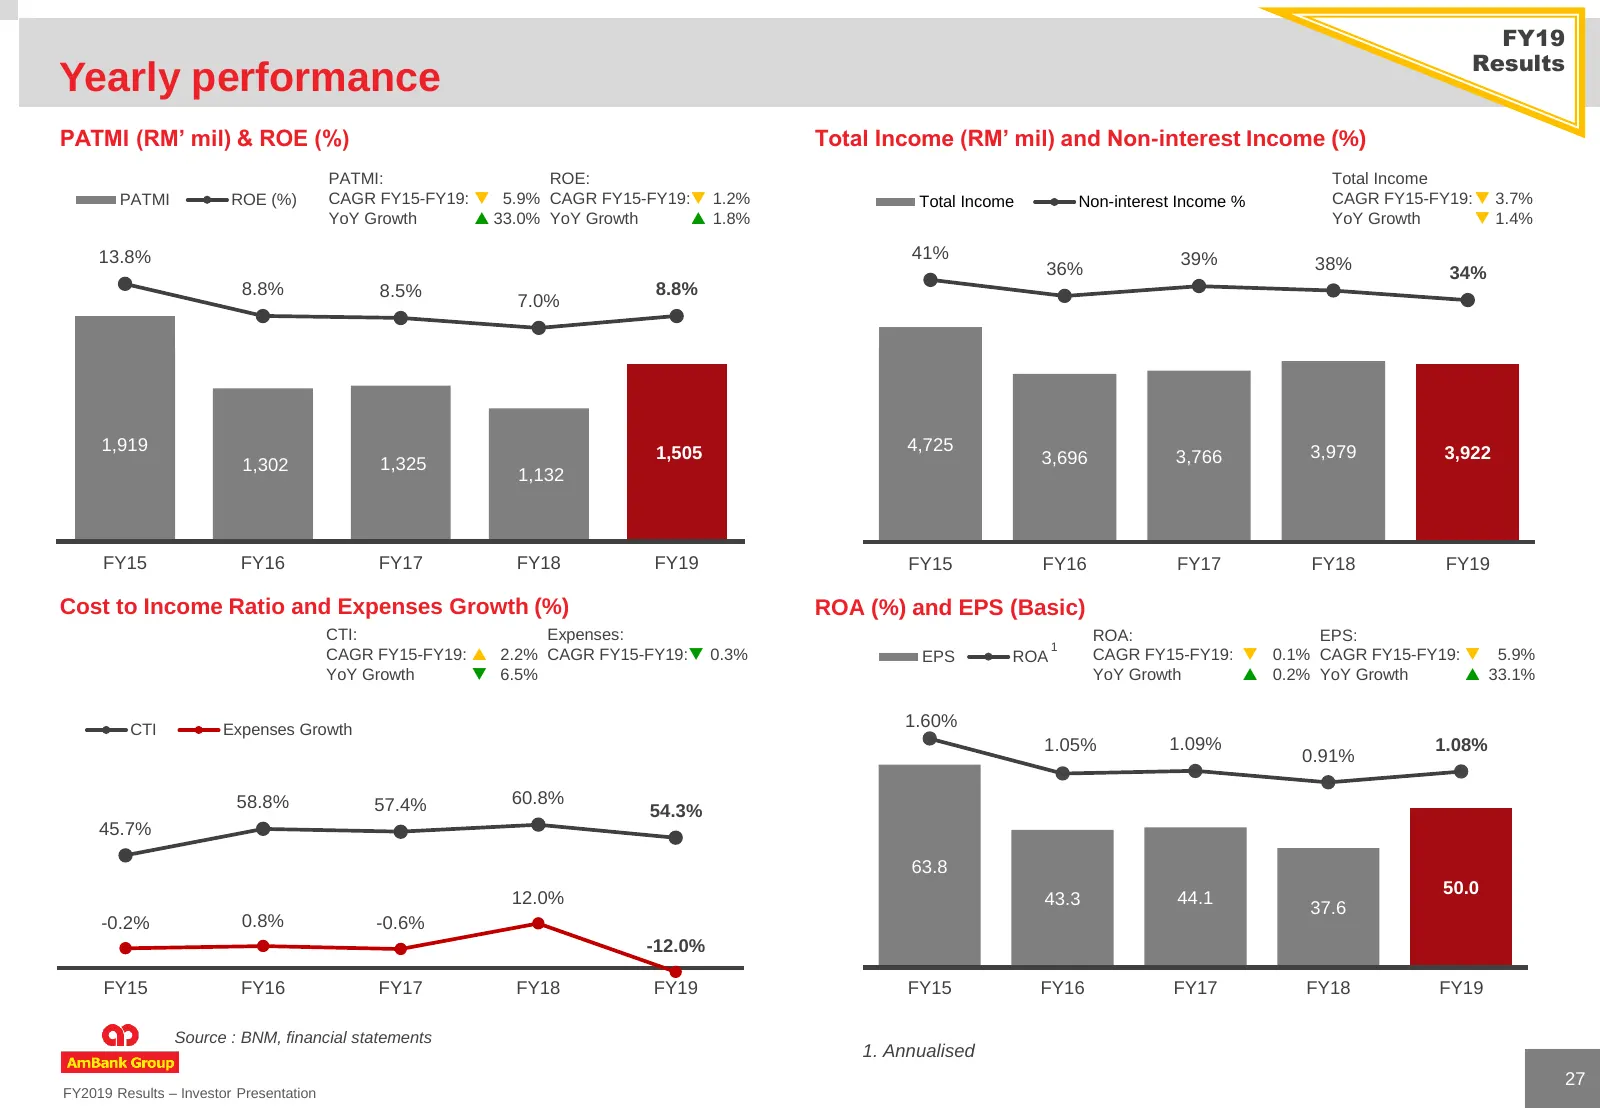
FY19 Results Yearly performance PATMI (RM’ mil) & ROE (%) Total Income (RM’ mil) and Non-interest Income (%) PATMI: ROE: Total Income PATMI ROE (%) CAGR FY15-FY19: 5.9% CAGR FY15-FY19: 1.2% Total Income Non-interest Income % CAGR FY15-FY19: 3.7% YoY Growth 33.0% YoY Growth 1.8% YoY Growth
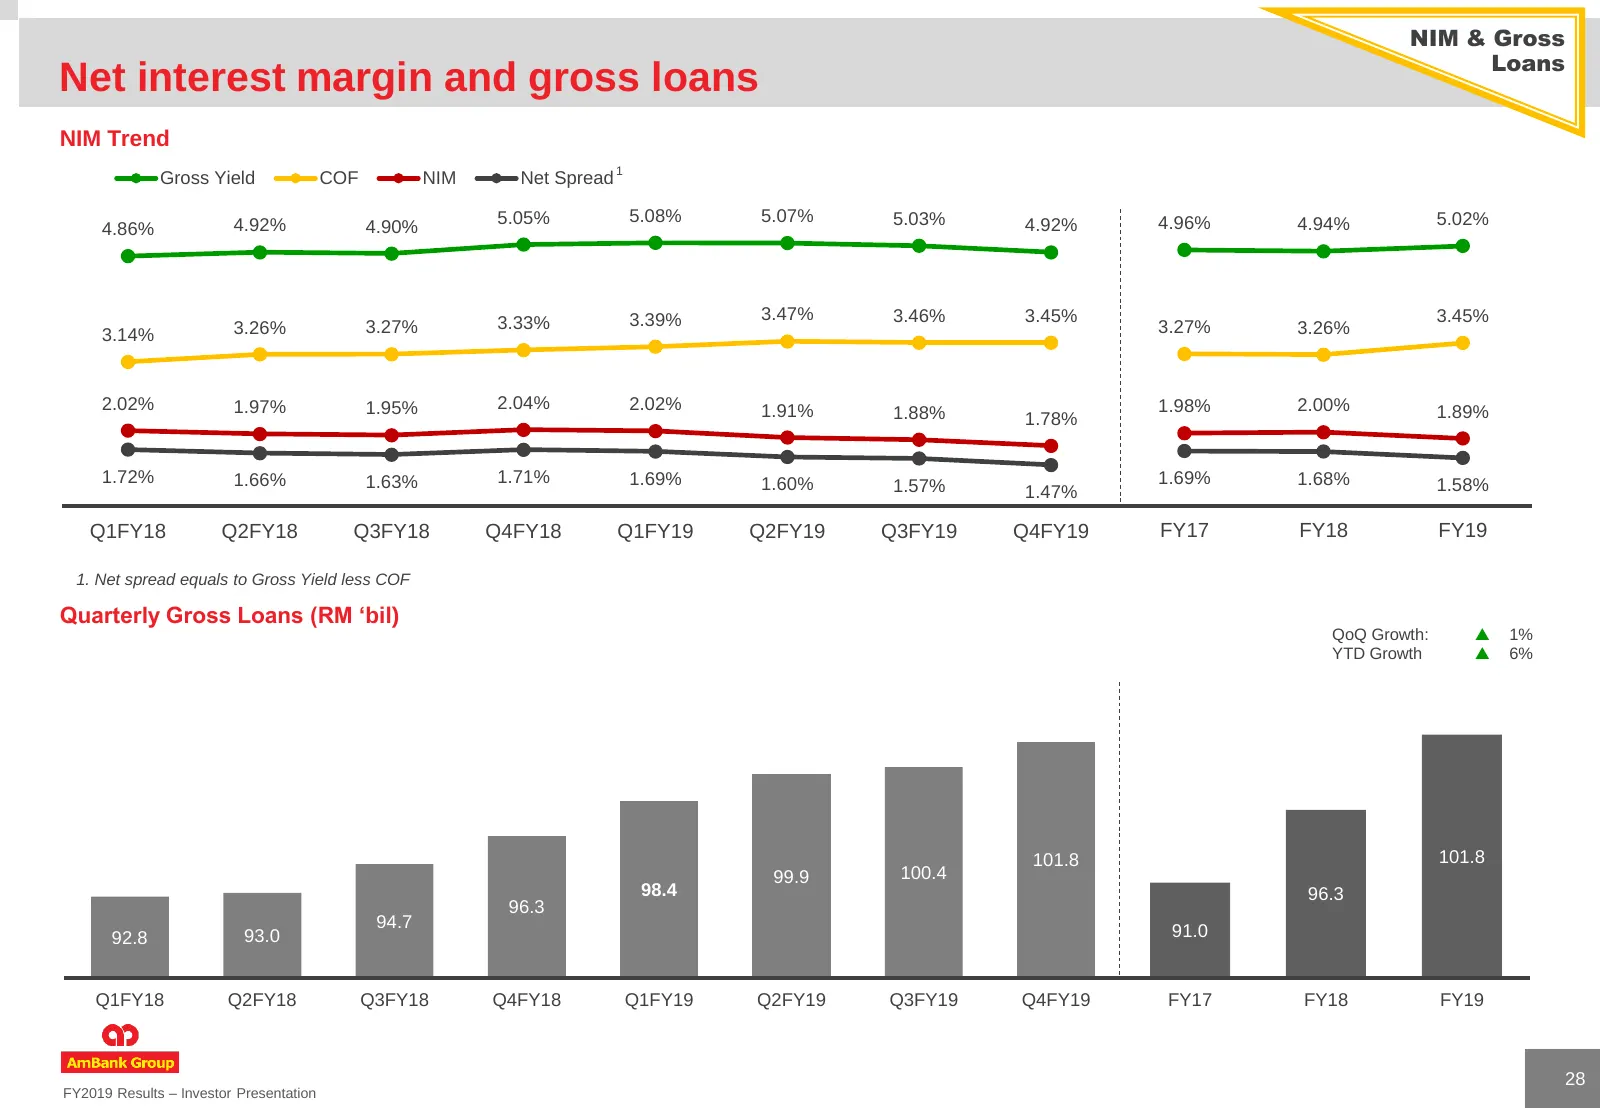
Slide 28: Net interest margin and gross loans
NIM & Gross Loans Net interest margin and gross loans NIM Trend Gross Yield COF NIM Net Spread 1 5.05% 5.08% 5.07% 5.03% 4.96% 4.94% 5.02% 4.86% 4.92% 4.90% 4.92% 3.33% 3.39% 3.47% 3.46% 3.45% 3.45% 3.14% 3.26% 3.27% 3.27% 3.26% 2.02% 1.97% 1.95% 2.04% 2.02% 1.91% 1.98% 2.00% 1.89% 1.88% 1.78% 1.72%
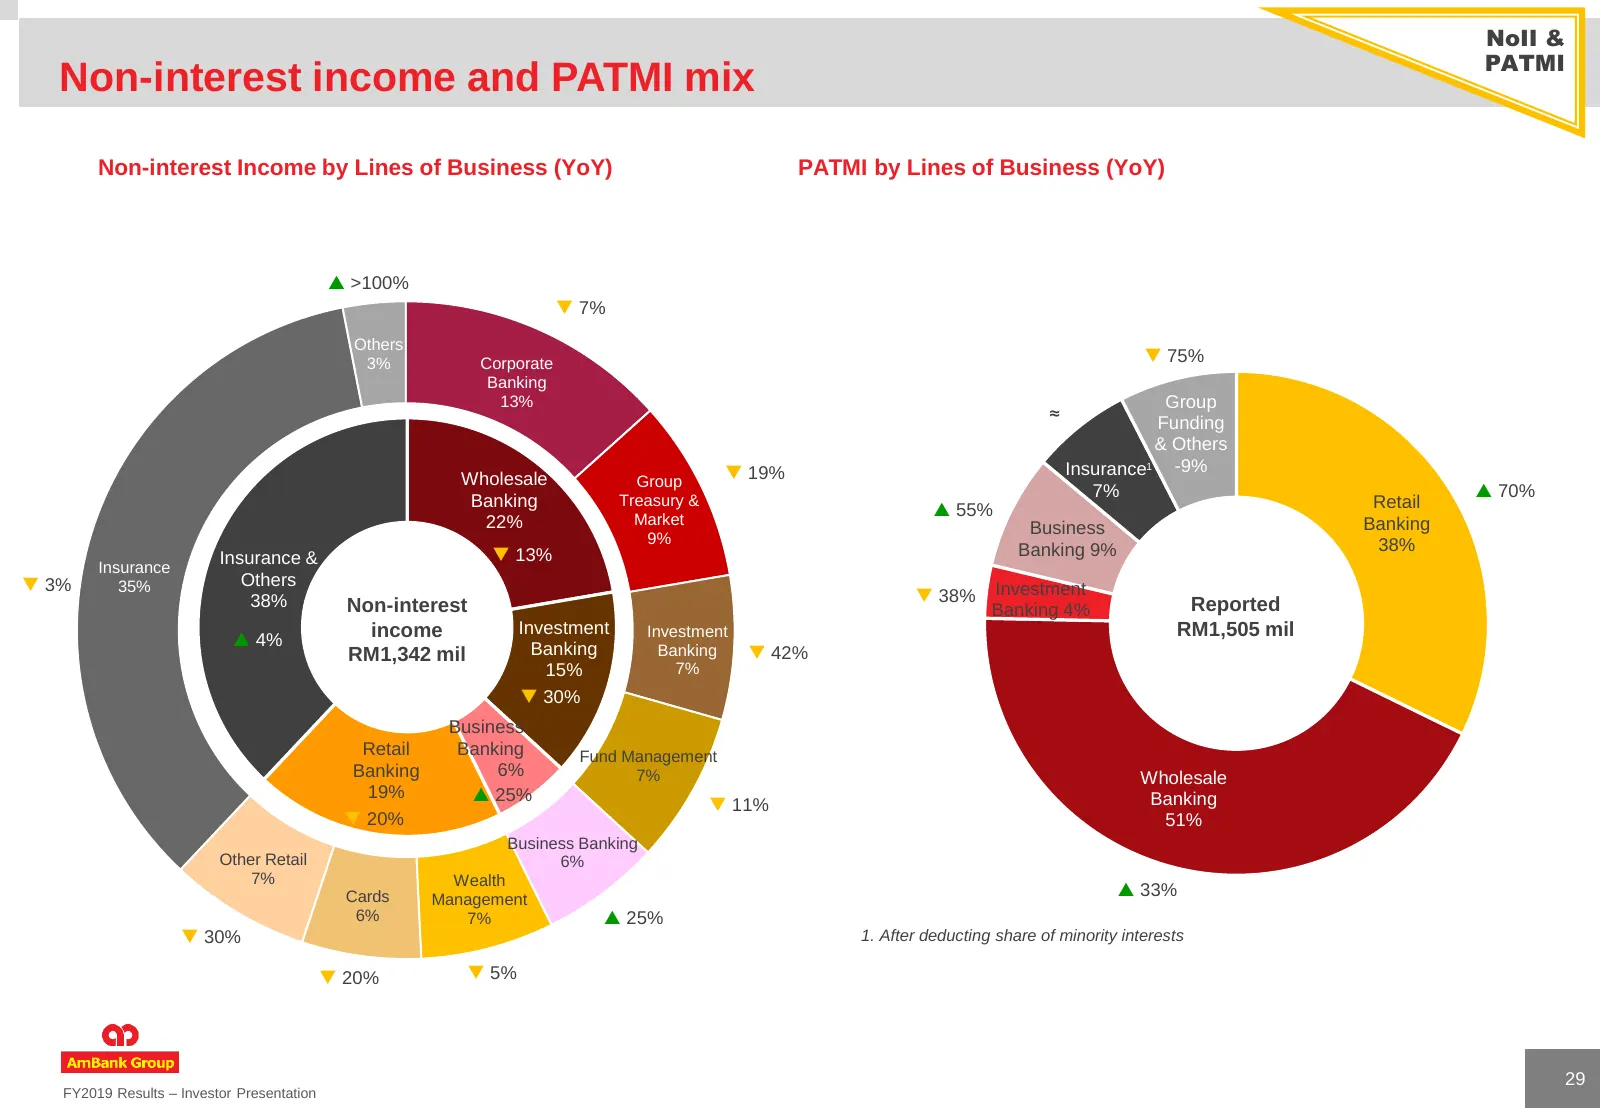
Slide 29: Non-interest income and PATMI mix
NoII & PATMI Non-interest income and PATMI mix Non-interest Income by Lines of Business (YoY) PATMI by Lines of Business (YoY) >100% 7% Others 3% Corporate 75% Banking 13% Group ≈ Funding & Others 19% Insurance -9% 1 Wholesale Group 7% 70% Banking Treasury & 55% Retail 22% Market Banking
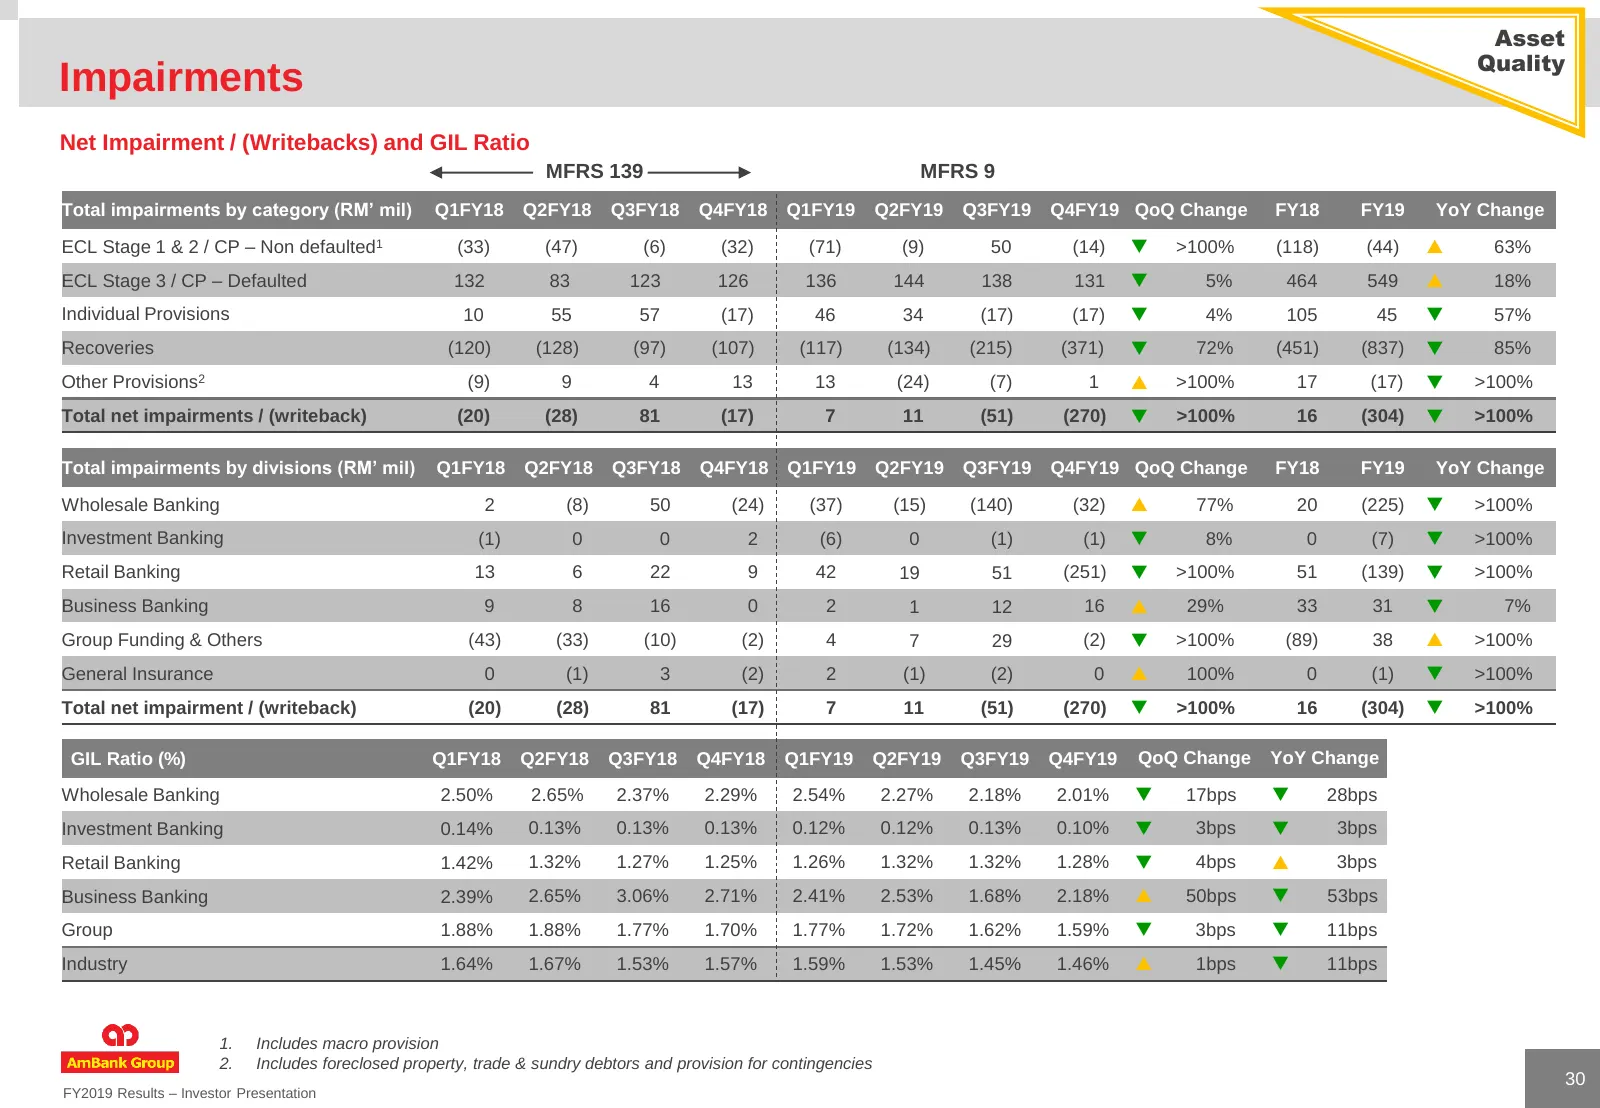
Slide 30: Impairments
Asset Quality Impairments Net Impairment / (Writebacks) and GIL Ratio MFRS 139 MFRS 9 Total impairments by category (RM’ mil) Q1FY18 Q2FY18 Q3FY18 Q4FY18 Q1FY19 Q2FY19 Q3FY19 Q4FY19 QoQ Change FY18 FY19 YoY Change ECL Stage 1 & 2 / CP – Non defaulted1 (33) (47) (6) (32) (71) (9) 50 (14) >100% (118
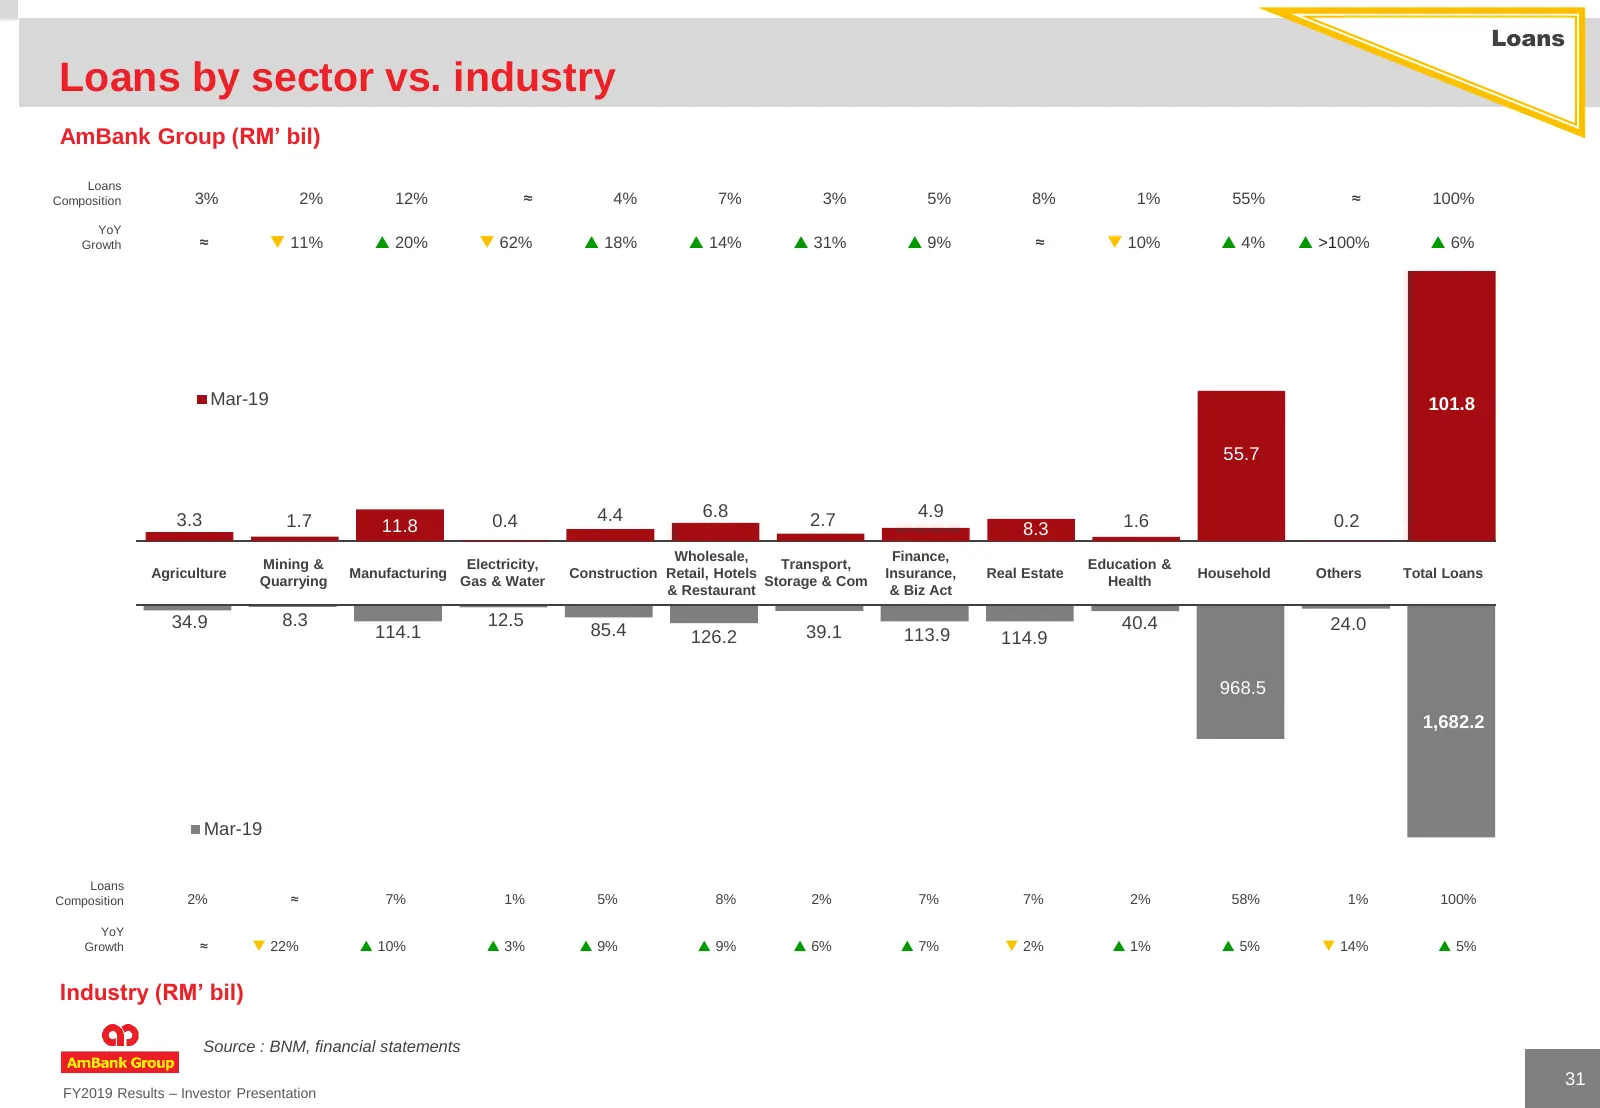
Slide 31: Loans by sector vs. industry
Loans Loans by sector vs. industry AmBank Group (RM’ bil) Loans Composition 3% 2% 12% ≈ 4% 7% 3% 5% 8% 1% 55% ≈ 100% YoY Growth ≈ 11% 20% 62% 18% 14% 31% 9% ≈ 10% 4% >100% 6% Mar-19 101.8 55.7 3.3 4.4 6.8 2.7 4.9 1.7 11.8 0.4 8.3 1.6 0.2 Wholesale, Finance, Mining & Electricity
Slide 32: Funding profile
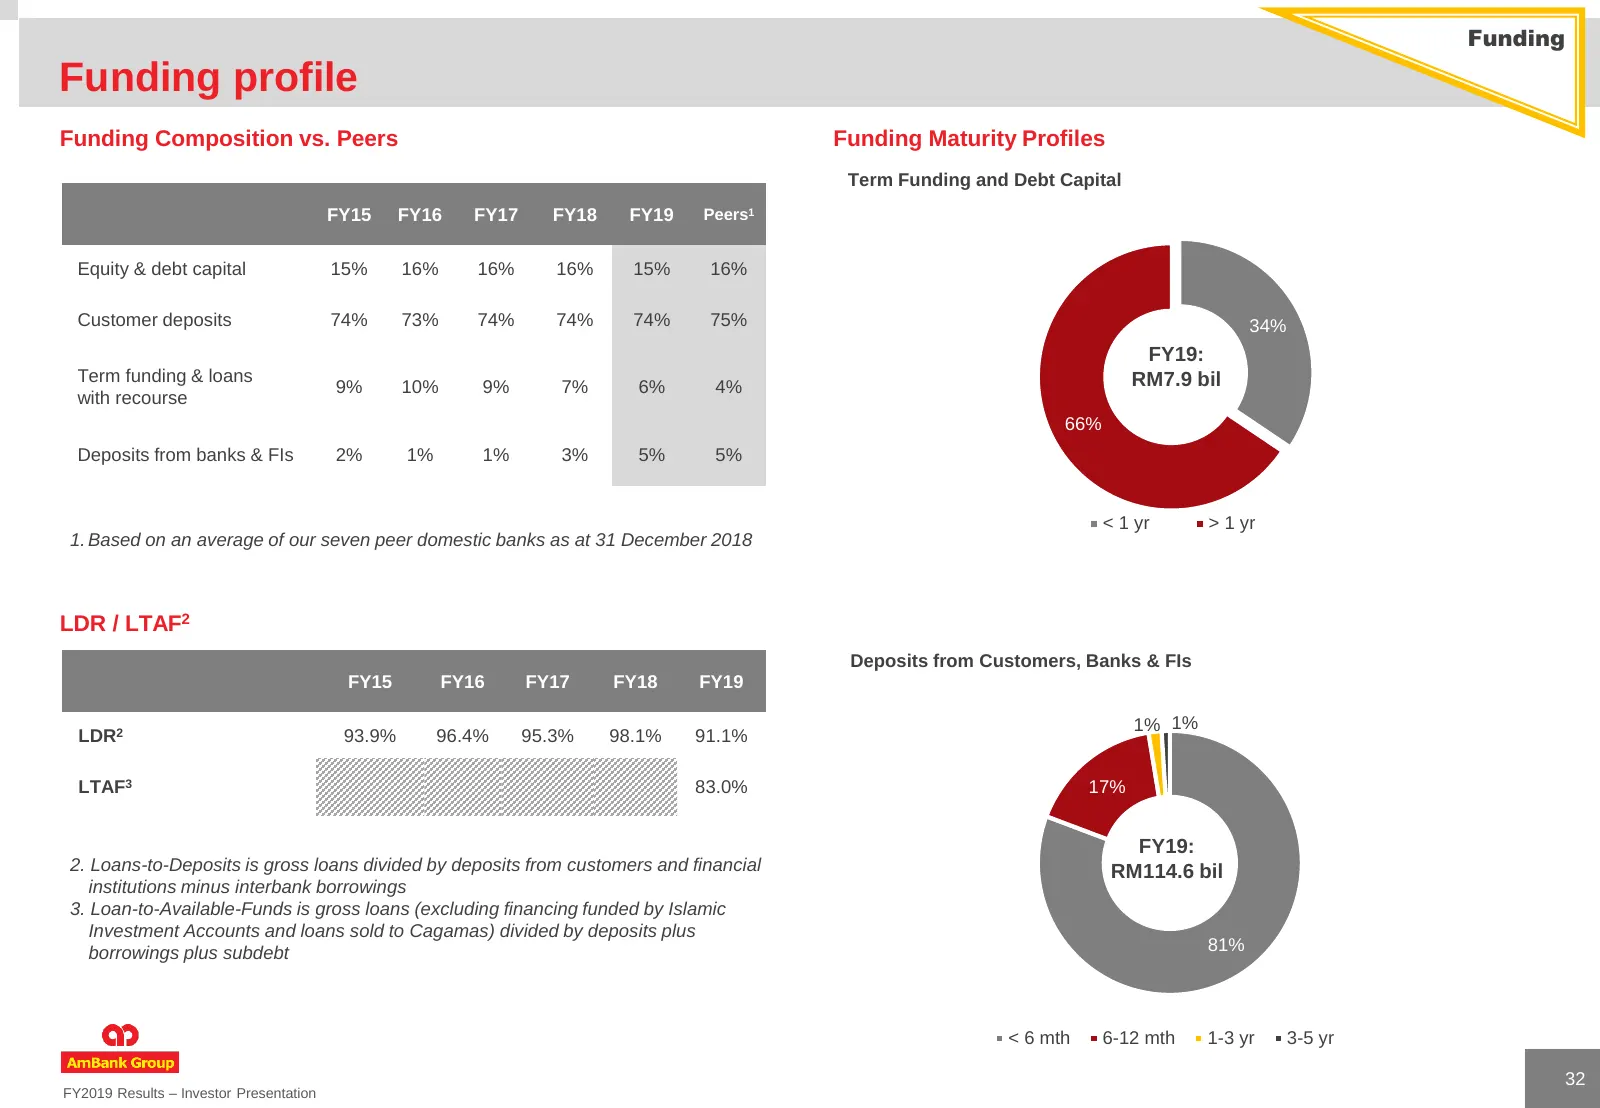
Funding Funding profile Funding Composition vs. Peers Funding Maturity Profiles Term Funding and Debt Capital FY15 FY16 FY17 FY18 FY19 Peers1 Equity & debt capital 15% 16% 16% 16% 15% 16% Customer deposits 74% 73% 74% 74% 74% 75% 34% FY19: Term funding & loans RM7.9 bil 9% 10% 9% 7% 6% 4% with recou
Slide 33: Divisional Performance
Divisional Performance
Slide 34: Wholesale Banking
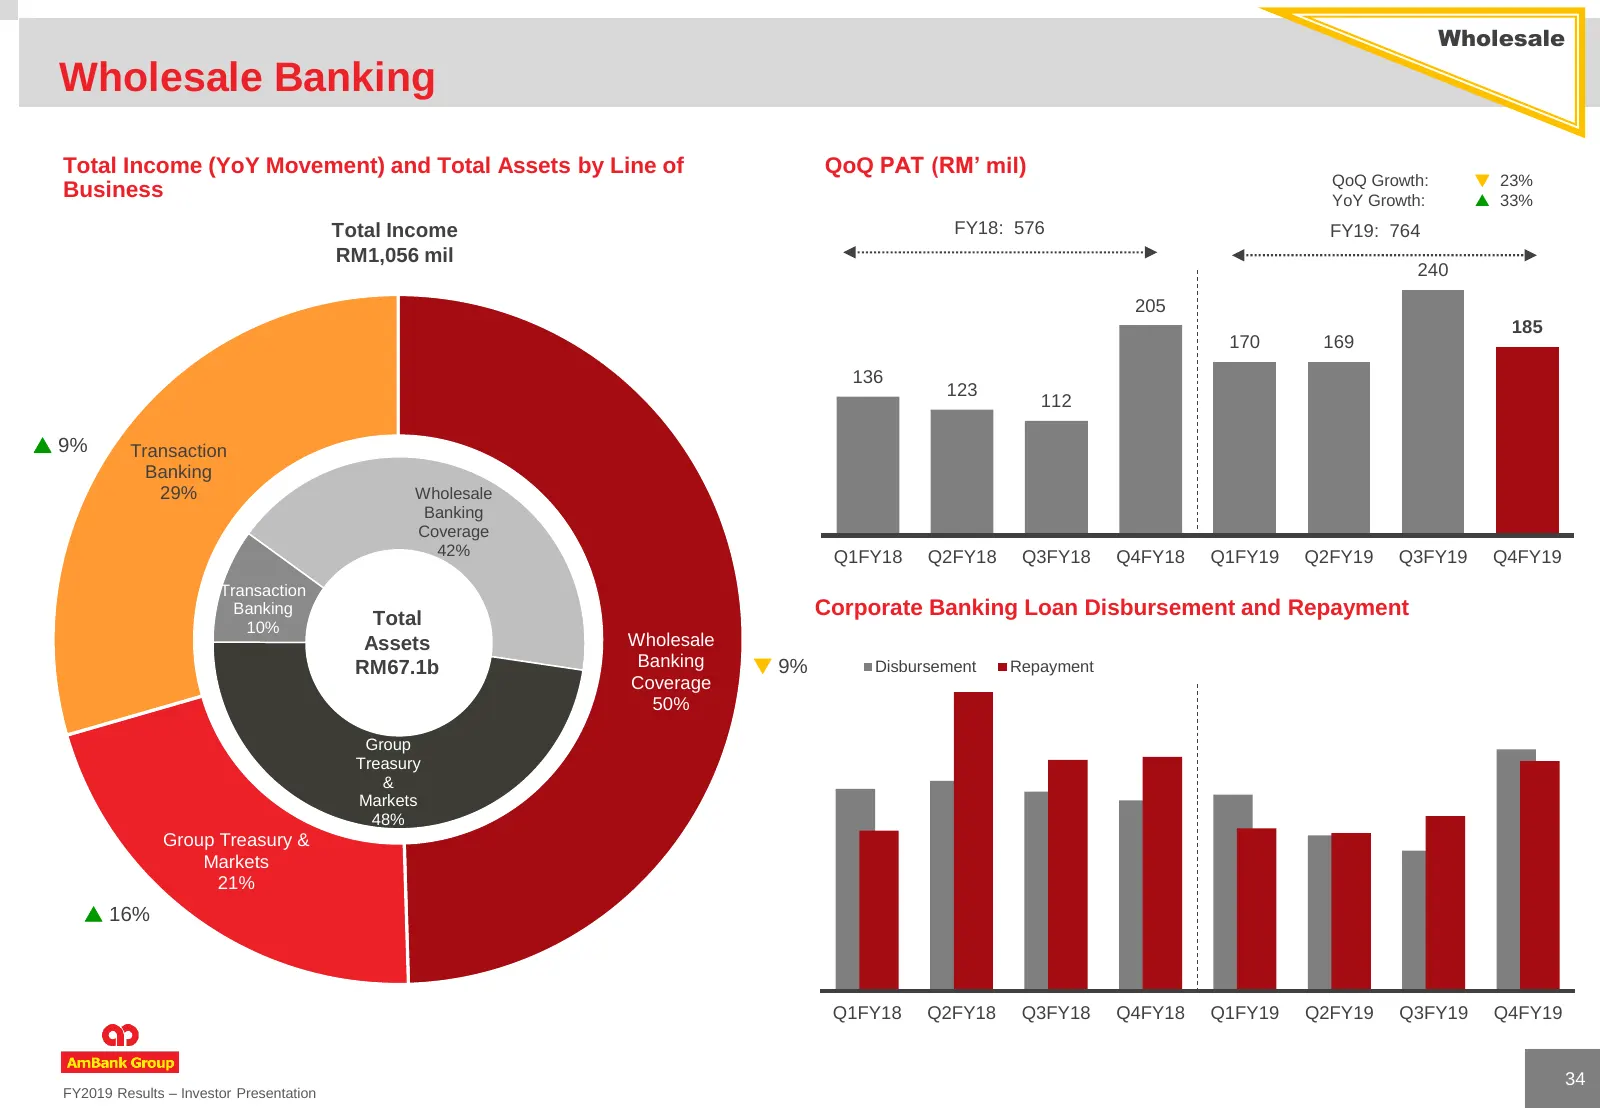
Wholesale Wholesale Banking Total Income (YoY Movement) and Total Assets by Line of QoQ PAT (RM’ mil) QoQ Growth: 23% Business YoY Growth: 33% Total Income FY18: 576 FY19: 764 RM1,056 mil 240 205 185 170 169 136 123 112 9% Transaction Banking 29% Wholesale Banking Coverage 42% Q1FY18 Q2FY18 Q3
Slide 35: Wholesale Banking
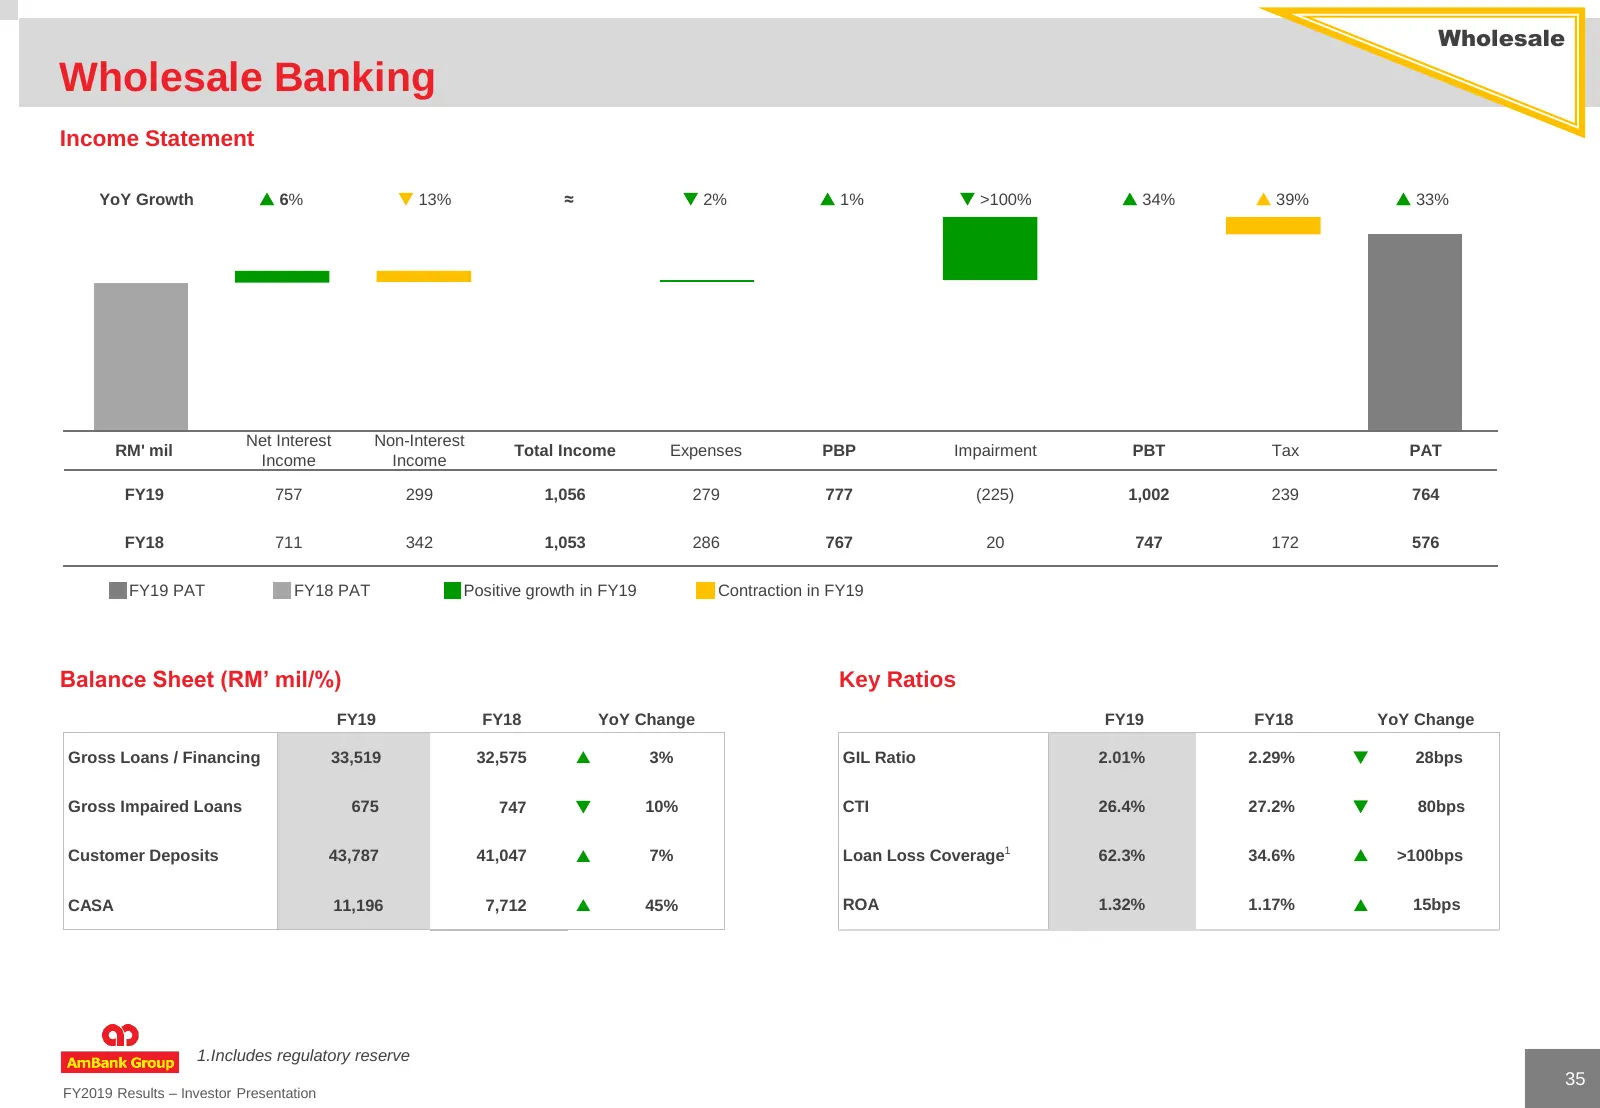
Wholesale Wholesale Banking Income Statement YoY Growth 6% 13% ≈ 2% 1% >100% 34% 39% 33% Net Interest Non-Interest RM' mil Total Income Expenses PBP Impairment PBT Tax PAT Income Income FY19 757 299 1,056 279 777 (225) 1,002 239 764 FY18 711 342 1,053 286 767 20 747 172 576 FY19 PAT
Slide 36: Investment Banking
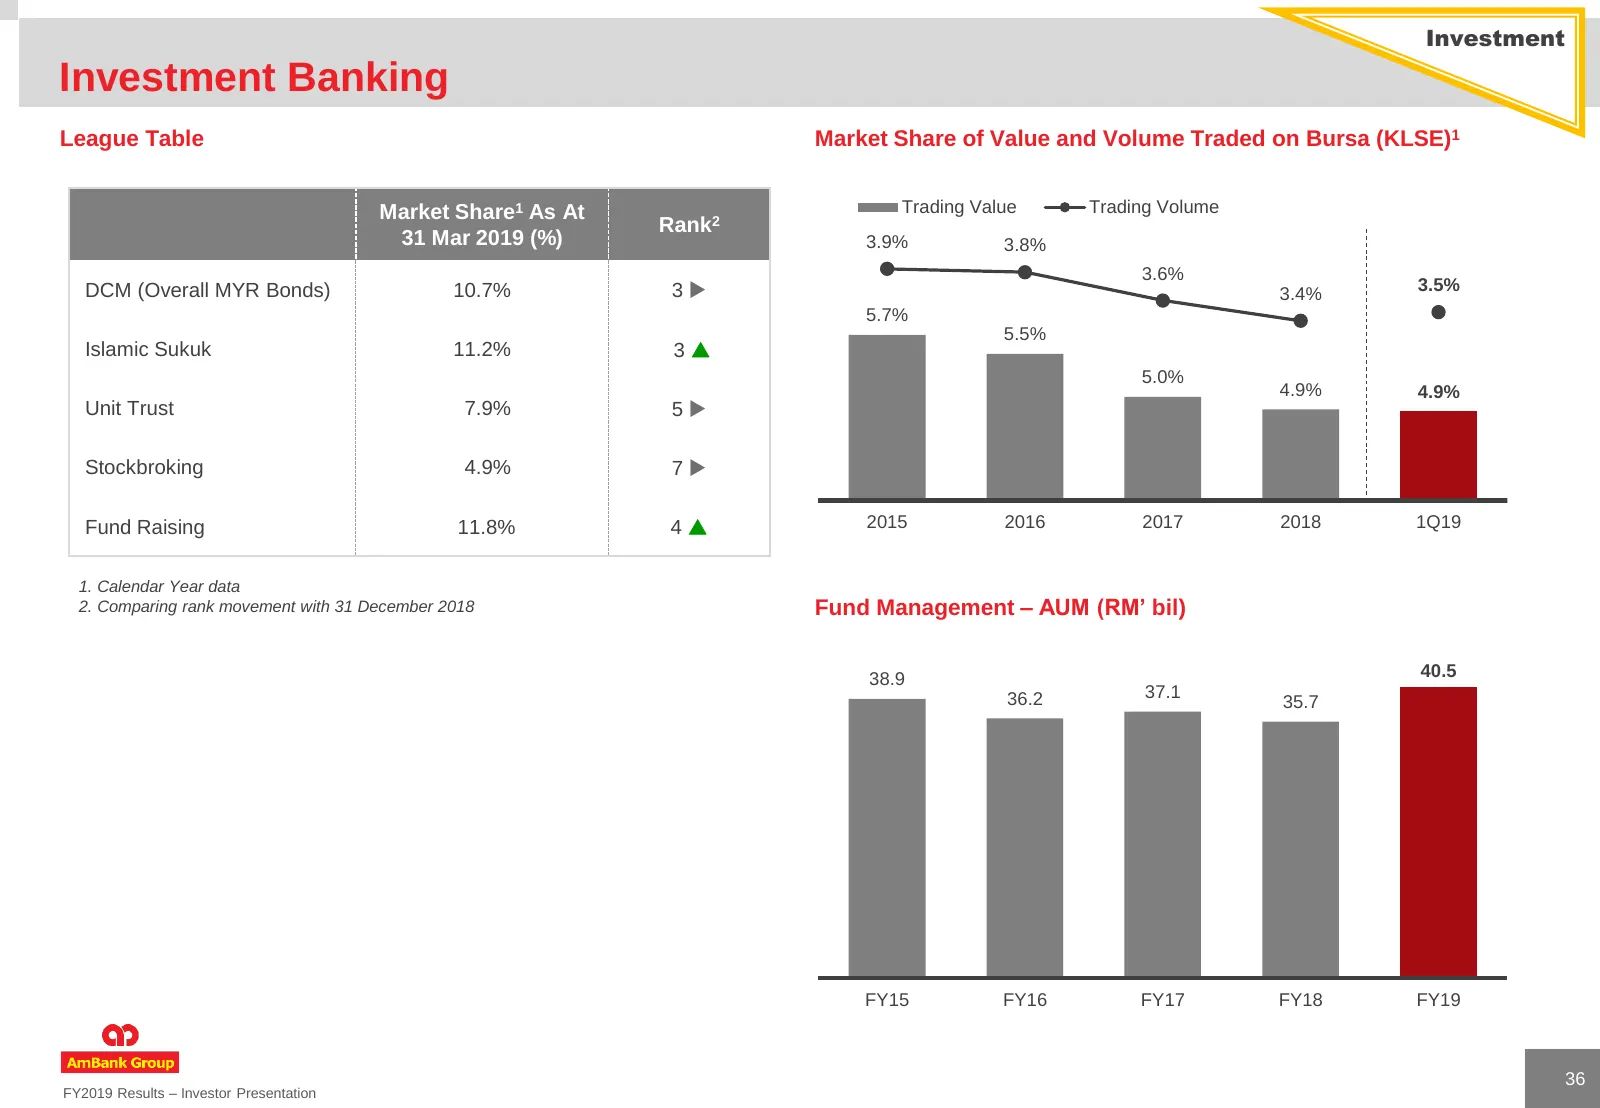
Investment Investment Banking League Table Market Share of Value and Volume Traded on Bursa (KLSE)1 Market Share1 As At Trading Value Trading Volume Rank2 31 Mar 2019 (%) 3.9% 3.8% 3.6% DCM (Overall MYR Bonds) 10.7% 3 3.4% 3.5% 5.7% 5.5% Islamic Sukuk 11.2% 3 5.0% 4.9% 4.9% Unit Trust 7.9% 5 Stoc
Slide 37: Investment Banking
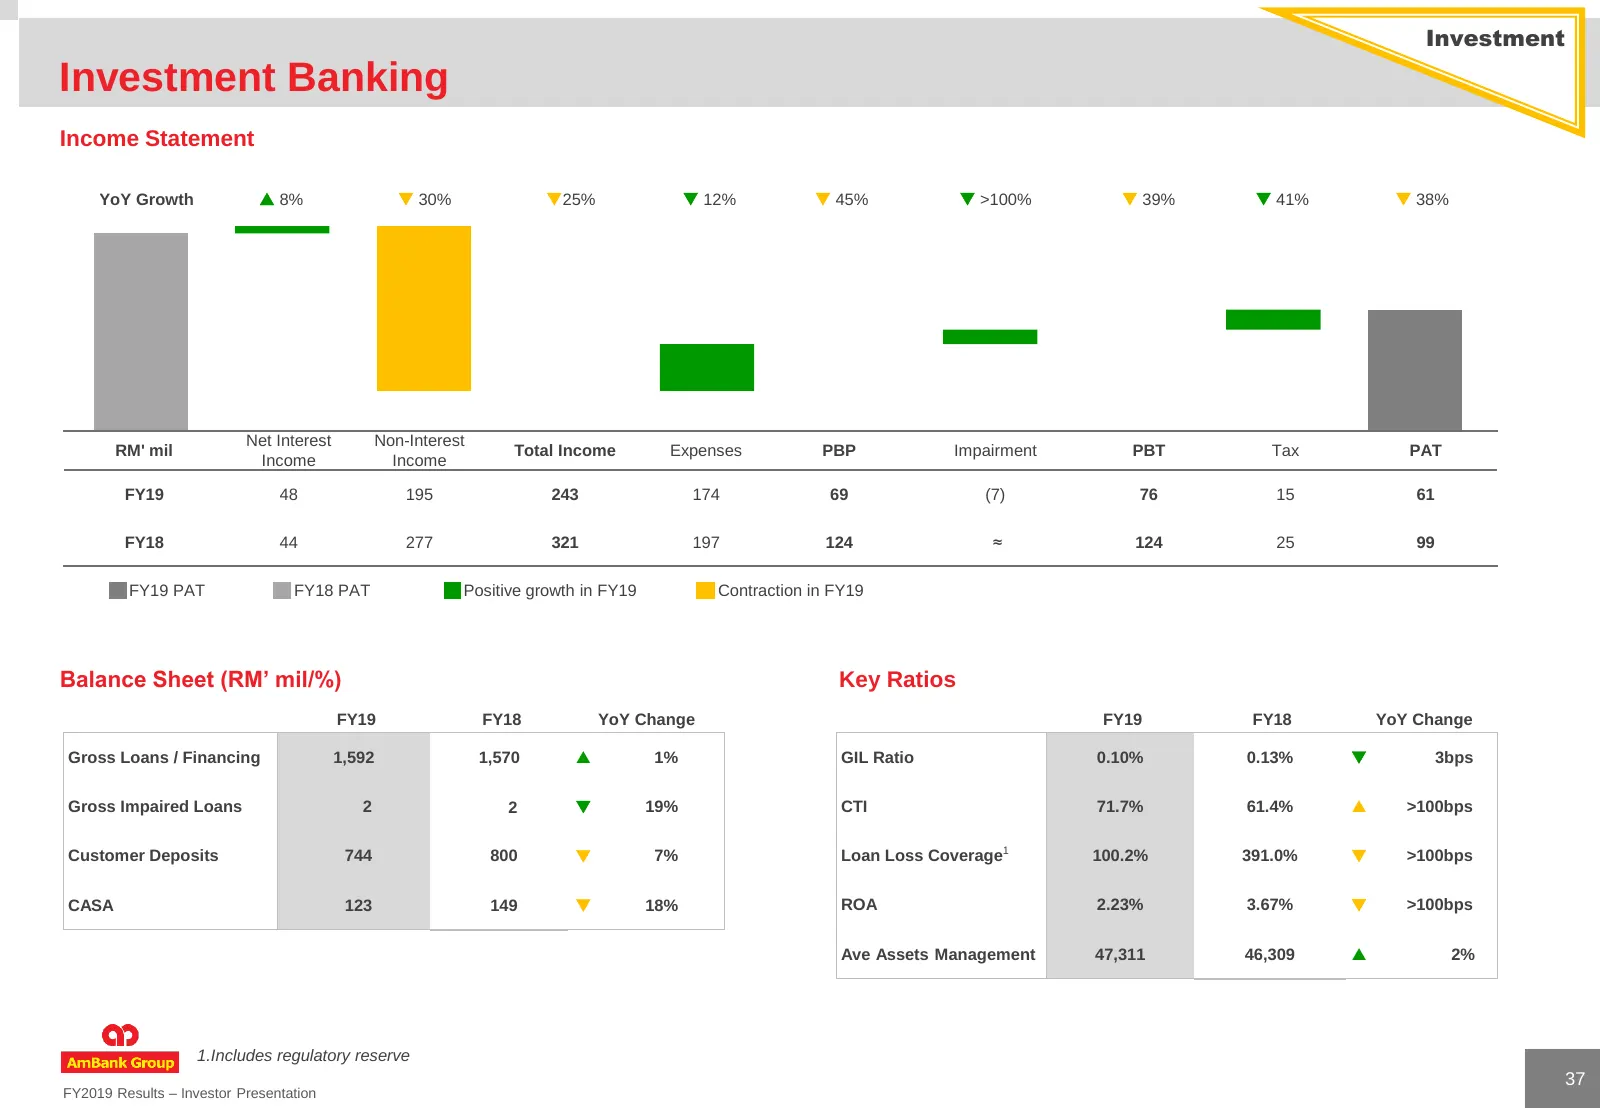
Investment Investment Banking Income Statement YoY Growth 8% 30% 25% 12% 45% >100% 39% 41% 38% Net Interest Non-Interest RM' mil Total Income Expenses PBP Impairment PBT Tax PAT Income Income FY19 48 195 243 174 69 (7) 76 15 61 FY18 44 277 321 197 124 ≈ 124 25 99 FY19 PAT FY18 PAT P
Slide 38: Retail Banking
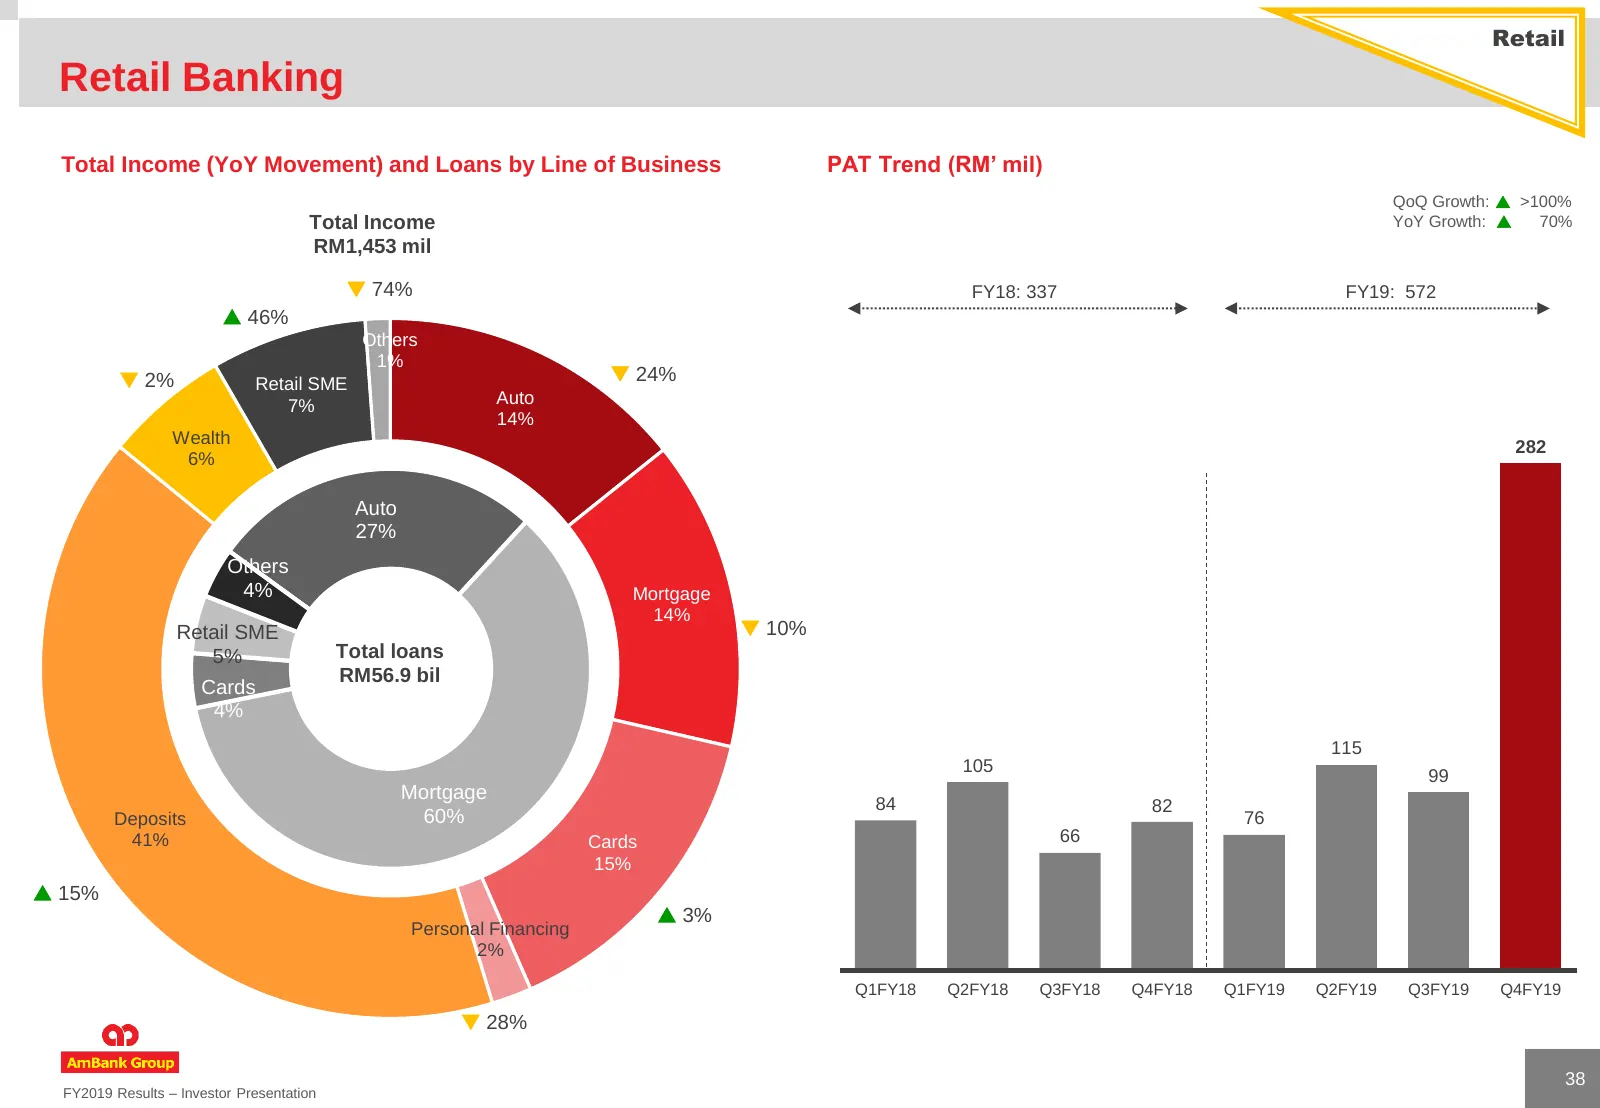
Retail Retail Banking Total Income (YoY Movement) and Loans by Line of Business PAT Trend (RM’ mil) QoQ Growth: >100% Total Income YoY Growth: 70% RM1,453 mil 74% FY18: 337 FY19: 572 46% Others 1% 2% Retail SME 24% 7% Auto 14% Wealth 282 6% Auto 27% Others 4% Mortgage 14% Retail SME 10
Slide 39: Cards in circulation
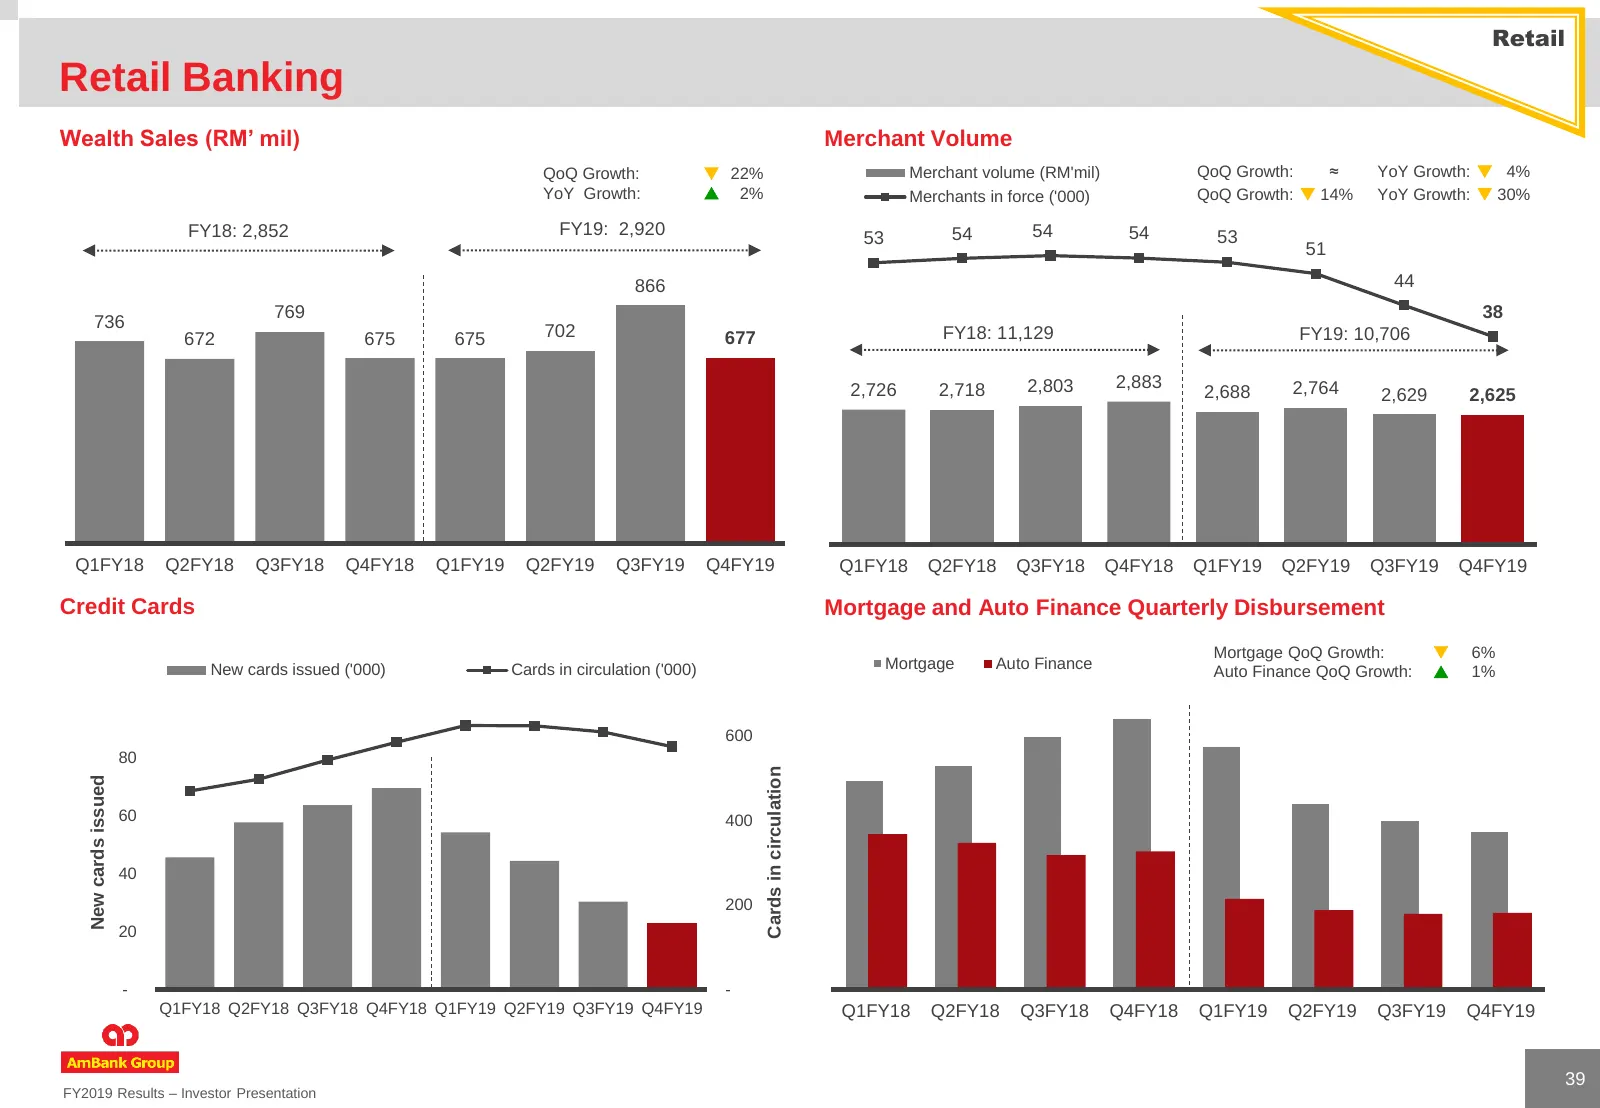
Retail Retail Banking Wealth Sales (RM’ mil) Merchant Volume QoQ Growth: 22% Merchant volume (RM'mil) QoQ Growth: ≈ YoY Growth: 4% YoY Growth: 2% Merchants in force ('000) QoQ Growth: 14% YoY Growth: 30% FY18: 2,852 FY19: 2,920 53 54 54 54 53 51 866 44 769 38 736 672 675 675 702 677 FY18:
Slide 40: Retail Banking
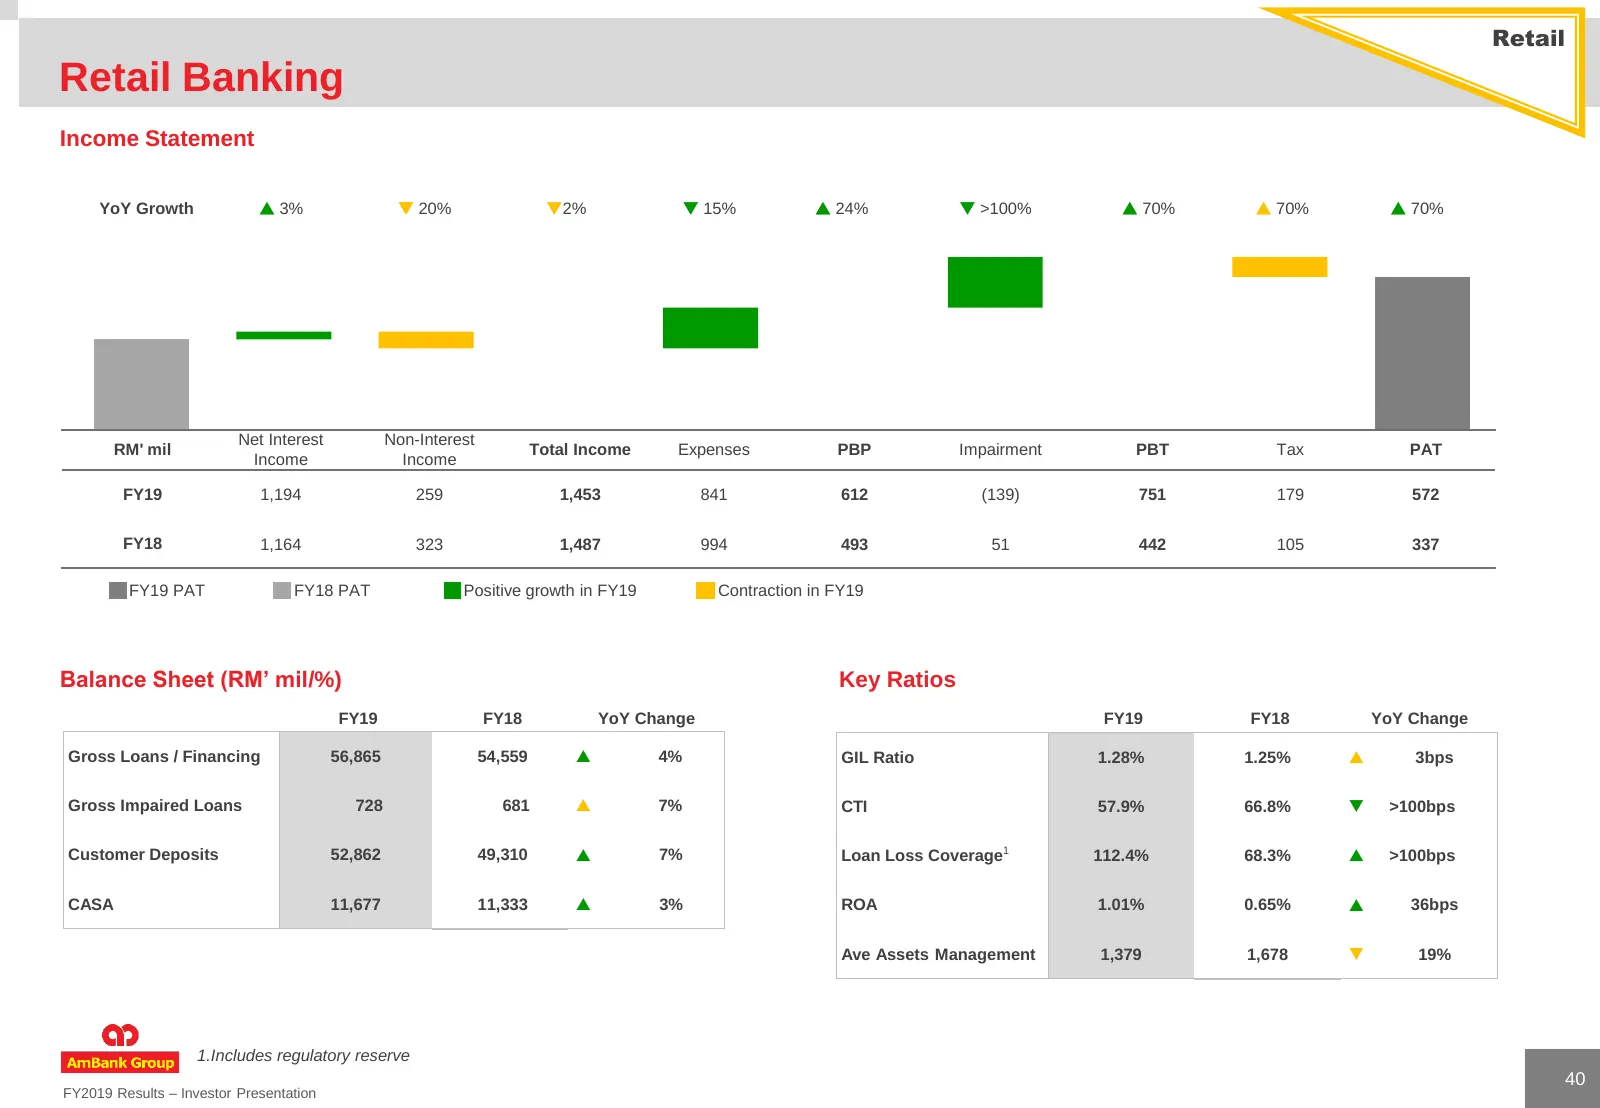
Retail Retail Banking Income Statement YoY Growth 3% 20% 2% 15% 24% >100% 70% 70% 70% Net Interest Non-Interest RM' mil Total Income Expenses PBP Impairment PBT Tax PAT Income Income FY19 1,194 259 1,453 841 612 (139) 751 179 572 FY18 1,164 323 1,487 994 493 51 442 105 337 FY19 PAT
Slide 41: Distribution Channels
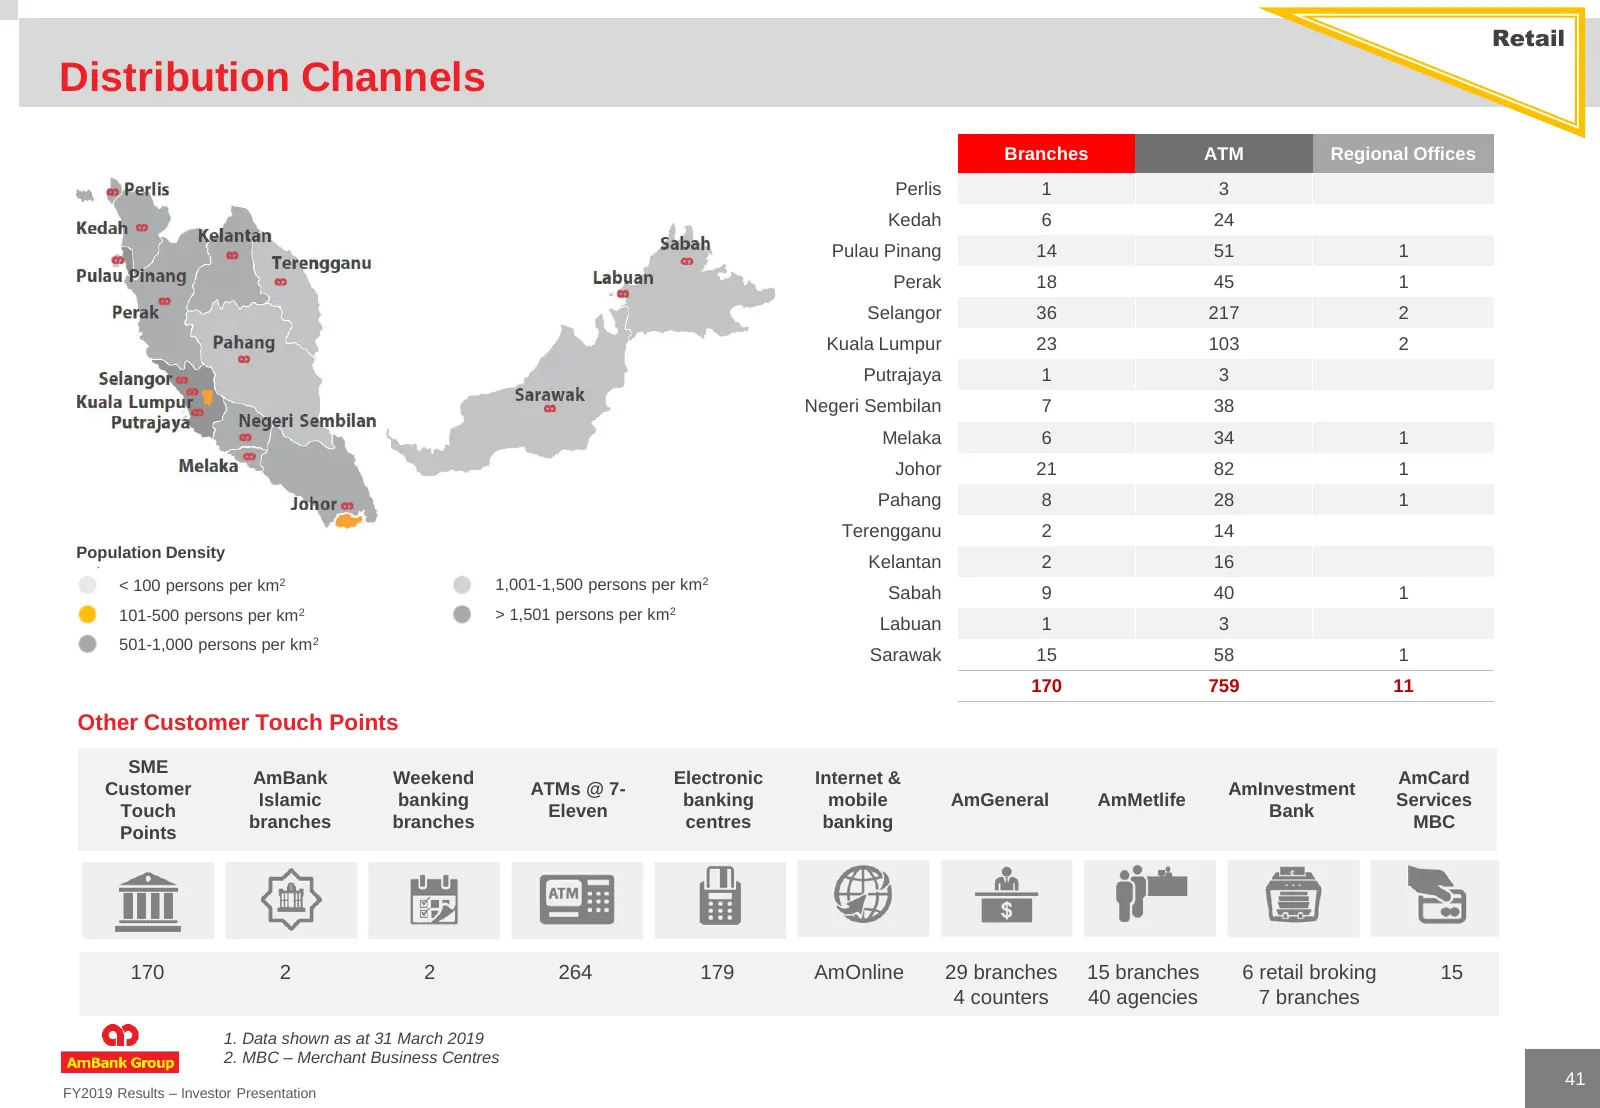
Retail Distribution Channels Branches ATM Regional Offices Perlis 1 3 Kedah 6 24 Pulau Pinang 14 51 1 Perak 18 45 1 Selangor 36 217 2 Kuala Lumpur 23 103 2 Putrajaya 1 3 Negeri Sembilan 7 38 Melaka 6 34 1 Johor 21 82 1 Pahang 8 28 1 Terengganu 2 14 Population Density Kelantan 2 16 < 100 persons per
Slide 42: Business Banking
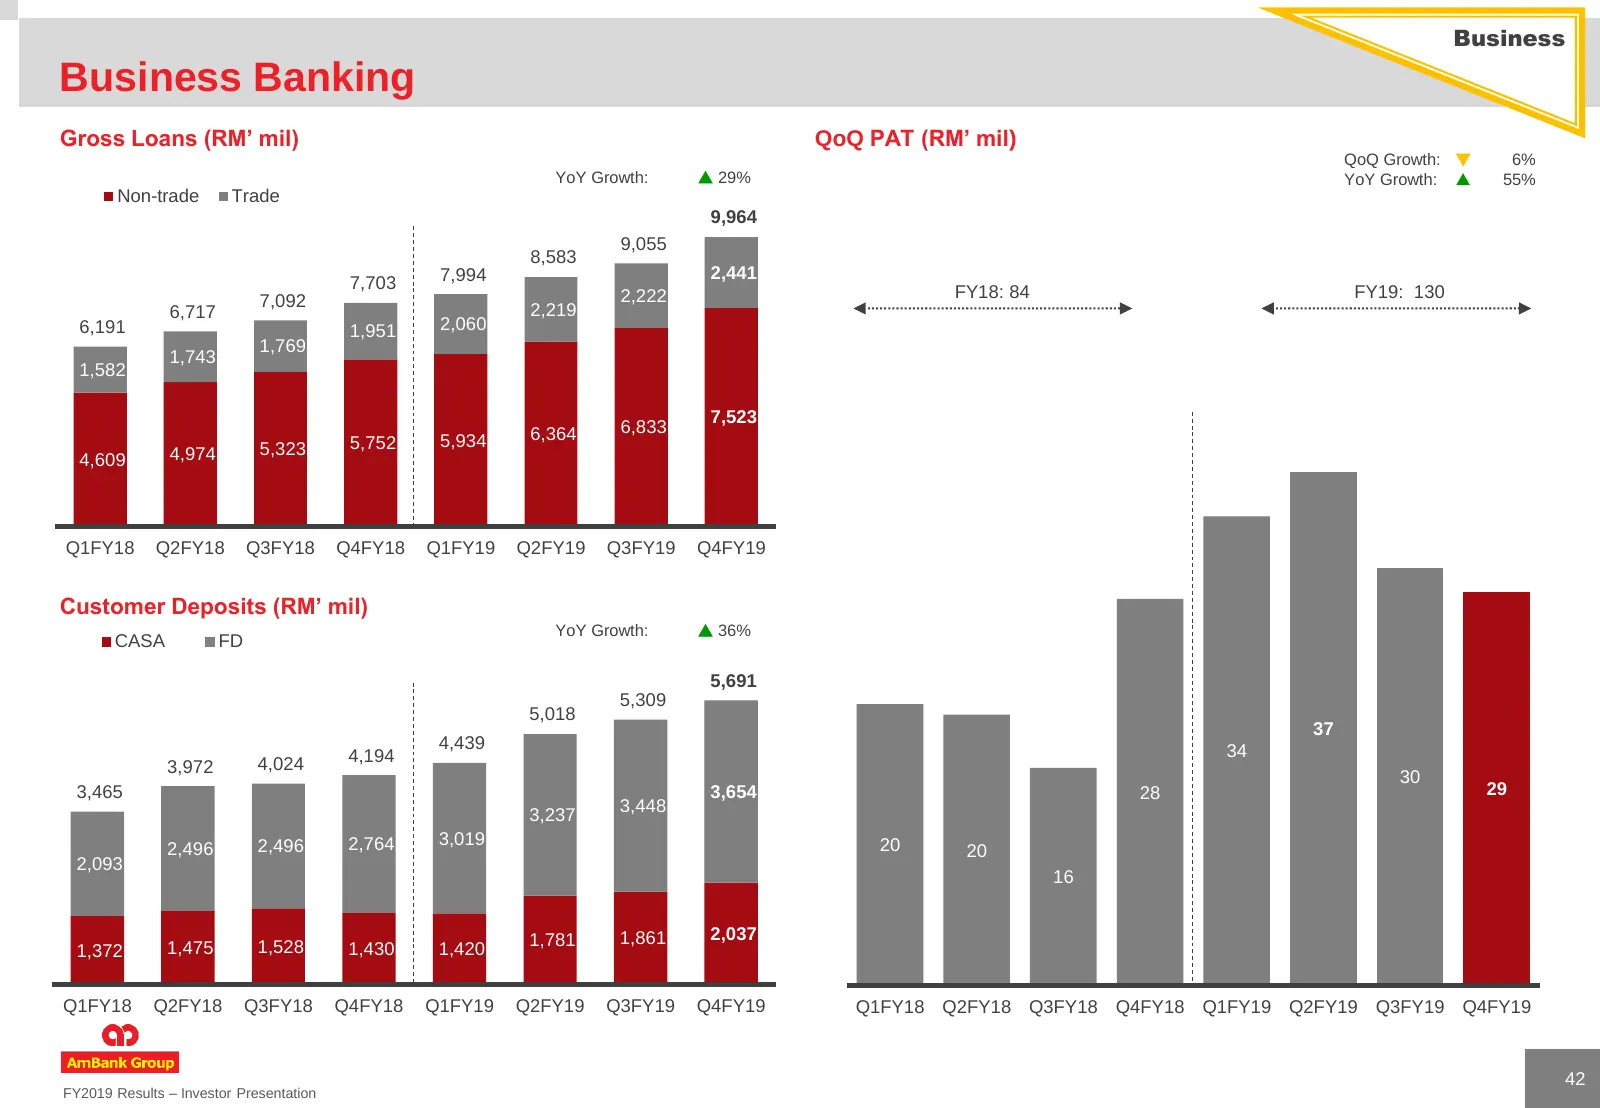
Business Business Banking Gross Loans (RM’ mil) QoQ PAT (RM’ mil) QoQ Growth: 6% YoY Growth: 29% YoY Growth: 55% Non-trade Trade 9,964 9,055 8,583 7,994 2,441 7,703 FY18: 84 FY19: 130 7,092 2,222 6,717 2,219 6,191 1,951 2,060 1,769 1,743 1,582 7,523 6,364 6,833 5,323 5,752 5,934 4,609 4,974 Q1
Slide 43: Business Banking
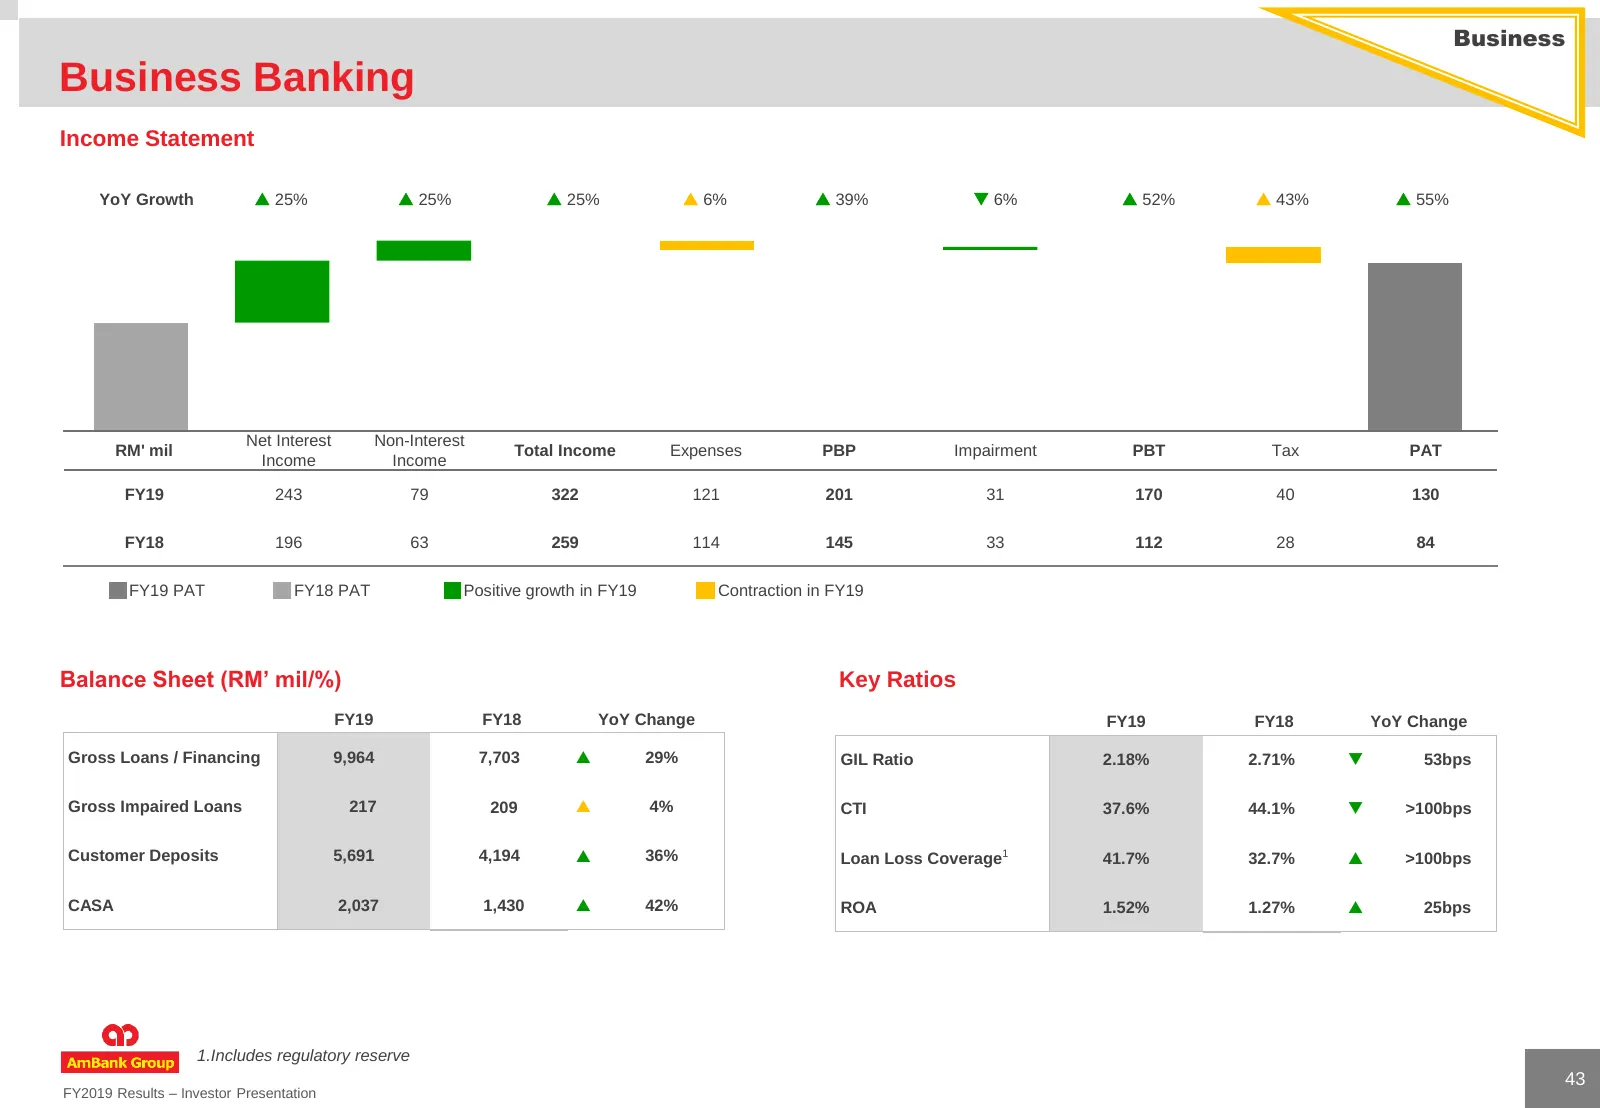
Business Business Banking Income Statement YoY Growth 25% 25% 25% 6% 39% 6% 52% 43% 55% Net Interest Non-Interest RM' mil Total Income Expenses PBP Impairment PBT Tax PAT Income Income FY19 243 79 322 121 201 31 170 40 130 FY18 196 63 259 114 145 33 112 28 84 FY19 PAT FY18 PAT Posi
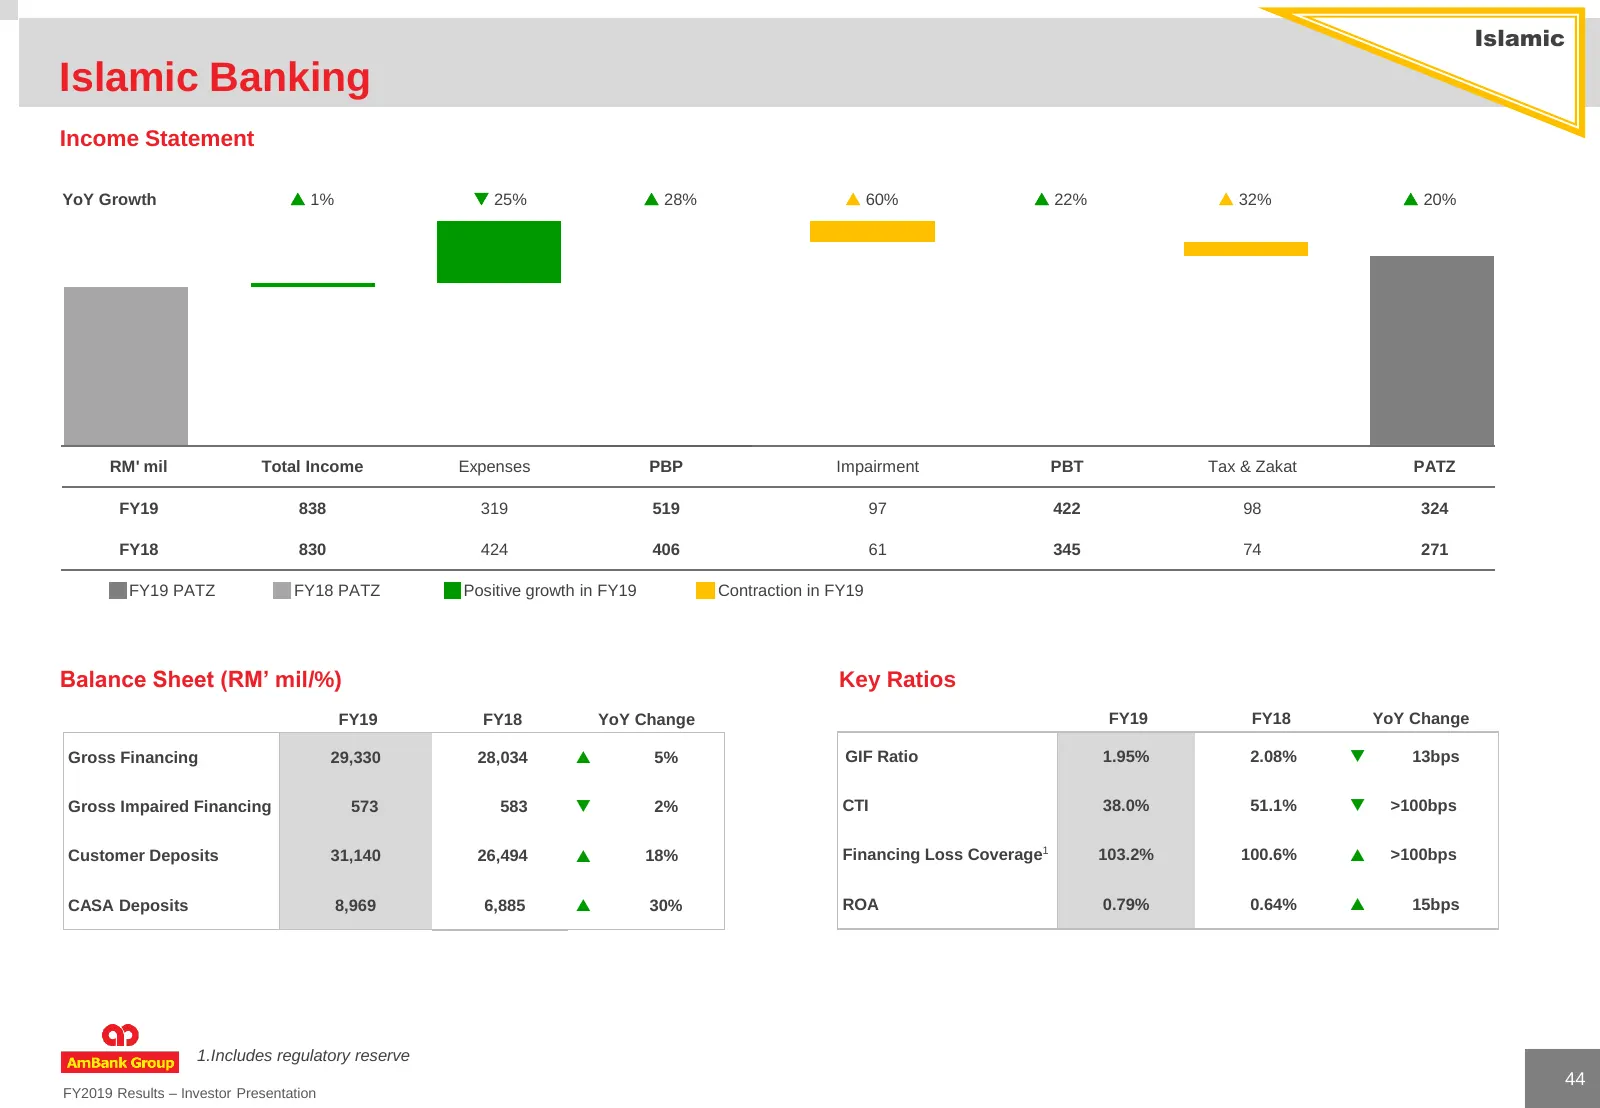
Slide 44: Islamic Banking
Islamic Islamic Banking Income Statement YoY Growth 1% 25% 28% 60% 22% 32% 20% RM' mil Total Income Expenses PBP Impairment PBT Tax & Zakat PATZ FY19 838 319 519 97 422 98 324 FY18 830 424 406 61 345 74 271 FY19 PATZ FY18 PATZ Positive growth in FY19 Contraction in FY19 Balance Sheet (
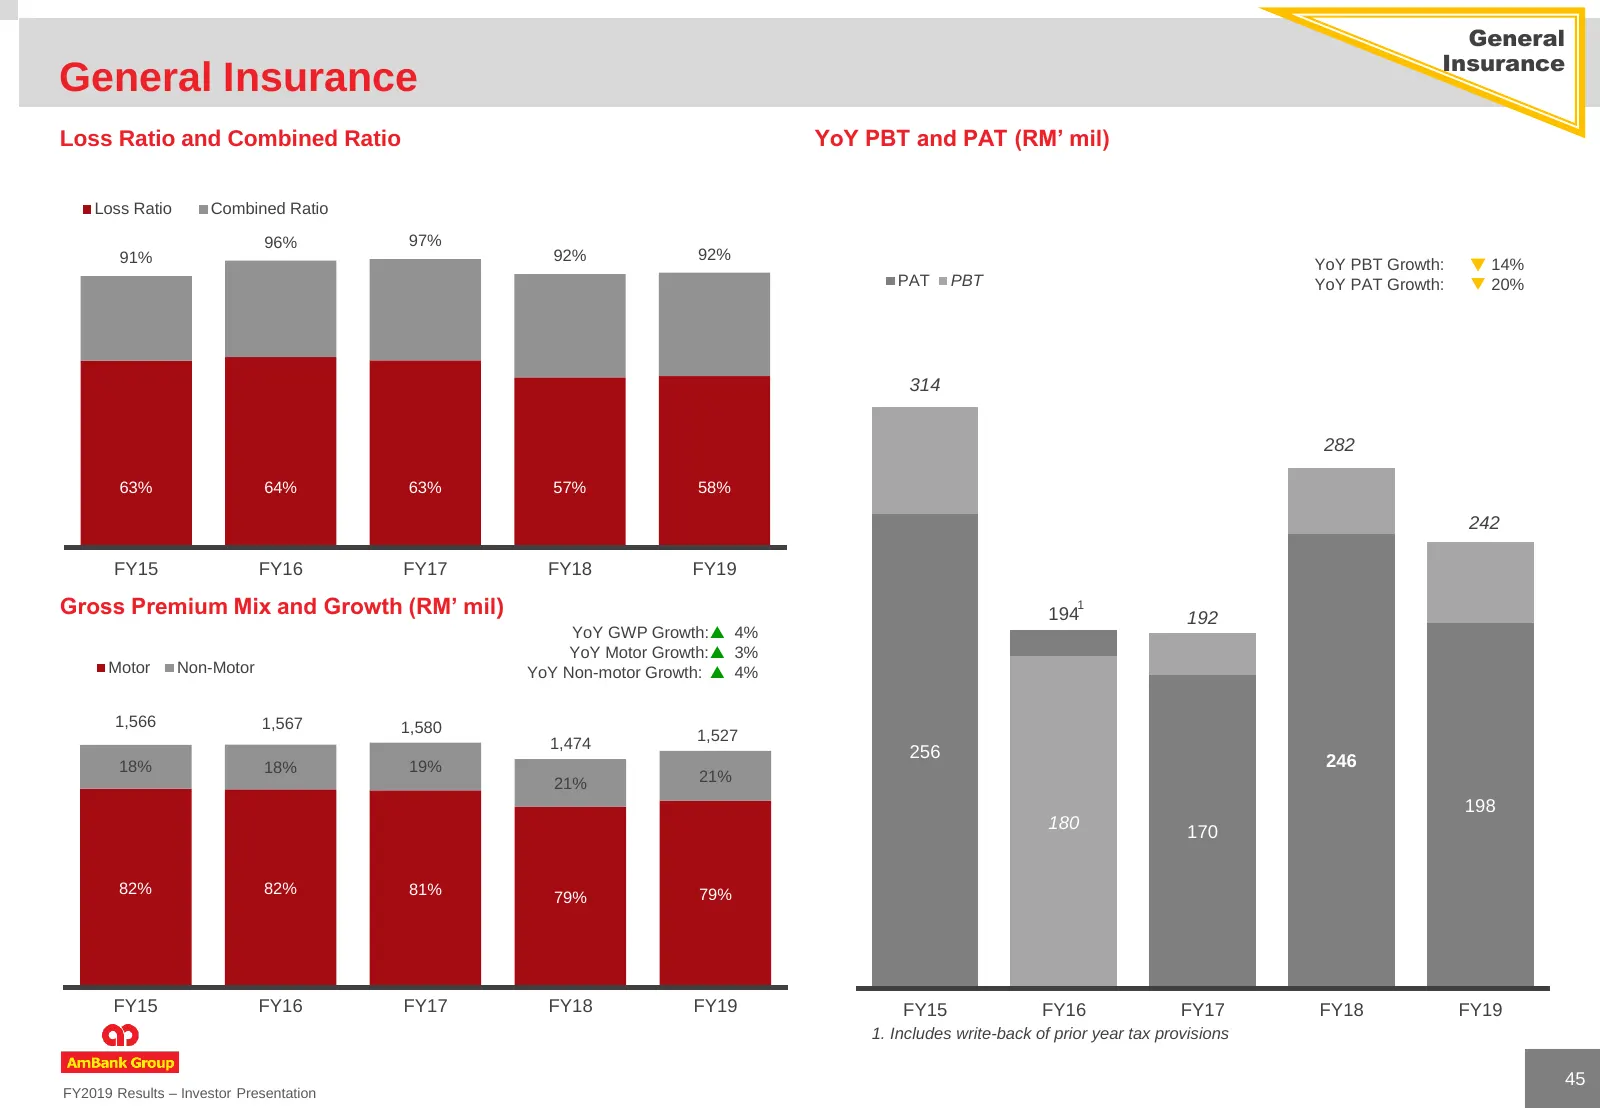
Slide 45: General Insurance
General Insurance General Insurance Loss Ratio and Combined Ratio YoY PBT and PAT (RM’ mil) Loss Ratio Combined Ratio 96% 97% 91% 92% 92% YoY PBT Growth: 14% PAT PBT YoY PAT Growth: 20% 314 282 63% 64% 63% 57% 58% 242 FY15 FY16 FY17 FY18 FY19 Gross Premium Mix and Growth (RM’ mil) 194 1 192 YoY
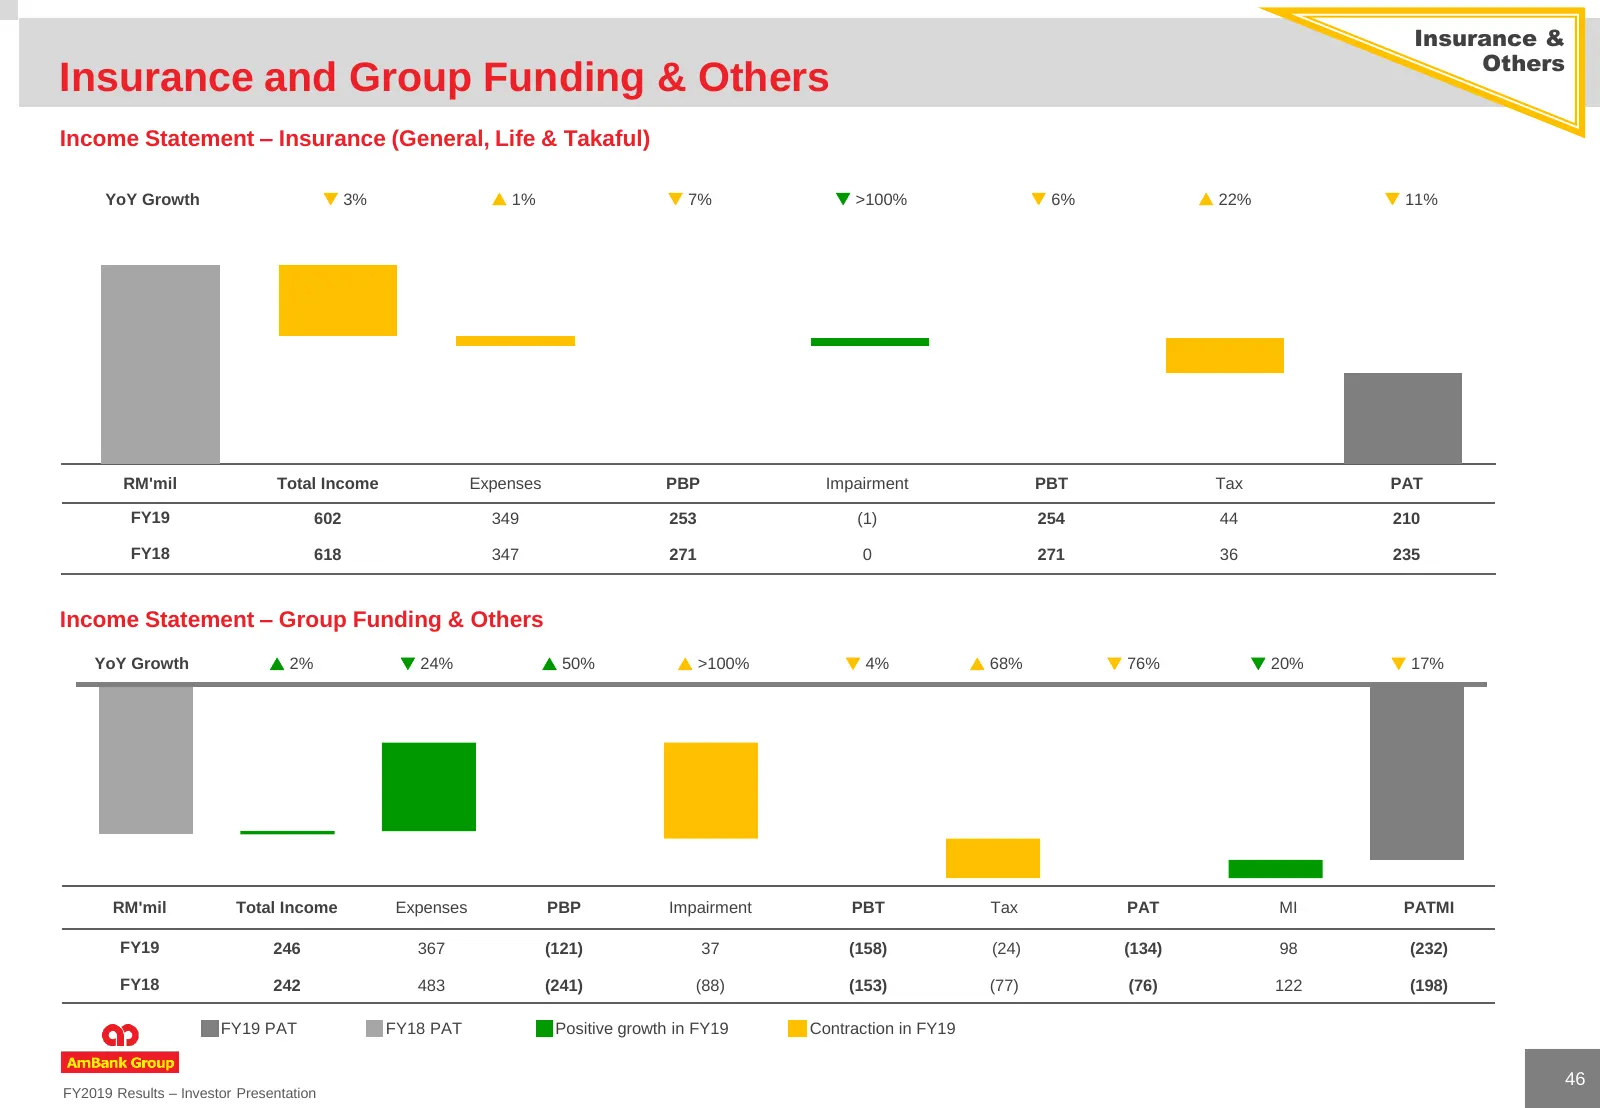
Slide 46: Insurance and Group Funding & Others
Insurance & Others Insurance and Group Funding & Others Income Statement – Insurance (General, Life & Takaful) YoY Growth 3% 1% 7% >100% 6% 22% 11% RM'mil Total Income Expenses PBP Impairment PBT Tax PAT FY19 602 349 253 (1) 254 44 210 FY18 618 347 271 0 271 36 235 Income Statement – G
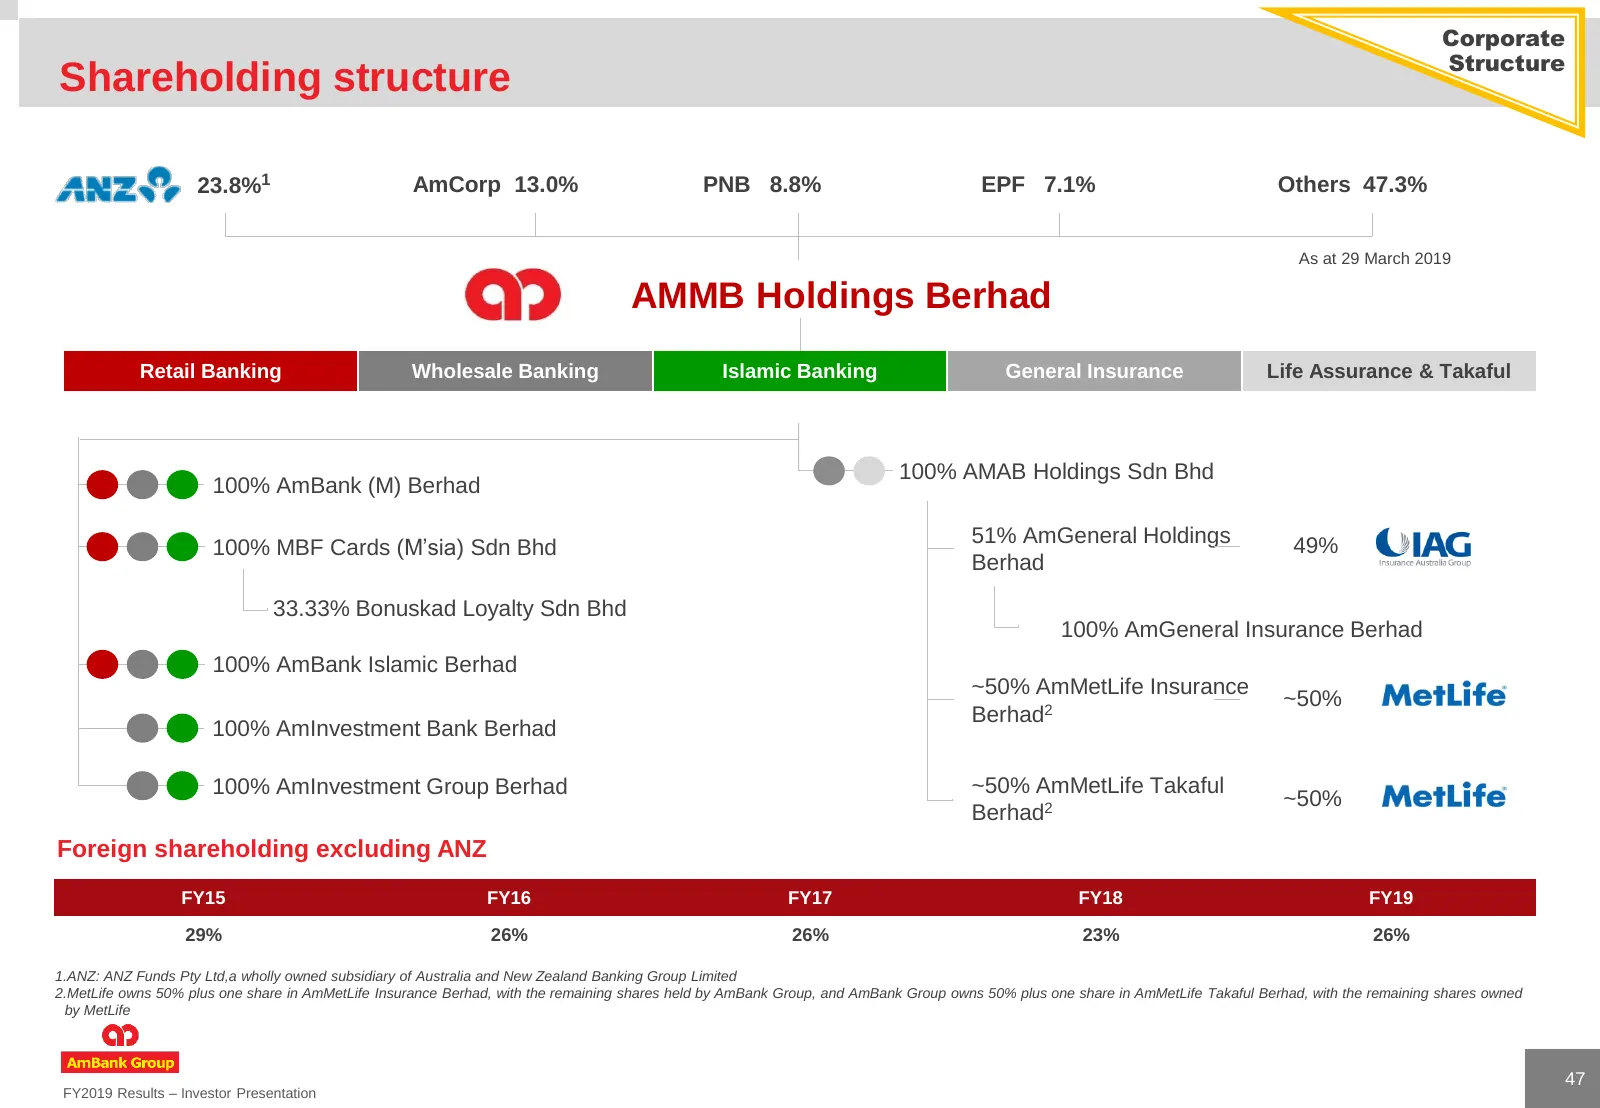
Slide 47: Shareholding structure
Corporate Structure Shareholding structure 23.8%1 AmCorp 13.0% PNB 8.8% EPF 7.1% Others 47.3% As at 29 March 2019 AMMB Holdings Berhad Retail Banking Wholesale Banking Islamic Banking General Insurance Life Assurance & Takaful 100% AMAB Holdings Sdn Bhd 100% AmBank (M) Berhad 51% AmGeneral Holdings
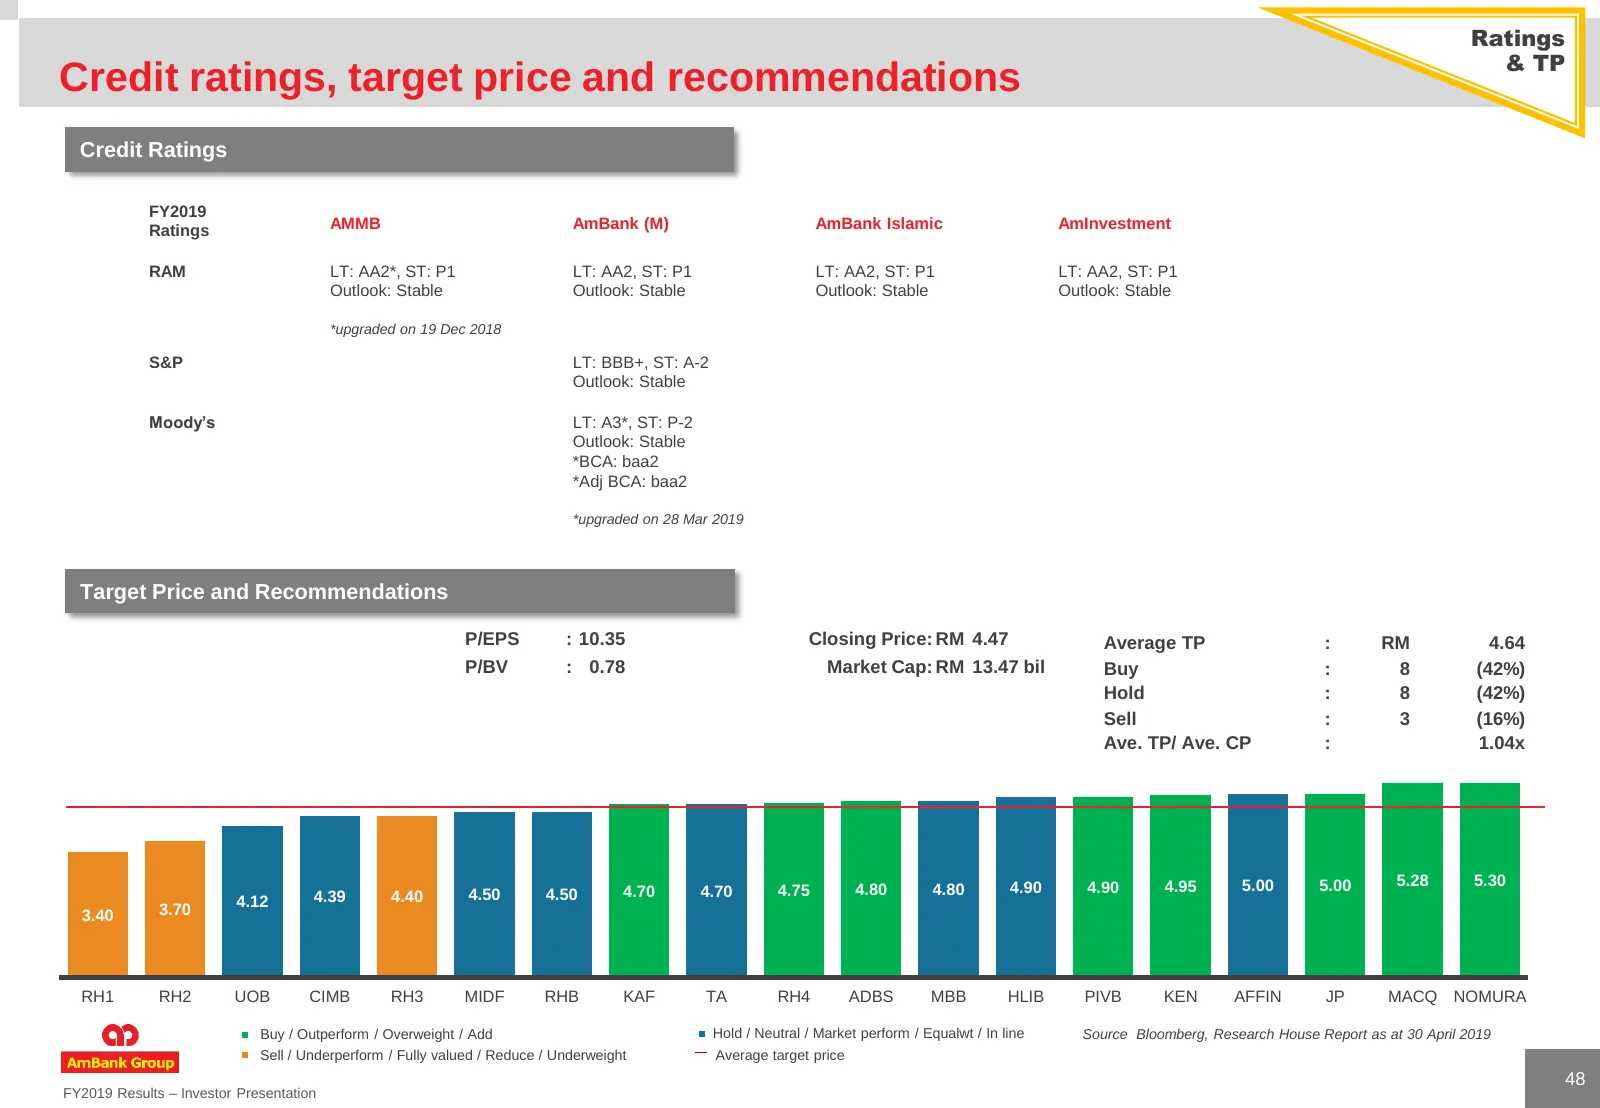
Slide 48: Credit ratings, target price and recommendations
Ratings & TP Credit ratings, target price and recommendations Credit Ratings FY2019 Ratings AMMB AmBank (M) AmBank Islamic AmInvestment RAM LT: AA2*, ST: P1 LT: AA2, ST: P1 LT: AA2, ST: P1 LT: AA2, ST: P1 Outlook: Stable Outlook: Stable Outlook: Stable Outlook: Stable *upgraded on 19 Dec 2018 S&P LT
Slide 49: Glossary & Disclaimer
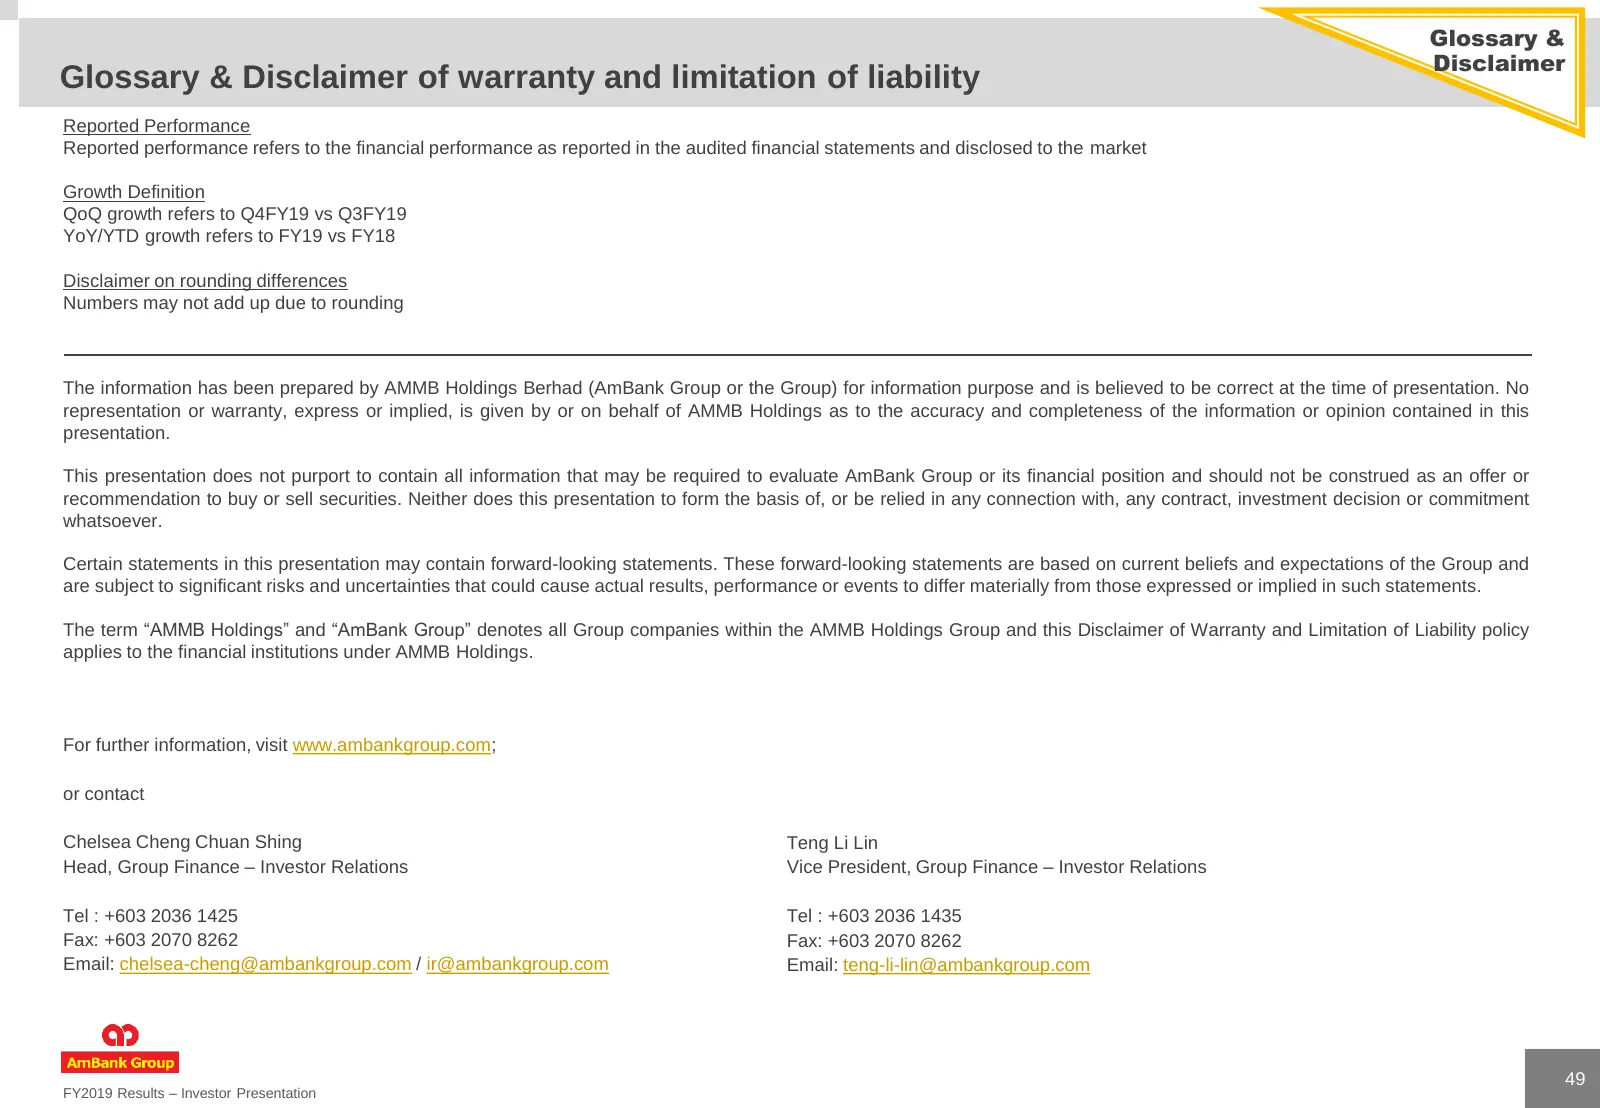
Glossary & Disclaimer Glossary & Disclaimer of warranty and limitation of liability Reported Performance Reported performance refers to the financial performance as reported in the audited financial statements and disclosed to the market Growth Definition QoQ growth refers to Q4FY19 vs Q3FY19 YoY/YT
Source: company website
More decks from AMMB Holdings Bhd.
 Q1 FY2027 Earnings Presentation38 slides · Aug 18, 2026
 FY2026 Earnings Presentation38 slides · May 28, 2026
 9MFY2026 Earnings Presentation38 slides · Feb 25, 2026
 H1 FY2026 Earnings Presentation38 slides · Nov 26, 2025
 Q1 FY2026 Earnings Presentation37 slides · Aug 18, 2025
 FY2025 Earnings Presentation37 slides · May 26, 2025