Endurance Specialty Holdings Ltd
Endurance Specialty — J.P. Morgan SMid Cap Conference 2009
18 slides from Endurance Specialty's conference presentation, Dec 1, 2009
Slide 1: J.P. Morgan SMid Cap Conference
J.P. Morgan SMid Cap Conference December 2, 2009 Ken LeStrange Chief Executive Officer
Slide 2: Forward looking statements & Regulation G disclaimer
2 Forward looking statements & regulation G disclaimer Safe Harbor for Forward Looking Statements Some of the statements in this presentation include forward-looking statements which reflect our current views with respect to future events and financial performance. Such statements include forward-lo
Slide 3: Introduction to Endurance Specialty Holdings
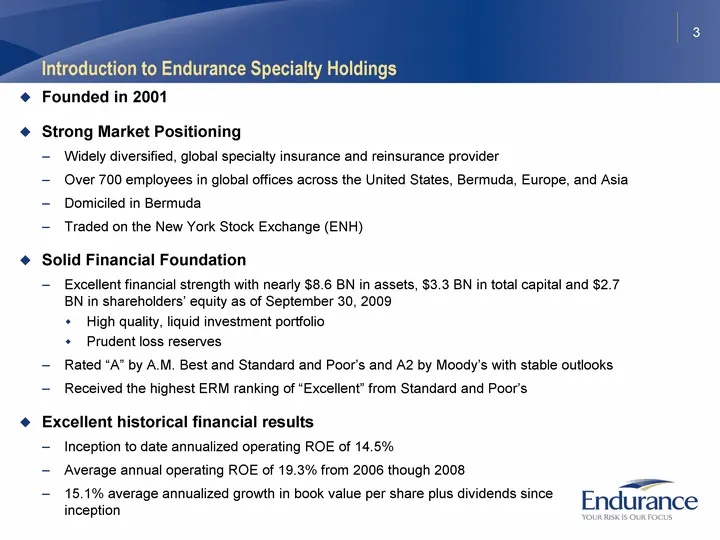
3 Introduction to Endurance Specialty Holdings Founded in 2001 Strong Market Positioning Widely diversified, global specialty insurance and reinsurance provider Over 700 employees in global offices across the United States, Bermuda, Europe, and Asia Domiciled in Bermuda Traded on the New York Stock
Slide 4: Our strategy is focused on delivering superior results for shareholders
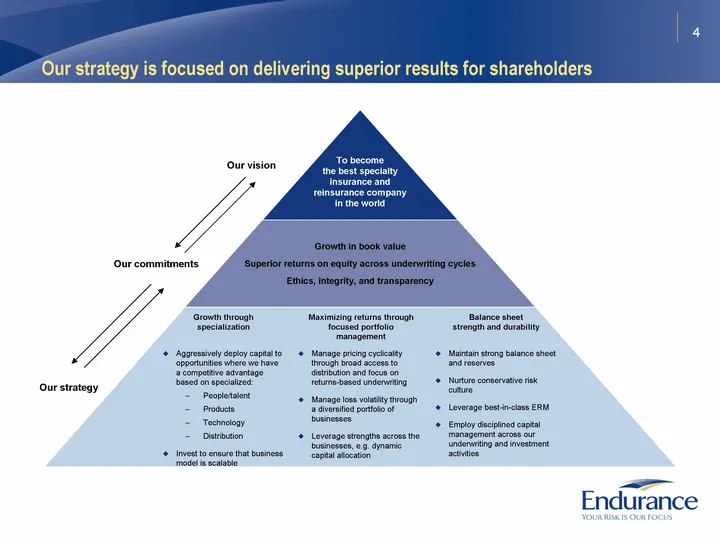
4 Our strategy is focused on delivering superior results for shareholders Our vision Our commitments Our strategy Growth in book value Superior returns on equity across underwriting cycles Ethics, integrity, and transparency To become the best specialty insurance and reinsurance company in the world
Slide 5: Investor value proposition
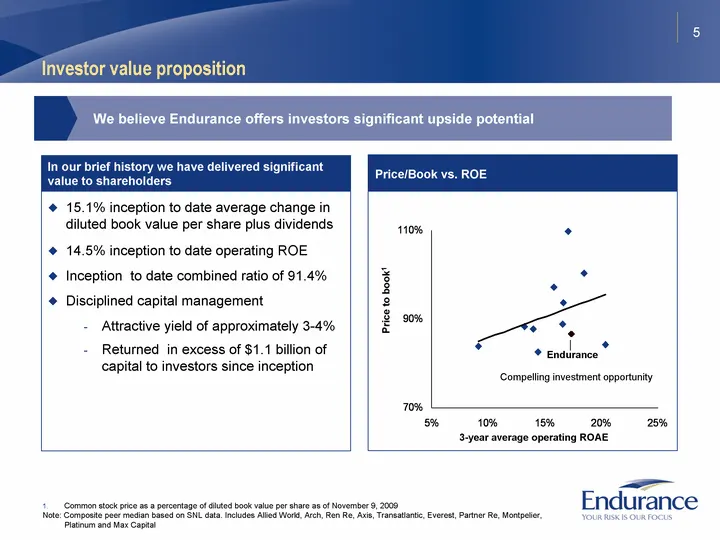
5 Investor value proposition 15.1% inception to date average change in diluted book value per share plus dividends 14.5% inception to date operating ROE Inception to date combined ratio of 91.4% Disciplined capital management Attractive yield of approximately 3-4% Returned in excess of $1.1 billion
Slide 6: Why specialization matters
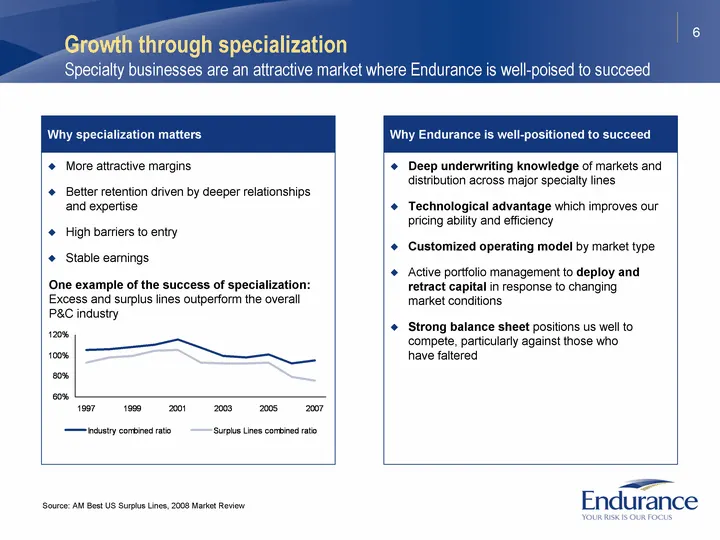
6 More attractive margins Better retention driven by deeper relationships and expertise High barriers to entry Stable earnings Why specialization matters Why Endurance is well-positioned to succeed Deep underwriting knowledge of markets and distribution across major specialty lines Technological adv
Slide 7: Engaged in diverse growth strategies
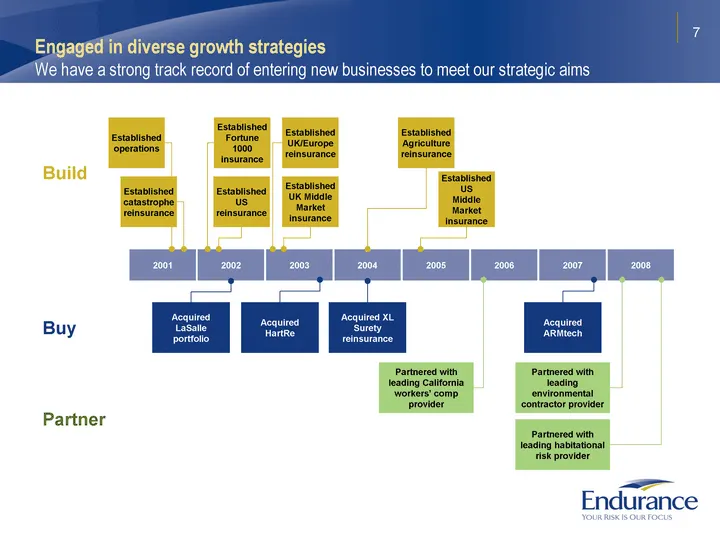
7 Engaged in diverse growth strategies We have a strong track record of entering new businesses to meet our strategic aims Buy Build Partner 2008 2006 2001 2002 2003 2004 2005 2007 Acquired LaSalle portfolio Acquired HartRe Acquired ARMtech Partnered with leading California workers' comp provider Ac
Slide 8: We have succeeded in building a diversified specialty portfolio of businesses
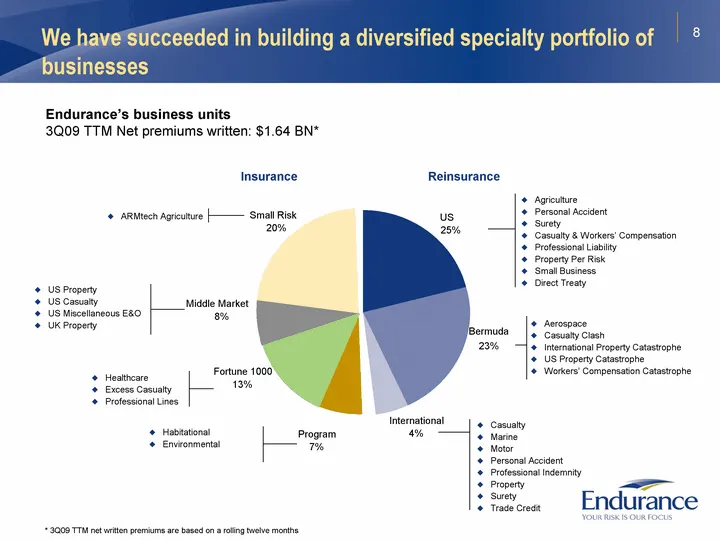
8 We have succeeded in building a diversified specialty portfolio of businesses Endurance's business units 3Q09 TTM Net premiums written: $1.64 BN* Reinsurance Insurance Agriculture Personal Accident Surety Casualty & Workers' Compensation Professional Liability Property Per Risk Small Business Dire
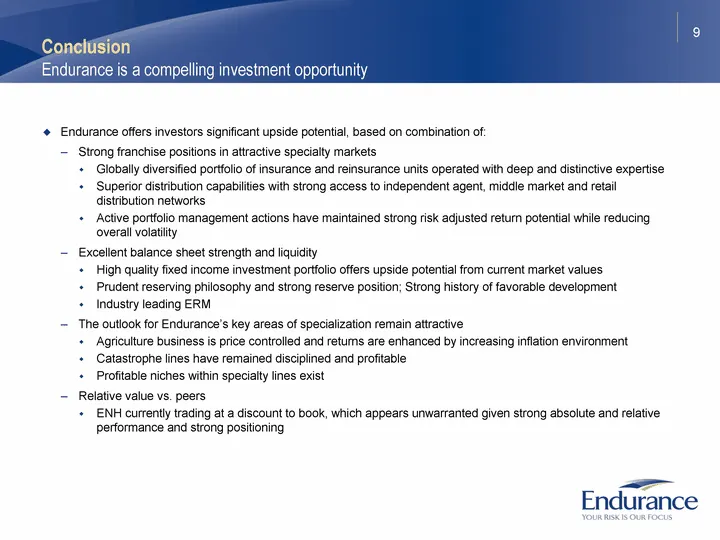
Slide 9: Conclusion: Endurance is a compelling investment opportunity
9 Conclusion Endurance is a compelling investment opportunity Endurance offers investors significant upside potential, based on combination of: Strong franchise positions in attractive specialty markets Globally diversified portfolio of insurance and reinsurance units operated with deep and distinct

Slide 10: Endurance
—_ Endurance
Slide 11: Strong book value growth
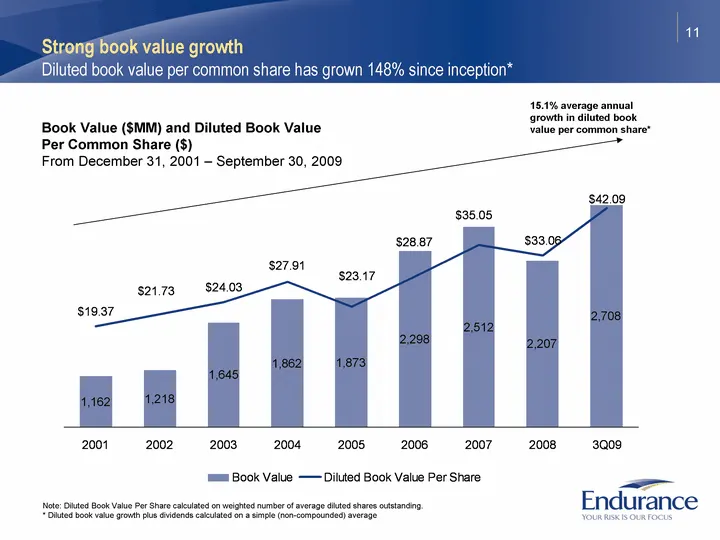
11 Strong book value growth Diluted book value per common share has grown 148% since inception* Book Value ($MM) and Diluted Book Value Per Common Share ($) From December 31, 2001 - September 30, 2009 2001 2002 2003 2004 2005 2006 2007 2008 1Q09 3Q09 Diluted Book Value Per Share 19.37 21.73 24.03 27
Slide 12: Operating ROE 2002-2008
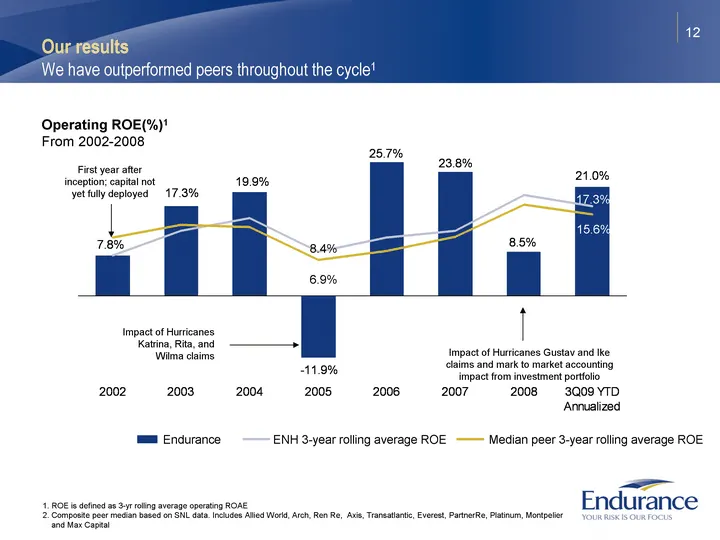
12 2002 2003 2004 2005 2006 2007 2008 3Q09 YTD Annualized Endurance ROE 0.078 0.173 0.199 -0.119 0.257 0.238 0.085 0.21 0.978 0.9767 0.97 Endurance 3-year rolling average 0.078 0.1255 0.15 0.084333333 0.112333333 0.125333333 0.193333333 0.173 Peer 3-year rolling average ROE 0.165 0.146 0.0745 0.0928
Slide 13: Financial results for third quarter 2009
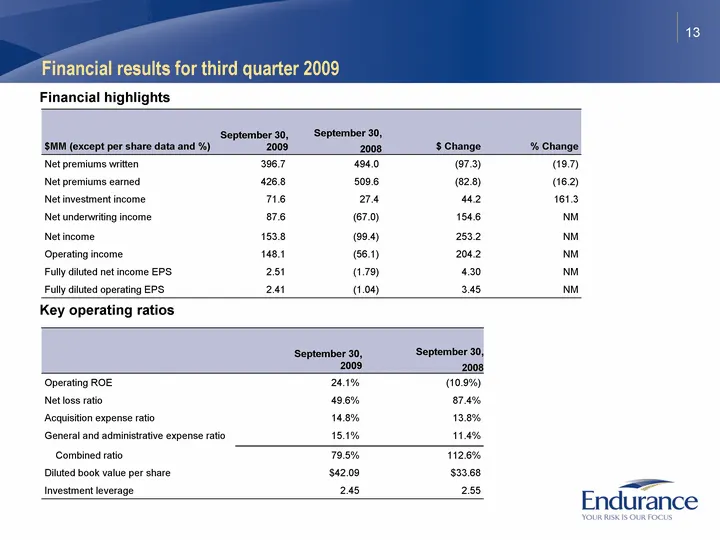
13 Financial results for third quarter 2009 $MM (except per share data and %) September 30, 2009 September 30, 2008 $ Change % Change Net premiums written 396.7 494.0 (97.3) (19.7) Net premiums earned 426.8 509.6 (82.8) (16.2) Net investment income 71.6 27.4 44.2 161.3 Net underwriting income 87.6 (
Slide 14: Third quarter net written premiums
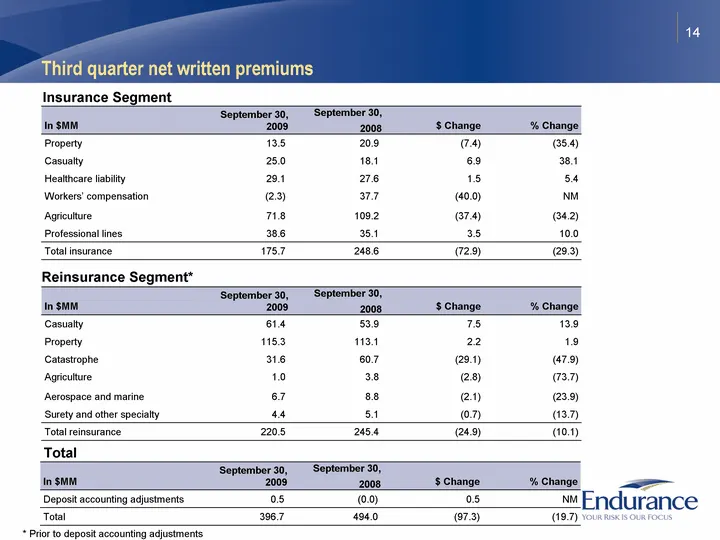
14 Third quarter net written premiums In $MM September 30, 2009 September 30, 2008 $ Change % Change Property 13.5 20.9 (7.4) (35.4) Casualty 25.0 18.1 6.9 38.1 Healthcare liability 29.1 27.6 1.5 5.4 Workers' compensation (2.3) 37.7 (40.0) NM Agriculture 71.8 109.2 (37.4) (34.2) Professional lines 3
Slide 15: Financial overview: historical
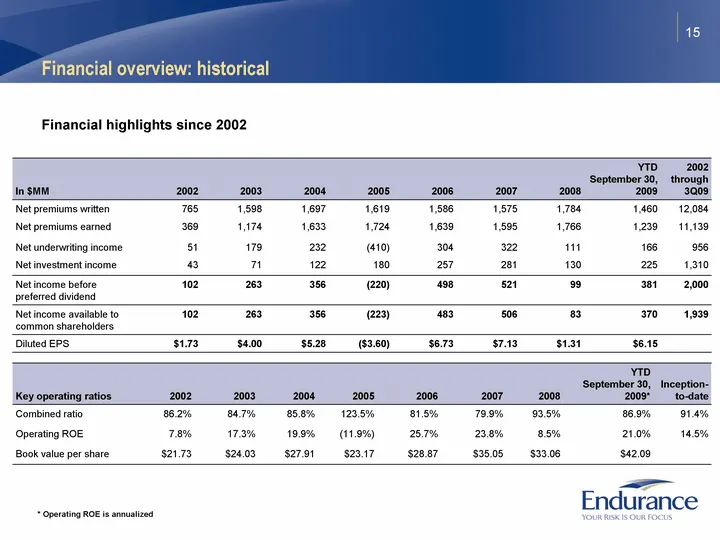
15 Financial overview: historical In $MM 2002 2003 2004 2005 2006 2007 2008 YTD September 30, 2009 2002 through 3Q09 Net premiums written 765 1,598 1,697 1,619 1,586 1,575 1,784 1,460 12,084 Net premiums earned 369 1,174 1,633 1,724 1,639 1,595 1,766 1,239 11,139 Net underwriting income 51 179 232 (
Slide 16: Balance sheet strength at September 30, 2009
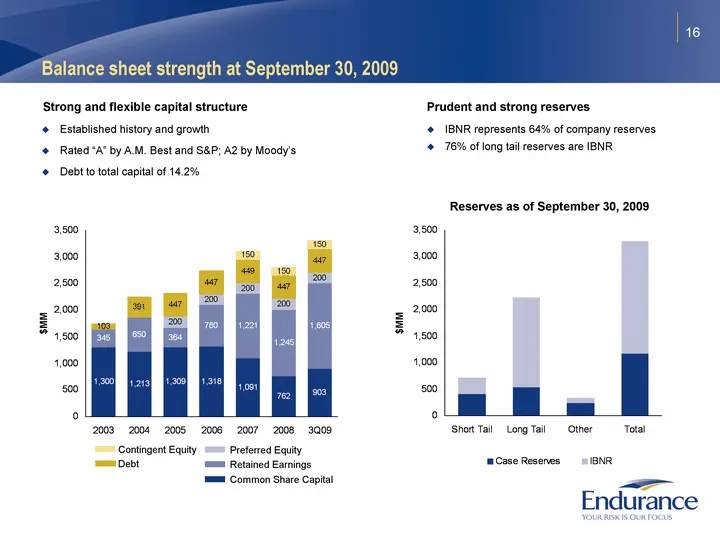
16 Balance sheet strength at September 30, 2009 Strong and flexible capital structure IBNR represents 64% of company reserves 76% of long tail reserves are IBNR Prudent and strong reserves Short Tail Long Tail Other Total 2007 2008 Case Reserves 402.311 538.386 233.282 1173.979 3111.1 2804.3 IBNR 31
Slide 17: Investment portfolio composition at September 30, 2009
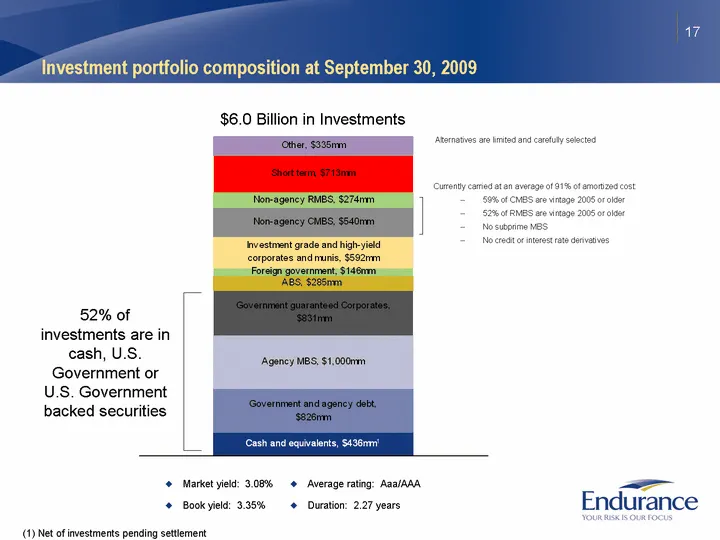
17 Cash and equivalents 436 Government and agency debt 825 Agency MBS 1000 Government guaranteed corporates 831 ABS 285 Foreign government 146 Investment grade and high-yield corporates and munis 592 Non-agency CMBS 540 Non-agency RMBS 274 Short term 713 Preferred equity securities Other 335 Aggrega
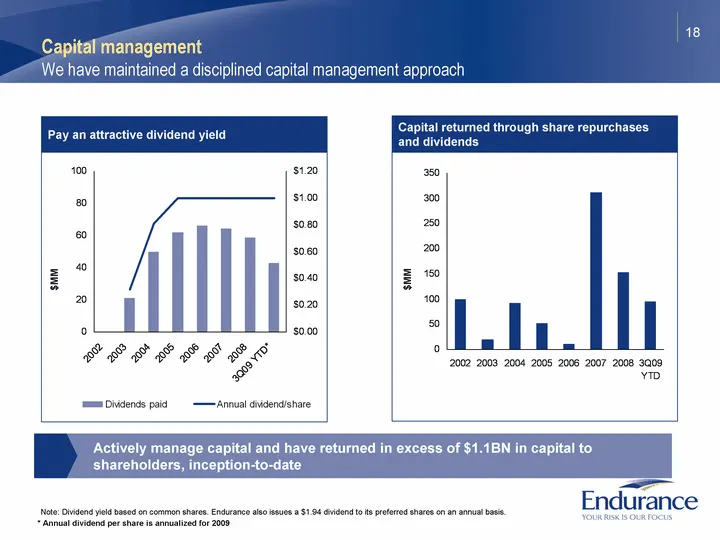
Slide 18: Capital management
18 2002 2003 2004 2005 2006 2007 2008 3Q09 YTD* Annual dividend/share 0.32 0.81 1 1 1 1 1 Dividends paid 21 50 62 66 64 58.7 42.9 C 3 2.9 3.7 5 D 4 3 4.5 6 E 4 6 6.5 7 F 9 7 7.2 8 G 11 8 2 9 H 5 8 9 10 $MM 2002 2003 2004 2005 2006 2007 2008 3Q09 YTD Annual dividend 0.32 0.81 1 1 1 1 Capital returned
Source: SEC EDGAR · 8-K filed Dec 1, 2009
More decks from Endurance Specialty Holdings Ltd
 Merger or Acquisition (October 2016)17 slides · Oct 12, 2016
 Investor Presentation (August 2016)29 slides · Aug 9, 2016
 Investor Presentation (May 2016)28 slides · May 10, 2016
 Investor Presentation (February 2016)29 slides · Feb 9, 2016
 Investor Presentation (February 2015)28 slides · Feb 11, 2015
 Merger or Acquisition (April 2014)22 slides · Apr 14, 2014