HCC Insurance — Conference Presentation (November 2005)
36 slides from HCC Insurance's conference presentation, Nov 30, 2005
Slide 1: About Forward Looking Statements
ABOUT FORWARD LOOKING STATEMENTS This presentation contains certain "forward looking statements" within the meaning of Section 27A of the Securities Act of 1933, and Section 21E of the Securities Exchange Act of 1934, which are intended to be covered by the safe harbors created by those laws. These
Slide 2: Overview
OVERVIEW
Slide 3: Corporate Profile
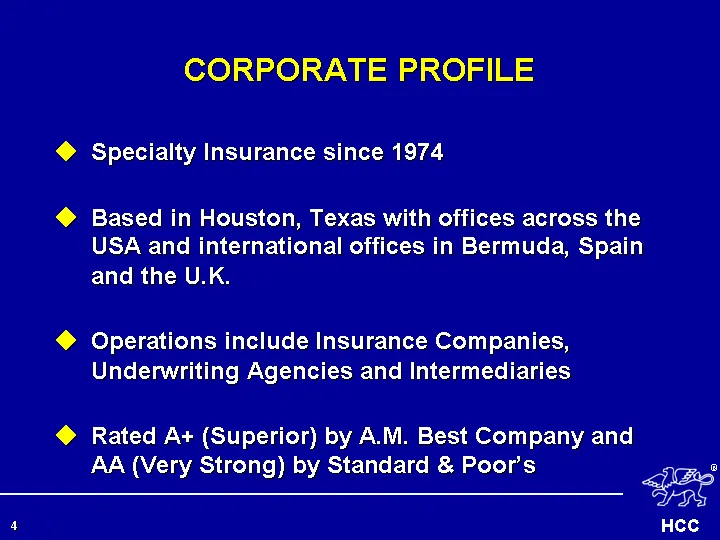
CORPORATE PROFILE Specialty Insurance since 1974 Based in Houston, Texas with offices across the USA and international offices in Bermuda, Spain and the U.K. Operations include Insurance Companies, Underwriting Agencies and Intermediaries Rated A+ (Superior) by A.M. Best Company and AA (Very Strong)
Slide 4: Corporate Philosophy
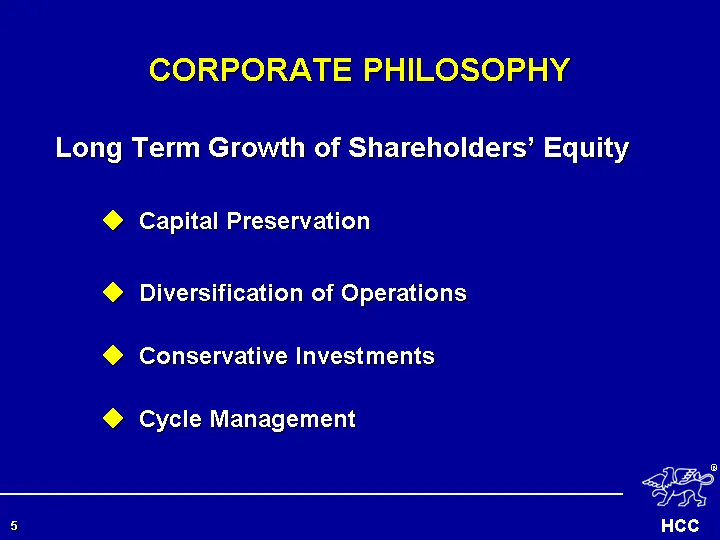
CORPORATE PHILOSOPHY Long Term Growth of Shareholders' Equity Capital Preservation Diversification of Operations Conservative Investments Cycle Management
Slide 5: Shareholders Equity
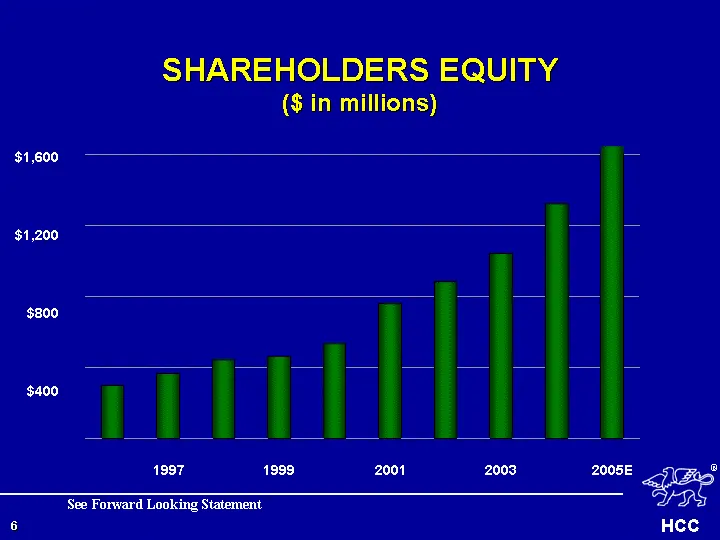
SHAREHOLDERS EQUITY ($ in millions) $1,200 $800 $400 1997 1999 2001 2003 2005E $1,600 See Forward Looking Statement
Slide 6: Shareholders Equity
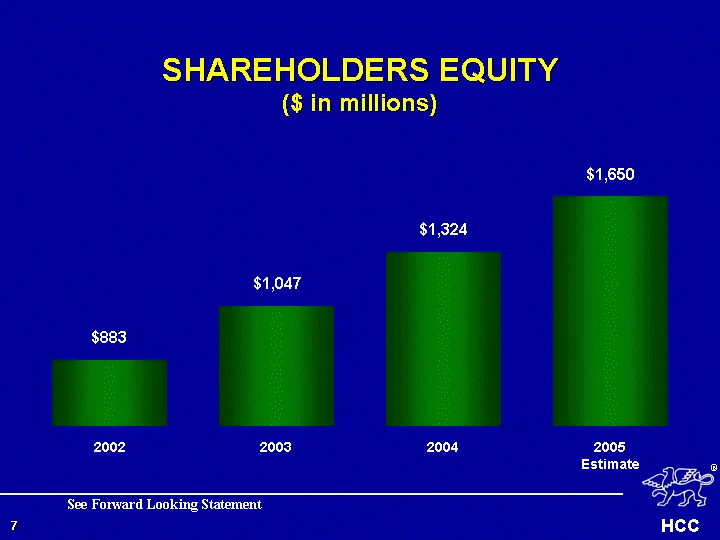
SHAREHOLDERS EQUITY ($ in millions) 2002 $883 2003 $1,047 $1,324 2005 Estimate $1,650 2004 See Forward Looking Statement
Slide 7: Return on Beginning Equity
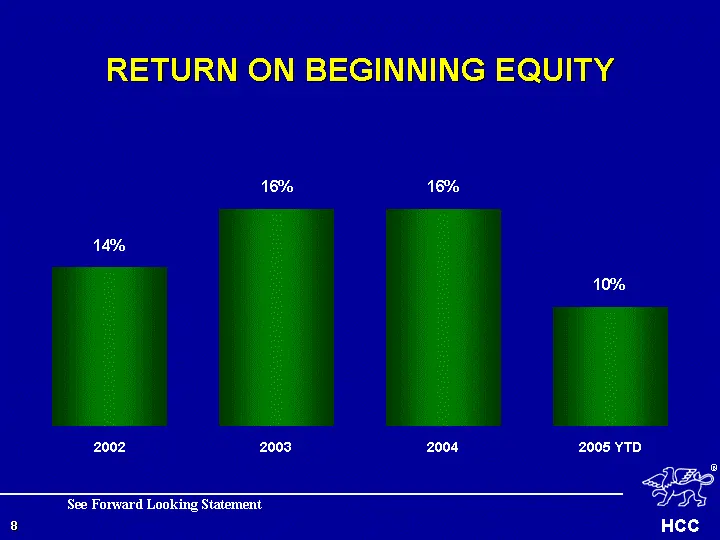
RETURN ON BEGINNING EQUITY 2002 14% 2003 16% 16% 2005 YTD 10% 2004 See Forward Looking Statement
Slide 8: Growth in Book Value
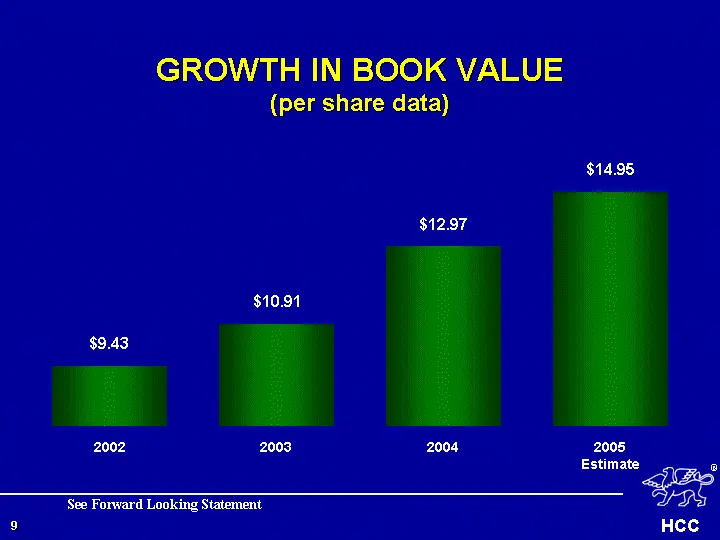
GROWTH IN BOOK VALUE (per share data) 2002 $9.43 2003 $10.91 $12.97 2004 2005 Estimate $14.95 See Forward Looking Statement
Slide 9: Operations
OPERATIONS
Slide 10: Executive Management
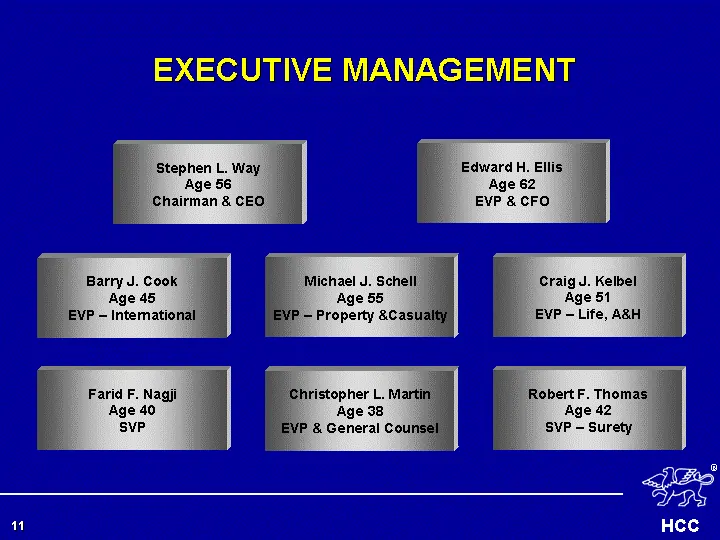
EXECUTIVE MANAGEMENT Edward H. Ellis Age 62 EVP & CFO Robert F. Thomas Age 42 SVP - Surety Farid F. Nagji Age 40 SVP Michael J. Schell Age 55 EVP - Property &Casualty Barry J. Cook Age 45 EVP - International
Slide 11: Operational Structure
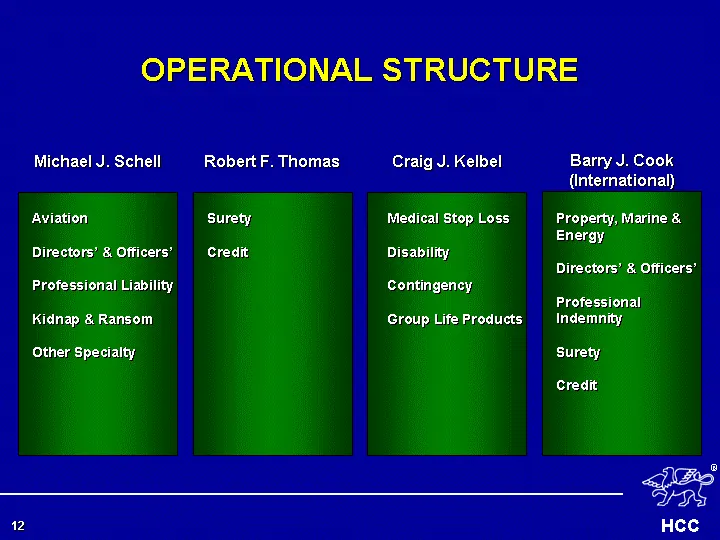
OPERATIONAL STRUCTURE Michael J. Schell Aviation Directors' & Officers' Professional Liability Kidnap & Ransom Other Specialty Craig J. Kelbel Medical Stop Loss Disability Contingency Group Life Products Robert F. Thomas Surety Credit Barry J. Cook (International) Property, Marine & Energy Directors
Slide 12: Operating Management
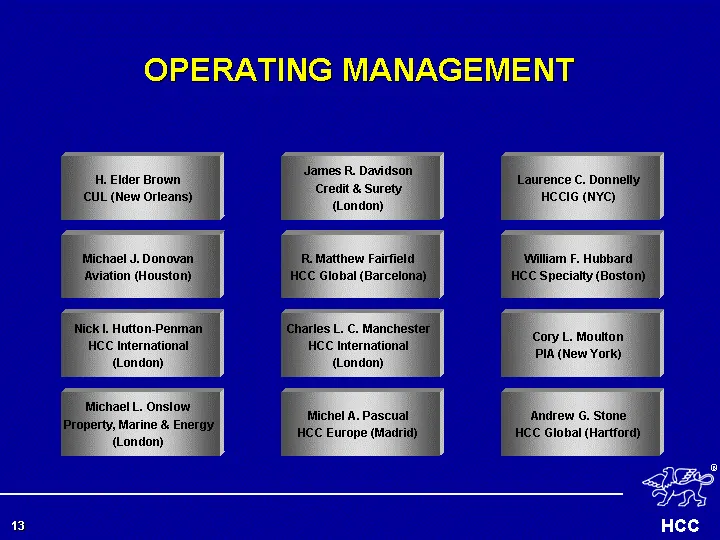
OPERATING MANAGEMENT H. Elder Brown CUL (New Orleans) James R. Davidson Credit & Surety (London) Laurence C. Donnelly HCCIG (NYC) Michael J. Donovan Aviation (Houston) William F. Hubbard HCC Specialty (Boston) R. Matthew Fairfield HCC Global (Barcelona) Nick I. Hutton-Penman HCC International (Londo
Slide 13: Lines of Business
LINES OF BUSINESS Group Life, Accident & Health Diversified Financial Products Aviation Property, Marine & Energy Other Specialty Operations
Slide 14: Group Life, Accident & Health
GROUP LIFE, ACCIDENT & HEALTH Medical Stop Loss protection for small and medium size corporations that self insure their employee medical benefits Accident & Health for vehicle owner-operators Accident & Health for Texas companies that self insure their Workers' Compensation risk
Slide 15: Diversified Financial Products
DIVERSIFIED FINANCIAL PRODUCTS D&O for Fortune 1000 and multinational companies, non- public companies and not-for-profit groups Professional Liability (E&O) for small businesses and professionals Surety including court, fiduciary, license, permit and small contractors Employers' Practice Liability
Slide 16: Property, Marine & Energy
PROPERTY, MARINE & ENERGY Large Property business worldwide, such as Fortune 1000 and multinational accounts Large Energy accounts worldwide, such as refineries, offshore platforms and drilling rigs Blue water marine fleets, worldwide
Slide 17: Other Specialty Operations
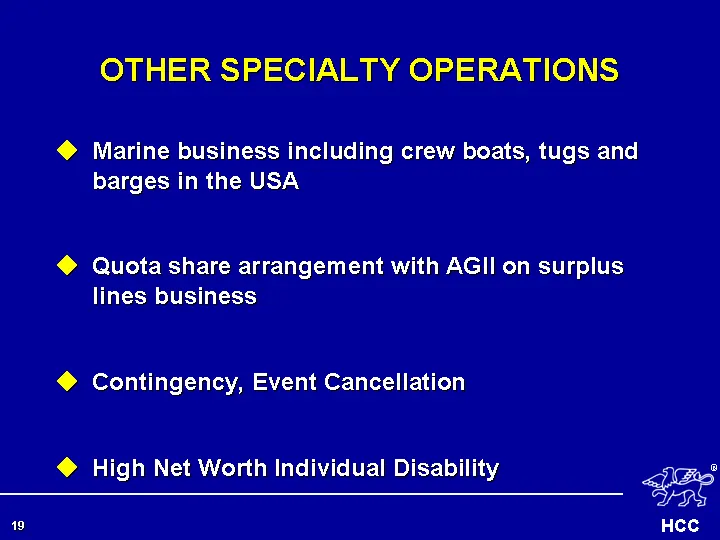
OTHER SPECIALTY OPERATIONS Marine business including crew boats, tugs and barges in the USA Quota share arrangement with AGII on surplus lines business Contingency, Event Cancellation High Net Worth Individual Disability
Slide 18: Gross Written Premium
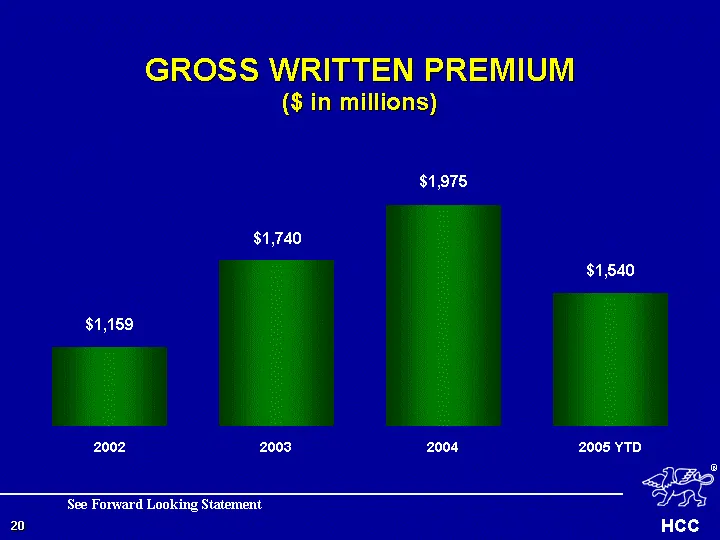
GROSS WRITTEN PREMIUM ($ in millions) 2002 $1,159 2003 $1,740 $1,975 2004 2005 YTD $1,540 See Forward Looking Statement
Slide 19: Net Written Premium
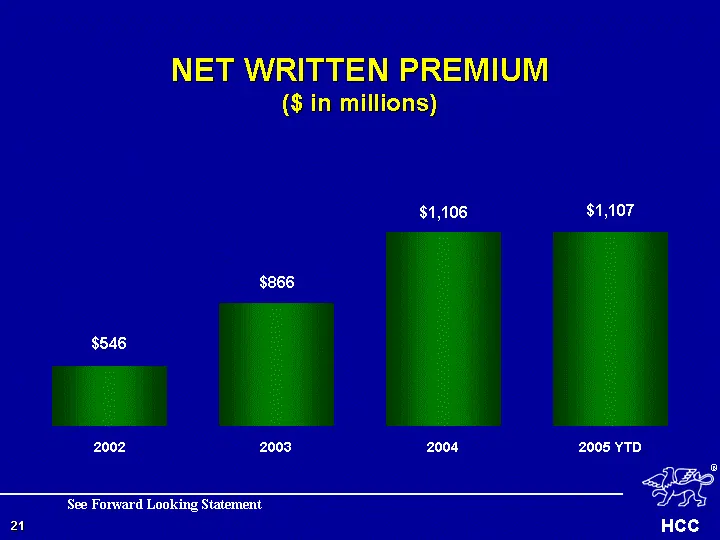
NET WRITTEN PREMIUM ($ in millions) 2002 $546 2003 $866 $1,106 2004 2005 YTD $1,107 See Forward Looking Statement
Slide 20: Financials
FINANCIALS
Slide 21: Balance Sheet
BALANCE SHEET
Slide 22: Strong Balance Sheet
STRONG BALANCE SHEET Conservative Loss Reserves Strong Liquidity Rising Investment Assets and Low Risk Investment Portfolio Assets of more than $6.6 Billion
Slide 23: Net Loss Reserves
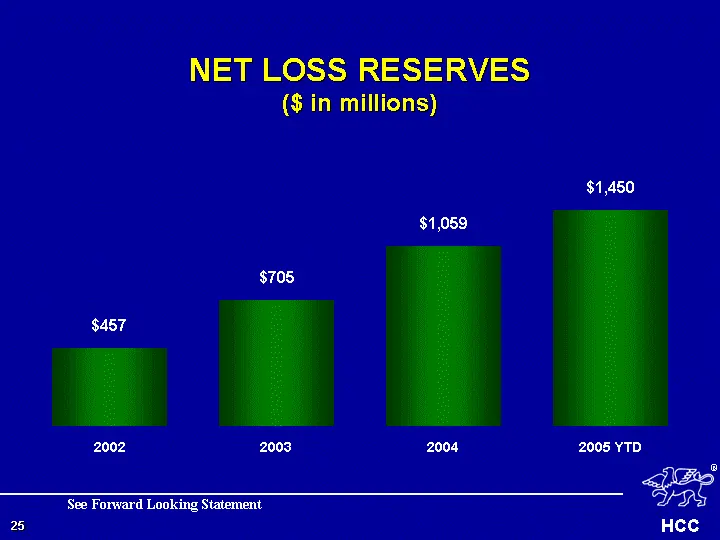
NET LOSS RESERVES ($ in millions) 2002 $457 2003 $705 $1,059 2004 2005 YTD $1,450 See Forward Looking Statement
Slide 24: Cash Flow
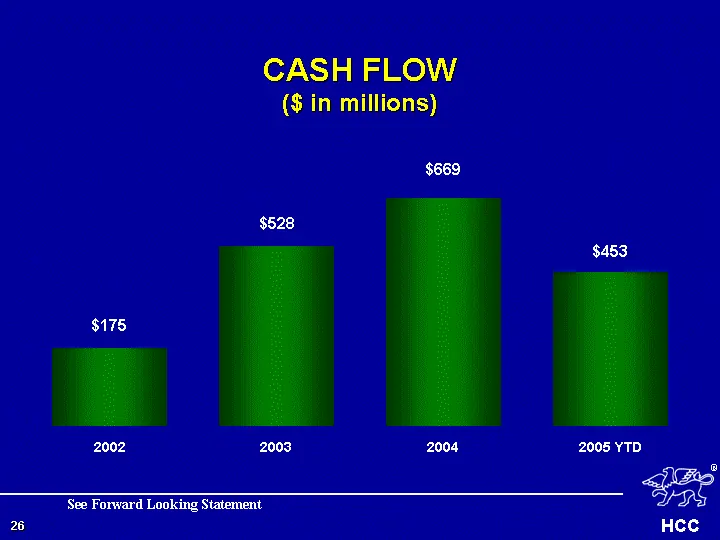
CASH FLOW ($ in millions) 2002 $175 2003 $528 $669 2004 2005 YTD $453 See Forward Looking Statement
Slide 25: Investment Assets
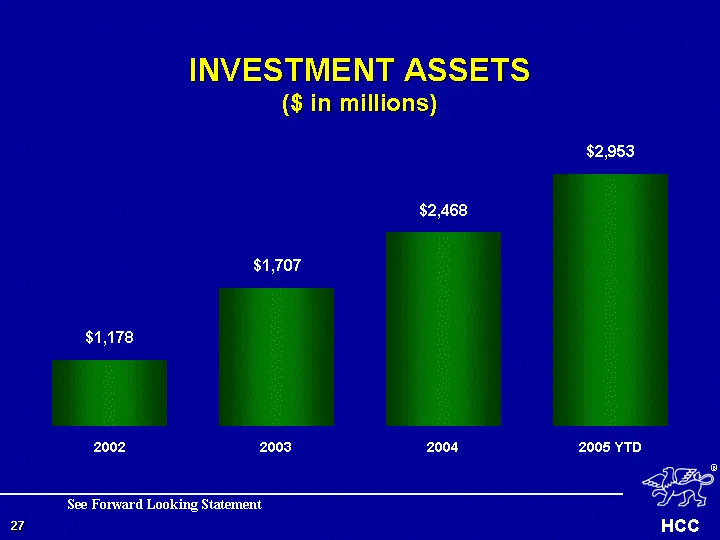
INVESTMENT ASSETS ($ in millions) 2002 $1,178 2003 $1,707 $2,468 2004 2005 YTD $2,953 See Forward Looking Statement
Slide 26: Conservative Investment Portfolio
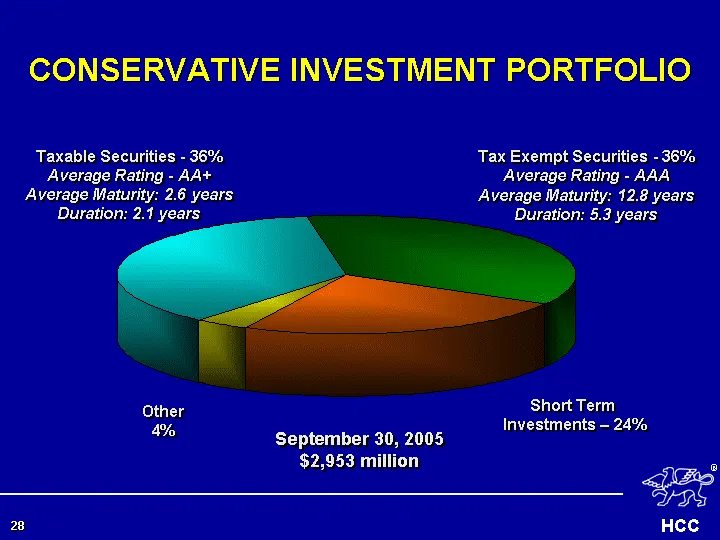
1st Qtr Tax Exempt Securities 36 Short Term Investments 24 Other 4 Taxable Securities 36 Taxable Securities - 36% Average Rating - AA+ Average Maturity: 2.6 years Duration: 2.1 years Tax Exempt Securities - 36% Average Rating - AAA Average Maturity: 12.8 years Duration: 5.3 years Other 4% September
Slide 27: Total Assets
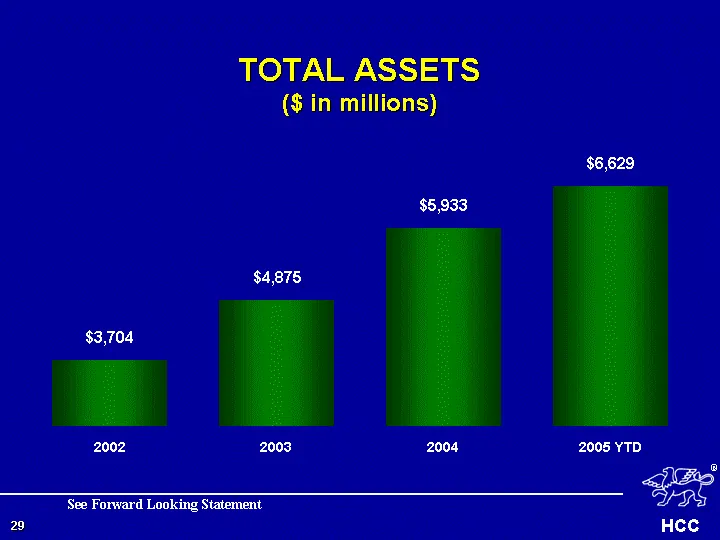
TOTAL ASSETS ($ in millions) 2002 $3,704 2003 $4,875 $5,933 2004 2005 YTD $6,629 See Forward Looking Statement
Slide 28: Revenue: Net Earned Premium
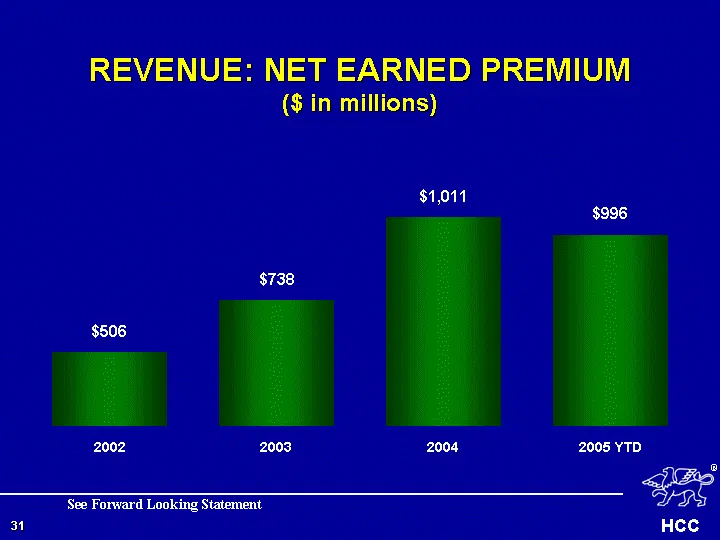
REVENUE: NET EARNED PREMIUM ($ in millions) 2002 $506 2003 $738 $1,011 2004 2005 YTD $996 See Forward Looking Statement
Slide 29: Revenue: Fee & Commission Income
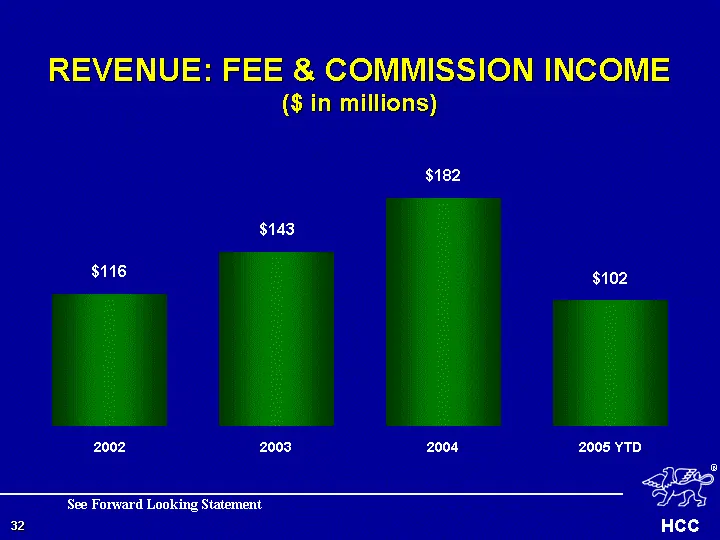
REVENUE: FEE & COMMISSION INCOME ($ in millions) 2002 $116 2003 $143 $182 2004 2005 YTD $102 See Forward Looking Statement
Slide 30: Revenue: Investment Income
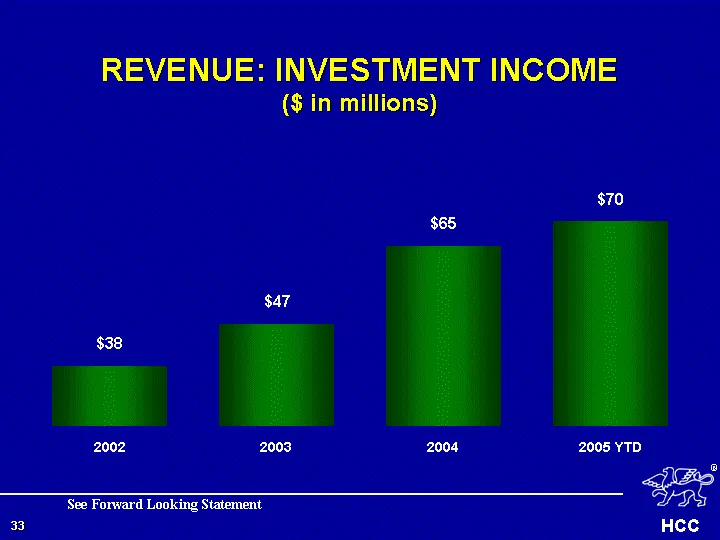
REVENUE: INVESTMENT INCOME ($ in millions) 2002 $38 2003 $47 $65 2004 2005 YTD $70 See Forward Looking Statement
Slide 31: Net Earnings
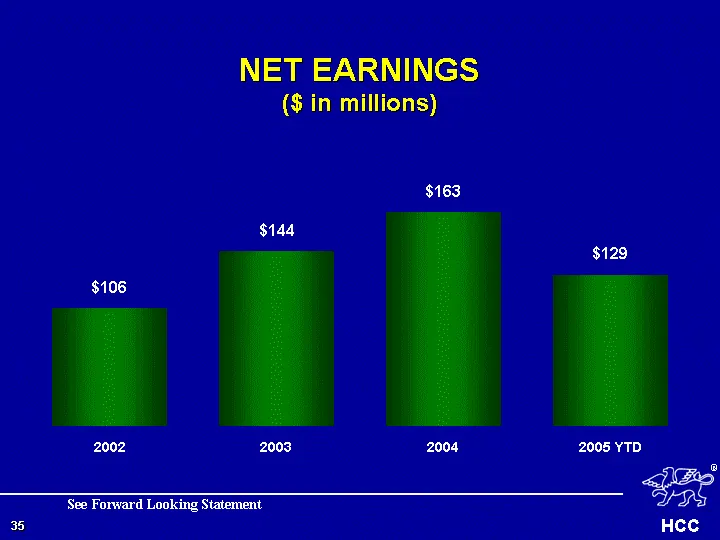
NET EARNINGS ($ in millions) 2002 $106 2003 $144 $163 2004 2005 YTD $129 See Forward Looking Statement
Slide 32: Net Earnings Per Share
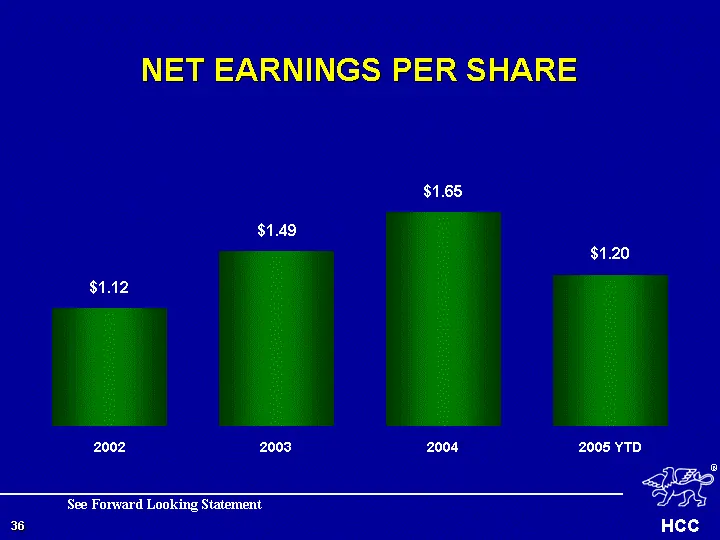
NET EARNINGS PER SHARE 2002 $1.12 2003 $1.49 $1.65 2004 2005 YTD $1.20 See Forward Looking Statement
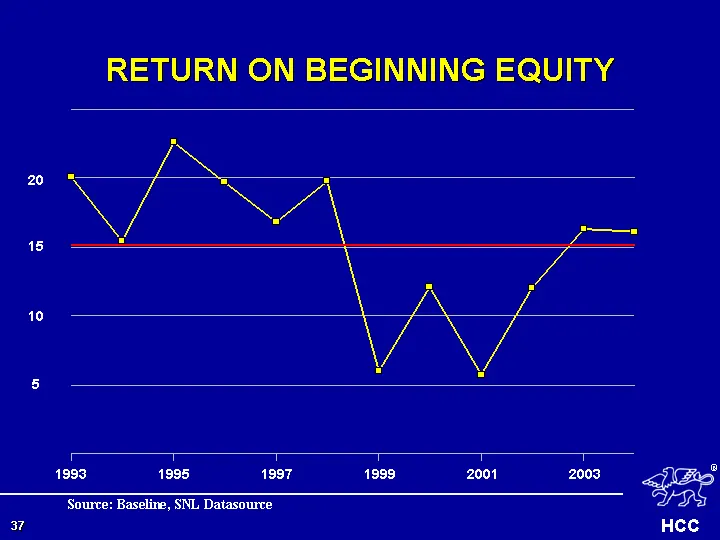
Slide 33: Return on Beginning Equity
RETURN ON BEGINNING EQUITY Source: Baseline, SNL Datasource 1993 1994 1995 1996 1997 1998 1999 2000 2001 2002 2003 2004 ROE 20.1 15.4 22.6 19.7 16.8 19.8 6 12.1 5.7 12 16.3 16.1 AVG ROE 15.2 15.2 15.2 15.2 15.2 15.2 15.2 15.2 15.2 15.2 15.2 15.2 5 10 15 20 1993 1995 1997 1999 2001 2003
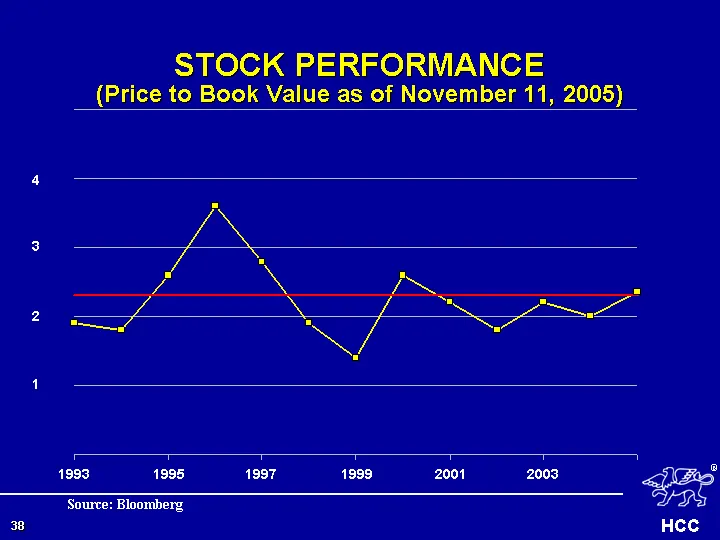
Slide 34: Stock Performance (Price to Book Value)
1993 1994 1995 1996 1997 1998 1999 2000 2001 2002 2003 2004 11/11/2005 P to B 1.9 1.8 2.6 3.6 2.8 1.9 1.4 2.6 2.2 1.8 2.2 2 2.35 AVG 2.3 2.3 2.3 2.3 2.3 2.3 2.3 2.3 2.3 2.3 2.3 2.3 2.3 1 2 3 4 1993 1995 1997 1999 2001 2003 STOCK PERFORMANCE (Price to Book Value as of November 11, 2005) Source: Bloom
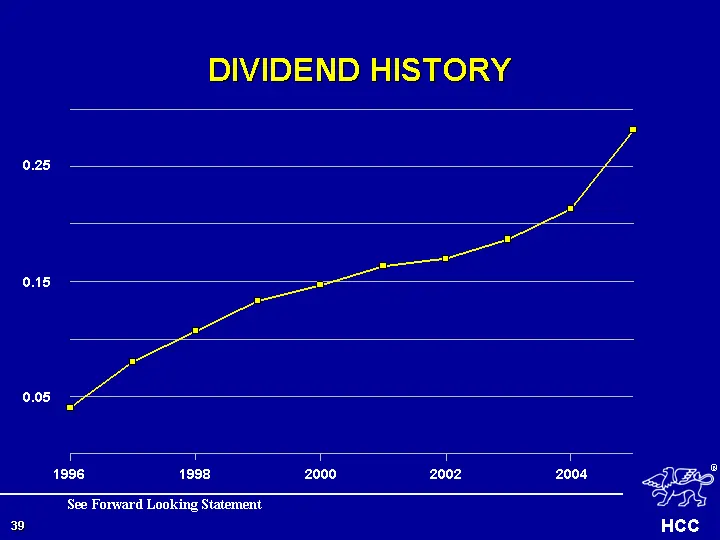
Slide 35: Dividend History
0.05 0.15 0.25 1996 1998 2000 2002 2004 DIVIDEND HISTORY 1996 1997 1998 1999 2000 2001 2002 2003 2004 2005 East 0.04 0.08 0.1067 0.1333 0.1467 0.1633 0.17 0.1867 0.2133 0.2817 See Forward Looking Statement
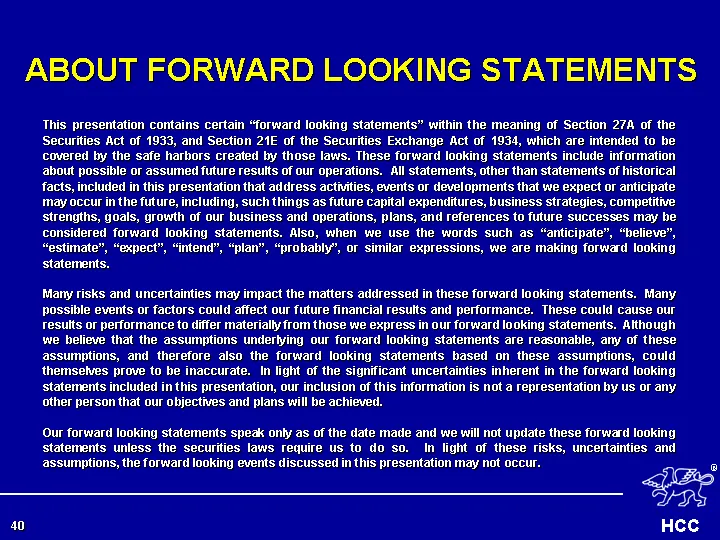
Slide 36: About Forward Looking Statements
ABOUT FORWARD LOOKING STATEMENTS This presentation contains certain "forward looking statements" within the meaning of Section 27A of the Securities Act of 1933, and Section 21E of the Securities Exchange Act of 1934, which are intended to be covered by the safe harbors created by those laws. These
Source: SEC EDGAR · 8-K filed Nov 30, 2005
More decks from HCC Insurance Holdings Inc
 Q2 2015 Earnings Presentation31 slides · Aug 14, 2015
 Merger or Acquisition (June 2015)22 slides · Jun 23, 2015
 Merger or Acquisition (June 2015)10 slides · Jun 10, 2015
 Merger or Acquisition (June 2015)30 slides · Jun 10, 2015
 Q1 2015 Earnings Presentation35 slides · May 21, 2015
 36th Annual Raymond James Institutional Investors Conference (February 2015)36 slides · Feb 27, 2015