MITIE Group PLC · LSE:MTO
MITIE — FY2014 Earnings Presentation
66 slides from MITIE's earnings presentation, May 19, 2014
Slide 1: Excellent progress through a focus on key growth markets
Excellent progress through a focus on key growth markets Preliminary results presentation for the year ended 31 March 2014 19 May 2014
Slide 2: Ruby McGregor-Smith CBE, Chief Executive
Ruby McGregor-Smith CBE Chief Executive 2
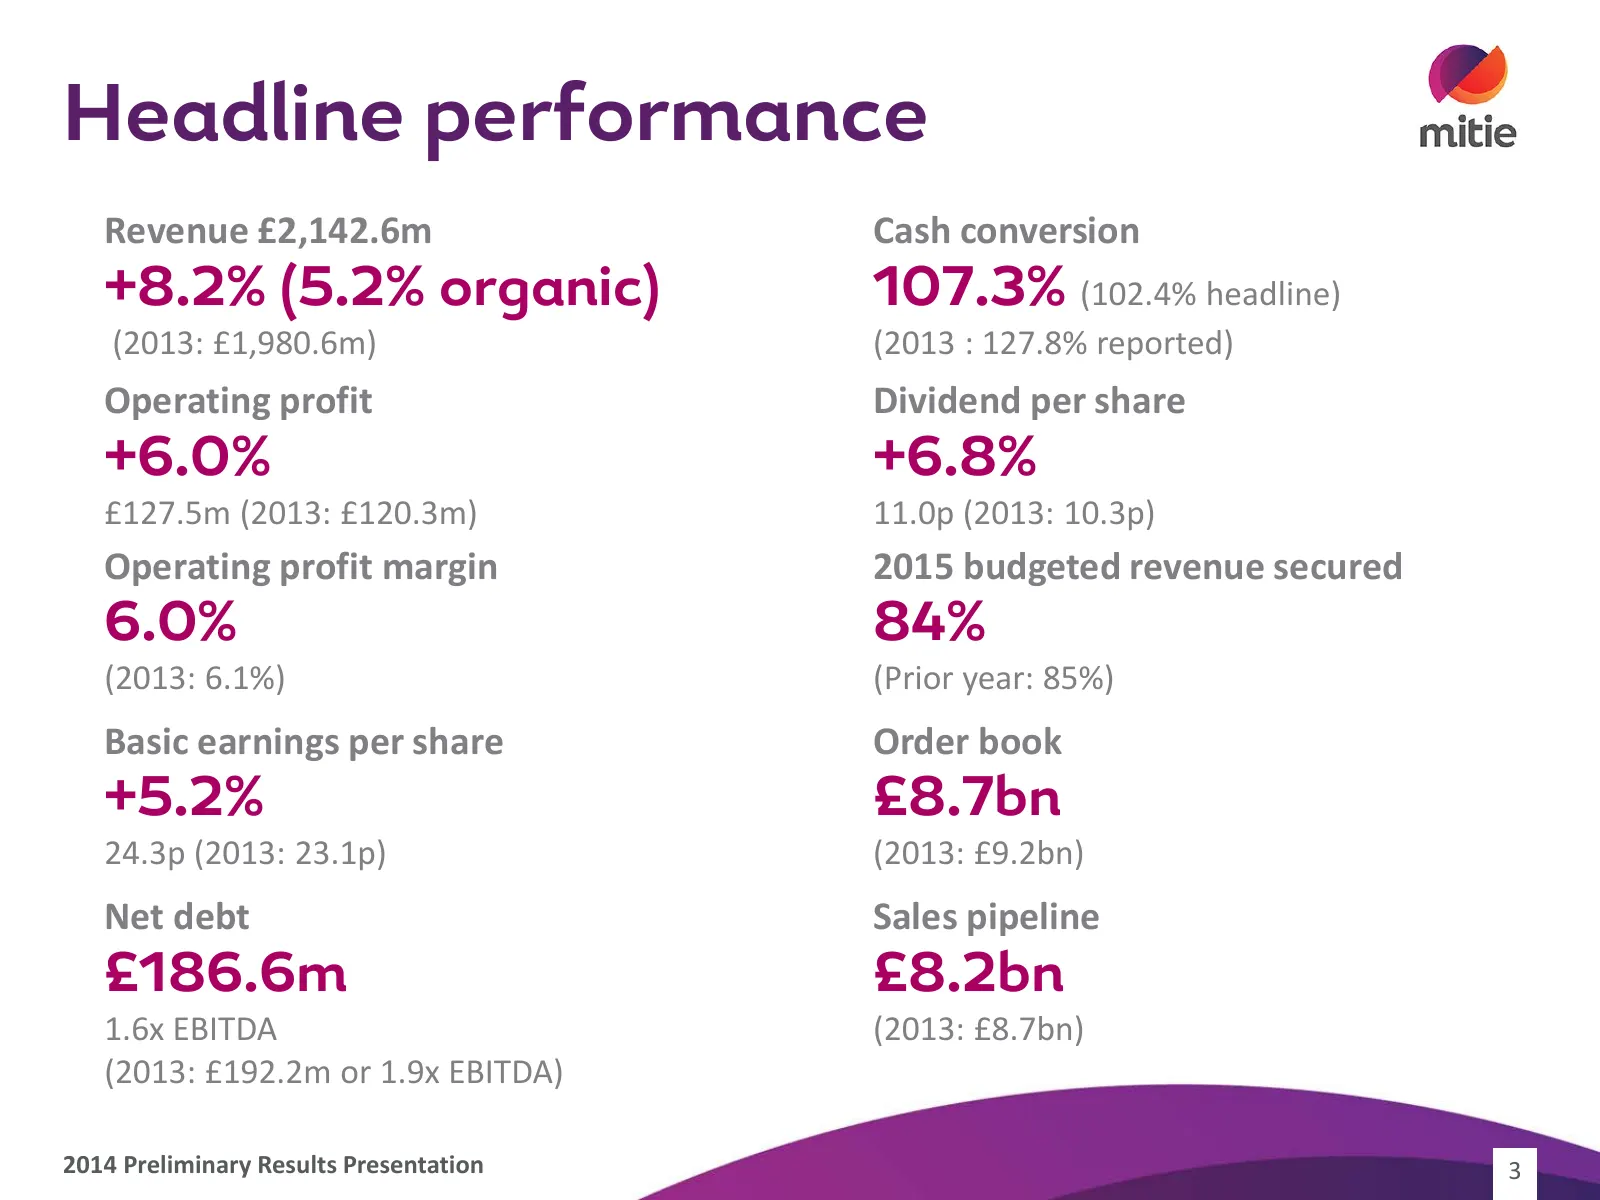
Slide 3: Headline performance
Headline performance Revenue £2,142.6m Cash conversion +8.2% (5.2% organic) 107.3% (102.4% headline) (2013: £1,980.6m) (2013 : 127.8% reported) Operating profit Dividend per share +6.0% +6.8% £127.5m (2013: £120.3m) 11.0p (2013: 10.3p) Operating profit margin 2015 budgeted revenue secured 6.0% 84% (
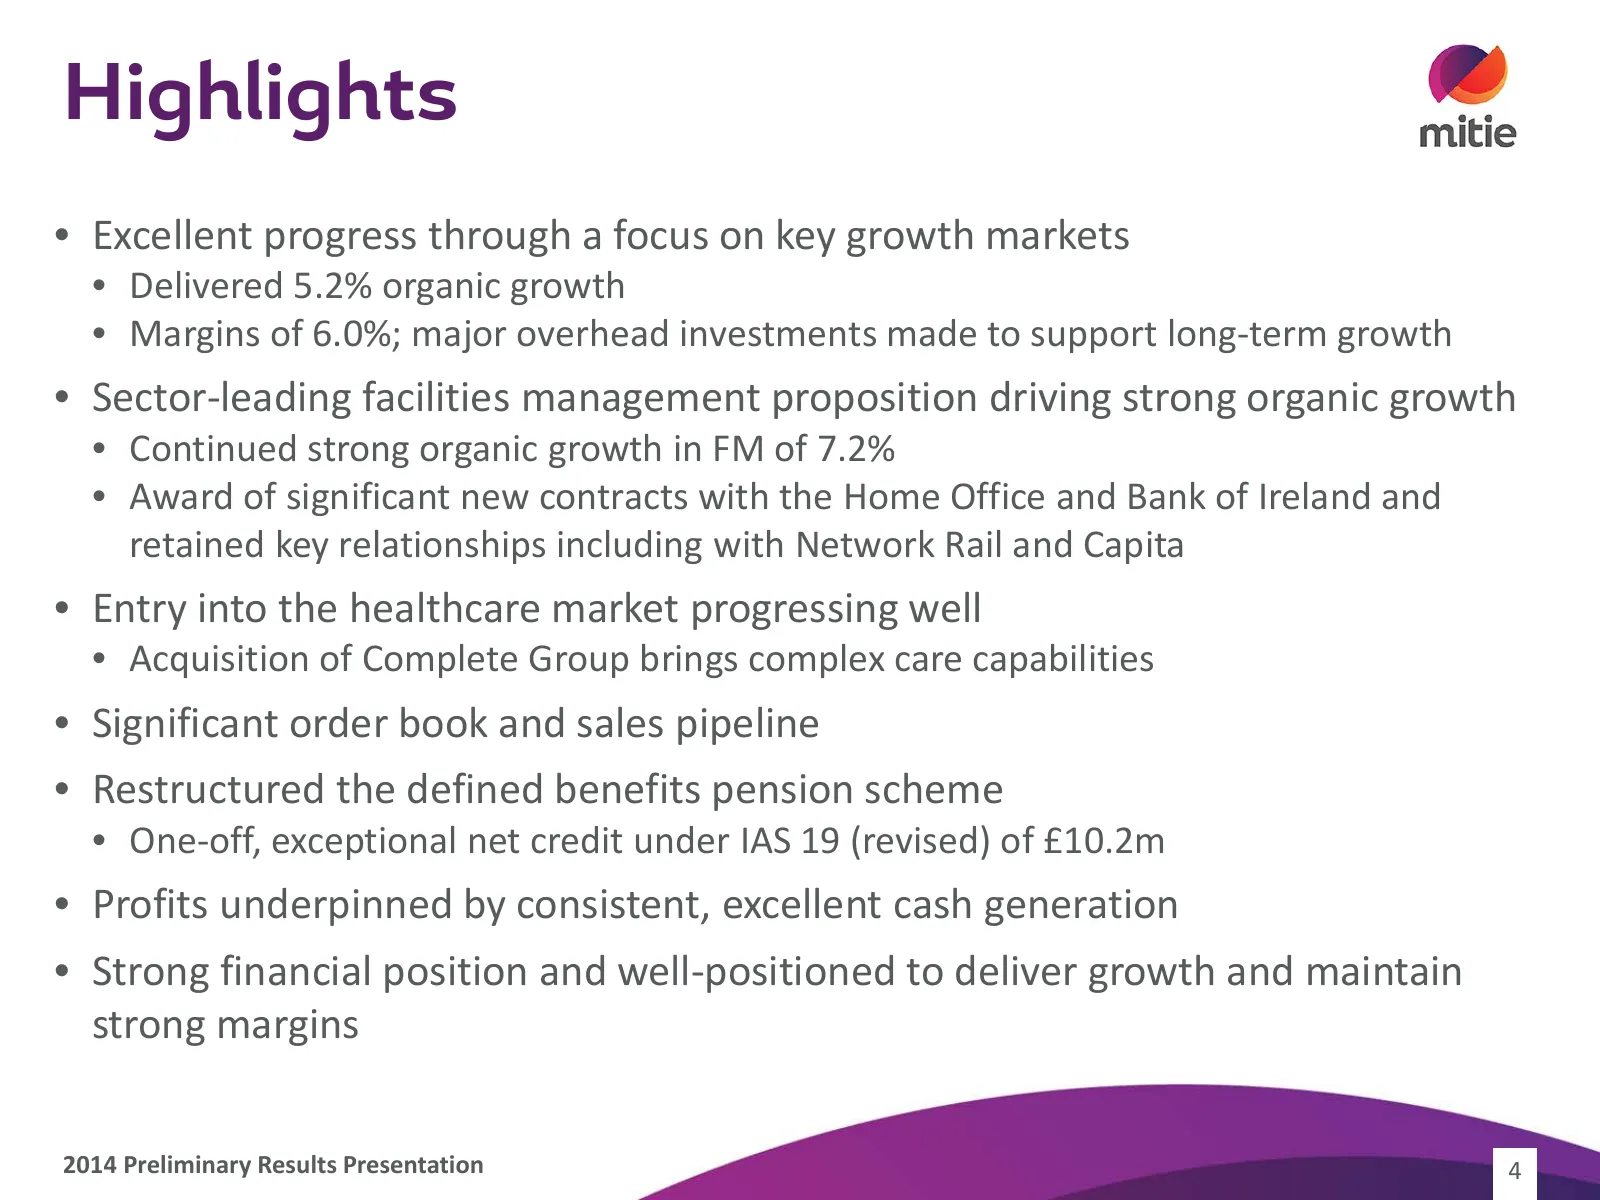
Slide 4: Highlights
Highlights • Excellent progress through a focus on key growth markets • Delivered 5.2% organic growth • Margins of 6.0%; major overhead investments made to support long-term growth • Sector-leading facilities management proposition driving strong organic growth • Continued strong organic growth in F
Slide 5: Re-positioning and de-risking the business
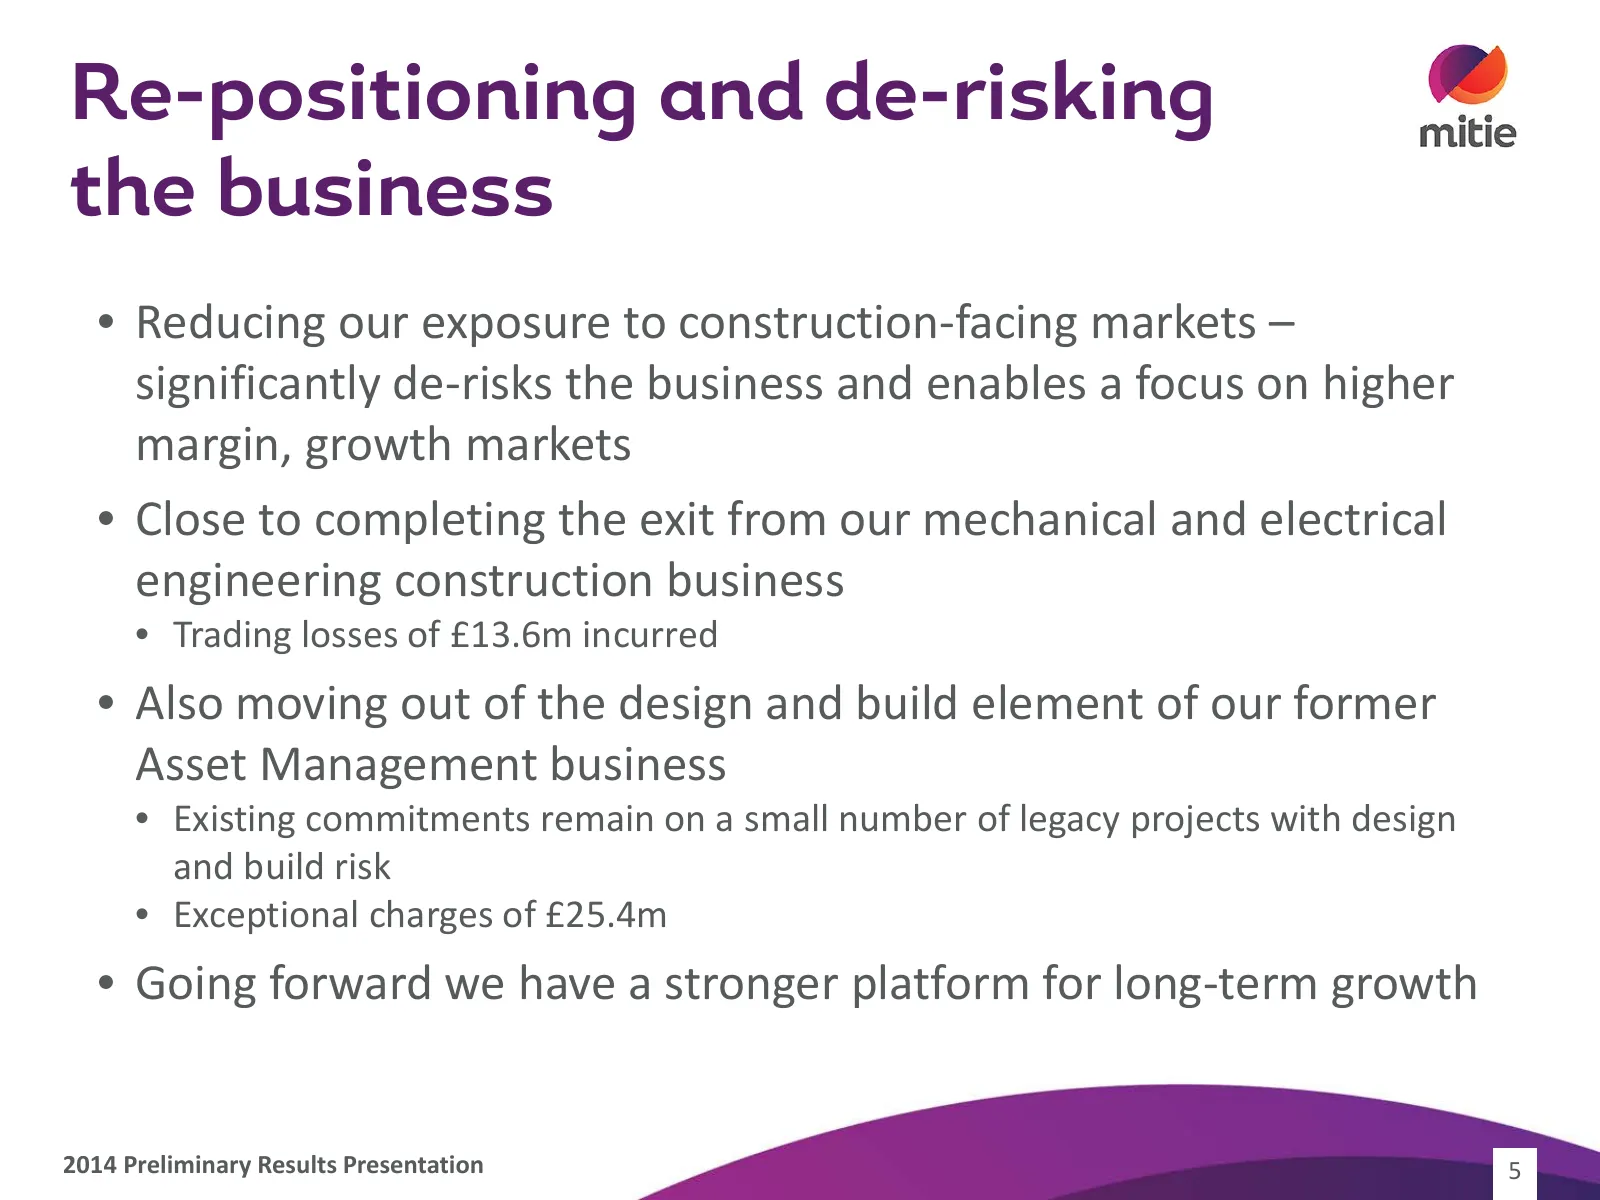
Re-positioning and de-risking the business • Reducing our exposure to construction-facing markets – significantly de-risks the business and enables a focus on higher margin, growth markets • Close to completing the exit from our mechanical and electrical engineering construction business • Trading l
Slide 6: The shape of our business
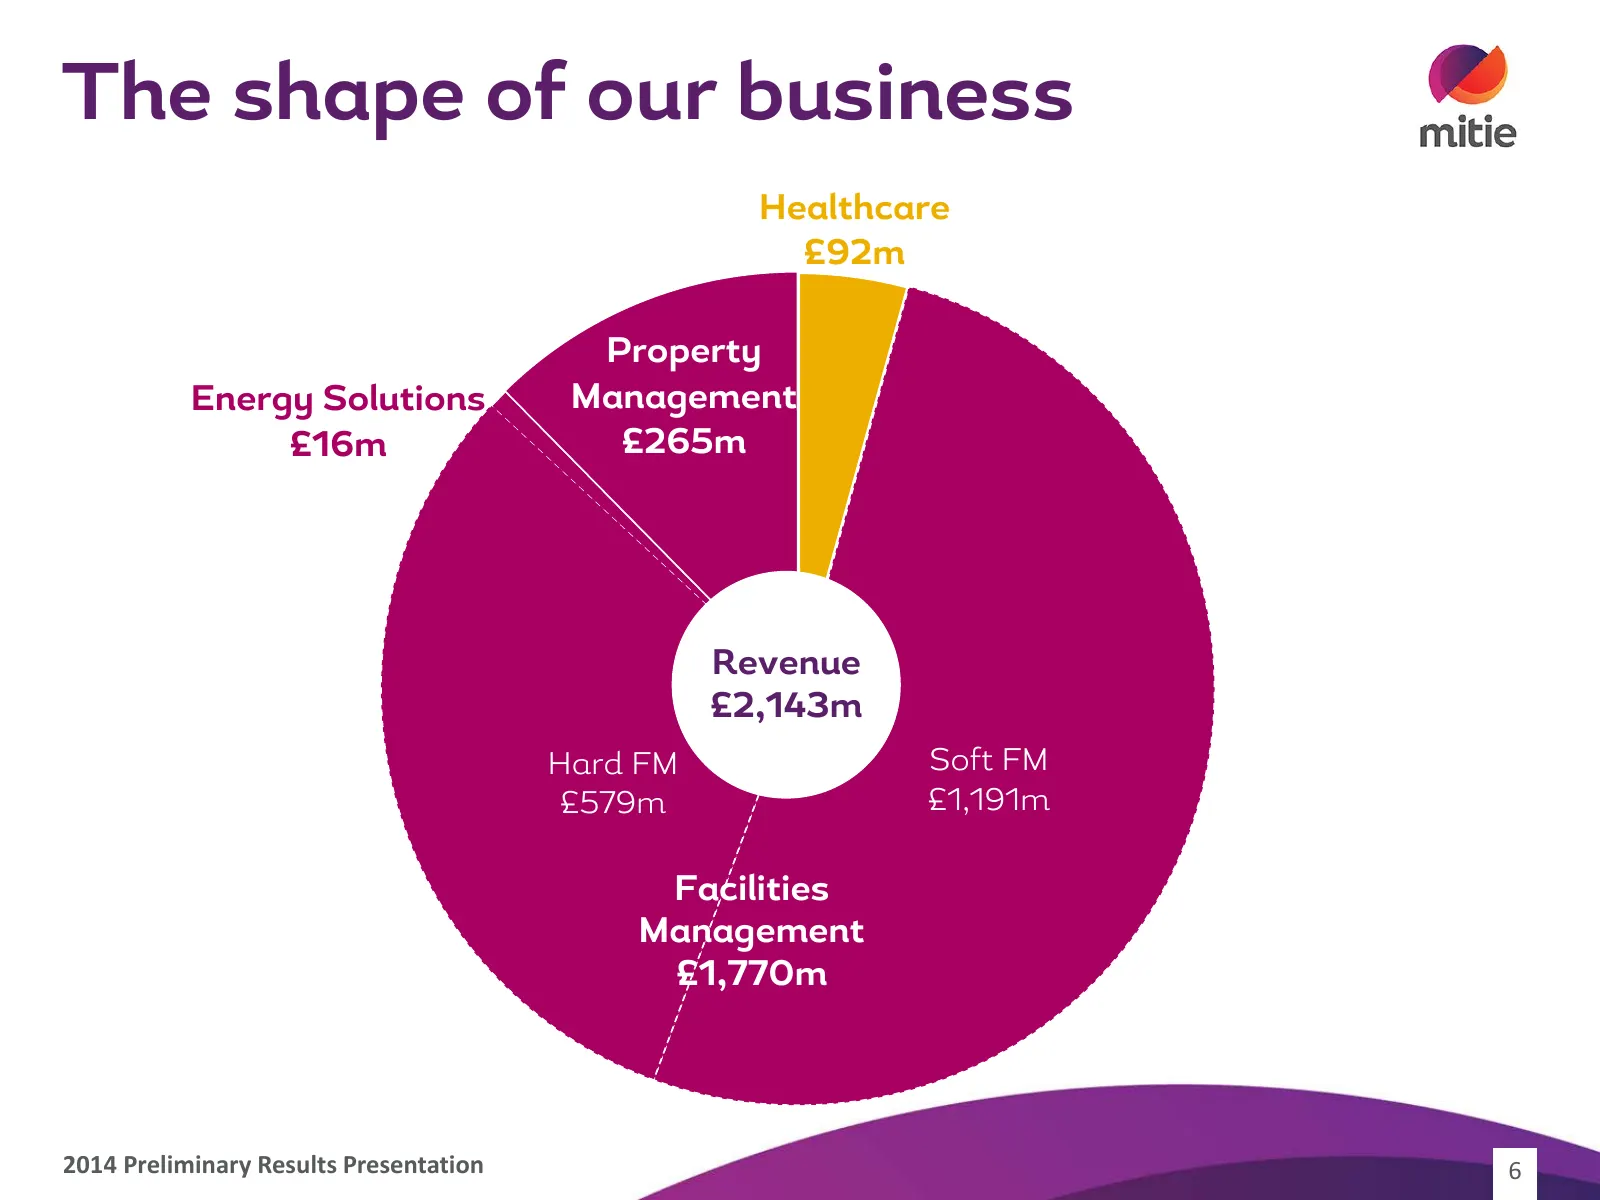
The shape of our business Healthcare £92m Property Energy Solutions Management £16m £265m Revenue £2,143m Hard FM Soft FM £579m £1,191m Facilities Management £1,770m 2014 Preliminary Results Presentation 6
Slide 7: FM revenue breakdown
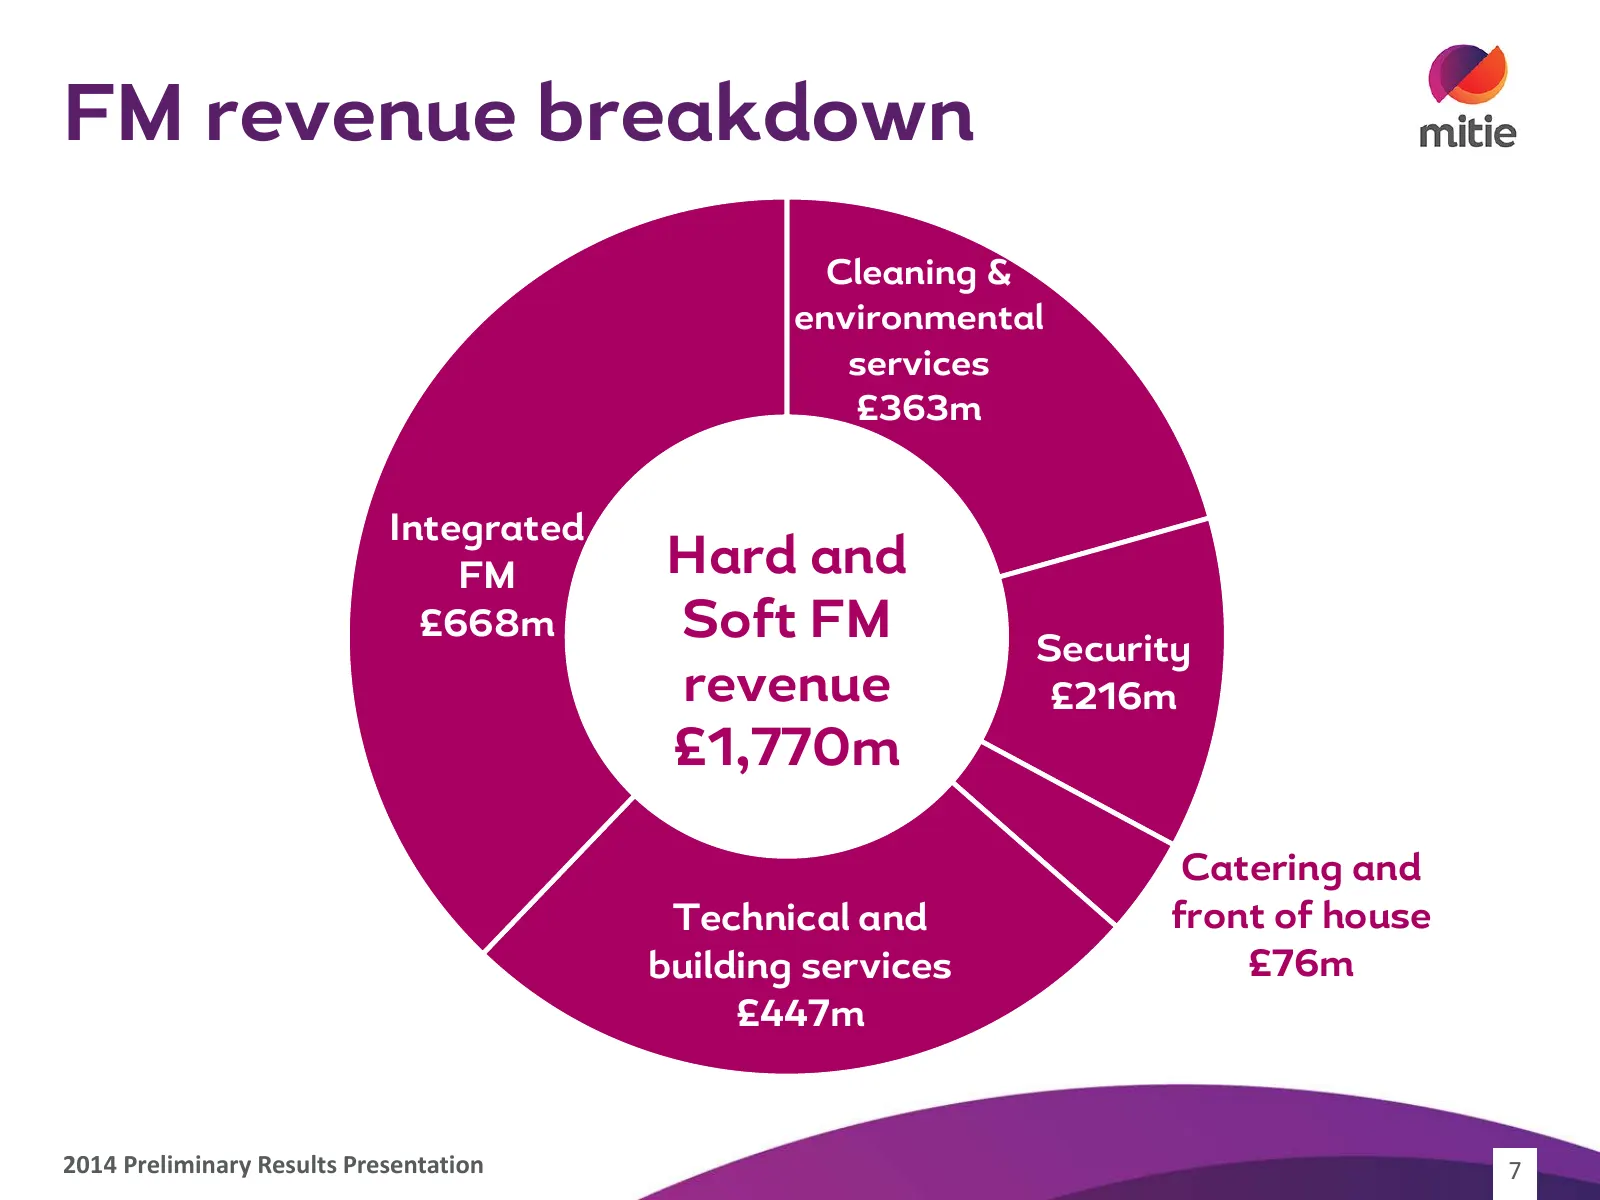
FM revenue breakdown Cleaning & environmental services £363m Integrated FM Hard and £668m Soft FM Security revenue £216m £1,770m Catering and Technical and front of house building services £76m £447m 2014 Preliminary Results Presentation 7
Slide 8: Revenue by sector
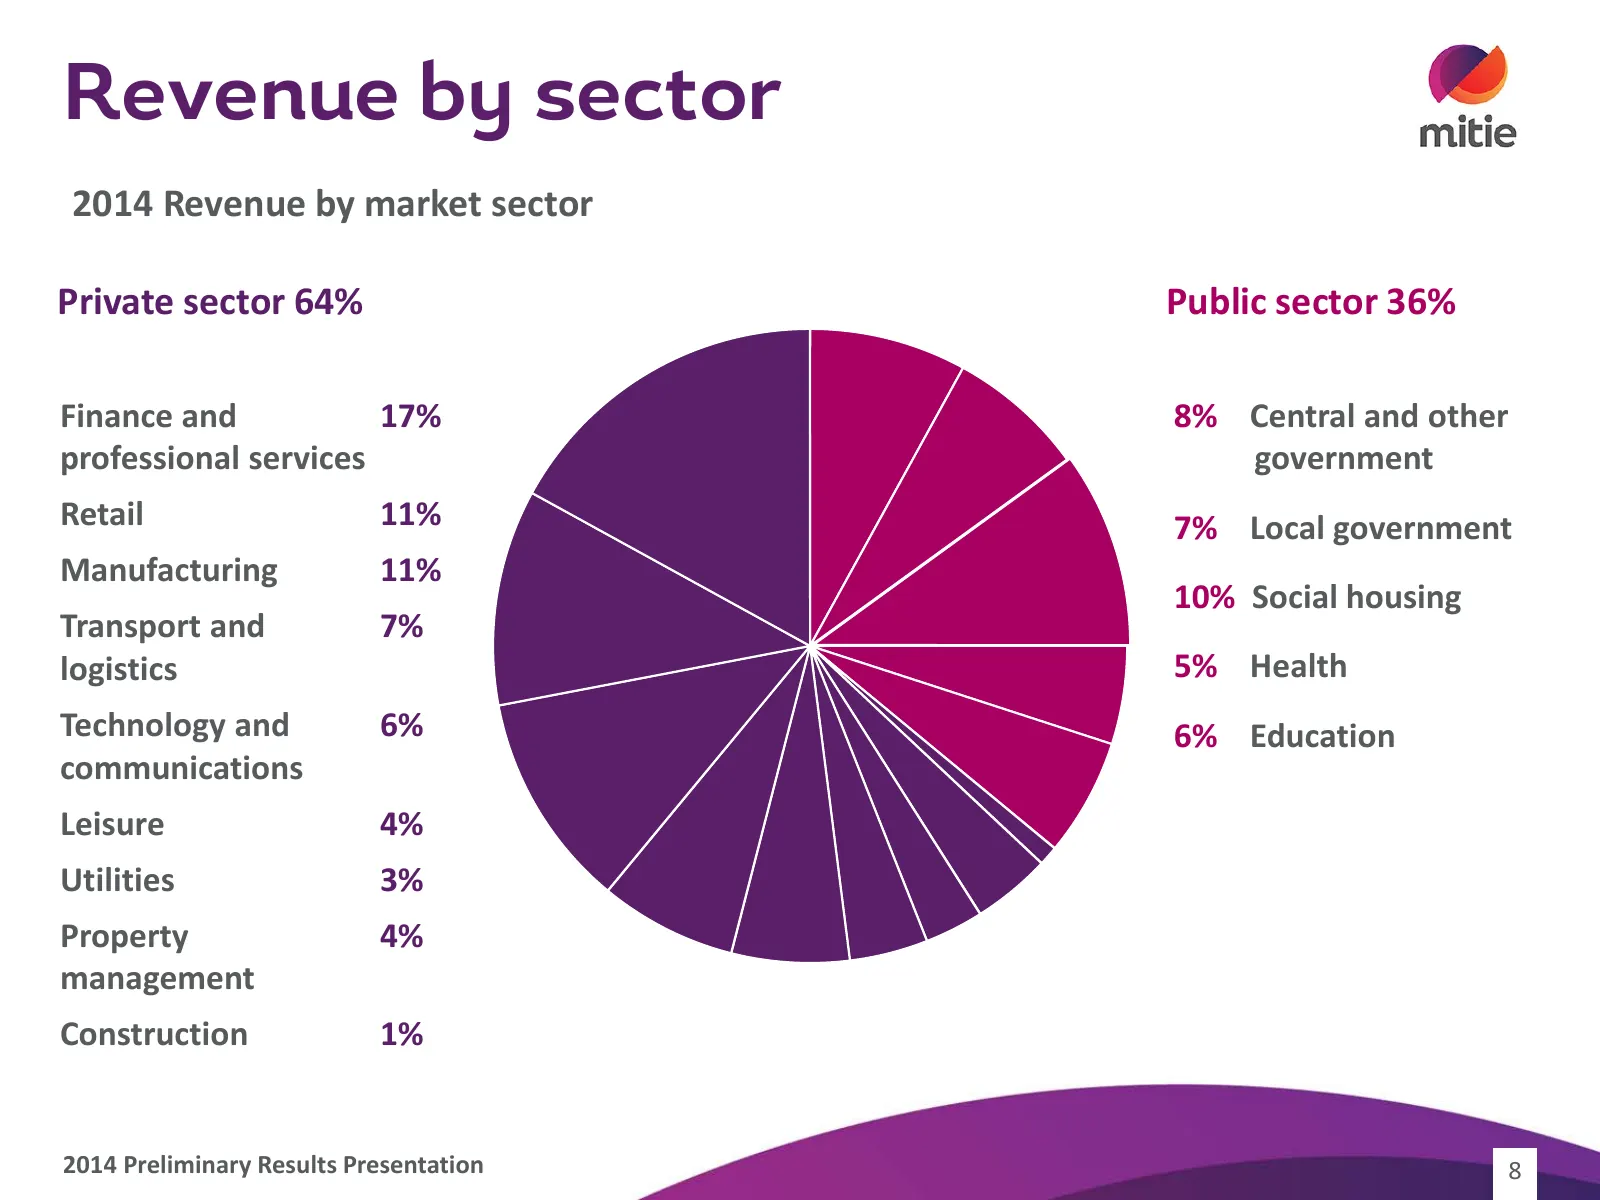
Revenue by sector 2014 Revenue by market sector Private sector 64% Public sector 36% Finance and 17% 8% Central and other professional services government Retail 11% 7% Local government Manufacturing 11% 10% Social housing Transport and 7% logistics 5% Health Technology and 6% 6% Education communica
Slide 9: Buoyant sales pipeline: £8.2bn
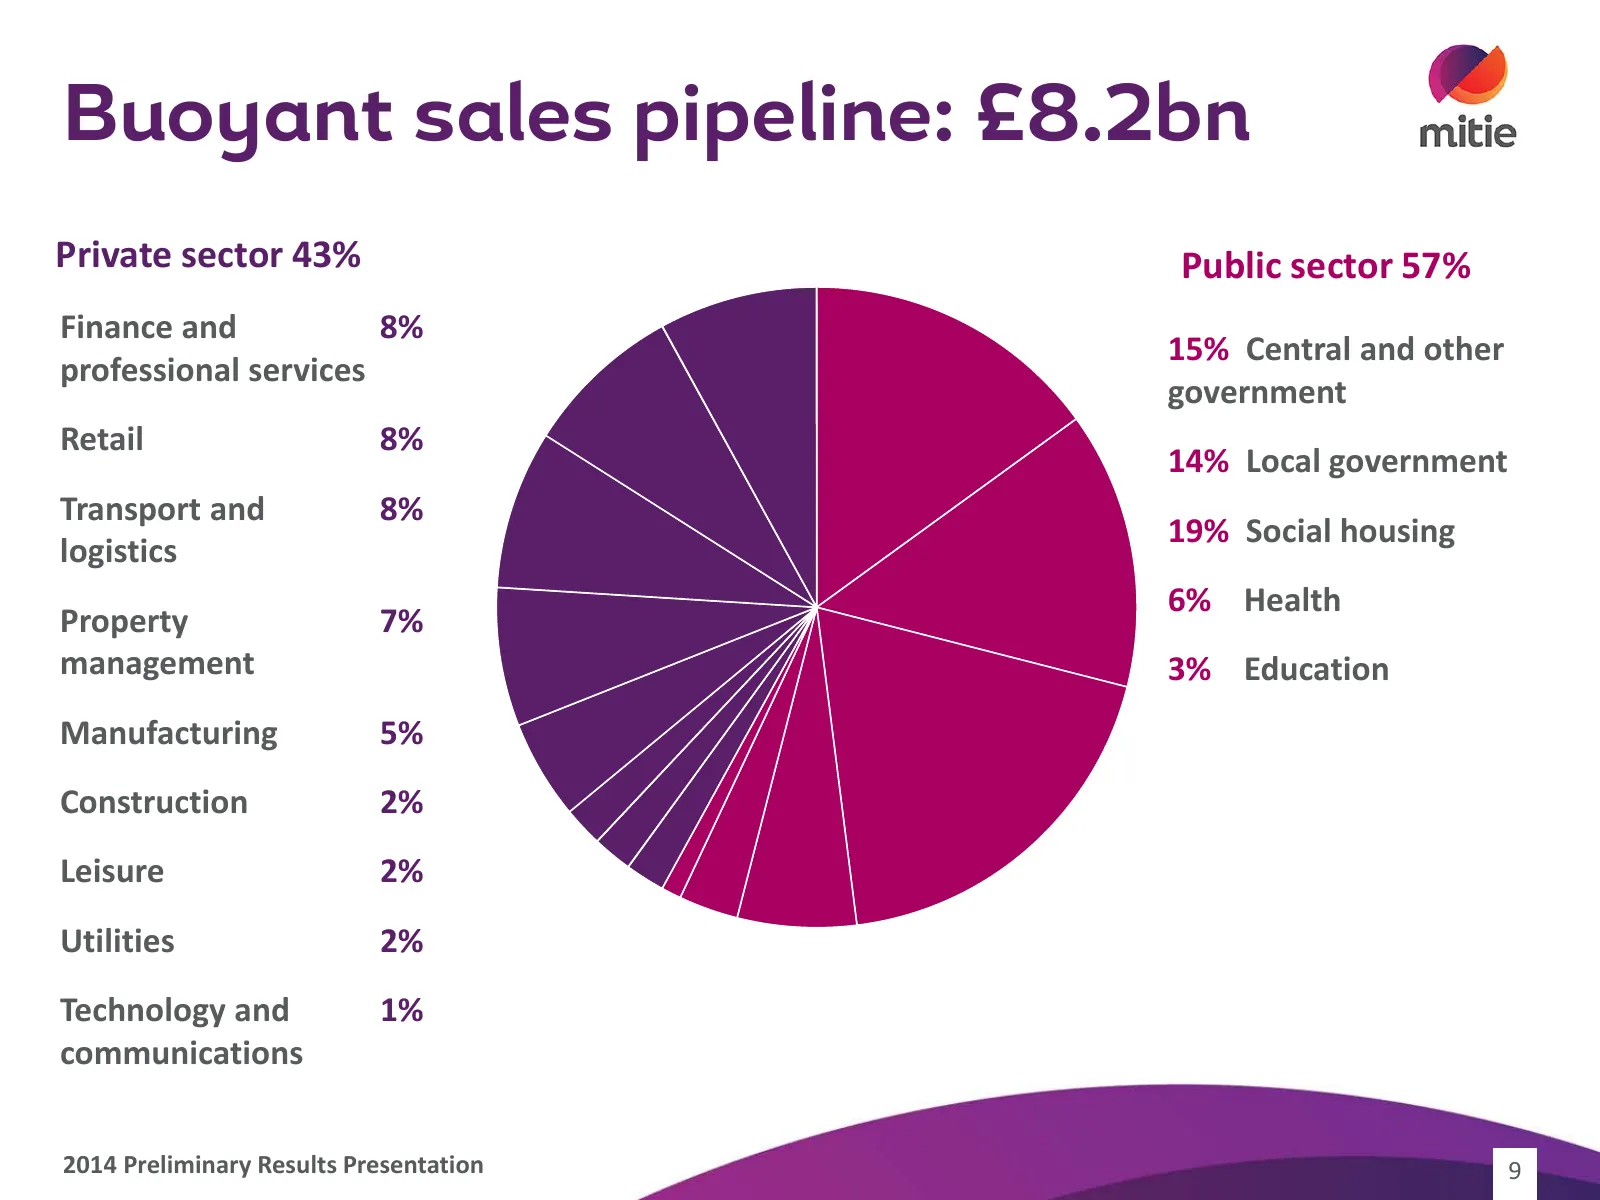
Buoyant sales pipeline: £8.2bn Private sector 43% Public sector 57% Finance and 8% 15% Central and other professional services government Retail 8% 14% Local government Transport and 8% 19% Social housing logistics 6% Health Property 7% management 3% Education Manufacturing 5% Construction 2% Leisur
Slide 10: Our business mix has changed
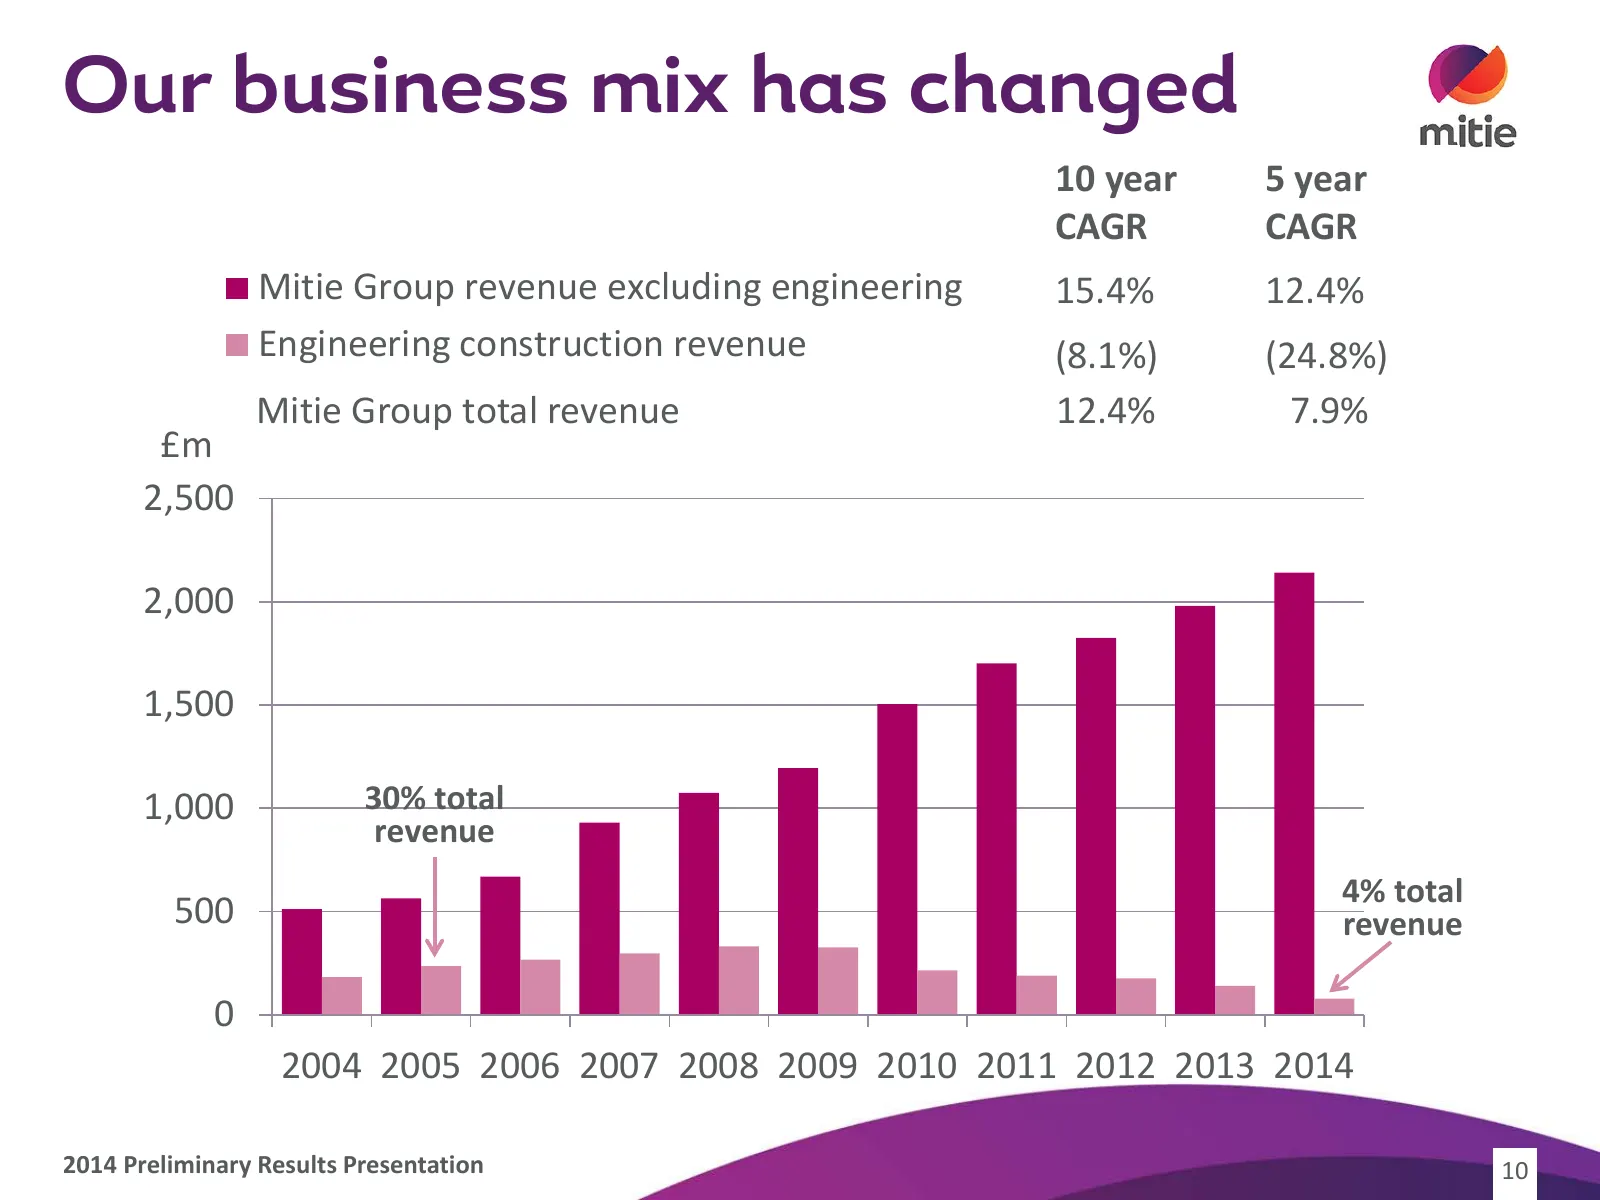
Our business mix has changed 10 year 5 year CAGR CAGR Mitie Group revenue excluding engineering 15.4% 12.4% Engineering construction revenue (8.1%) (24.8%) Mitie Group total revenue 12.4% 7.9% £m 2,500 2,000 1,500 1,000 30% total revenue 4% total 500 revenue 0 2004 2005 2006 2007 2008 2009 2010 2011
Slide 11: A focus on higher margin growth markets
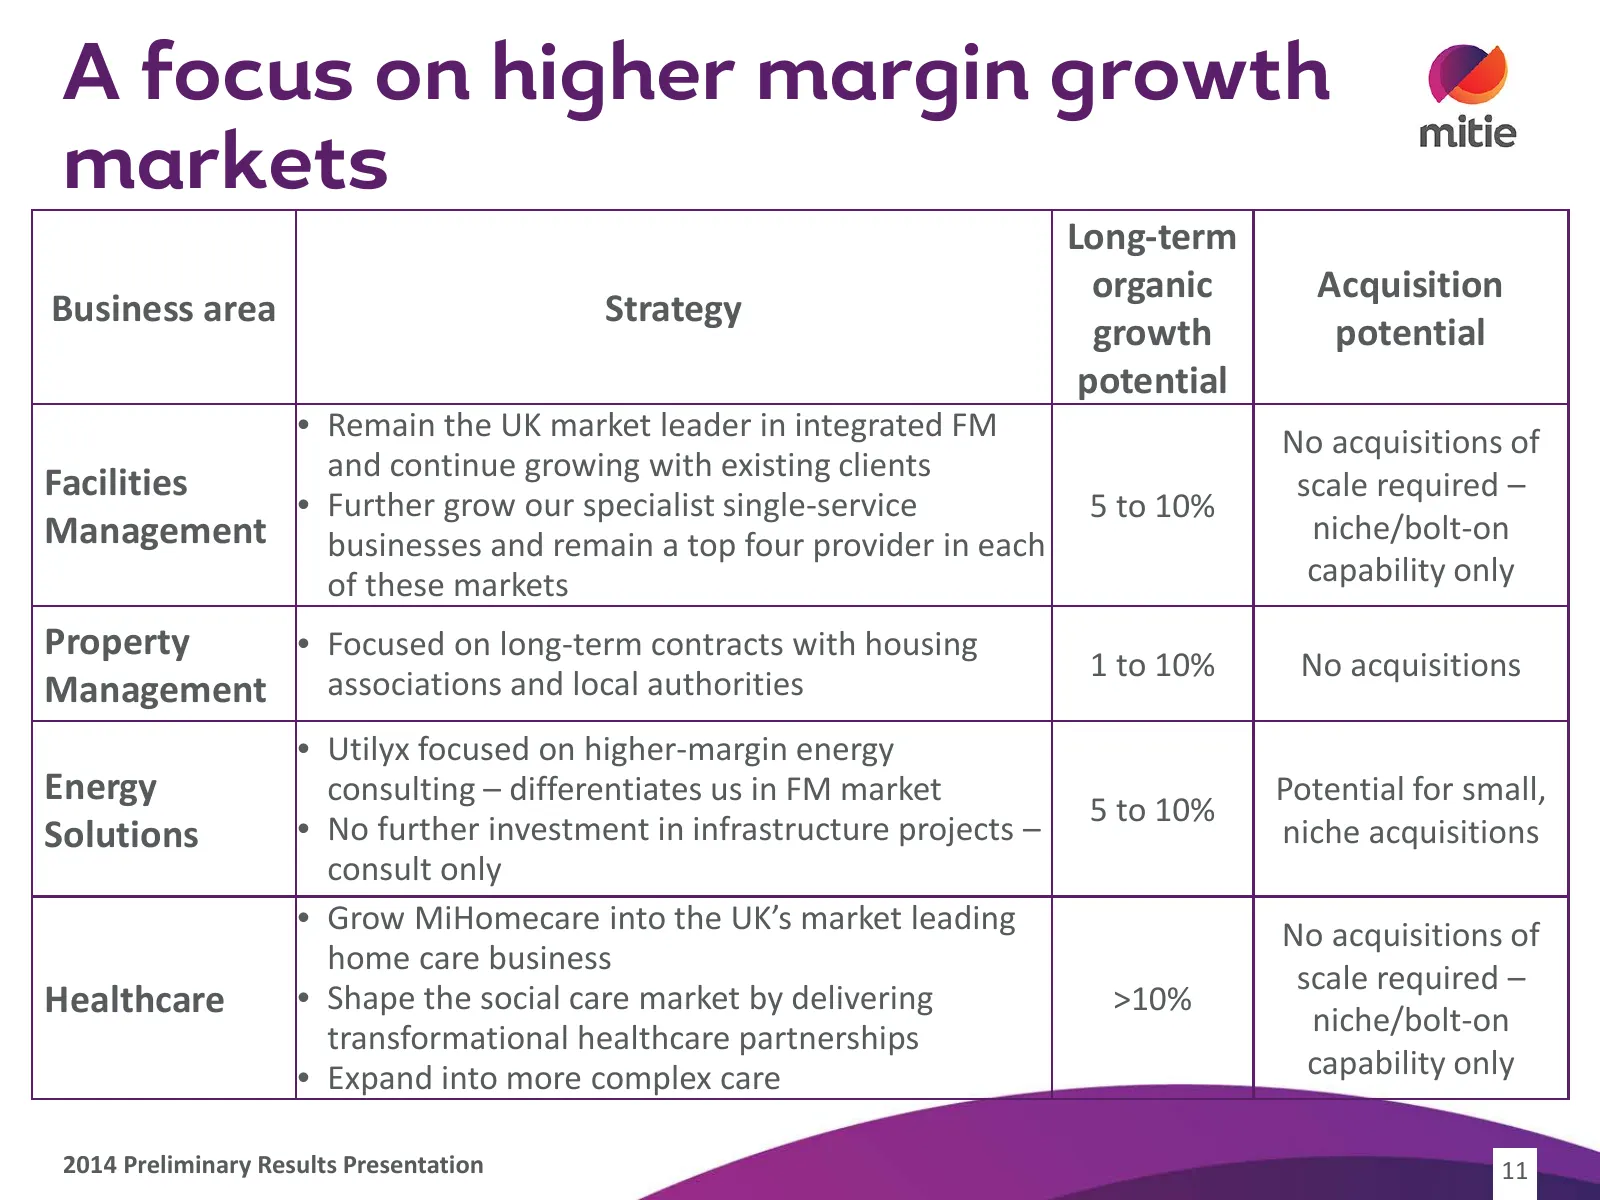
A focus on higher margin growth markets Long-term organic Acquisition Business area Strategy growth potential potential • Remain the UK market leader in integrated FM No acquisitions of and continue growing with existing clients Facilities scale required – • Further grow our specialist single-servic
Slide 12: Excellent revenue visibility
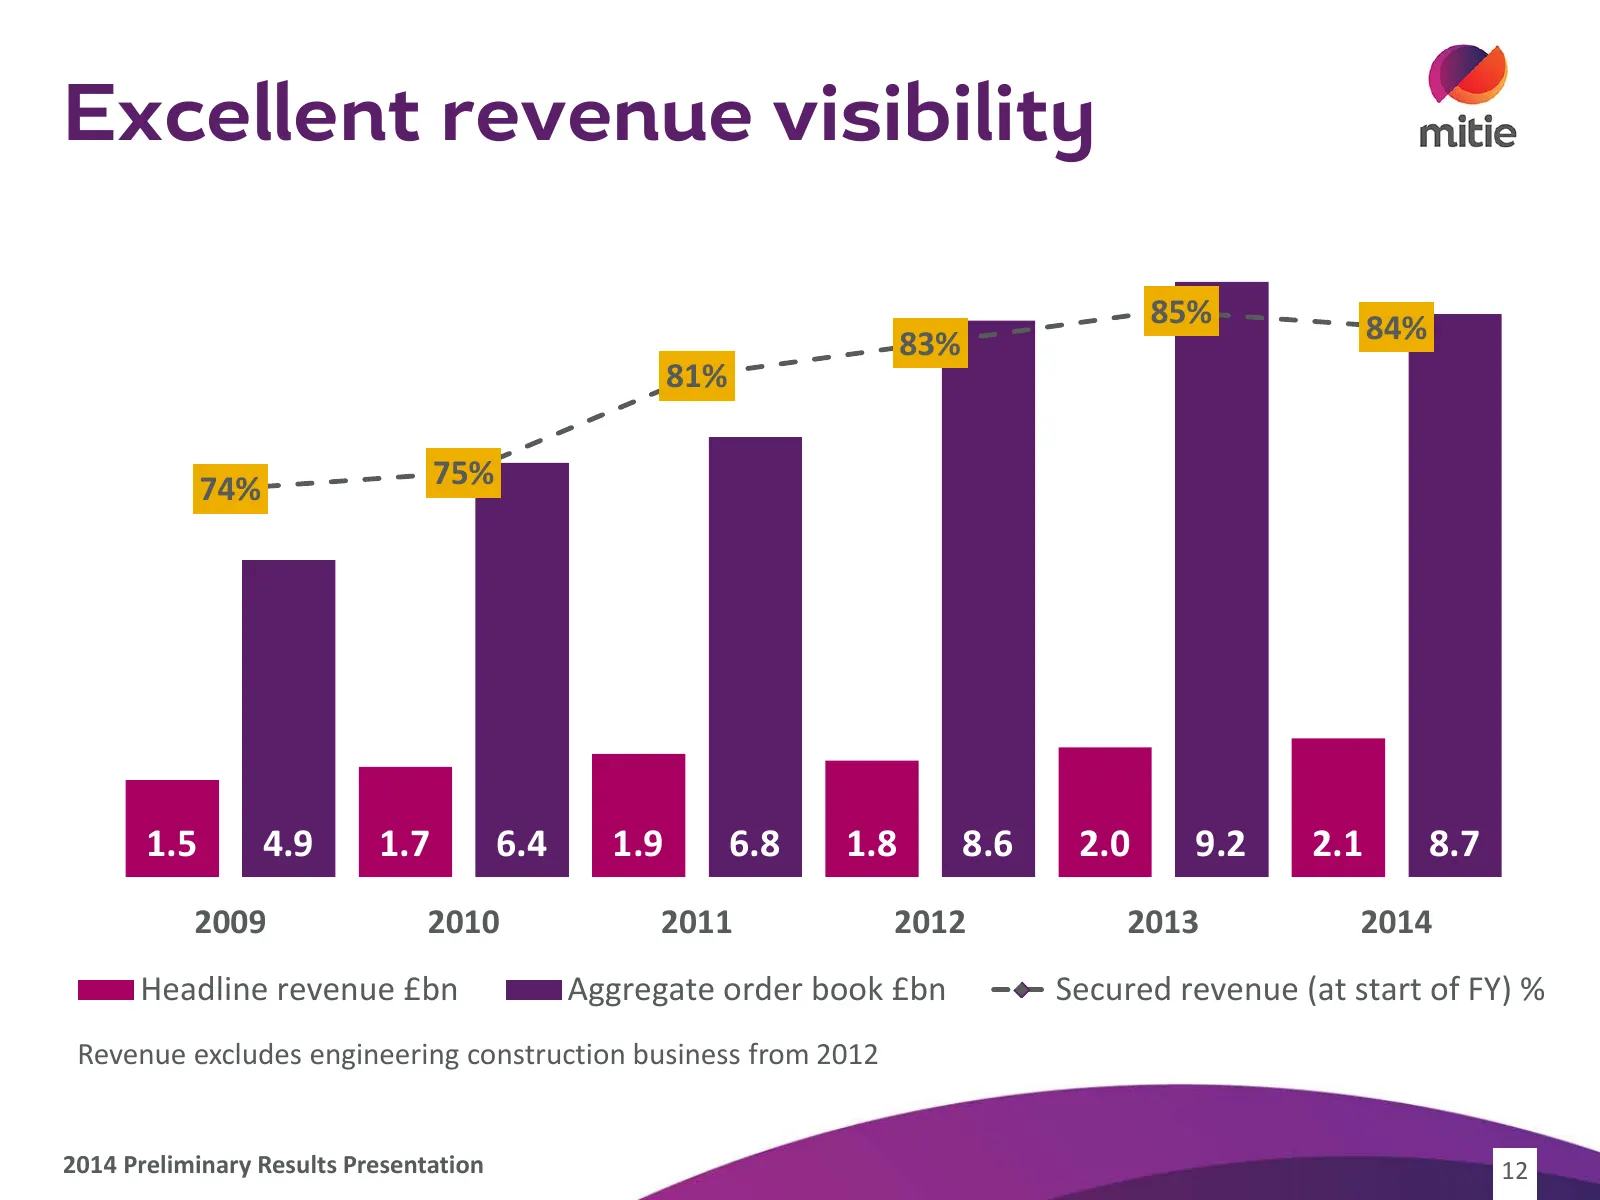
Excellent revenue visibility 10.0 90% 9.5 9.0 8.5 85% 84% 85% 8.0 83% 7.5 81% 80% 7.0 6.5 6.0 74% 75% 75% 5.5 5.0 70% 4.5 4.0 65% 3.5 3.0 2.5 60% 2.0 1.5 55% 1.0 0.5 1.5 4.9 1.7 6.4 1.9 6.8 1.8 8.6 2.0 9.2 2.1 8.7 - 50% 2009 2010 2011 2012 2013 2014 Headline revenue £bn Aggregate order book £bn Secu
Slide 13: Consistently strong organic growth in FM
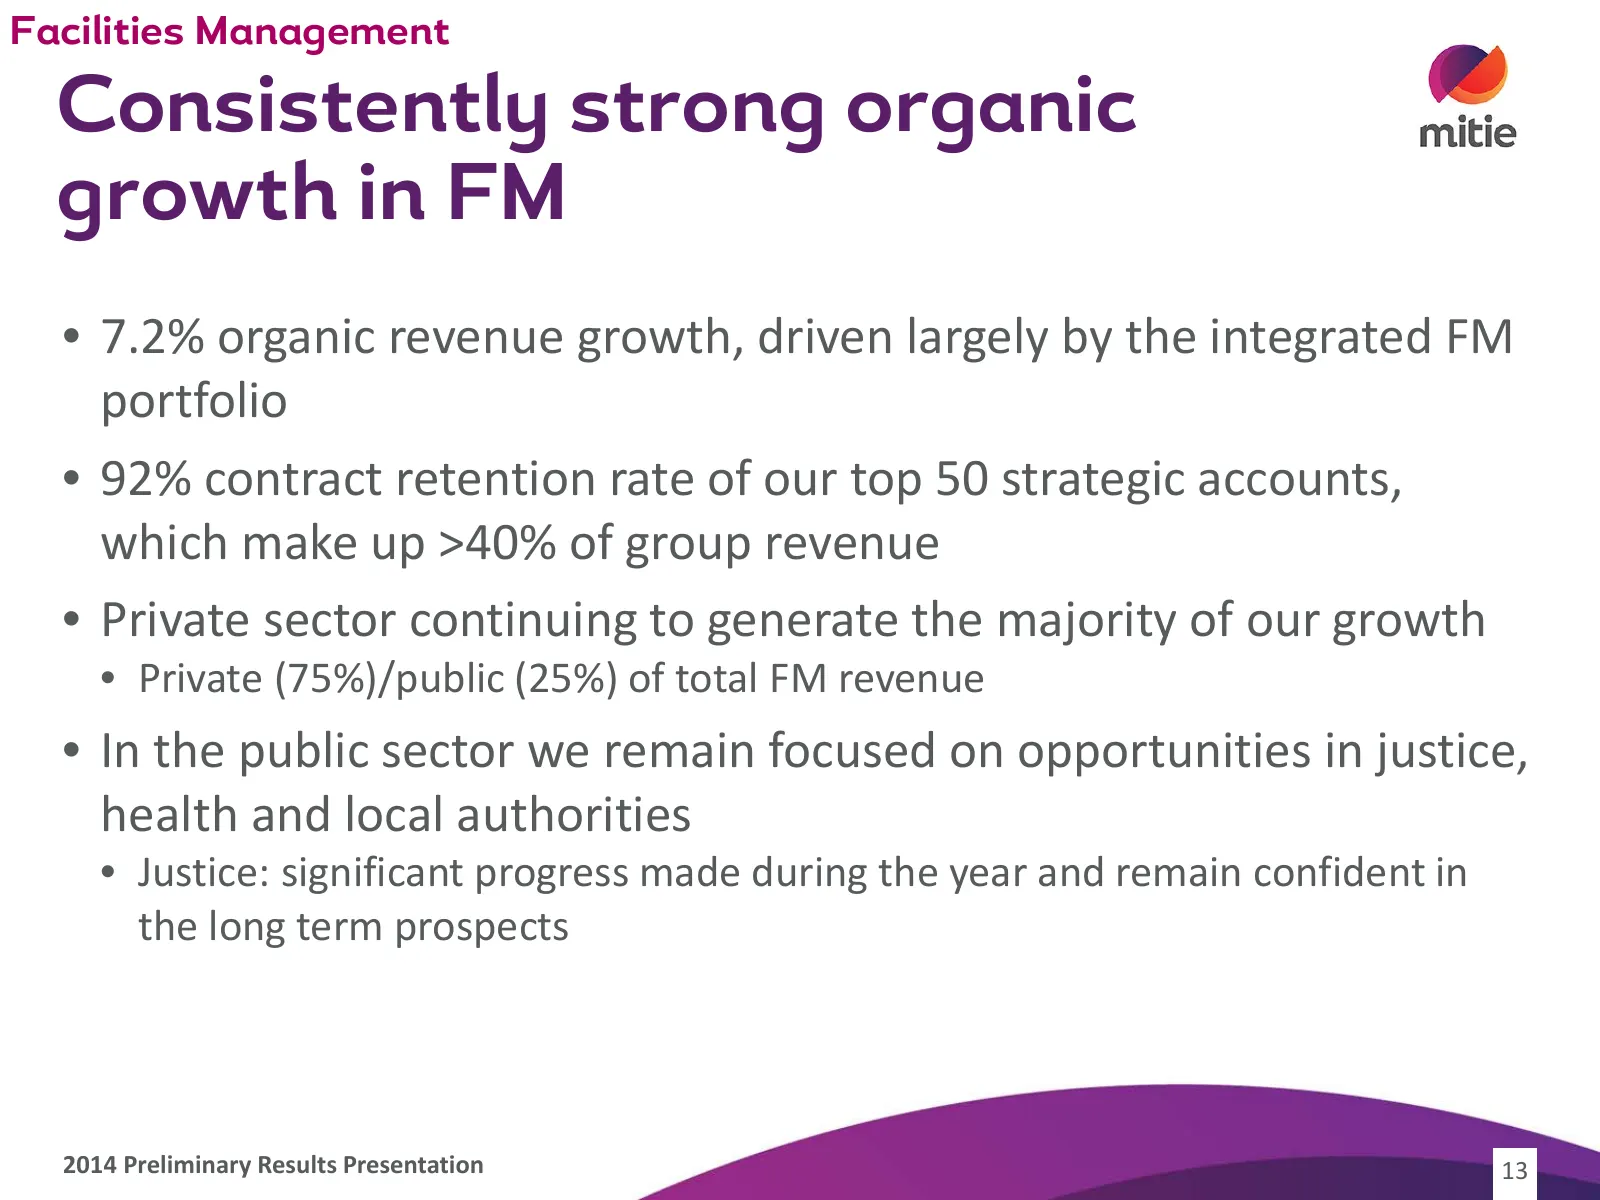
Facilities Management Consistently strong organic growth in FM • 7.2% organic revenue growth, driven largely by the integrated FM portfolio • 92% contract retention rate of our top 50 strategic accounts, which make up >40% of group revenue • Private sector continuing to generate the majority of our
Slide 14: Leading market position
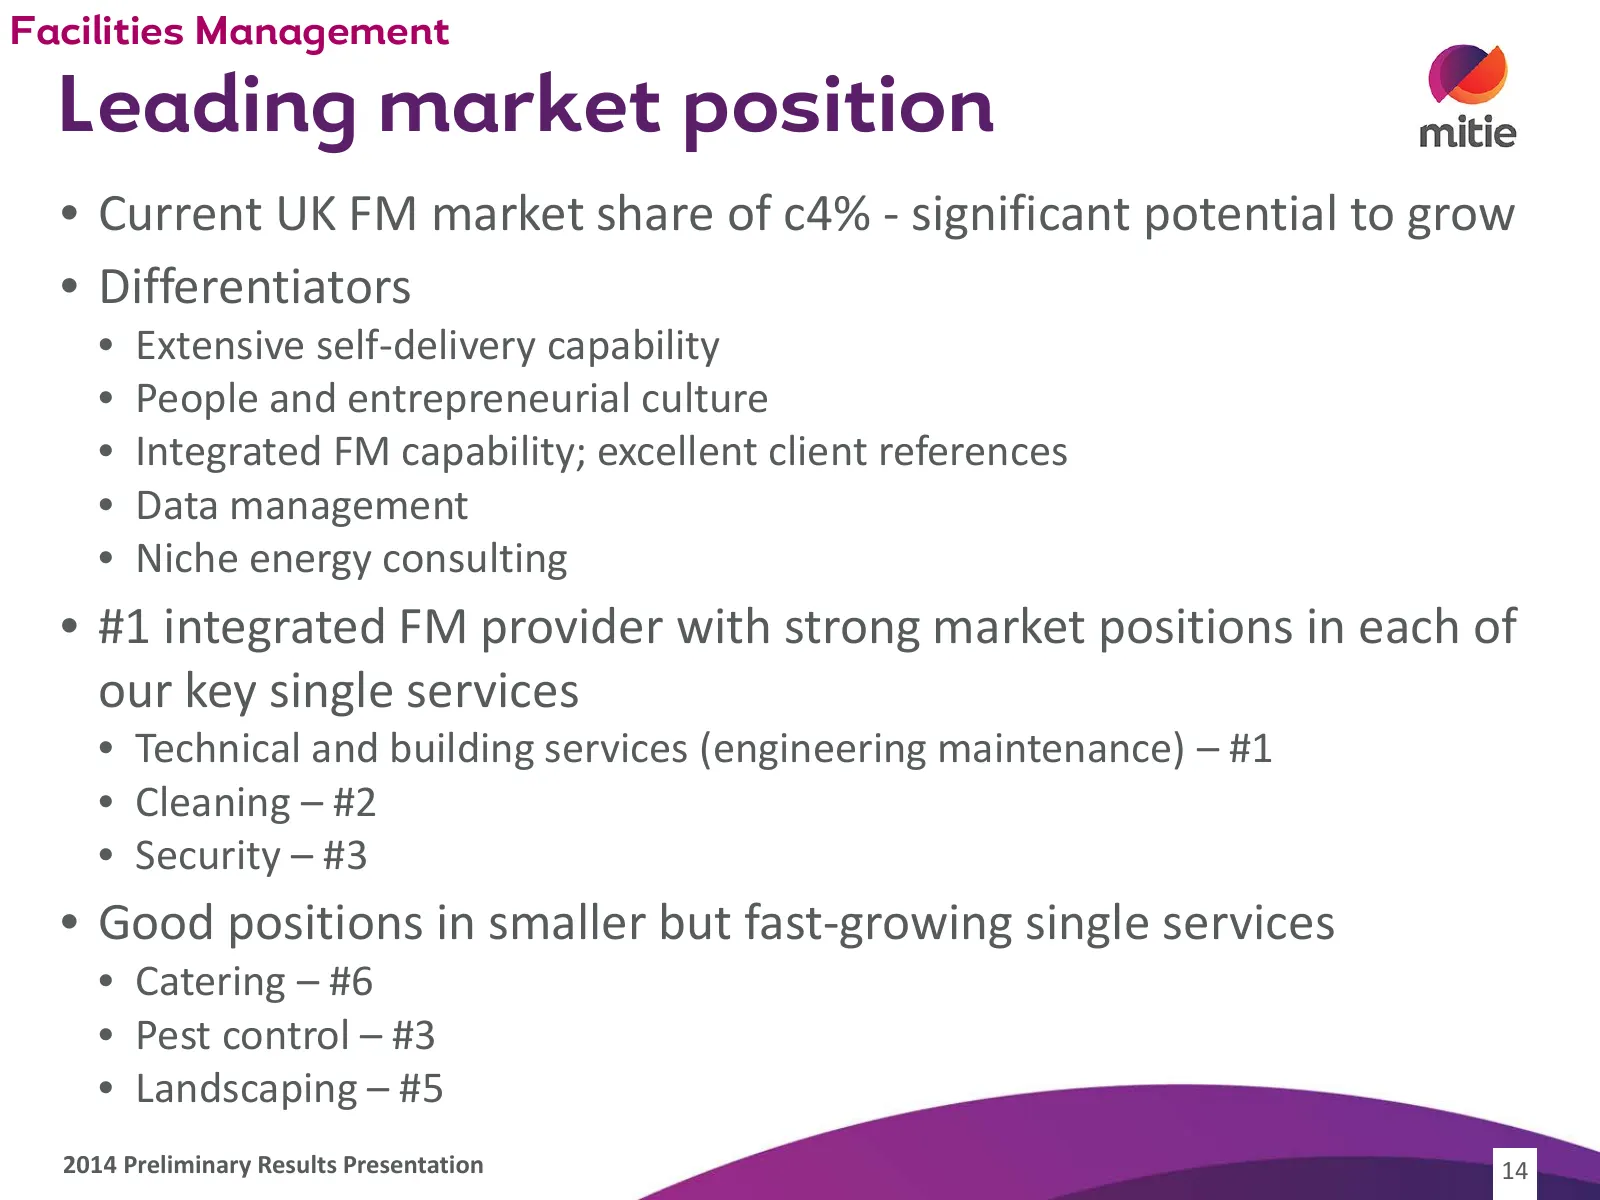
Facilities Management Leading market position • Current UK FM market share of c4% - significant potential to grow • Differentiators • Extensive self-delivery capability • People and entrepreneurial culture • Integrated FM capability; excellent client references • Data management • Niche energy consu
Slide 15: High quality client portfolio
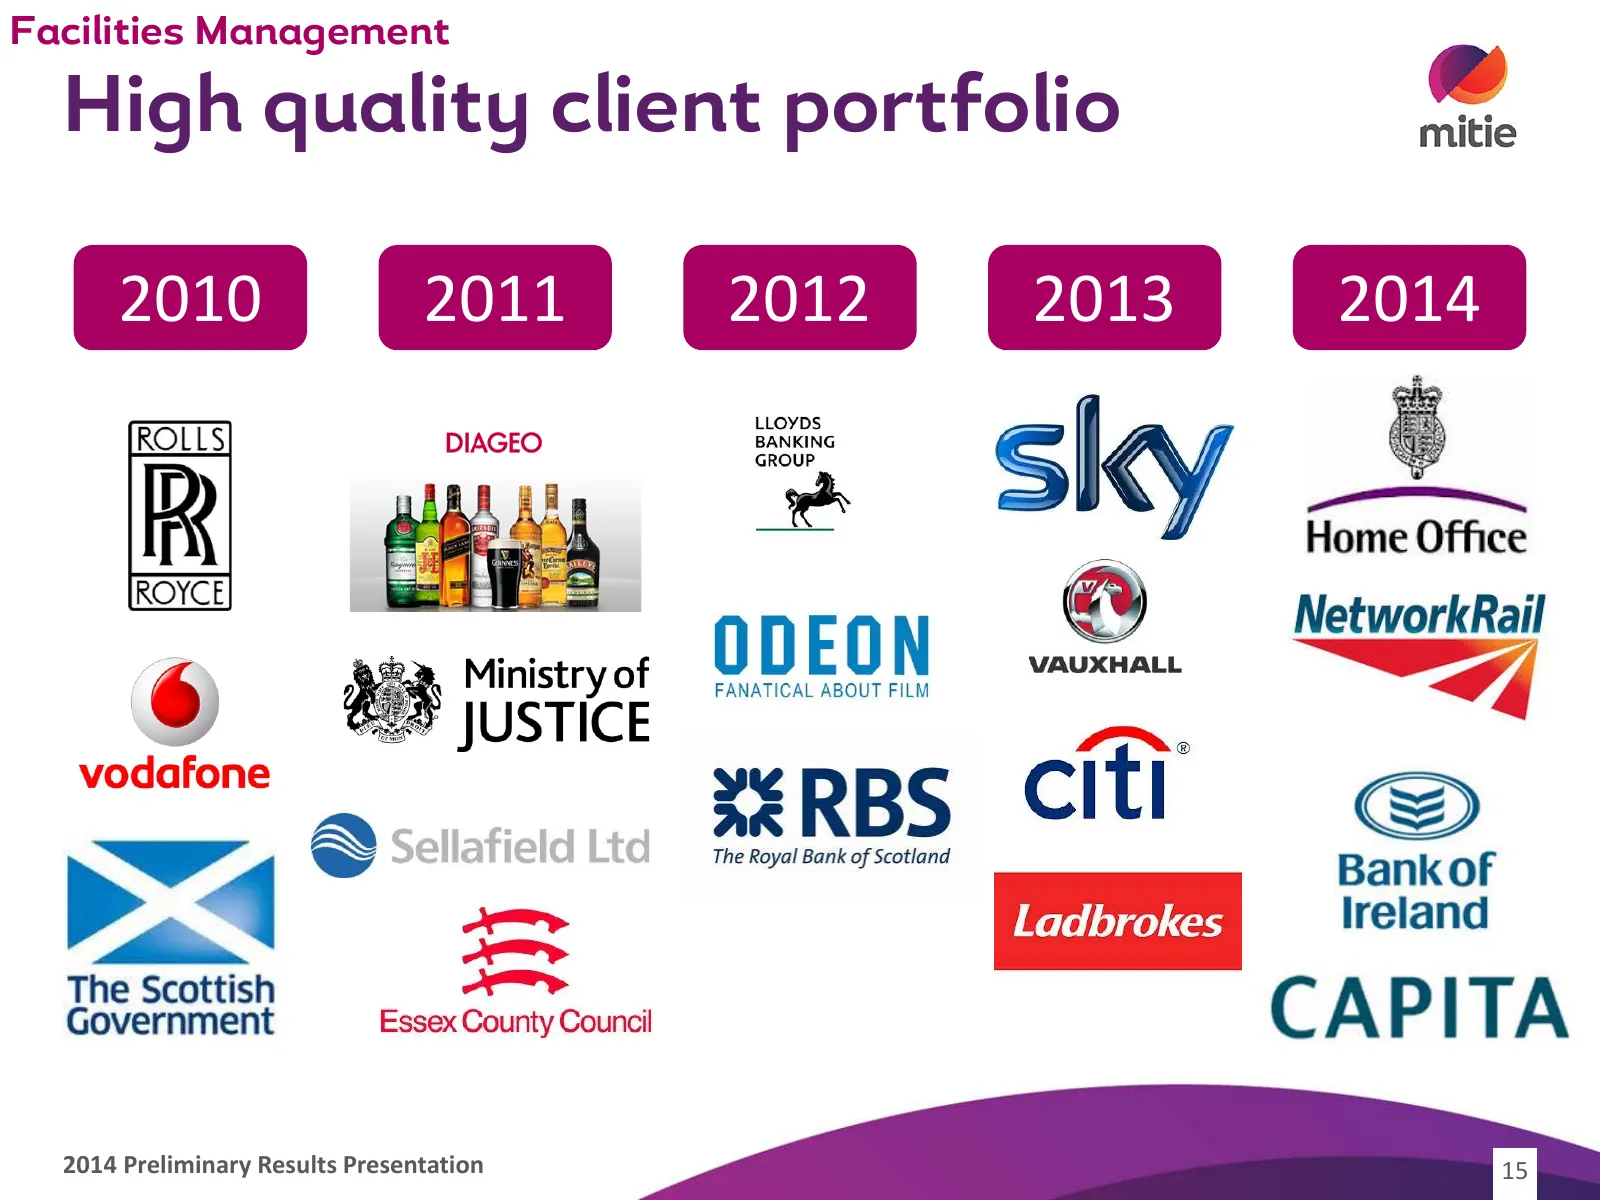
Facilities Management High quality client portfolio 2010 2011 2012 2013 2014 2014 Preliminary Results Presentation 15
Slide 16: Integrated FM drives growth
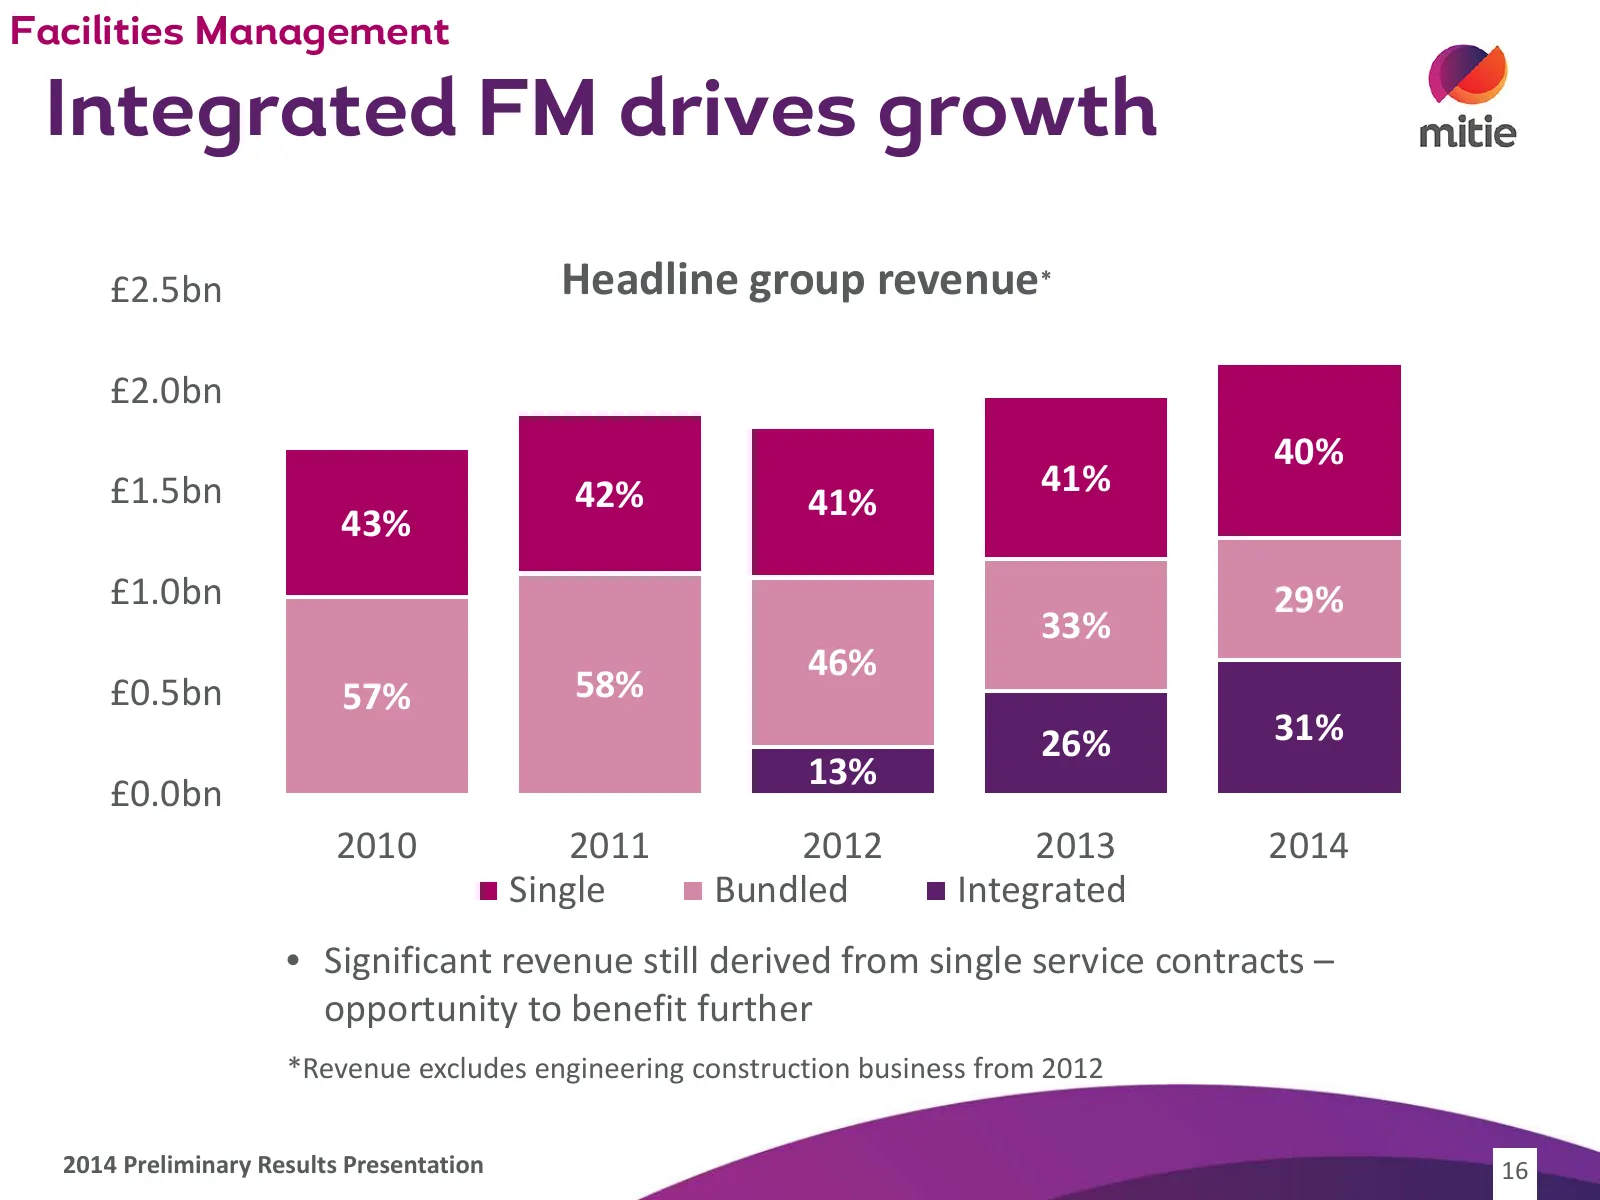
Facilities Management Integrated FM drives growth £2.5bn Headline group revenue* £2.0bn 40% £1.5bn 42% 41% 41% 43% £1.0bn 29% 33% 46% £0.5bn 57% 58% 26% 31% 13% £0.0bn 2010 2011 2012 2013 2014 Single Bundled Integrated • Significant revenue still derived from single service contracts – opportunity t
Slide 17: Steady flow of contract awards across the private sector
Facilities Management Steady flow of contract awards across the private sector • Successfully re-secured several key integrated FM contracts • Network Rail – £75m+ over five years • Capita – £110m over five years • Awarded a number of significant new contracts across a range of sectors • Bank of Ire
Slide 18: Public sector remains attractive long-term growth market
Facilities Management Public sector remains attractive long-term growth market • Focused on Justice, Local Authorities and Health • Key successes during the year include: • The Home Office – new contract to manage and maintain two immigration centres, valued at £180m over eight years (potential thre
Slide 19: Investing for capability
Facilities Management Investing for capability • Acquired UK CRBs on 14 August 2013 • One of the largest providers of online criminal records checking service in the UK – conducts over 50,000 checks per annum • Provides a scalable platform to compete in the growing screening and vetting market 2014
Slide 20: Significant potential to drive further organic growth
Facilities Management Significant potential to drive further organic growth • Prime focus is on core FM business • Opportunities to generate strong growth from existing client base • Further develop market leading capabilities, focus on: • Outstanding customer service • Sector specialisms and cross-
Slide 21: Utilyx consulting capability an important niche
Energy Solutions Utilyx consulting capability an important niche • Focused on consulting contracts with a large independent client base as well as supporting our larger FM clients with their energy strategies • Energy spend an increasing share of our clients’ overall property spend, particularly in
Slide 22: Organic growth improvement in Property Management
Property Management Organic growth improvement in Property Management • Organic growth of 9.1% • Positive impact from Hammersmith and Fulham – mobilised our £200m contract to deliver painting, repairs and maintenance over ten years • Now operates solely in the domestic housing market delivering a wi
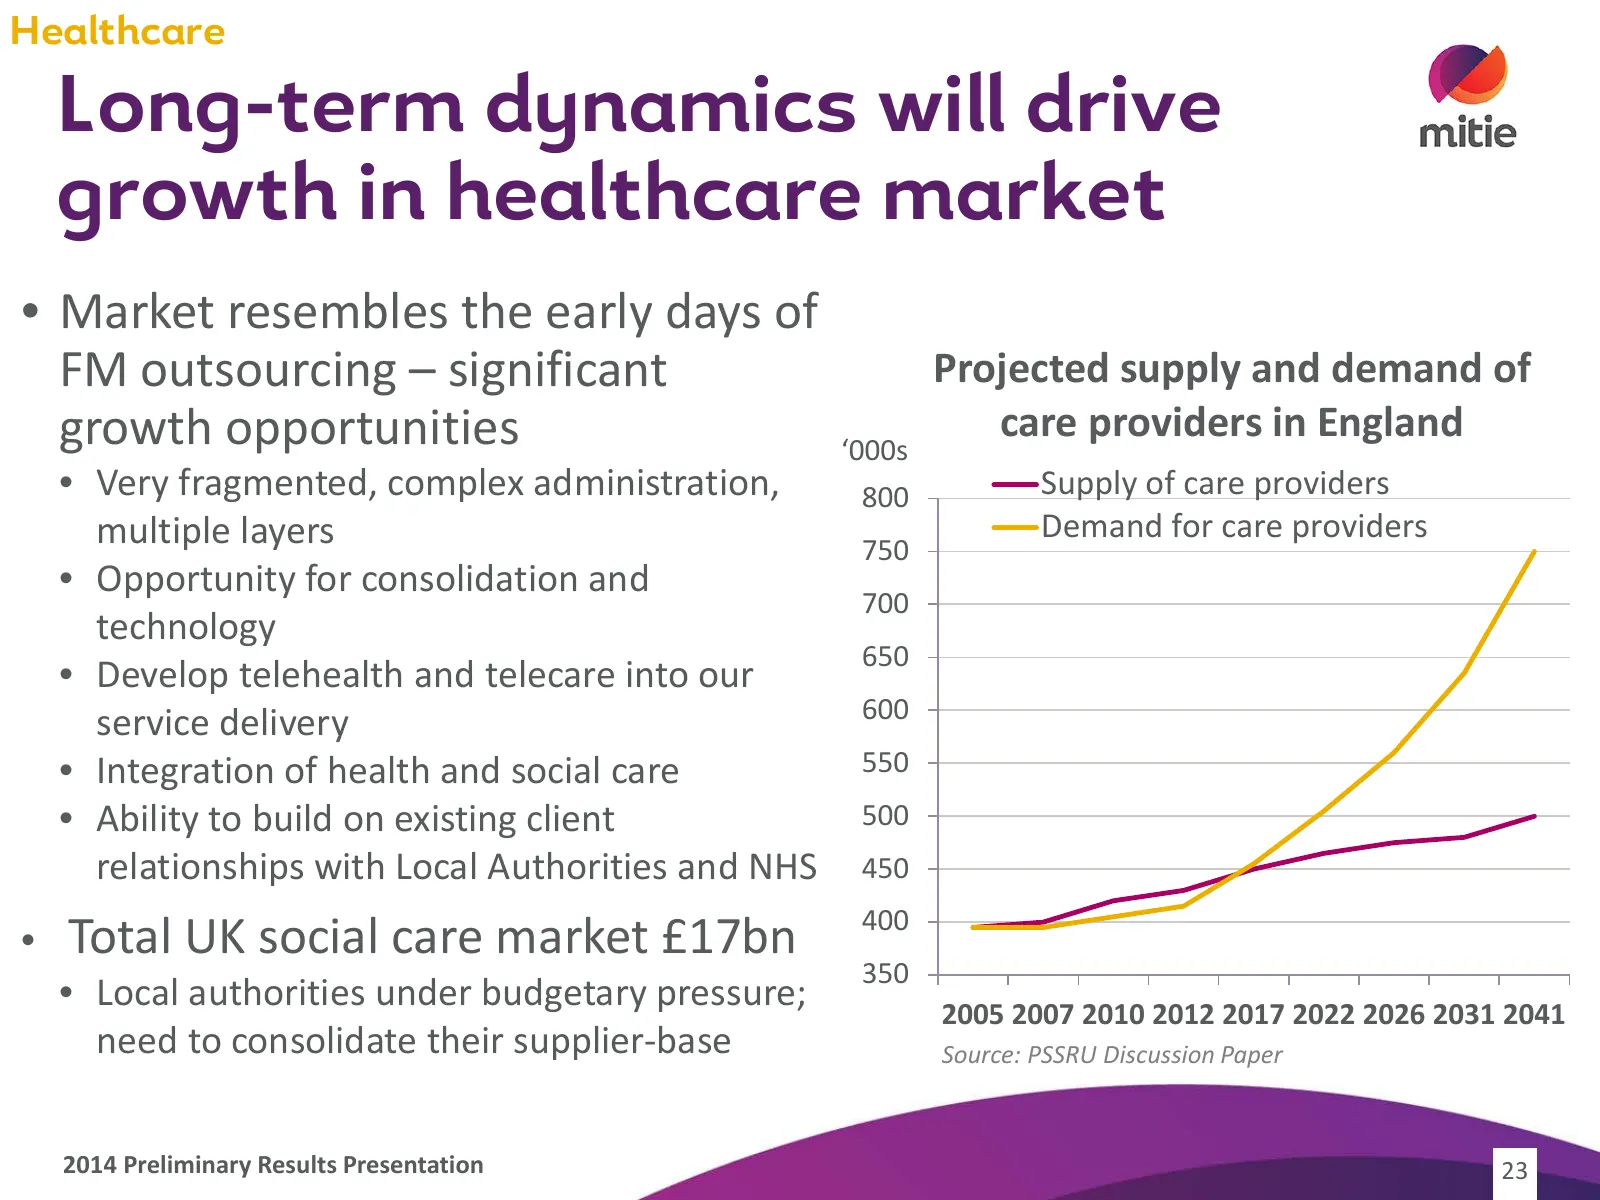
Slide 23: Long-term dynamics will drive growth in healthcare market
Healthcare Long-term dynamics will drive growth in healthcare market • Market resembles the early days of FM outsourcing – significant Projected supply and demand of growth opportunities ‘000s care providers in England • Very fragmented, complex administration, 800 Supply of care providers multiple
Slide 24: MiHomecare positioned for growth
Healthcare MiHomecare positioned for growth • Successful integration of Enara and re-brand to MiHomecare • Margins robust • Selective bidding • Long-term growth positive • Encouraging progress with the award of several significant contracts during the year: • East Sussex County Council - £20m over f
Slide 25: Suzanne Baxter, Group Finance Director
Suzanne Baxter Group Finance Director 25
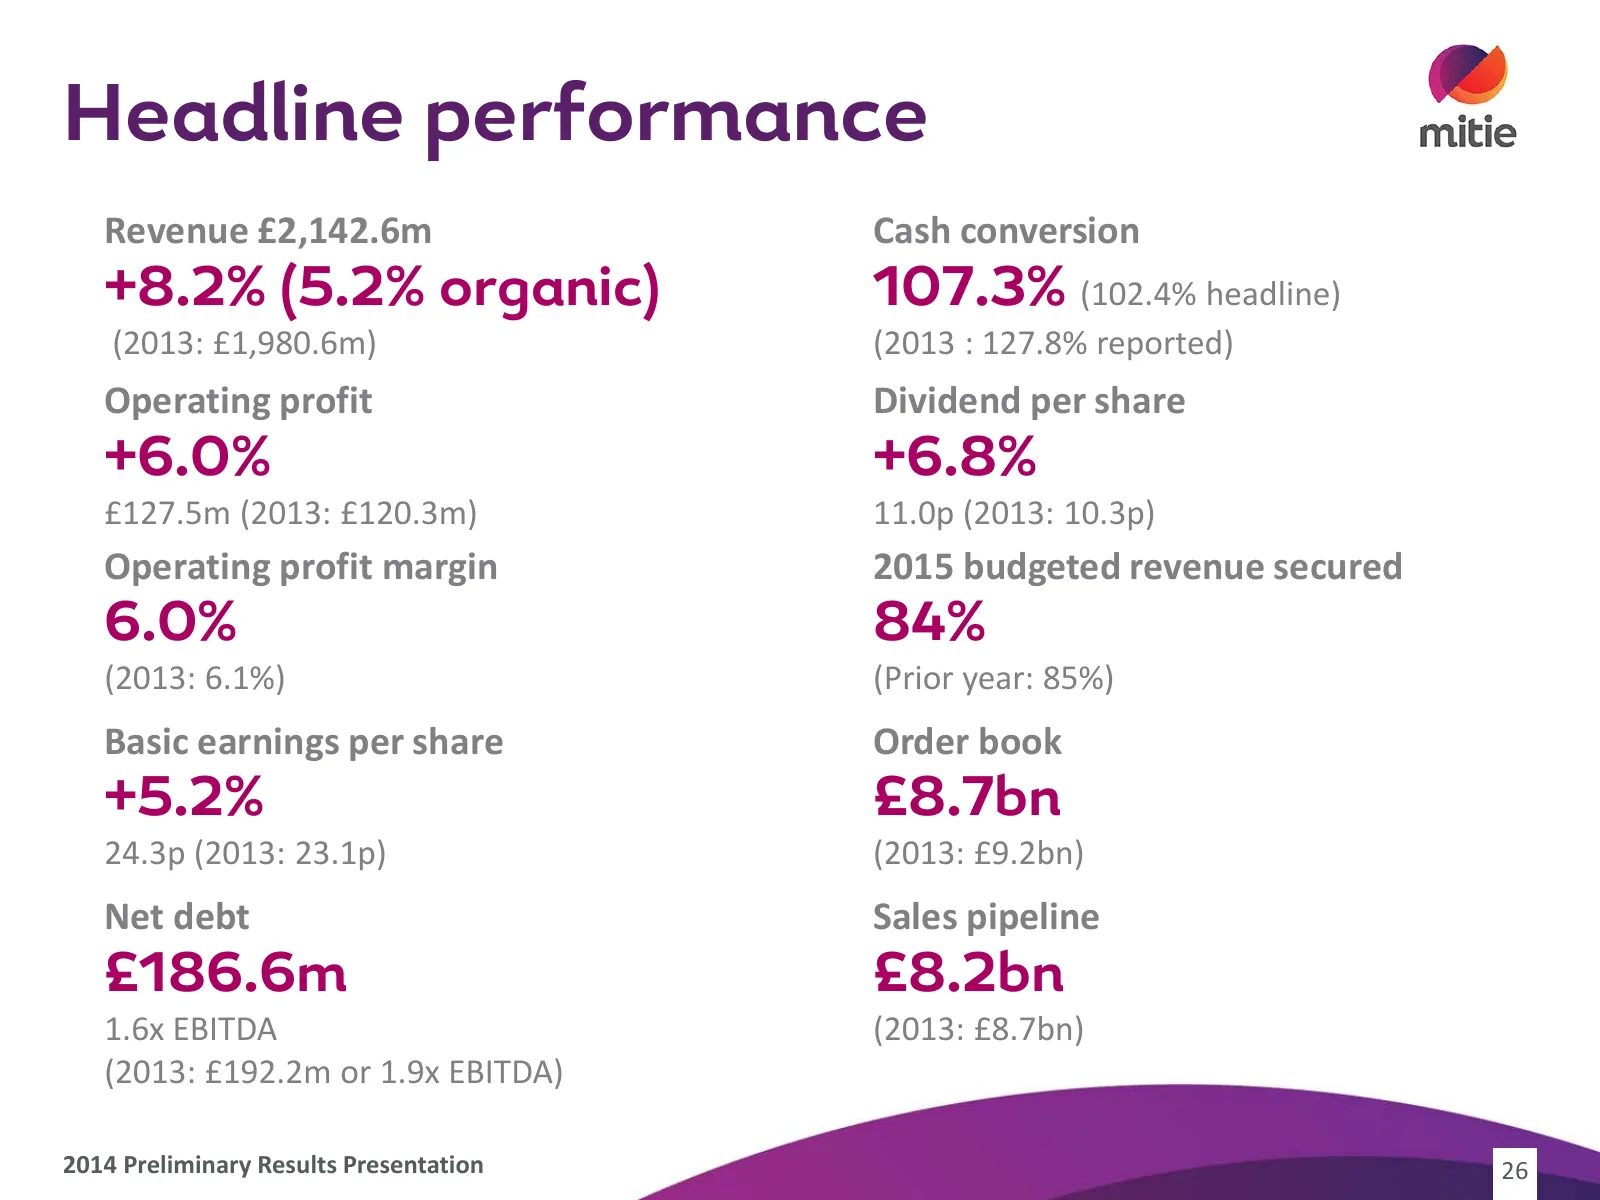
Slide 26: Headline performance
Headline performance Revenue £2,142.6m Cash conversion +8.2% (5.2% organic) 107.3% (102.4% headline) (2013: £1,980.6m) (2013 : 127.8% reported) Operating profit Dividend per share +6.0% +6.8% £127.5m (2013: £120.3m) 11.0p (2013: 10.3p) Operating profit margin 2015 budgeted revenue secured 6.0% 84% (
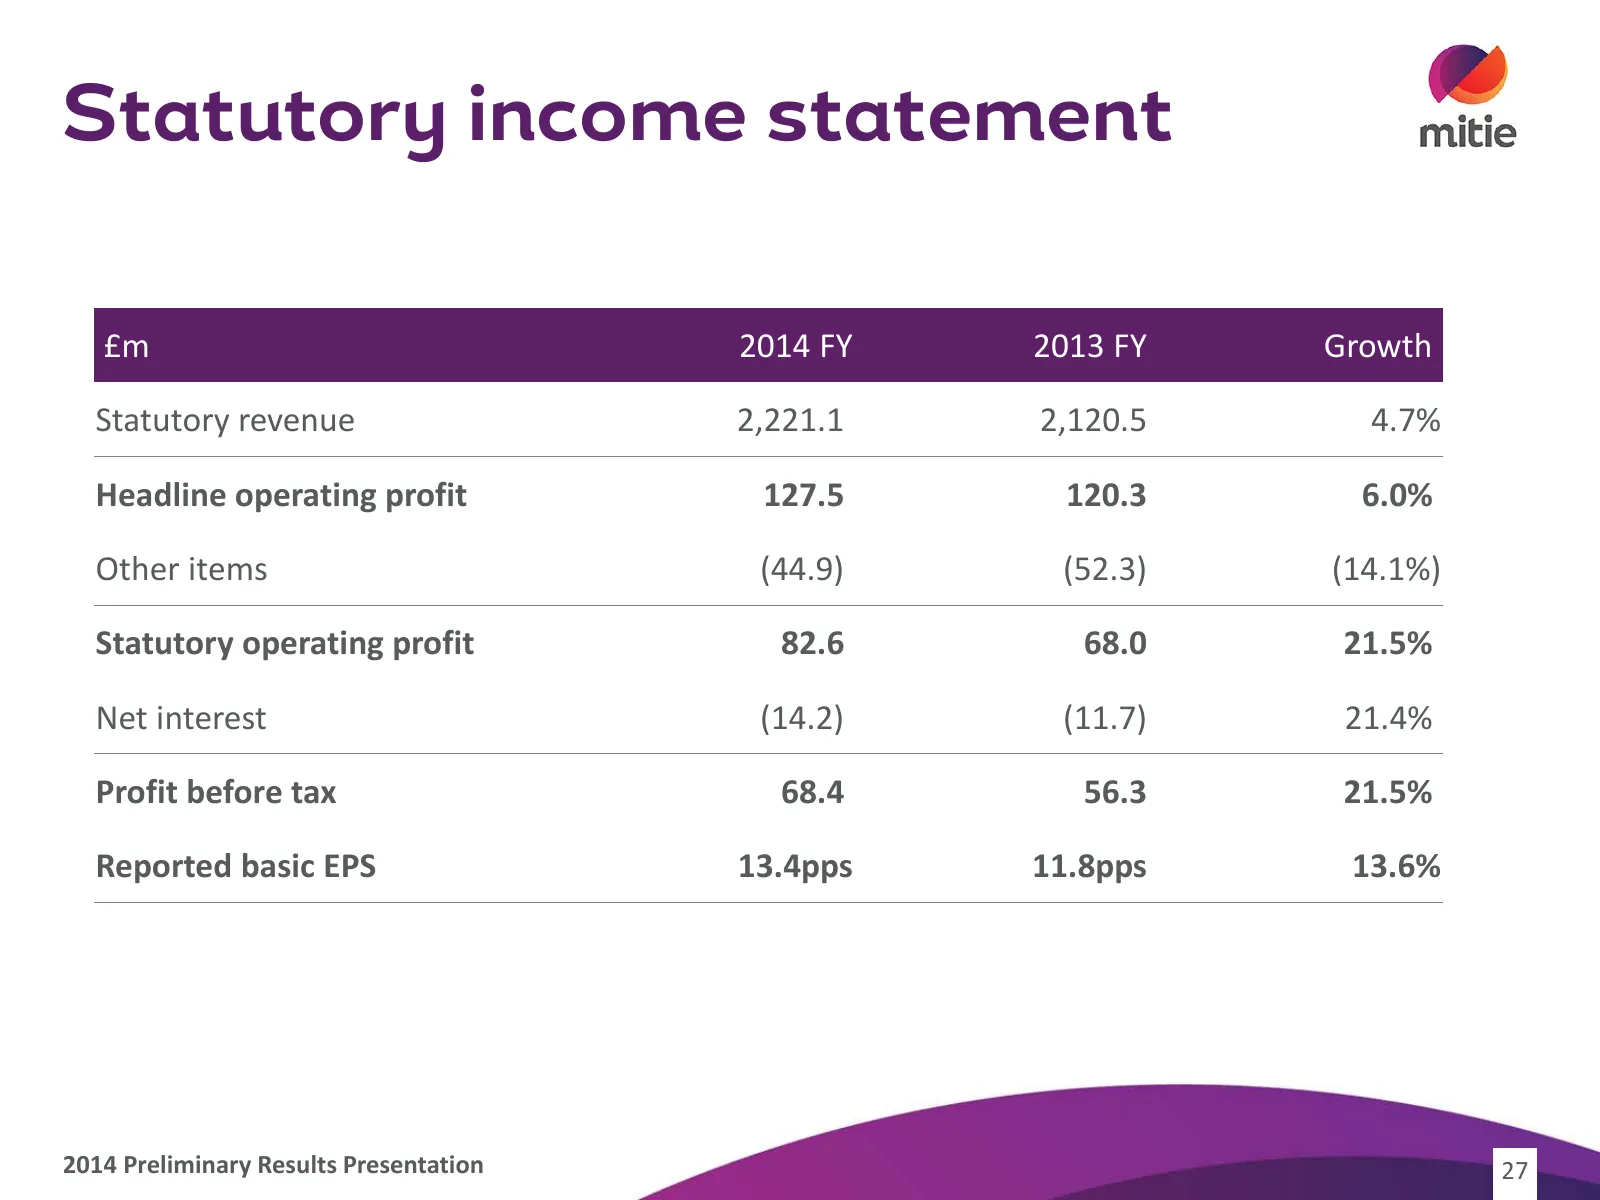
Slide 27: Statutory income statement
Statutory income statement £m 2014 FY 2013 FY Growth Statutory revenue 2,221.1 2,120.5 4.7% Headline operating profit 127.5 120.3 6.0% Other items (44.9) (52.3) (14.1%) Statutory operating profit 82.6 68.0 21.5% Net interest (14.2) (11.7) 21.4% Profit before tax 68.4 56.3 21.5% Reported basic EPS 13
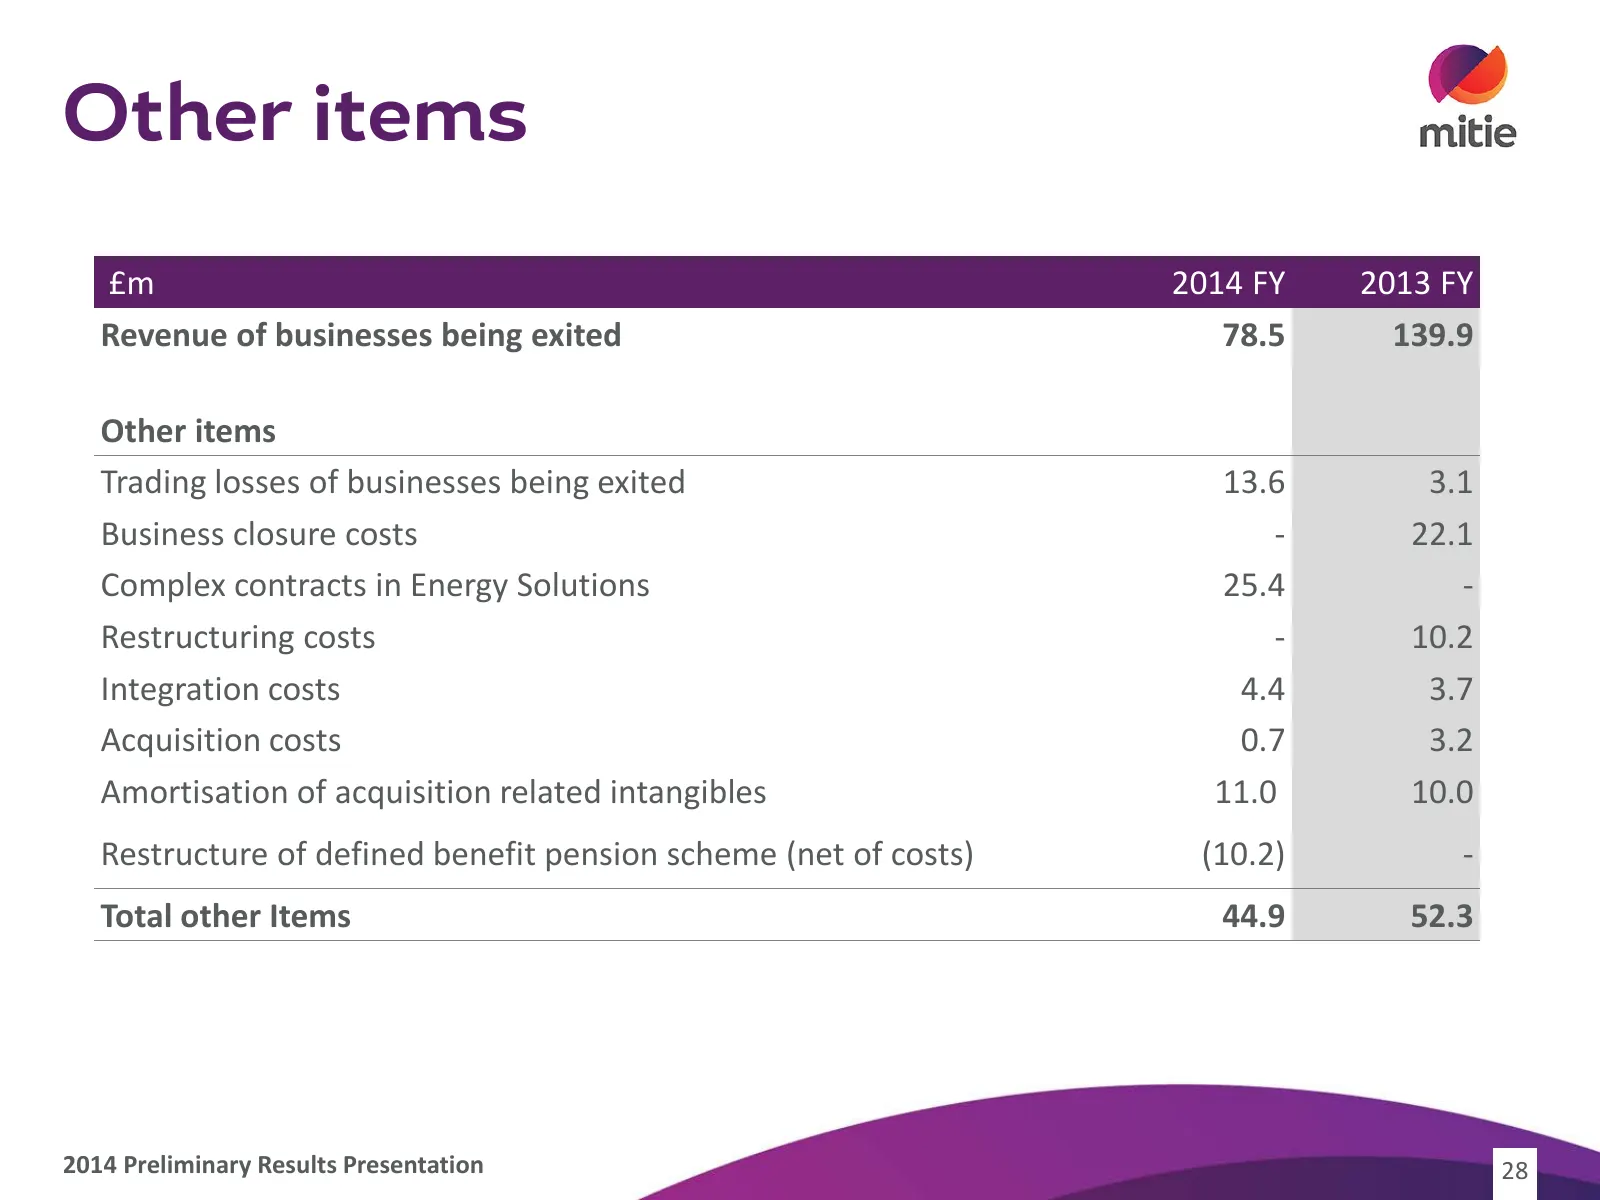
Slide 28: Other items
Other items £m 2014 FY 2013 FY Revenue of businesses being exited 78.5 139.9 Other items Trading losses of businesses being exited 13.6 3.1 Business closure costs - 22.1 Complex contracts in Energy Solutions 25.4 - Restructuring costs - 10.2 Integration costs 4.4 3.7 Acquisition costs 0.7 3.2 Amorti
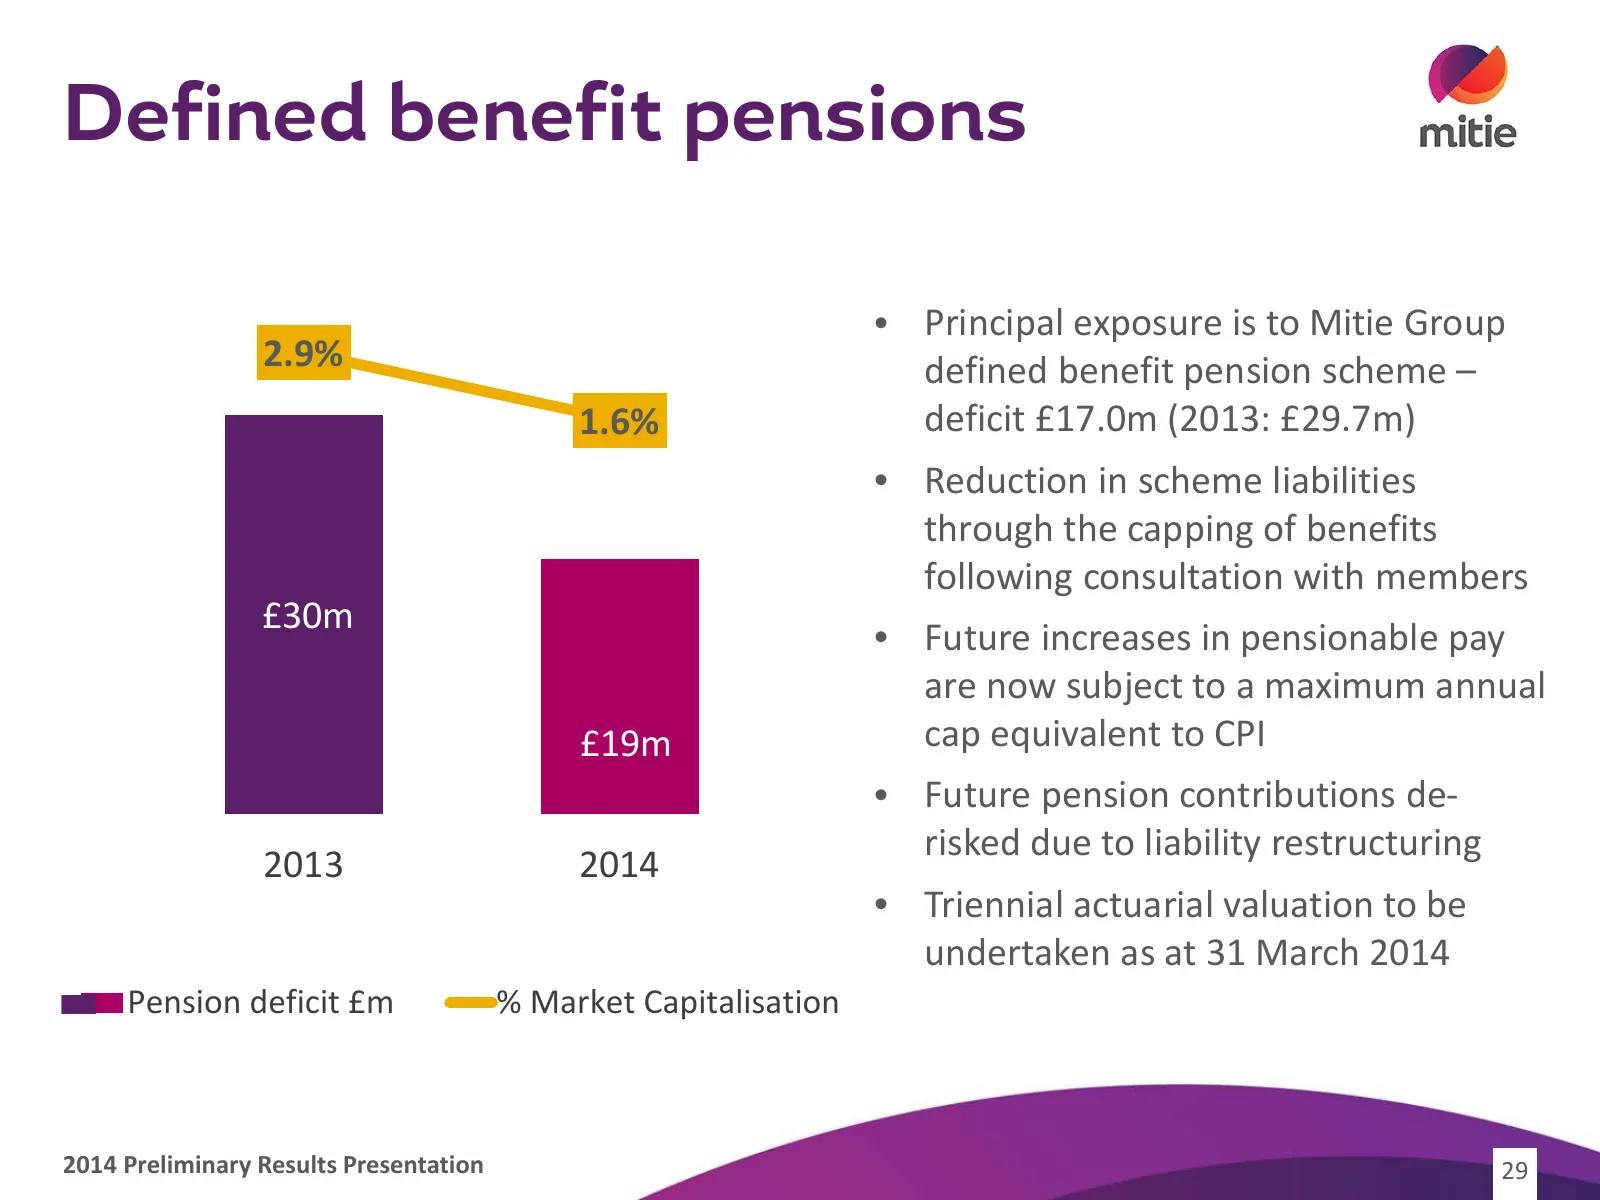
Slide 29: Defined benefit pensions
Defined benefit pensions • Principal exposure is to Mitie Group 35 2.9% 3.0 % defined benefit pension scheme – 1.6% deficit £17.0m (2013: £29.7m) 2.0 % 30 1.0 % 25 0.0 % • Reduction in scheme liabilities 20 through the capping of benefits following consultation with members -1.0% £30m -2.0% • Future
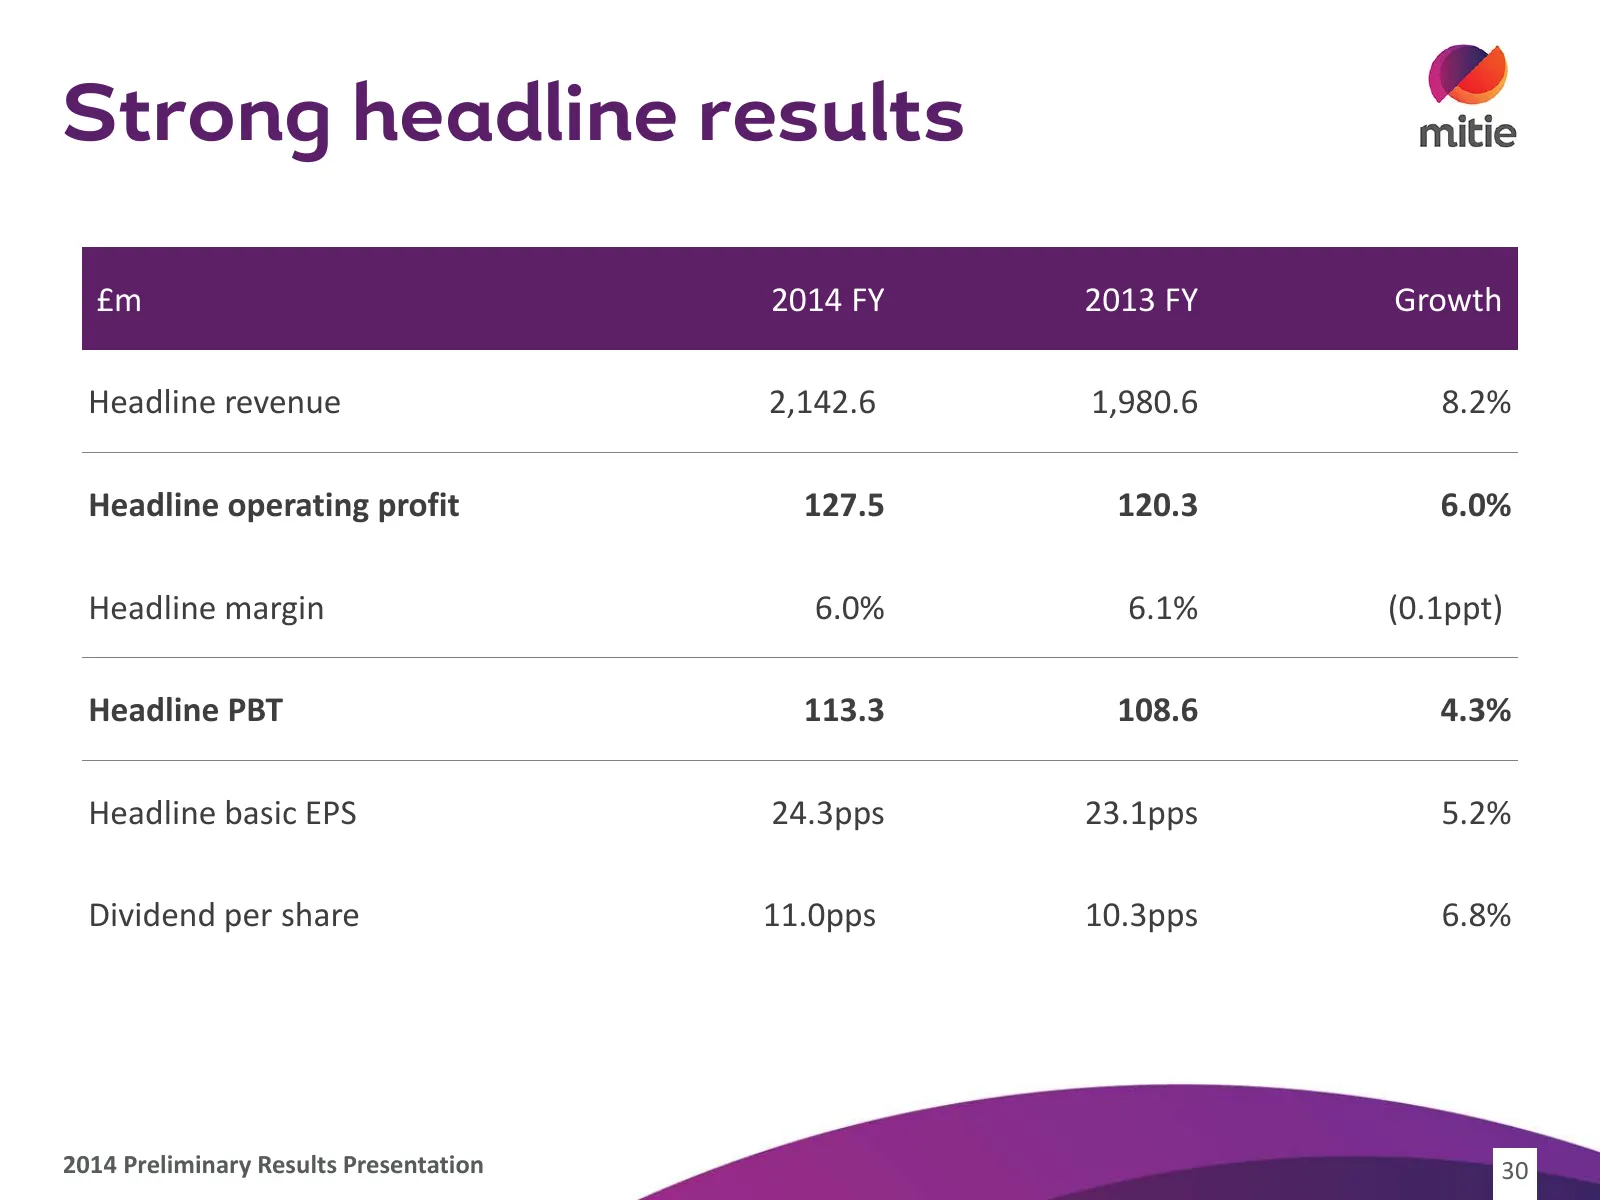
Slide 30: Strong headline results
Strong headline results £m 2014 FY 2013 FY Growth Headline revenue 2,142.6 1,980.6 8.2% Headline operating profit 127.5 120.3 6.0% Headline margin 6.0% 6.1% (0.1ppt) Headline PBT 113.3 108.6 4.3% Headline basic EPS 24.3pps 23.1pps 5.2% Dividend per share 11.0pps 10.3pps 6.8% 2014 Preliminary Results
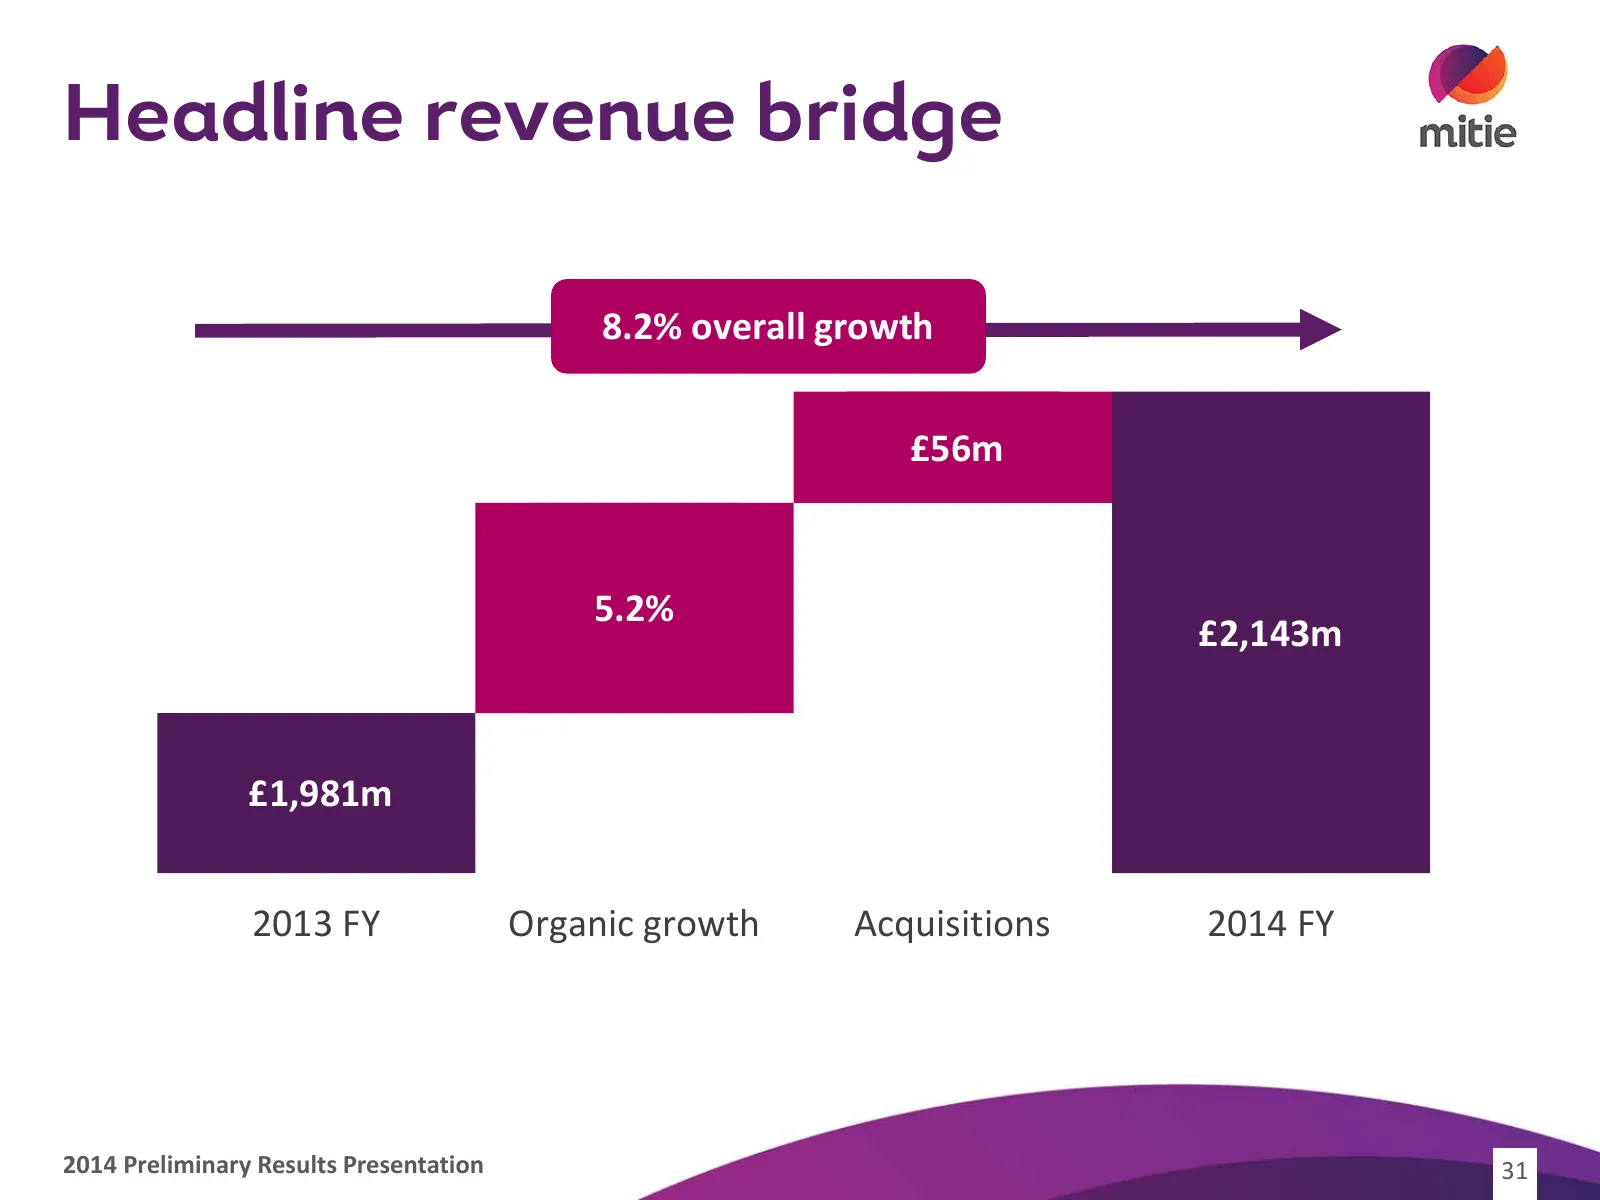
Slide 31: Headline revenue bridge
Headline revenue bridge 8.2% overall growth £56m 5.2% £2,143m £1,981m 2013 FY Organic growth Acquisitions 2014 FY 2014 Preliminary Results Presentation 31
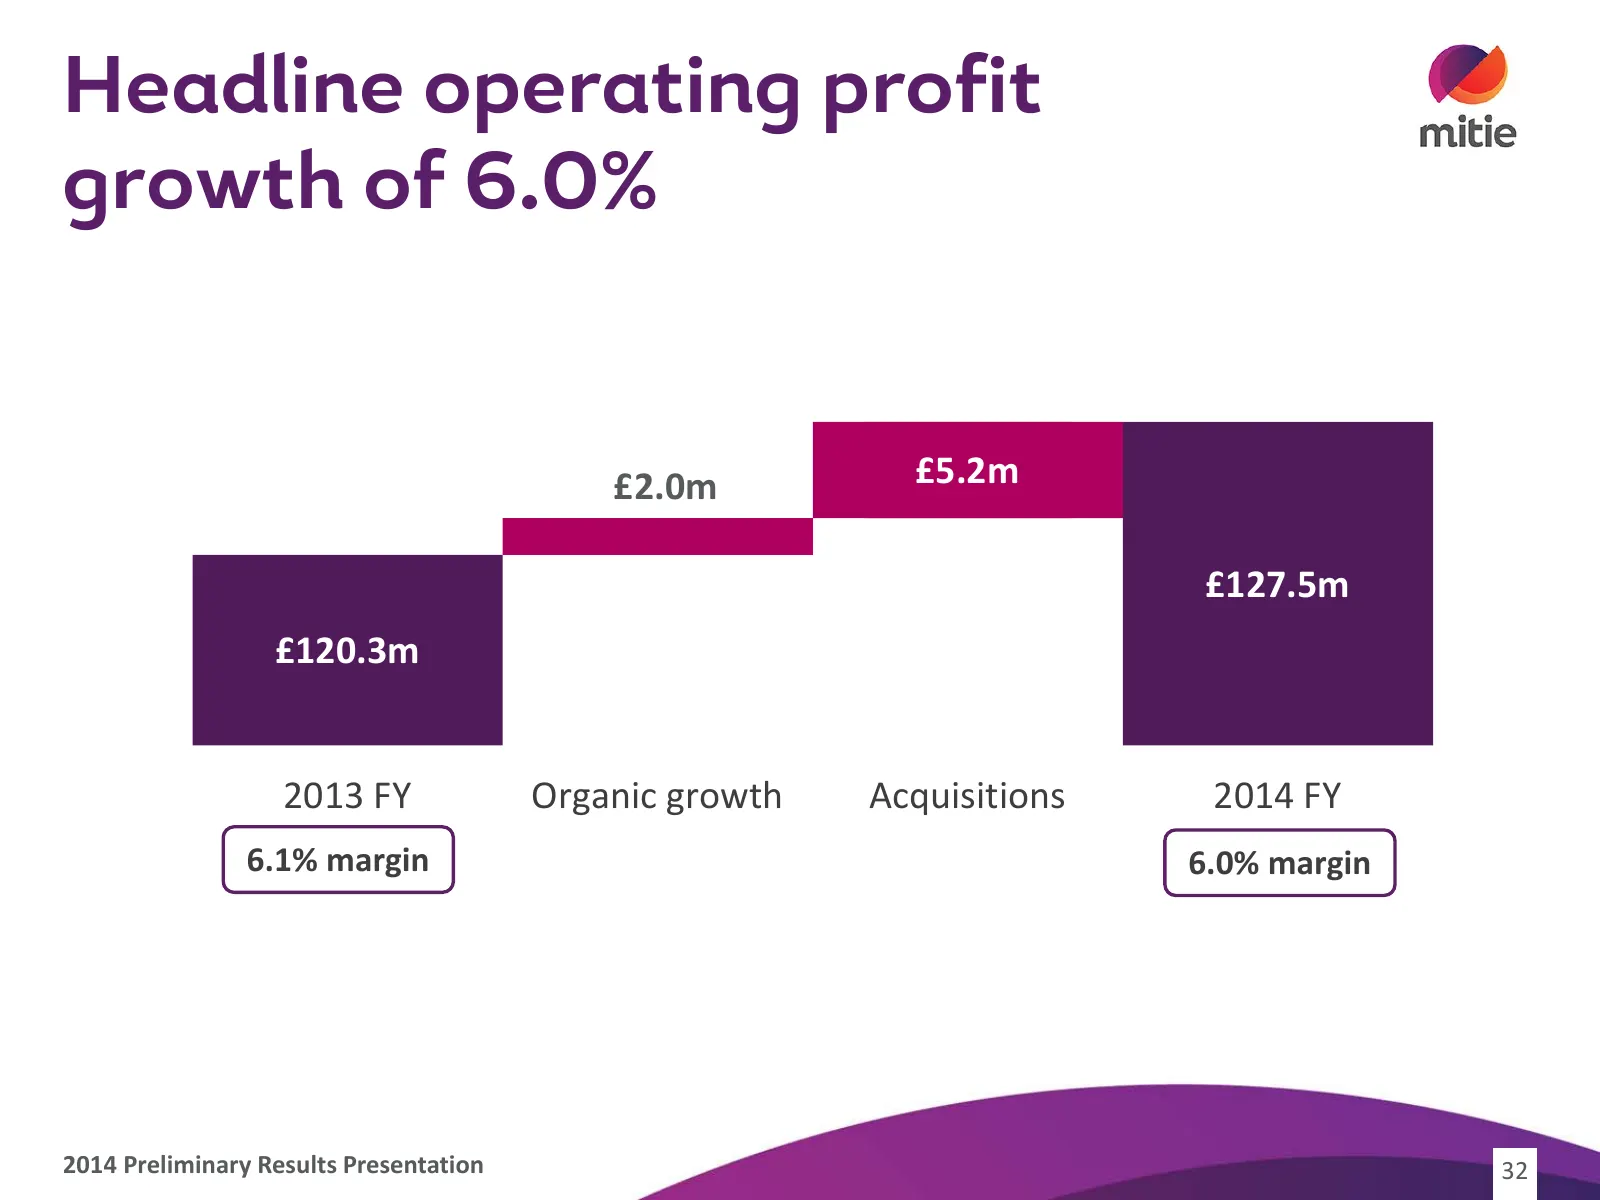
Slide 32: Headline operating profit growth of 6.0%
Headline operating profit growth of 6.0% £2.0m £5.2m £127.5m £120.3m 2013 FY Organic growth Acquisitions 2014 FY 6.1% margin 6.0% margin 2014 Preliminary Results Presentation 32
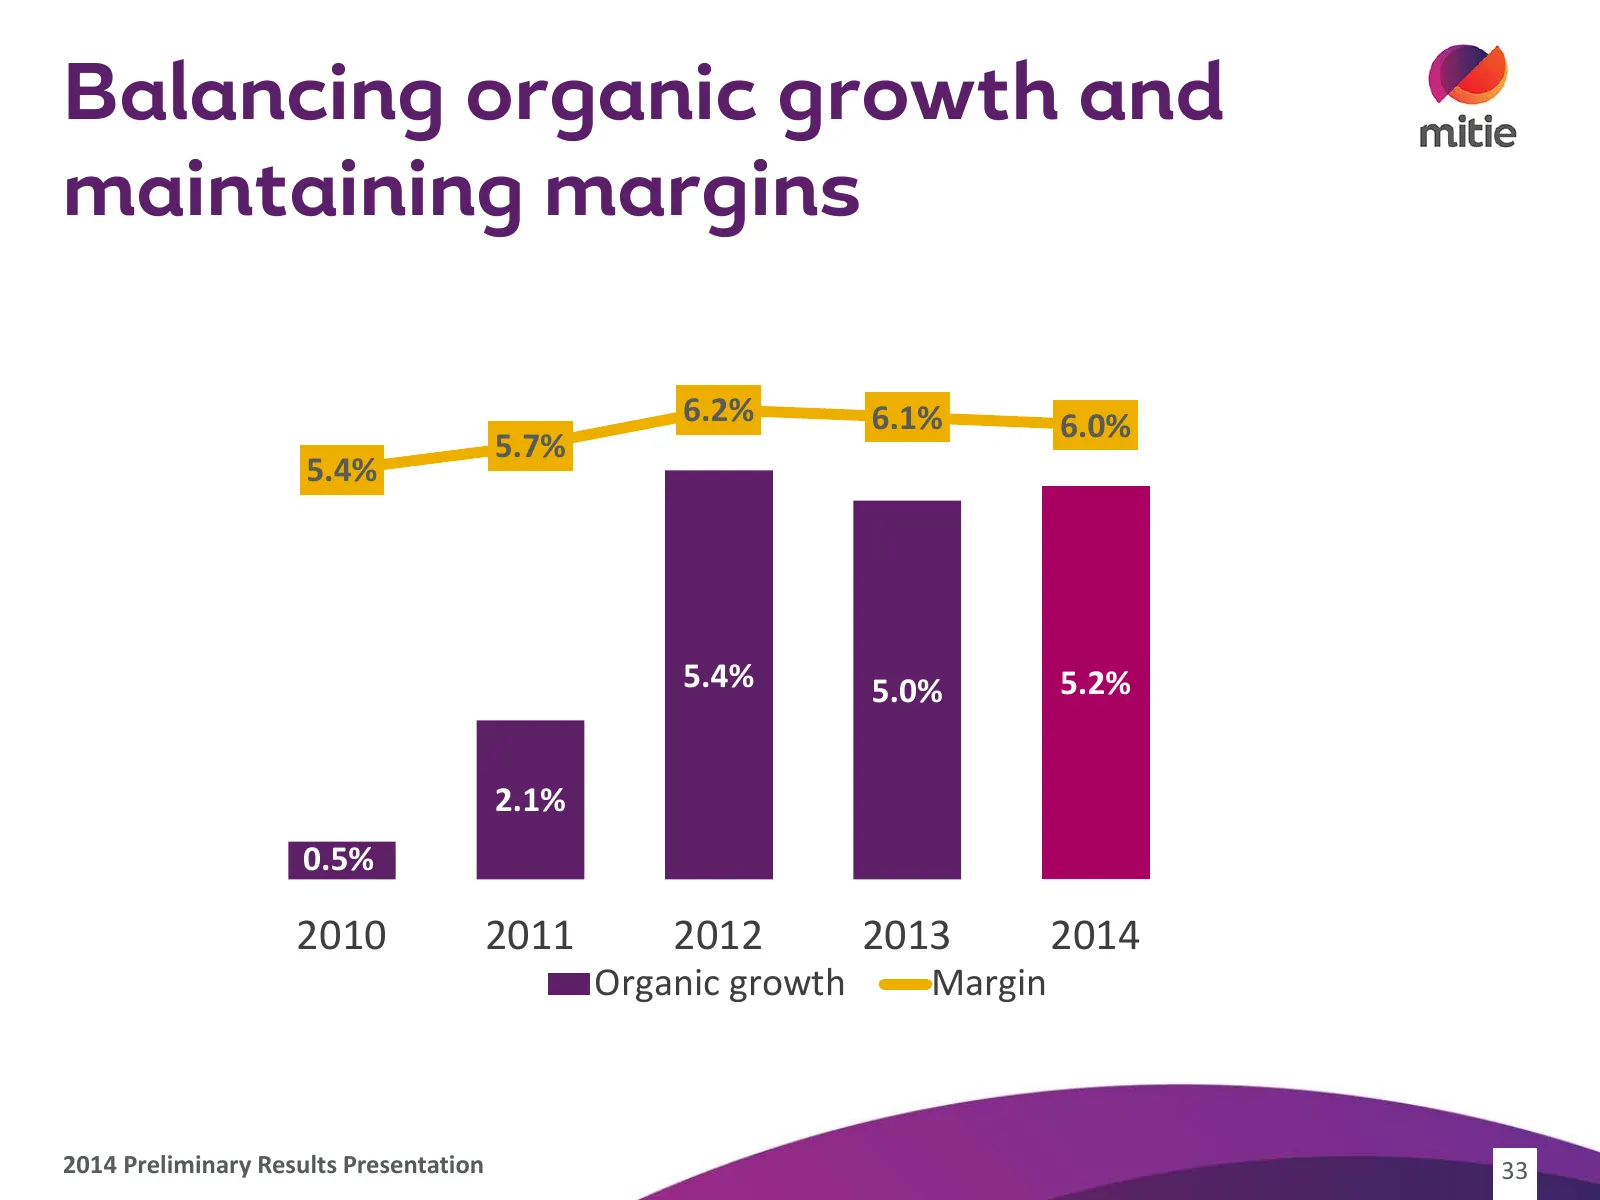
Slide 33: Balancing organic growth and maintaining margins
Balancing organic growth and maintaining margins 7.0 % 6.2% 6.1% 6.0% 5.7% 6.0 % 5.4% 5.0 % 4.0 % 3.0 % 5.4% 5.0% 5.2% 2.0 % 1.0 % 2.1% 0.0 % 0.5% 2010 2011 2012 2013 2014 Organic growth Margin 2014 Preliminary Results Presentation 33
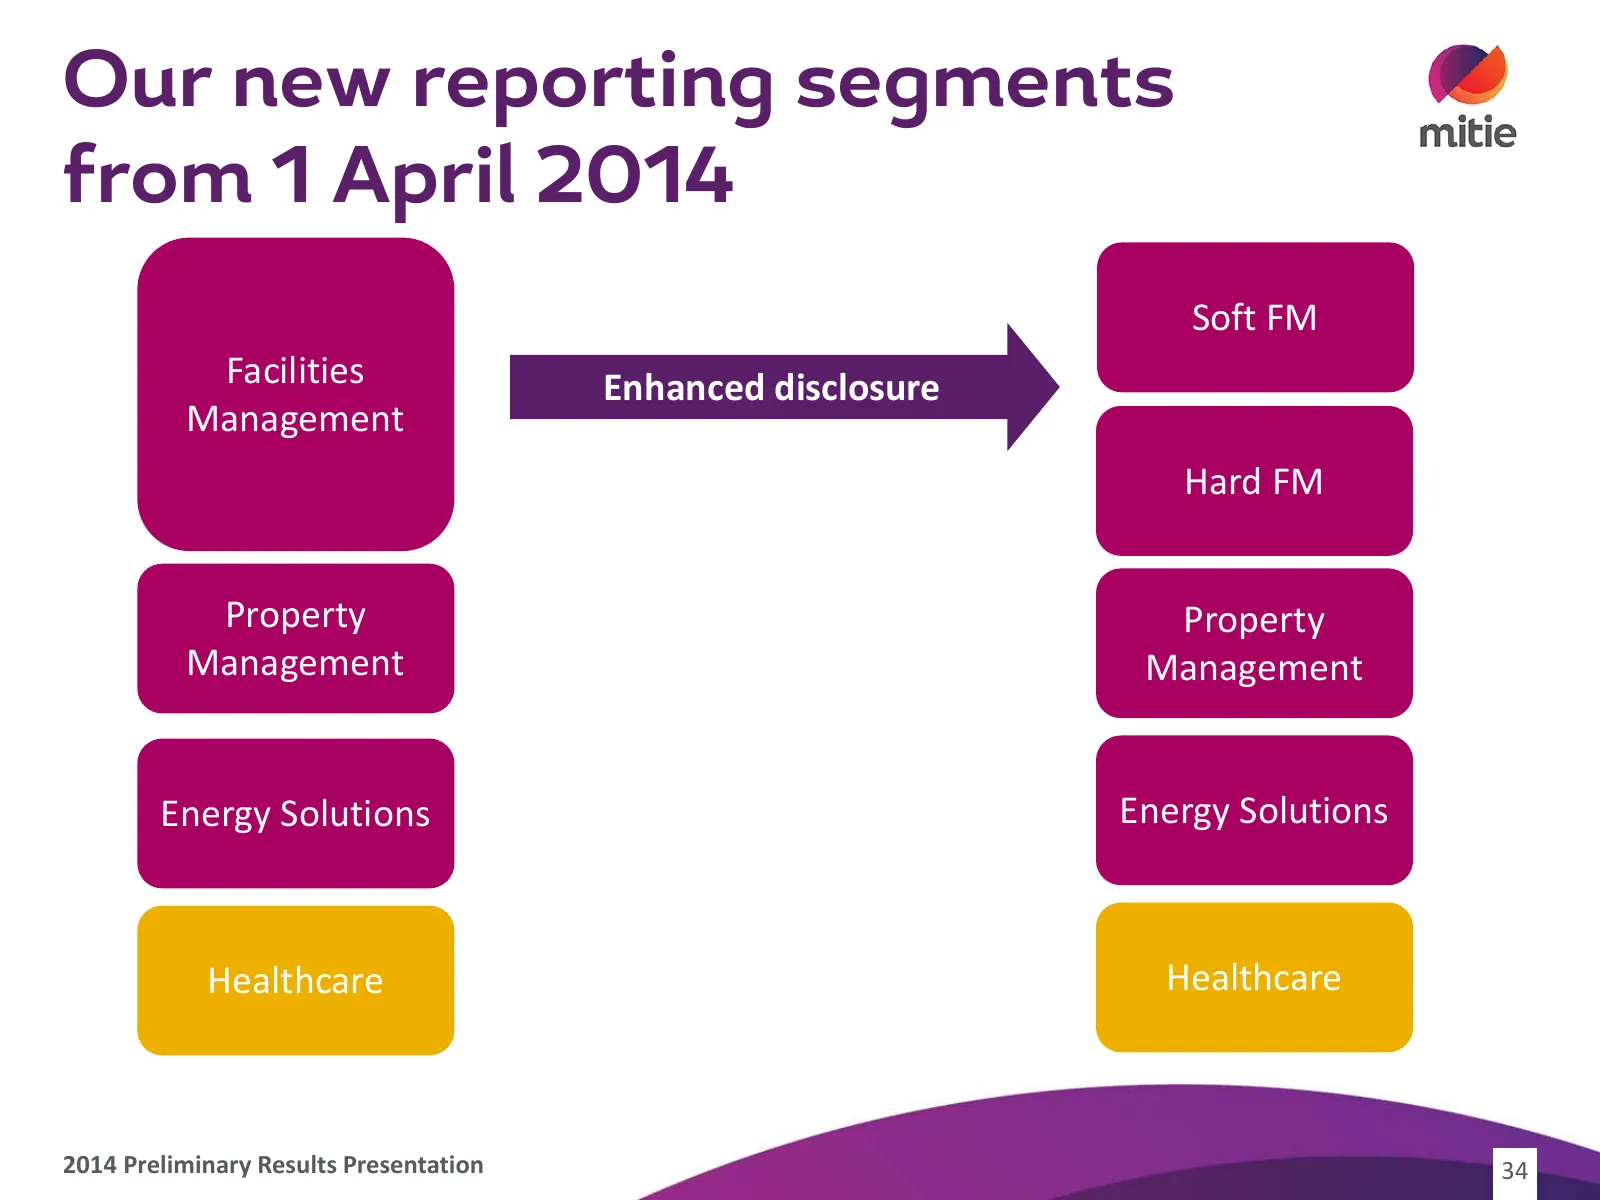
Slide 34: Our new reporting segments from April 2014
Our new reporting segments from 1 April 2014 Soft FM Facilities Enhanced disclosure Management Hard FM Property Property Management Management Energy Solutions Energy Solutions Healthcare Healthcare 2014 Preliminary Results Presentation 34
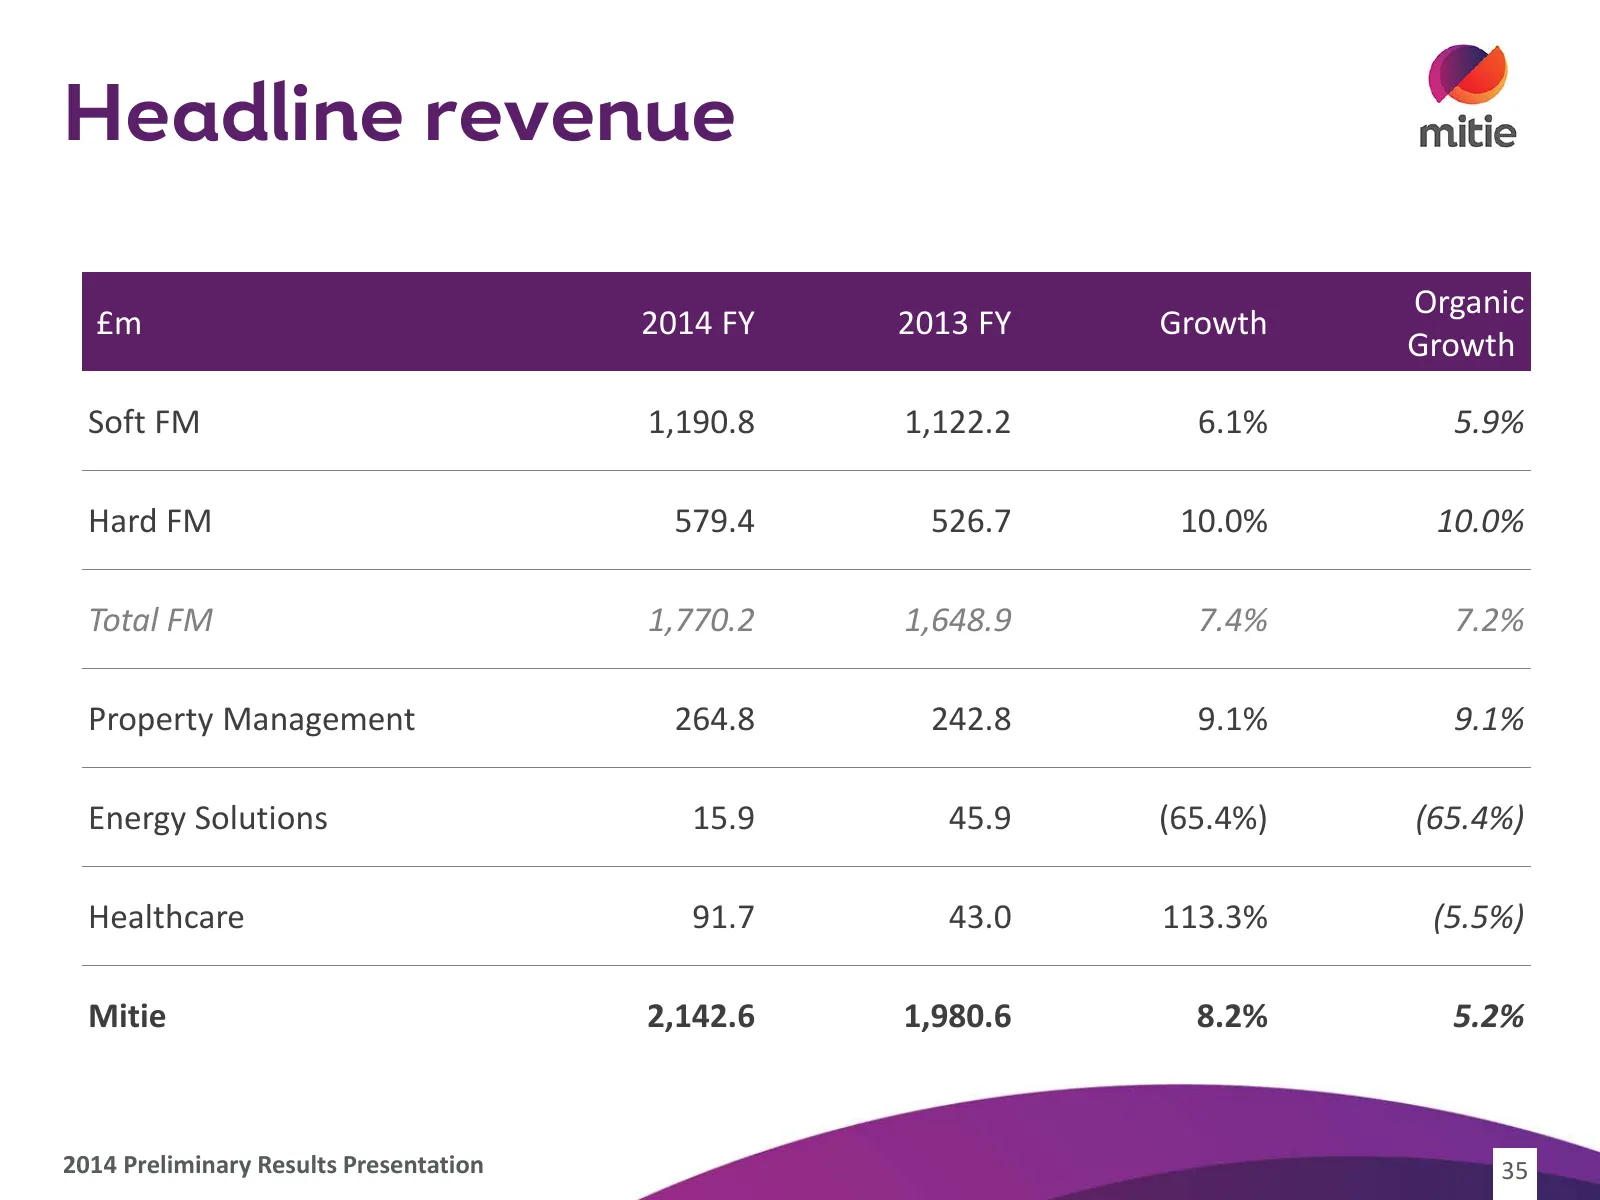
Slide 35: Headline revenue
Headline revenue Organic £m 2014 FY 2013 FY Growth Growth Soft FM 1,190.8 1,122.2 6.1% 5.9% Hard FM 579.4 526.7 10.0% 10.0% Total FM 1,770.2 1,648.9 7.4% 7.2% Property Management 264.8 242.8 9.1% 9.1% Energy Solutions 15.9 45.9 (65.4%) (65.4%) Healthcare 91.7 43.0 113.3% (5.5%) Mitie 2,142.6 1,980.6
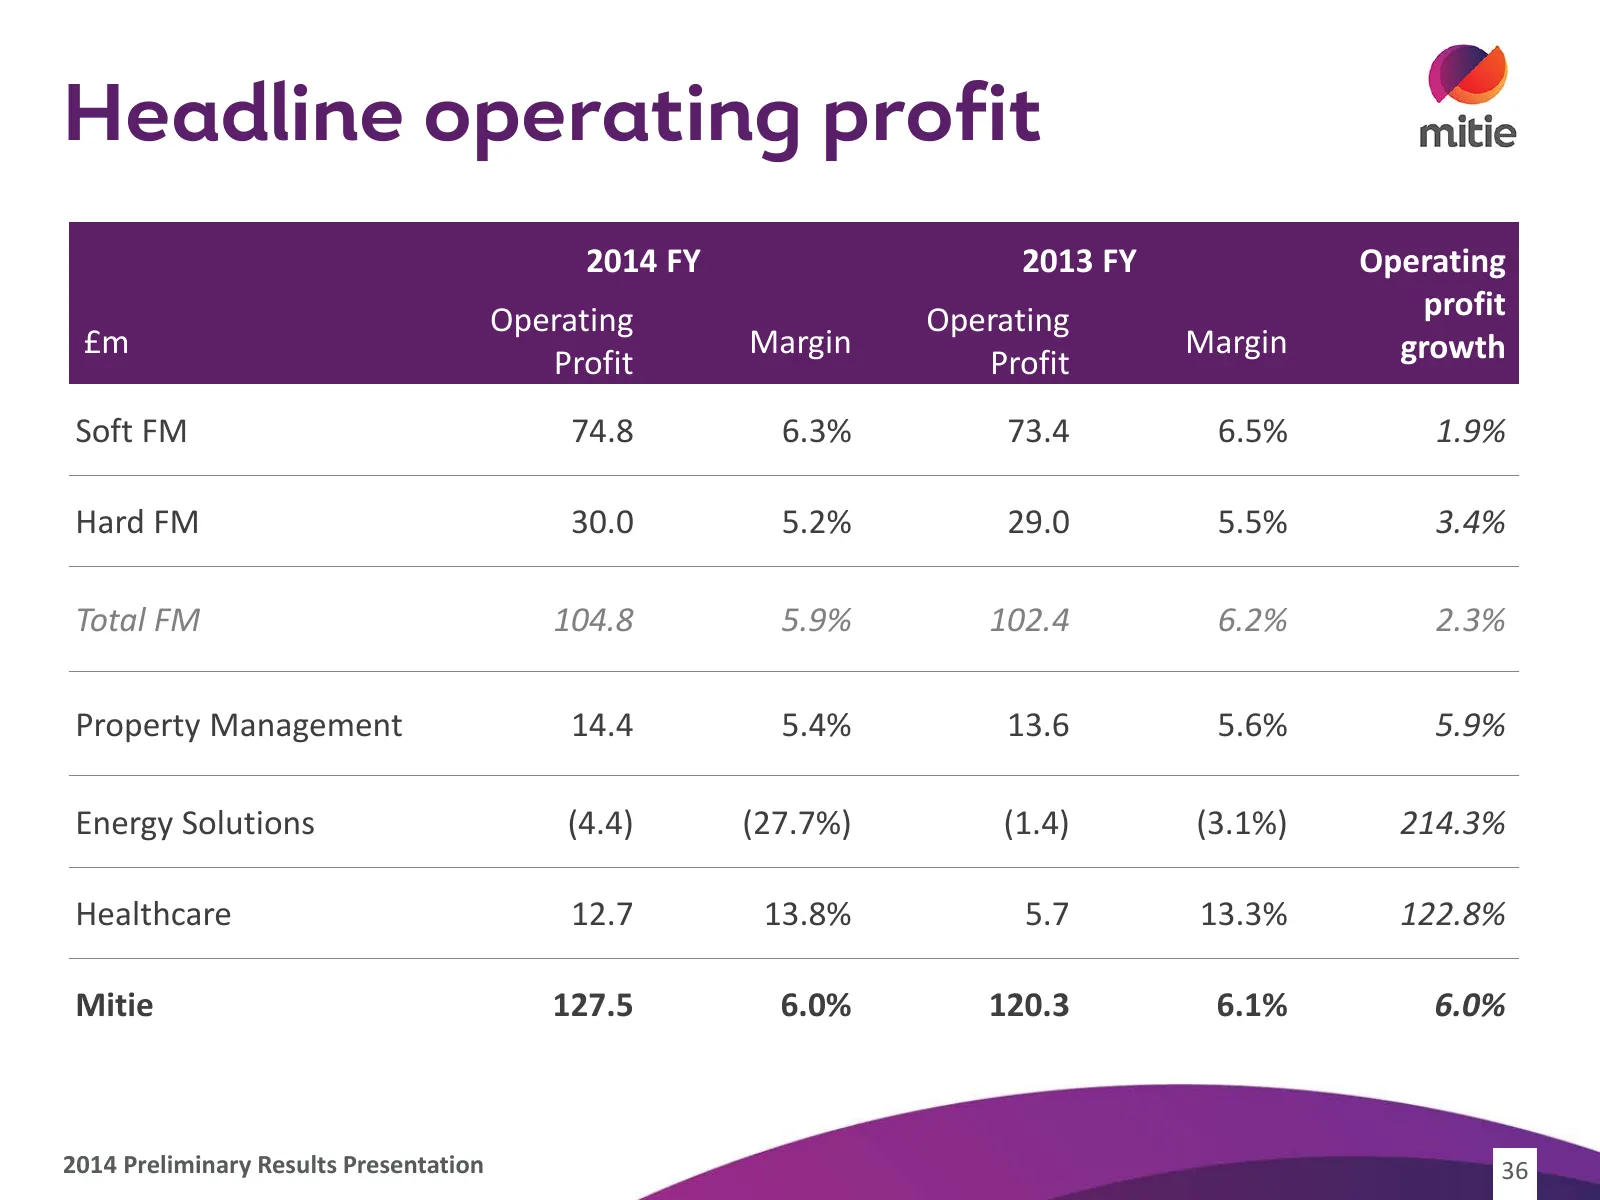
Slide 36: Headline operating profit
Headline operating profit 2014 FY 2013 FY Operating Operating Operating profit £m Margin Margin growth Profit Profit Soft FM 74.8 6.3% 73.4 6.5% 1.9% Hard FM 30.0 5.2% 29.0 5.5% 3.4% Total FM 104.8 5.9% 102.4 6.2% 2.3% Property Management 14.4 5.4% 13.6 5.6% 5.9% Energy Solutions (4.4) (27.7%) (1.4)
Slide 37: Soft FM
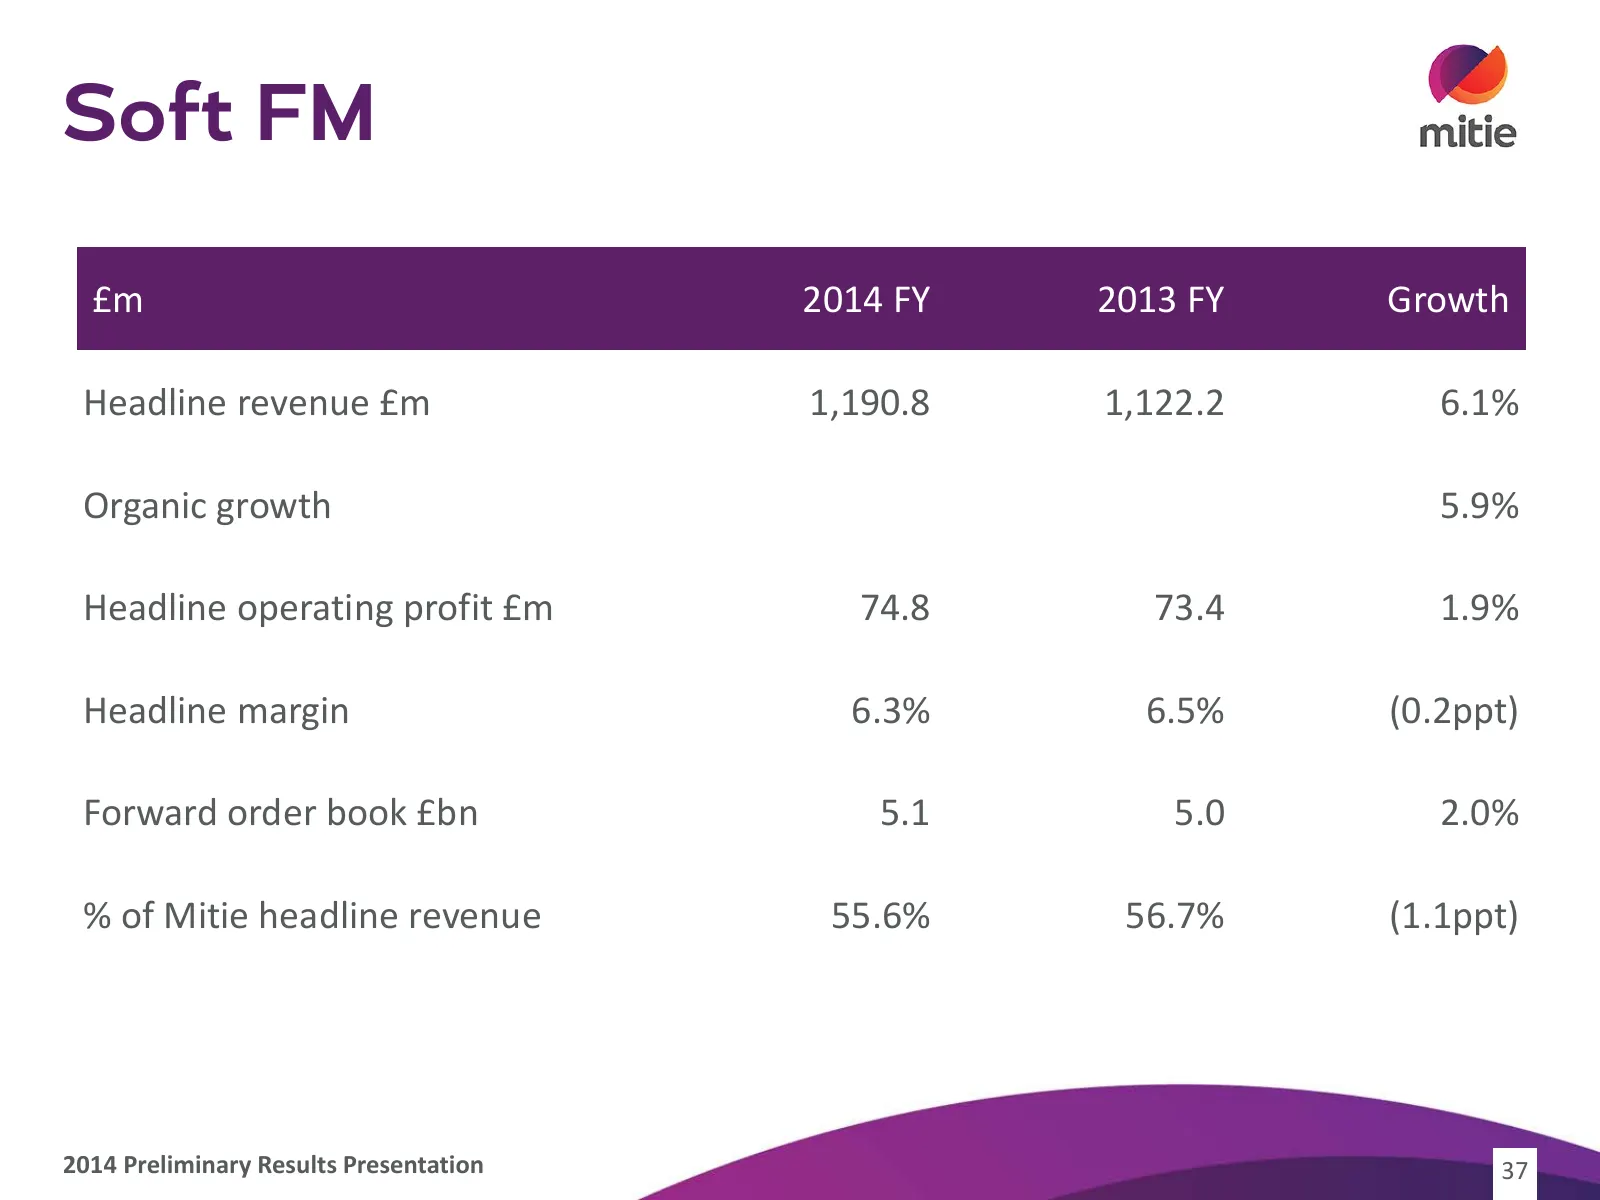
Soft FM £m 2014 FY 2013 FY Growth Headline revenue £m 1,190.8 1,122.2 6.1% Organic growth 5.9% Headline operating profit £m 74.8 73.4 1.9% Headline margin 6.3% 6.5% (0.2ppt) Forward order book £bn 5.1 5.0 2.0% % of Mitie headline revenue 55.6% 56.7% (1.1ppt) 2014 Preliminary Results Presentation 37
Slide 38: Hard FM
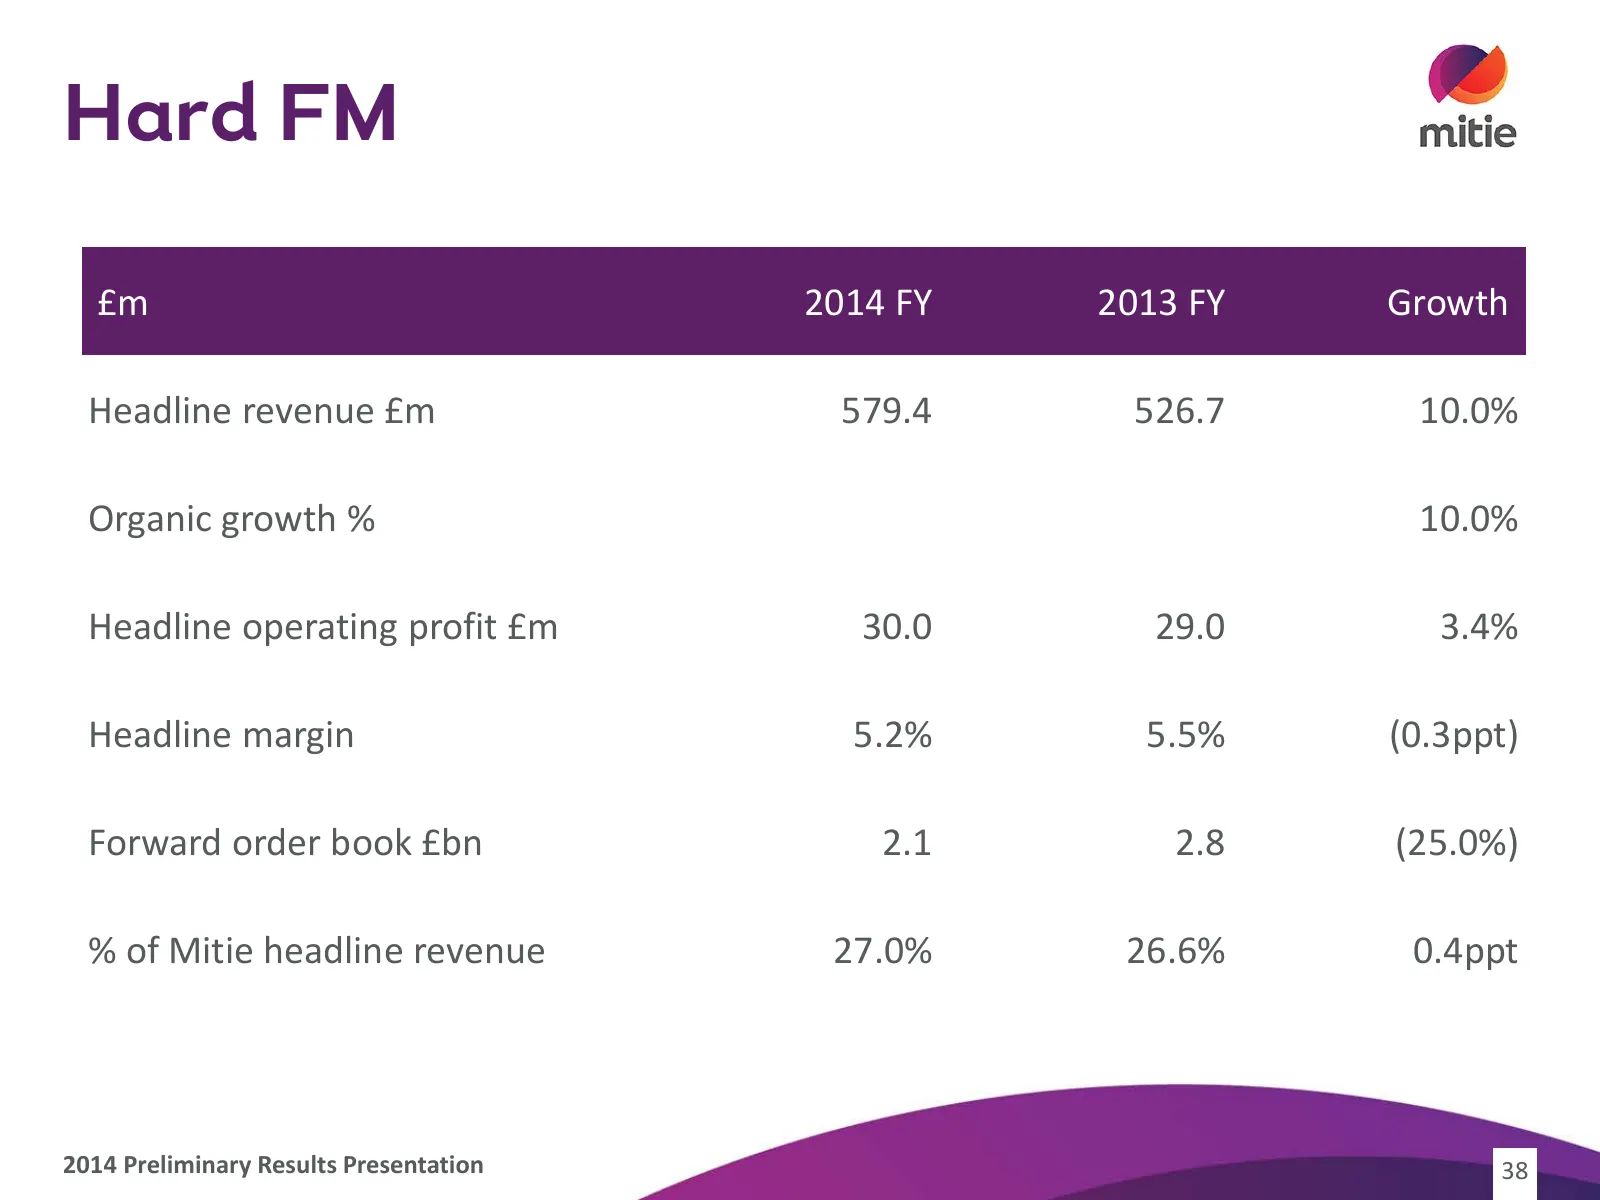
Hard FM £m 2014 FY 2013 FY Growth Headline revenue £m 579.4 526.7 10.0% Organic growth % 10.0% Headline operating profit £m 30.0 29.0 3.4% Headline margin 5.2% 5.5% (0.3ppt) Forward order book £bn 2.1 2.8 (25.0%) % of Mitie headline revenue 27.0% 26.6% 0.4ppt 2014 Preliminary Results Presentation 38
Slide 39: Property Management
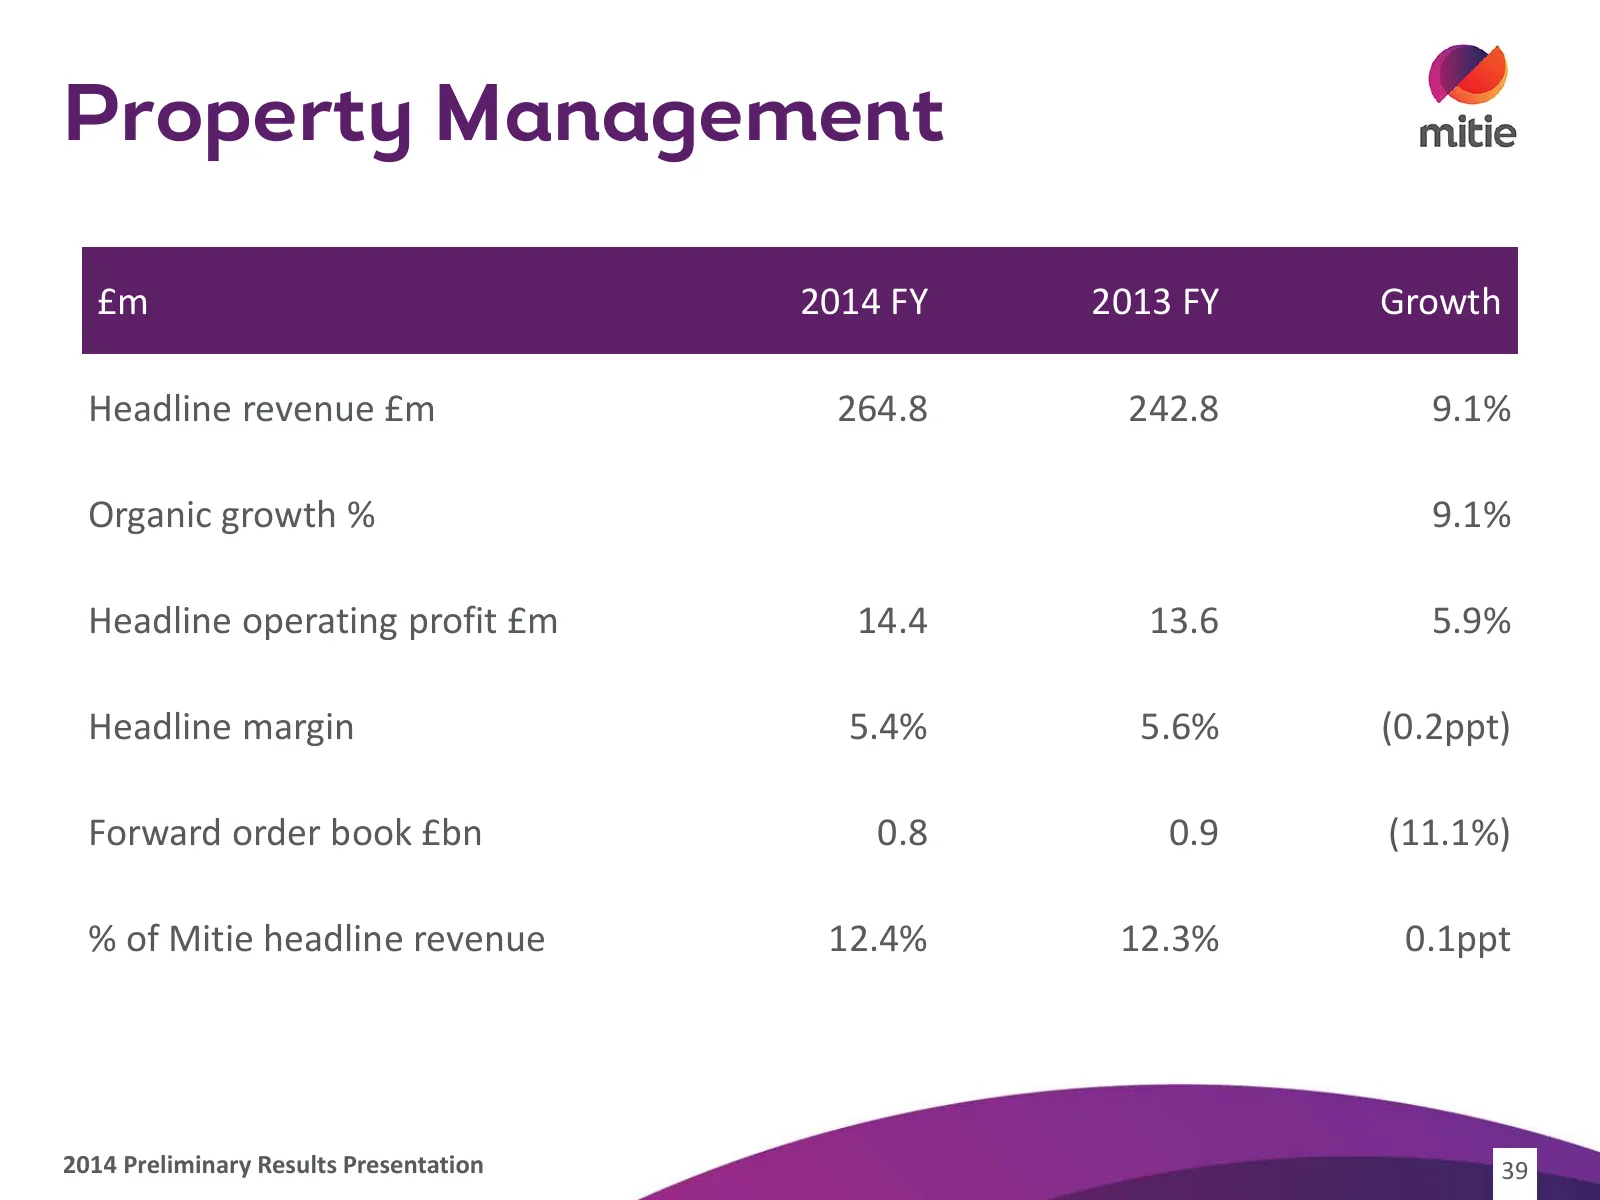
Property Management £m 2014 FY 2013 FY Growth Headline revenue £m 264.8 242.8 9.1% Organic growth % 9.1% Headline operating profit £m 14.4 13.6 5.9% Headline margin 5.4% 5.6% (0.2ppt) Forward order book £bn 0.8 0.9 (11.1%) % of Mitie headline revenue 12.4% 12.3% 0.1ppt 2014 Preliminary Results Prese
Slide 40: Energy Solutions
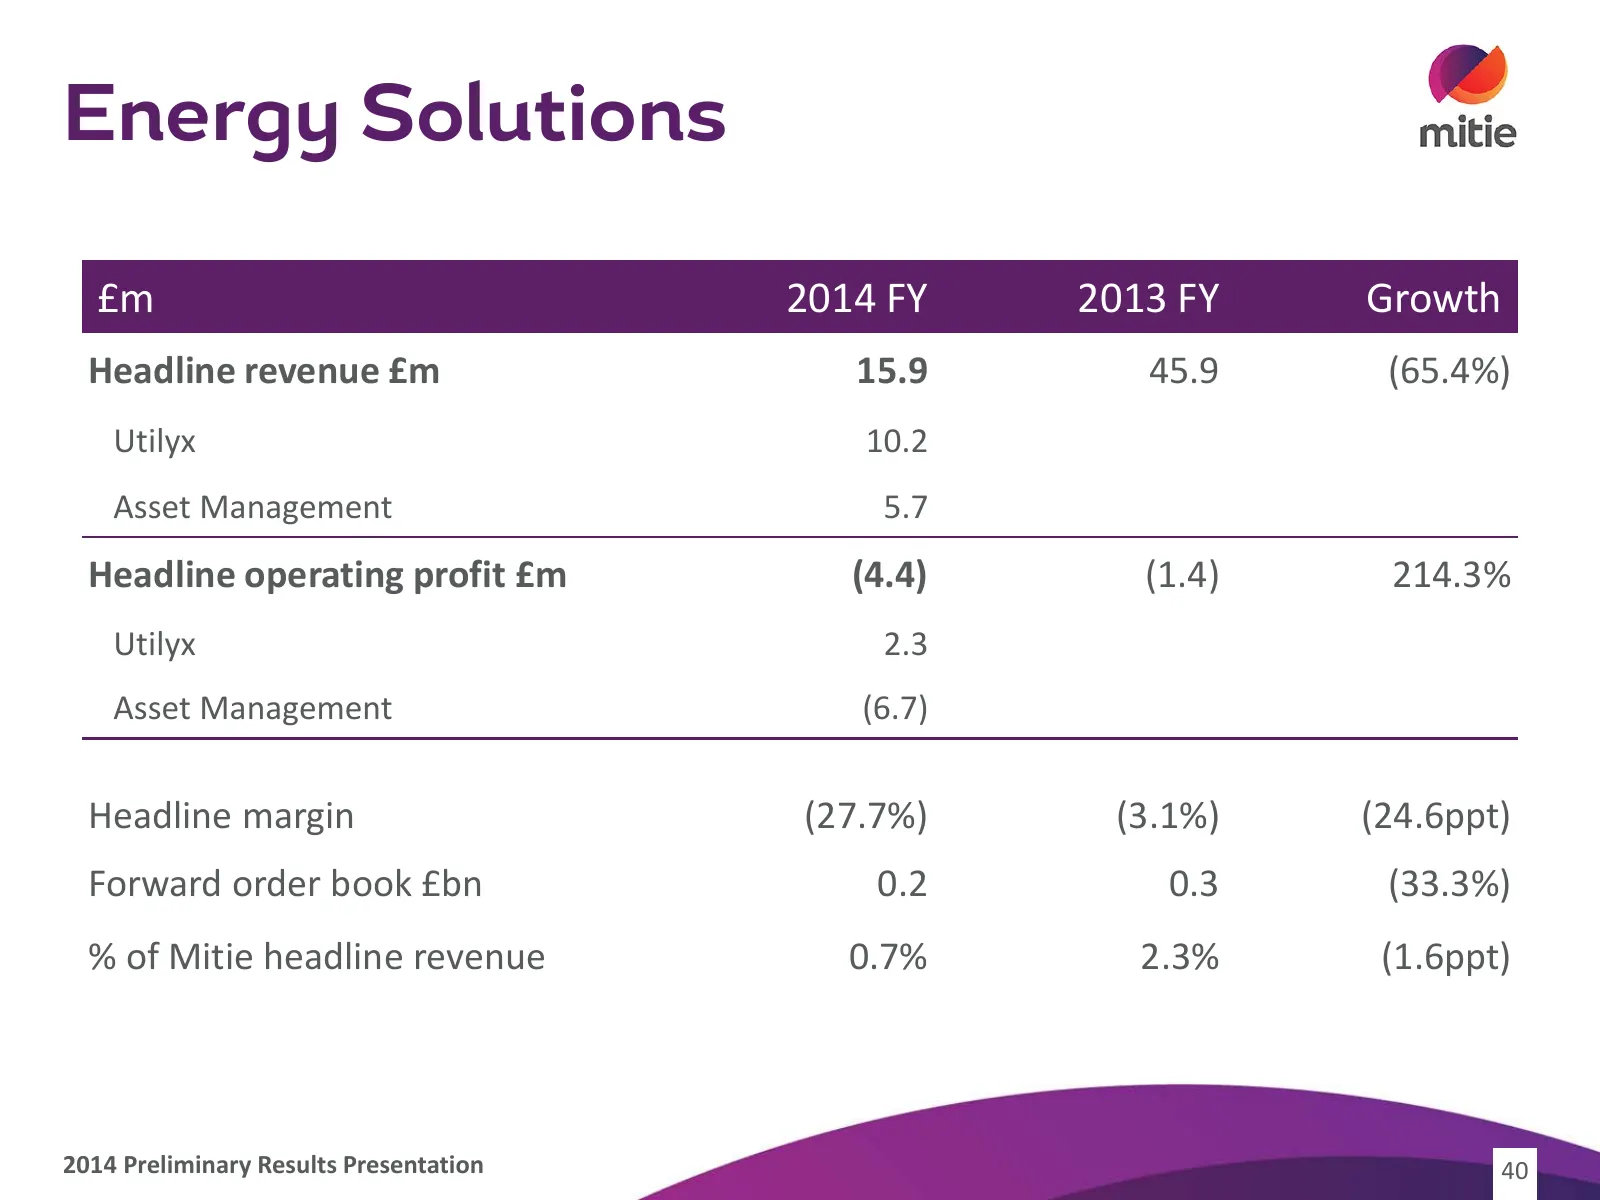
Energy Solutions £m 2014 FY 2013 FY Growth Headline revenue £m 15.9 45.9 (65.4%) Utilyx 10.2 Asset Management 5.7 Headline operating profit £m (4.4) (1.4) 214.3% Utilyx 2.3 Asset Management (6.7) Headline margin (27.7%) (3.1%) (24.6ppt) Forward order book £bn 0.2 0.3 (33.3%) % of Mitie headline reve
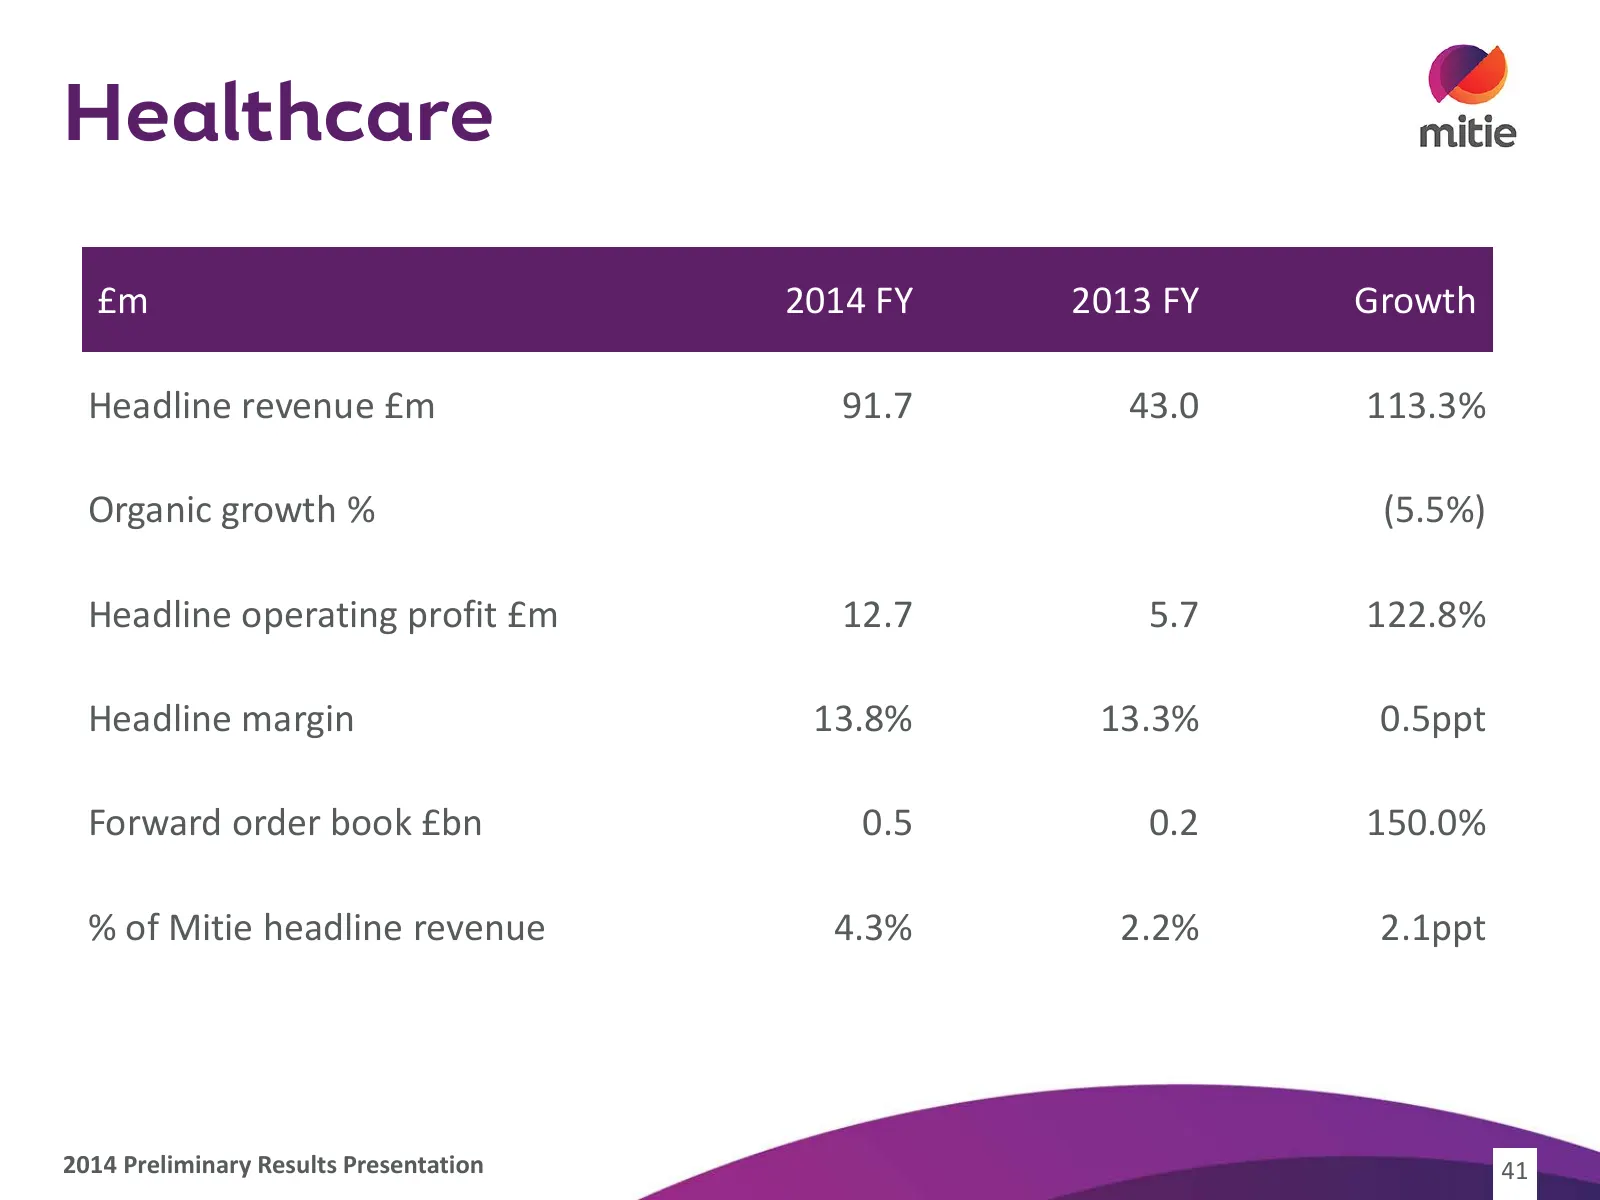
Slide 41: Healthcare
Healthcare £m 2014 FY 2013 FY Growth Headline revenue £m 91.7 43.0 113.3% Organic growth % (5.5%) Headline operating profit £m 12.7 5.7 122.8% Headline margin 13.8% 13.3% 0.5ppt Forward order book £bn 0.5 0.2 150.0% % of Mitie headline revenue 4.3% 2.2% 2.1ppt 2014 Preliminary Results Presentation 4
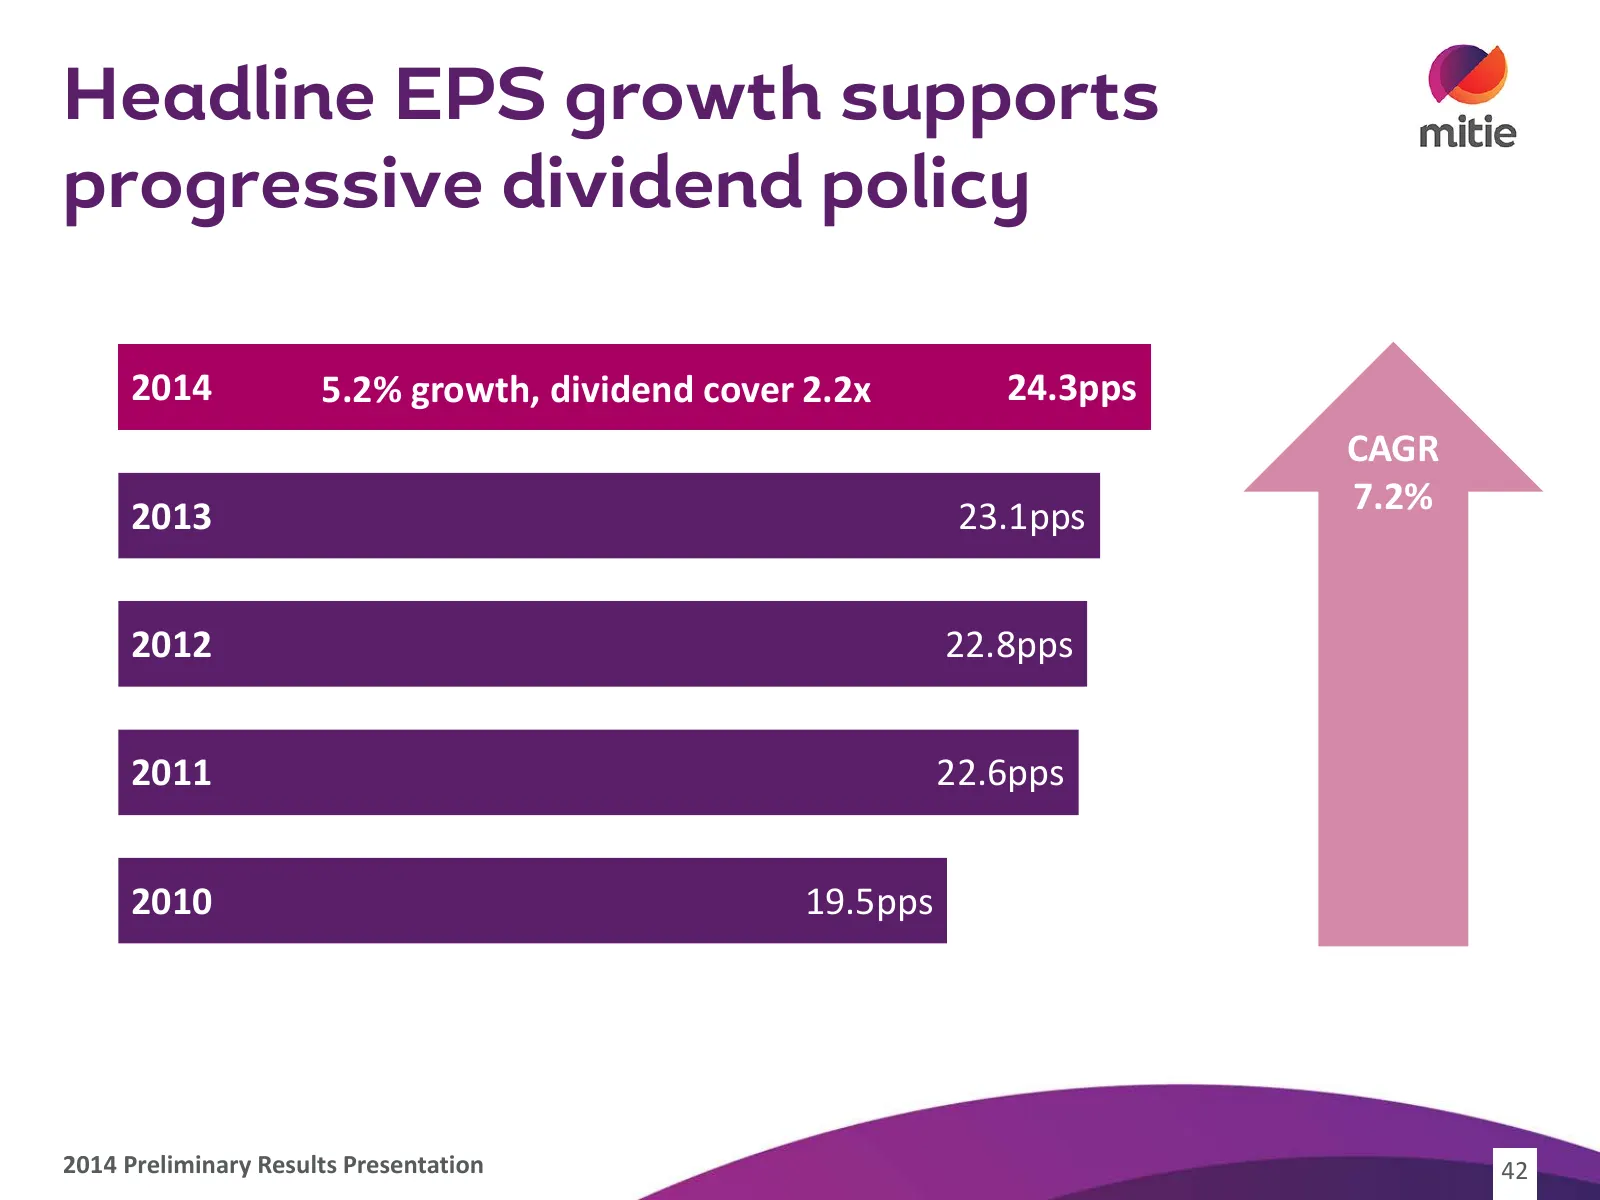
Slide 42: Headline EPS growth supports progressive dividend policy
Headline EPS growth supports progressive dividend policy 2014 5.2% growth, dividend cover 2.2x 24.3pps CAGR 2013 23.1pps 7.2% 2012 22.8pps 2011 22.6pps 2010 19.5pps 2014 Preliminary Results Presentation 42
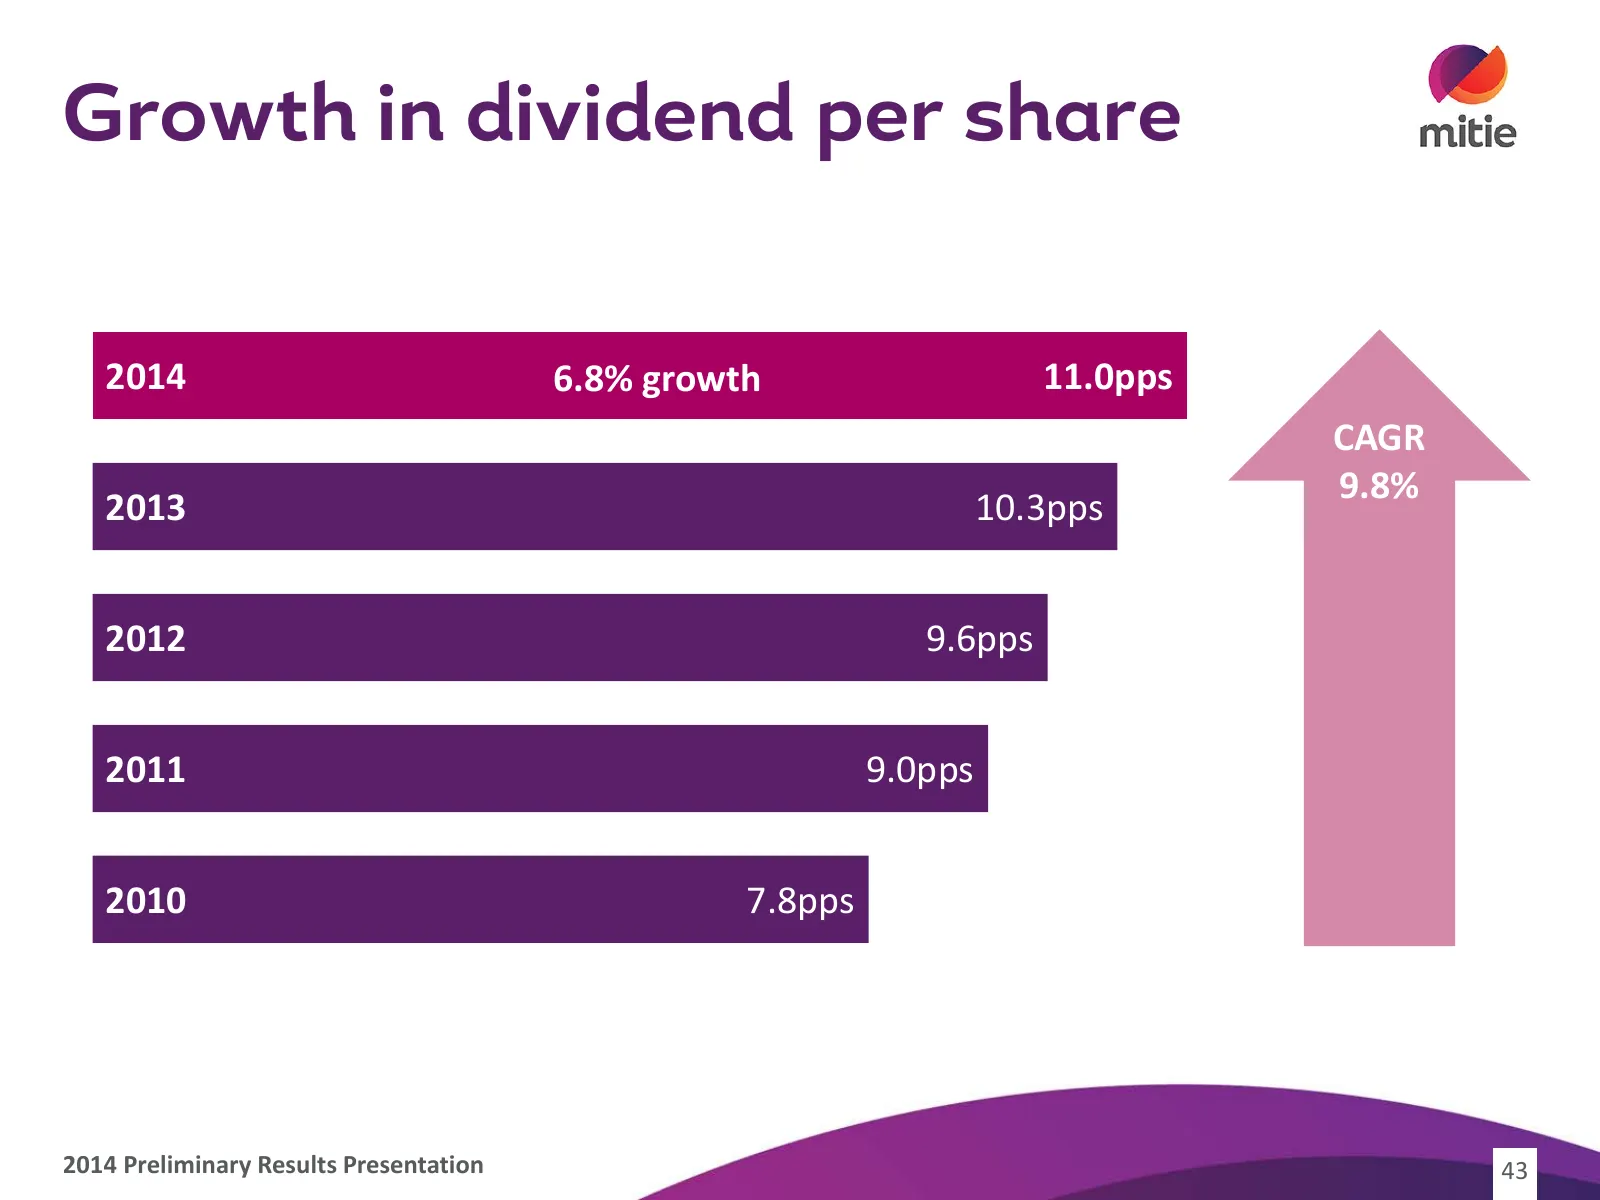
Slide 43: Growth in dividend per share
Growth in dividend per share 2014 6.8% growth 11.0pps CAGR 9.8% 2013 10.3pps 2012 9.6pps 2011 9.0pps 2010 7.8pps 2014 Preliminary Results Presentation 43
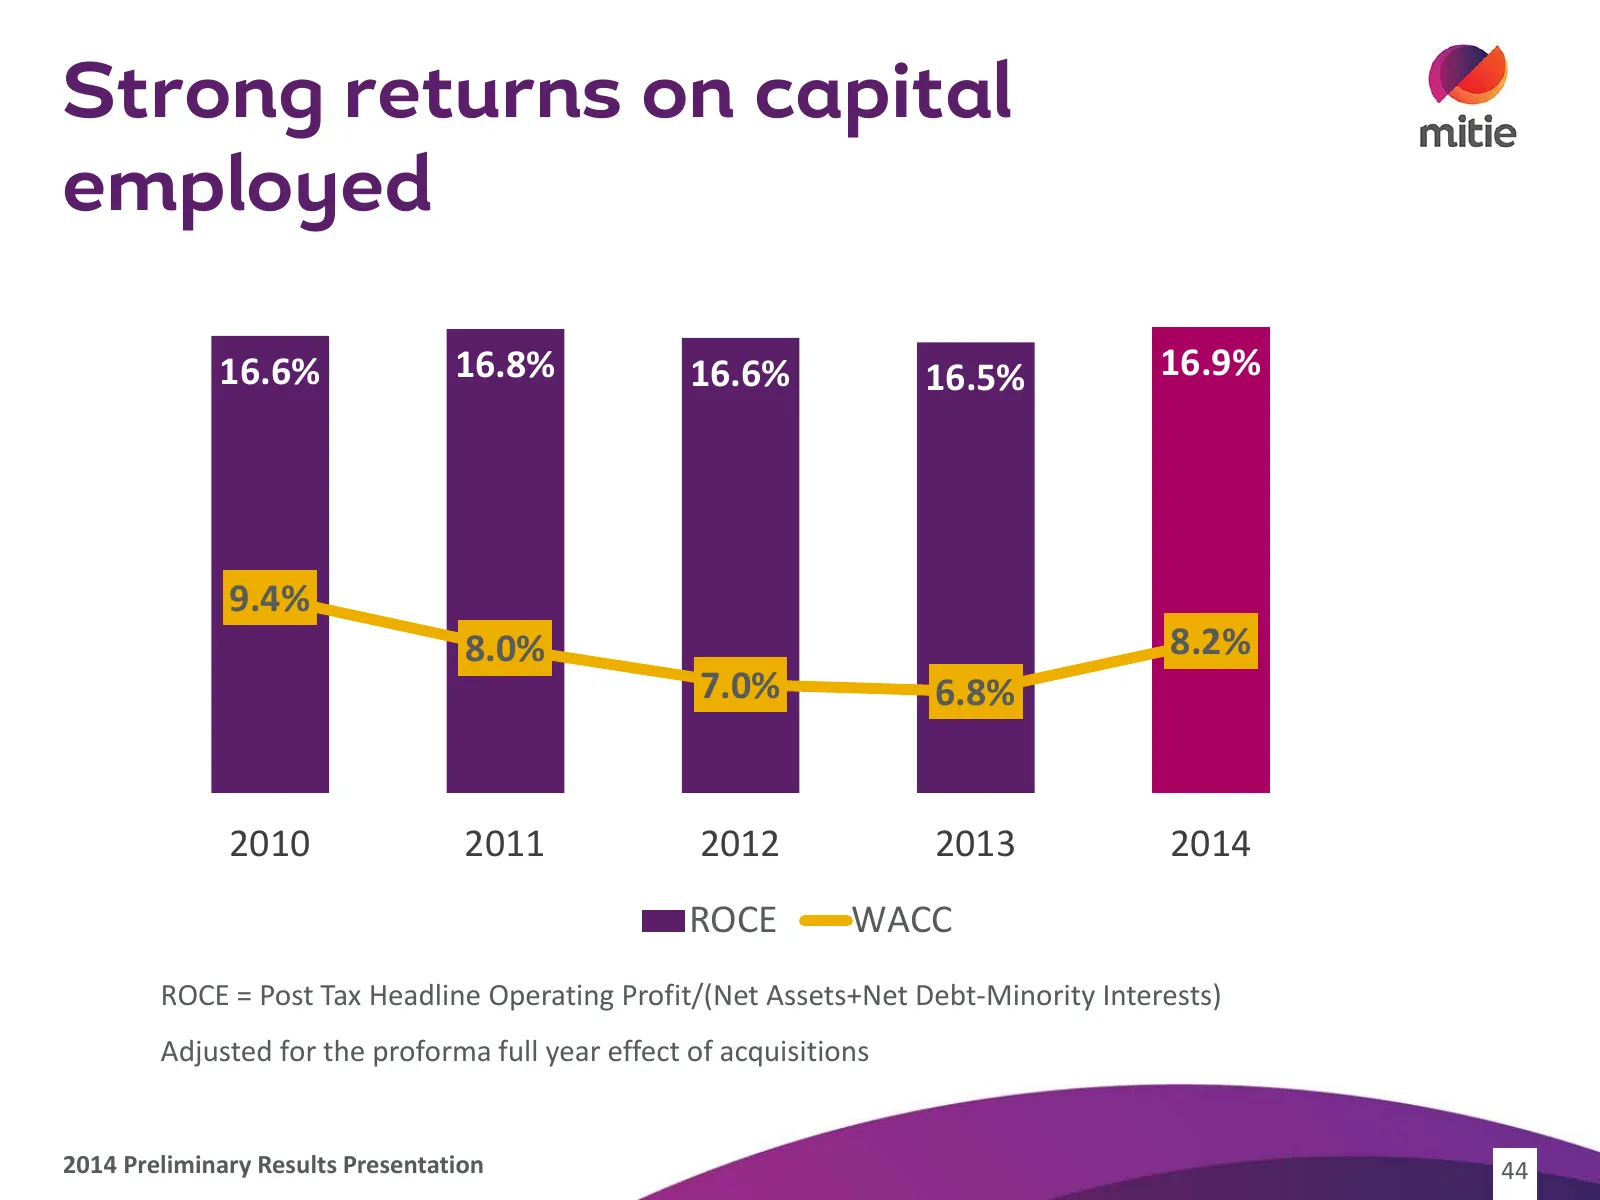
Slide 44: Strong returns on capital employed
Strong returns on capital employed 16.6% 16.8% 16.6% 16.5% 16.9% 9.4% 8.0% 8.2% 7.0% 6.8% 2010 2011 2012 2013 2014 ROCE WACC ROCE = Post Tax Headline Operating Profit/(Net Assets+Net Debt-Minority Interests) Adjusted for the proforma full year effect of acquisitions 2014 Preliminary Results Presenta
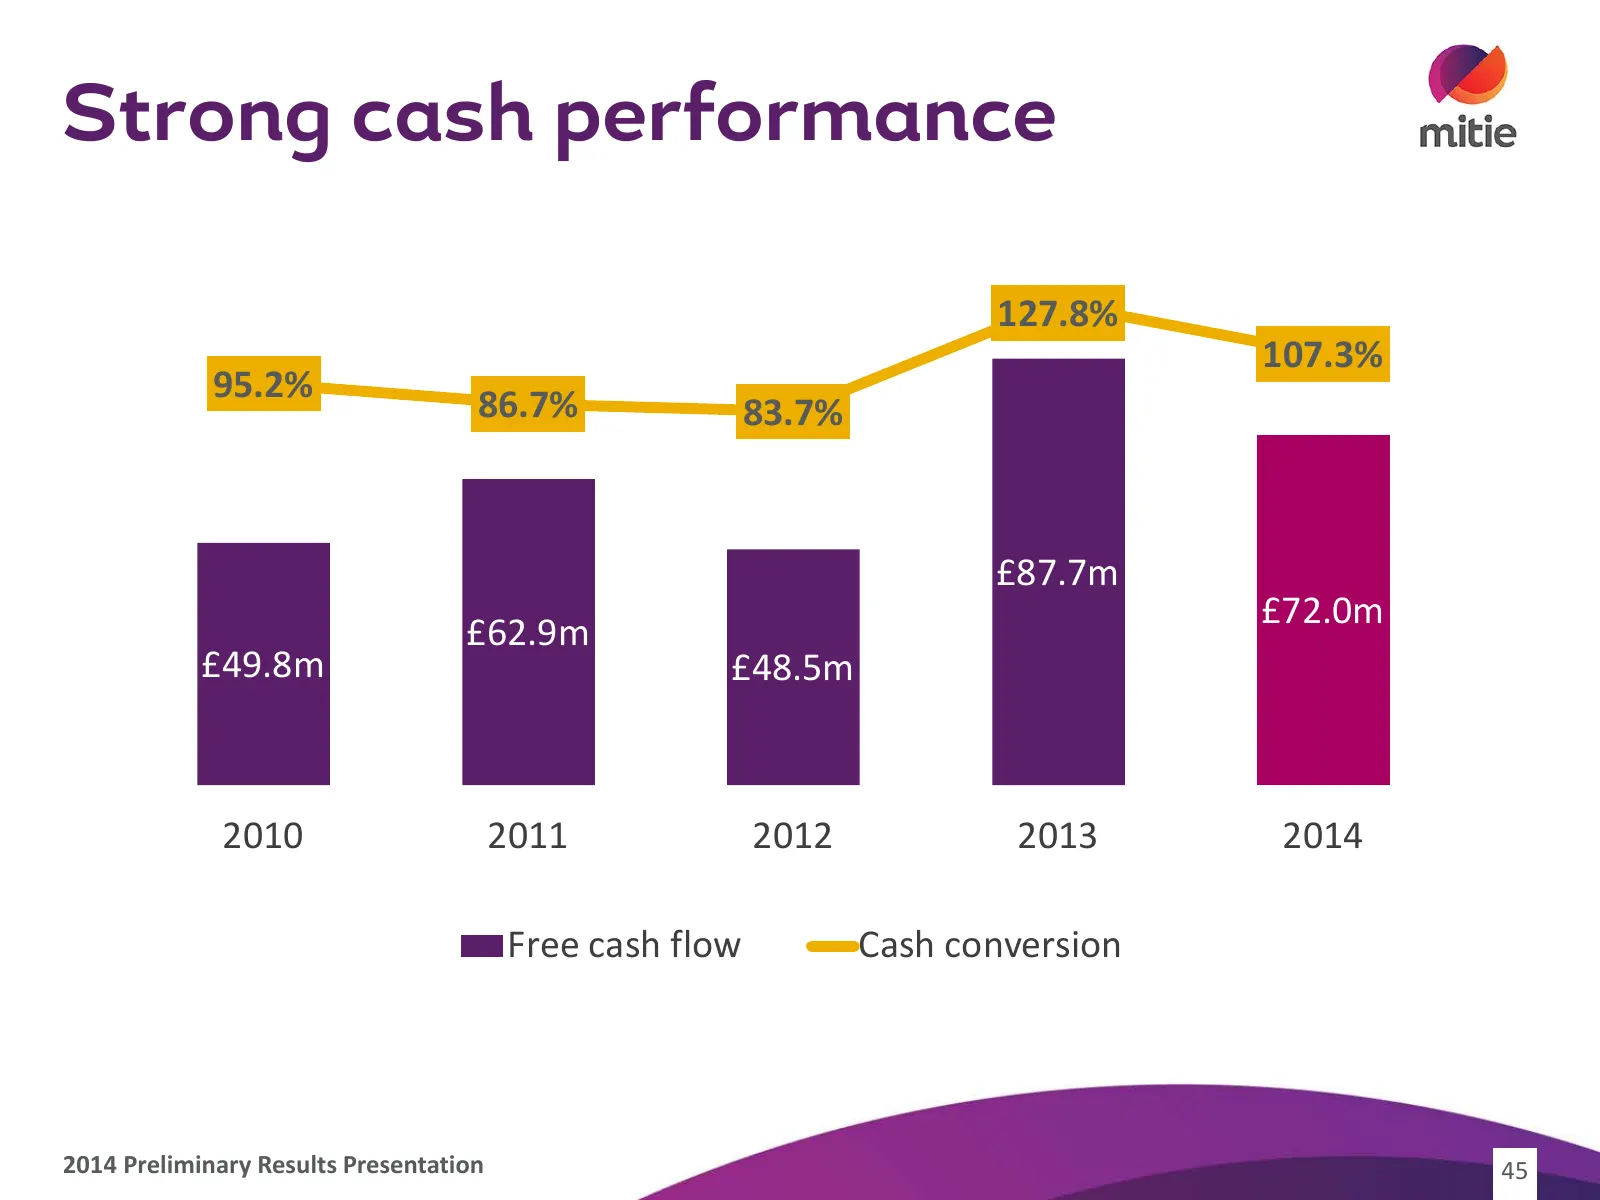
Slide 45: Strong cash performance
Strong cash performance 127.8% 100 .0 130 .0% 90.0 107.3% 110 .0% 95.2% 86.7% 83.7% 80.0 90. 0% 70.0 70. 0% 60.0 50. 0% 50.0 30. 0% £87.7m £72.0m 40.0 10. 0% 30.0 £62.9m -10.0% 20.0 £49.8m £48.5m -30.0% 10.0 -50.0% - -70.0% 2010 2011 2012 2013 2014 Free cash flow Cash conversion 2014 Preliminary Res
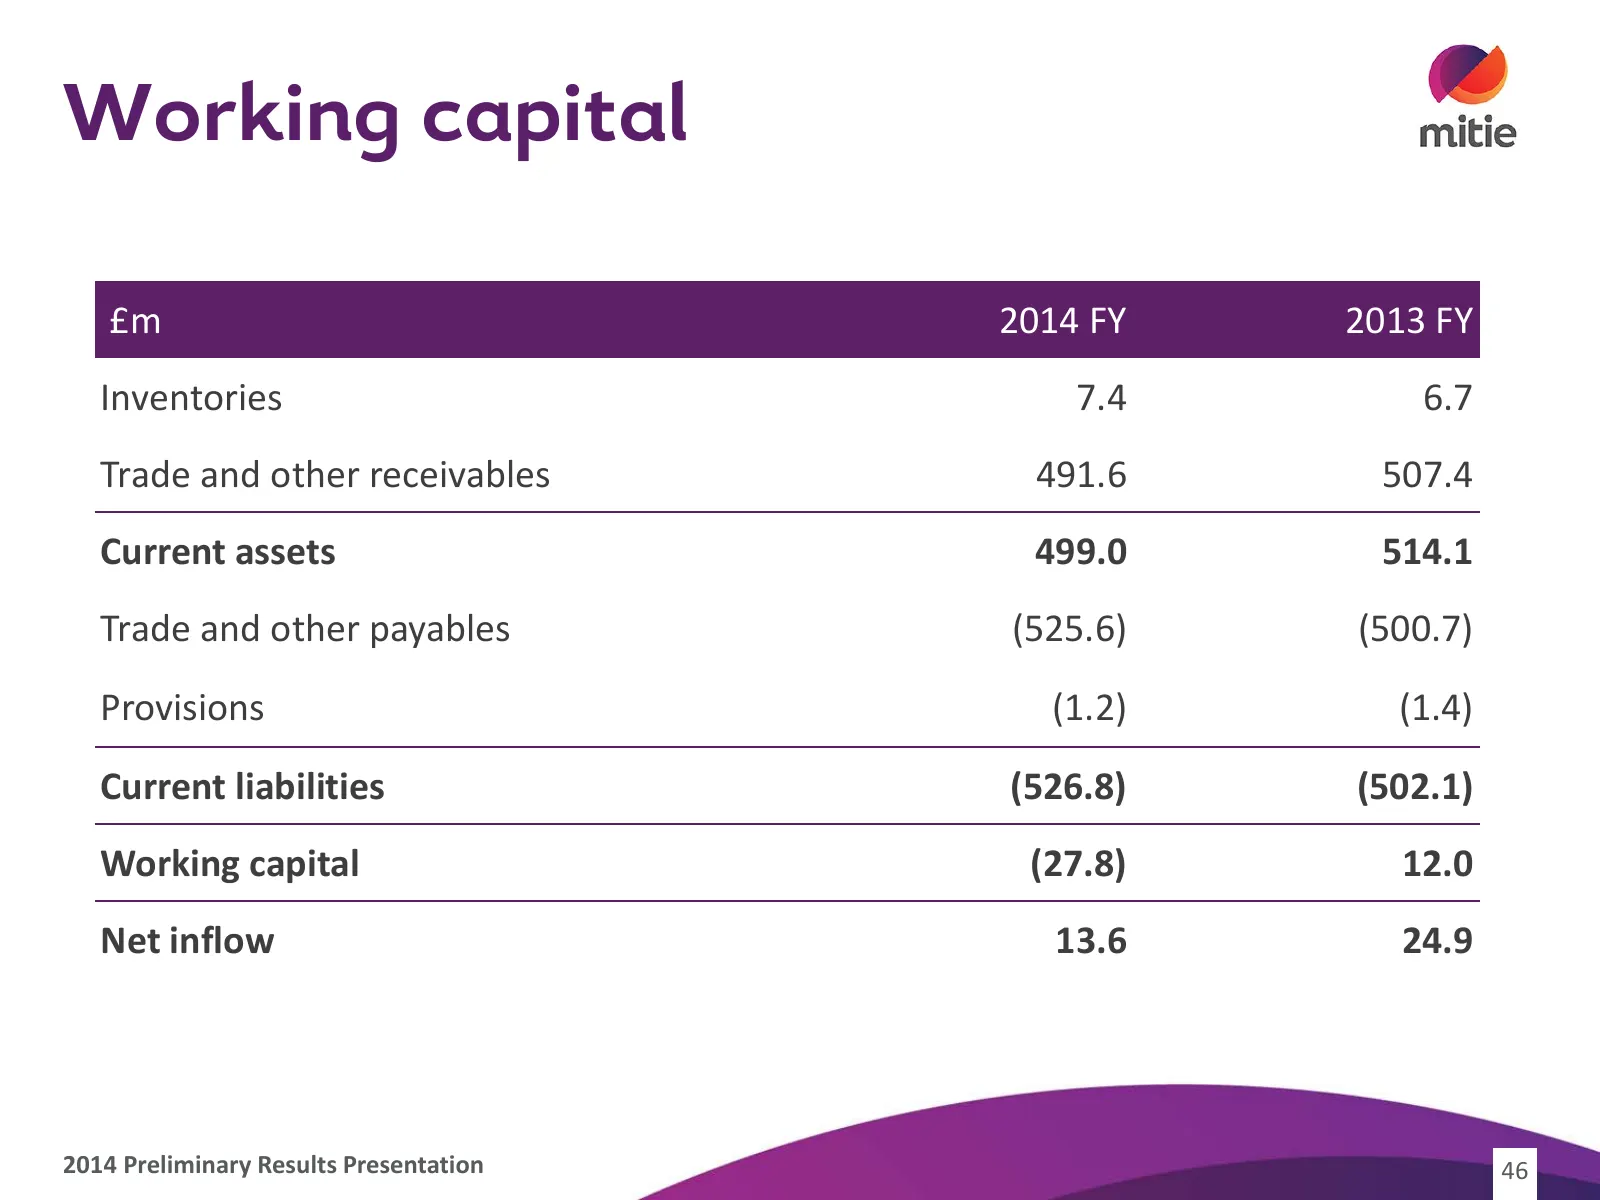
Slide 46: Working capital
Working capital £m 2014 FY 2013 FY Inventories 7.4 6.7 Trade and other receivables 491.6 507.4 Current assets 499.0 514.1 Trade and other payables (525.6) (500.7) Provisions (1.2) (1.4) Current liabilities (526.8) (502.1) Working capital (27.8) 12.0 Net inflow 13.6 24.9 2014 Preliminary Results Pres
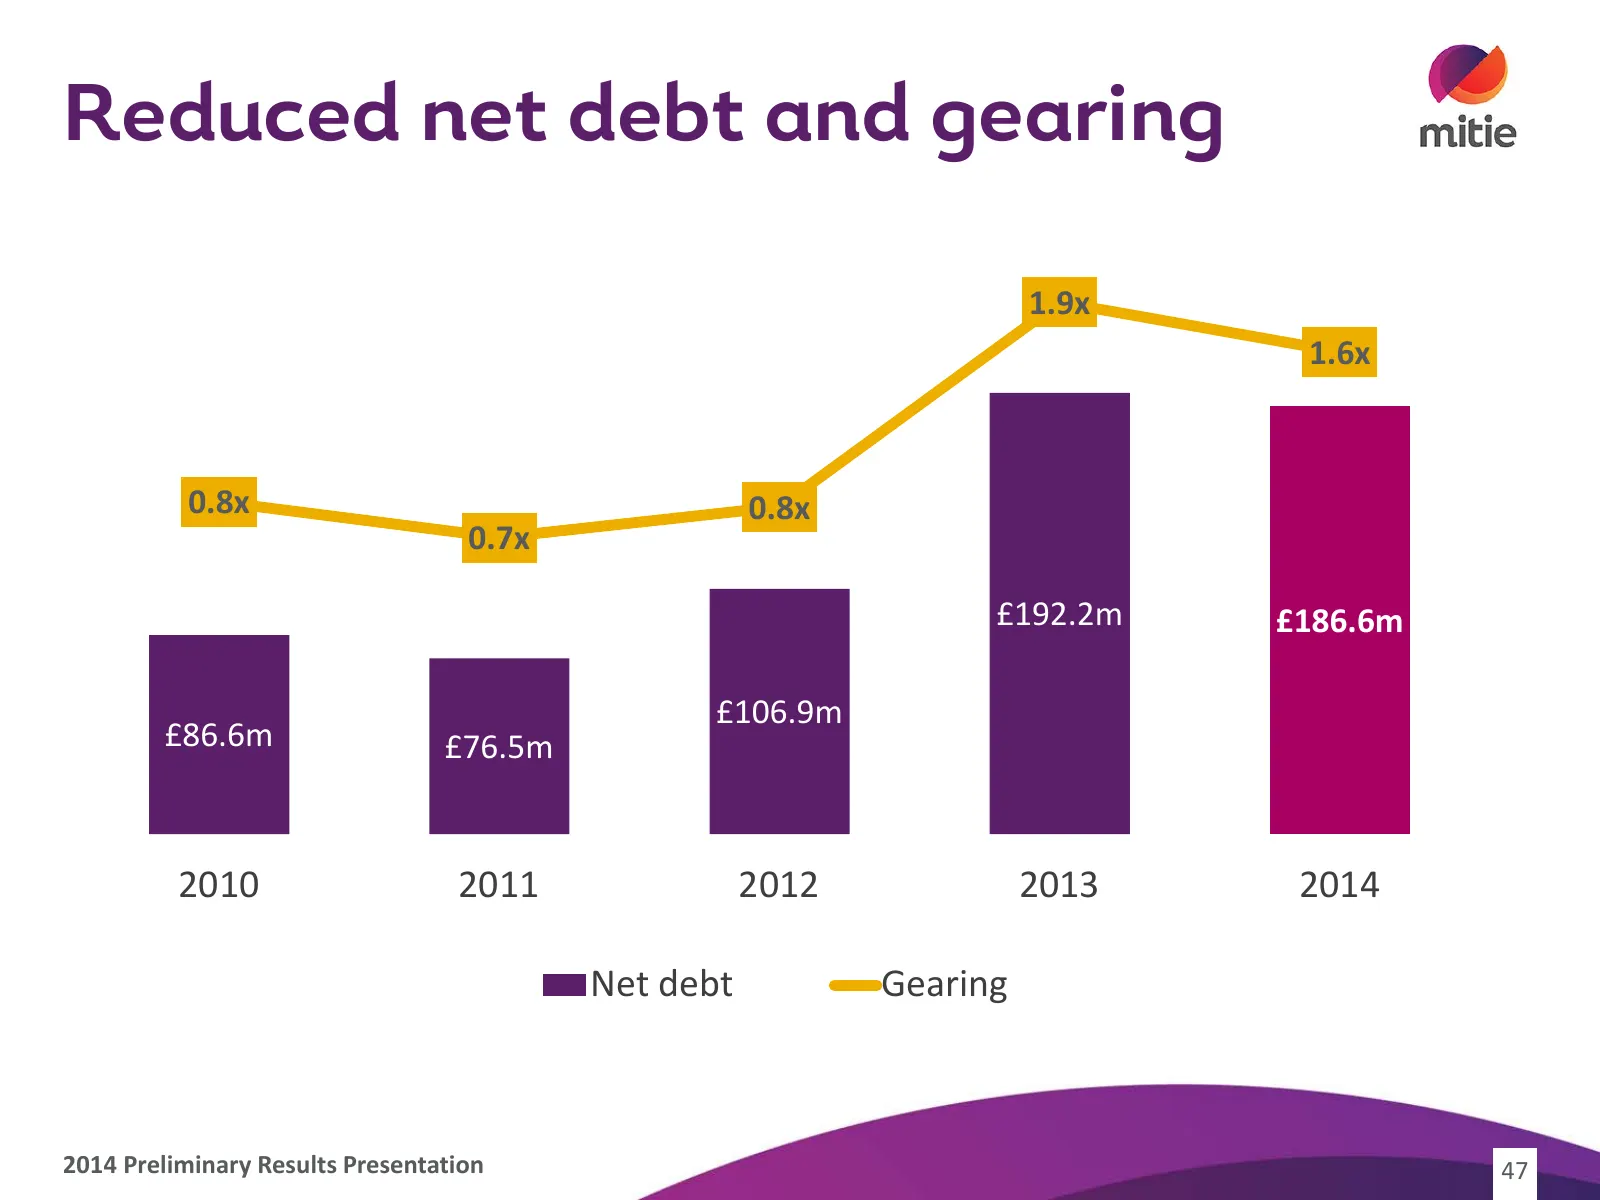
Slide 47: Reduced net debt and gearing
Reduced net debt and gearing 250 2.1 x 1.9x 200 1.6x 1.6 x 1.1 x 0.8x 0.8x 150 0.7x 0.6 x £192.2m £186.6m 100 0.1 x £106.9m £86.6m 50 £76.5m -0.4x - -0.9x 2010 2011 2012 2013 2014 Net debt Gearing 2014 Preliminary Results Presentation 47
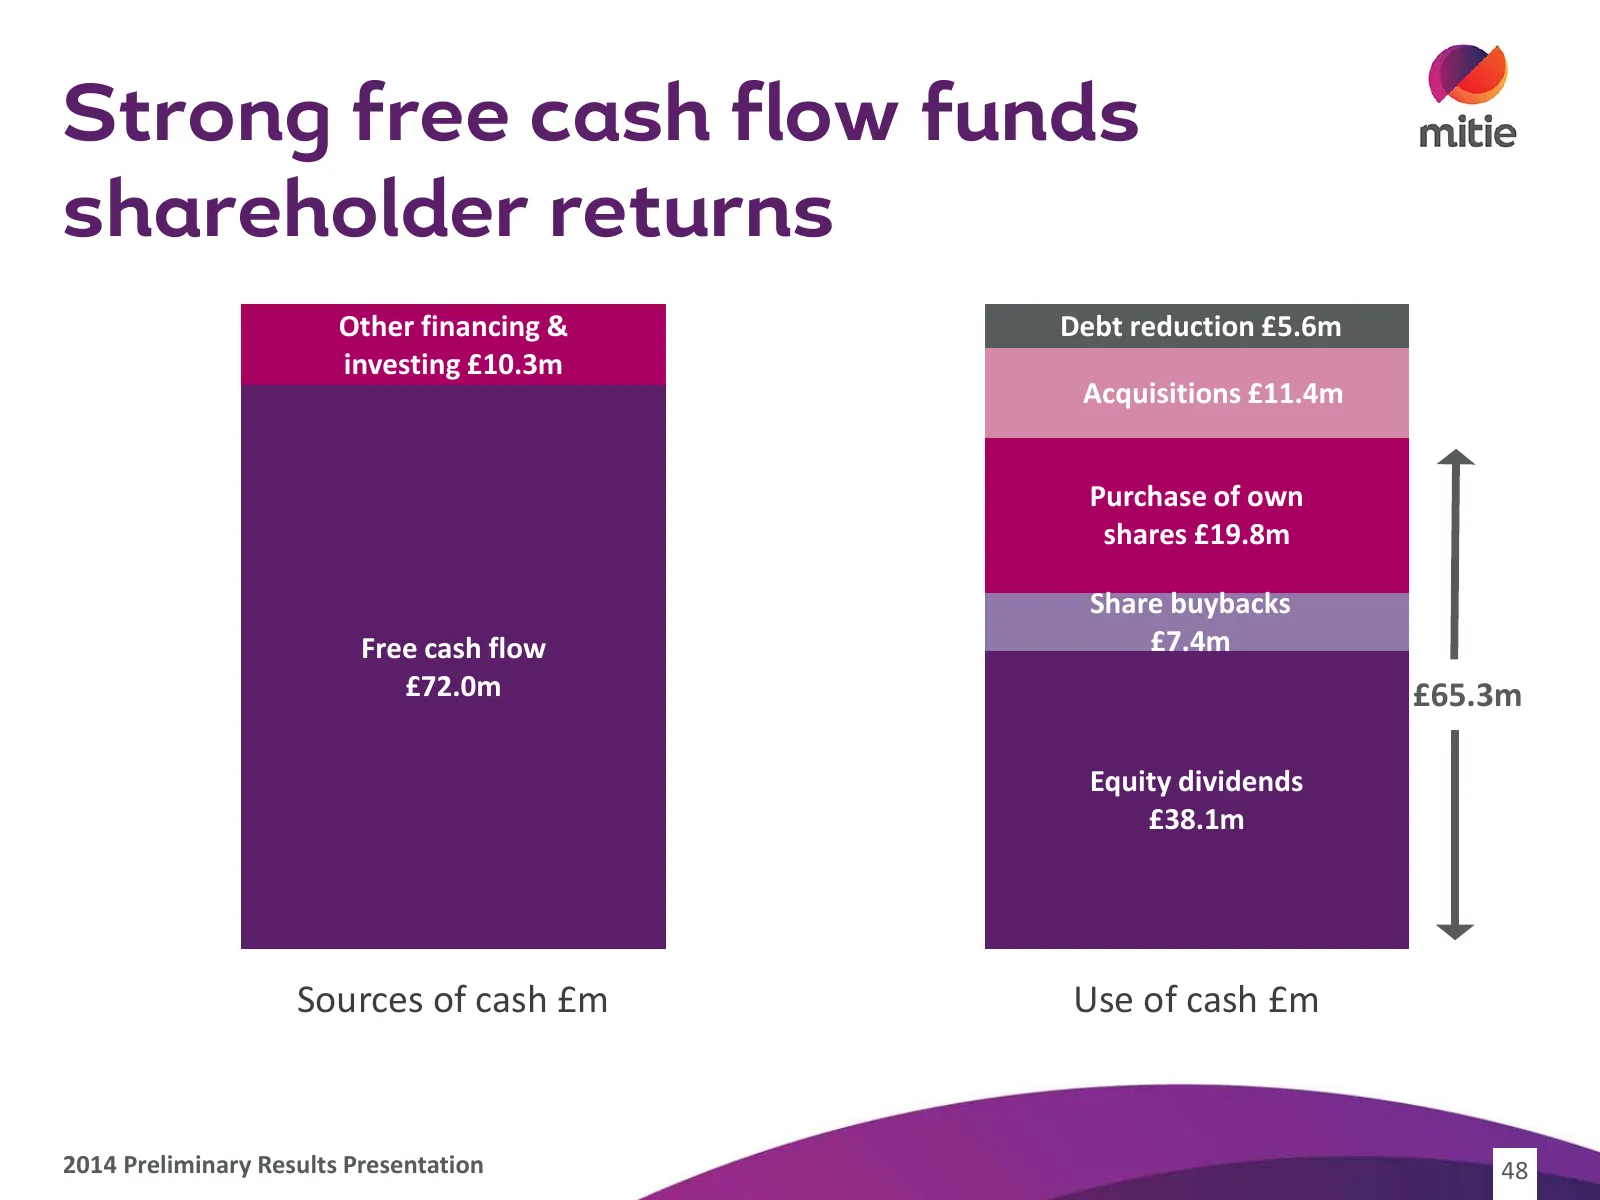
Slide 48: Strong free cash flow funds shareholder returns
Strong free cash flow funds shareholder returns Other financing & Debt reduction £5.6m investing £10.3m Acquisitions £11.4m Purchase of own shares £19.8m Share buybacks Free cash flow £7.4m £72.0m £65.3m Equity dividends £38.1m Sources of cash £m Use of cash £m 2014 Preliminary Results Presentation
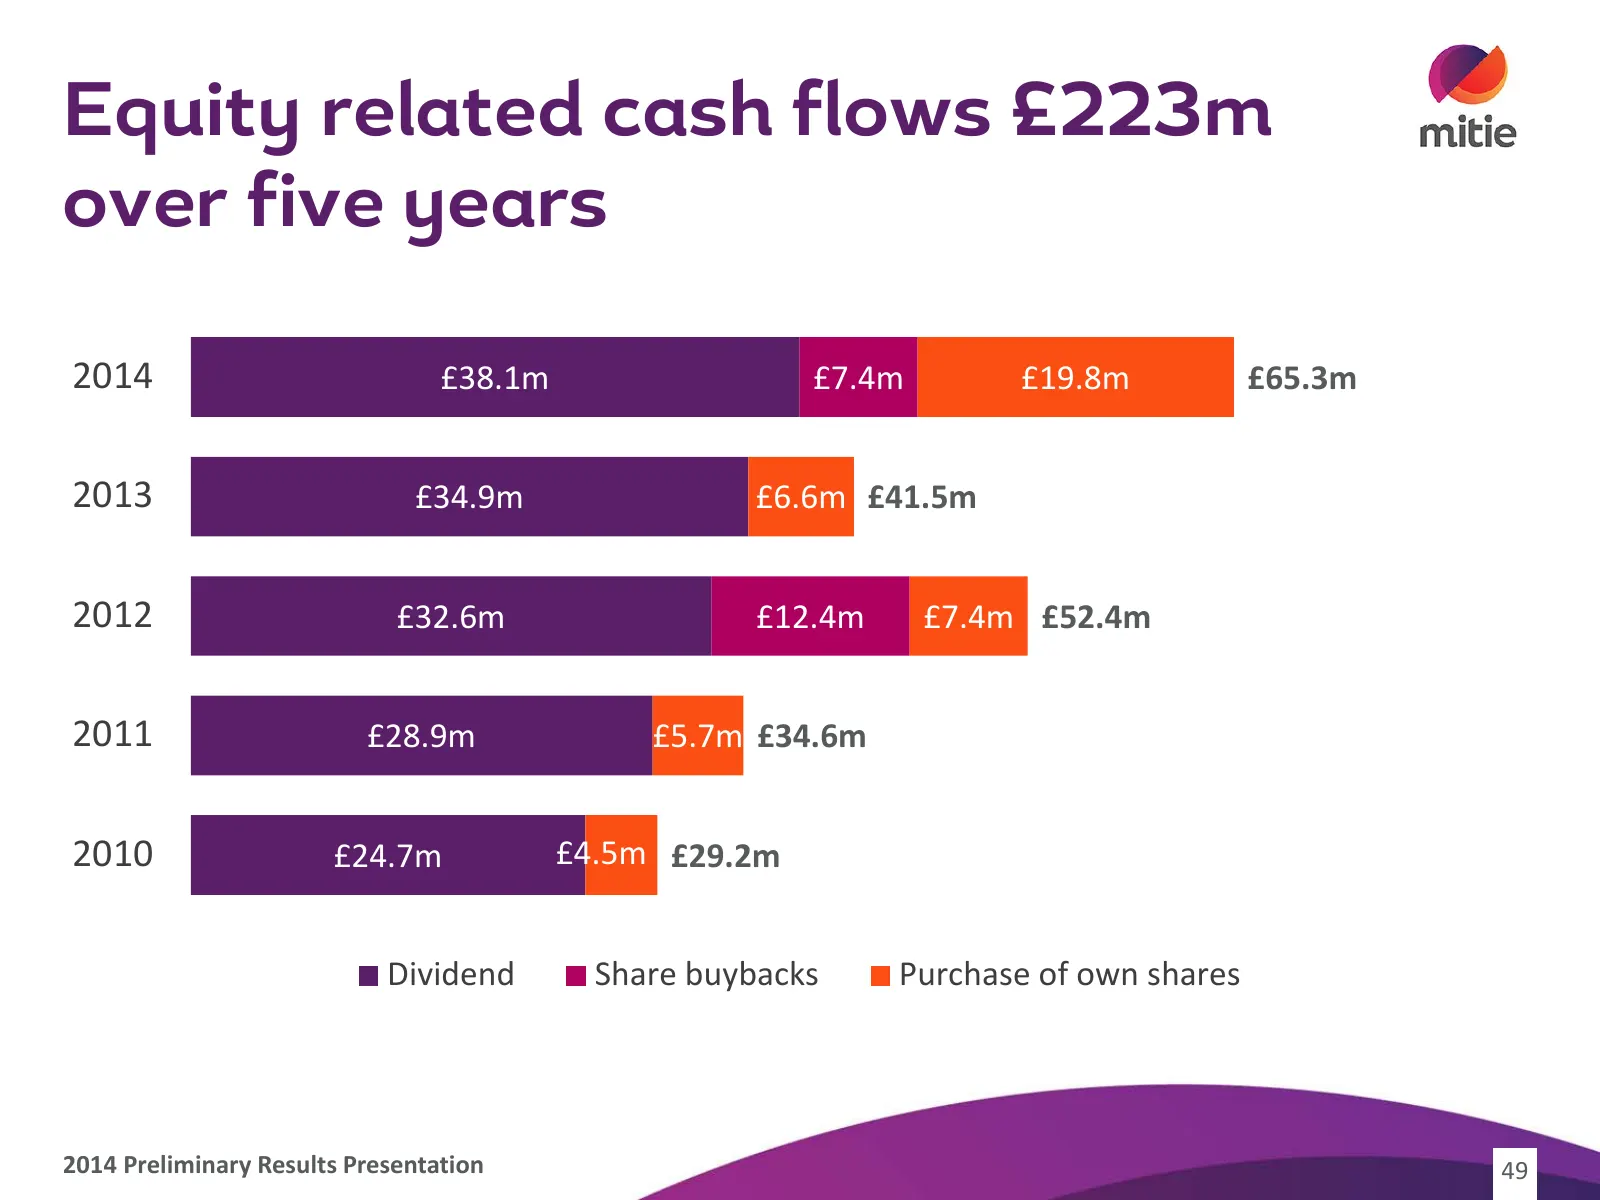
Slide 49: Equity related cash flows £223m over five years
Equity related cash flows £223m over five years 2014 £38.1m £7.4m £19.8m £65.3m 2013 £34.9m £6.6m £41.5m 2012 £32.6m £12.4m £7.4m £52.4m 2011 £28.9m £5.7m £34.6m 2010 £24.7m £4.5m £29.2m Dividend Share buybacks Purchase of own shares 2014 Preliminary Results Presentation 49
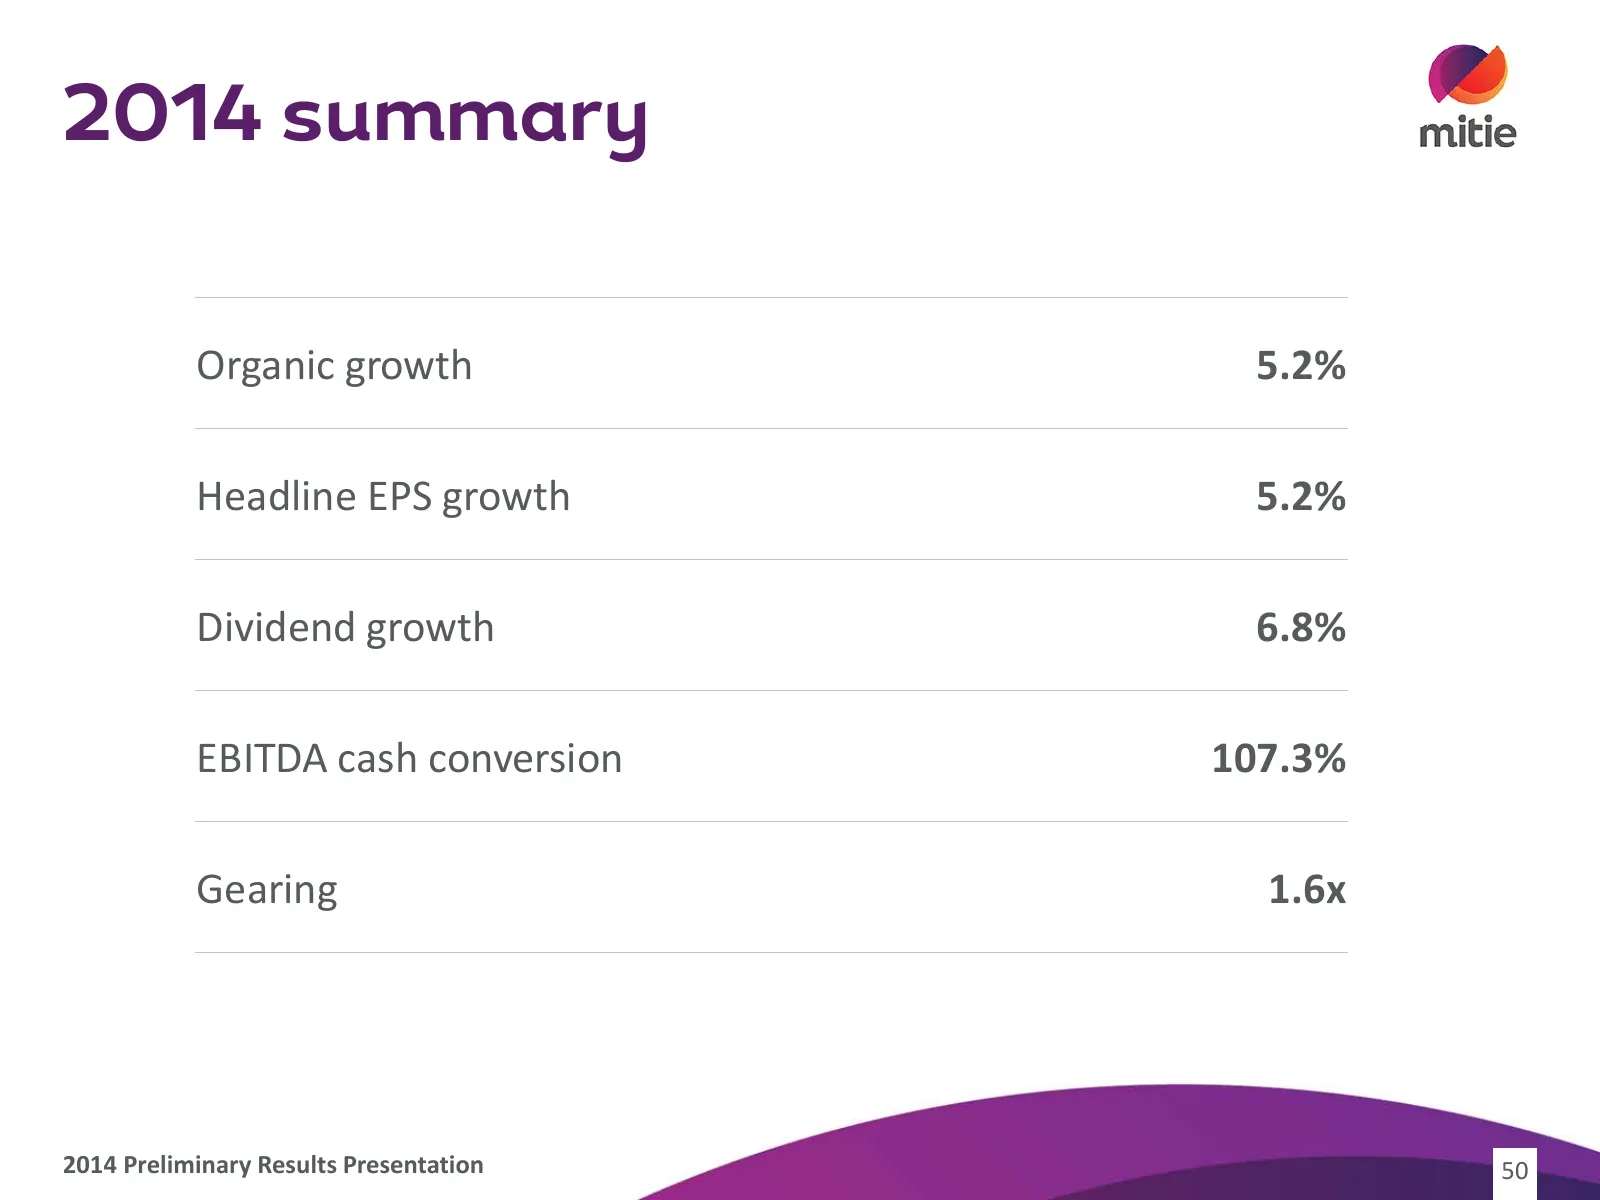
Slide 50: 2014 summary
2014 summary Organic growth 5.2% Headline EPS growth 5.2% Dividend growth 6.8% EBITDA cash conversion 107.3% Gearing 1.6x 2014 Preliminary Results Presentation 50
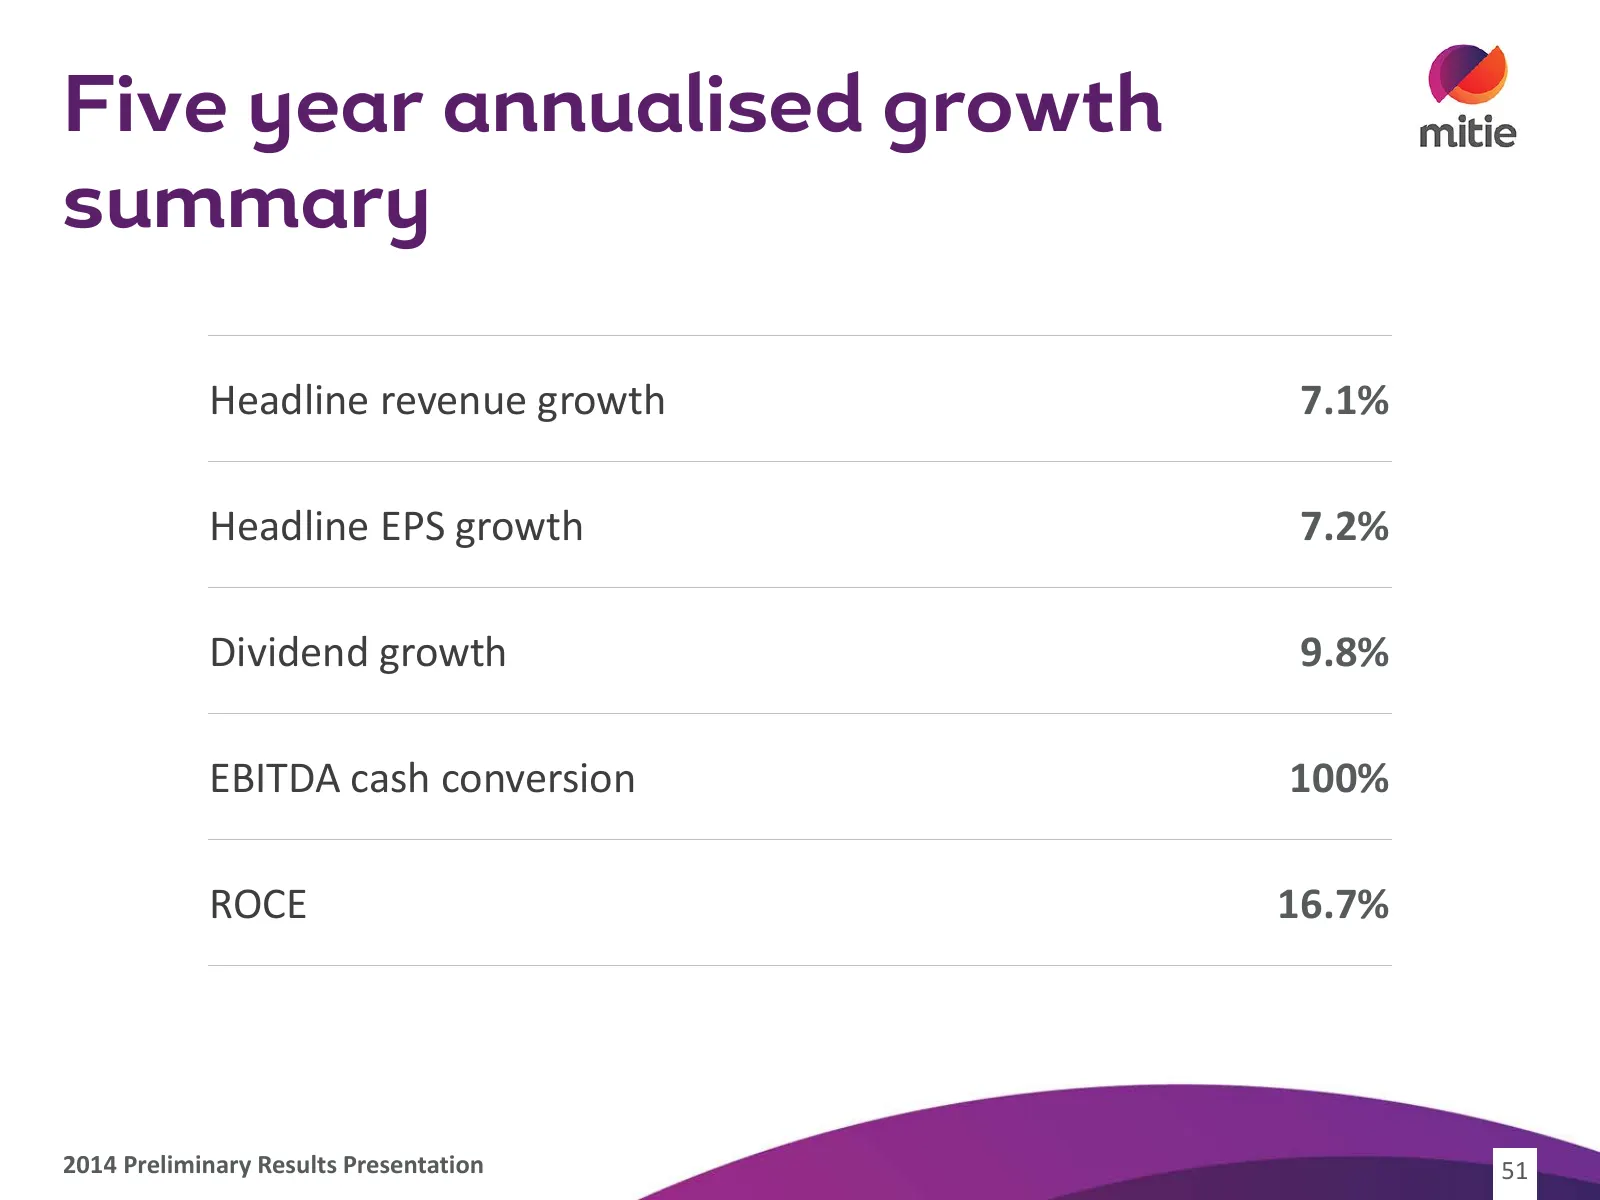
Slide 51: Five year annualised growth summary
Five year annualised growth summary Headline revenue growth 7.1% Headline EPS growth 7.2% Dividend growth 9.8% EBITDA cash conversion 100% ROCE 16.7% 2014 Preliminary Results Presentation 51
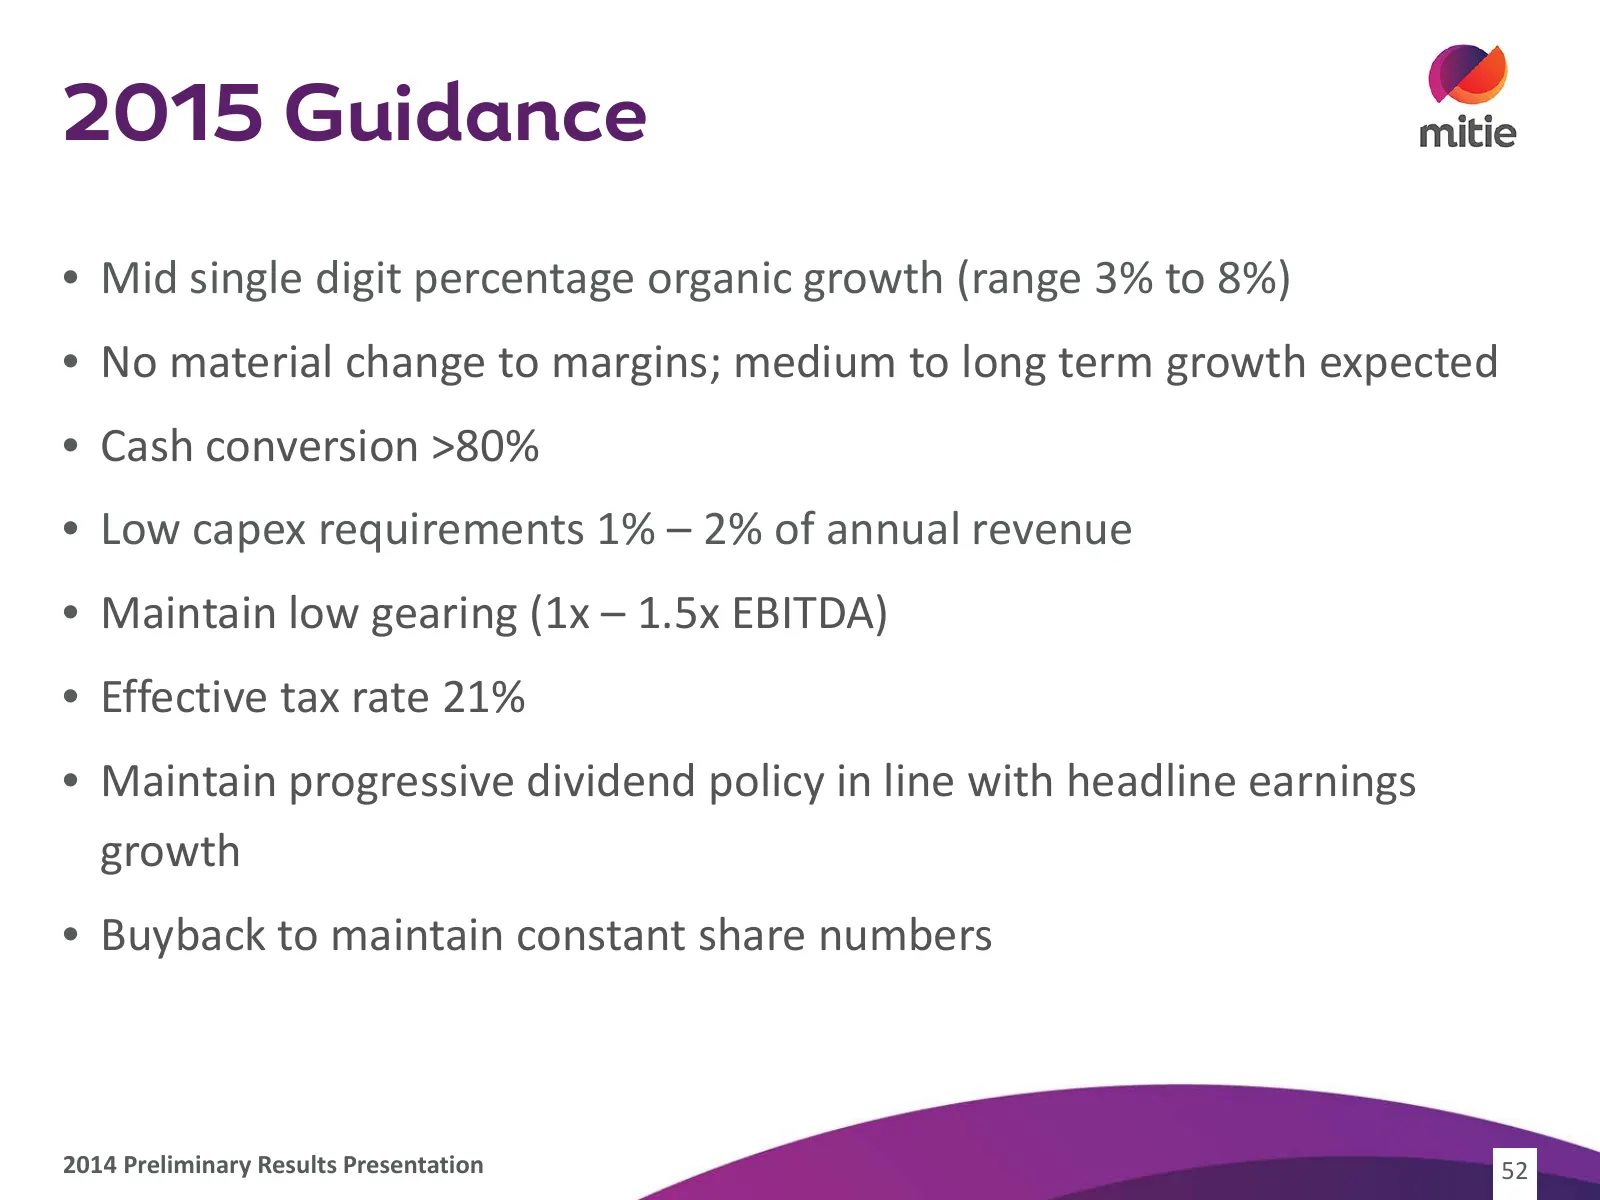
Slide 52: 2015 Guidance
2015 Guidance • Mid single digit percentage organic growth (range 3% to 8%) • No material change to margins; medium to long term growth expected • Cash conversion >80% • Low capex requirements 1% – 2% of annual revenue • Maintain low gearing (1x – 1.5x EBITDA) • Effective tax rate 21% • Maintain pro
Slide 53: Ruby McGregor-Smith CBE, Chief Executive
Ruby McGregor-Smith CBE Chief Executive 53
Slide 54: Highlights
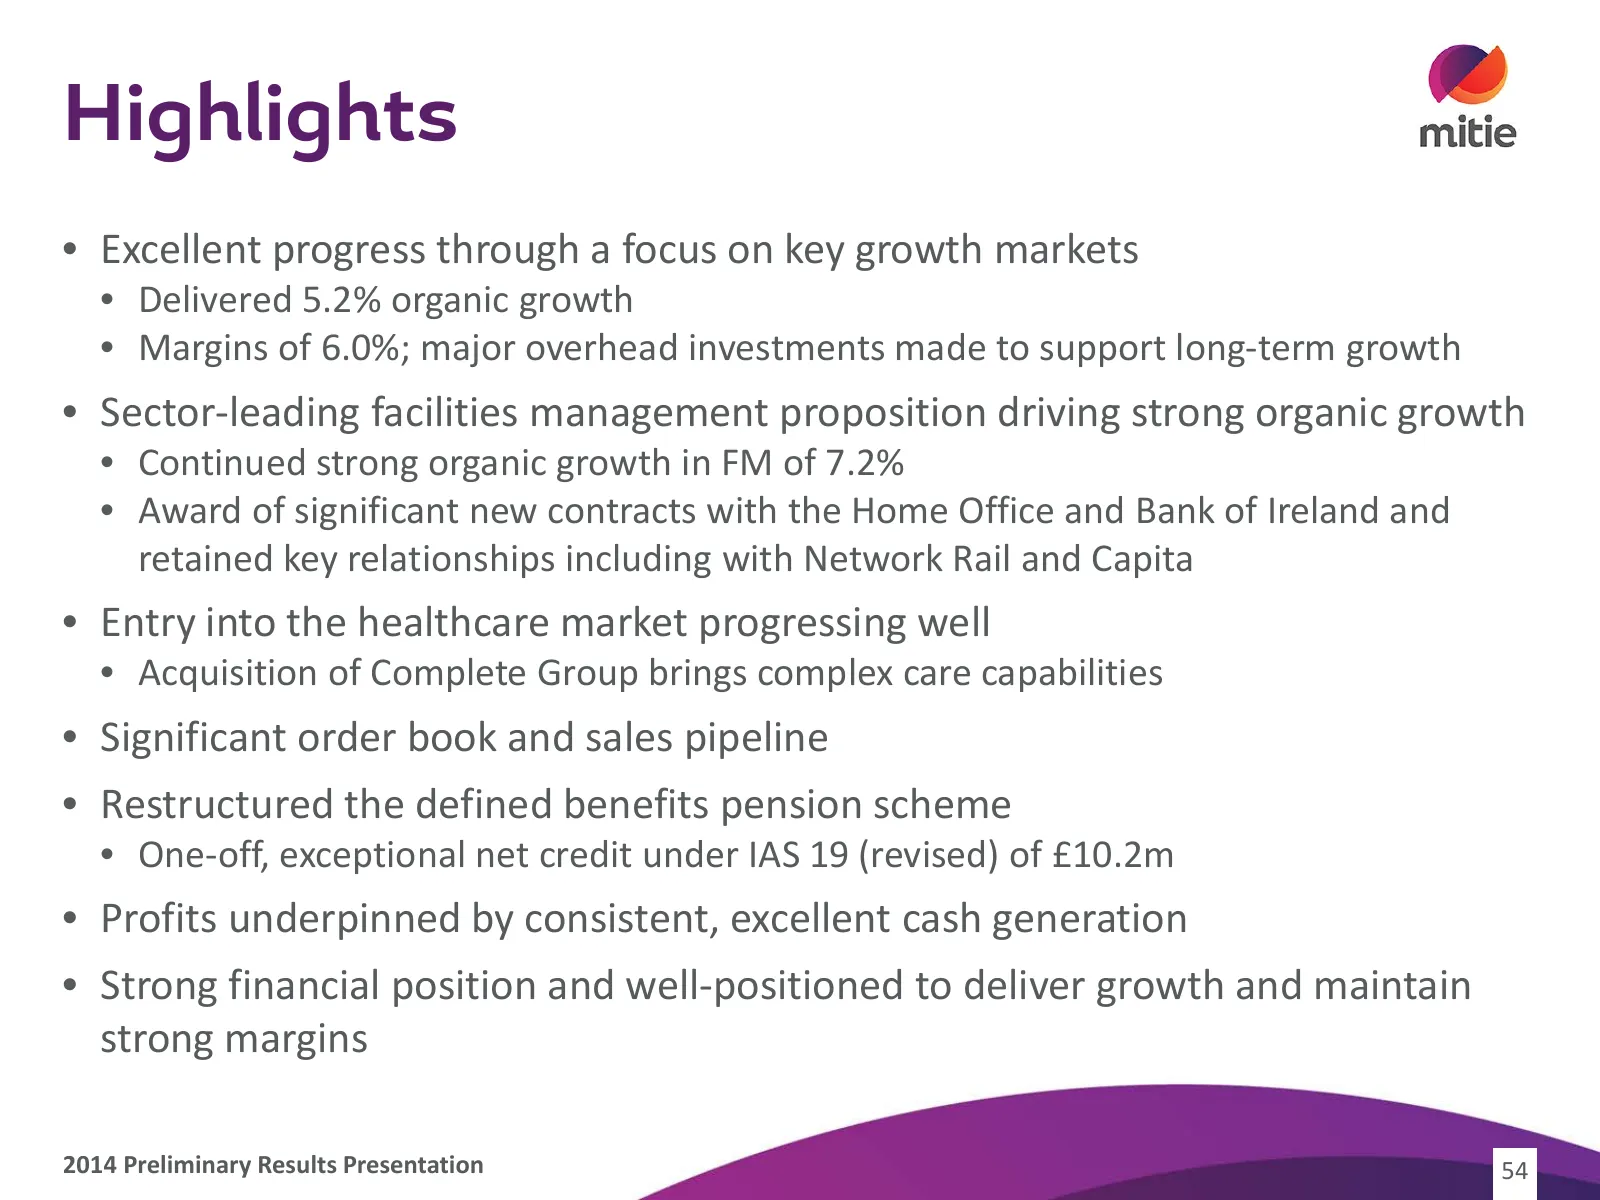
Highlights • Excellent progress through a focus on key growth markets • Delivered 5.2% organic growth • Margins of 6.0%; major overhead investments made to support long-term growth • Sector-leading facilities management proposition driving strong organic growth • Continued strong organic growth in F
Slide 55: Outlook
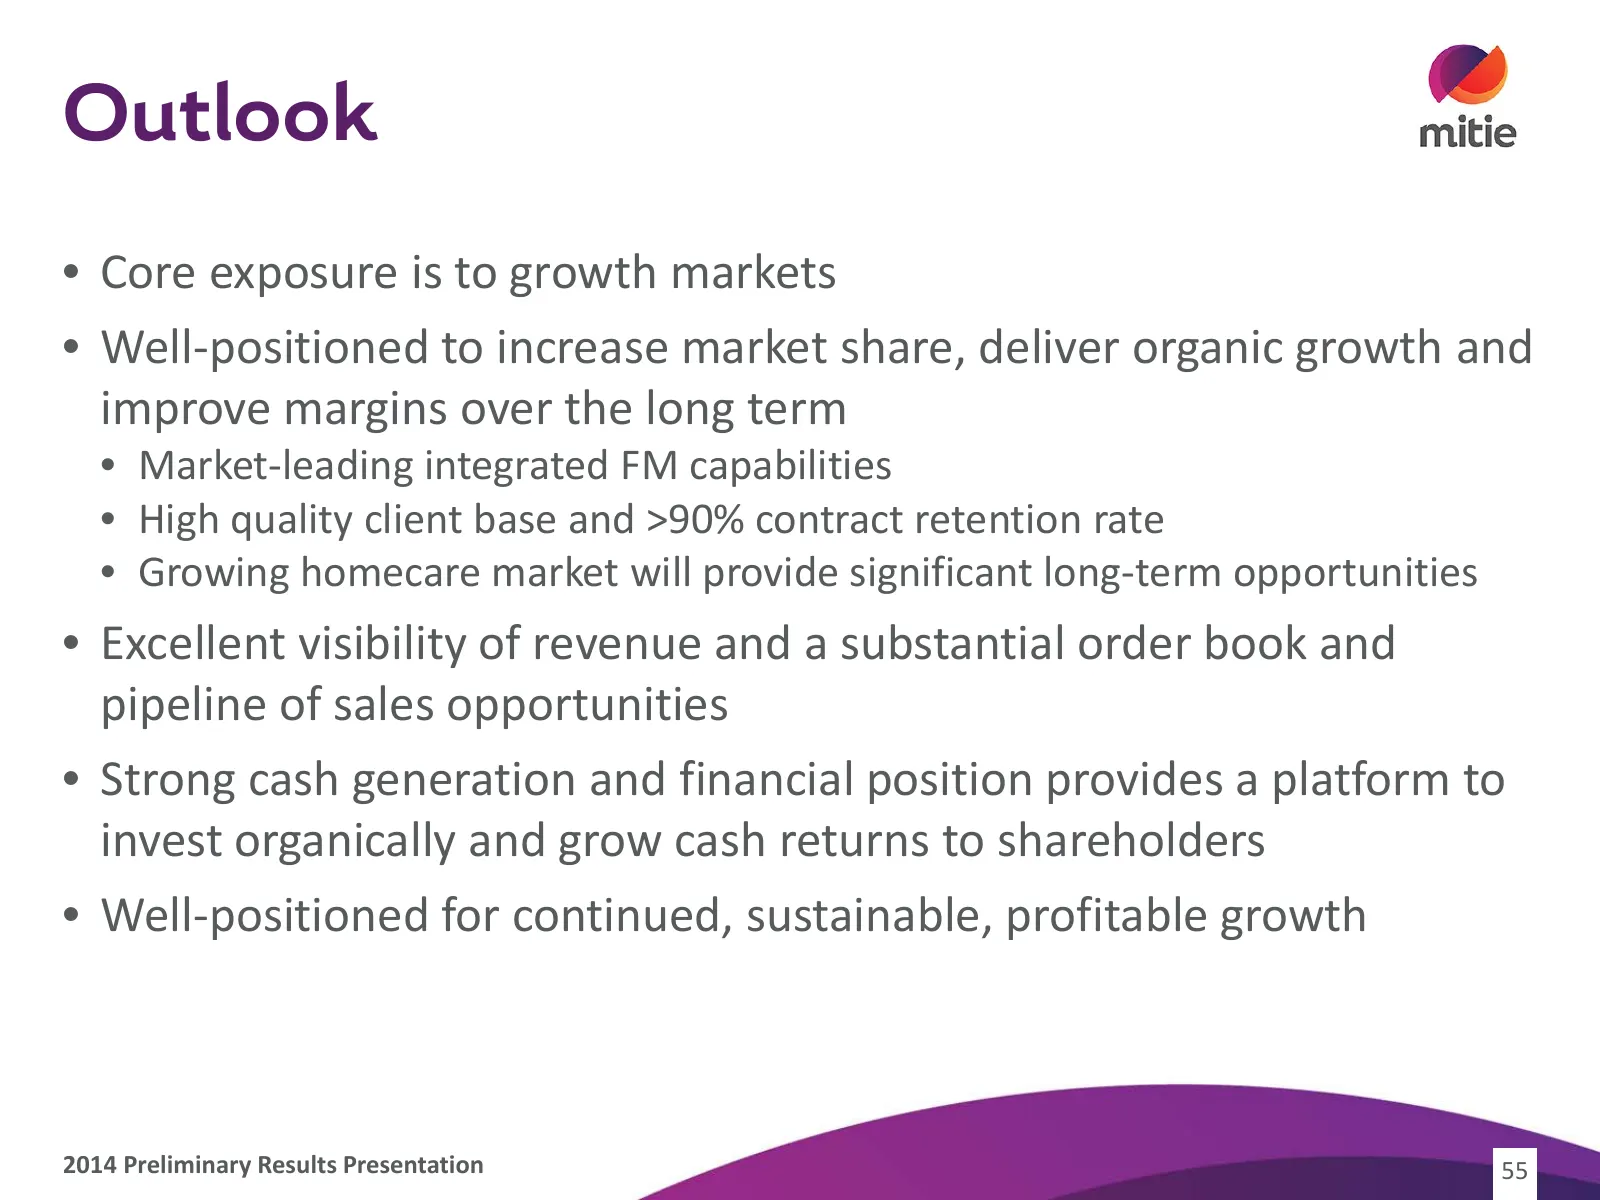
Outlook • Core exposure is to growth markets • Well-positioned to increase market share, deliver organic growth and improve margins over the long term • Market-leading integrated FM capabilities • High quality client base and >90% contract retention rate • Growing homecare market will provide signif

Slide 56: Appendix
Appendix 56
Slide 57: Segment reconciliation 2014 revenue
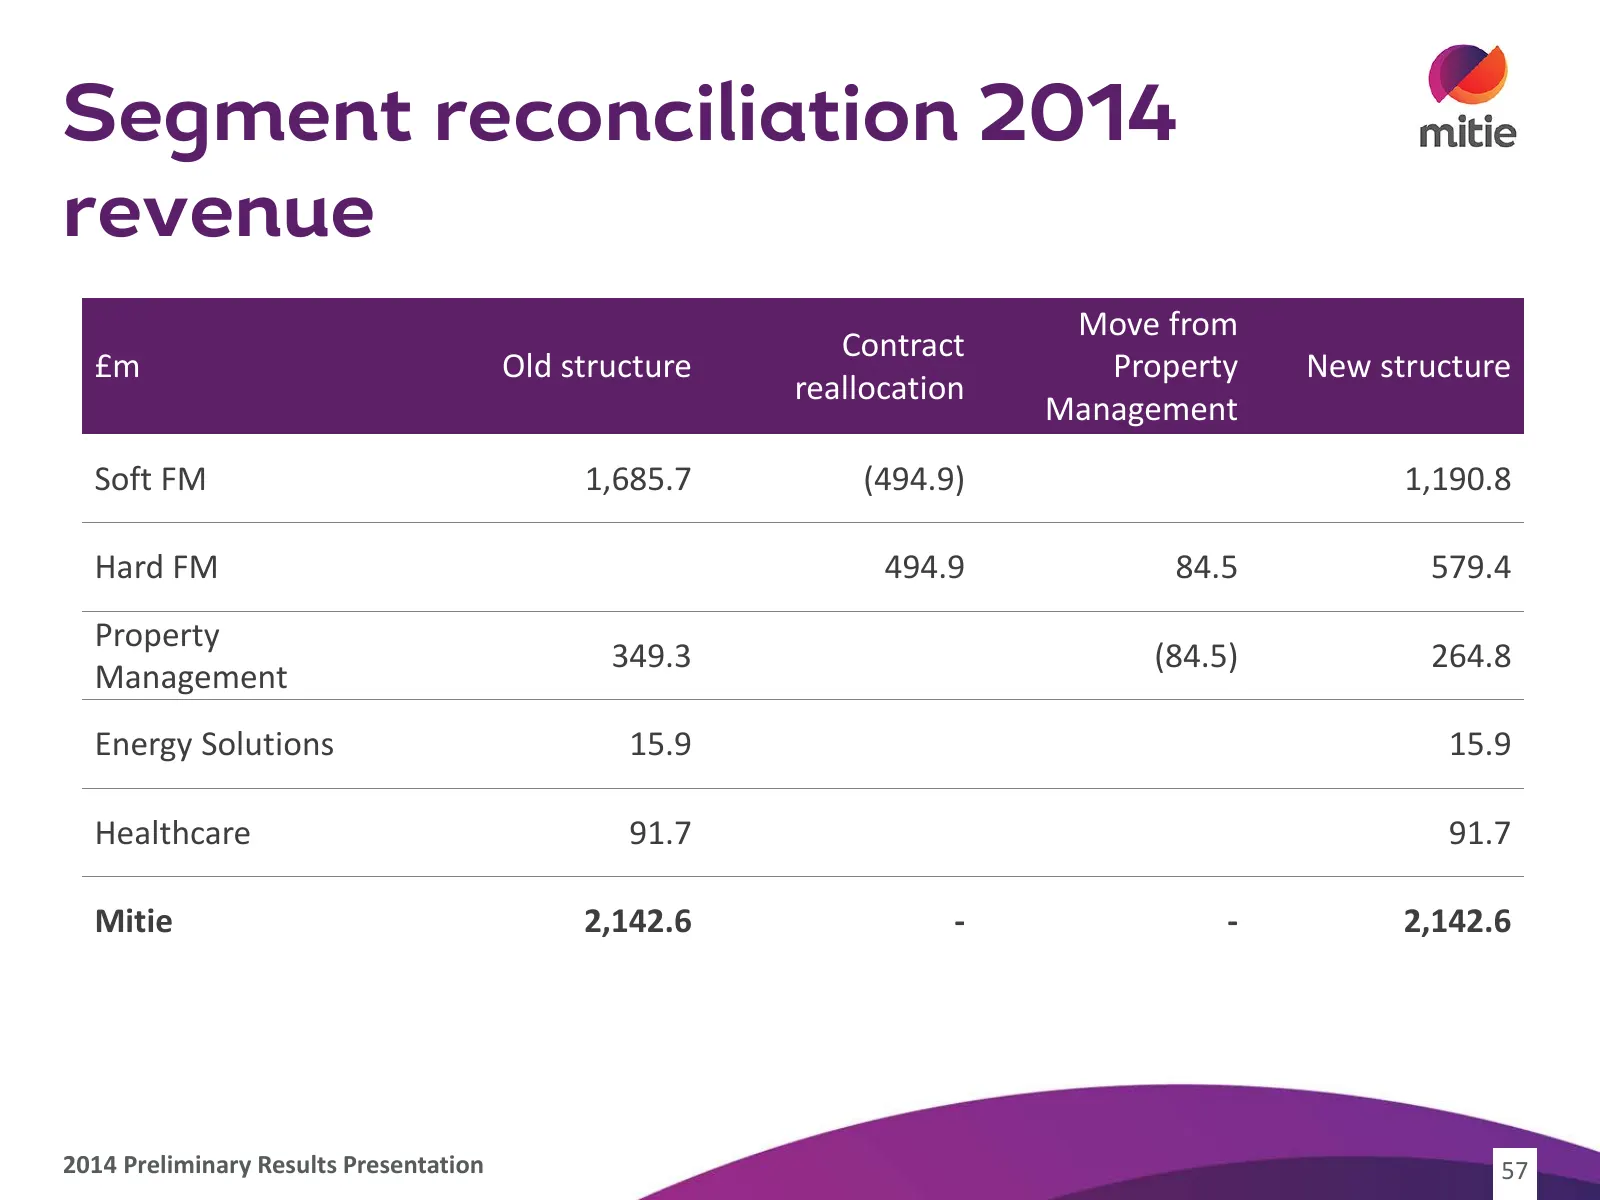
Segment reconciliation 2014 revenue Move from Contract £m Old structure Property New structure reallocation Management Soft FM 1,685.7 (494.9) 1,190.8 Hard FM 494.9 84.5 579.4 Property 349.3 (84.5) 264.8 Management Energy Solutions 15.9 15.9 Healthcare 91.7 91.7 Mitie 2,142.6 - - 2,142.6 2014 Prelim
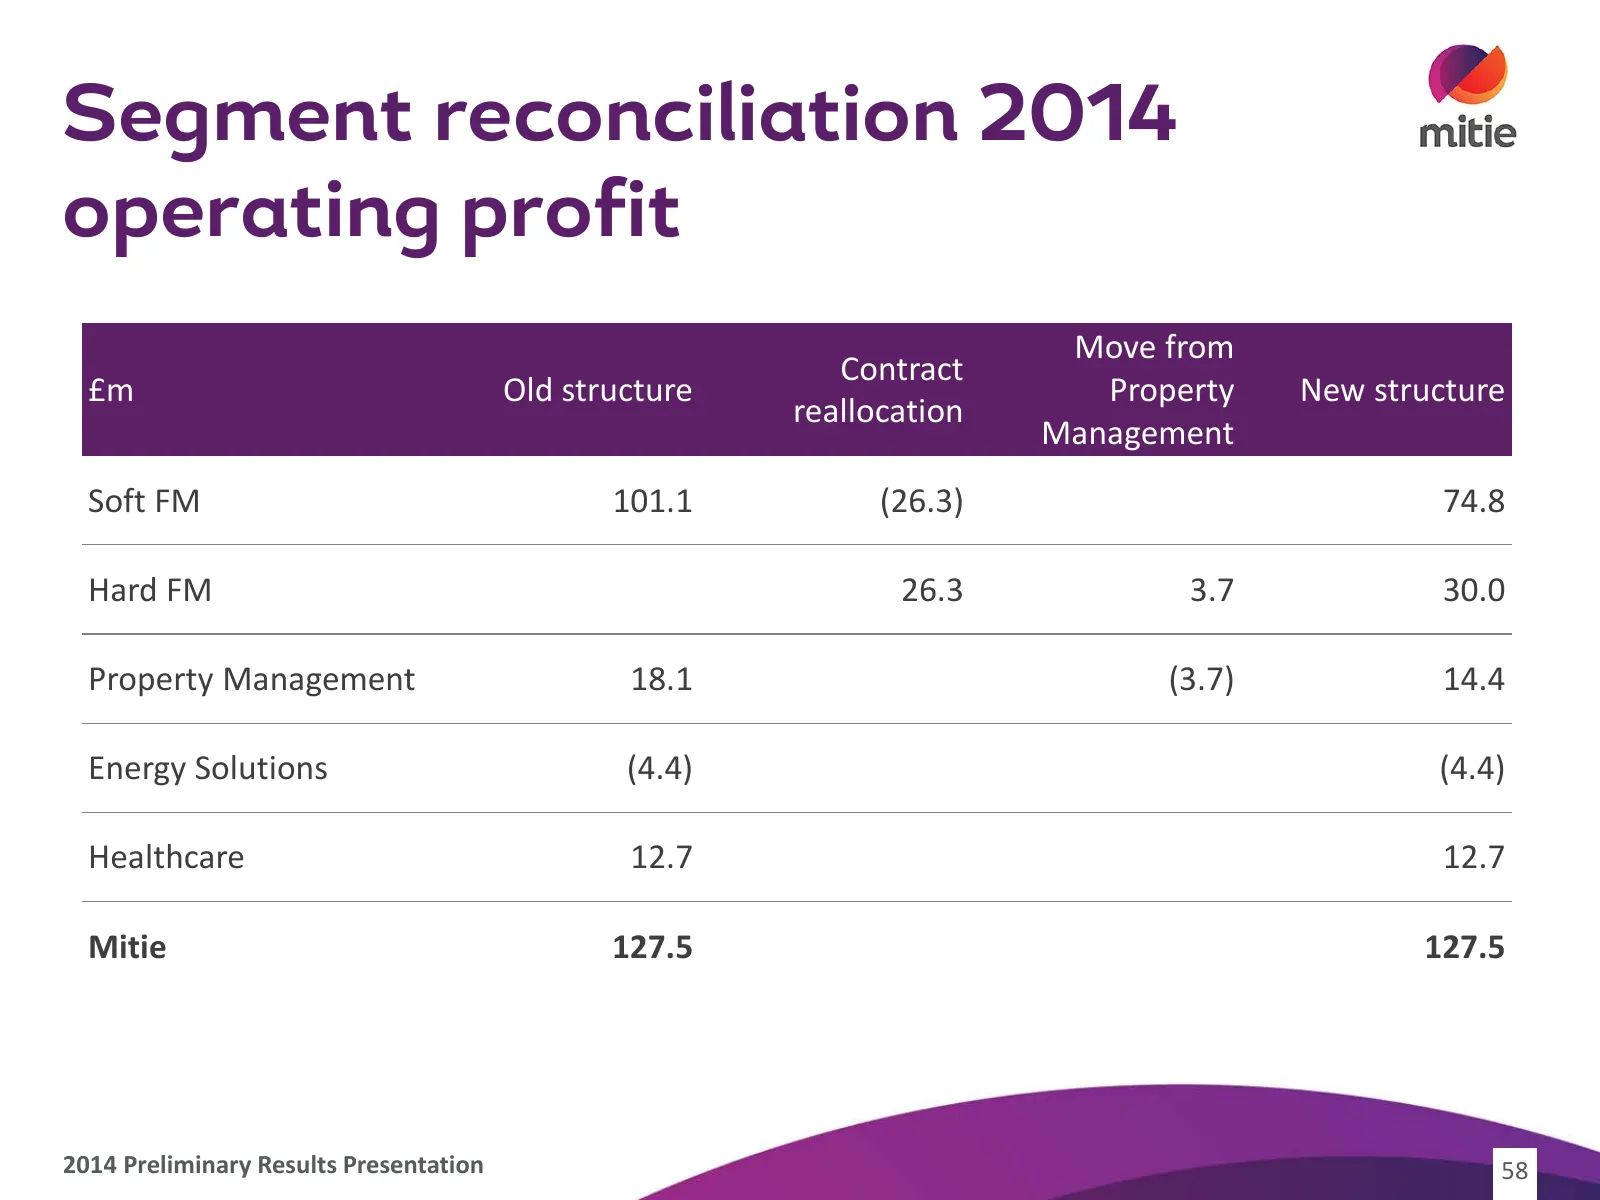
Slide 58: Segment reconciliation 2014 operating profit
Segment reconciliation 2014 operating profit Move from Contract £m Old structure Property New structure reallocation Management Soft FM 101.1 (26.3) 74.8 Hard FM 26.3 3.7 30.0 Property Management 18.1 (3.7) 14.4 Energy Solutions (4.4) (4.4) Healthcare 12.7 12.7 Mitie 127.5 127.5 2014 Preliminary Res
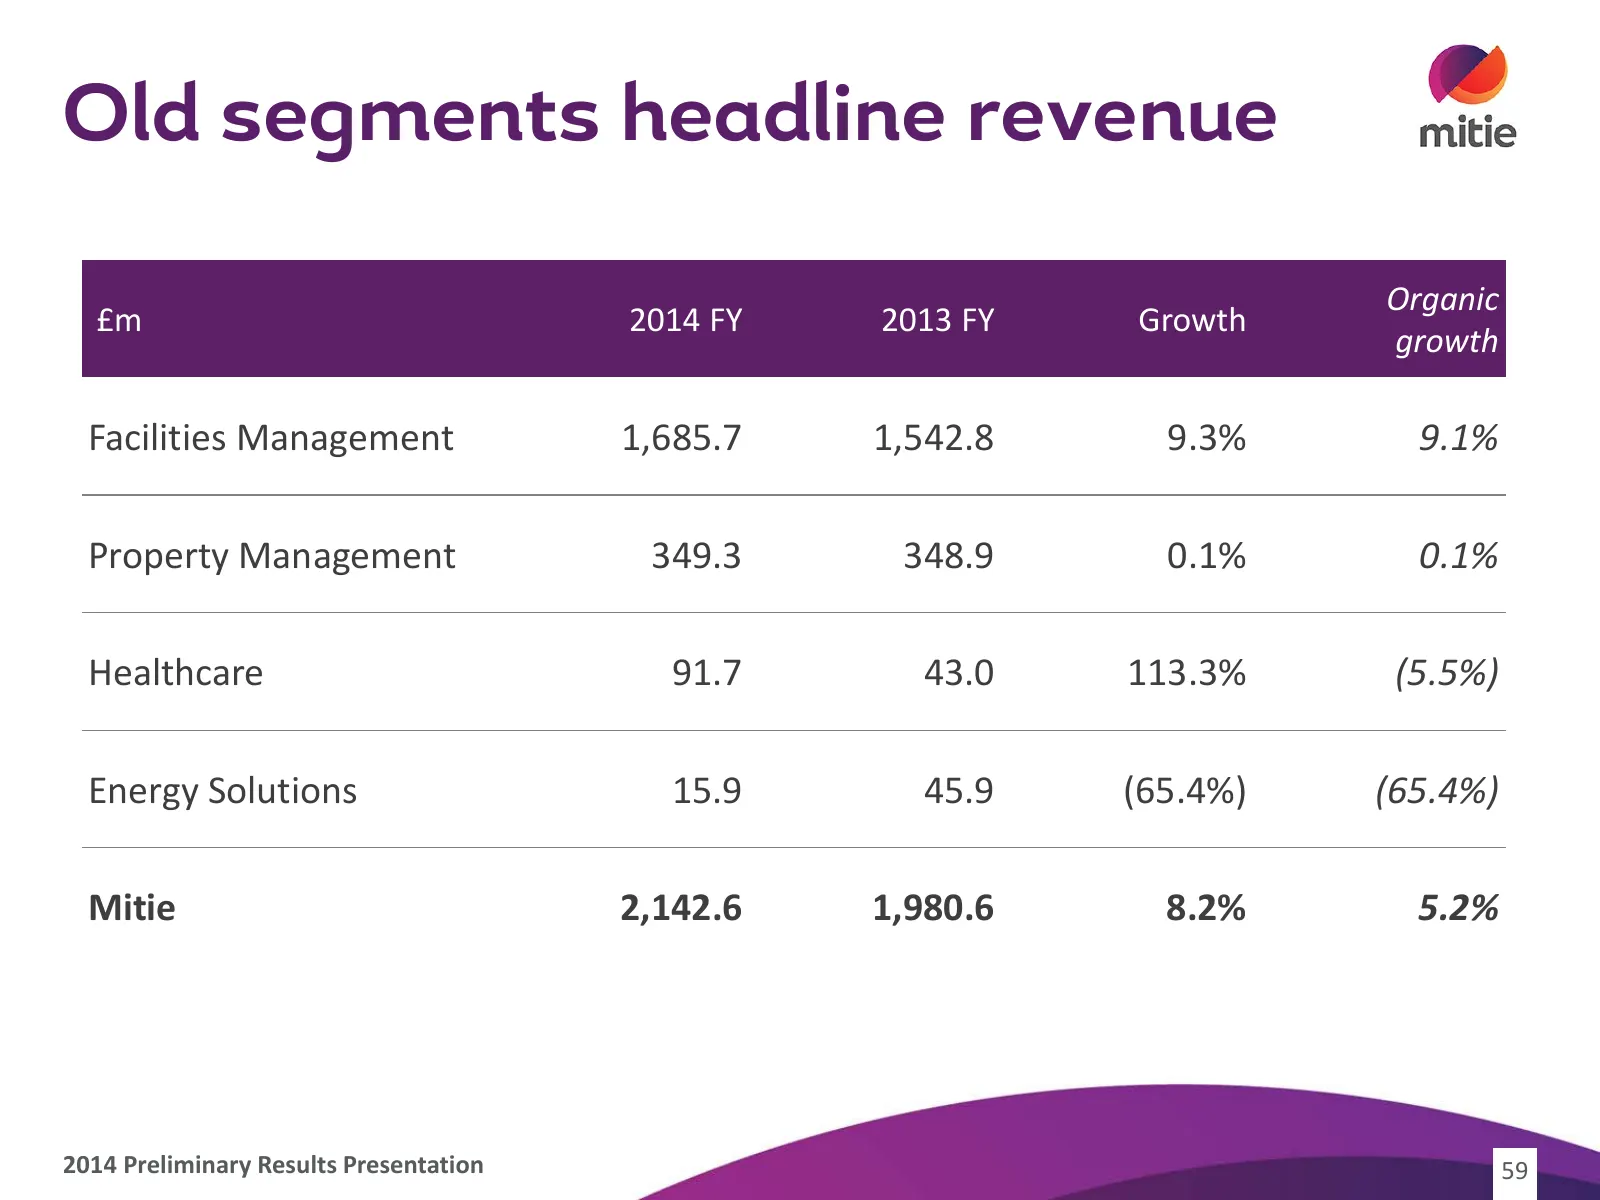
Slide 59: Old segments headline revenue
Old segments headline revenue Organic £m 2014 FY 2013 FY Growth growth Facilities Management 1,685.7 1,542.8 9.3% 9.1% Property Management 349.3 348.9 0.1% 0.1% Healthcare 91.7 43.0 113.3% (5.5%) Energy Solutions 15.9 45.9 (65.4%) (65.4%) Mitie 2,142.6 1,980.6 8.2% 5.2% 2014 Preliminary Results Pres
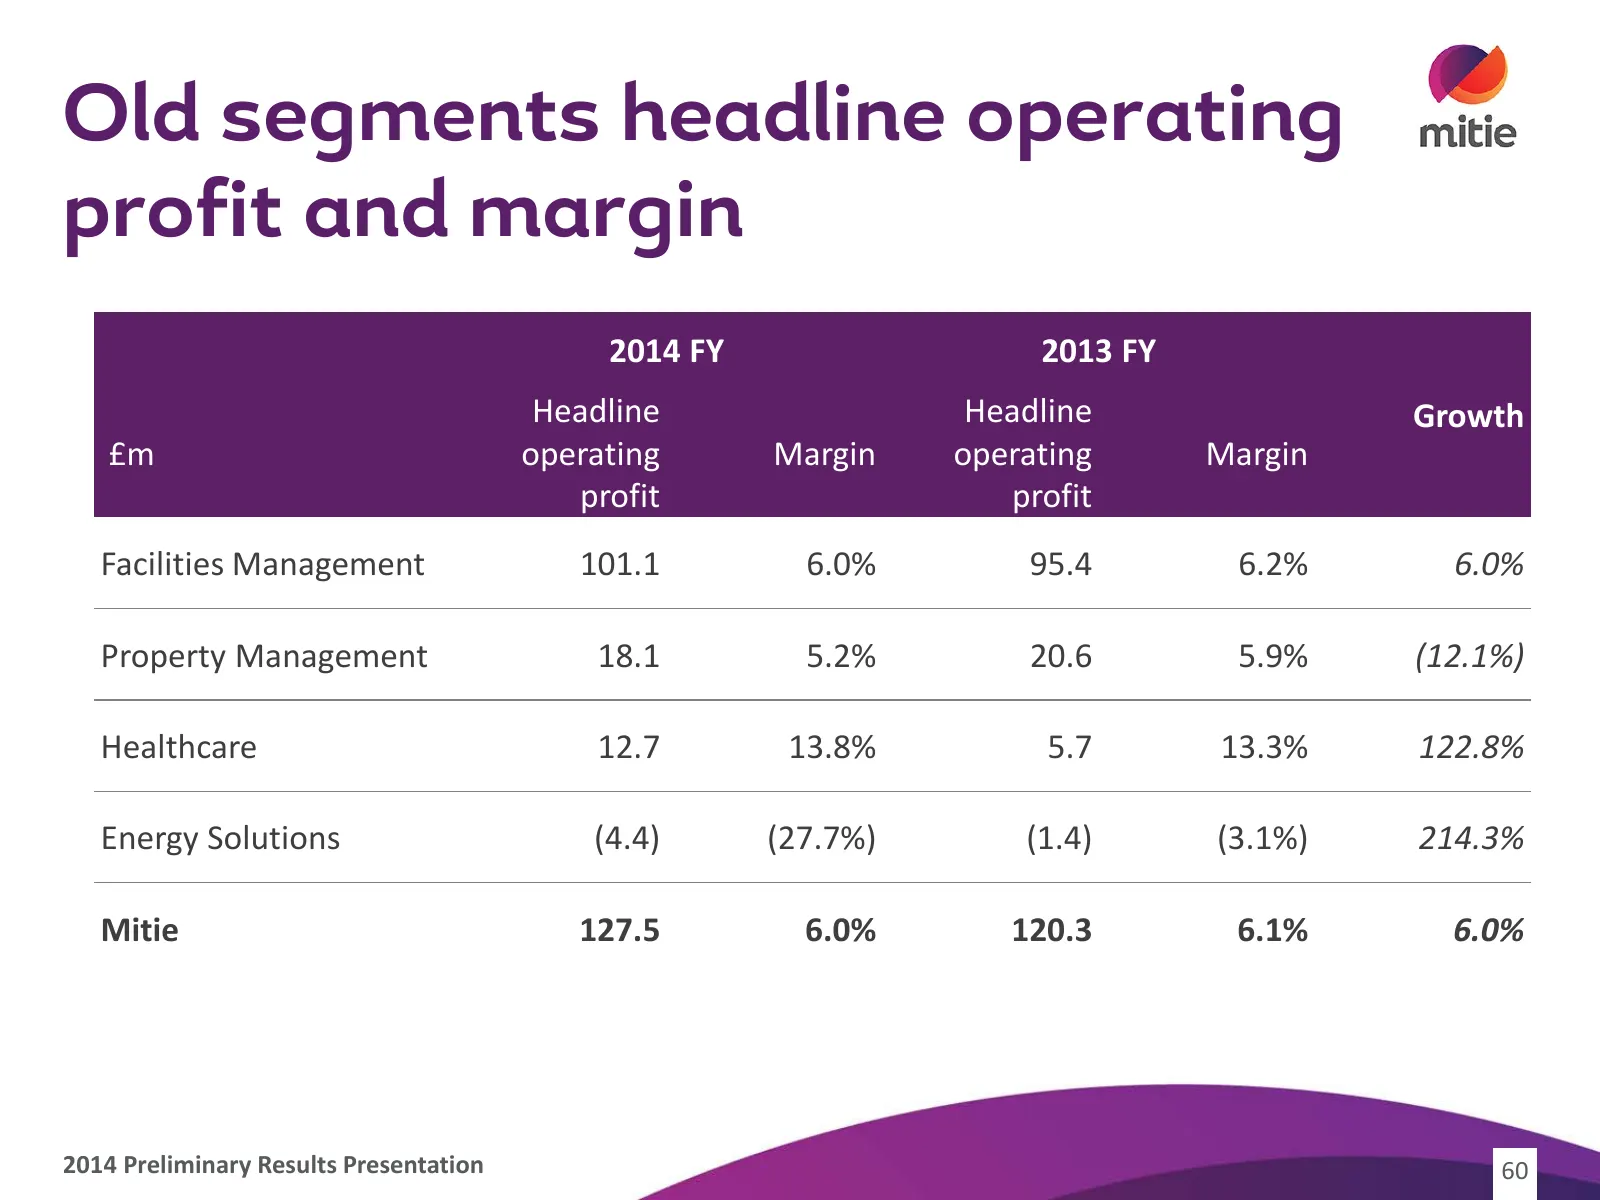
Slide 60: Old segments headline operating profit and margin
Old segments headline operating profit and margin 2014 FY 2013 FY Headline Headline Growth £m operating Margin operating Margin profit profit Facilities Management 101.1 6.0% 95.4 6.2% 6.0% Property Management 18.1 5.2% 20.6 5.9% (12.1%) Healthcare 12.7 13.8% 5.7 13.3% 122.8% Energy Solutions (4.4)
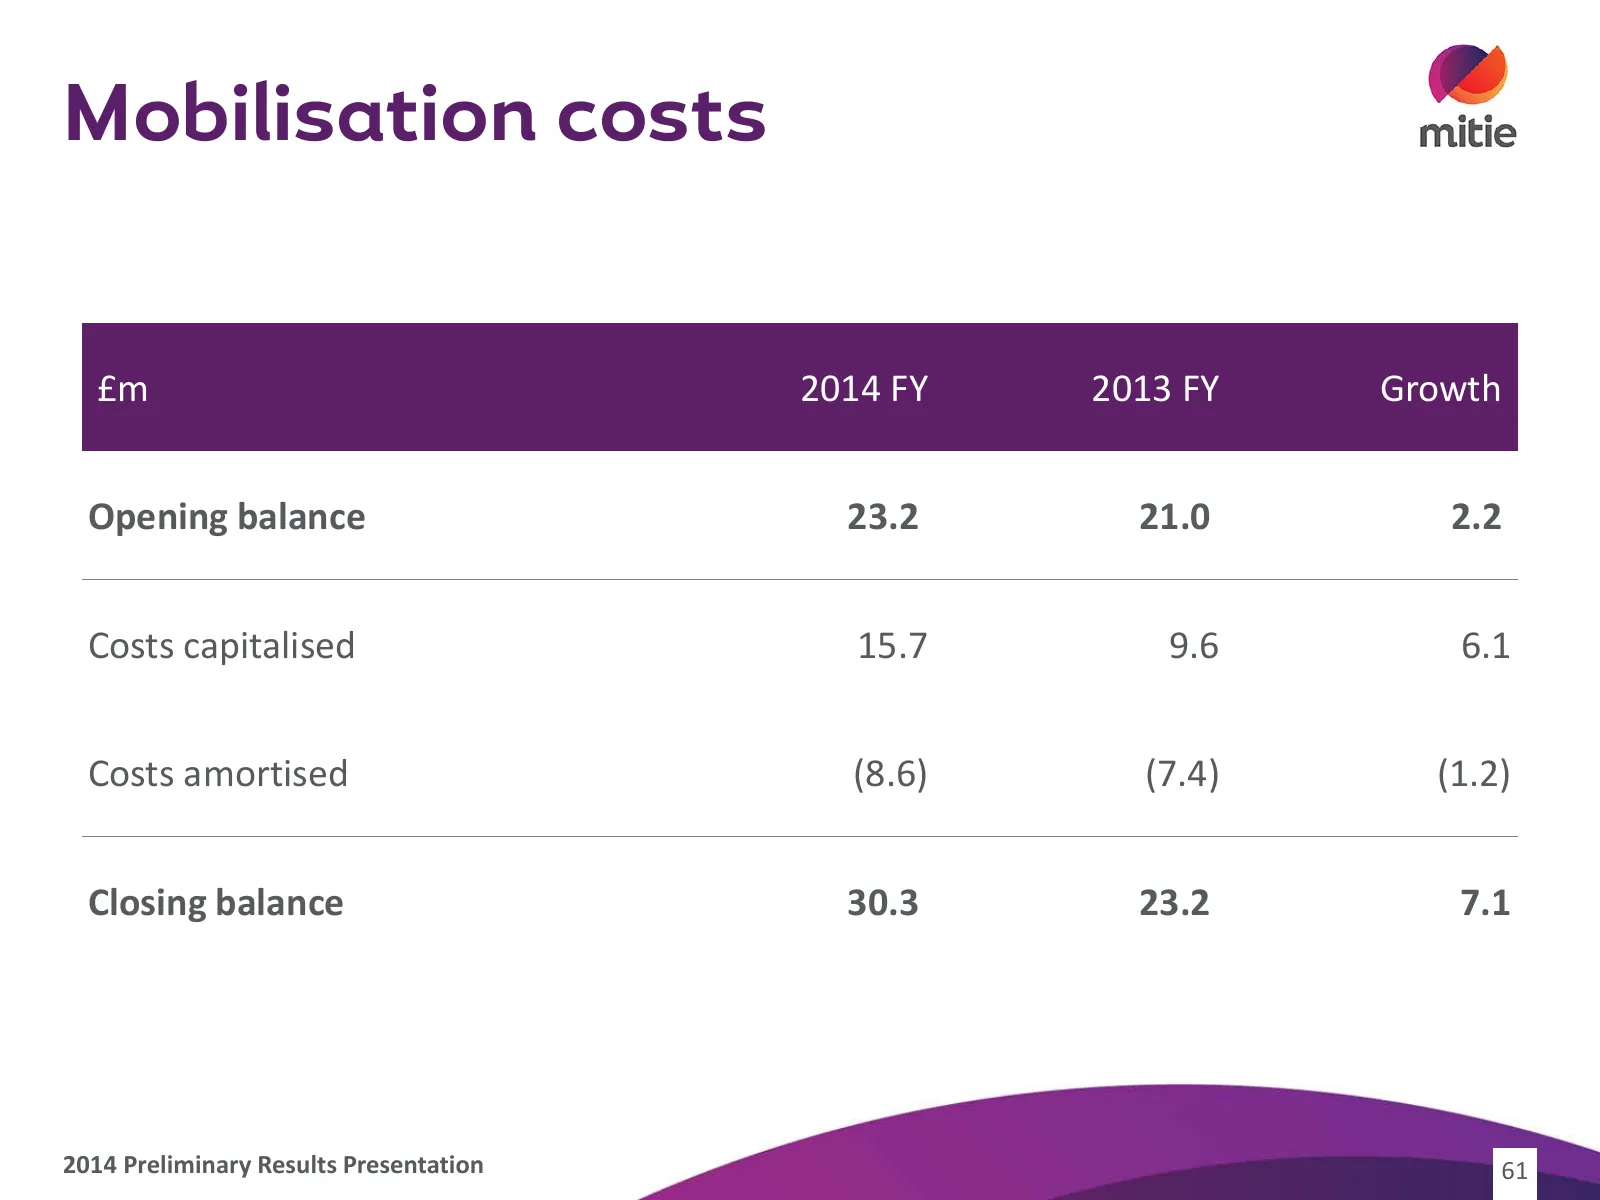
Slide 61: Mobilisation costs
Mobilisation costs £m 2014 FY 2013 FY Growth Opening balance 23.2 21.0 2.2 Costs capitalised 15.7 9.6 6.1 Costs amortised (8.6) (7.4) (1.2) Closing balance 30.3 23.2 7.1 2014 Preliminary Results Presentation 61
Slide 62: Cash flow statement
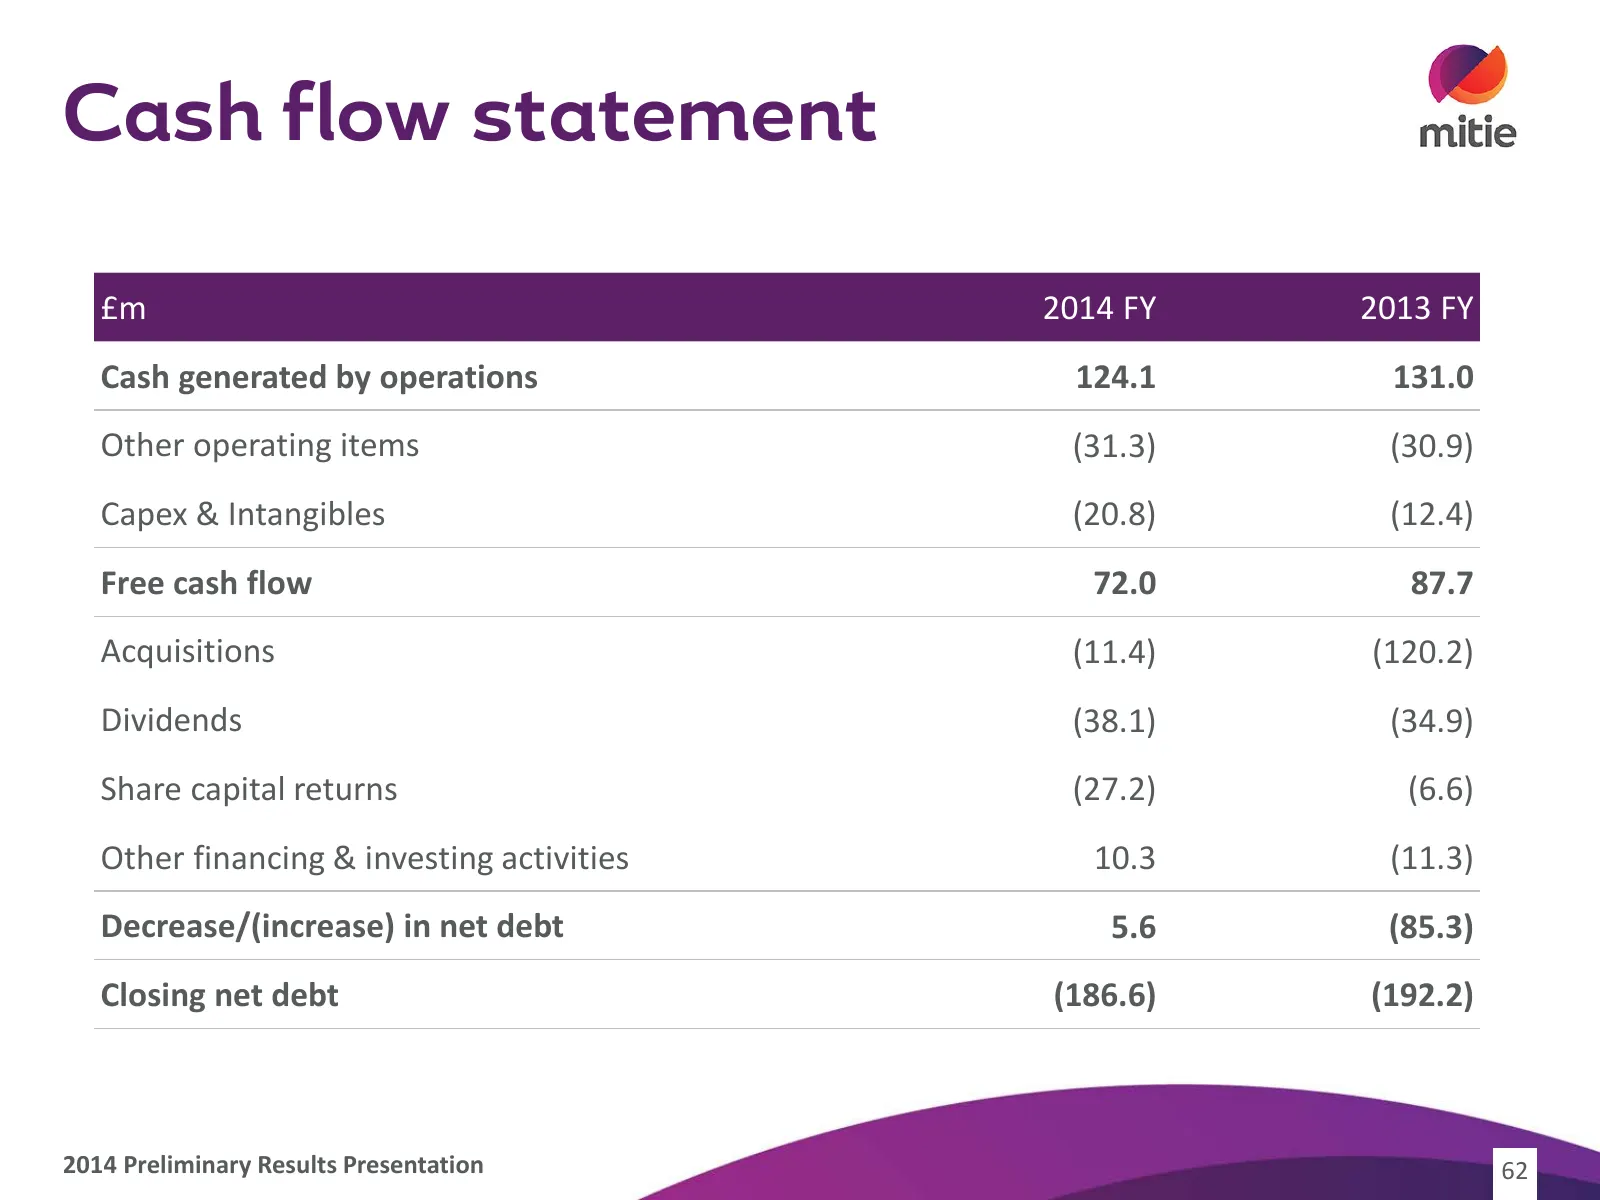
Cash flow statement £m 2014 FY 2013 FY Cash generated by operations 124.1 131.0 Other operating items (31.3) (30.9) Capex & Intangibles (20.8) (12.4) Free cash flow 72.0 87.7 Acquisitions (11.4) (120.2) Dividends (38.1) (34.9) Share capital returns (27.2) (6.6) Other financing & investing activities
Slide 63: Long term facilities in place to fund growth
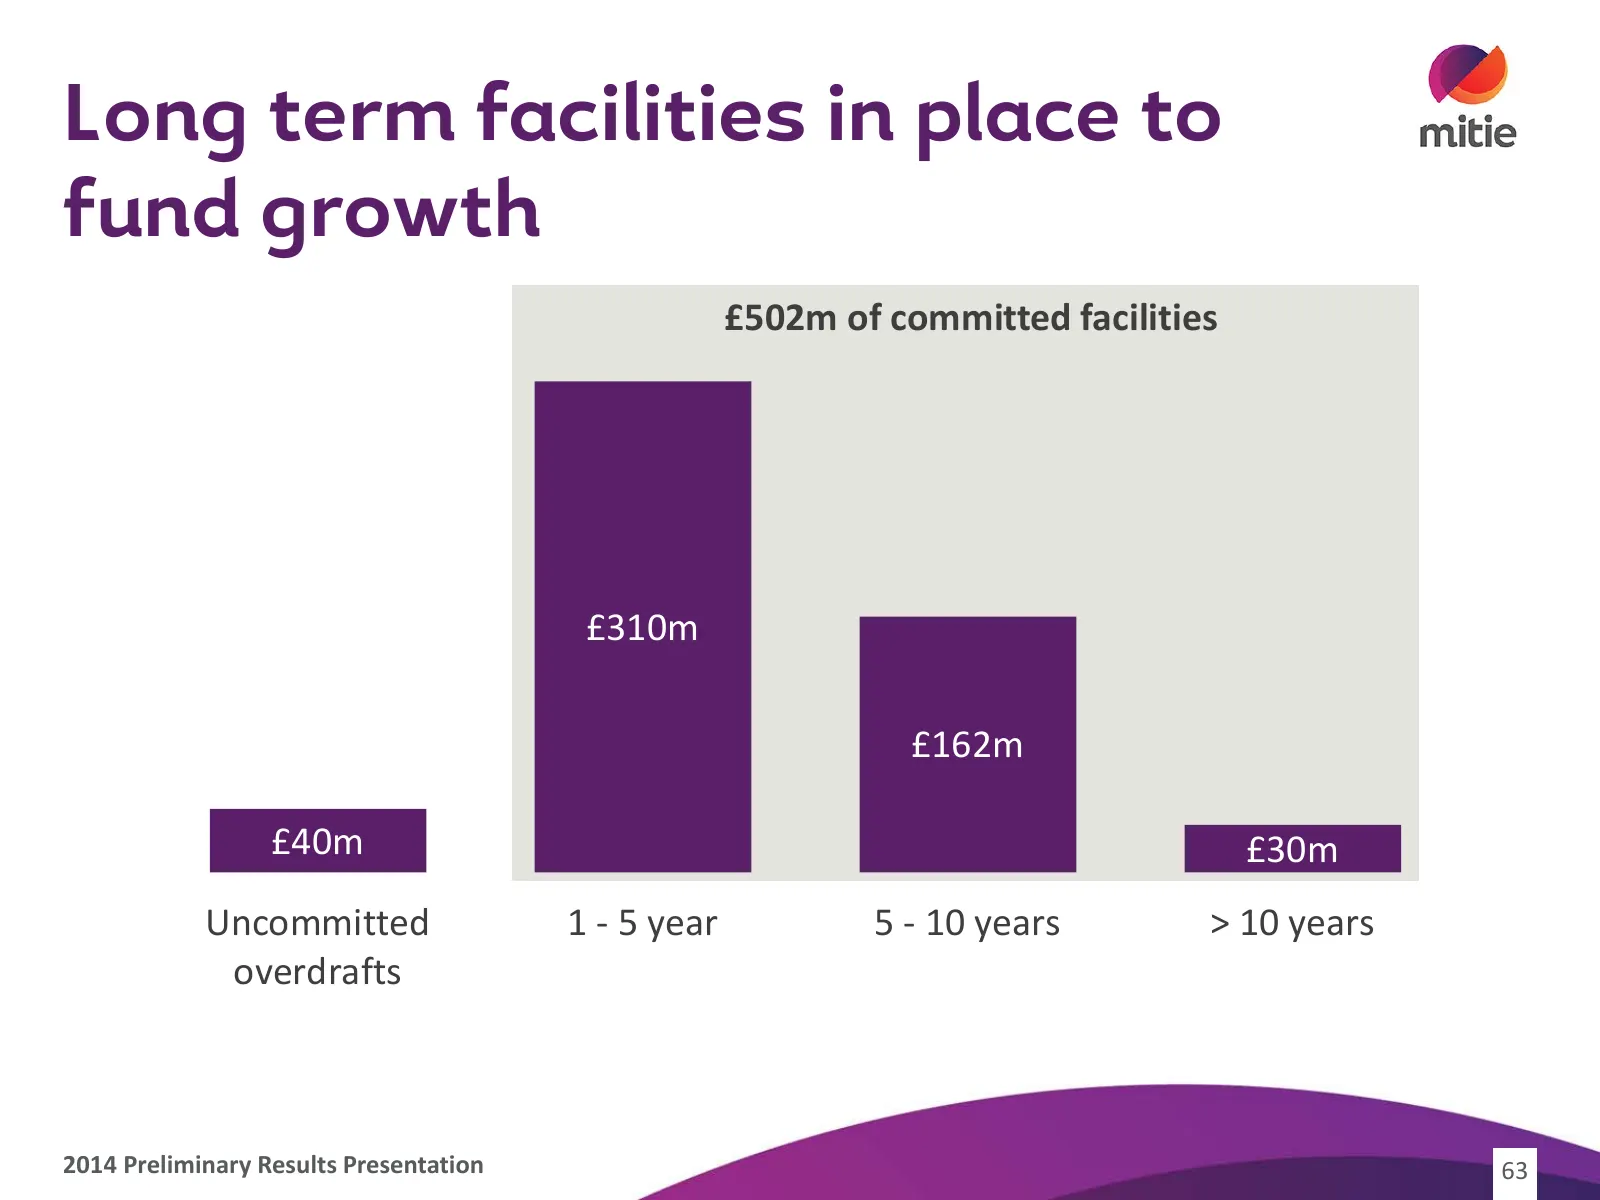
Long term facilities in place to fund growth 350 £502m of committed facilities 300 250 200 150 £310m 100 £162m 50 - £40m £30m Uncommitted 1 - 5 year 5 - 10 years > 10 years overdrafts 2014 Preliminary Results Presentation 63
Slide 64: Provisions
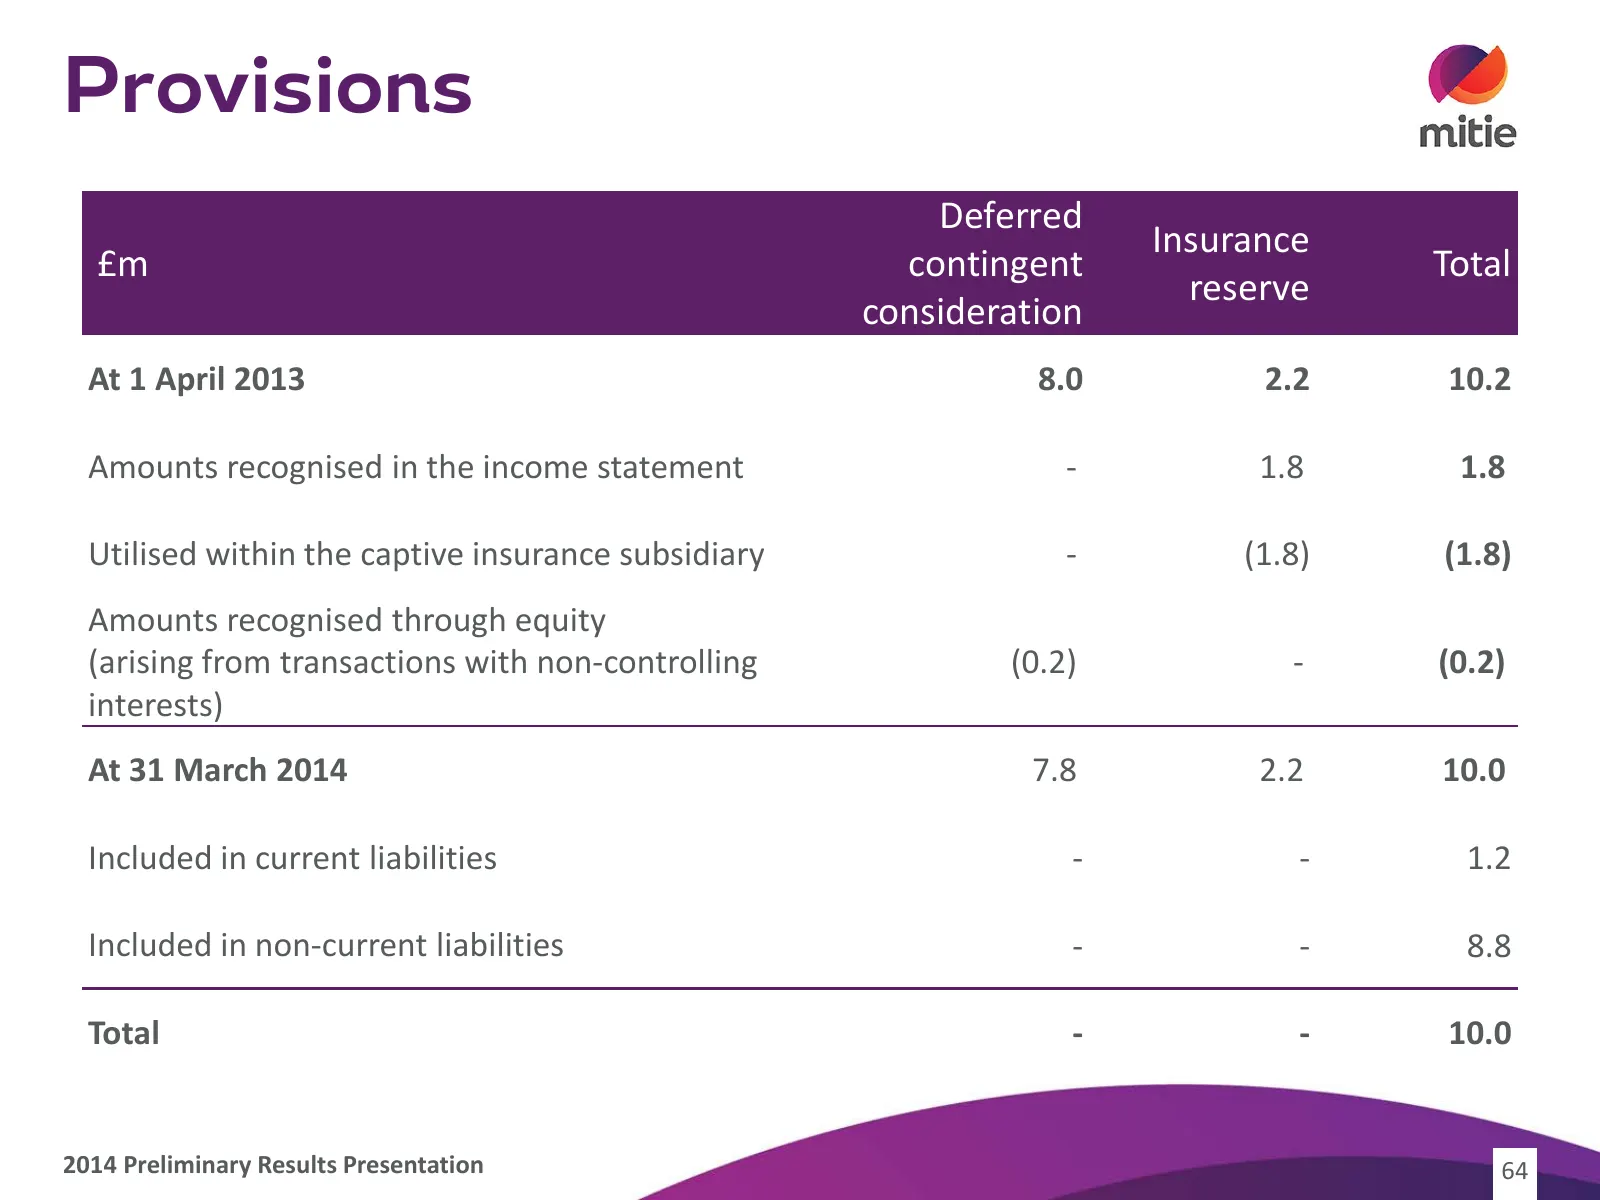
Provisions Deferred Insurance £m contingent Total reserve consideration At 1 April 2013 8.0 2.2 10.2 Amounts recognised in the income statement - 1.8 1.8 Utilised within the captive insurance subsidiary - (1.8) (1.8) Amounts recognised through equity (arising from transactions with non-controlling (

Slide 65: mitie
mitie

Slide 66
Source: Internet Archive copy of mitie.com
More decks from MITIE Group PLC
 FY2026 Earnings Presentation34 slides · Jun 4, 2026
 H1 FY26 Earnings Presentation29 slides · Nov 20, 2025
 FY2025 Earnings Presentation36 slides · Jun 5, 2025
 H1 FY25 Earnings Presentation29 slides · Nov 21, 2024
 FY2024 Earnings Presentation34 slides · Jun 6, 2024
 H1 FY24 Earnings Presentation29 slides · Nov 23, 2023