FIGS, Inc. · NYSE:FIGS
FIGS — Q3 2026 Earnings Presentation
26 slides from FIGS's earnings presentation, Nov 5, 2026

Slide 1: Q3 2026 Earnings Presentation
Q3 2026 Earnings Presentation
Slide 2: Disclaimer and Forward-Looking Statements
D IS C LA IM E R Nothing contained in this presentation is, or should be construed as, a recommendation, promise or representation by FIGS, Inc. (the “Company”) or any officer, director, employee, agent or advisor of the Company. This presentation does not purport to be all inclusive or to contain a

Slide 3: Our Mission
O UR MIS S IO N To celebrate, empower, & serve those who serve others EARNINGS 3 PRESENTATION
Slide 4: Why FIGS?
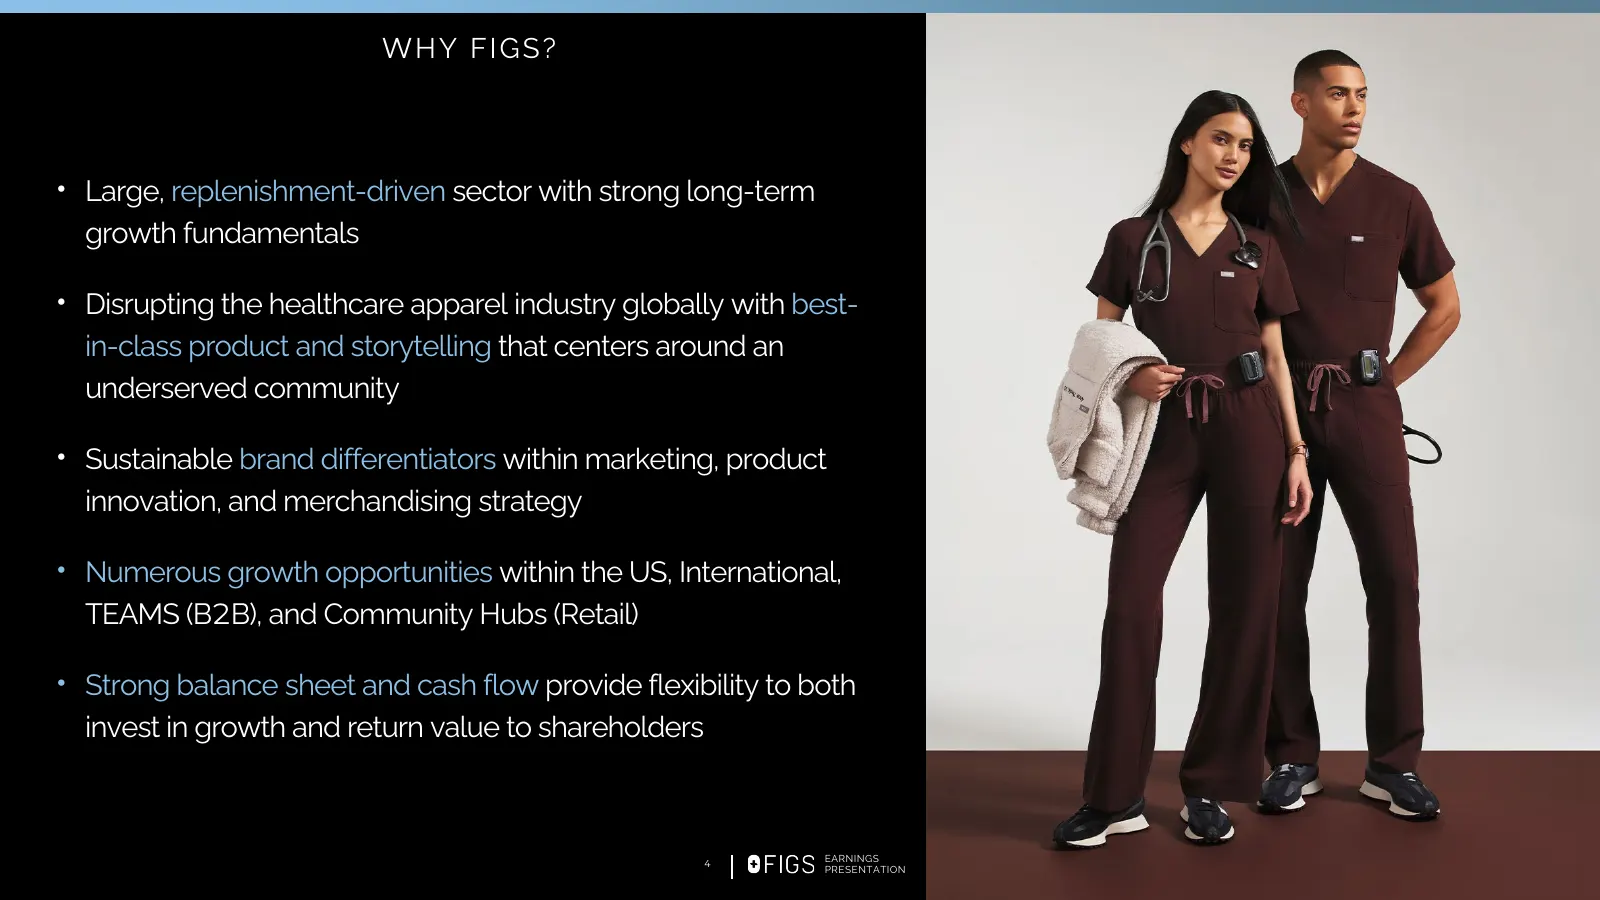
W HY F IG S ? • Large, replenishment-driven sector with strong long-term growth fundamentals • Disrupting the healthcare apparel industry globally with best- in-class product and storytelling that centers around an underserved community • Sustainable brand differentiators within marketing, product i
Slide 5: Q3 at a Glance
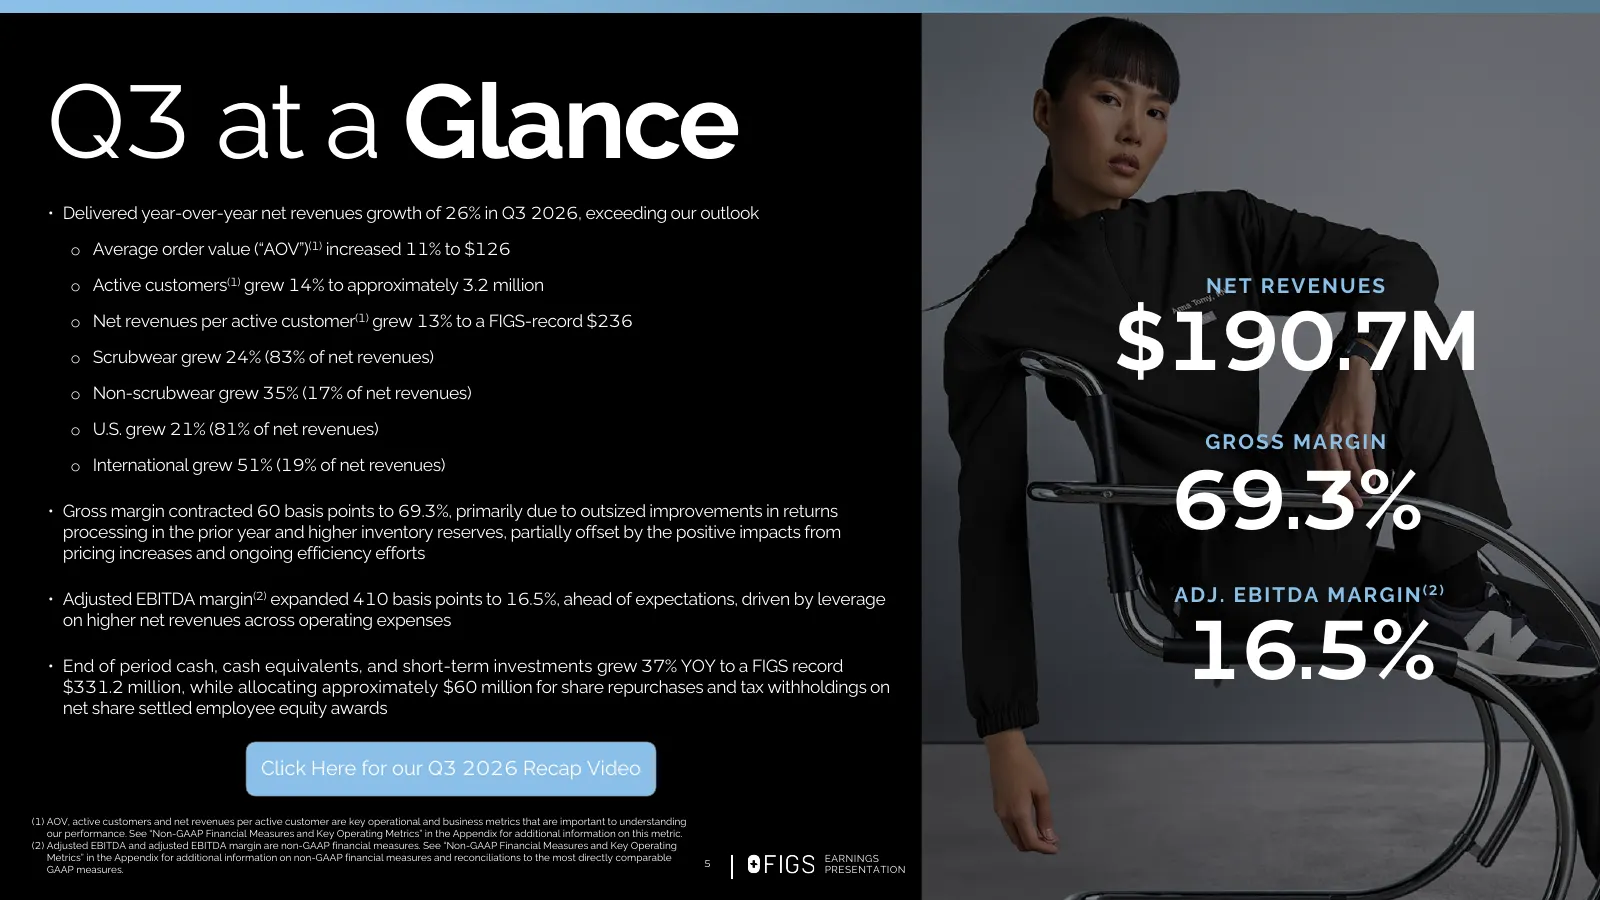
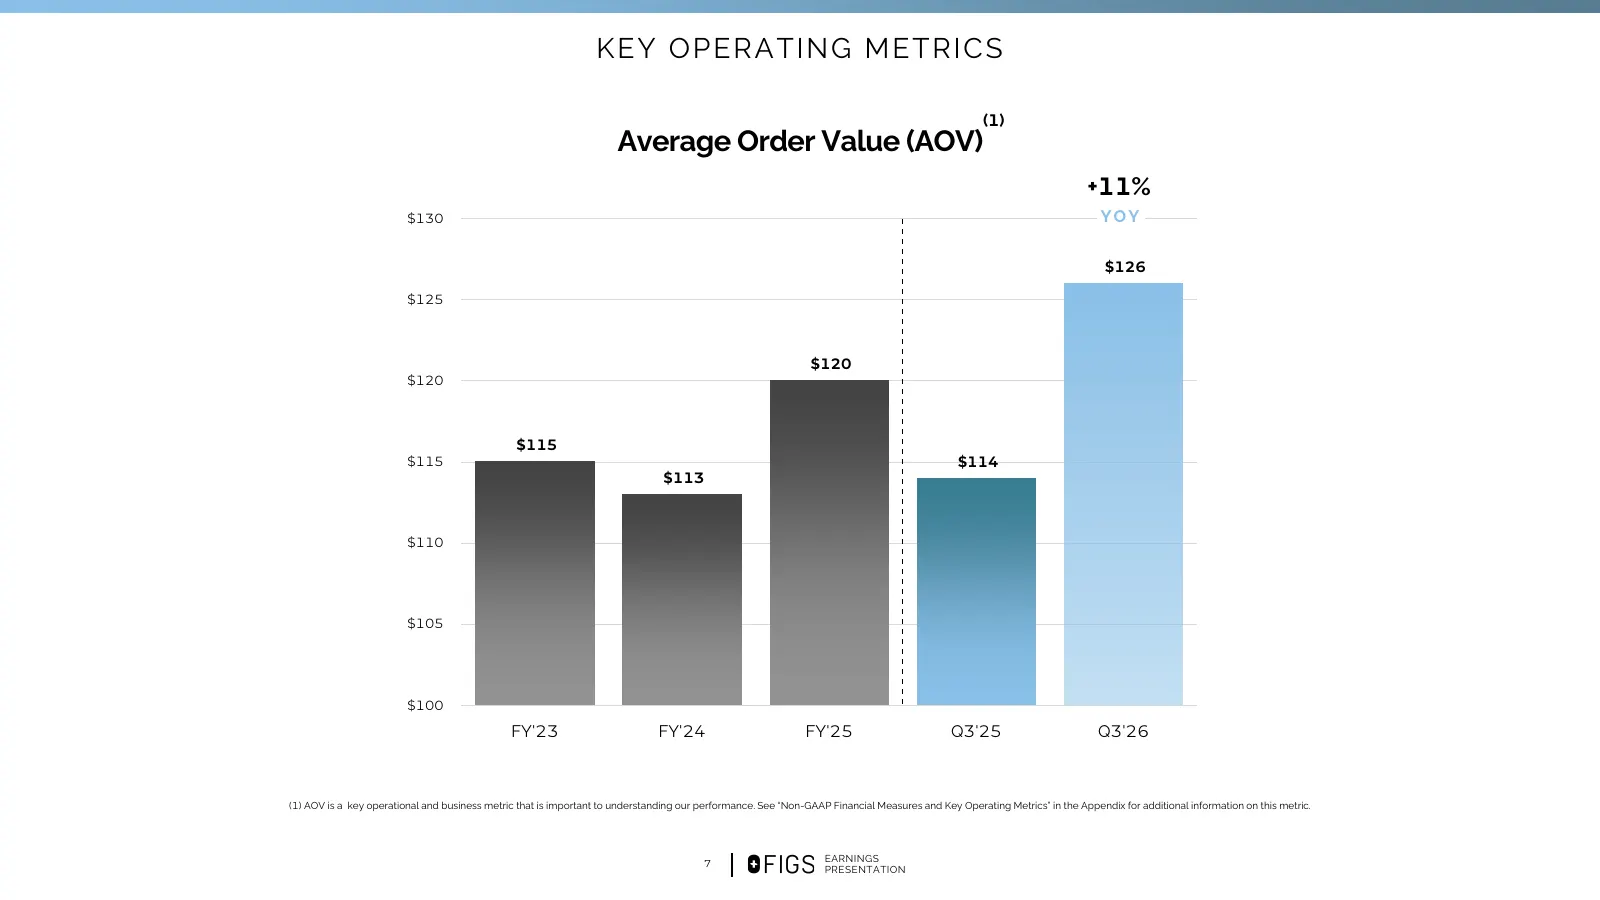
Q3 at a Glance • Delivered year-over-year net revenues growth of 26% in Q3 2026, exceeding our outlook o Average order value (“AOV”)(1) increased 11% to $126 o Active customers(1) grew 14% to approximately 3.2 million N E T RE V E N U E S $190.7M o Net revenues per active customer(1) grew 13% to a F
Slide 6: Key Operating Metrics: Active Customers and Net Revenues Per Active Customer
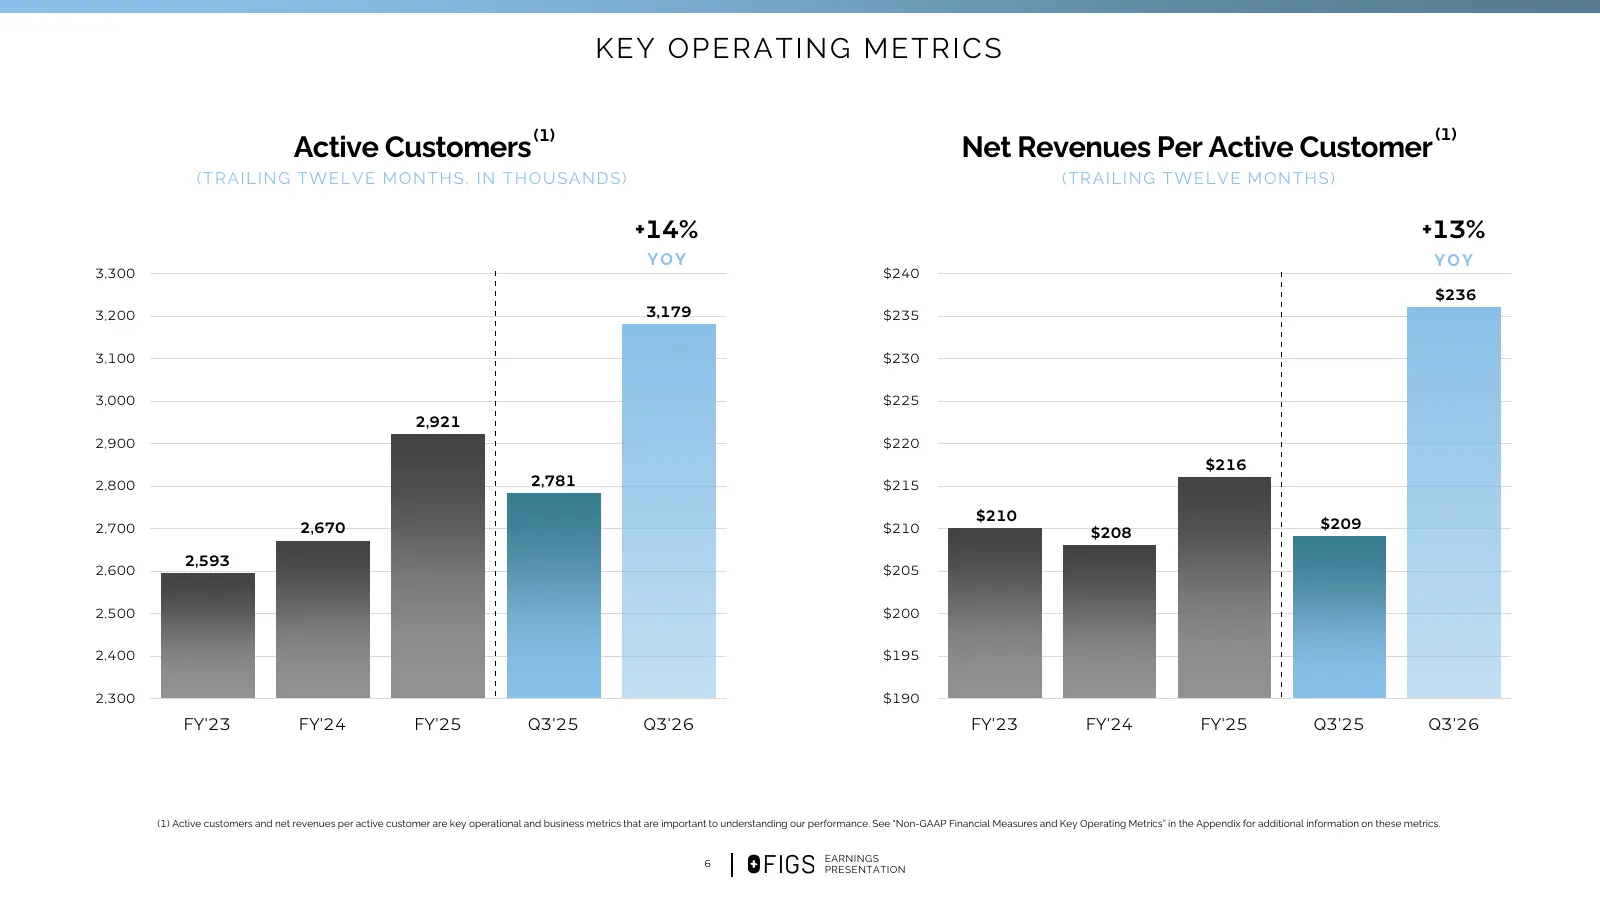
KEY O PERAT ING MET RICS (1) (1) Active Customers Net Revenues Per Active Customer ( T R A ILIN G T WE LVE MON T H S, IN T H OU SA N DS) ( T R A ILIN G T WE LVE MON T H S) +14% +13% YOY YOY 3,300 $240 $236 3,200 3,179 $235 3,100 $230 3,000 $225 2,921 2,900 $220 $216 2,800 2,781 $215 $210 2,700 2,670
Slide 7: Key Operating Metrics: Average Order Value
KEY O PERAT ING MET RICS (1) Average Order Value (AOV) +11% $130 YOY $126 $125 $120 $120 $115 $115 $114 $113 $110 $105 $100 FY'23 FY'24 FY'25 Q3'25 Q3'26 (1) AOV is a key operational and business metric that is important to understanding our performance. See “Non-GAAP Financial Measures and Key Oper
Slide 8: Diversified Growth Strategy
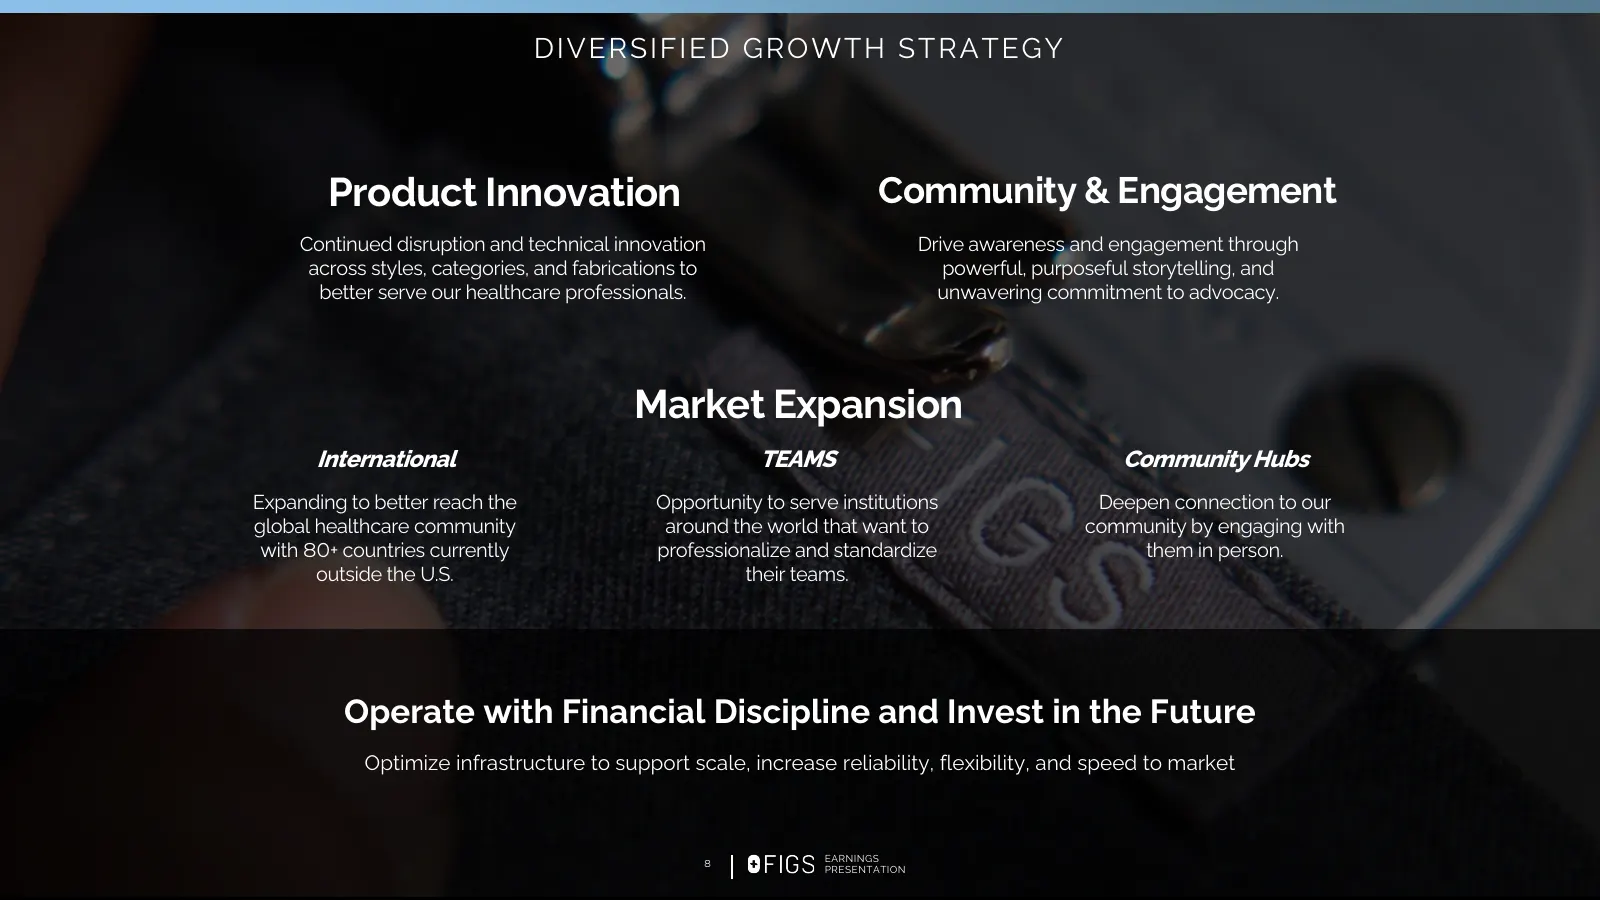
DIVERS IF IE D G RO W TH STRATEGY Product Innovation Community & Engagement Continued disruption and technical innovation Drive awareness and engagement through across styles, categories, and fabrications to powerful, purposeful storytelling, and better serve our healthcare professionals. unwavering

Slide 9: Product Innovation
Product Innovation We introduced new products across the layering system designed for maximum comfort, versatility, and durability, including: • The CHARxMACY: With our recent acquisition of V Coterie, we broadened our non- scrubwear opportunity with a dedicated collection of jewelry, pins, charms,

Slide 10: Build and Deepen Connection with Community
Build and Deepen Connection with Community SPIDER-MAN In July, we debuted our first-ever Marvel Spider-Man collaboration tied to the latest movie in the franchise, Spider-Man: Brand New Day. The response from healthcare professionals was overwhelming with incredible engagement and rapid sell through
Slide 11: Impact
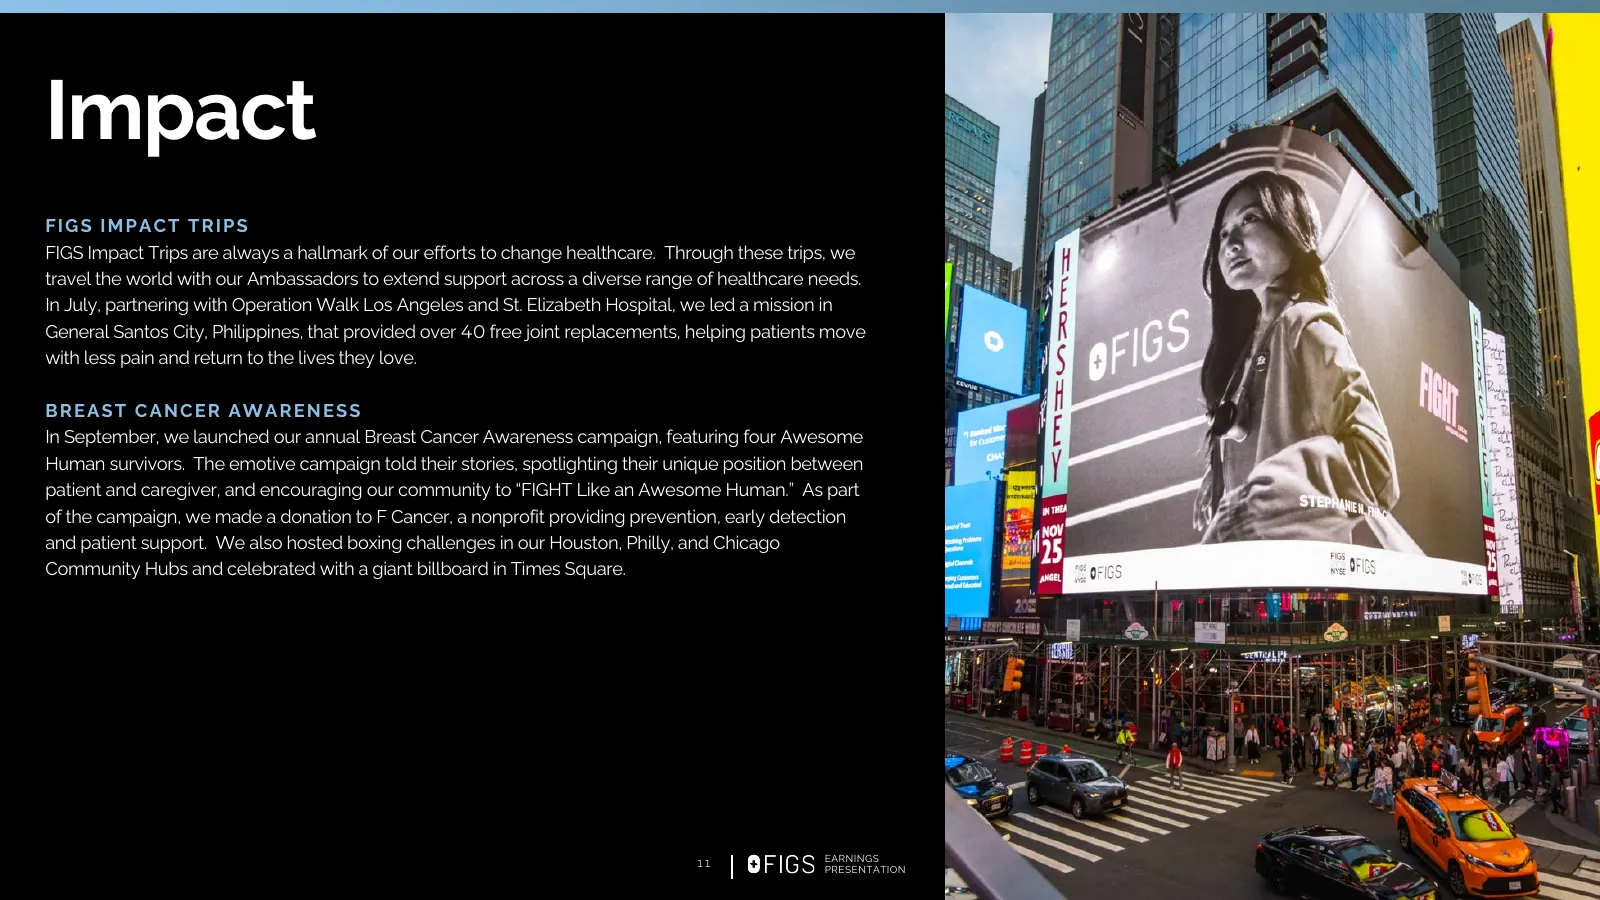
Impact FIGS IMPACT TRIPS FIGS Impact Trips are always a hallmark of our efforts to change healthcare. Through these trips, we travel the world with our Ambassadors to extend support across a diverse range of healthcare needs. In July, partnering with Operation Walk Los Angeles and St. Elizabeth Hosp
Slide 12: International: Expanding Global Presence
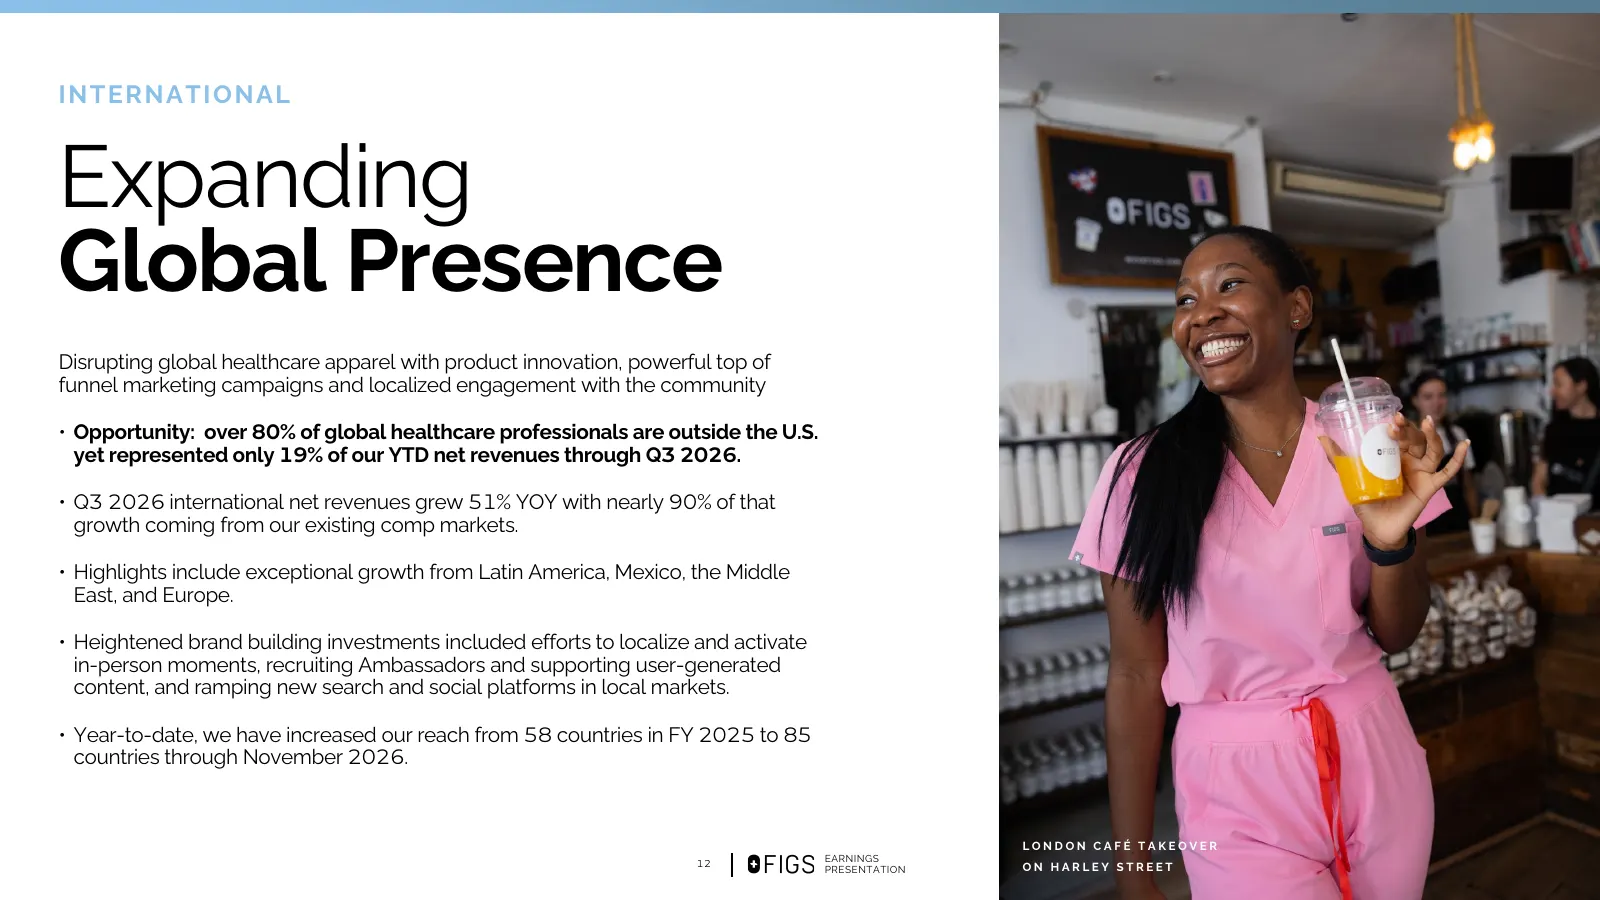
I N T ERN AT I O N AL Expanding Global Presence Disrupting global healthcare apparel with product innovation, powerful top of funnel marketing campaigns and localized engagement with the community • Opportunity: over 80% of global healthcare professionals are outside the U.S. yet represented only 19

Slide 13: TEAMS: Serving Healthcare Institutions
T EAMS Serving Healthcare Institutions Serving hospitals, medical offices, and concierge clinics to professionalize and standardize their teams • Opportunity: ~15% of the U.S. scrubs industry has historically been driven by institutions buying for their teams, while the commercialization of healthca
Slide 14: Community Hubs: Creating Community Presence
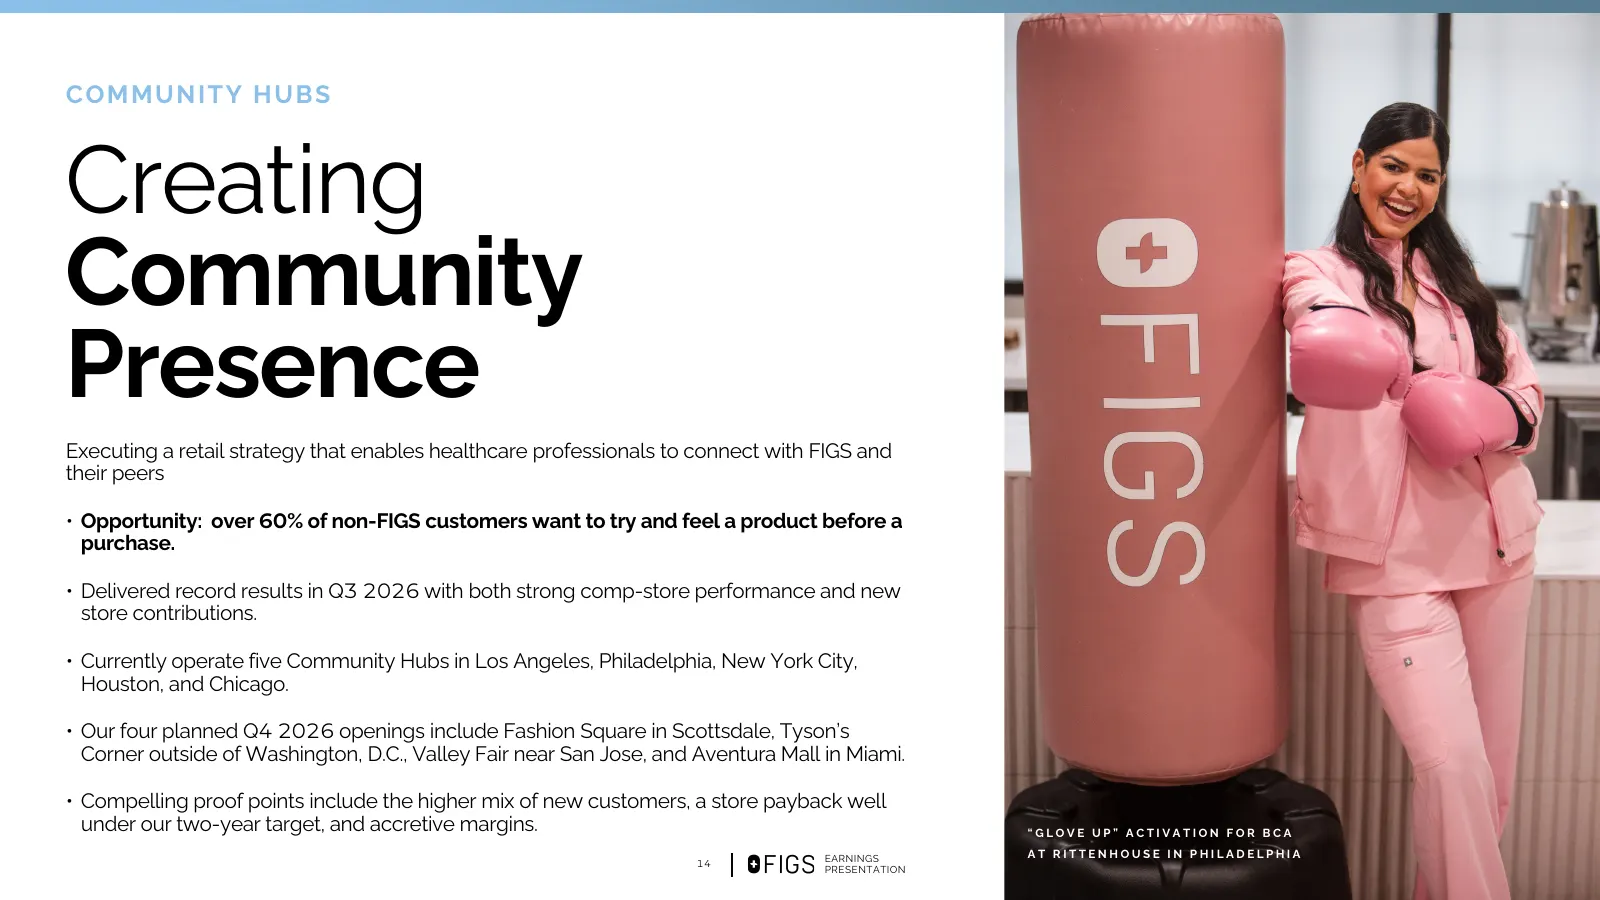
C OMMU N I T Y HU BS Creating Community Presence Executing a retail strategy that enables healthcare professionals to connect with FIGS and their peers • Opportunity: over 60% of non-FIGS customers want to try and feel a product before a purchase. • Delivered record results in Q3 2026 with both stro
Slide 15: Why FIGS?
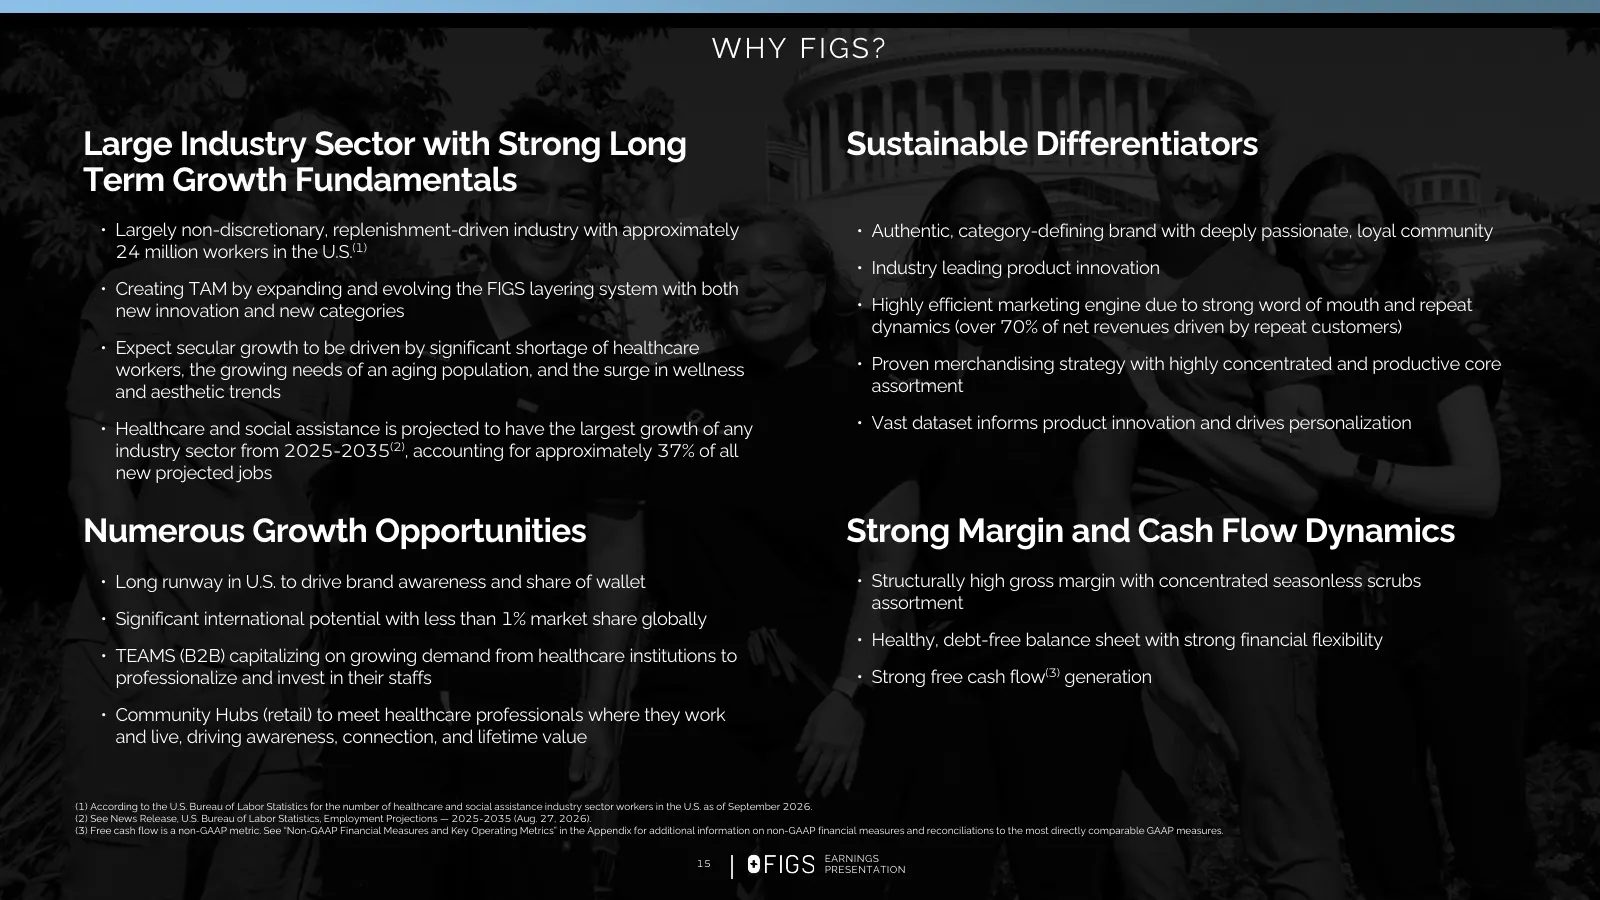
WHY F IG S? Large Industry Sector with Strong Long Sustainable Differentiators Term Growth Fundamentals • Largely non-discretionary, replenishment-driven industry with approximately • Authentic, category-defining brand with deeply passionate, loyal community 24 million workers in the U.S.(1) • Indus

Slide 16: Earnings Presentation
EARNINGS 16 PRESENTATION
Slide 17: Q3 2026 Net Revenues
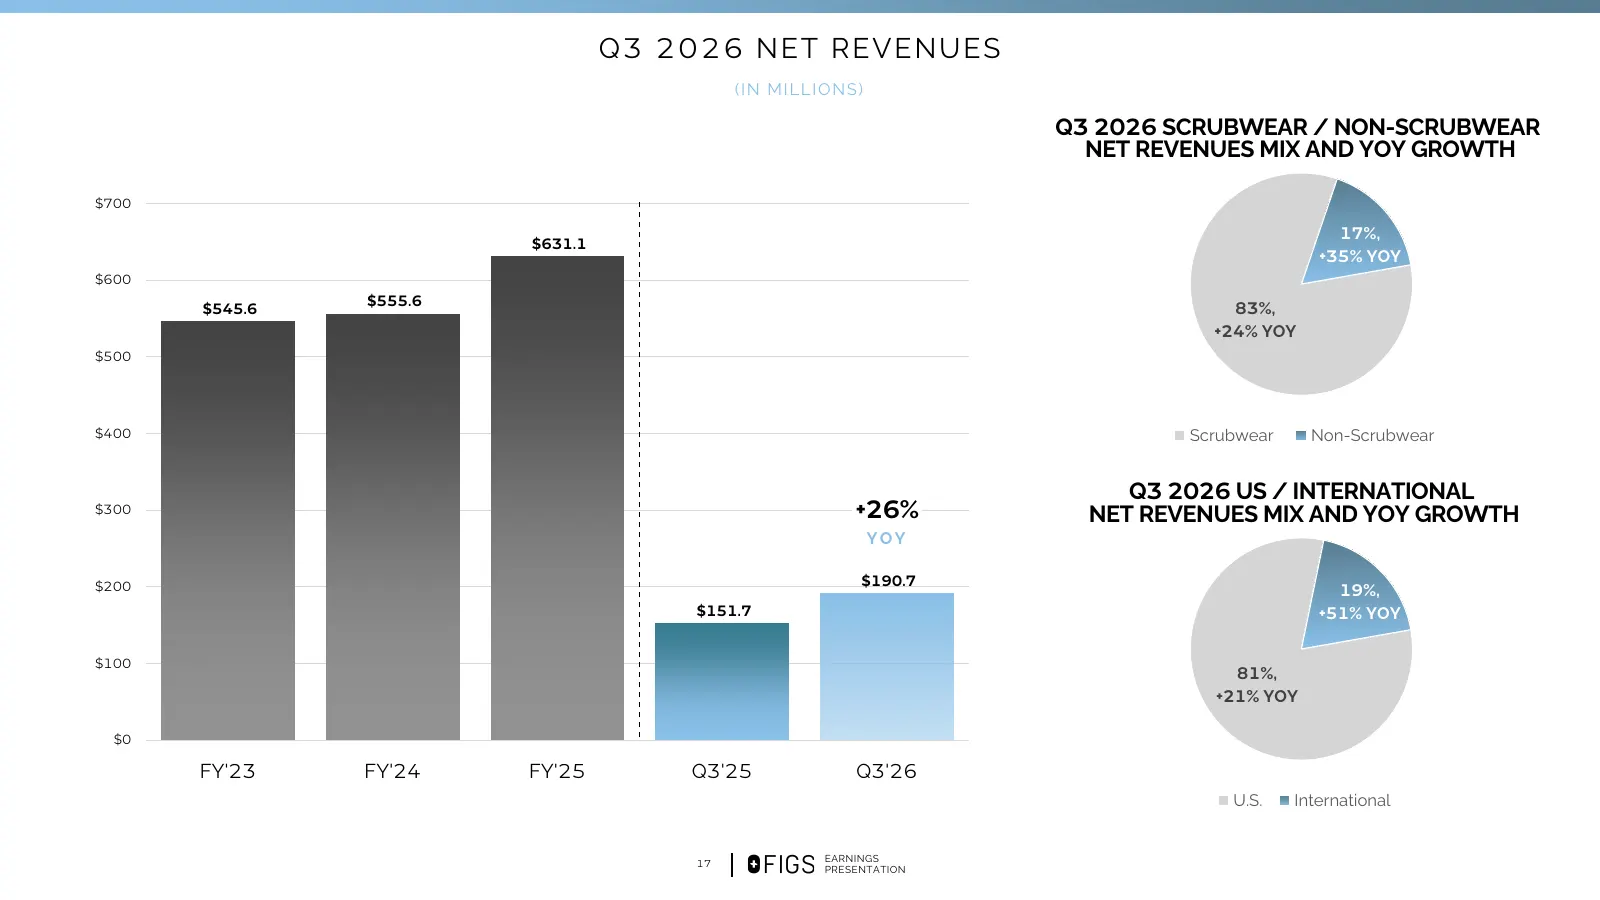
Q3 2026 NET REVE NU ES ( IN MILLION S) Q3 2026 SCRUBWEAR / NON-SCRUBWEAR NET REVENUES MIX AND YOY GROWTH $700 17%, $631.1 +35% YOY $600 $555.6 $545.6 83%, +24% YOY $500 $400 Scrubwear Non-Scrubwear Q3 2026 US / INTERNATIONAL $300 +26% NET REVENUES MIX AND YOY GROWTH YOY $200 $190.7 19%, $151.7 +51%
Slide 18: Q3 2026 Gross Margin
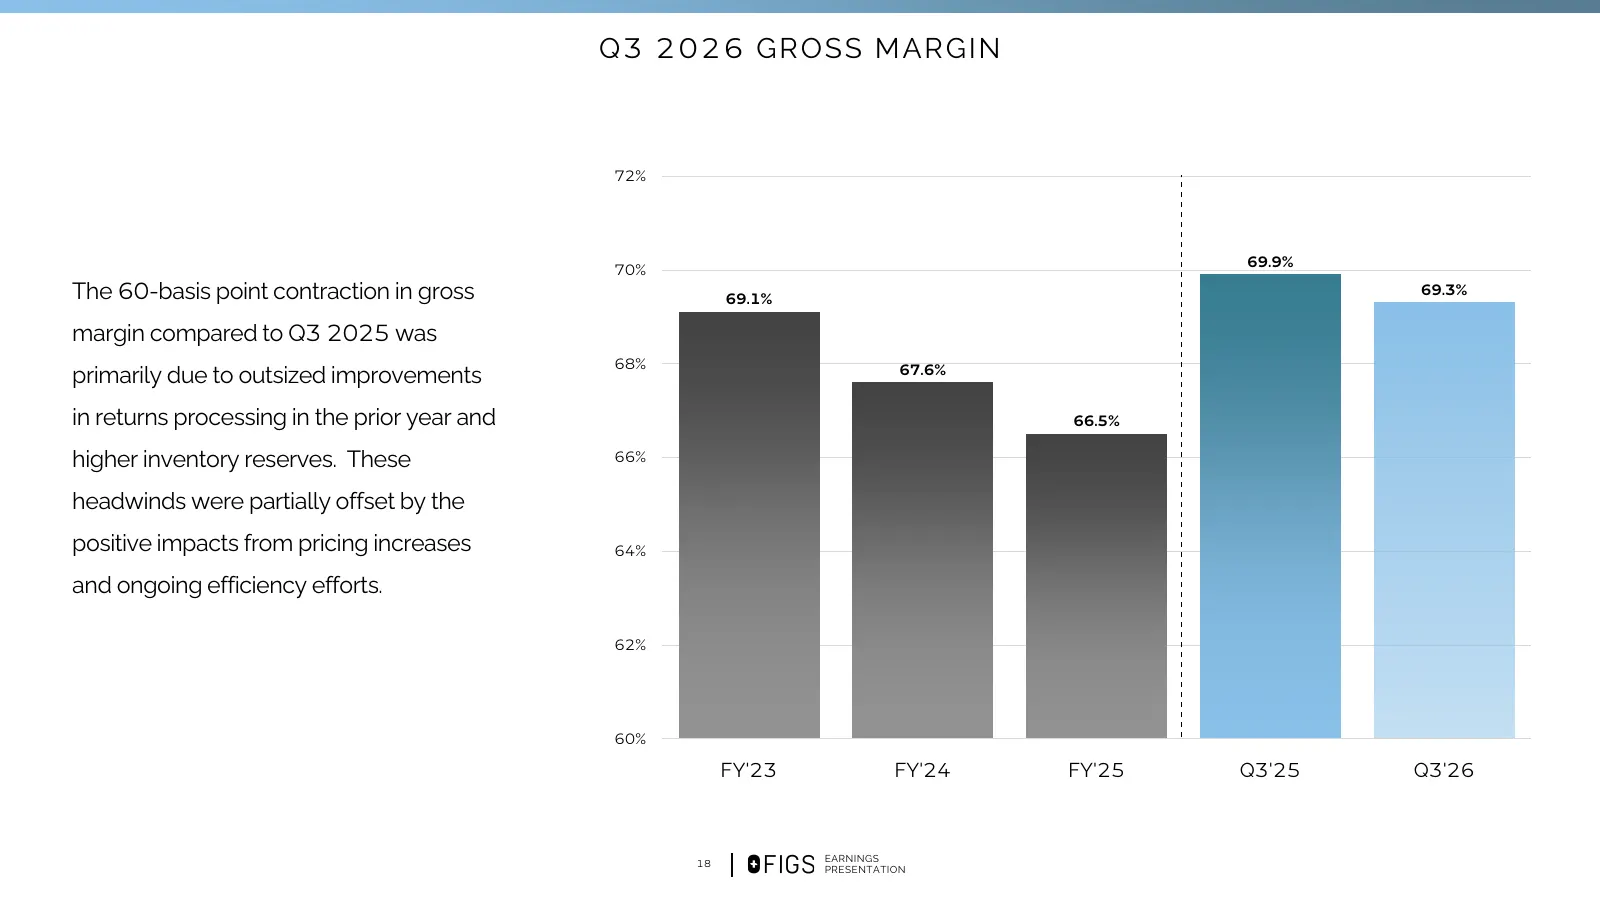
Q3 2026 G RO SS MARG IN 72% 69.9% 70% The 60-basis point contraction in gross 69.1% 69.3% margin compared to Q3 2025 was 68% primarily due to outsized improvements 67.6% in returns processing in the prior year and 66.5% higher inventory reserves. These 66% headwinds were partially offset by the posi
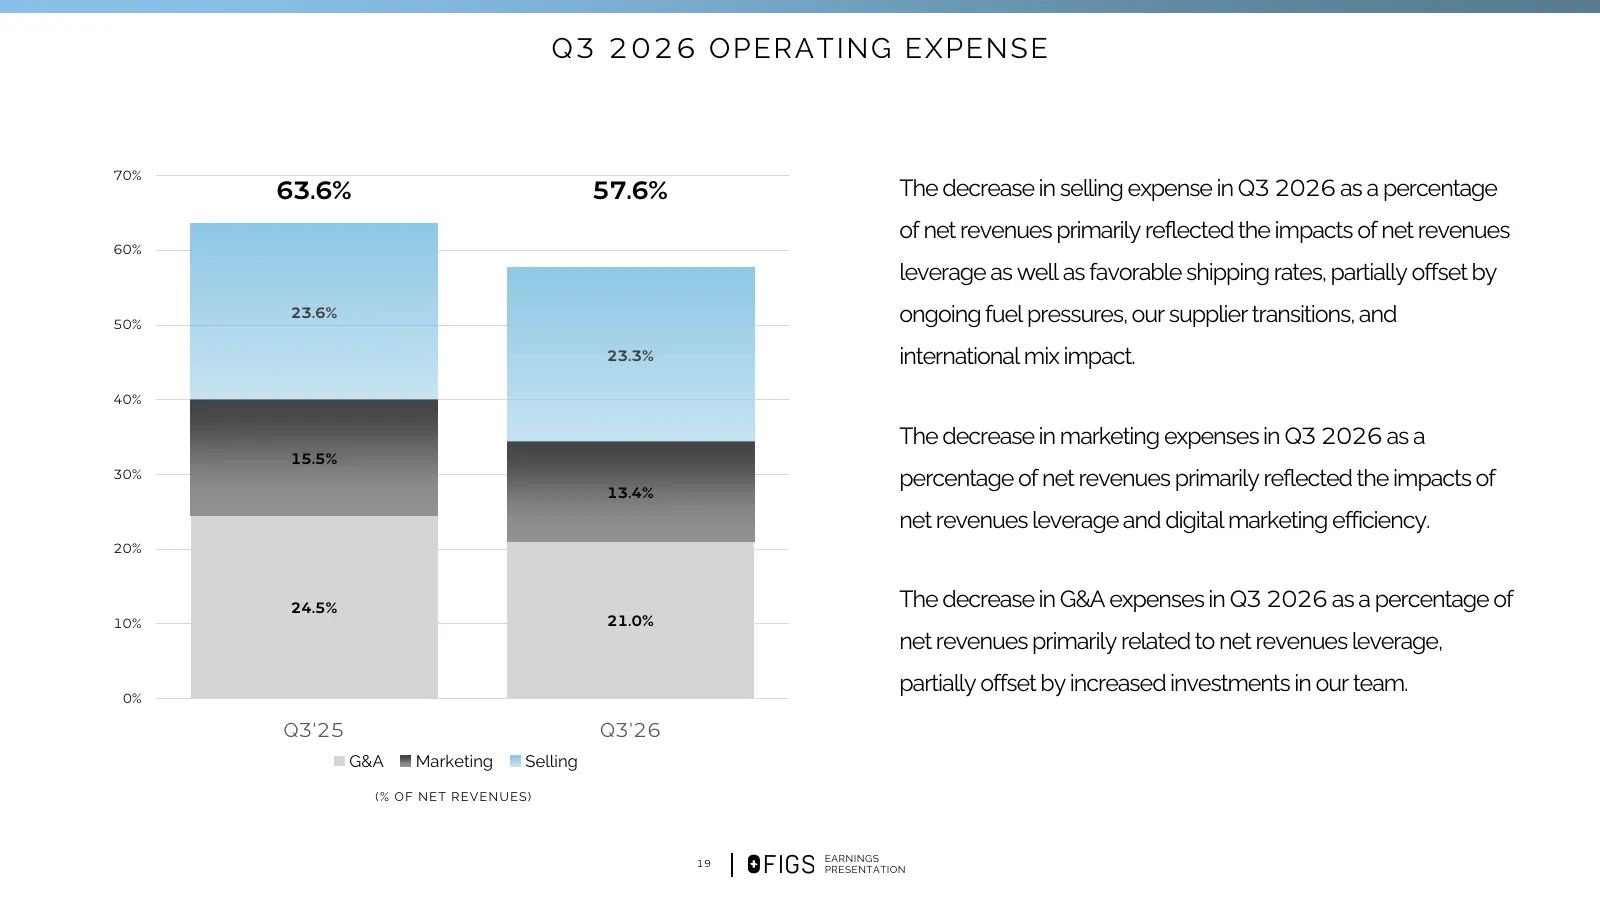
Slide 19: Q3 2026 Operating Expense
Q3 2026 O PERAT ING EXPENS E 70% 63.6% 57.6% The decrease in selling expense in Q3 2026 as a percentage of net revenues primarily reflected the impacts of net revenues 60% leverage as well as favorable shipping rates, partially offset by 50% 23.6% ongoing fuel pressures, our supplier transitions, an
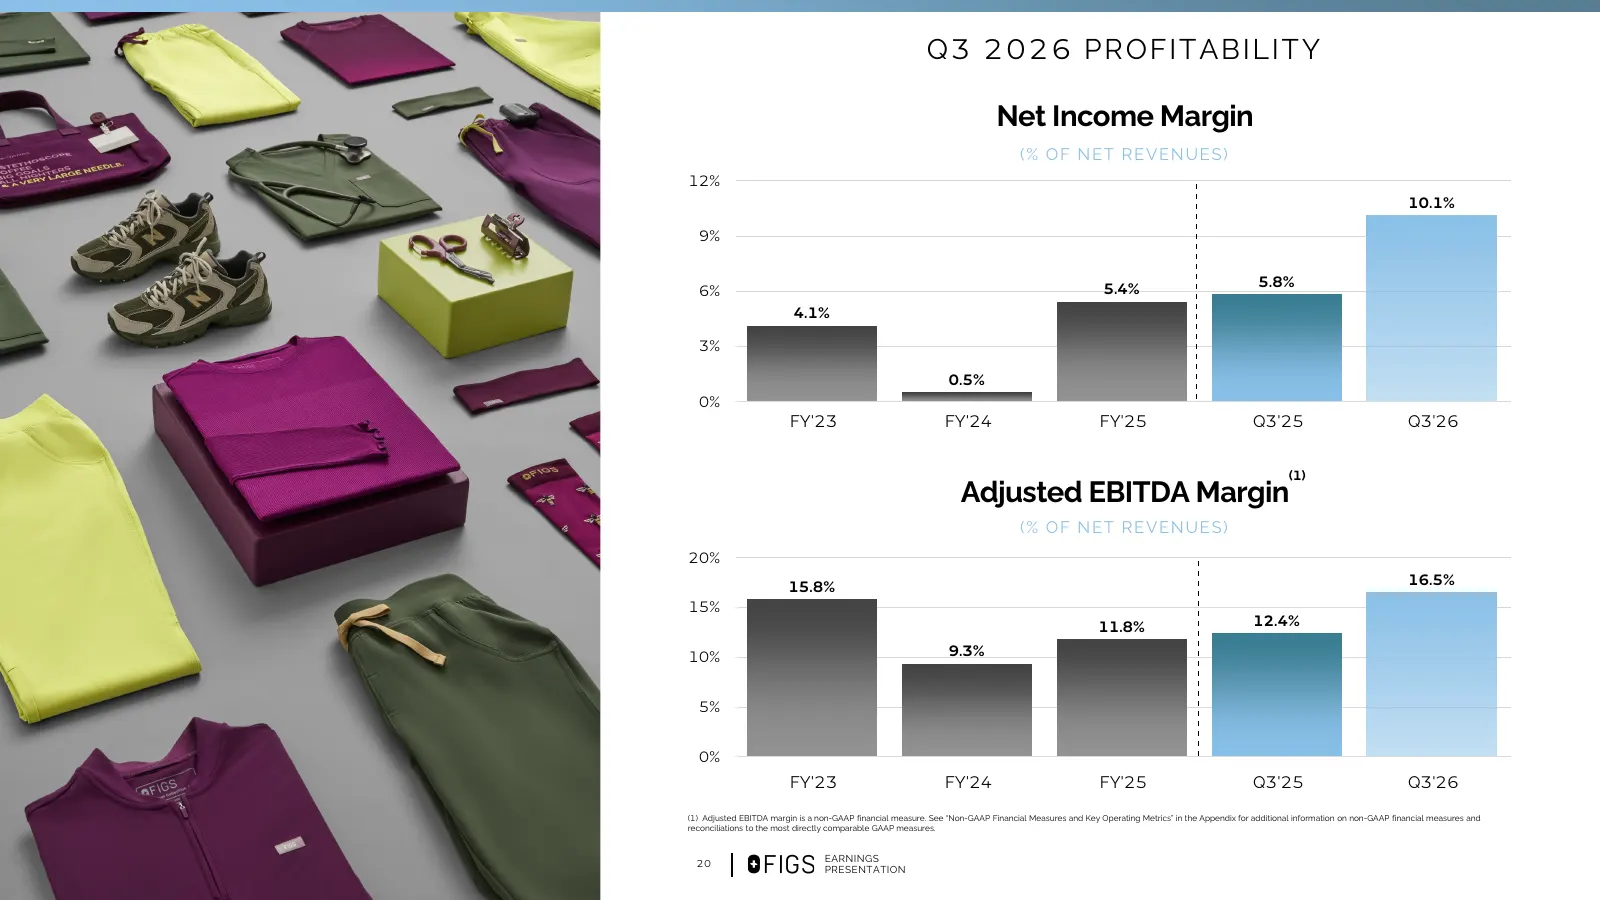
Slide 20: Q3 2026 Profitability
Q3 2026 PRO FIT ABILIT Y Net Income Margin ( % OF N E T R E VEN UES ) 12% 10.1% 9% 5.4% 5.8% 6% 4.1% 3% 0.5% 0% FY'23 FY'24 FY'25 Q3'25 Q3'26 (1) Adjusted EBITDA Margin ( % OF N E T R E VEN UES ) 20% 15.8% 16.5% 15% 11.8% 12.4% 10% 9.3% 5% 0% FY'23 FY'24 FY'25 Q3'25 Q3'26 (1) Adjusted EBITDA margin
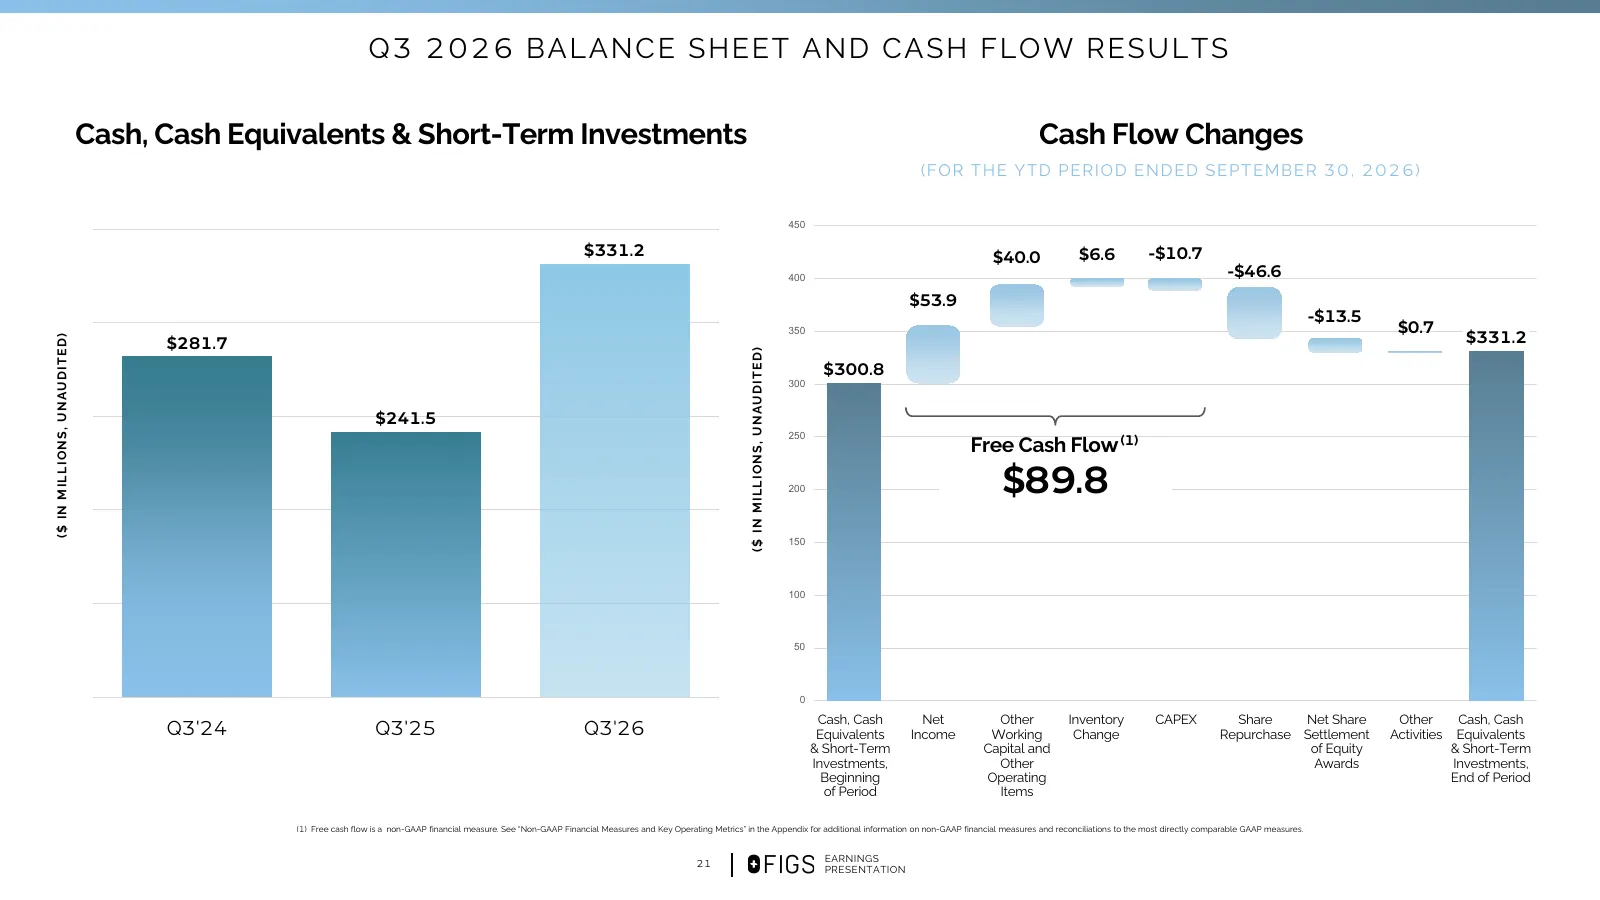
Slide 21: Q3 2026 Balance Sheet and Cash Flow Results
Q3 2026 BALAN C E S HEET AND CASH FLOW RESU LTS Cash, Cash Equivalents & Short-Term Investments Cash Flow Changes ( FOR T HE Y T D P E R IOD E N DE D SE P T E MB ER 3 0 , 2 0 2 6 ) 450 $331.2 $40.0 $6.6 -$10.7 400 -$46.6 $53.9 -$13.5 350 $0.7 $281.7 $331.2 ( $ I N M I L L I ON S , U N A U D I T ED)
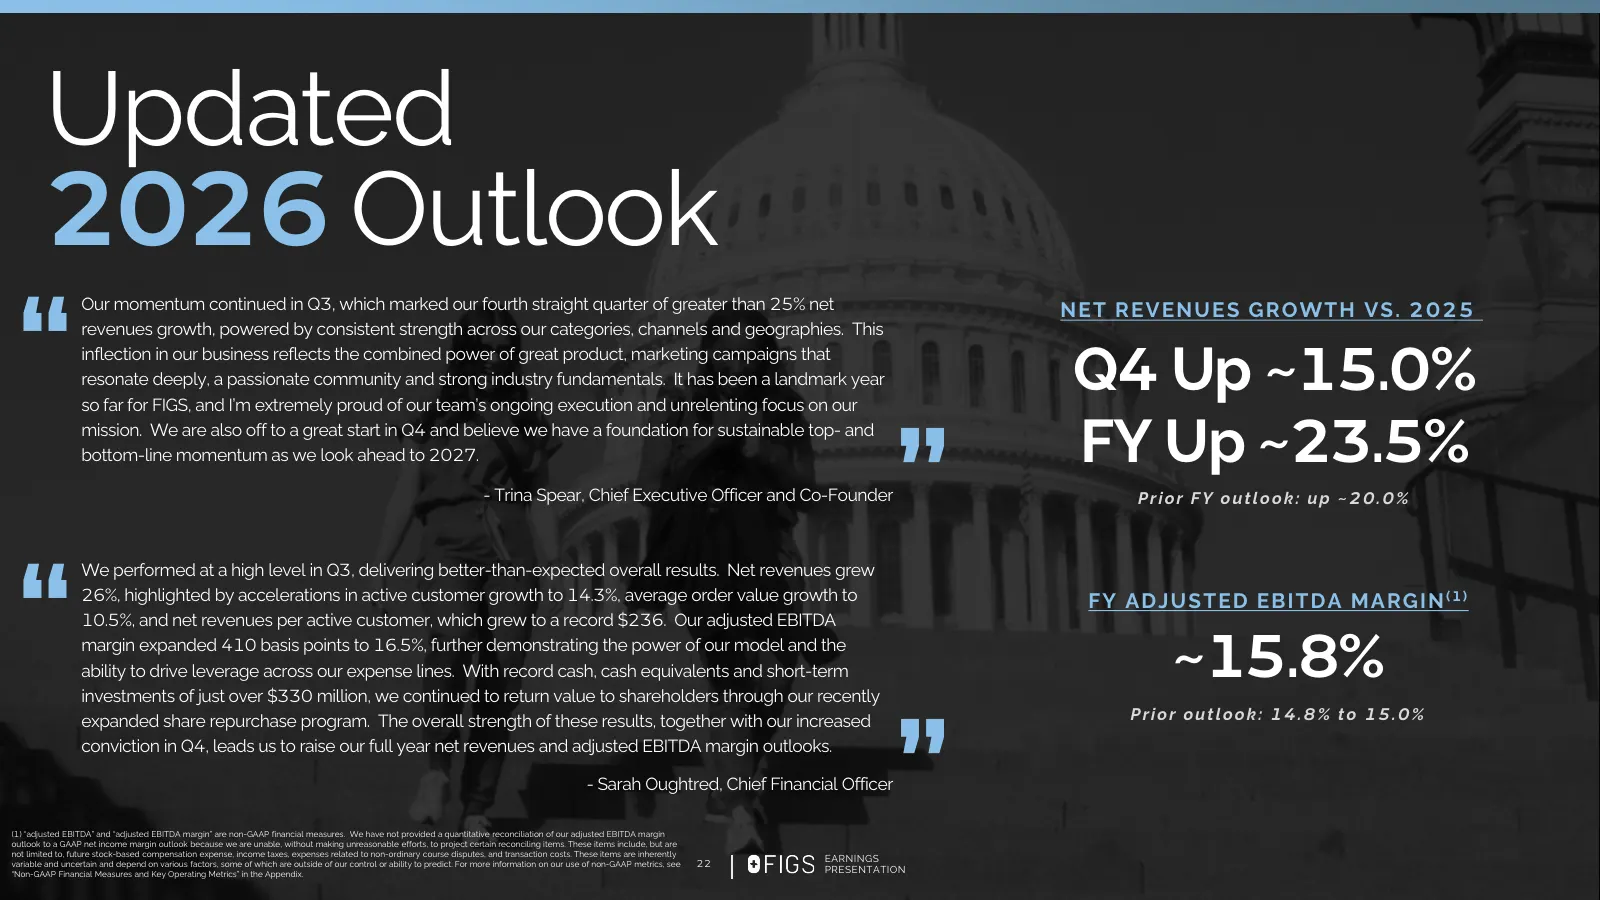
Slide 22: Updated 2026 Outlook
Updated 2026 Outlook “ Our momentum continued in Q3, which marked our fourth straight quarter of greater than 25% net N E T RE V E N U E S G ROW T H V S . 2 0 2 5 revenues growth, powered by consistent strength across our categories, channels and geographies. This inflection in our business reflects

Slide 23: Appendix
Appendix 25 | QFIGS breenranon
Slide 24: Non-GAAP Financial Measures and Key Operating Metrics
N ON - G A A P FIN A N C IA L M E A S U RE S A N D K E Y OP E RA T IN G M E T RIC S Included in this presentation are certain financial measures that are not calculated in accordance with U.S. generally accepted accounting principles (“GAAP”) and which are designed to supplement, and not as a substi
Slide 25: Non-GAAP Financial Measures and Key Operating Metrics (cont.)
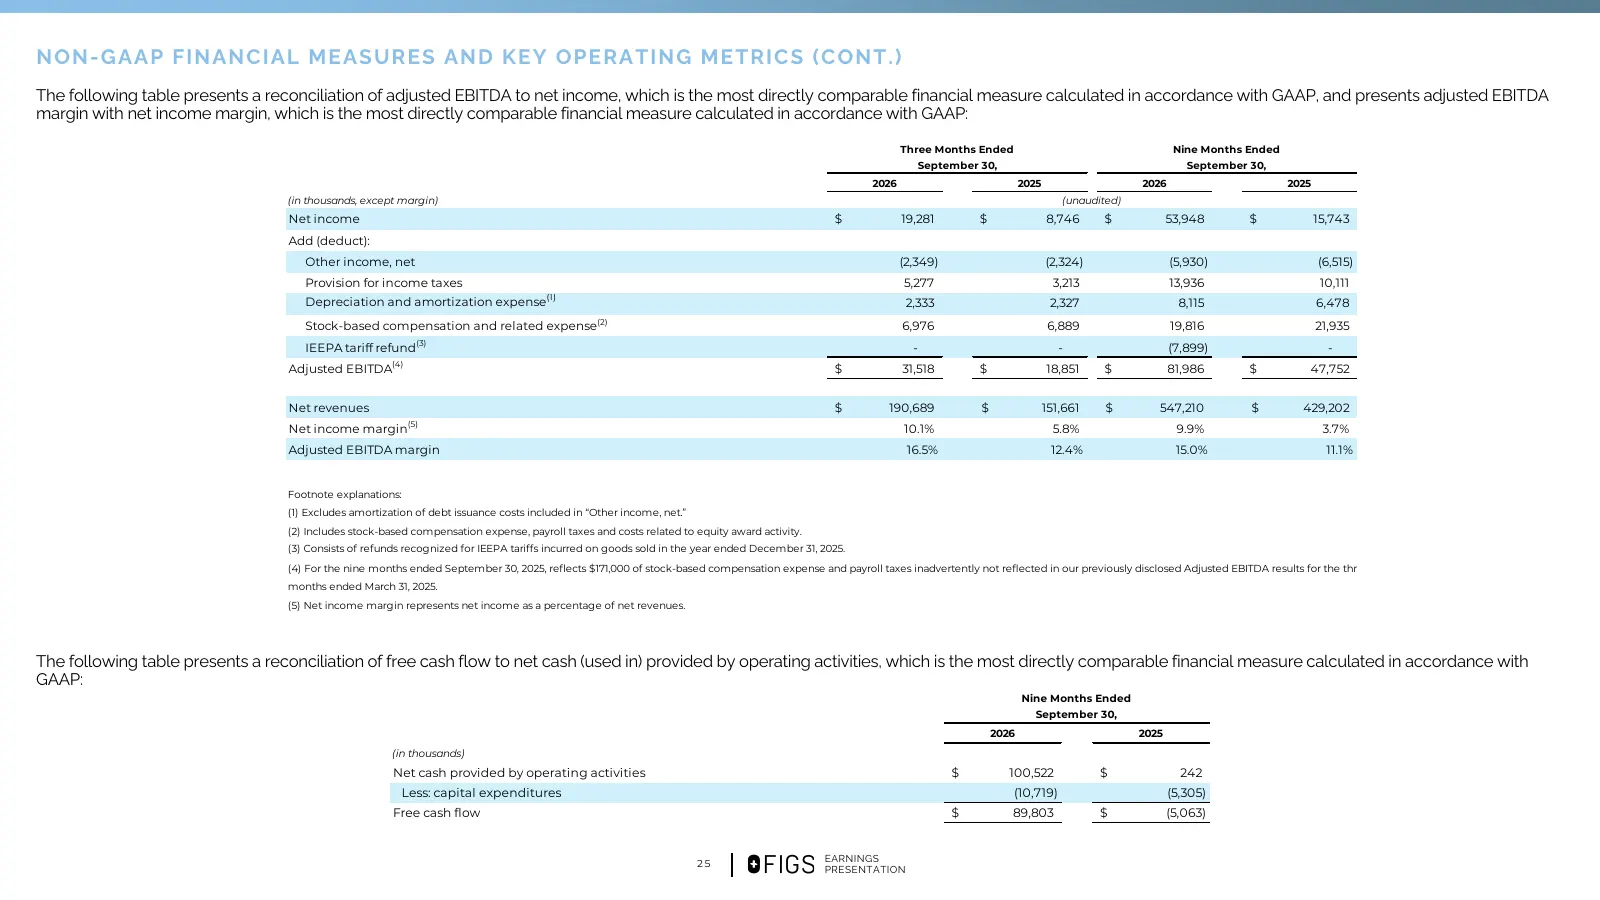
N ON - G A A P FIN A N C IA L M E A S U RE S A N D K E Y OP E RA T IN G M E T RIC S (C ON T . ) The following table presents a reconciliation of adjusted EBITDA to net income, which is the most directly comparable financial measure calculated in accordance with GAAP, and presents adjusted EBITDA mar
Slide 26: Non-GAAP Financial Measures and Key Operating Metrics (cont.)
N ON - G A A P FIN A N C IA L M E A S U RE S A N D K E Y OP E RA T IN G M E T RIC S (C ON T . ) The Company has also included herein “active customers,” “net revenues per active customer” and “average order value,” which are key operational and business metrics that are important to understanding Co
Source: 6ix earnings call
More decks from FIGS, Inc.
 Q2 2026 Earnings Presentation26 slides · Aug 6, 2026
 Q1 2026 Earnings Presentation26 slides · May 7, 2026
 Q4 2025 Earnings Presentation26 slides · Feb 26, 2026
 Q3 2025 Earnings Presentation26 slides · Nov 6, 2025
 Q1 2025 Earnings Presentation26 slides · May 8, 2025
 Q4 2024 Earnings Presentation26 slides · Feb 27, 2025