Noranda Aluminum — Q3 2010 Earnings Presentation
11 slides from Noranda Aluminum's earnings presentation, Oct 27, 2010
Slide 1: Third Quarter Results Conference Call
Third Quarter Results Conference Call Noranda Aluminum Holding Corp October 27, 2010 10:00 AM Eastern / 9:00 AM Central
Slide 2: Forward-Looking Statements
Forward-Looking Statements The following information contains, or may be deemed to contain, "forward-looking statements" (as defined in the U.S. Private Securities Litigation Reform Act of 1995). By their nature, forward-looking statements involve risks and uncertainties because they relate to event
Slide 3: Management Presenters
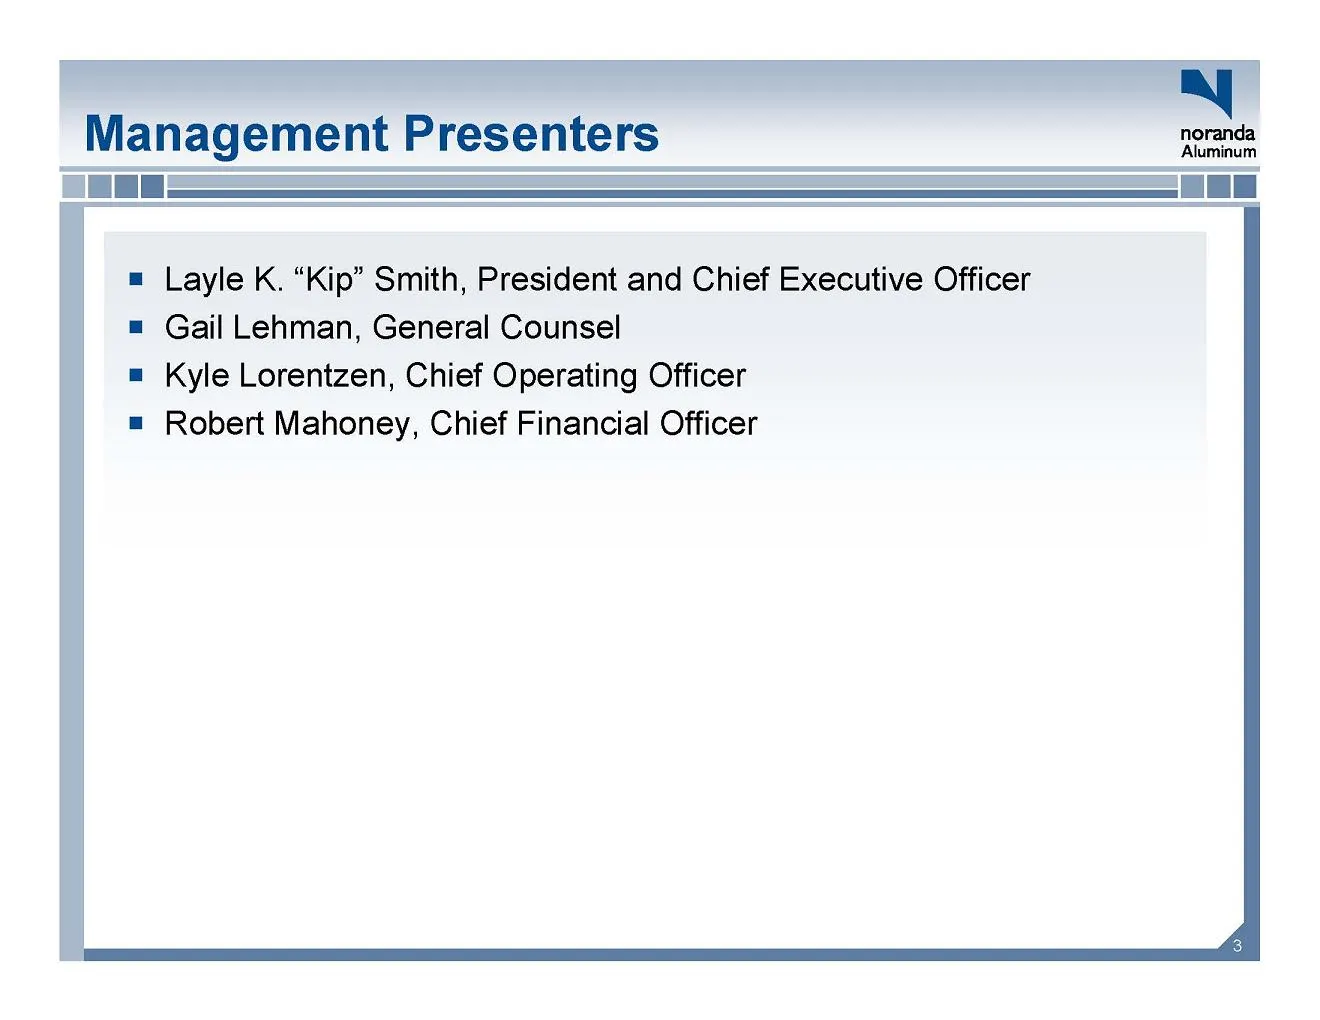
Management Presenters Other Placeholder: Layle K. “Kip” Smith, President and Chief Executive Officer, Gail Lehman, General Counsel, Kyle Lorentzen, Chief Operating Officer, Robert Mahoney, Chief Financial Officer
Slide 4: Third Quarter Highlights
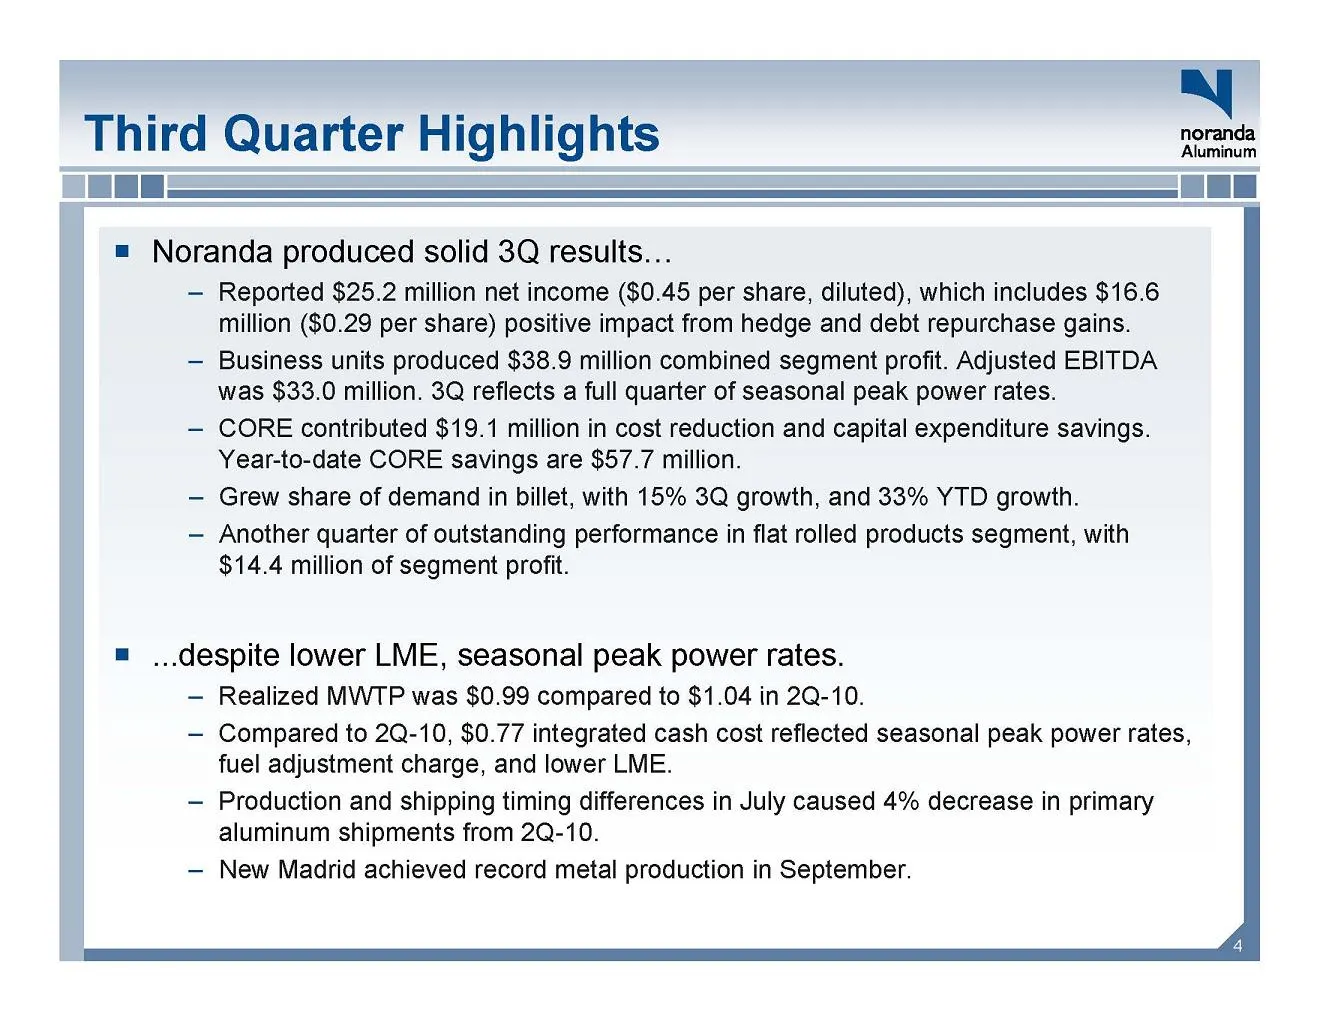
Third Quarter Highlights Other Placeholder: Noranda produced solid 3Q results… Reported $25.2 million net income ($0.45 per share, diluted), which includes $16.6 million ($0.29 per share) positive impact from hedge and debt repurchase gains. Business units produced $38.9 million combined segment pro
Slide 5: Third Quarter Highlights (cont'd)
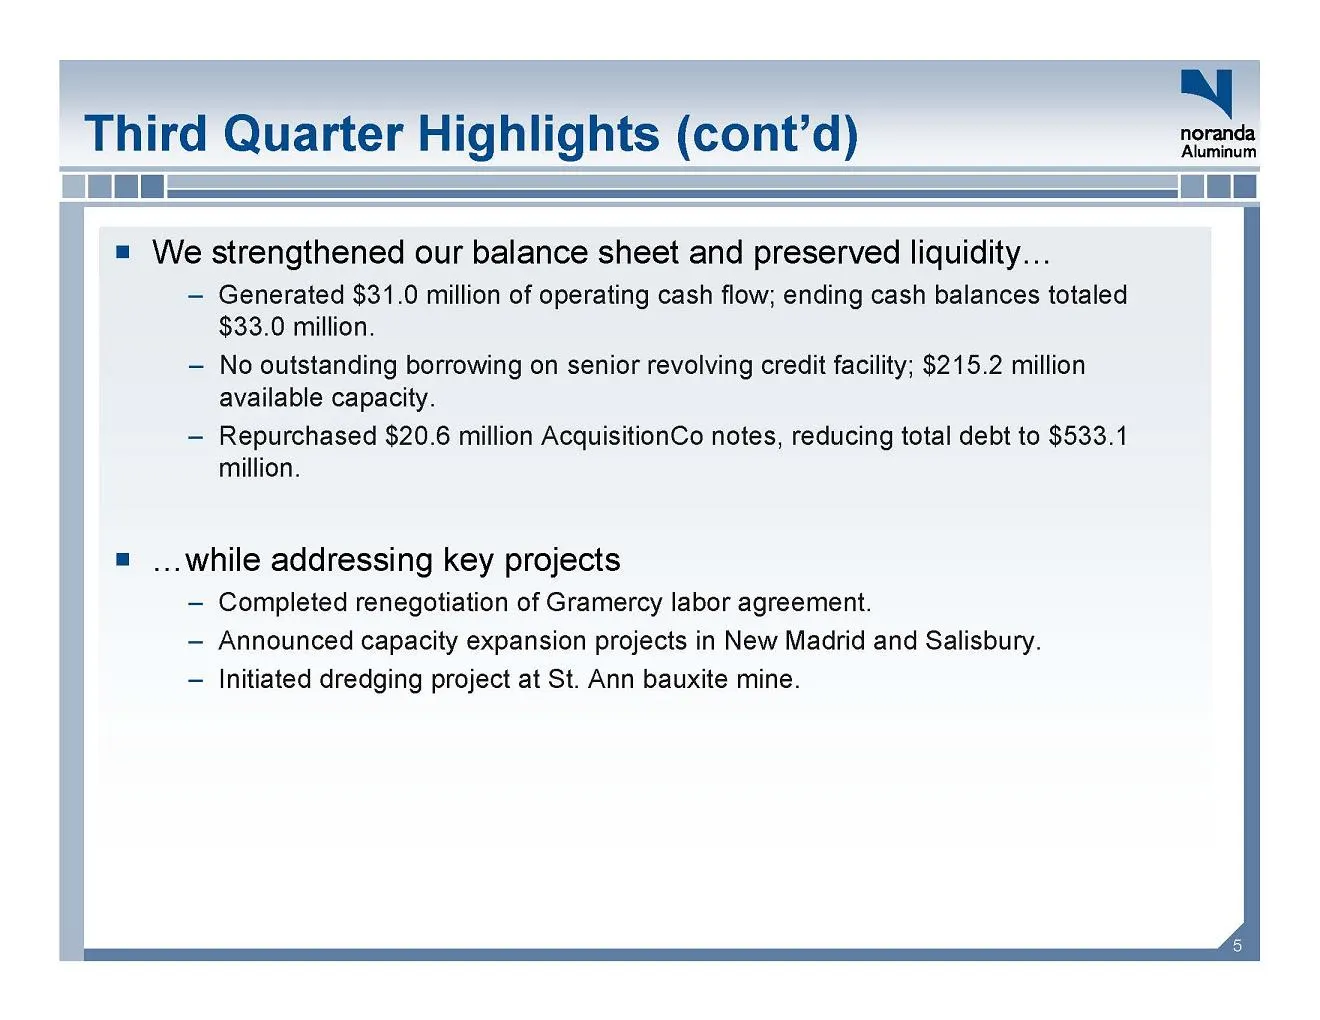
Third Quarter Highlights (cont’d) We strengthened our balance sheet and preserved liquidity… Generated $31.0 million of operating cash flow; ending cash balances totaled $33.0 million. No outstanding borrowing on senior revolving credit facility; $215.2 million available capacity. Repurchased $20.6
Slide 6: Market Fundamentals
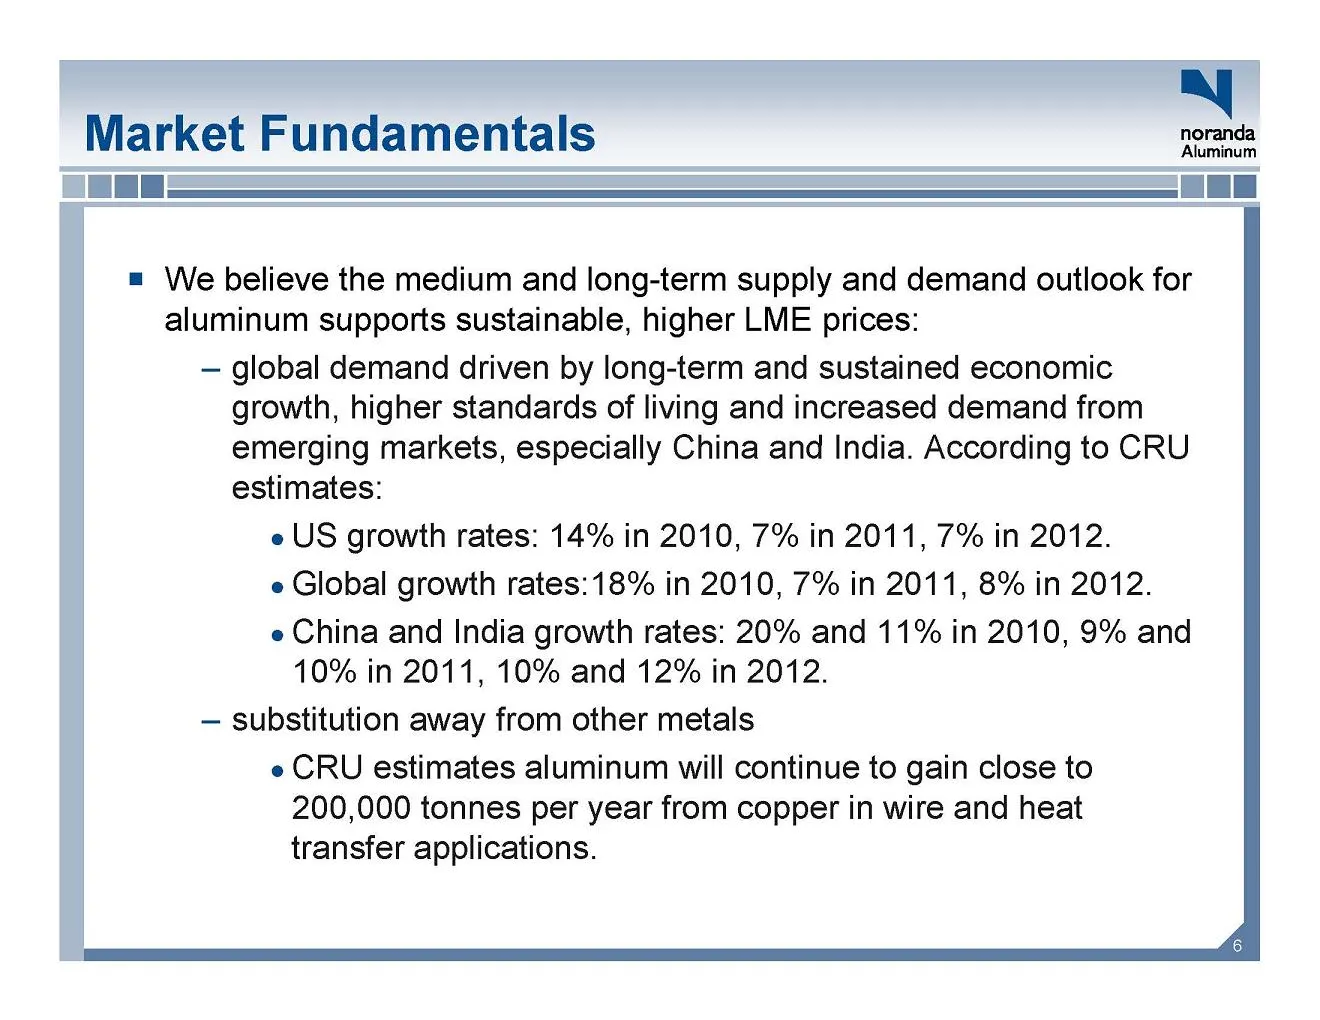
Market Fundamentals We believe the medium and long-term supply and demand outlook for aluminum supports sustainable, higher LME prices: global demand driven by long-term and sustained economic growth, higher standards of living and increased demand from emerging markets, especially China and India.
Slide 7: Integrated Upstream Business Review
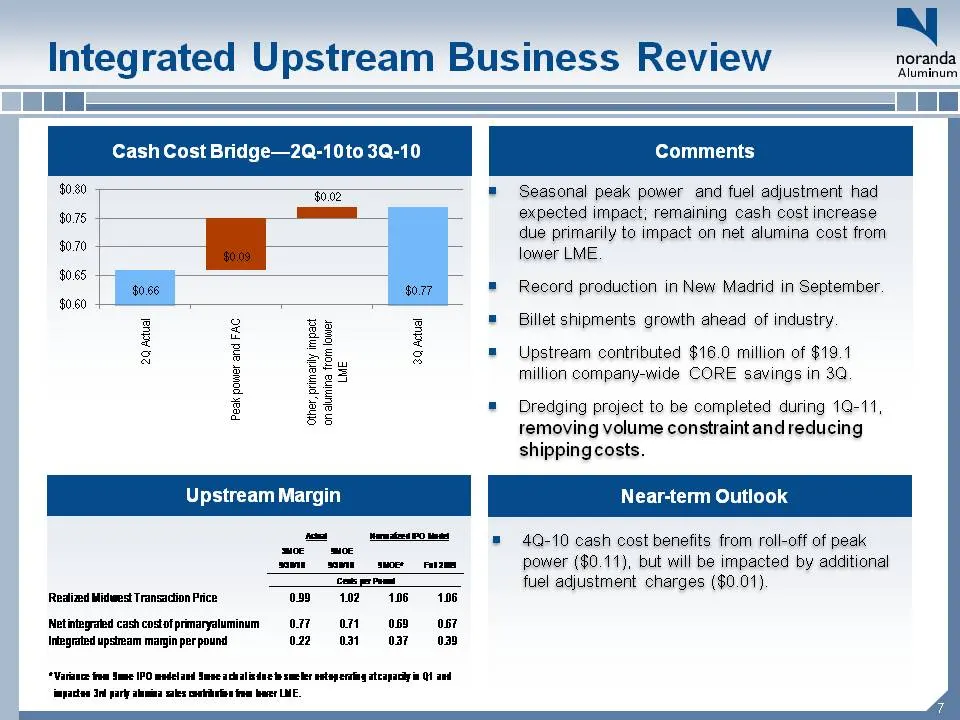
Integrated Upstream Business Review Cash Cost Bridge—2Q-10 to 3Q-10 Upstream Margin Seasonal peak power and fuel adjustment had expected impact; remaining cash cost increase due primarily to impact on net alumina cost from lower LME. Record production in New Madrid in September. Billet shipments gro
Slide 8: Flat Rolled Products Business Review
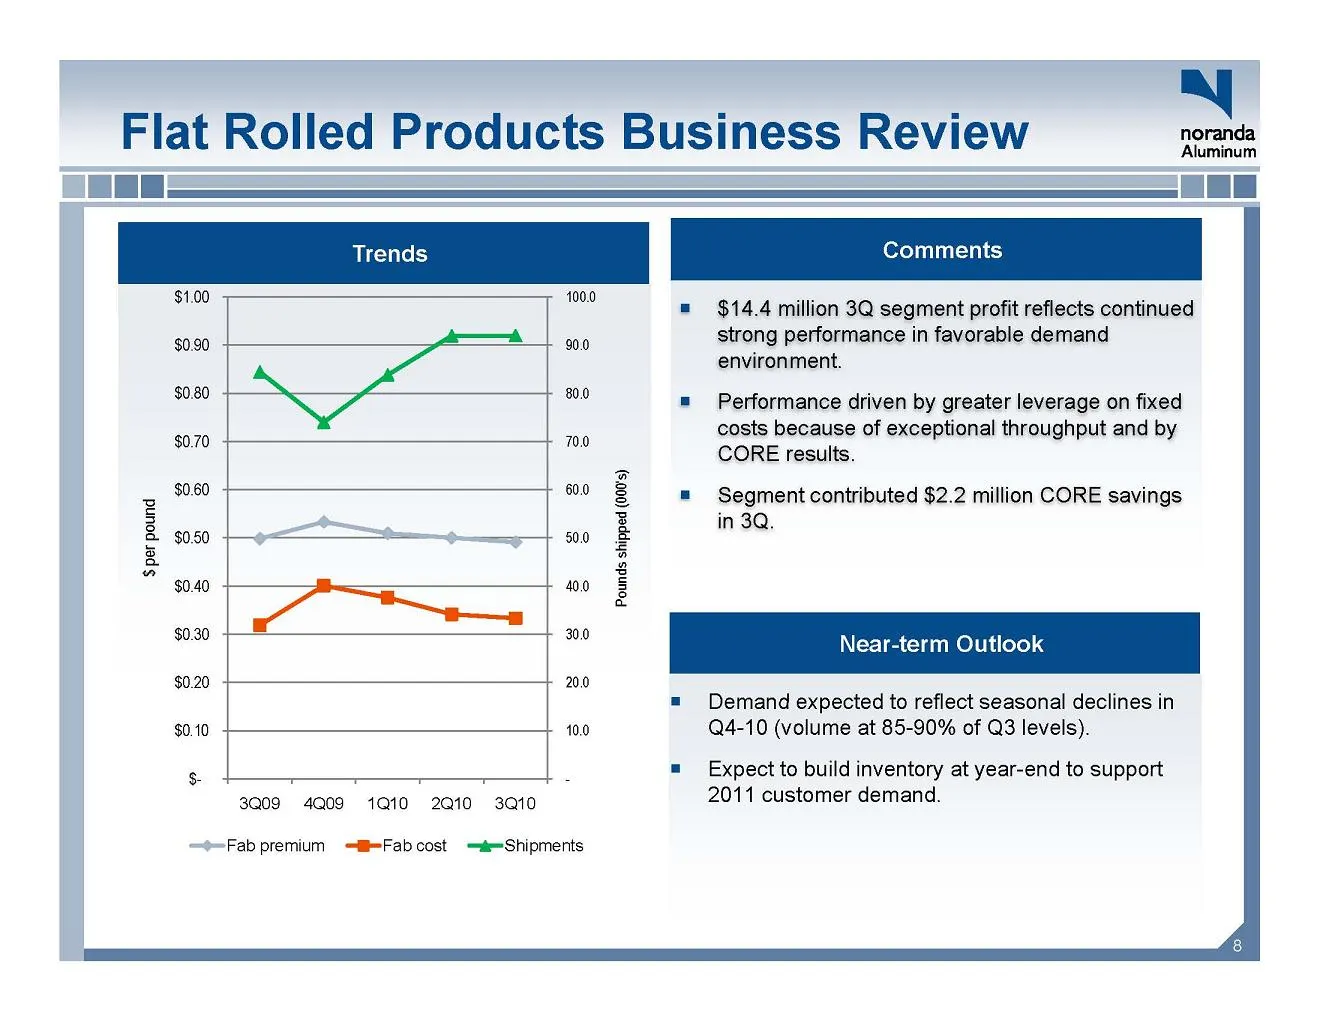
Flat Rolled Products Business Review Trends Comments .. $ 14.4 million 3Q segment profit reflects continued 100.0 $1.00 g p strong performance in favorable demand environment. .. Performance driven by greater leverage on fixed costs because of exceptional throughput and by CORE l 70.0 .80.0 90.0 $0.
Slide 9: Corporate Summary
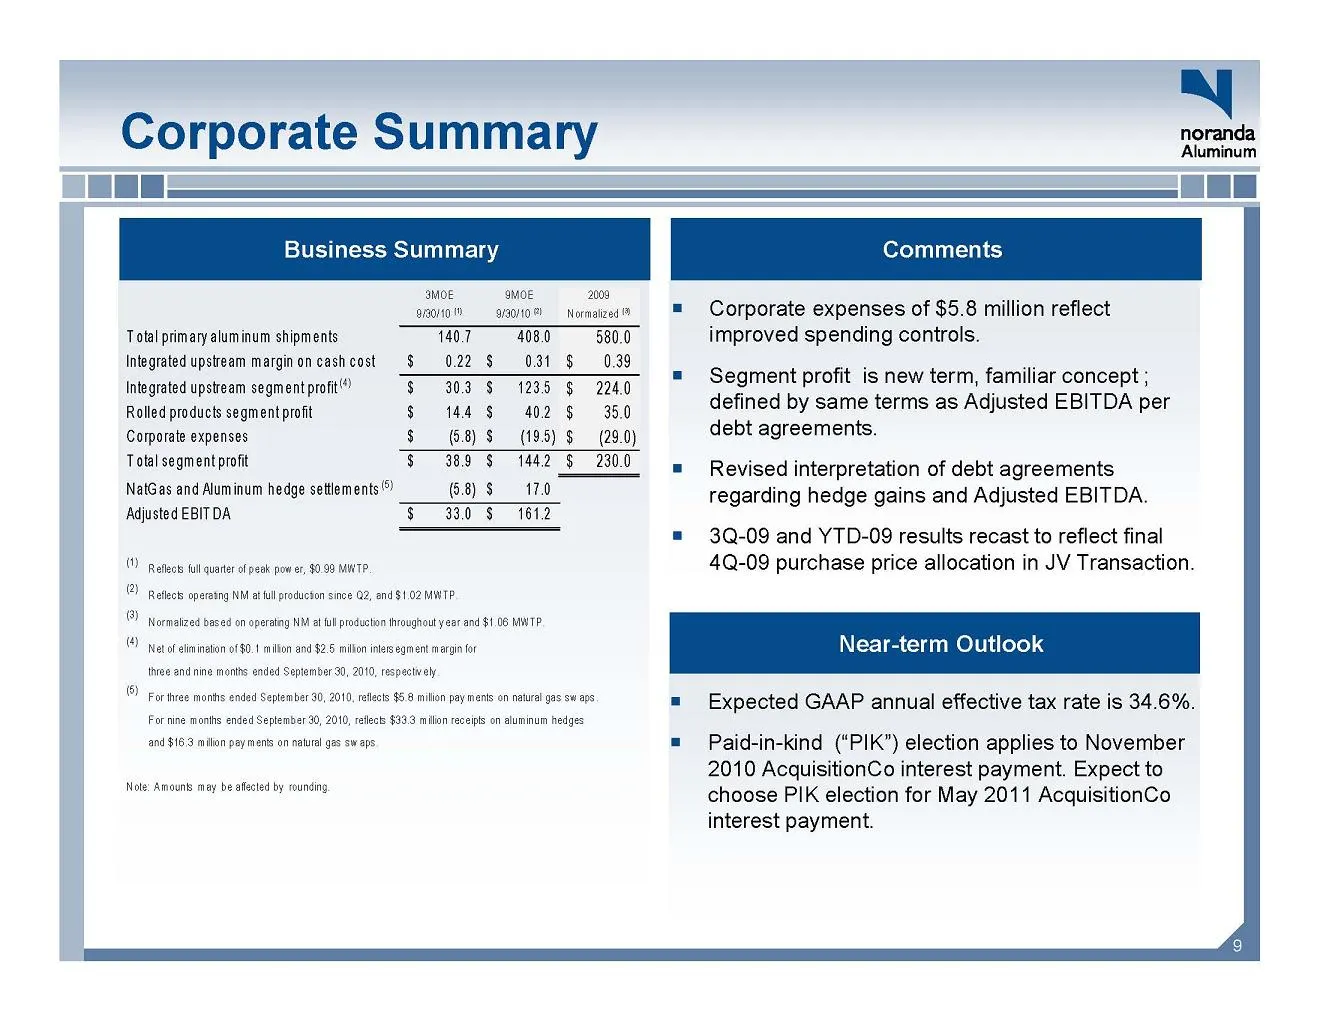
Corporate Summary Business Summary Comments .. Corporate expenses of $ 5.8 million reflect 3MOE 9/30/10 (1) 9MOE 9/30/10 (2) 2009 Normalized (3) p p improved spending controls. .. Segment profit is new term, familiar concept ; defined by same terms as Adjusted EBITDA per debt agreements. Total prima
Slide 10: Review of Liquidity and Financial Management
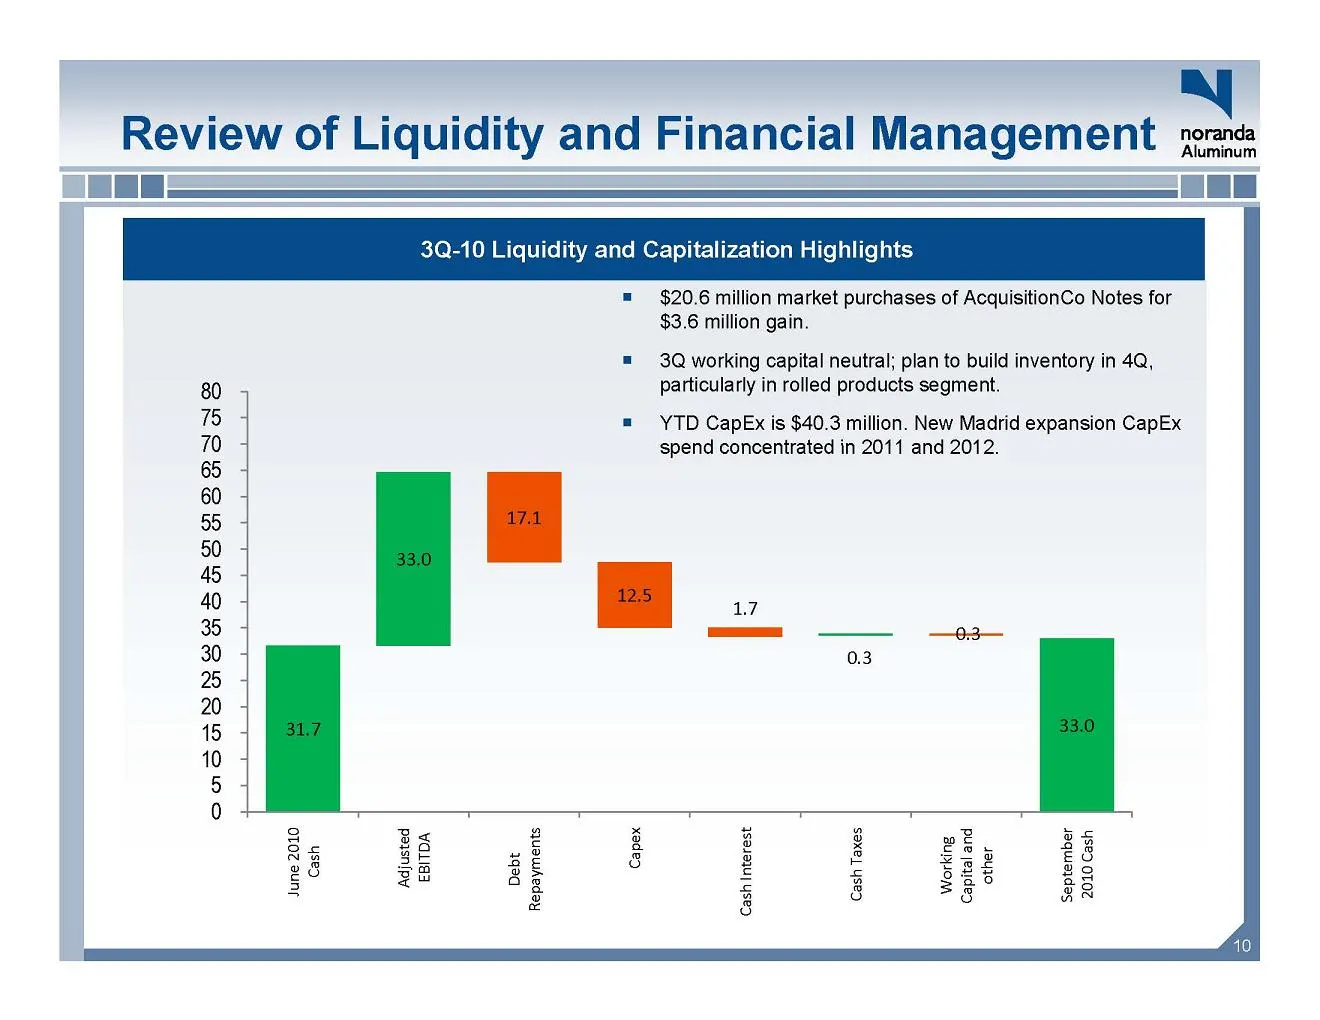
Review of Liquidity and Financial Management 3Q-10 Liquidity and Capitalization Highlights Other Placeholder: $20.6 million market purchases of AcquisitionCo Notes for $3.6 million gain. 3Q working capital neutral; plan to build inventory in 4Q, particularly in rolled products segment. YTD CapEx is
Slide 11: Key Takeaways
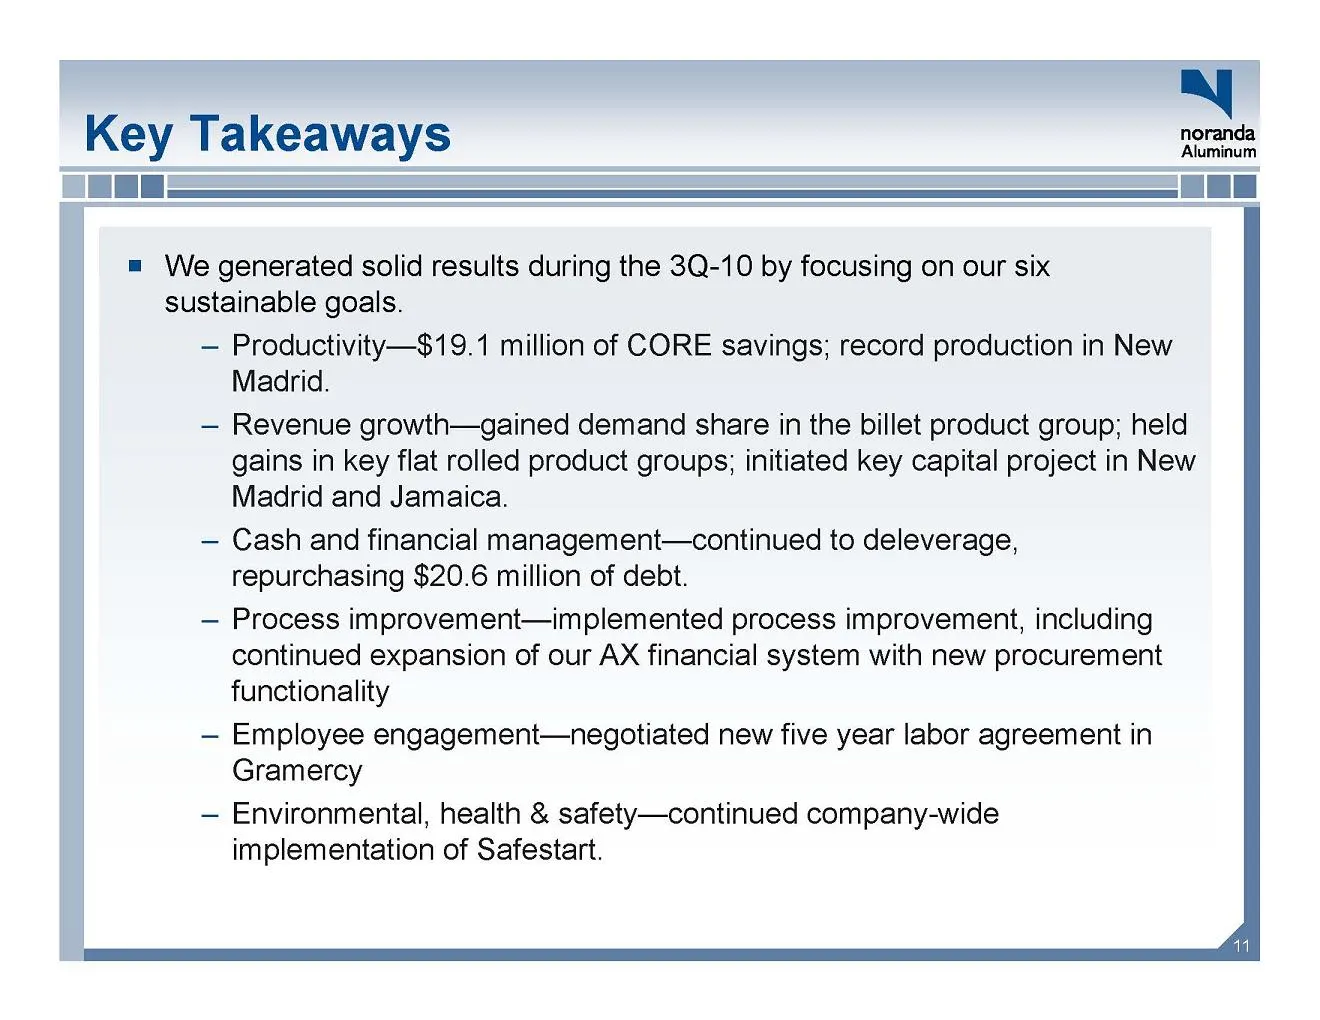
Key Takeaways .. We generated solid results during the 3Q-10 by focusing on our six sustainable goals. g – Productivity—$19.1 million of CORE savings; record production in New Madrid. – Revenue growth—gained demand share in the billet product group; held gains in key flat rolled product groups; init
Source: SEC EDGAR · 8-K filed Oct 27, 2010
More decks from Noranda Aluminum Holding Corp
 Q3 2015 Earnings Presentation10 slides · Nov 9, 2015
 Q2 2015 Earnings Presentation11 slides · Jul 22, 2015
 Q1 2015 Earnings Presentation15 slides · May 6, 2015
 Q4 2014 Earnings Presentation15 slides · Feb 18, 2015
 Q3 2014 Earnings Presentation15 slides · Nov 3, 2014
 Q2 2014 Earnings Presentation16 slides · Aug 11, 2014