TC Energy Corporation · TSX:TRP
TC Energy — Investor Presentation (November 2026)
47 slides from TC Energy's investor presentation, November 2026

Slide 1: Corporate Profile
Corporate Profile November 2026
Slide 2: Forward-looking information and non-GAAP/supplementary financial measures
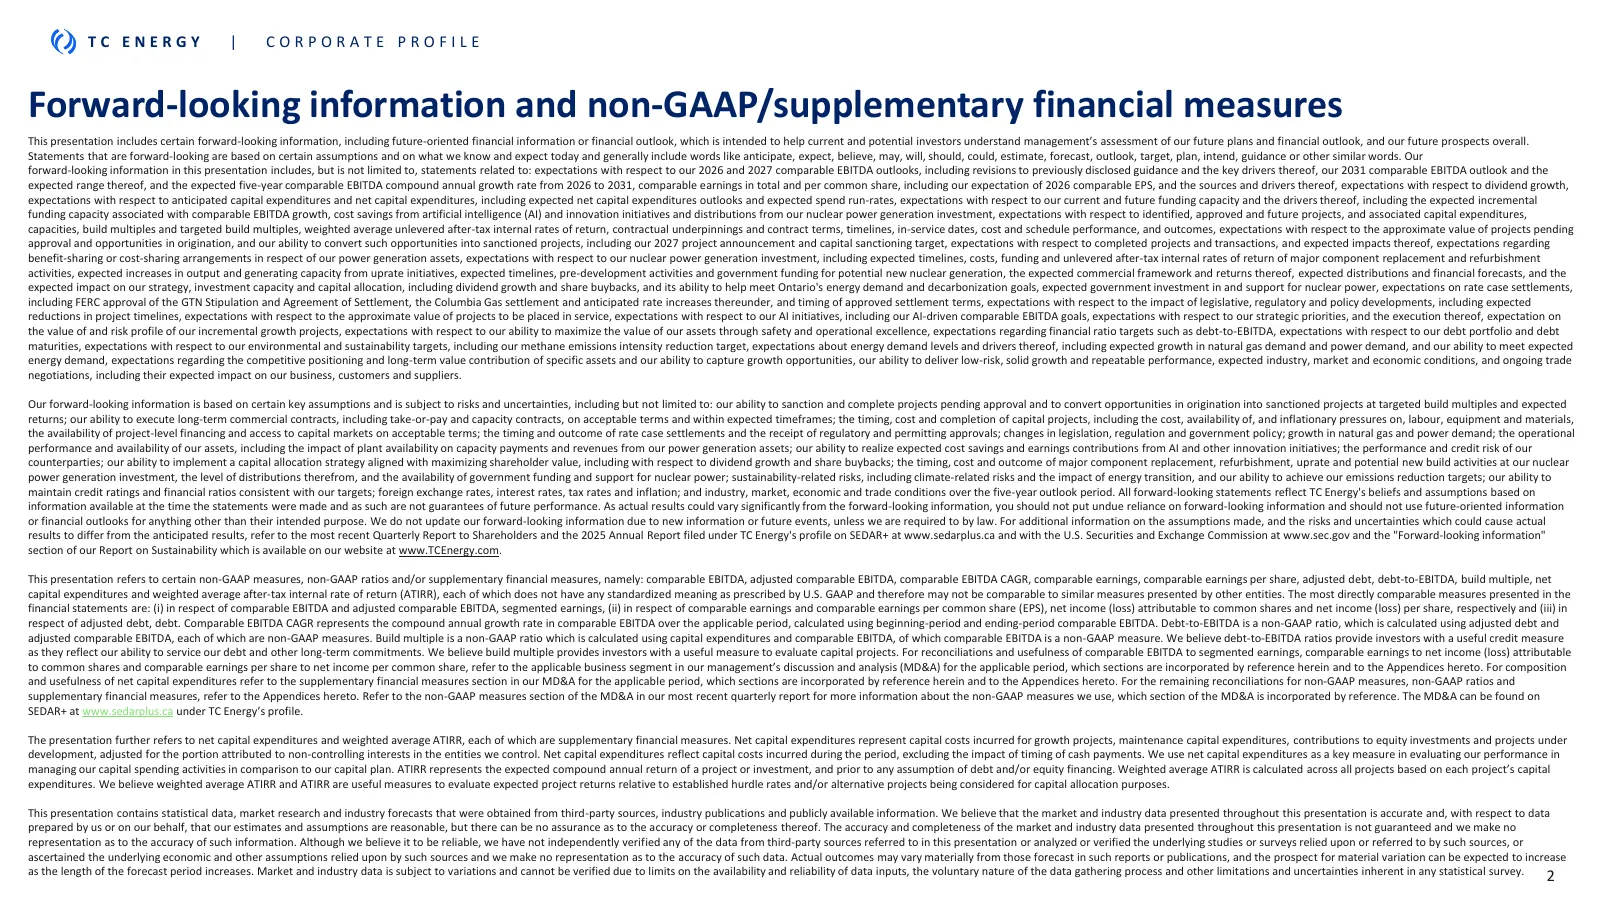
TC ENERGY | CORPORATE PROFILE Forward-looking information and non-GAAP/supplementary financial measures This presentation includes certain forward-looking information, including future-oriented financial information or financial outlook, which is intended to help current and potential investors unde
Slide 3: Strategic outlook
TC ENERGY | CORPORATE PROFILE CORPORATE PROFILE Strategic outlook | TC E N E RGY
Slide 4: A premium value proposition built for the opportunity ahead
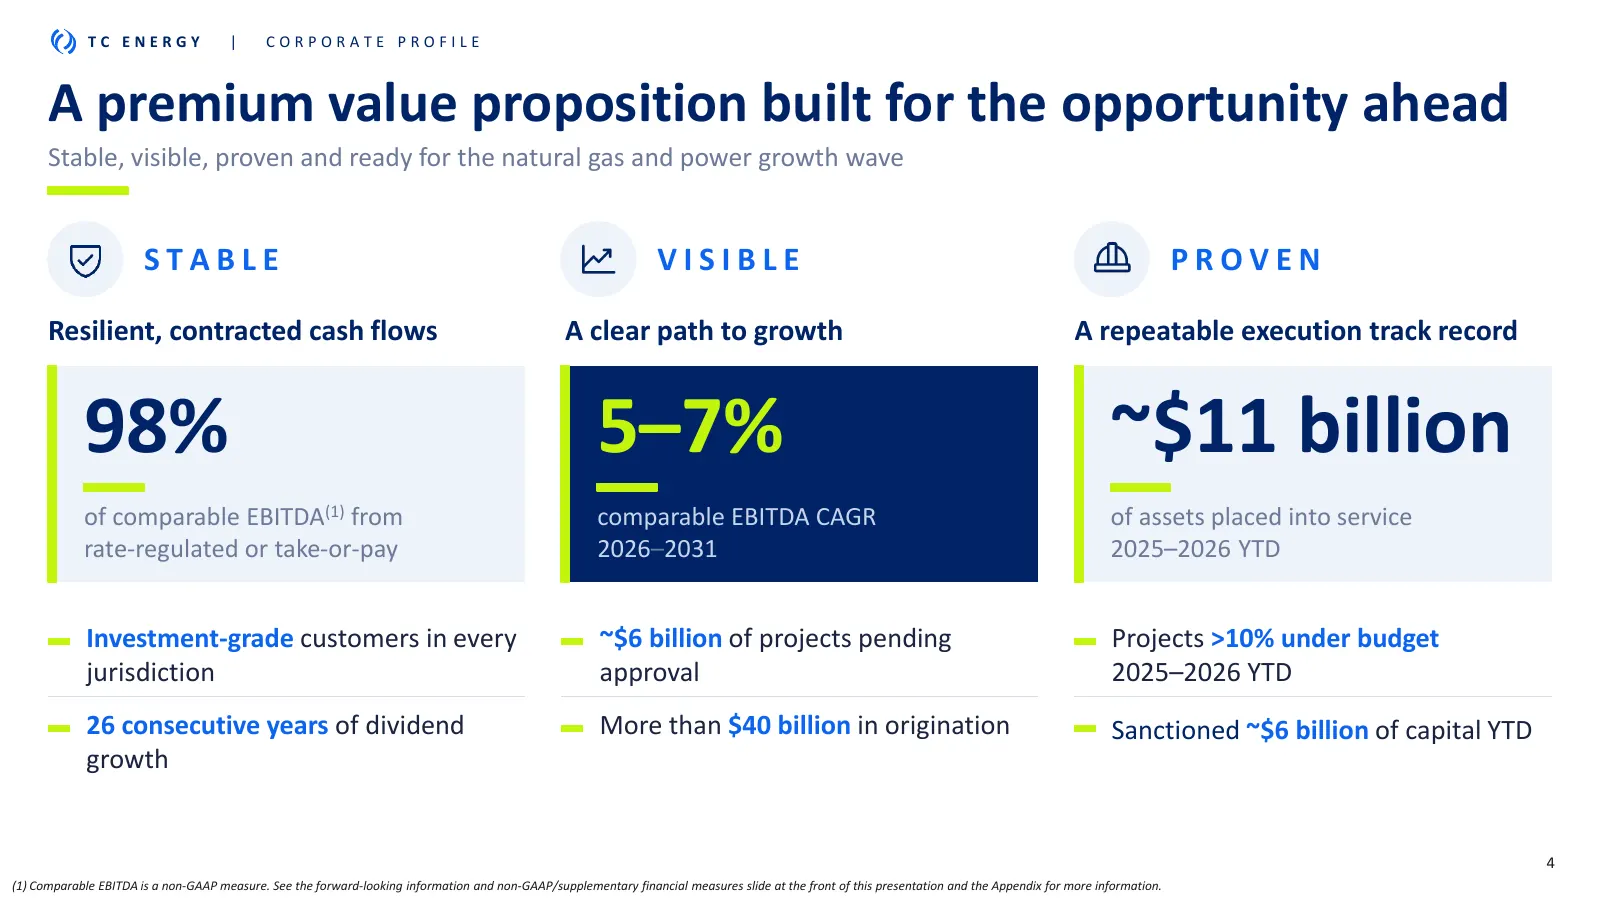
TC ENERGY | CORPORATE PROFILE A premium value proposition built for the opportunity ahead Stable, visible, proven and ready for the natural gas and power growth wave STABLE VISIBLE PROVEN Resilient, contracted cash flows A clear path to growth A repeatable execution track record 98% 5–7% ~$11 billio
Slide 5: One-of-one asset portfolio
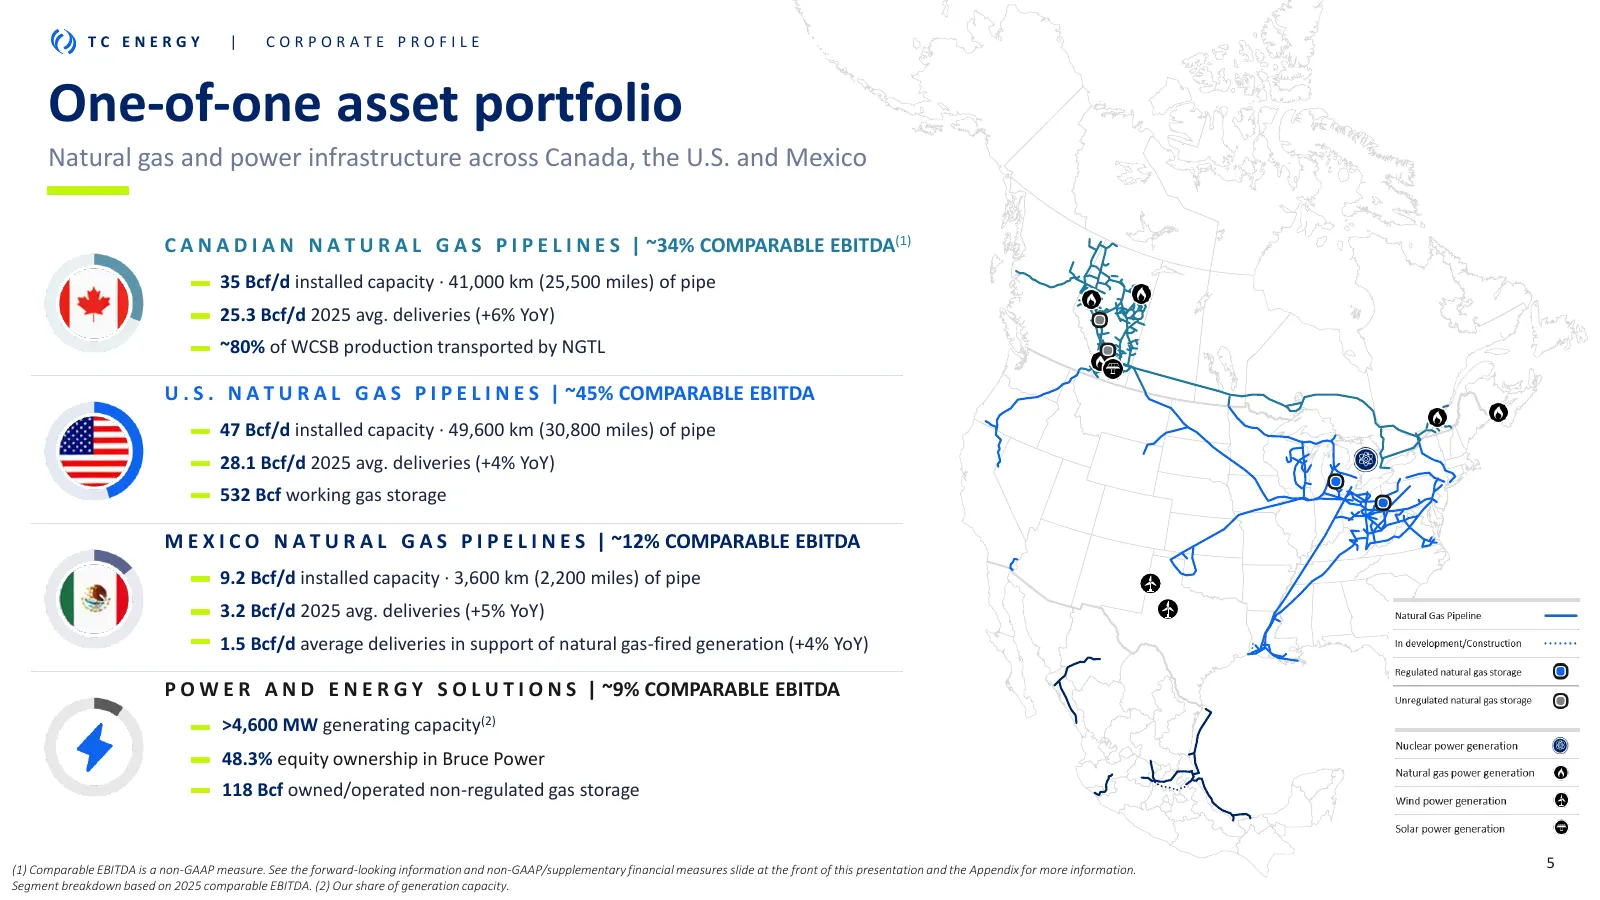
TC ENERGY | CORPORATE PROFILE One-of-one asset portfolio Natural gas and power infrastructure across Canada, the U.S. and Mexico C A N A D I A N N A T U R A L G A S P I P E L I N E S | ~34% COMPARABLE EBITDA(1) 35 Bcf/d installed capacity · 41,000 km (25,500 miles) of pipe 25.3 Bcf/d 2025 avg. deliv
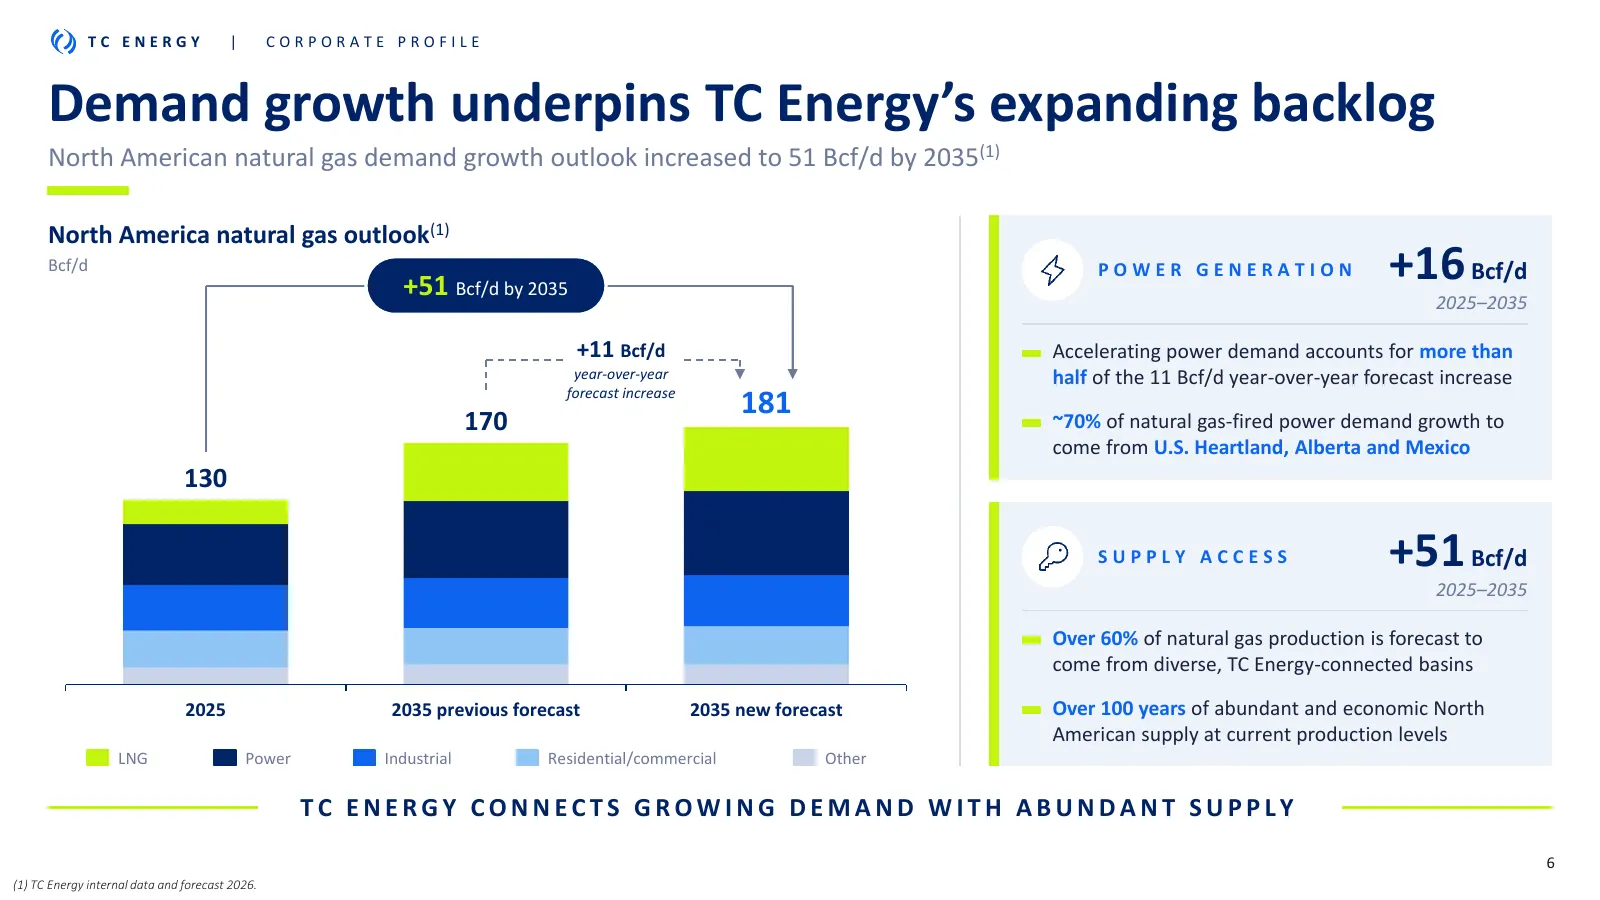
Slide 6: Demand growth underpins TC Energy's expanding backlog
TC ENERGY | CORPORATE PROFILE Demand growth underpins TC Energy’s expanding backlog North American natural gas demand growth outlook increased to 51 Bcf/d by 2035(1) North America natural gas outlook(1) Bcf/d +51 Bcf/d by 2035 POWER GENERATION +16 Bcf/d 2025–2035 +11 Bcf/d Accelerating power demand
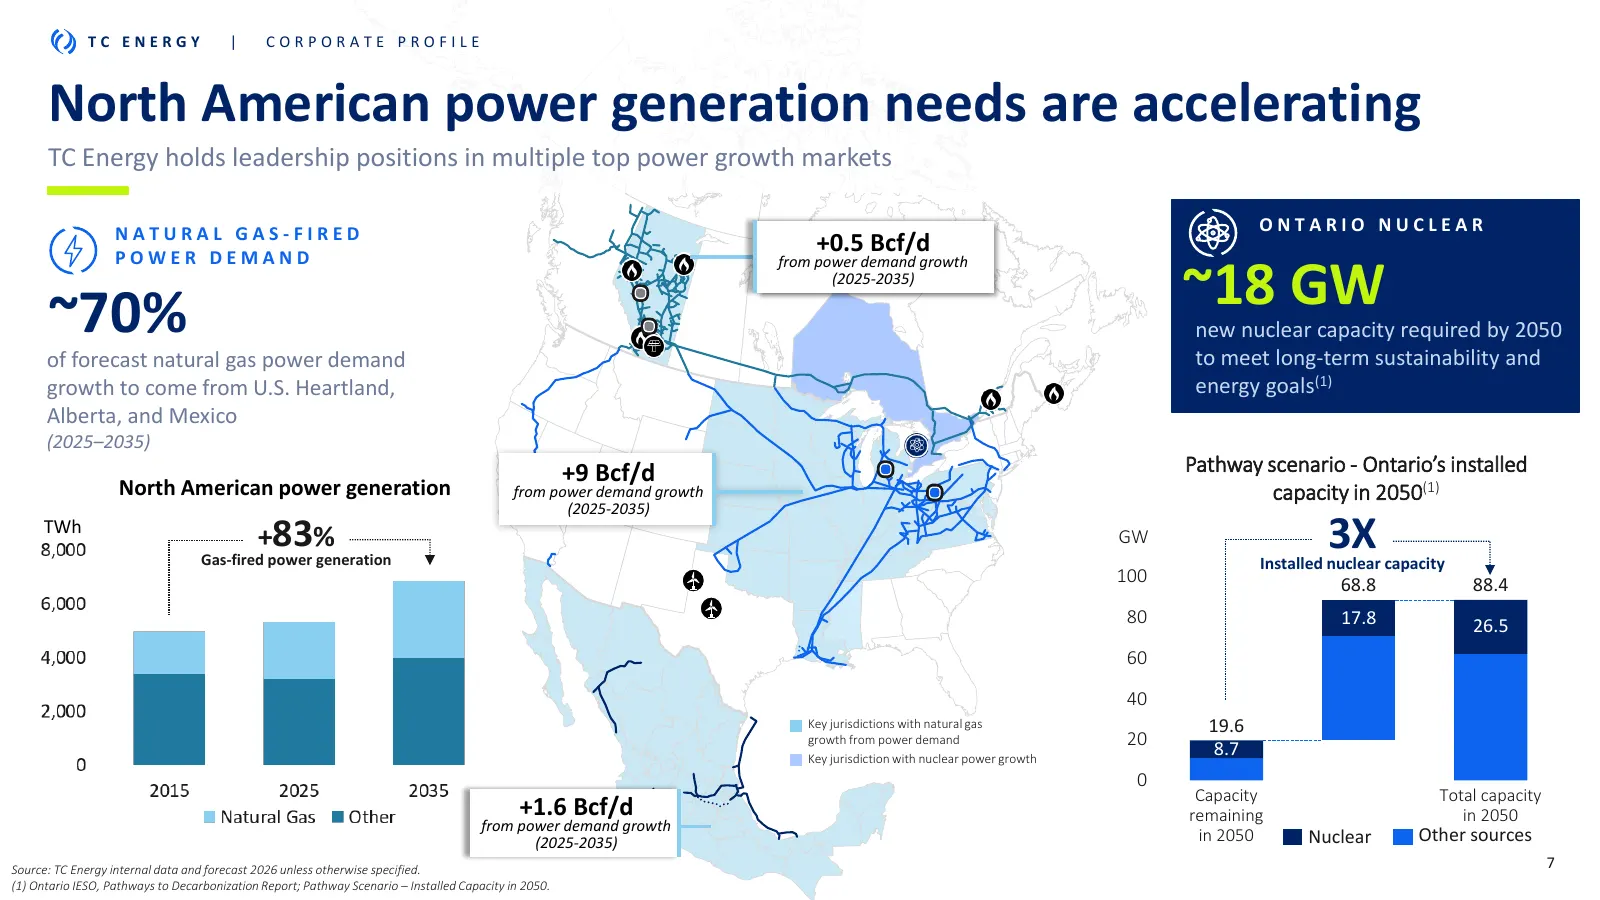
Slide 7: North American power generation needs are accelerating
TC ENERGY | CORPORATE PROFILE North American power generation needs are accelerating TC Energy holds leadership positions in multiple top power growth markets NATURAL GAS-FIRED ONTARIO NUCLEAR POWER DEMAND +0.5 Bcf/d from power demand growth ~70% (2025-2035) ~18 GW new nuclear capacity required by 2
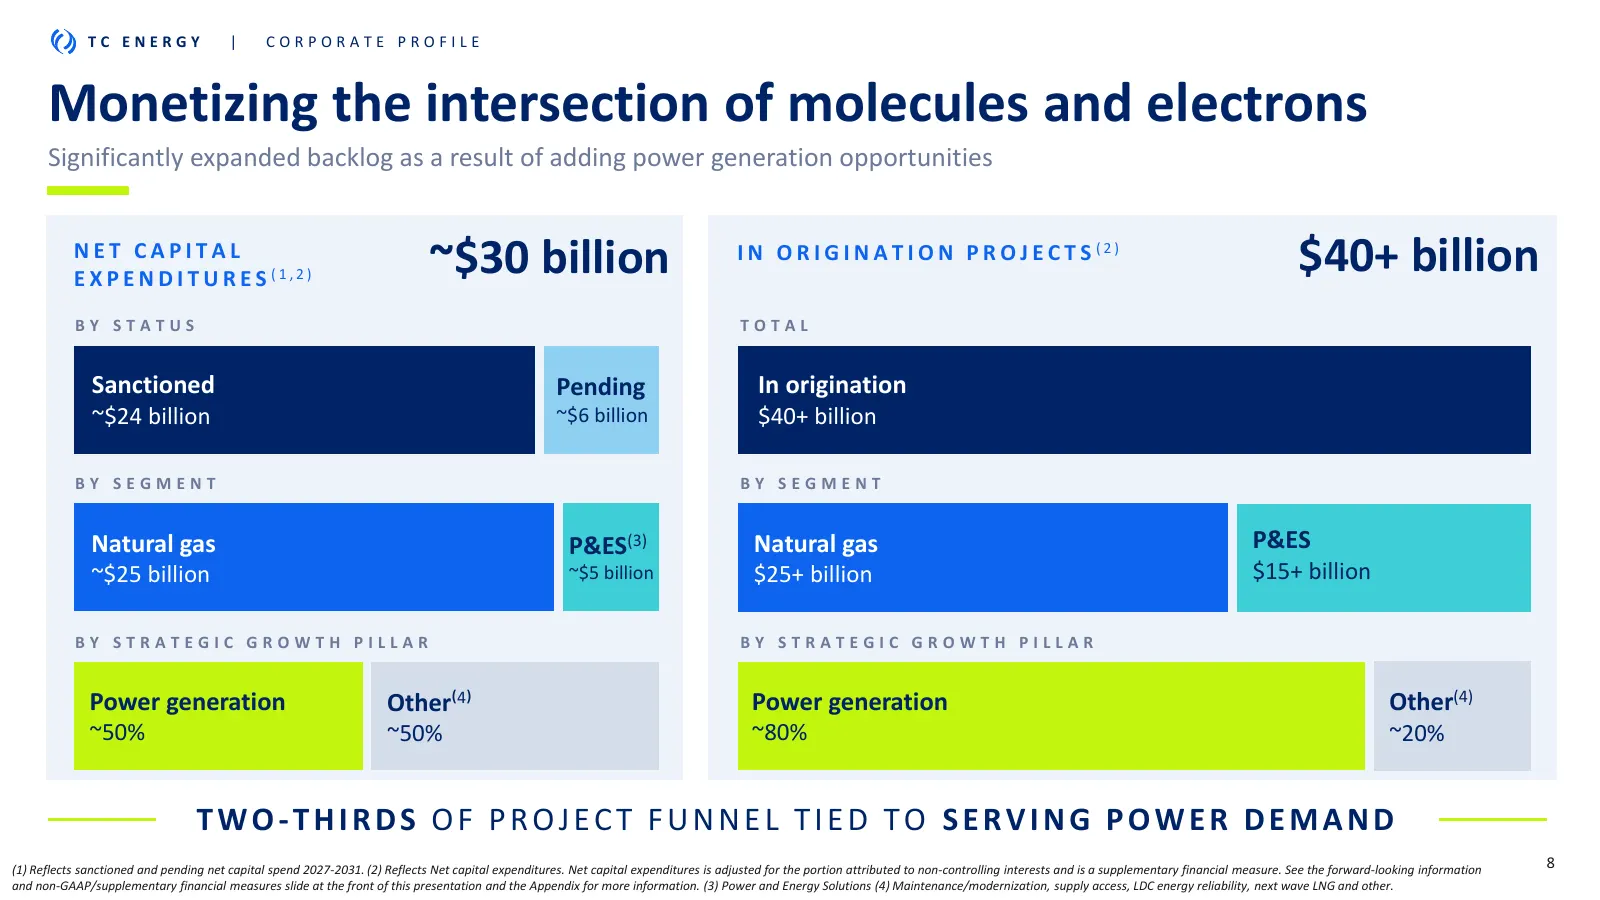
Slide 8: Monetizing the intersection of molecules and electrons
TC ENERGY | CORPORATE PROFILE Monetizing the intersection of molecules and electrons Significantly expanded backlog as a result of adding power generation opportunities NET CAPITAL E X P E N D I T U R E S (1,2) ~$30 billion I N O R I G I N A T I O N P R O J E C T S (2) $40+ billion BY STATUS TOTAL S
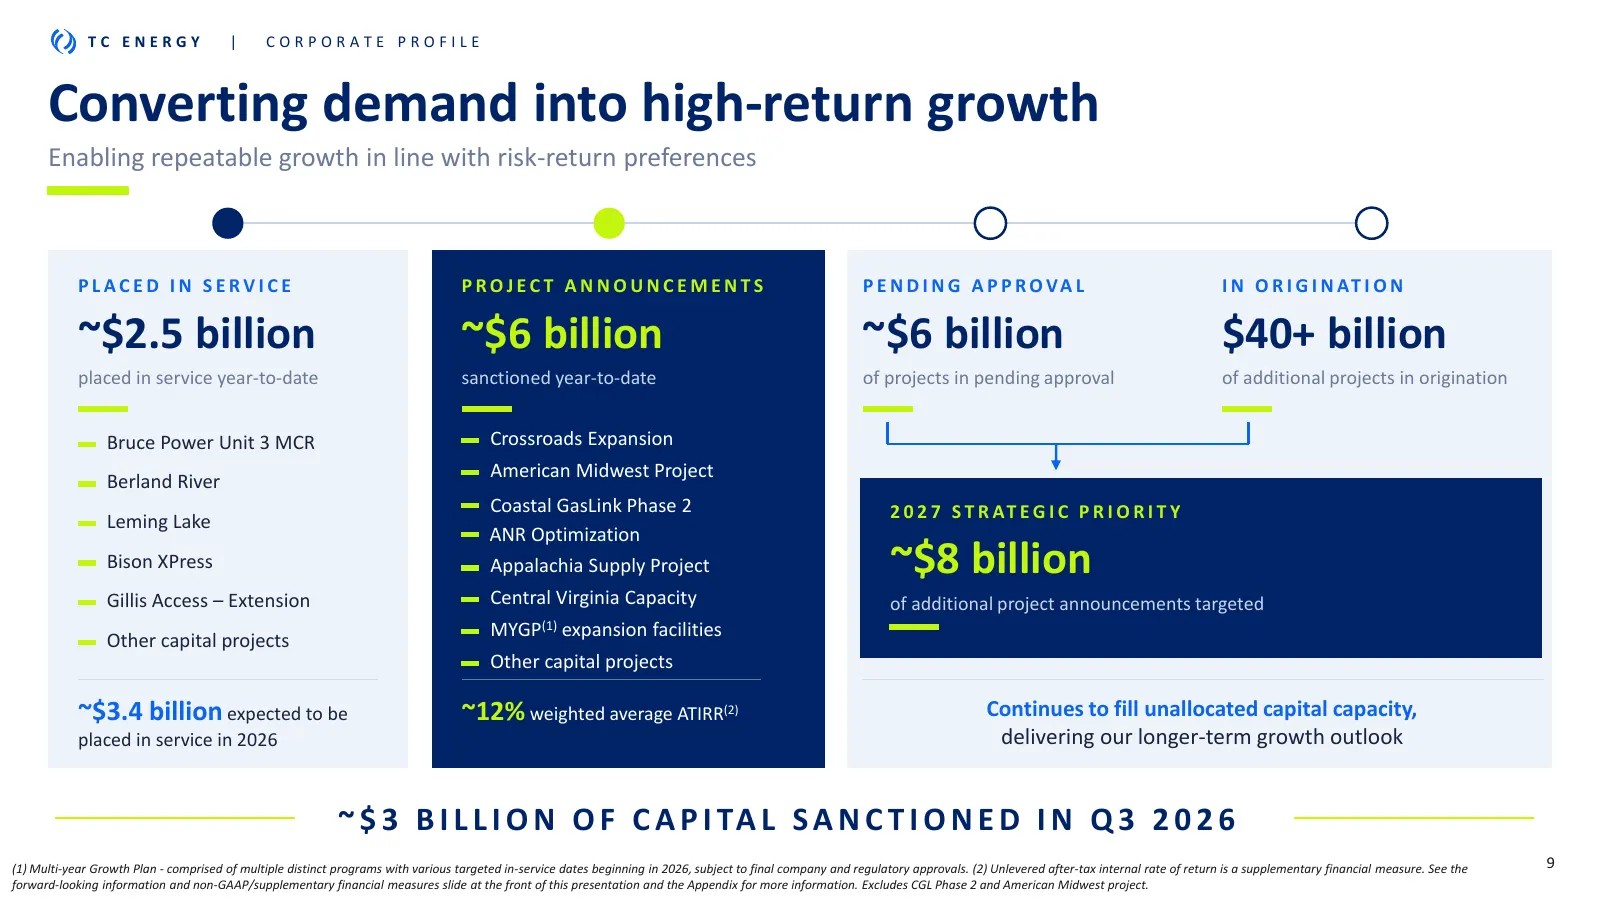
Slide 9: Converting demand into high-return growth
TC ENERGY | CORPORATE PROFILE Converting demand into high-return growth Enabling repeatable growth in line with risk-return preferences PLACED IN SERVICE PROJECT ANNOUNCEMENTS P E N D I N G A P P R OVA L I N O R I G I N AT I O N ~$2.5 billion ~$6 billion ~$6 billion $40+ billion placed in service ye
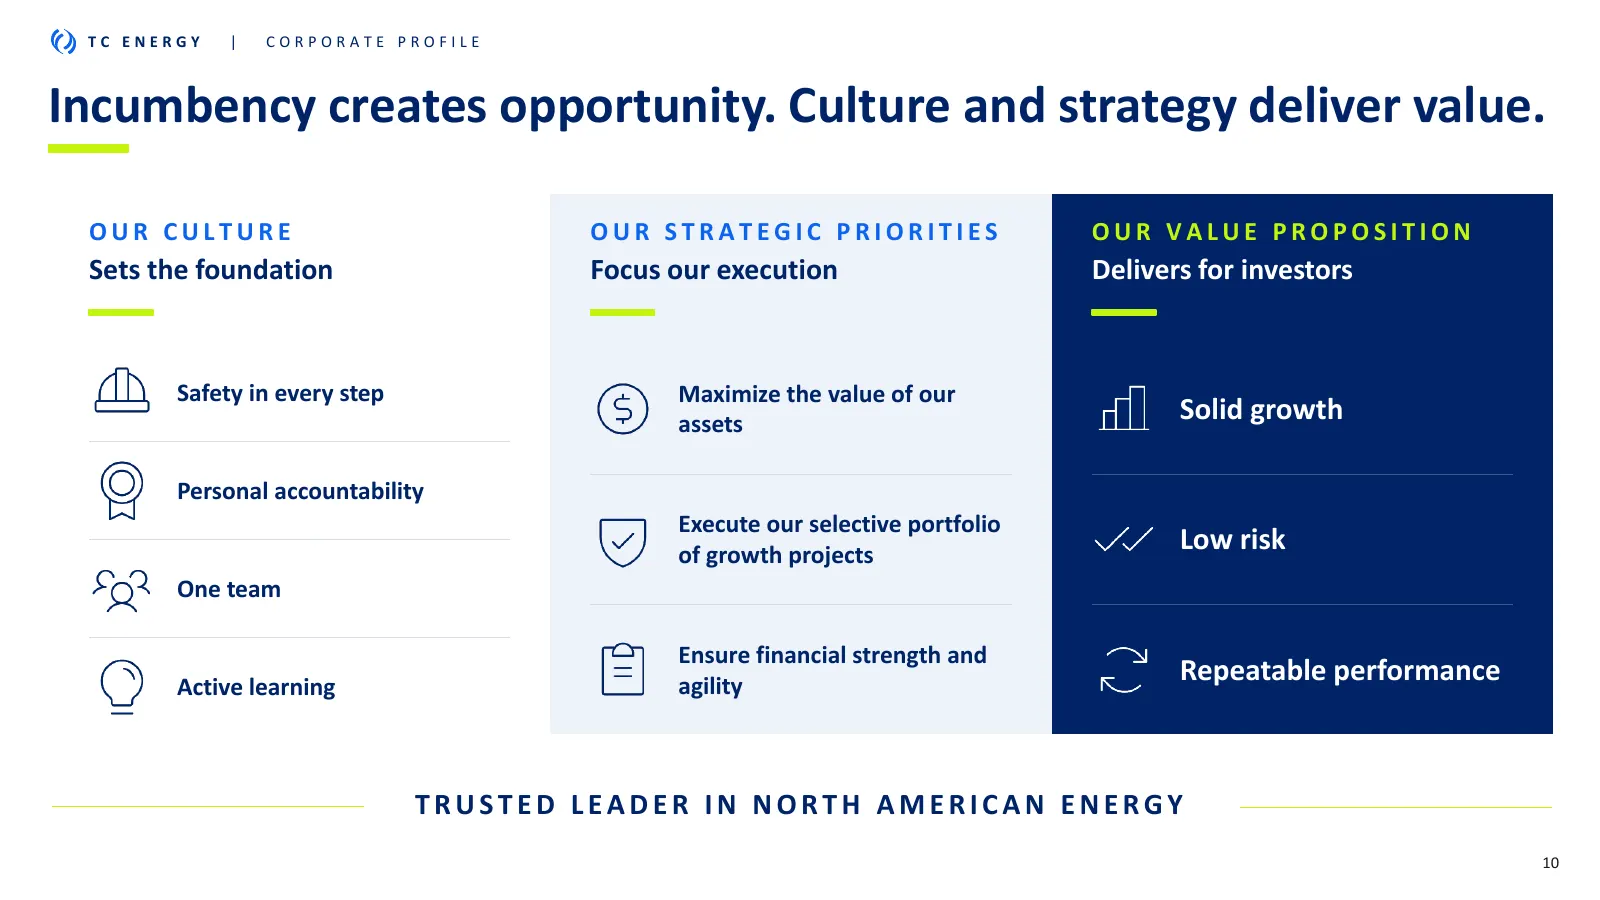
Slide 10: Incumbency creates opportunity. Culture and strategy deliver value.
TC ENERGY | CORPORATE PROFILE Incumbency creates opportunity. Culture and strategy deliver value. OUR CULTURE OUR STRATEGIC PRIORITIES OUR VALUE PROPOSITION Sets the foundation Focus our execution Delivers for investors Safety in every step Maximize the value of our assets Solid growth Personal acco
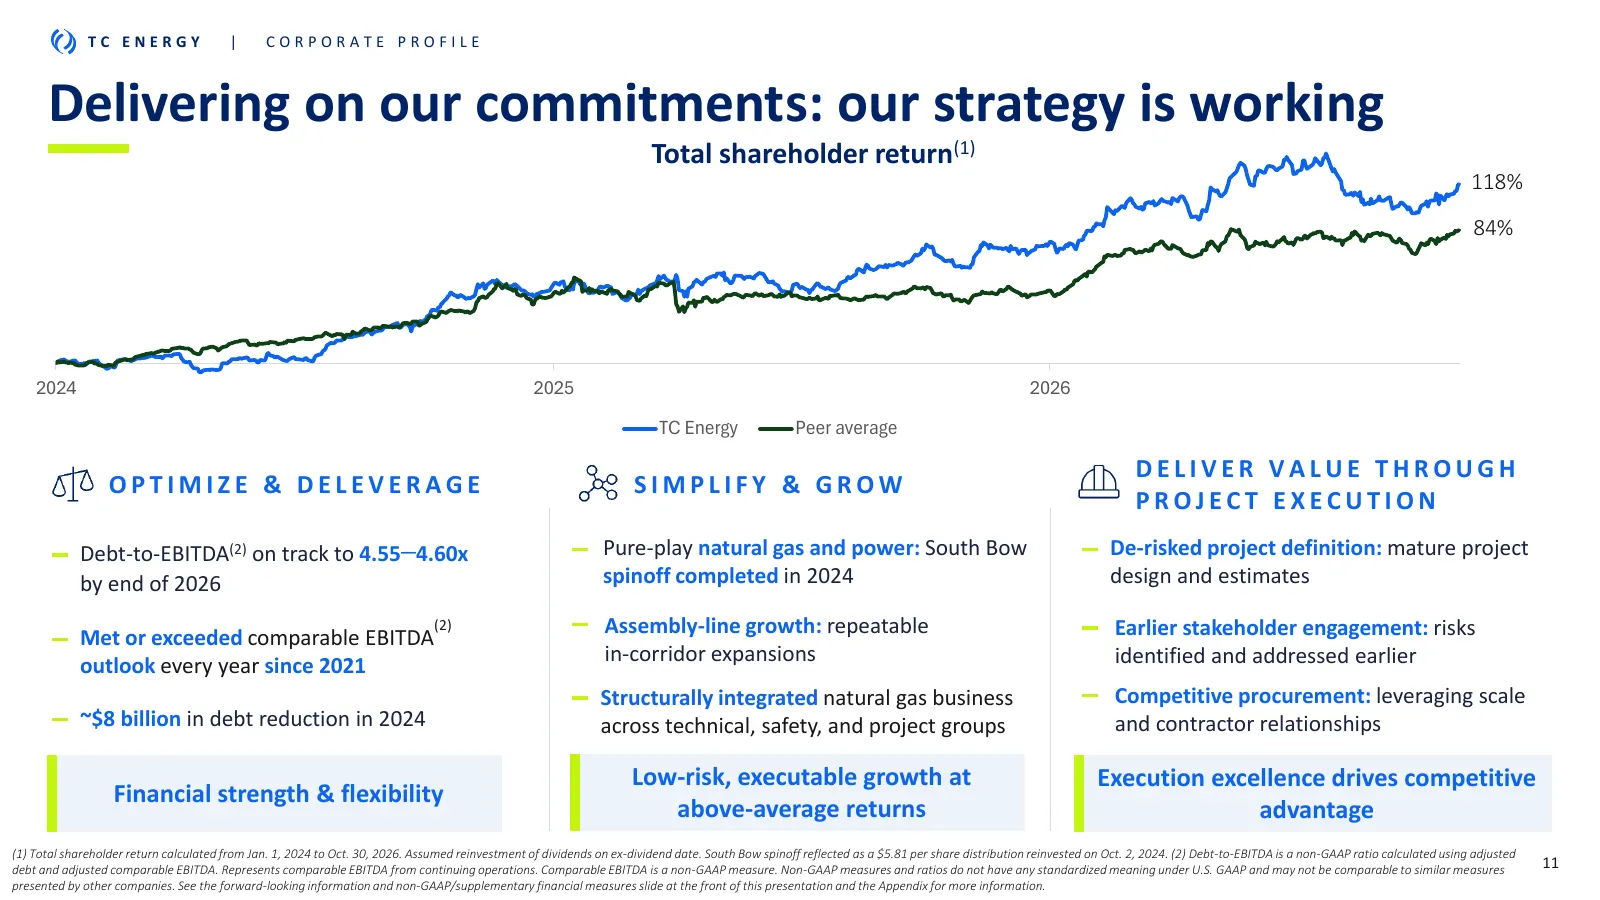
Slide 11: Delivering on our commitments: our strategy is working
TC ENERGY | CORPORATE PROFILE Delivering on our commitments: our strategy is working Total shareholder return(1) 118% 84% 2024 2025 2026 TC Energy Peer average DELIVER VALUE THROUGH OPTIMIZE & DELEVERAGE SIMPLIFY & GROW PROJECT EXECUTION Debt-to-EBITDA(2) on track to 4.55–4.60x Pure-play natural gas
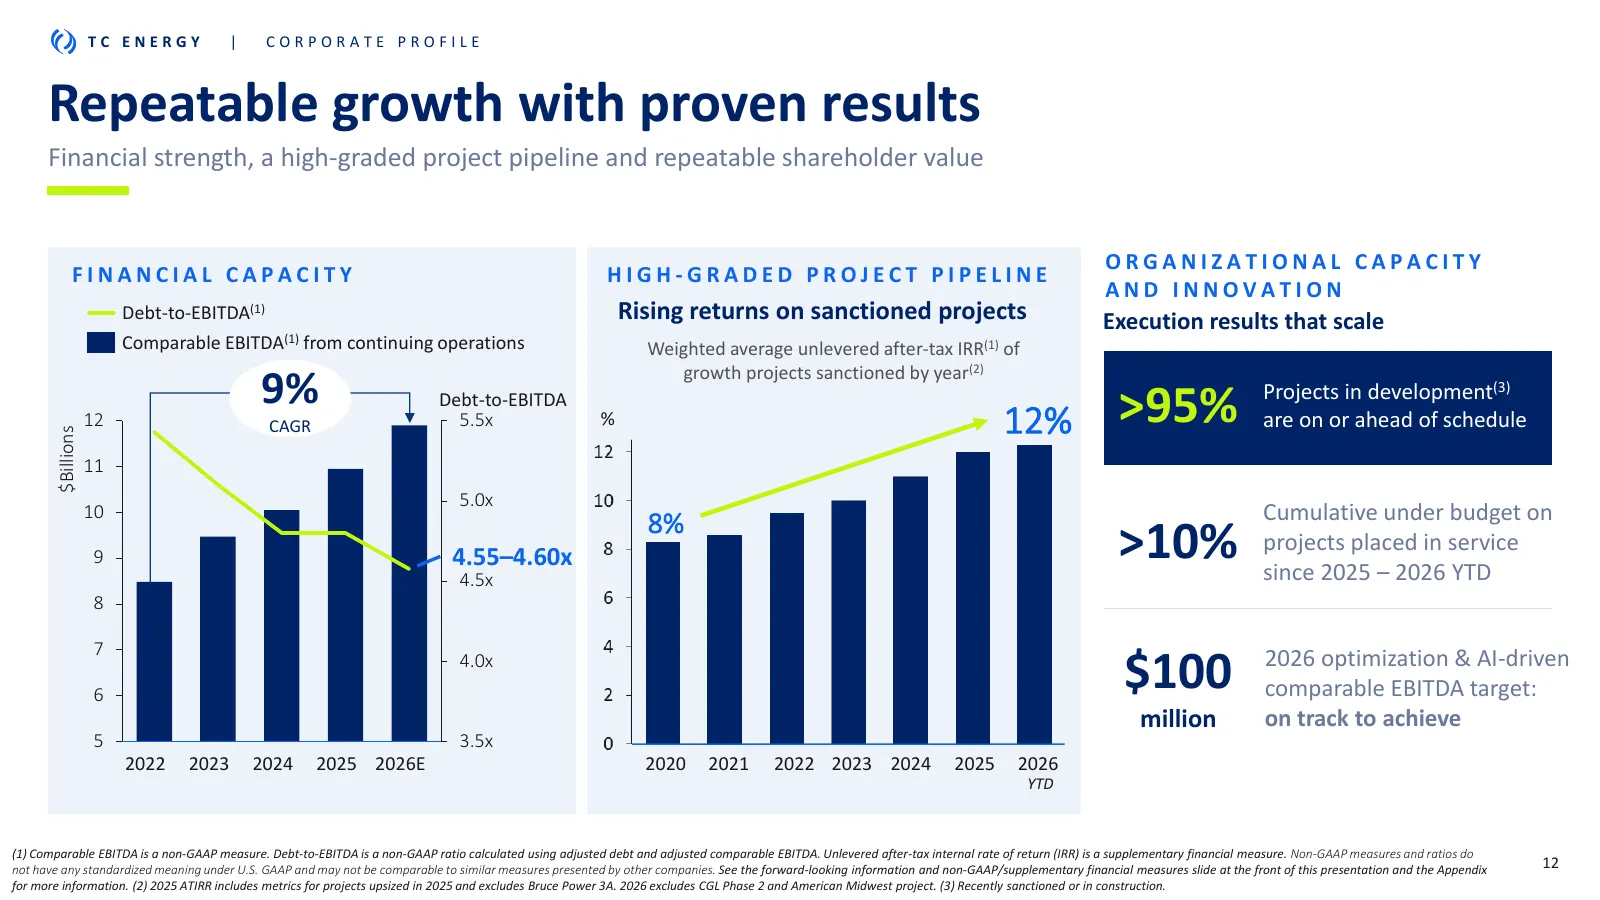
Slide 12: Repeatable growth with proven results
TC ENERGY | CORPORATE PROFILE Repeatable growth with proven results Financial strength, a high-graded project pipeline and repeatable shareholder value ORGANIZATIONAL CAPACITY FINANCIAL CAPACITY HIGH-GRADED PROJECT PIPELINE AND INNOVATION Debt-to-EBITDA(1) Rising returns on sanctioned projects Execu
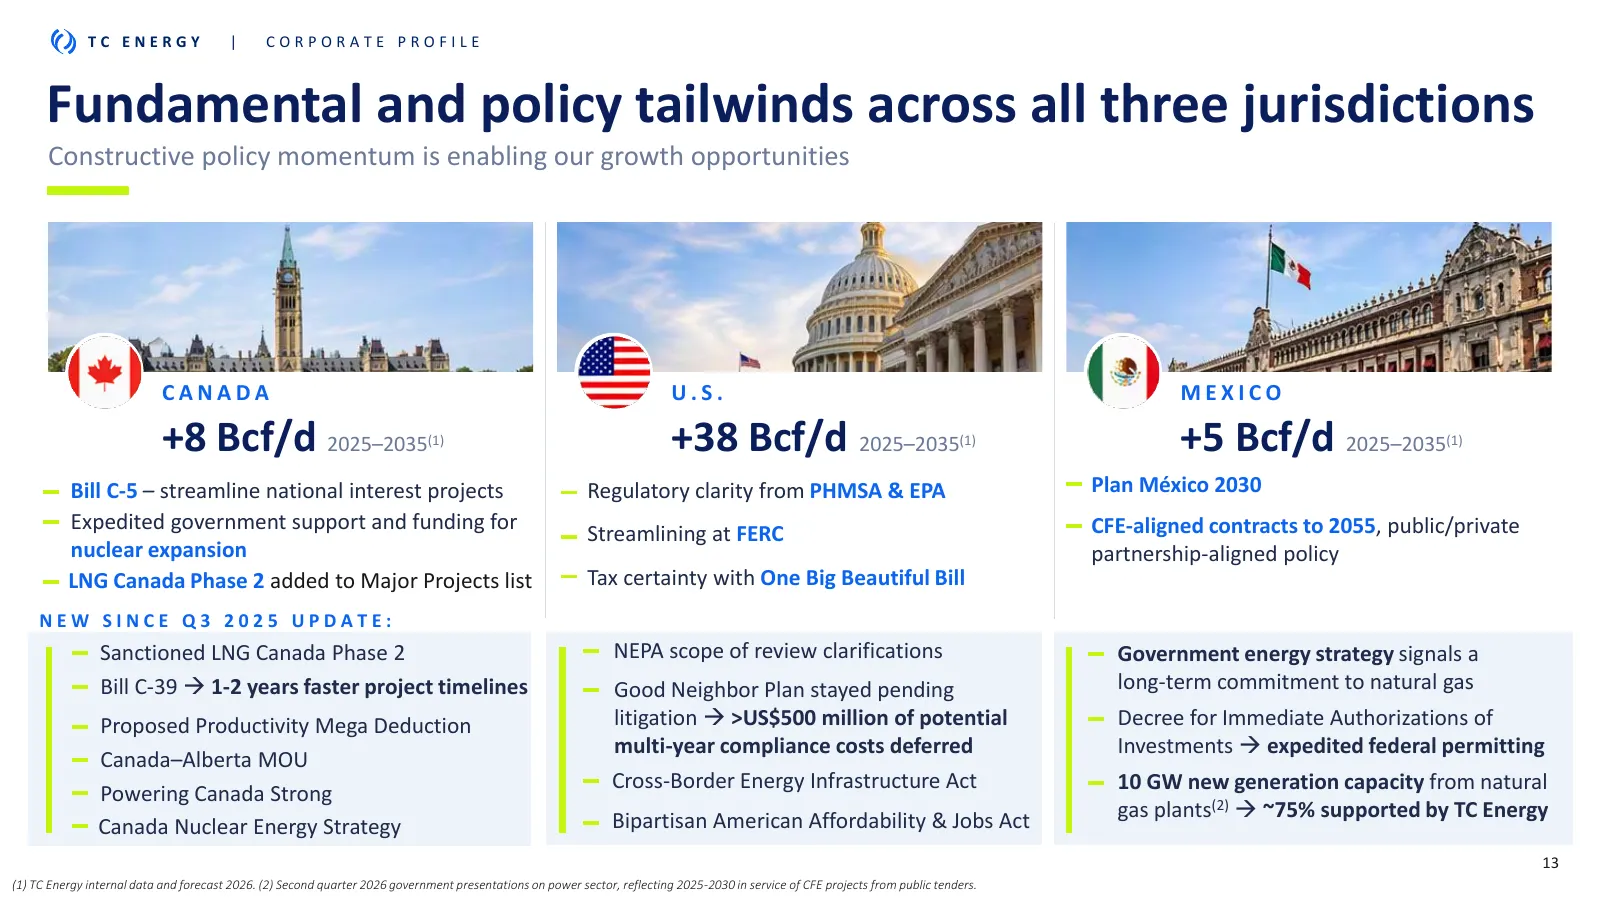
Slide 13: Fundamental and policy tailwinds across all three jurisdictions
TC ENERGY | CORPORATE PROFILE Fundamental and policy tailwinds across all three jurisdictions Constructive policy momentum is enabling our growth opportunities CANADA U.S. MEXICO +8 Bcf/d 2025–2035 (1) +38 Bcf/d 2025–2035 (1) +5 Bcf/d 2025–2035 (1) Bill C-5 – streamline national interest projects Re
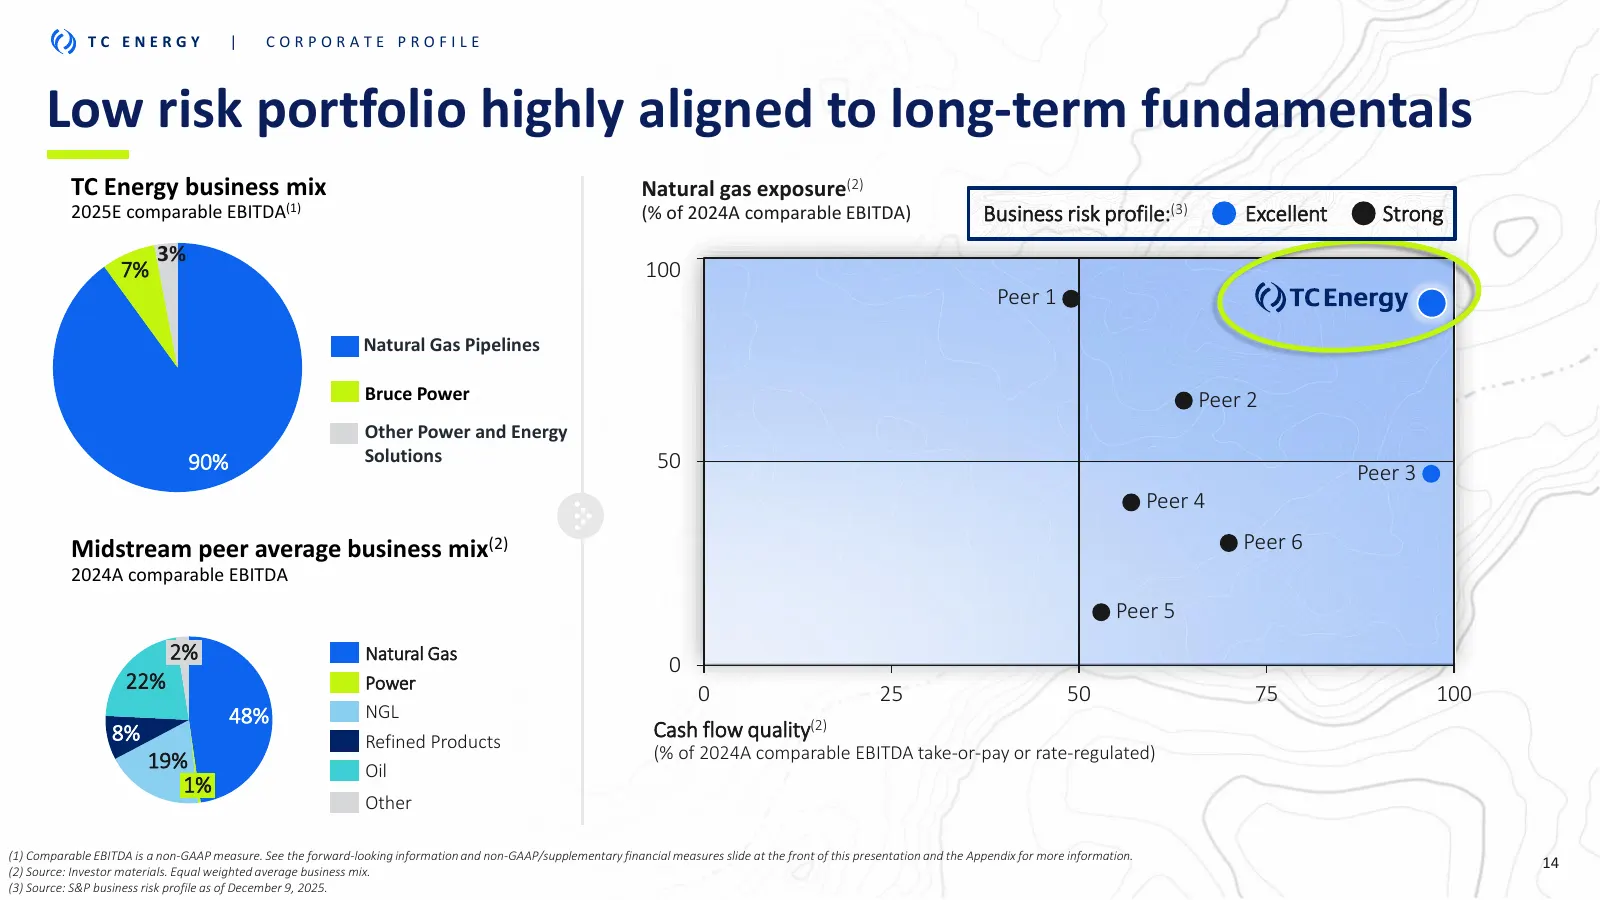
Slide 14: Low risk portfolio highly aligned to long-term fundamentals
TC ENERGY | CORPORATE PROFILE Low risk portfolio highly aligned to long-term fundamentals TC Energy business mix Natural gas exposure(2) 2025E comparable EBITDA(1) (% of 2024A comparable EBITDA) Business risk profile:(3) Excellent Strong 3% 7% 100 Peer 1 Natural Gas Pipelines Bruce Power Peer 2 Othe
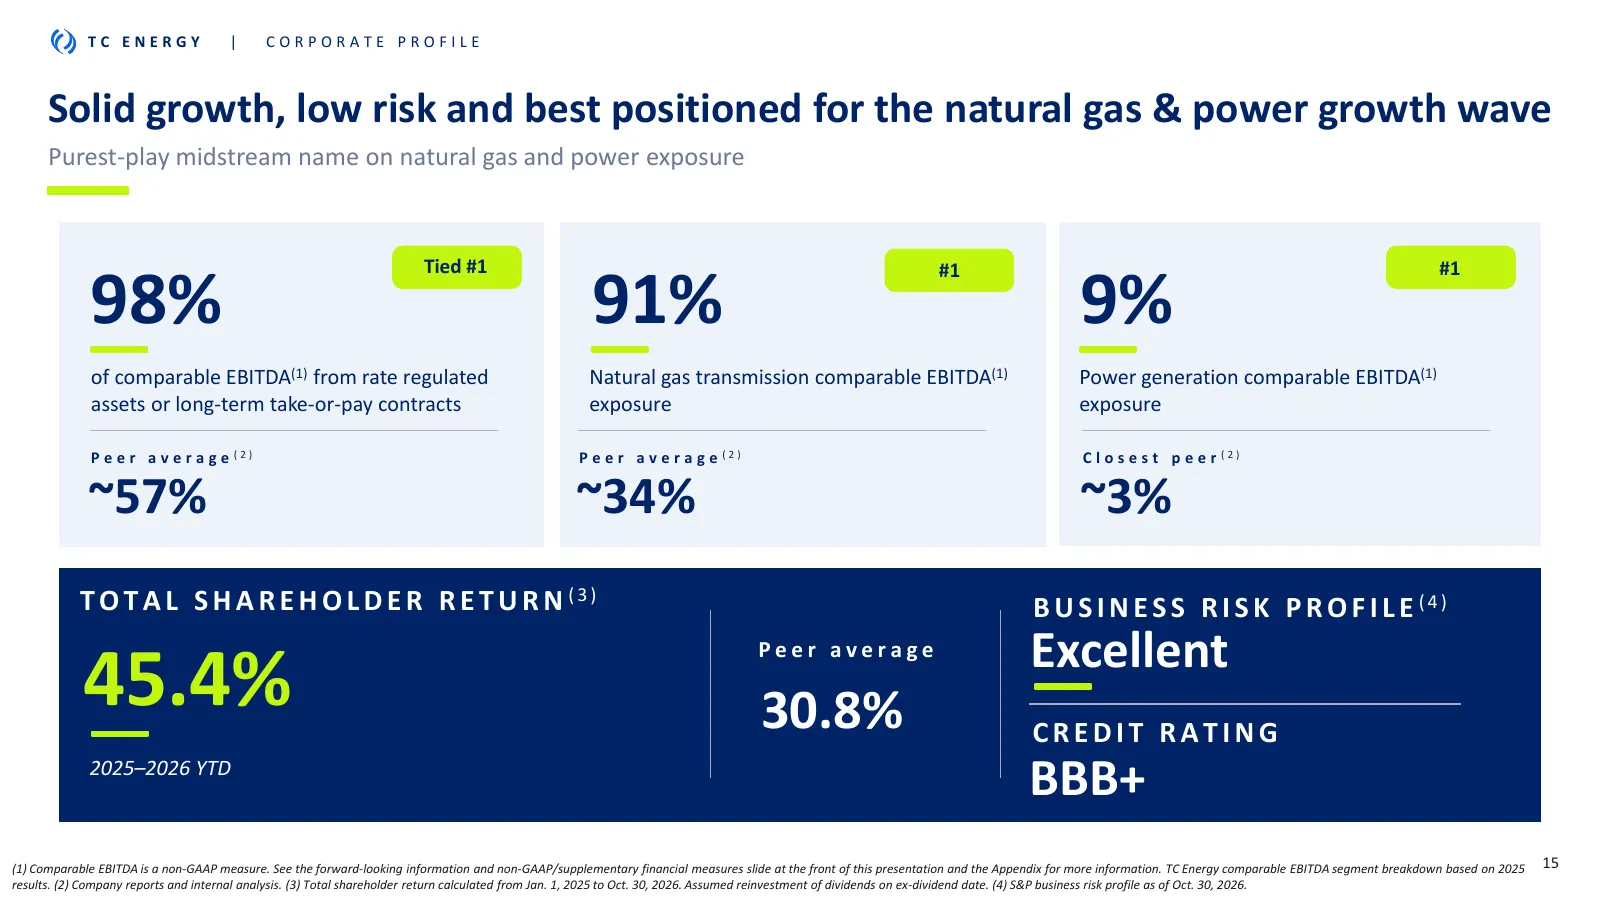
Slide 15: Solid growth, low risk and best positioned for the natural gas & power growth wave
TC ENERGY | CORPORATE PROFILE Solid growth, low risk and best positioned for the natural gas & power growth wave Purest-play midstream name on natural gas and power exposure Tied #1 #1 #1 98% 91% 9% of comparable EBITDA(1) from rate regulated Natural gas transmission comparable EBITDA(1) Power gener
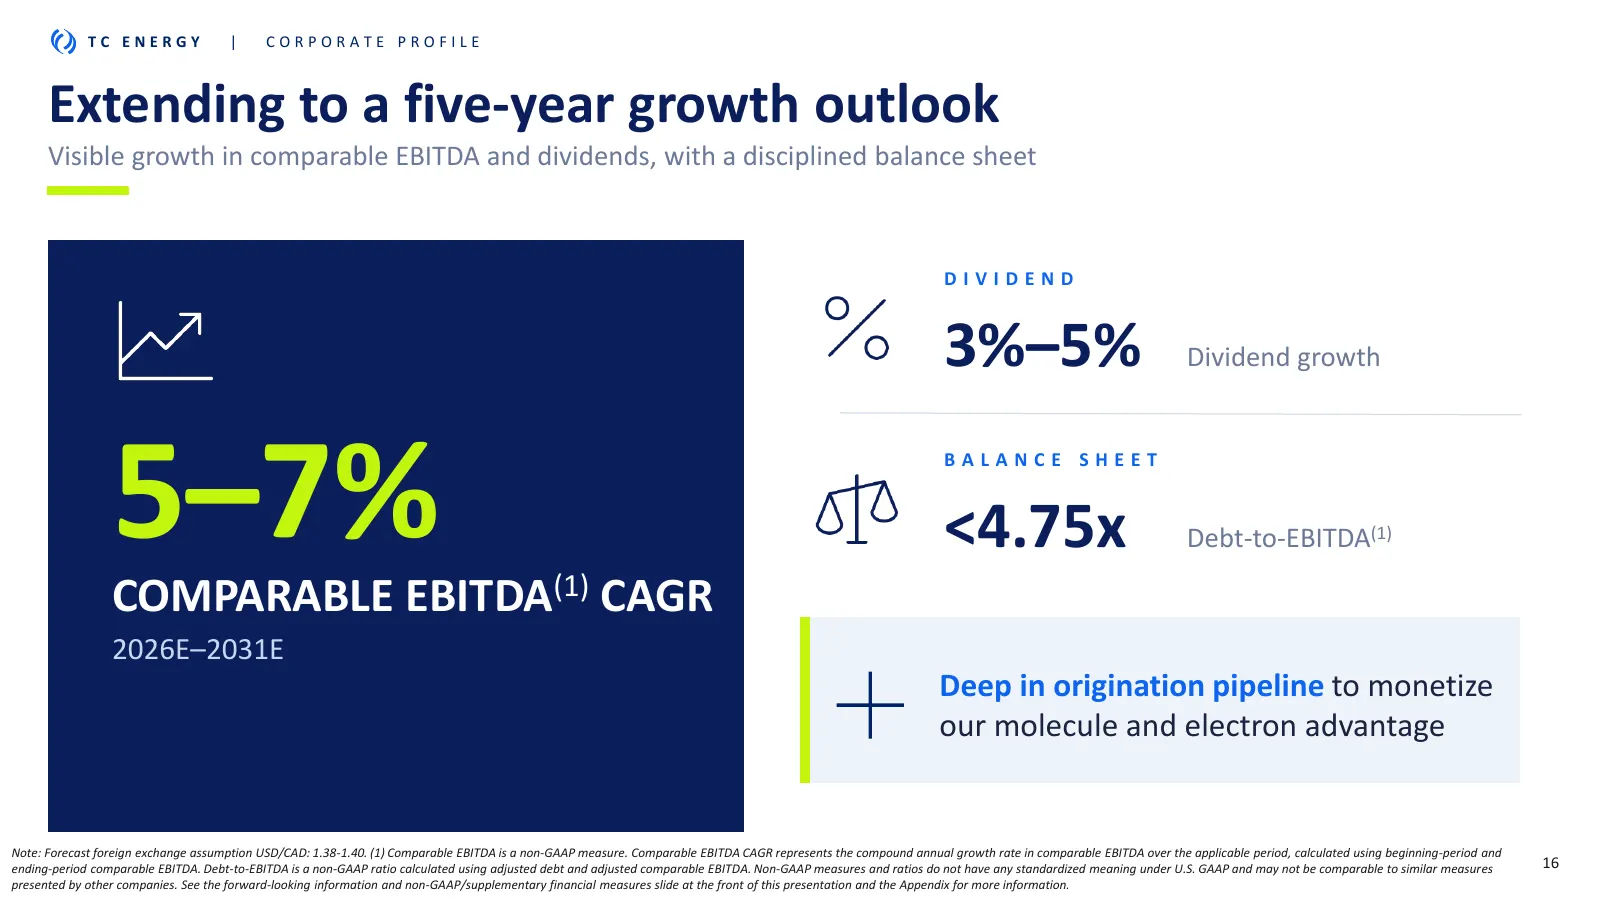
Slide 16: Extending to a five-year growth outlook
TC ENERGY | CORPORATE PROFILE Extending to a five-year growth outlook Visible growth in comparable EBITDA and dividends, with a disciplined balance sheet DIVIDEND 3%–5% Dividend growth 5–7% BALANCE SHEET <4.75x Debt-to-EBITDA(1) COMPARABLE EBITDA(1) CAGR 2026E–2031E Deep in origination pipeline to m
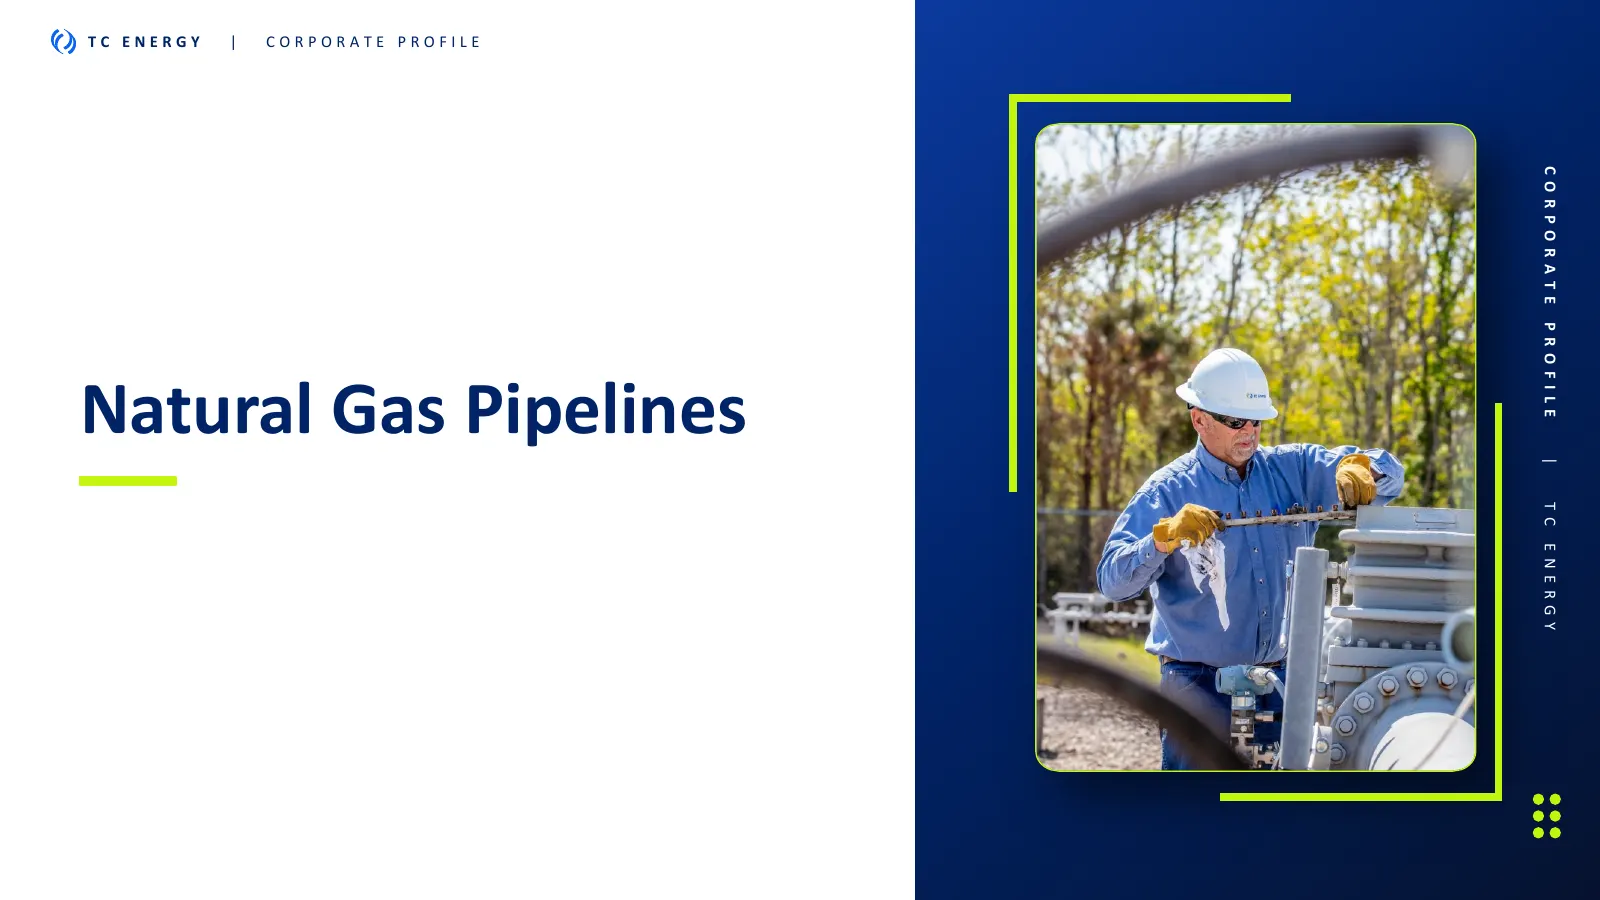
Slide 17: Natural Gas Pipelines
TC ENERGY | CORPORATE PROFILE CORPORATE PROFILE Natural Gas Pipelines | TC E N E RGY
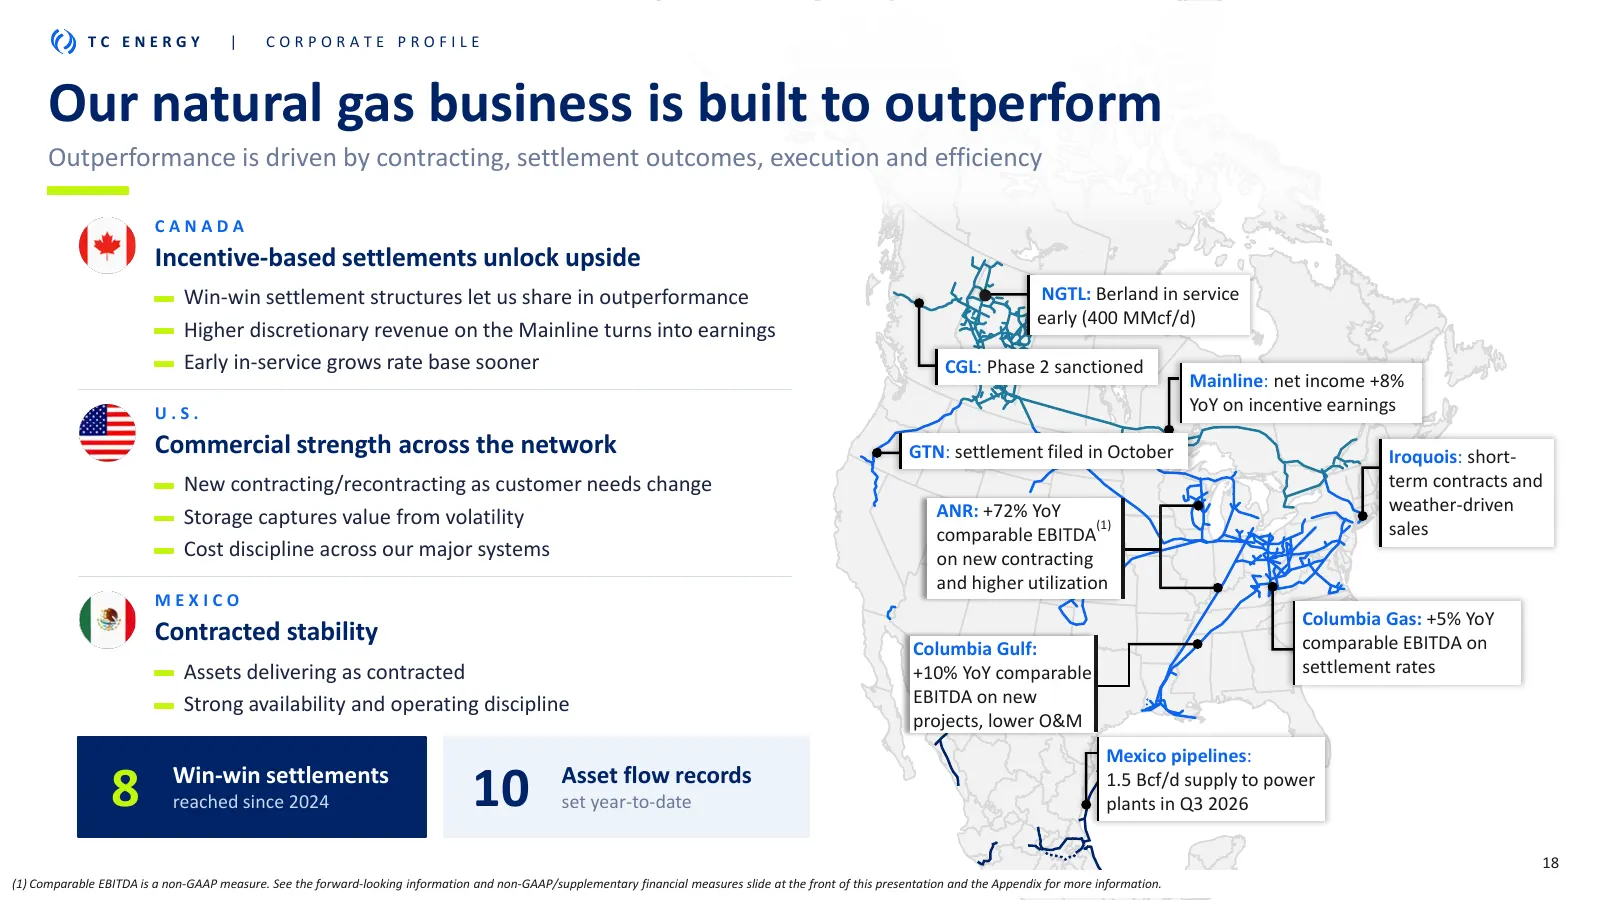
Slide 18: Our natural gas business is built to outperform
TC ENERGY | CORPORATE PROFILE Our natural gas business is built to outperform Outperformance is driven by contracting, settlement outcomes, execution and efficiency CANADA Incentive-based settlements unlock upside Win-win settlement structures let us share in outperformance NGTL: Berland in service
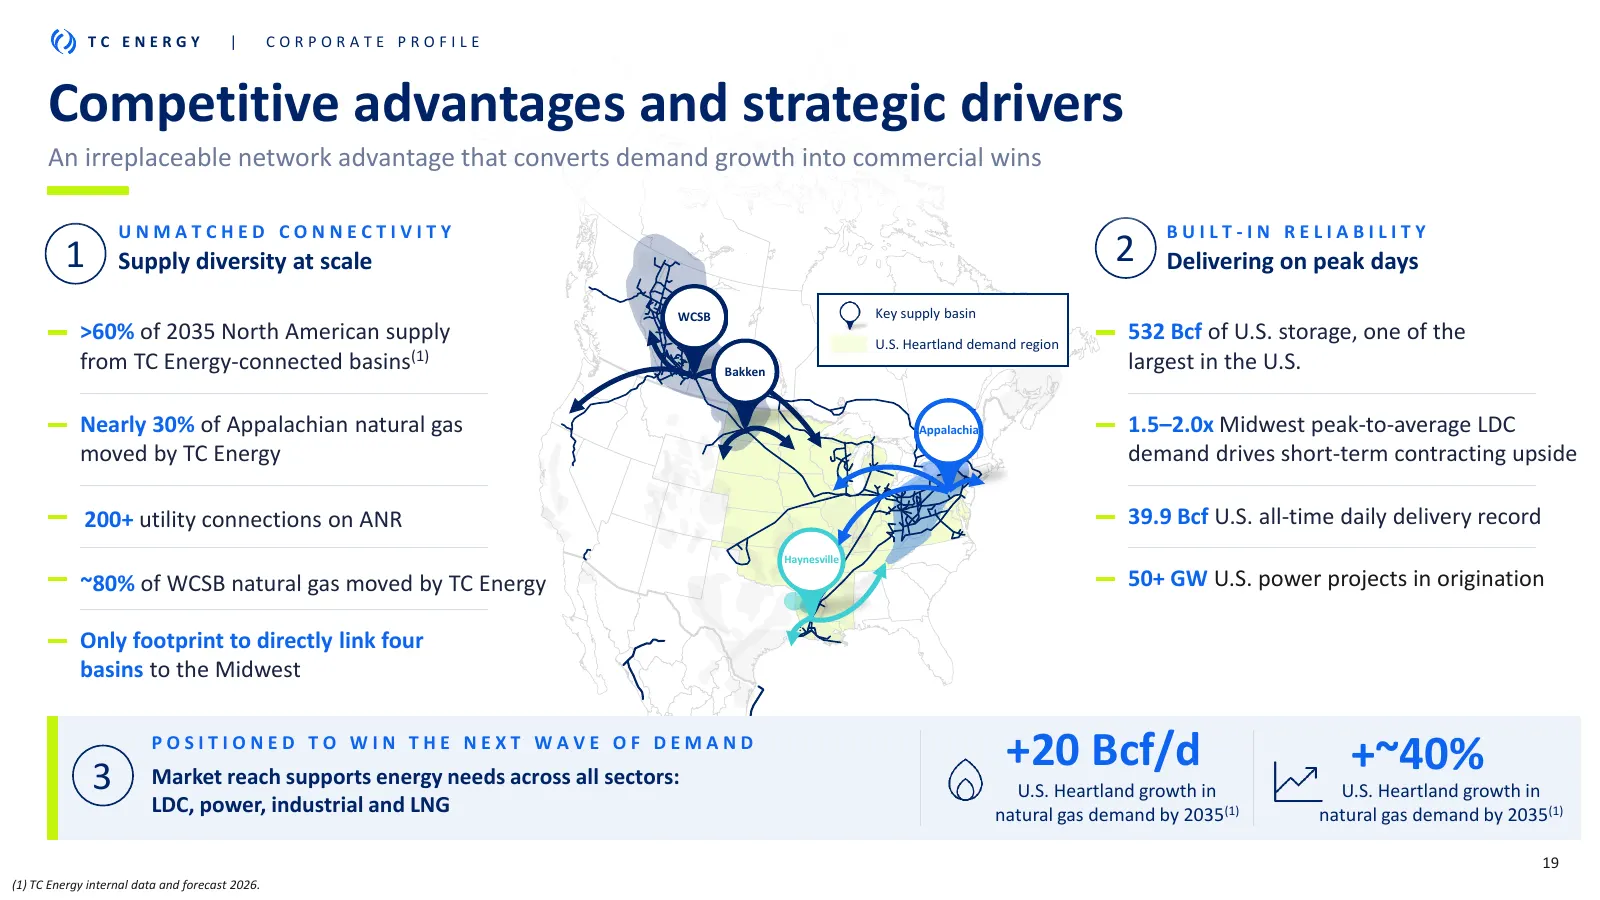
Slide 19: Competitive advantages and strategic drivers
TC ENERGY | CORPORATE PROFILE Competitive advantages and strategic drivers An irreplaceable network advantage that converts demand growth into commercial wins UNMATCHED CONNECTIVITY BUILT-IN RELIABILITY 1 Supply diversity at scale 2 Delivering on peak days WCSB Key supply basin >60% of 2035 North Am
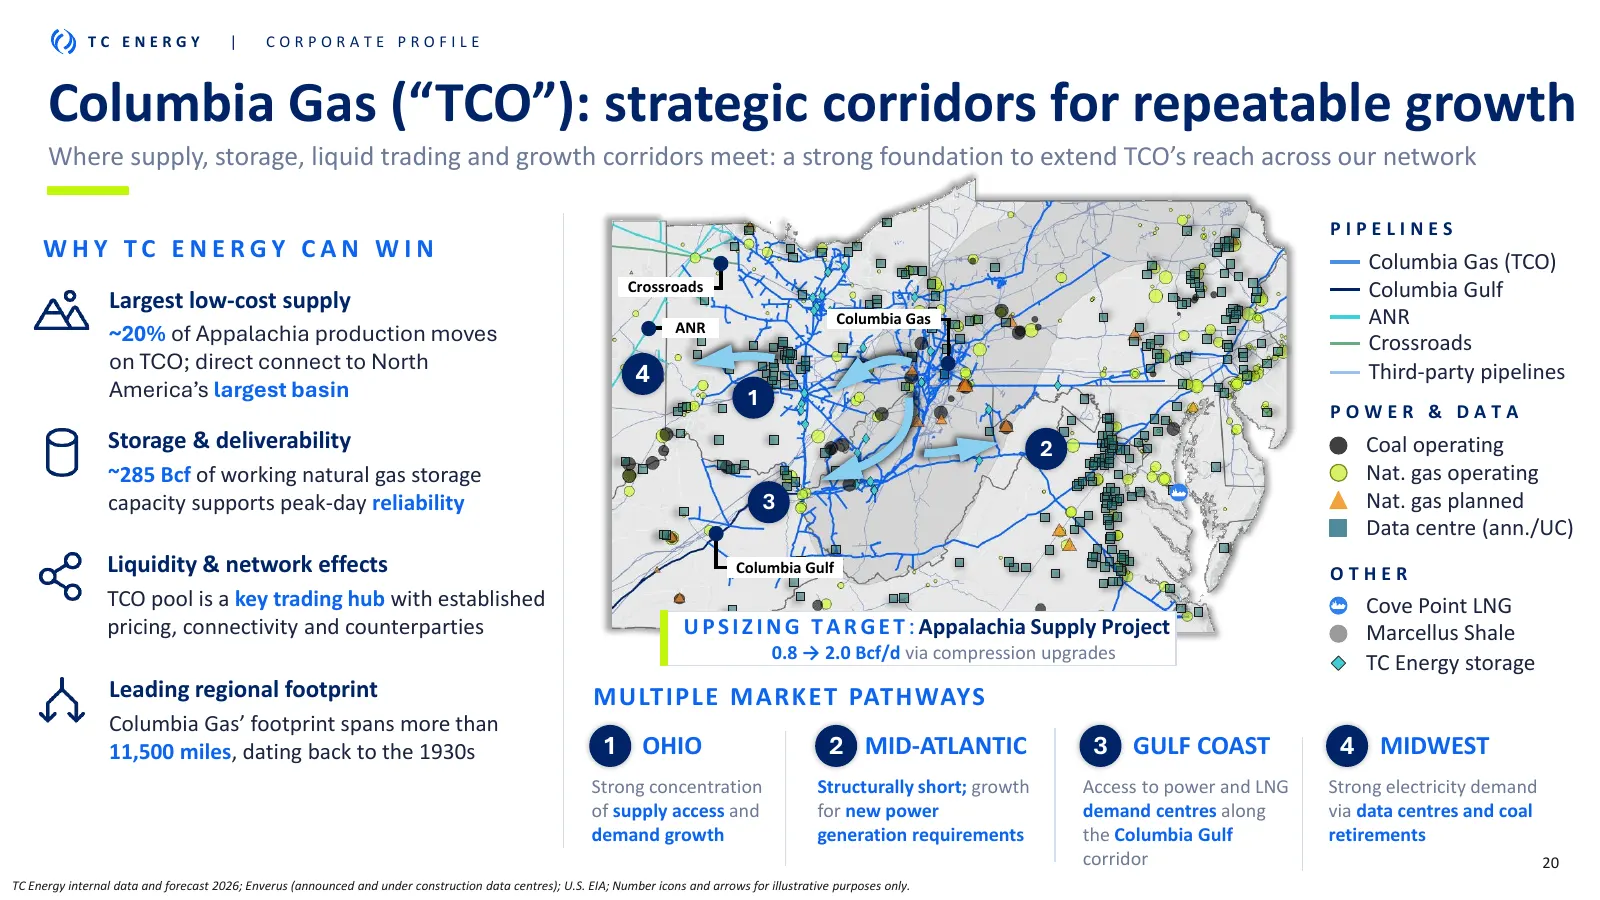
Slide 20: Columbia Gas (TCO): strategic corridors for repeatable growth
TC ENERGY | CORPORATE PROFILE Columbia Gas (“TCO”): strategic corridors for repeatable growth Where supply, storage, liquid trading and growth corridors meet: a strong foundation to extend TCO’s reach across our network PIPELINES WHY TC ENERGY CAN WIN Columbia Gas (TCO) Largest low-cost supply Cross
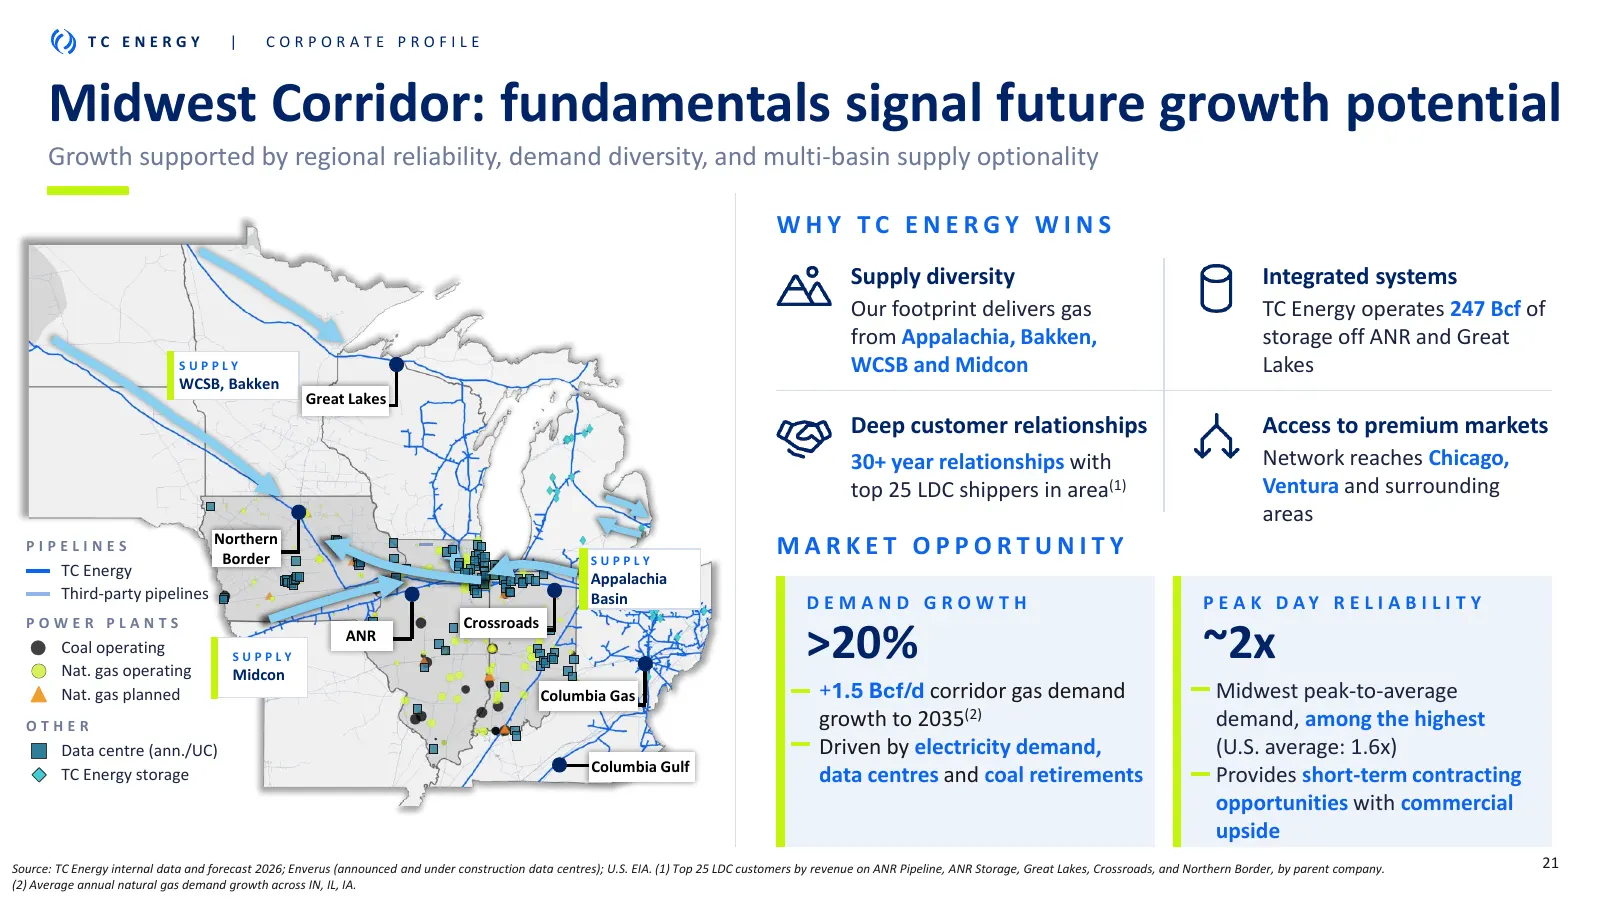
Slide 21: Midwest Corridor: fundamentals signal future growth potential
TC ENERGY | CORPORATE PROFILE Midwest Corridor: fundamentals signal future growth potential Growth supported by regional reliability, demand diversity, and multi-basin supply optionality WHY TC ENERGY WINS Supply diversity Integrated systems Our footprint delivers gas TC Energy operates 247 Bcf of f
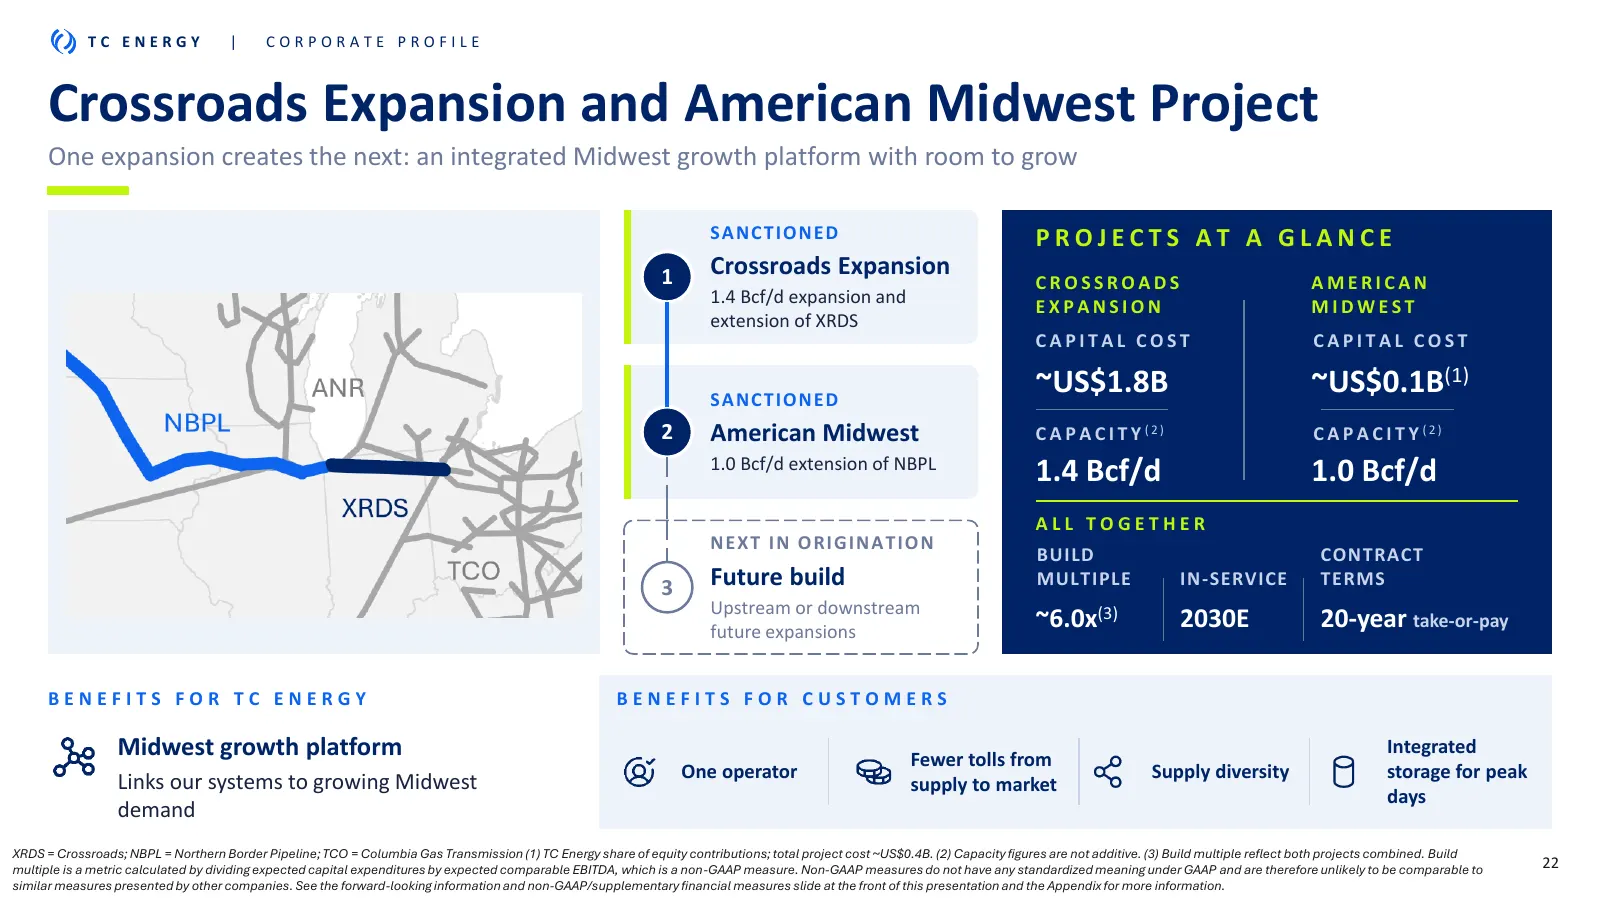
Slide 22: Crossroads Expansion and American Midwest Project
TC ENERGY | CORPORATE PROFILE Crossroads Expansion and American Midwest Project One expansion creates the next: an integrated Midwest growth platform with room to grow SA NCT I O NE D PROJECTS AT A GLANCE 1 Crossroads Expansion CROSSROADS AMERICAN 1.4 Bcf/d expansion and EXPANSION MIDWEST extension
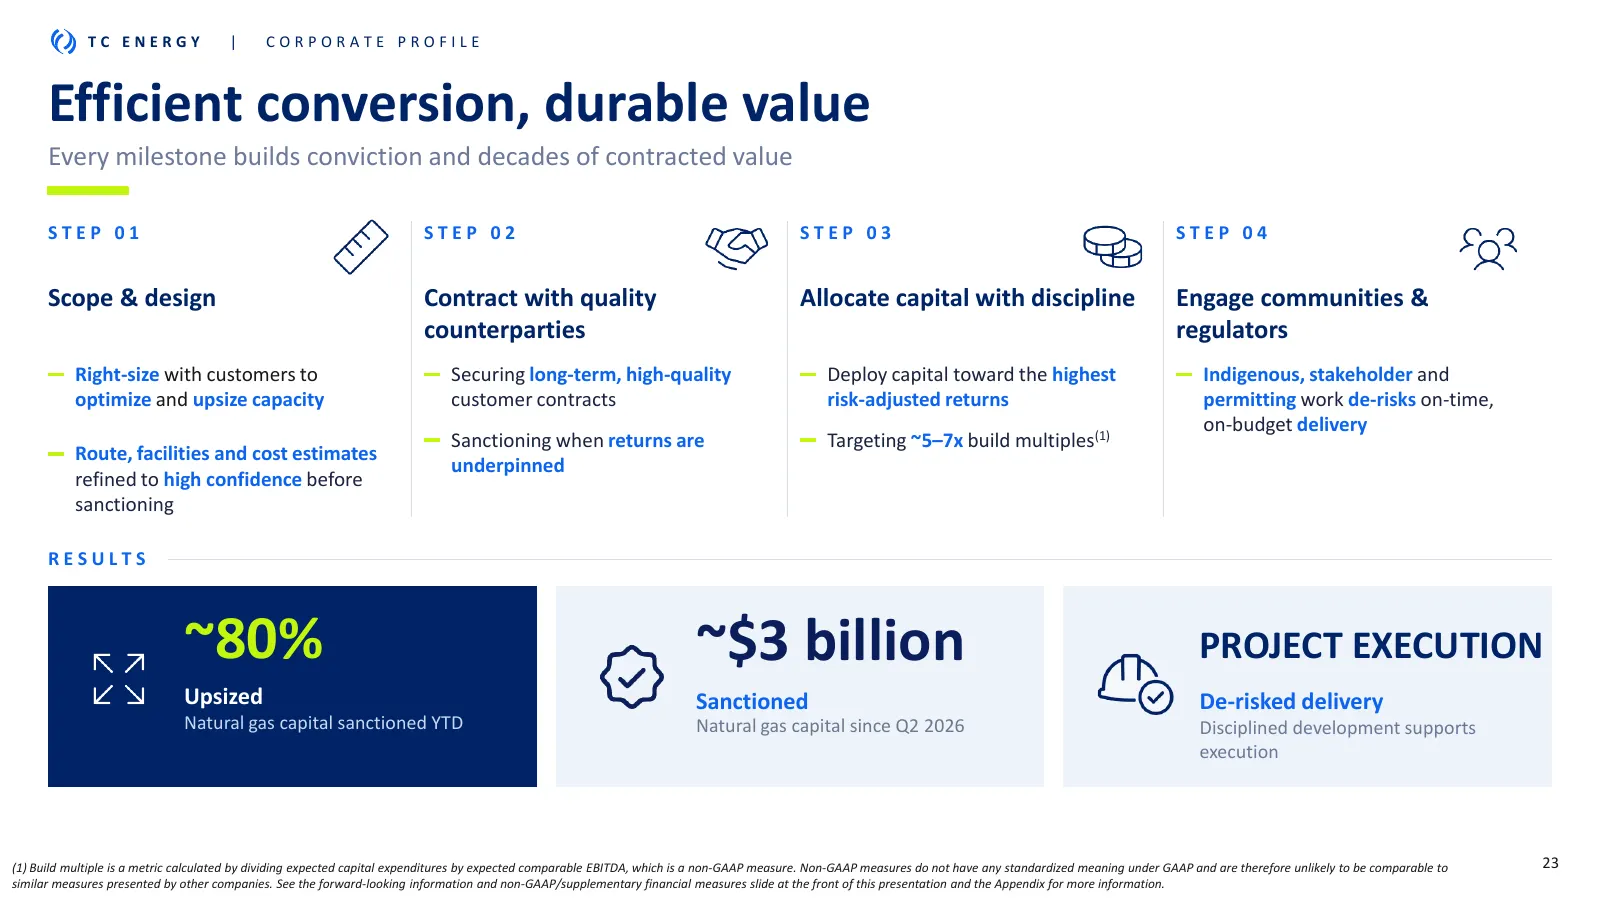
Slide 23: Efficient conversion, durable value
TC ENERGY | CORPORATE PROFILE Efficient conversion, durable value Every milestone builds conviction and decades of contracted value STEP 01 STEP 02 STEP 03 STEP 04 Scope & design Contract with quality Allocate capital with discipline Engage communities & counterparties regulators Right-size with cus
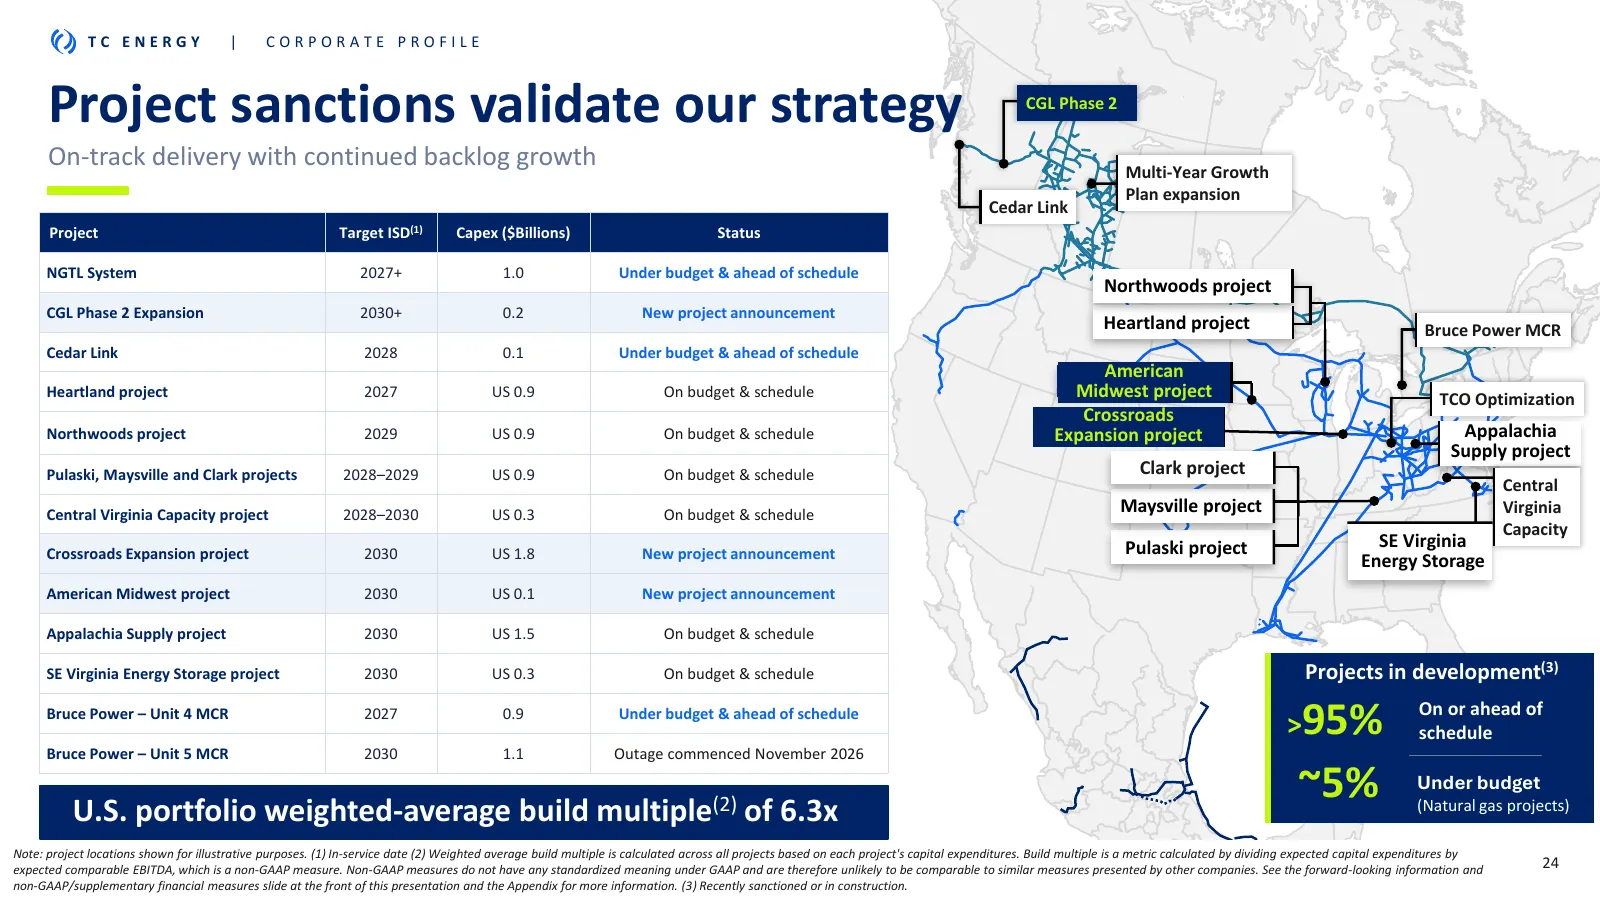
Slide 24: Project sanctions validate our strategy
TC ENERGY | CORPORATE PROFILE Project sanctions validate our strategy CGL Phase 2 On-track delivery with continued backlog growth Multi-Year Growth Plan expansion Cedar Link Project Target ISD(1) Capex ($Billions) Status NGTL System 2027+ 1.0 Under budget & ahead of schedule Northwoods project CGL P
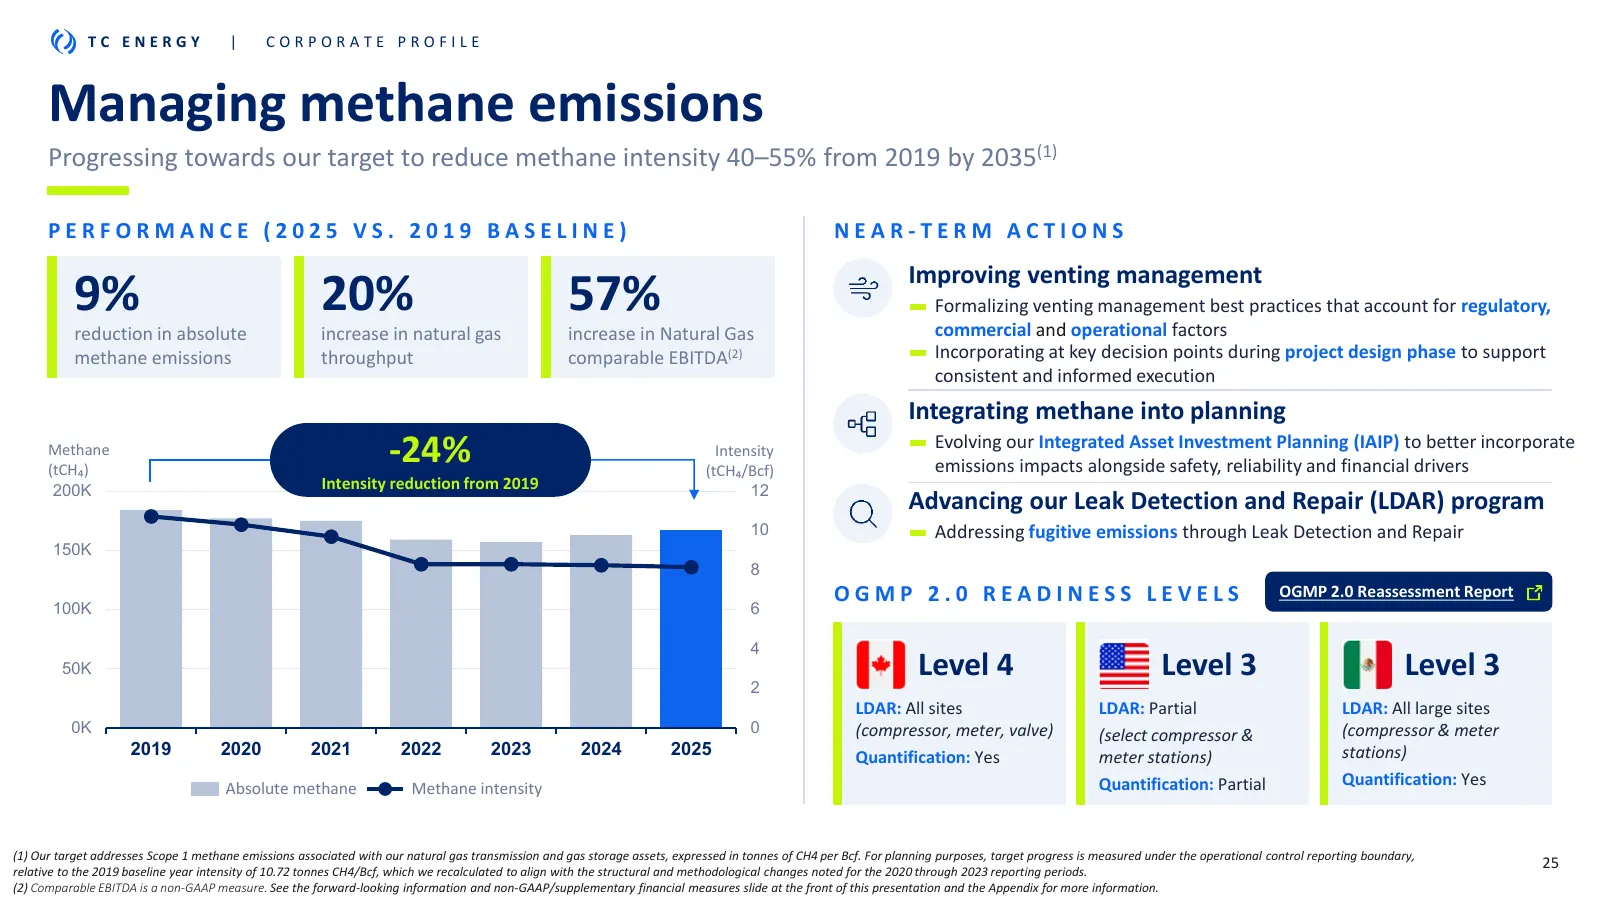
Slide 25: Managing methane emissions
TC ENERGY | CORPORATE PROFILE Managing methane emissions Progressing towards our target to reduce methane intensity 40–55% from 2019 by 2035(1) PERFORMANCE (2025 VS. 2019 BASELINE) NEAR-TERM ACTIONS Improving venting management 9% 20% 57% Formalizing venting management best practices that account fo
Slide 26: Power and Energy Solutions
TC ENERGY | CORPORATE PROFILE CORPORATE Power and Energy PROFILE Solutions | TC E N E RGY
Slide 27: Power demand growth meets proven execution
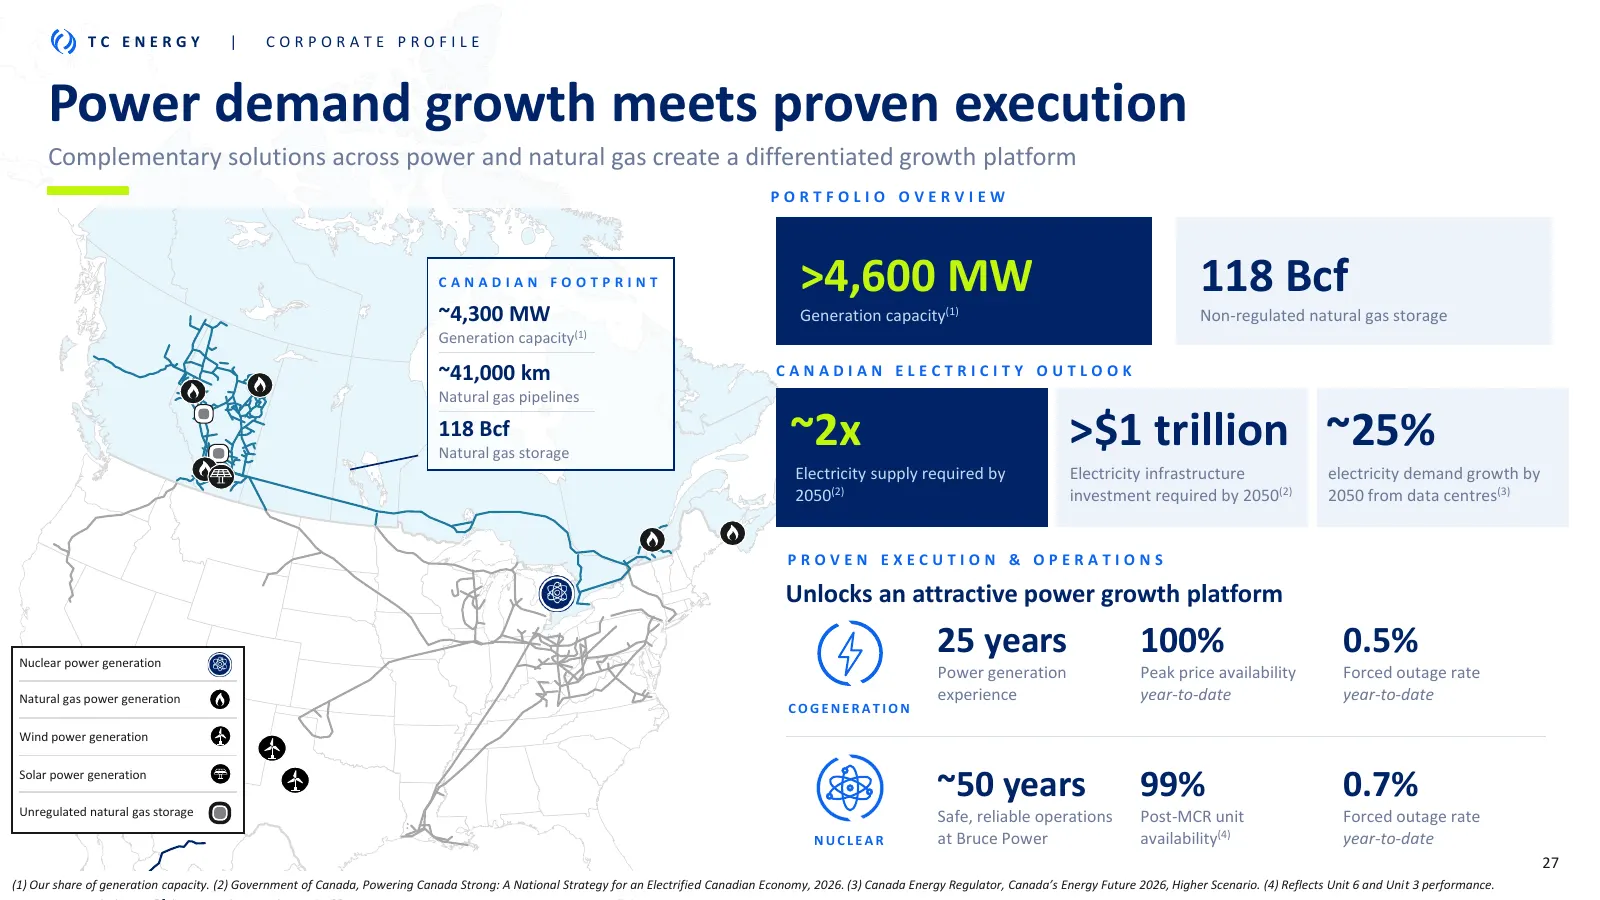
TC ENERGY | CORPORATE PROFILE Power demand growth meets proven v execution Complementary solutions across power and natural gas create a differentiated growth platform PORTFOLIO OVERVIEW CANADIAN FOOTPRINT >4,600 MW 118 Bcf ~4,300 MW Generation capacity(1) Non-regulated natural gas storage Generatio
Slide 28: Power opportunities aligned with our risk-return preferences
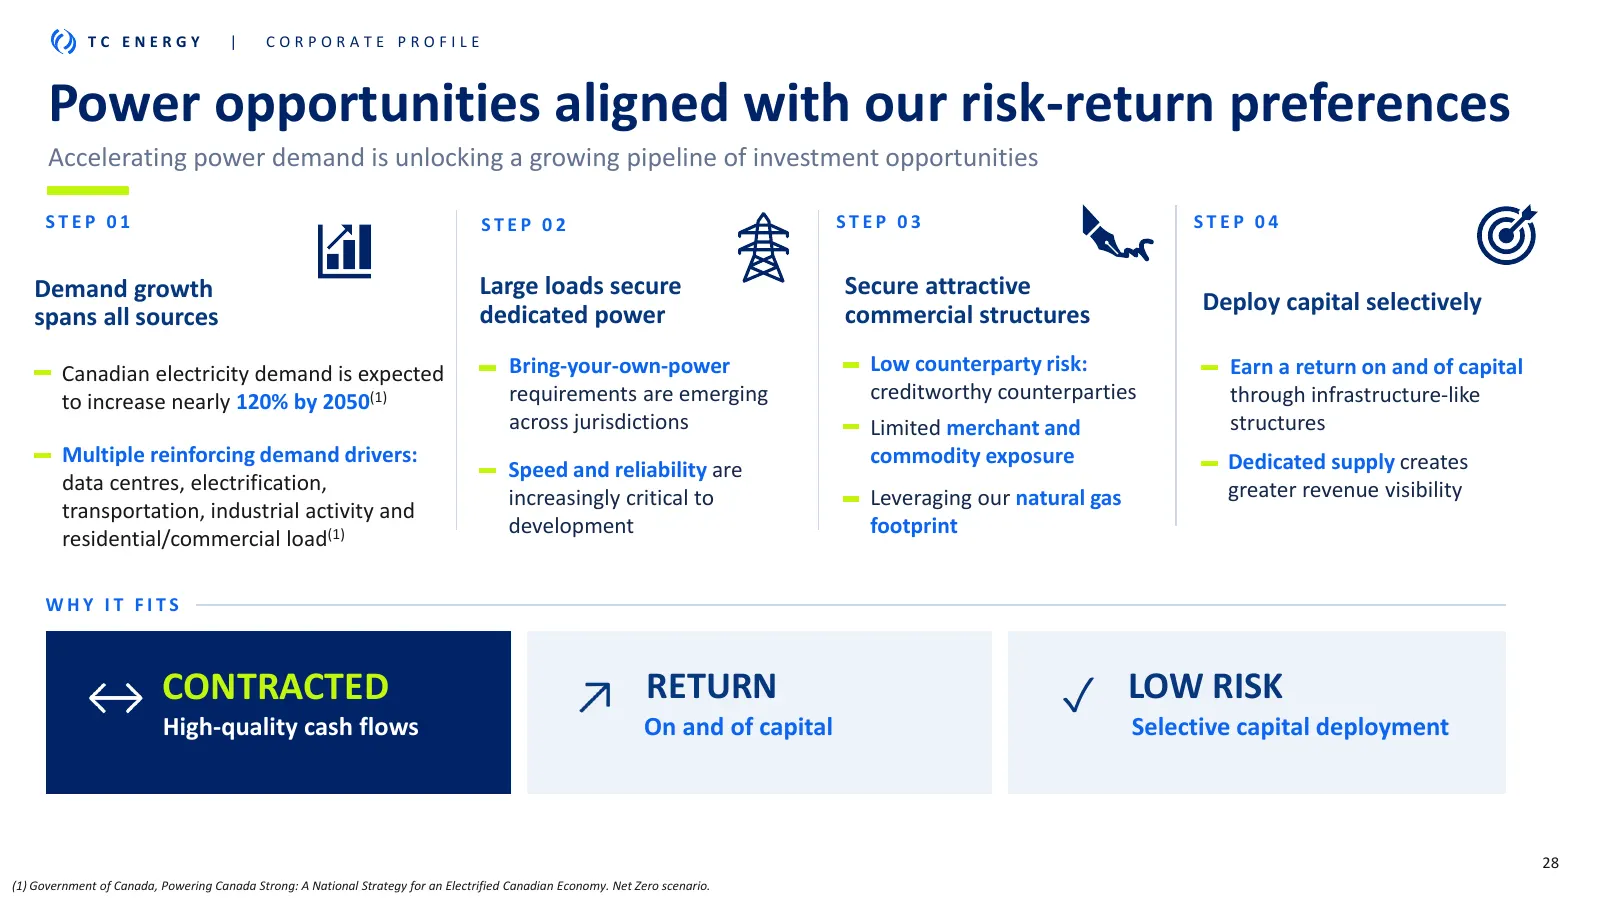
TC ENERGY | CORPORATE PROFILE Power opportunities aligned with our risk-return preferences Accelerating power demand is unlocking a growing pipeline of investment opportunities STEP 01 STEP 02 STEP 03 STEP 04 Demand growth Large loads secure Secure attractive dedicated power commercial structures De
Slide 29: Multiple pathways to capture meaningful power growth
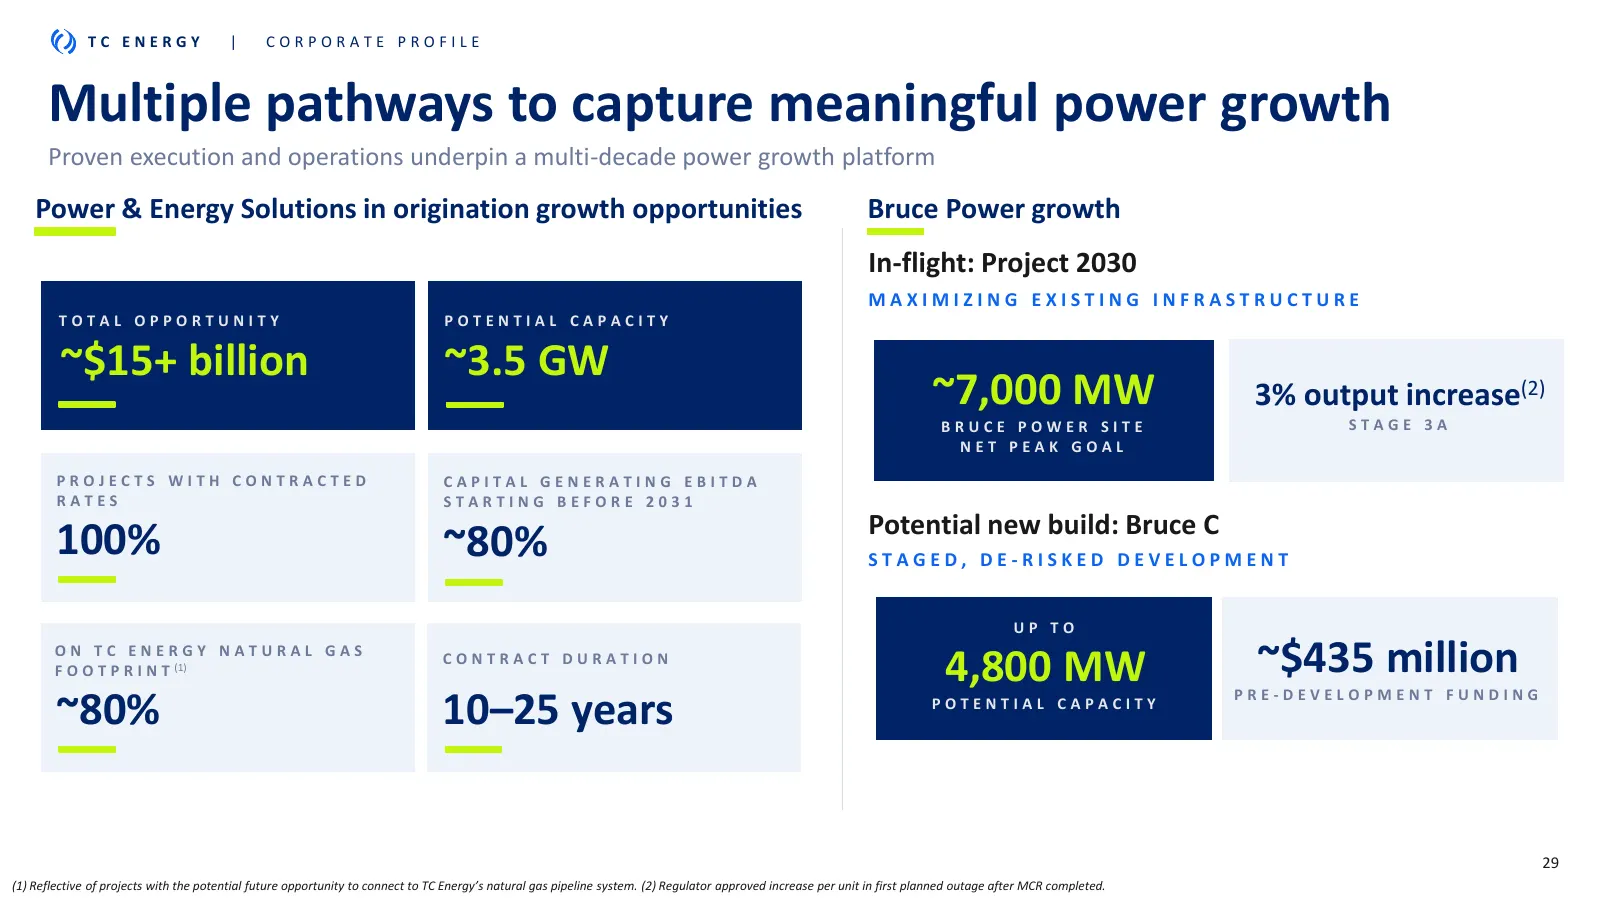
TC ENERGY | CORPORATE PROFILE Multiple pathways to capture meaningful power growth Proven execution and operations underpin a multi-decade power growth platform Power & Energy Solutions in origination growth opportunities Bruce Power growth In-flight: Project 2030 MAXIMIZING EXISTING INFRASTRUCTURE
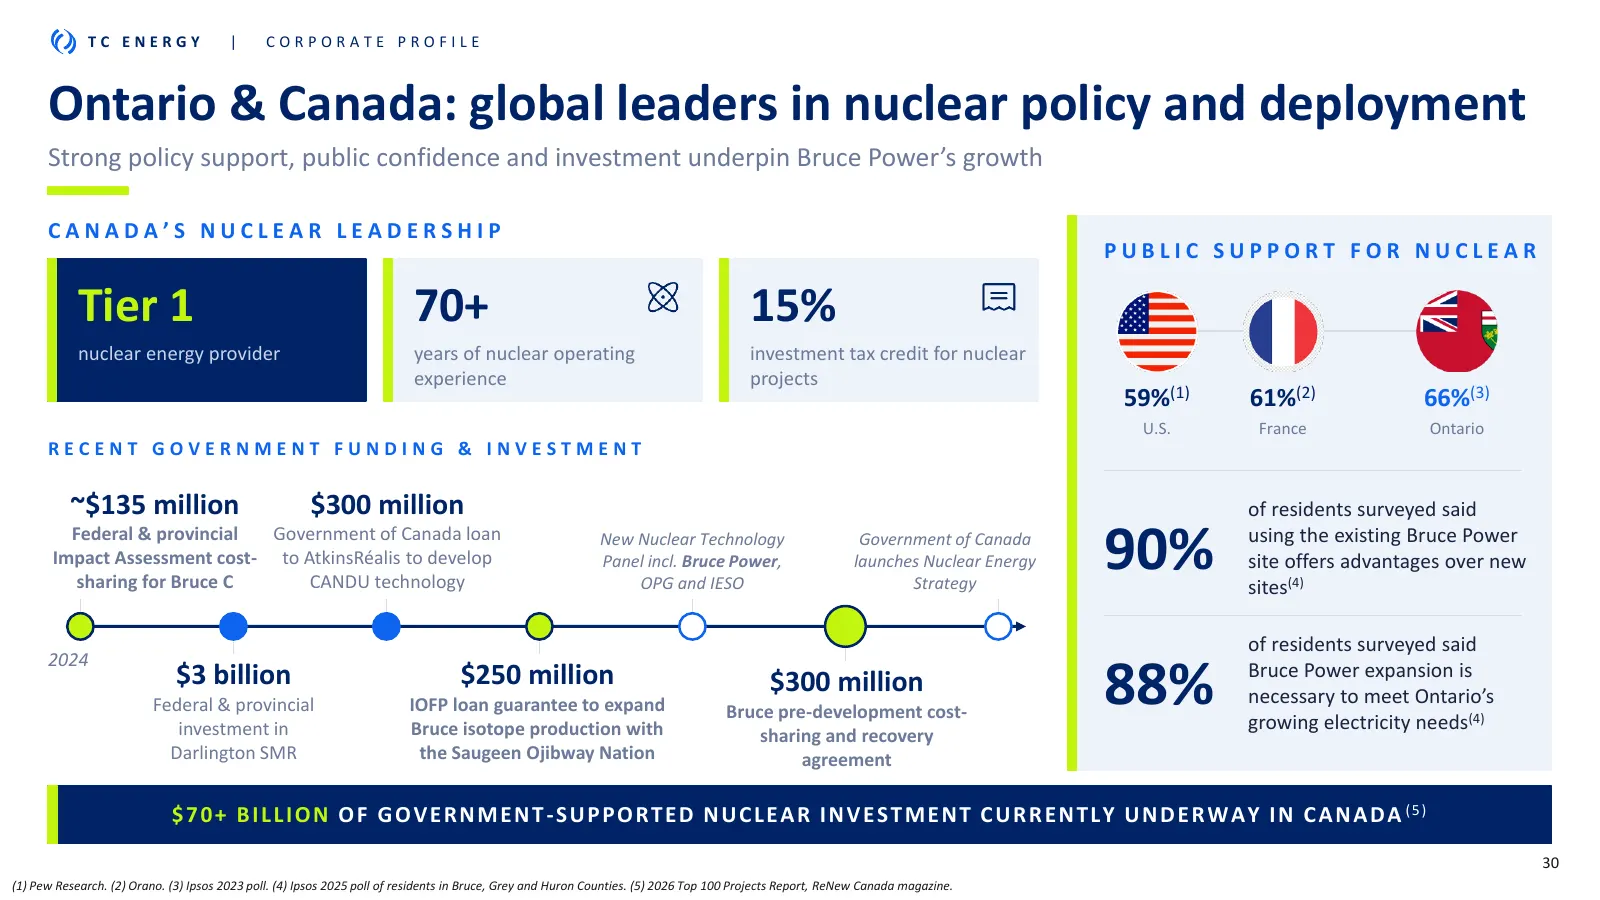
Slide 30: Ontario & Canada: global leaders in nuclear policy and deployment
TC ENERGY | CORPORATE PROFILE Ontario & Canada: global leaders in nuclear policy and deployment Strong policy support, public confidence and investment underpin Bruce Power’s growth CANADA’S NUCLEAR LEADERSHIP PUBLIC SUPPORT FOR NUCLEAR Tier 1 70+ 15% nuclear energy provider years of nuclear operati
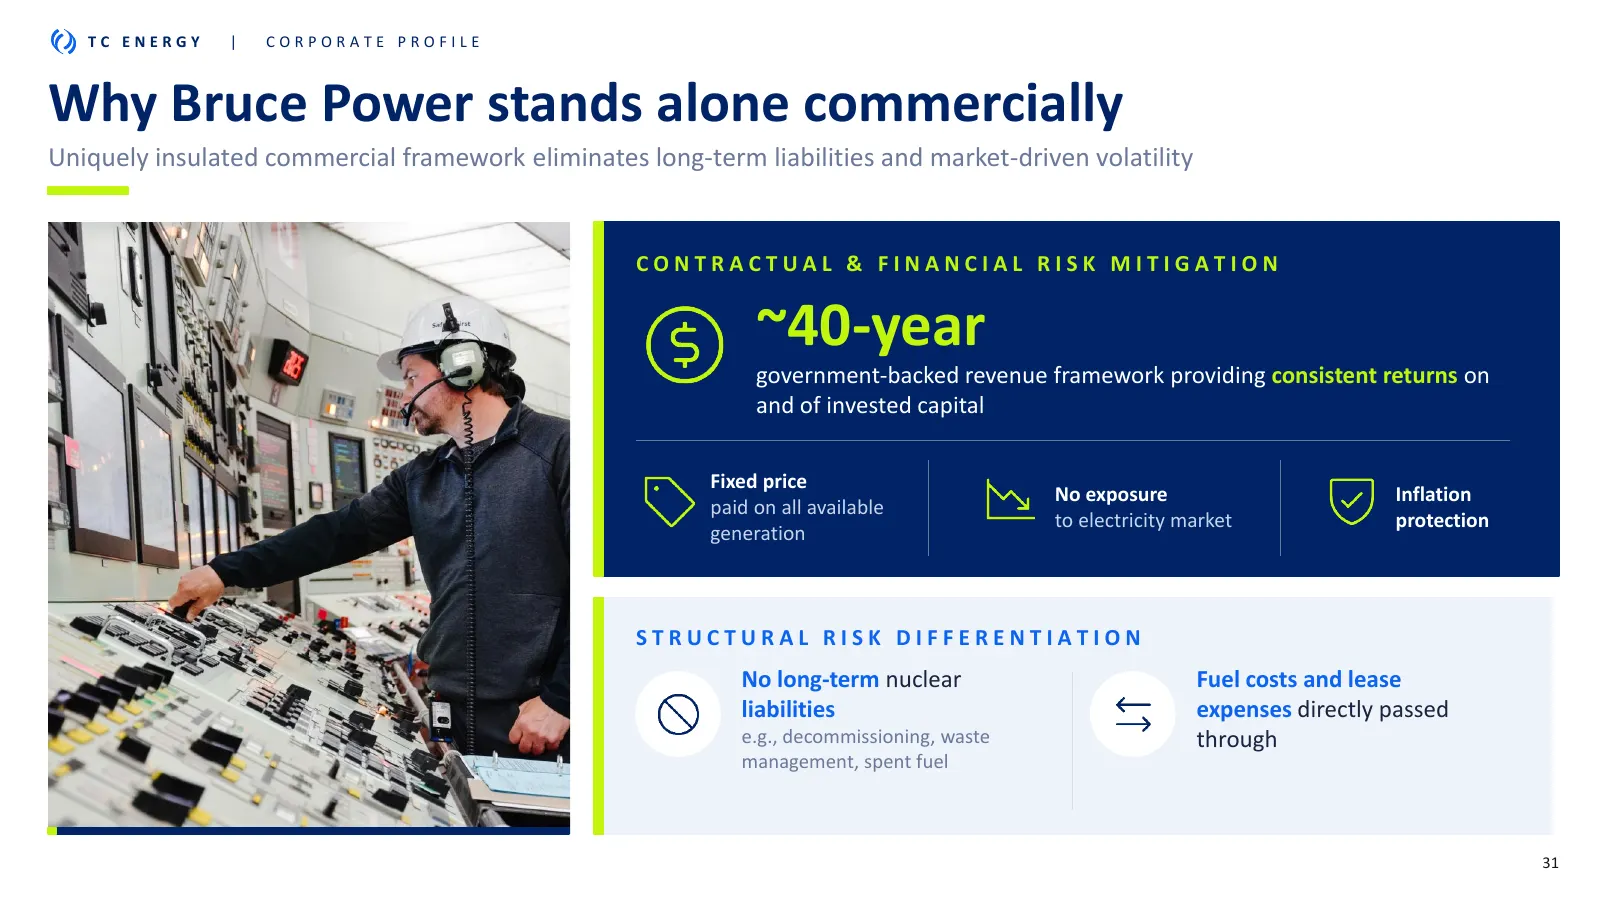
Slide 31: Why Bruce Power stands alone commercially
TC ENERGY | CORPORATE PROFILE Why Bruce Power stands alone commercially Uniquely insulated commercial framework eliminates long-term liabilities and market-driven volatility CONTRACTUAL & FINANCIAL RISK MITIGATION ~40-year government-backed revenue framework providing consistent returns on and of in
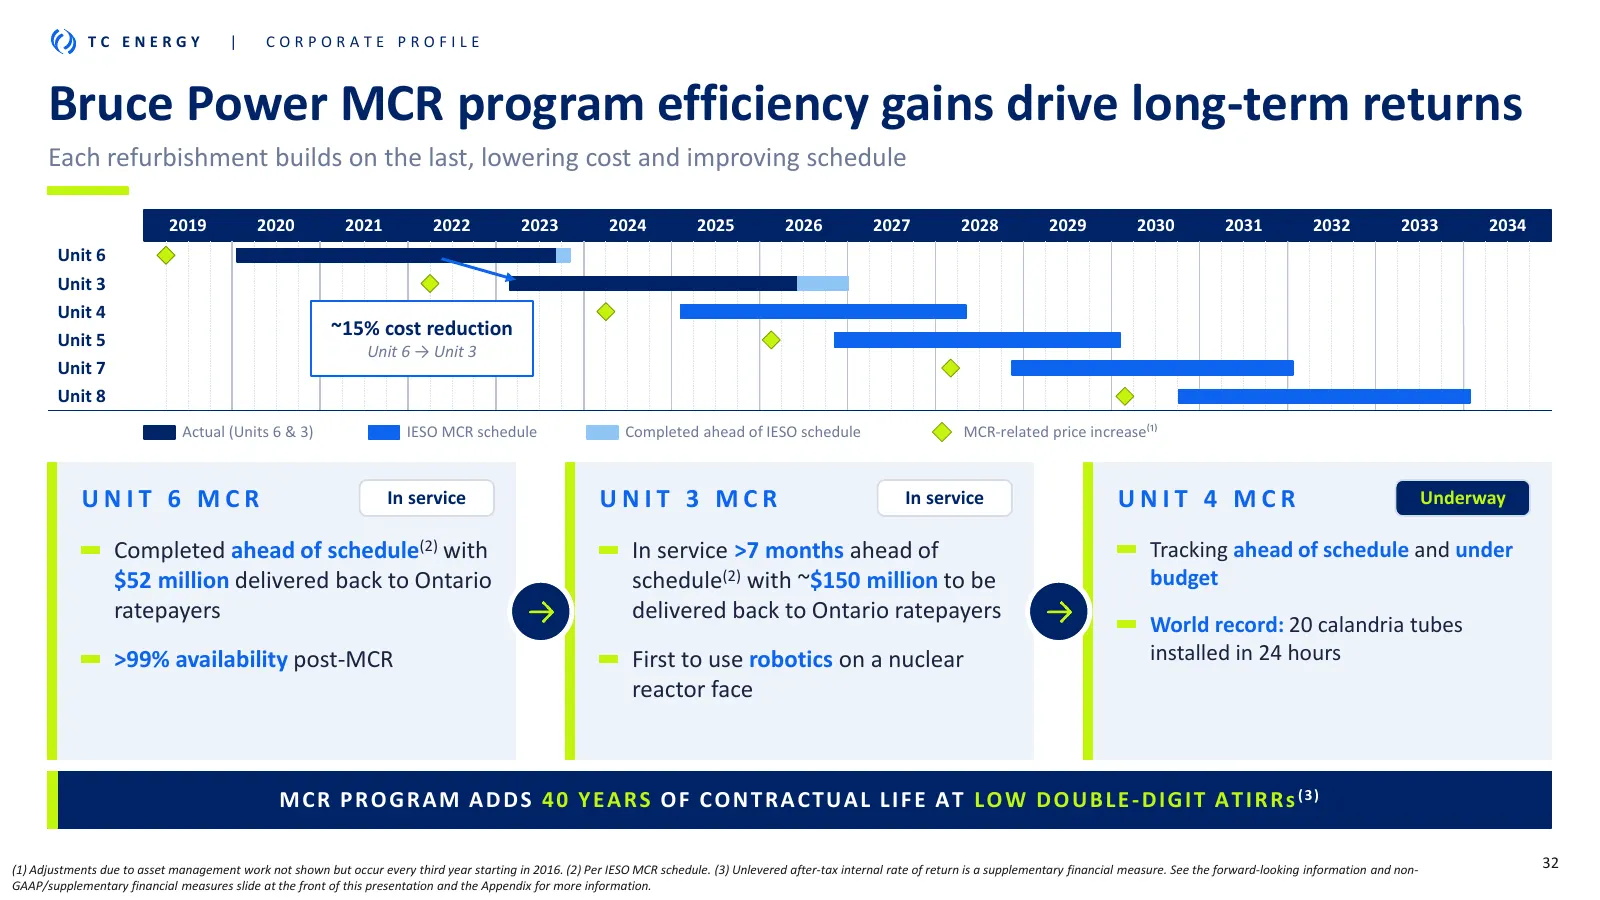
Slide 32: Bruce Power MCR program efficiency gains drive long-term returns
TC ENERGY | CORPORATE PROFILE Bruce Power MCR program efficiency gains drive long-term returns Each refurbishment builds on the last, lowering cost and improving schedule 2019 2020 2021 2022 2023 2024 2025 2026 2027 2028 2029 2030 2031 2032 2033 2034 Unit 6 Unit 3 Unit 4 ~15% cost reduction Unit 5 U
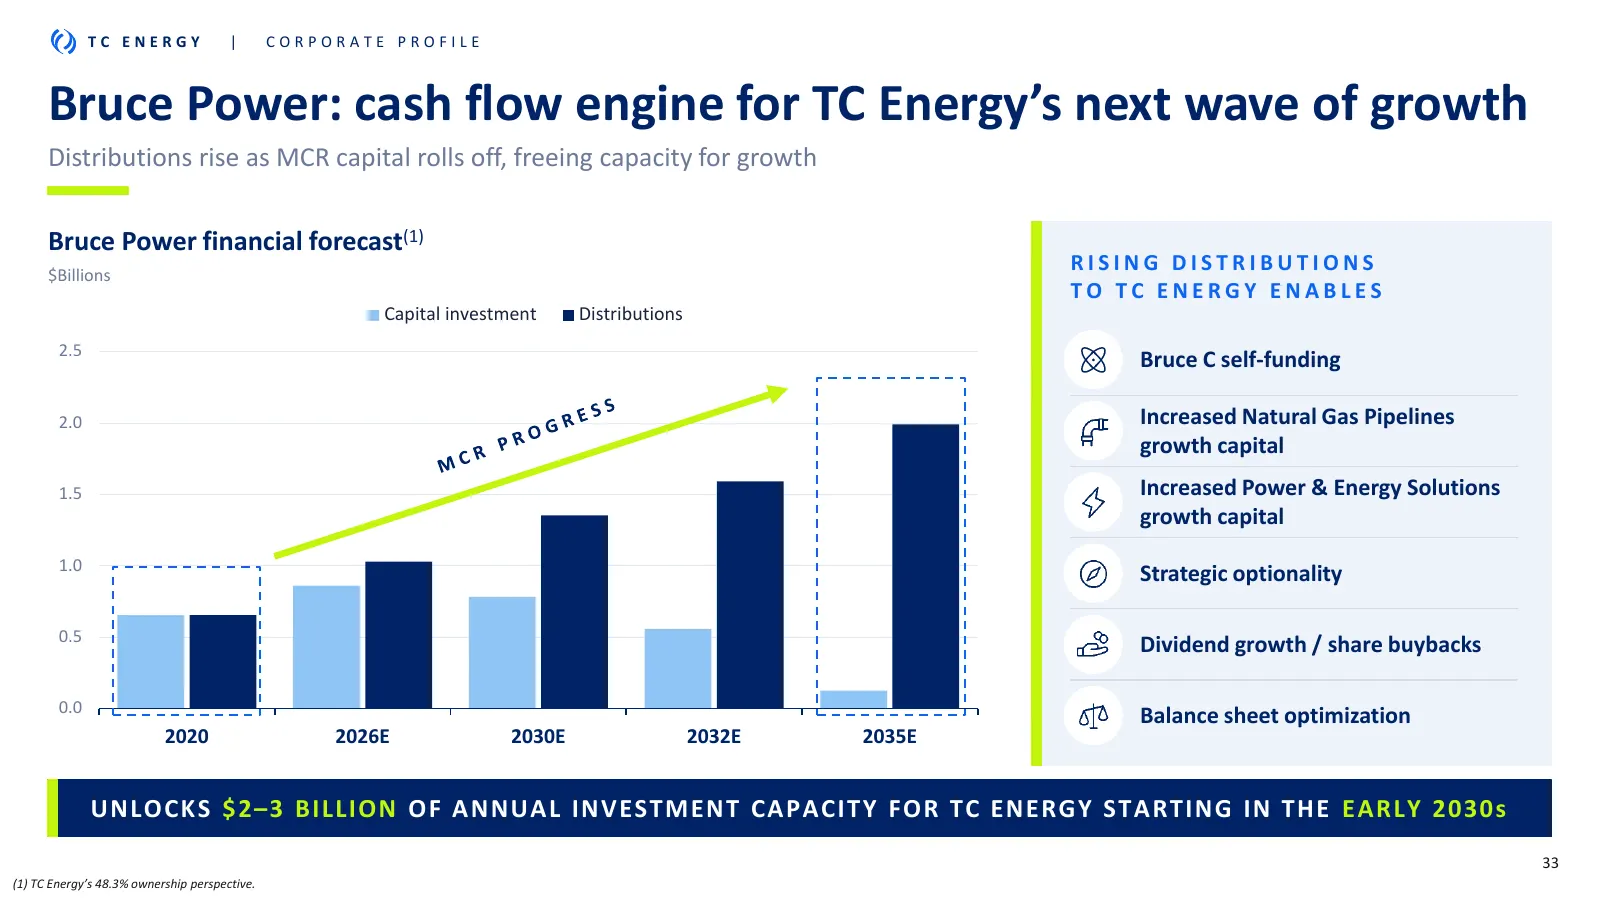
Slide 33: Bruce Power: cash flow engine for TC Energy's next wave of growth
TC ENERGY | CORPORATE PROFILE Bruce Power: cash flow engine for TC Energy’s next wave of growth Distributions rise as MCR capital rolls off, freeing capacity for growth Bruce Power financial forecast(1) $Billions RISING DISTRIBUTIONS TO TC ENERGY ENABLES Capital investment Distributions 2.5 Bruce C
Slide 34: Financial outlook
TC ENERGY | CORPORATE PROFILE CORPORATE PROFILE Financial outlook | TC E N E RGY
Slide 35: Raising our 2026 and 2027 outlook
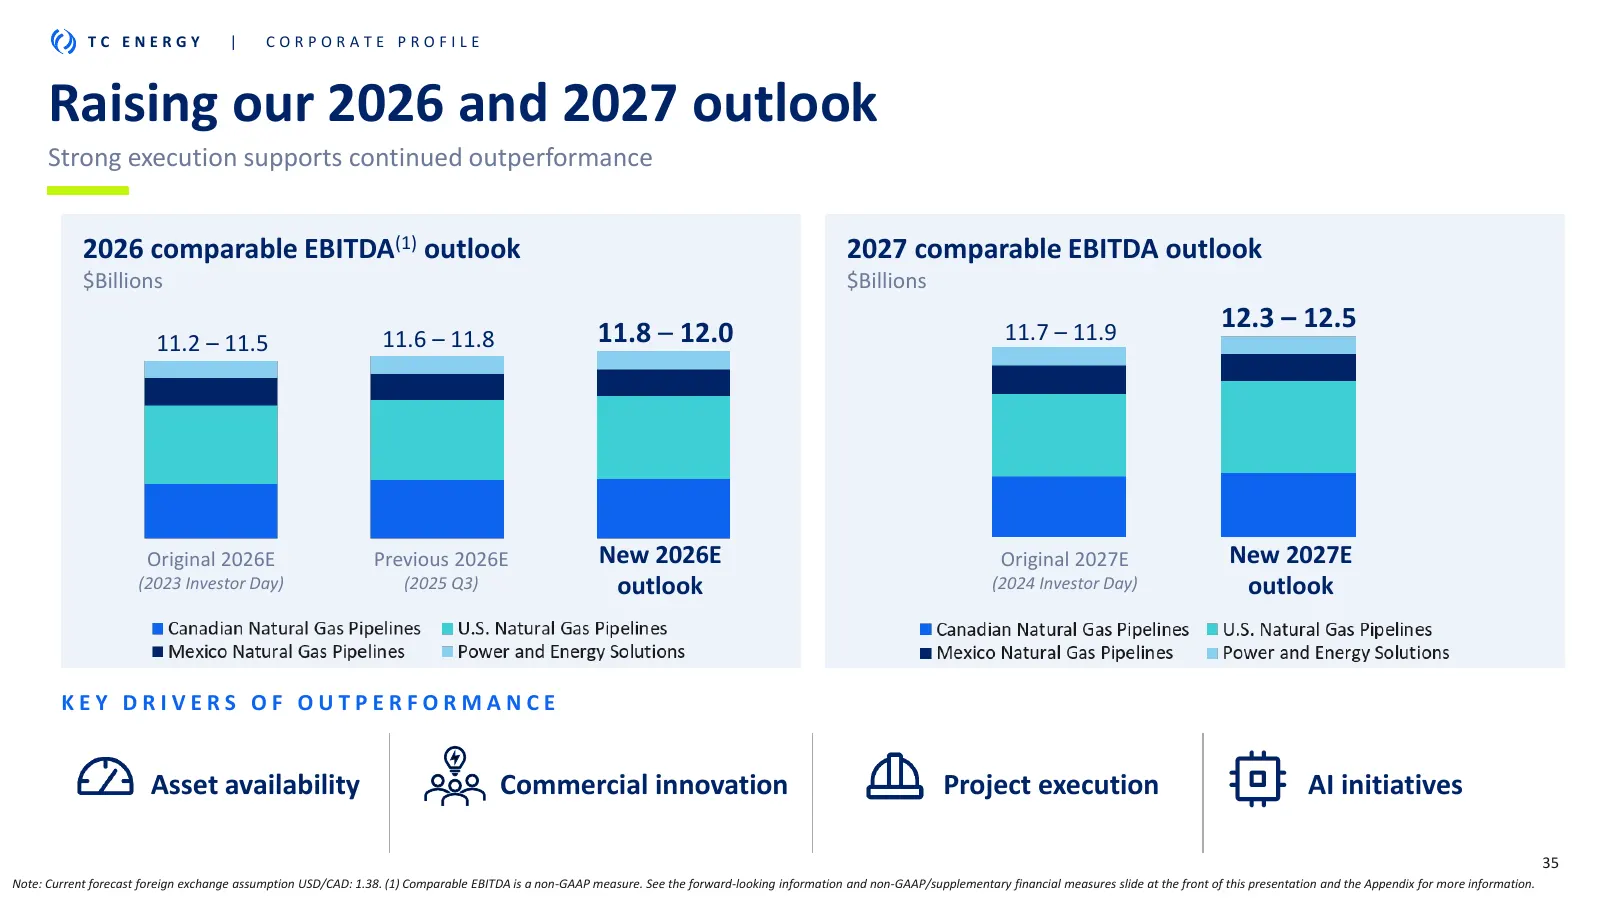
TC ENERGY | CORPORATE PROFILE Raising our 2026 and 2027 outlook Strong execution supports continued outperformance 2026 comparable EBITDA(1) outlook 2027 comparable EBITDA outlook $Billions $Billions 12.3 – 12.5 11.2 – 11.5 11.6 – 11.8 11.8 – 12.0 11.7 – 11.9 Original 2026E Previous 2026E New 2026E
Slide 36: Demonstrating capital backlog conversion
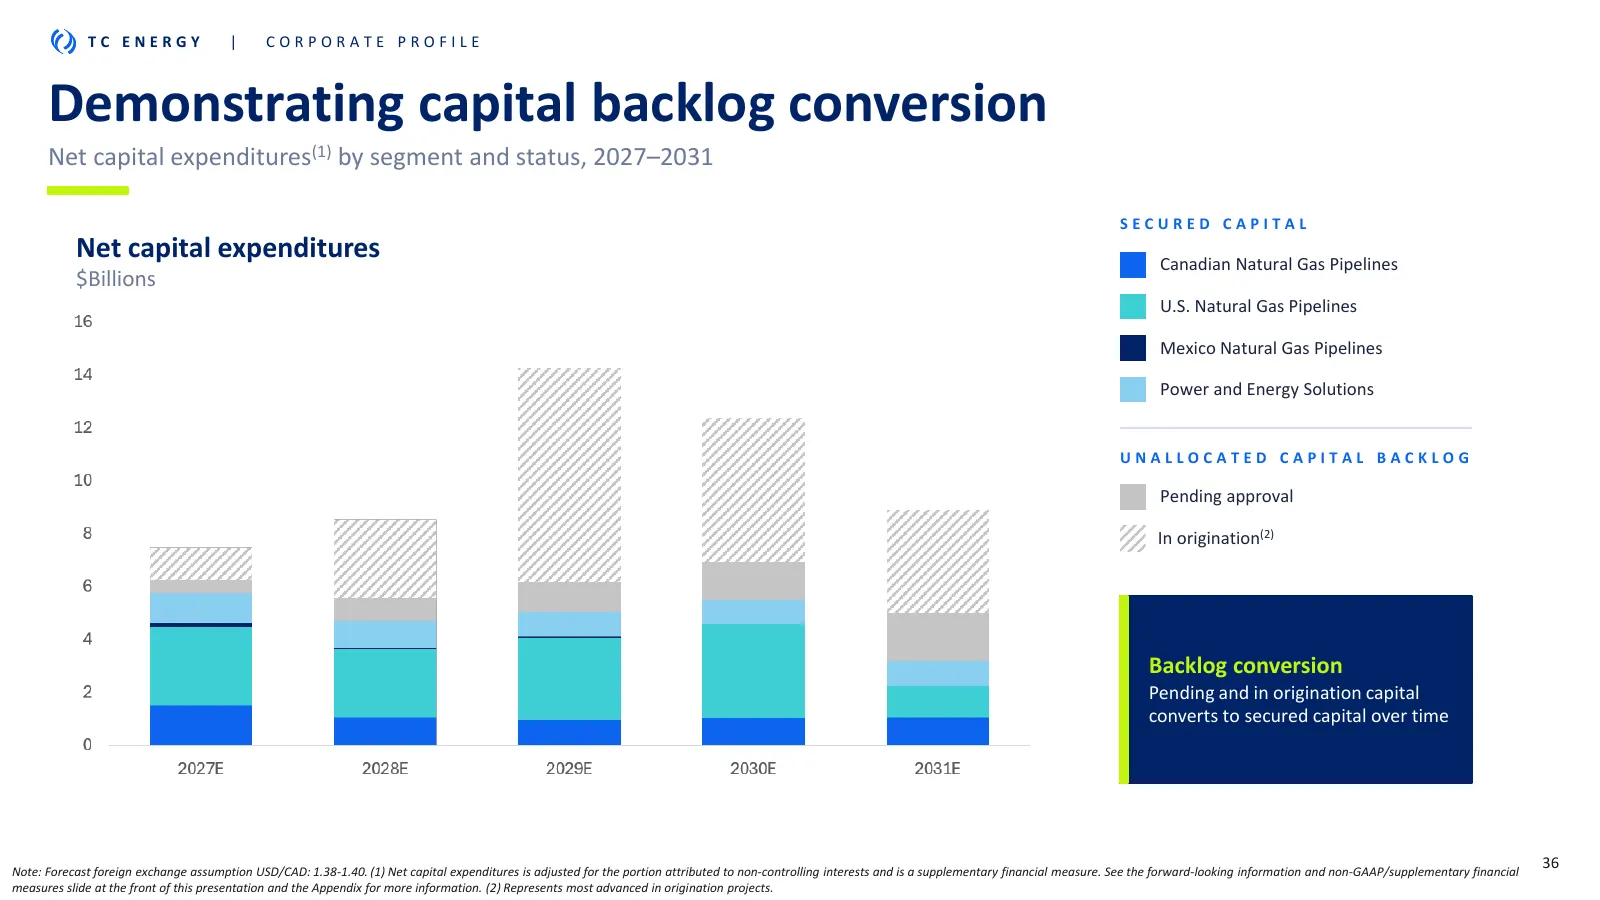
TC ENERGY | CORPORATE PROFILE Demonstrating capital backlog conversion Net capital expenditures(1) by segment and status, 2027–2031 SECURED CAPITAL Net capital expenditures Canadian Natural Gas Pipelines $Billions U.S. Natural Gas Pipelines Mexico Natural Gas Pipelines Power and Energy Solutions UNA
Slide 37: Five-year 5–7% compound annual growth outlook
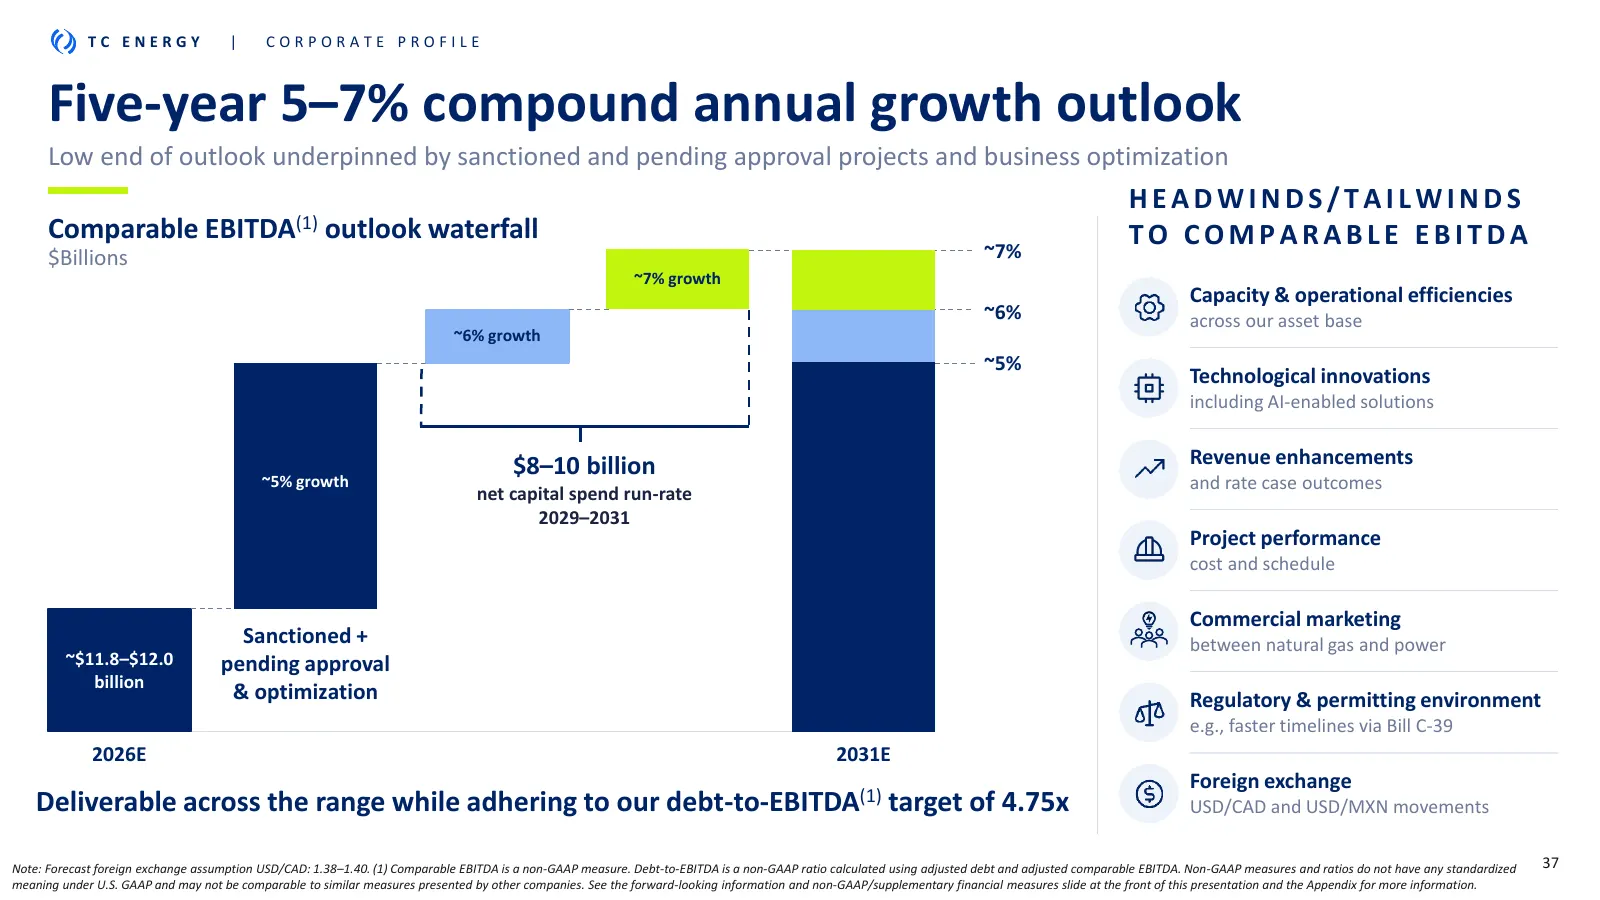
TC ENERGY | CORPORATE PROFILE Five-year 5–7% compound annual growth outlook Low end of outlook underpinned by sanctioned and pending approval projects and business optimization HEADWINDS/TAILWINDS Comparable EBITDA(1) outlook waterfall TO COMPARABLE EBITDA $Billions ~7% ~7% growth Capacity & operati
Slide 38: Funding generational growth
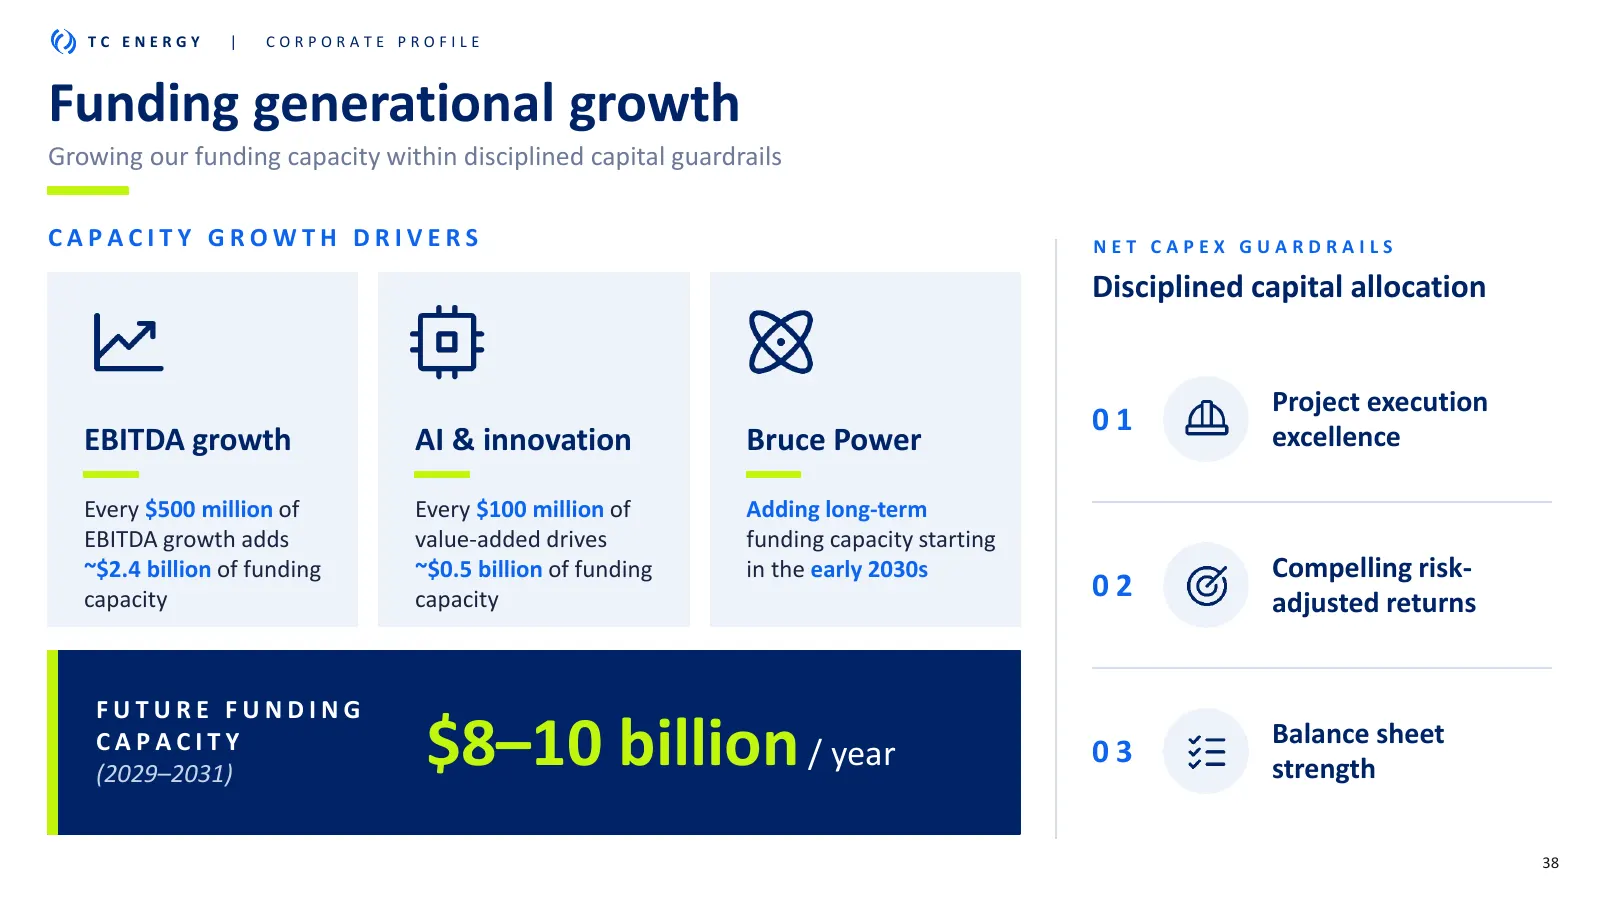
TC ENERGY | CORPORATE PROFILE Funding generational growth Growing our funding capacity within disciplined capital guardrails CAPACITY GROWTH DRIVERS NET CAPEX GUARDRAILS Disciplined capital allocation Project execution 01 excellence EBITDA growth AI & innovation Bruce Power Every $500 million of Eve
Slide 39: Appendix
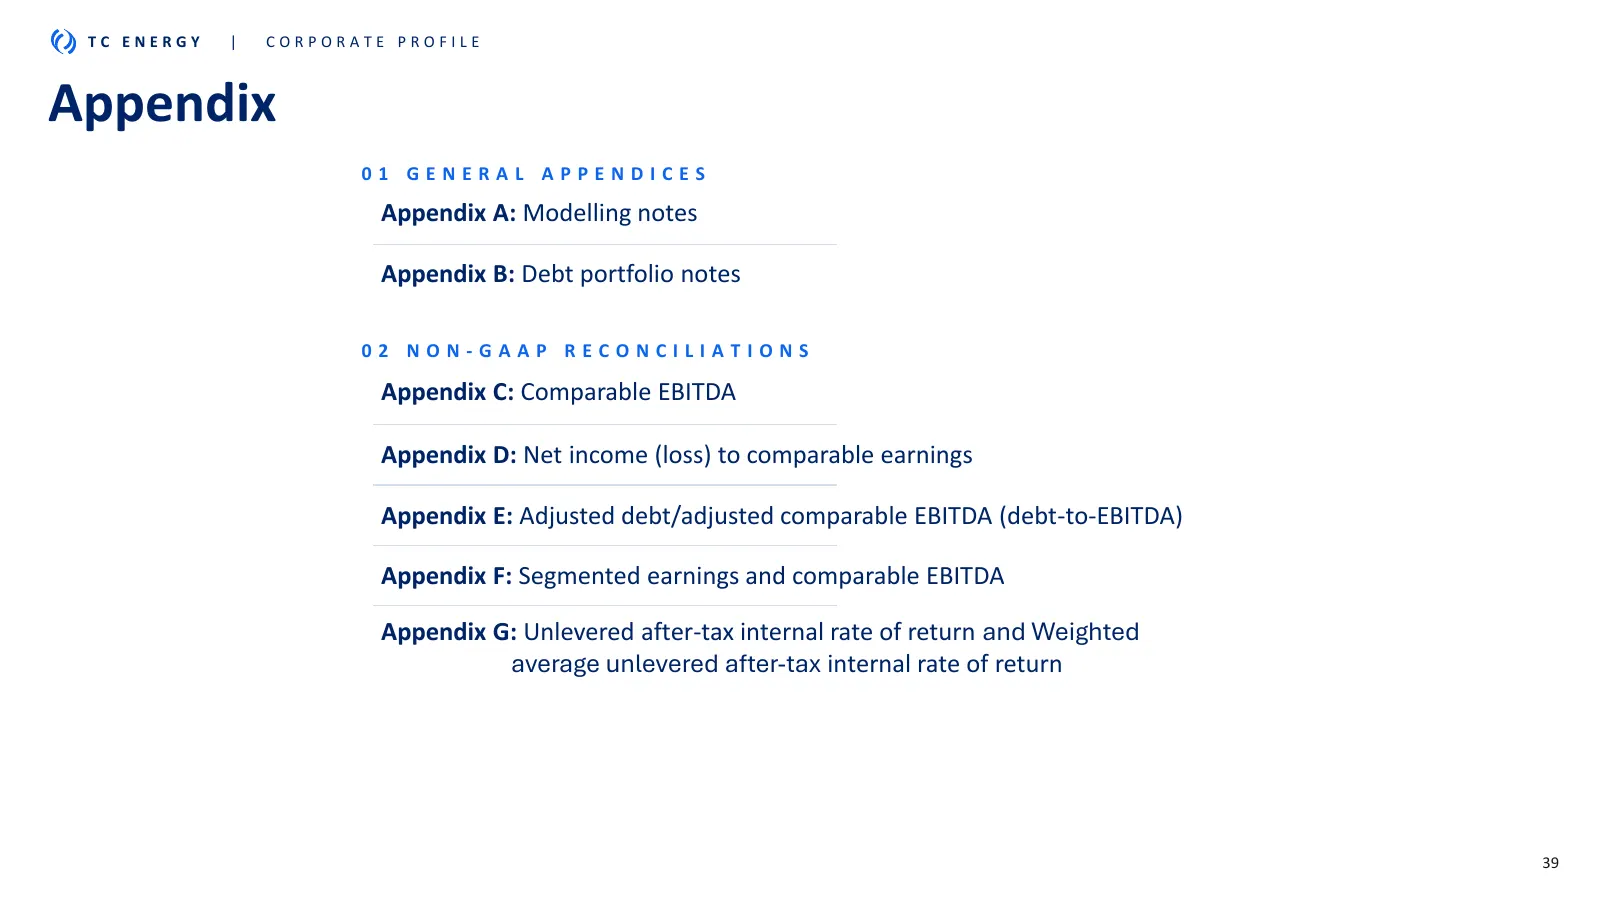
TC ENERGY | CORPORATE PROFILE Appendix 01 GENERAL APPENDICES Appendix A: Modelling notes Appendix B: Debt portfolio notes 02 NON-GAAP RECONCILIATIONS Appendix C: Comparable EBITDA Appendix D: Net income (loss) to comparable earnings Appendix E: Adjusted debt/adjusted comparable EBITDA (debt-to-EBITD
Slide 40: Appendix A: Modelling notes
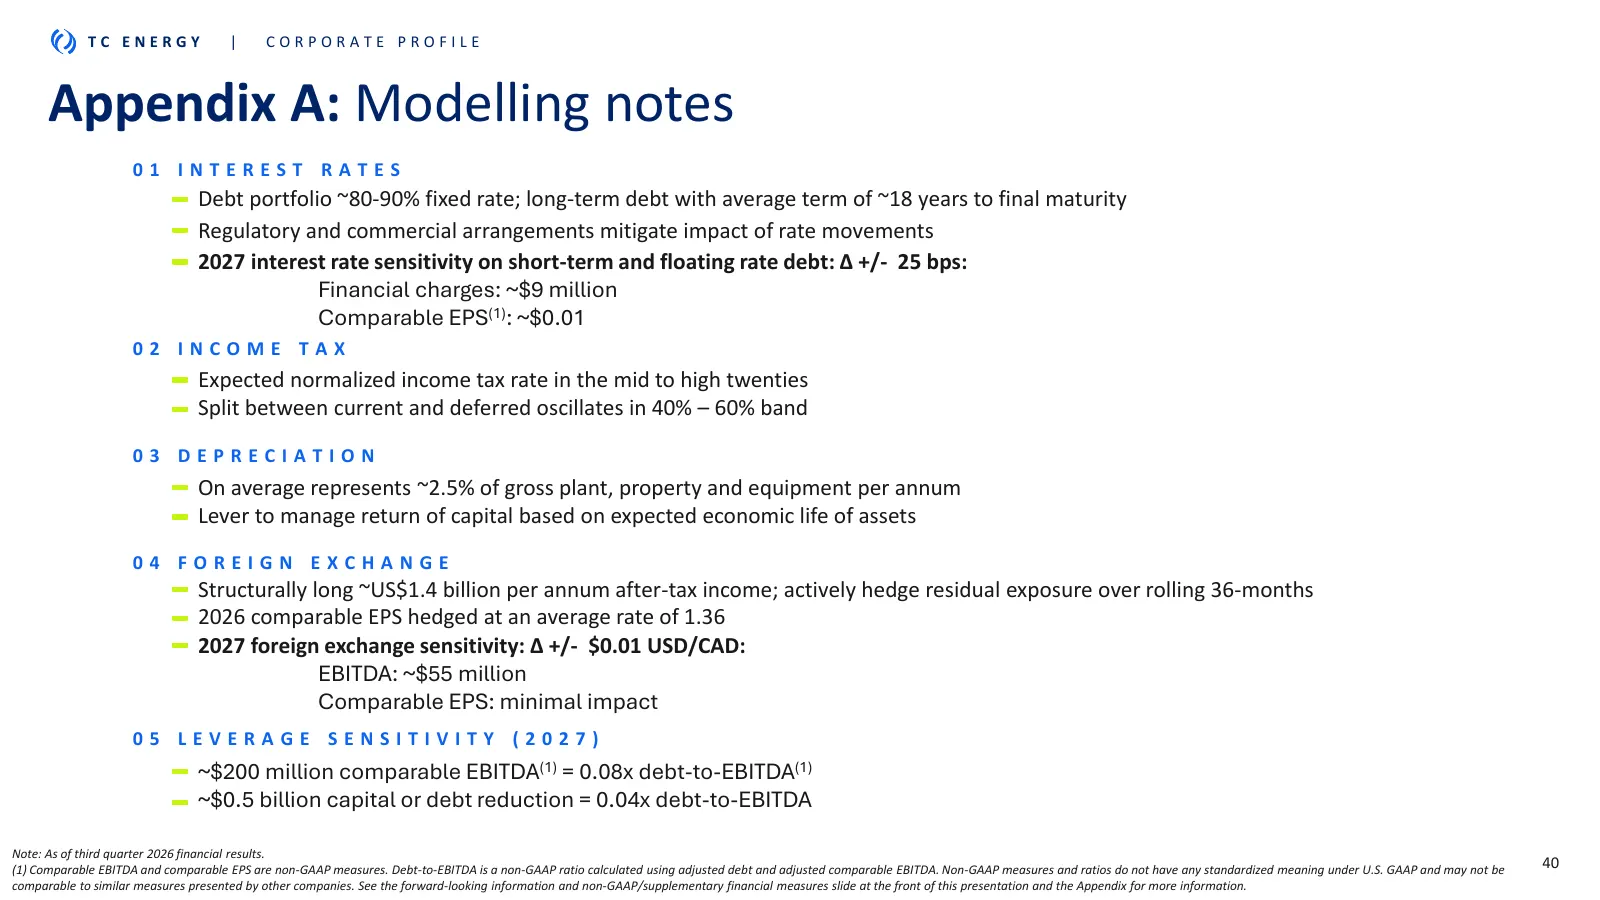
TC ENERGY | CORPORATE PROFILE Appendix A: Modelling notes 01 INTEREST RATES Debt portfolio ~80-90% fixed rate; long-term debt with average term of ~18 years to final maturity Regulatory and commercial arrangements mitigate impact of rate movements 2027 interest rate sensitivity on short-term and flo
Slide 41: Appendix B: Debt portfolio notes
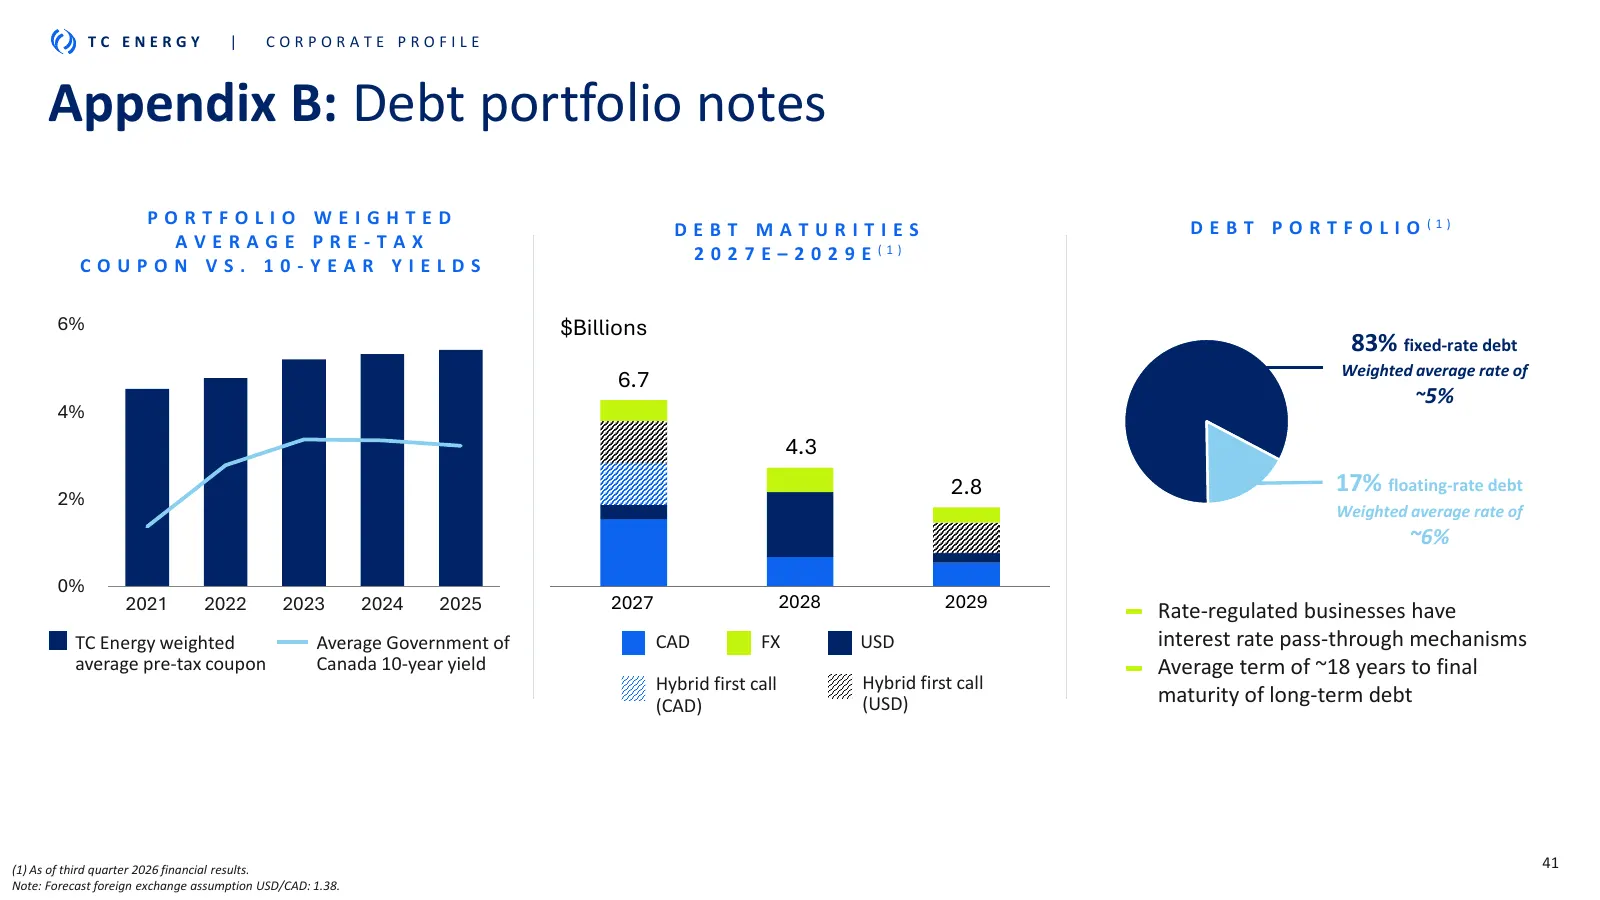
TC ENERGY | CORPORATE PROFILE Appendix B: Debt portfolio notes PORTFOLIO WEIGHTED DEBT MATURITIES D E B T P O R T F O L I O (1) AVERAGE PRE-TAX 2 0 2 7 E – 2 0 2 9 E (1) COUPON VS. 10-YEAR YIELDS 6% $Billions 83% fixed-rate debt Weighted average rate of 6.7 ~5% 4% 4.3 2.8 17% floating-rate debt 2% W
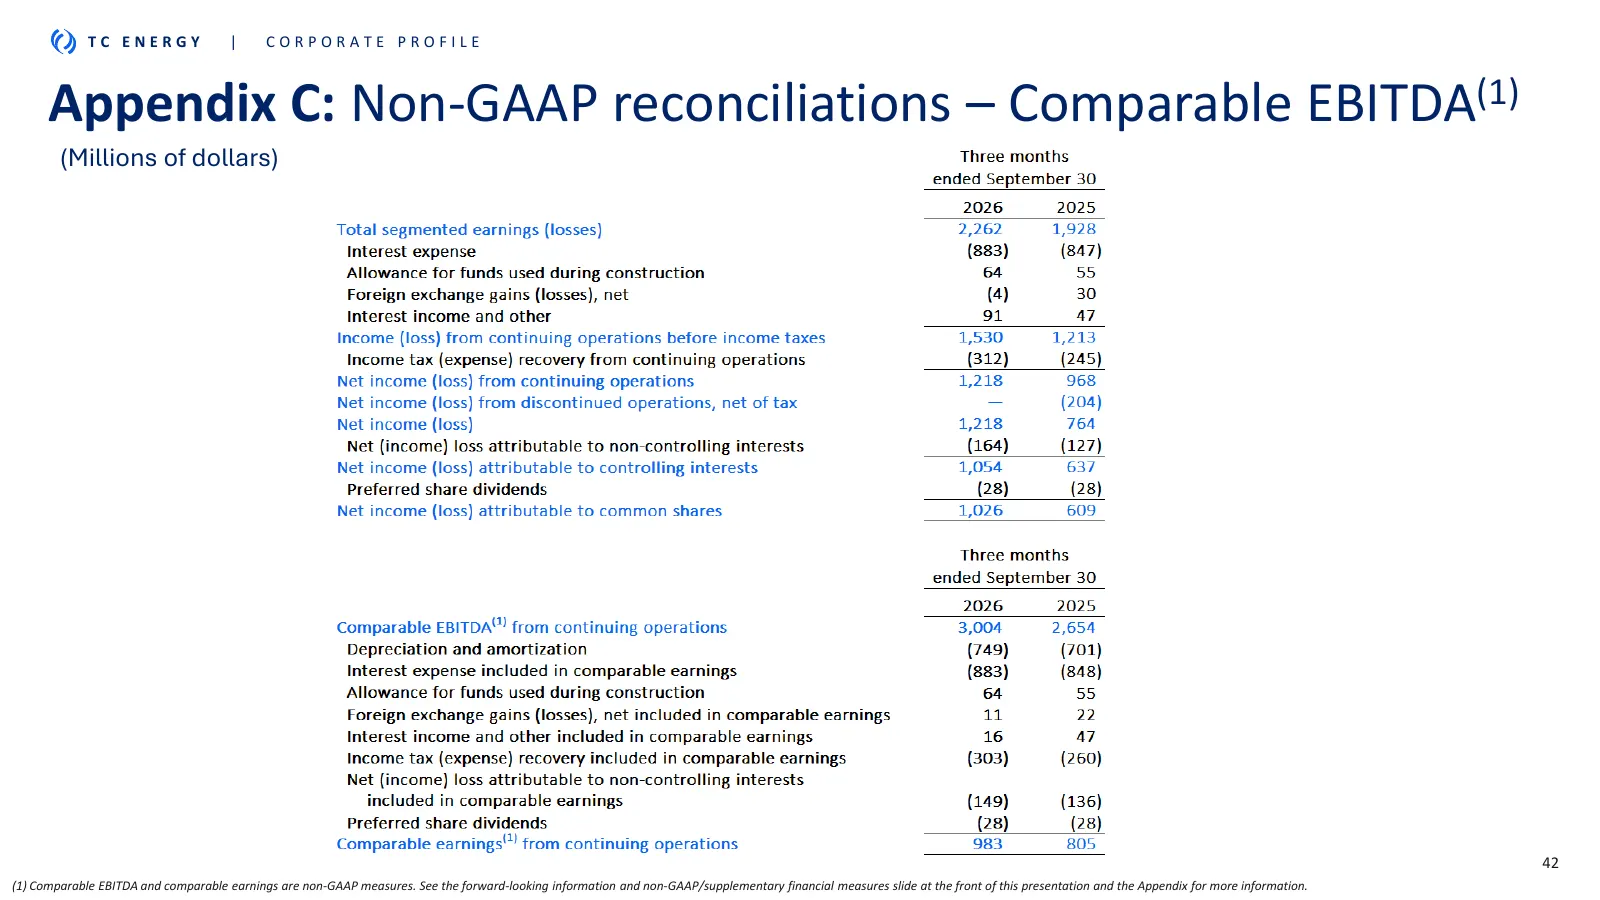
Slide 42: Appendix C: Non-GAAP reconciliations – Comparable EBITDA
TC ENERGY | CORPORATE PROFILE Appendix C: Non-GAAP reconciliations – Comparable EBITDA(1) (Millions of dollars) 42 (1) Comparable EBITDA and comparable earnings are non-GAAP measures. See the forward-looking information and non-GAAP/supplementary financial measures slide at the front of this present
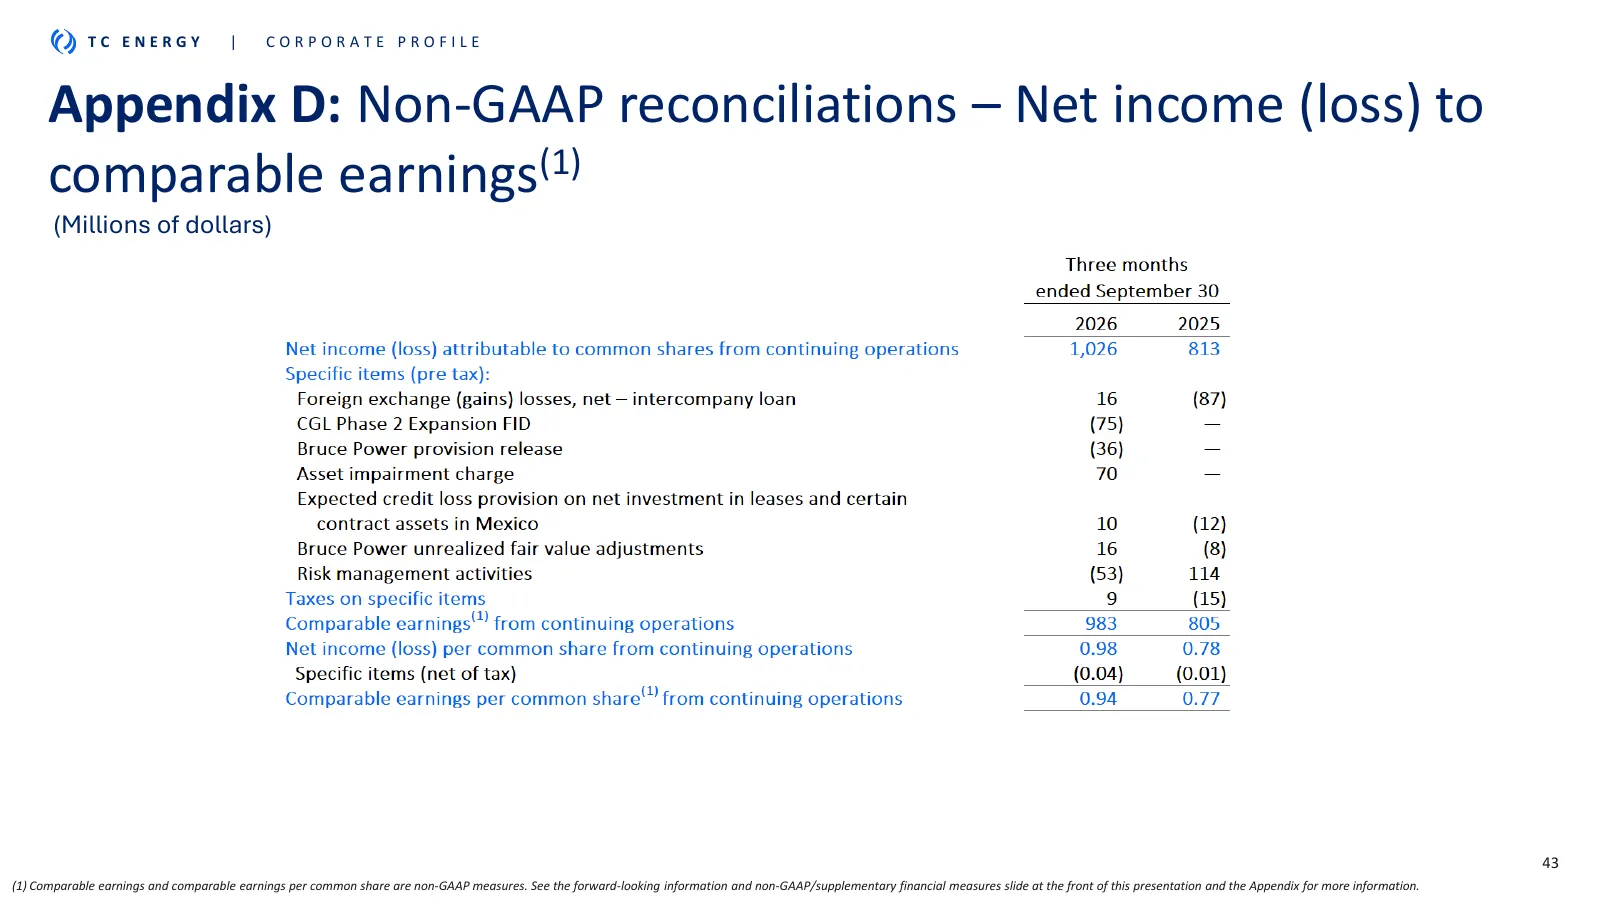
Slide 43: Appendix D: Non-GAAP reconciliations – Net income (loss) to comparable earnings
TC ENERGY | CORPORATE PROFILE Appendix D: Non-GAAP reconciliations – Net income (loss) to comparable earnings(1) (Millions of dollars) 43 (1) Comparable earnings and comparable earnings per common share are non-GAAP measures. See the forward-looking information and non-GAAP/supplementary financial m
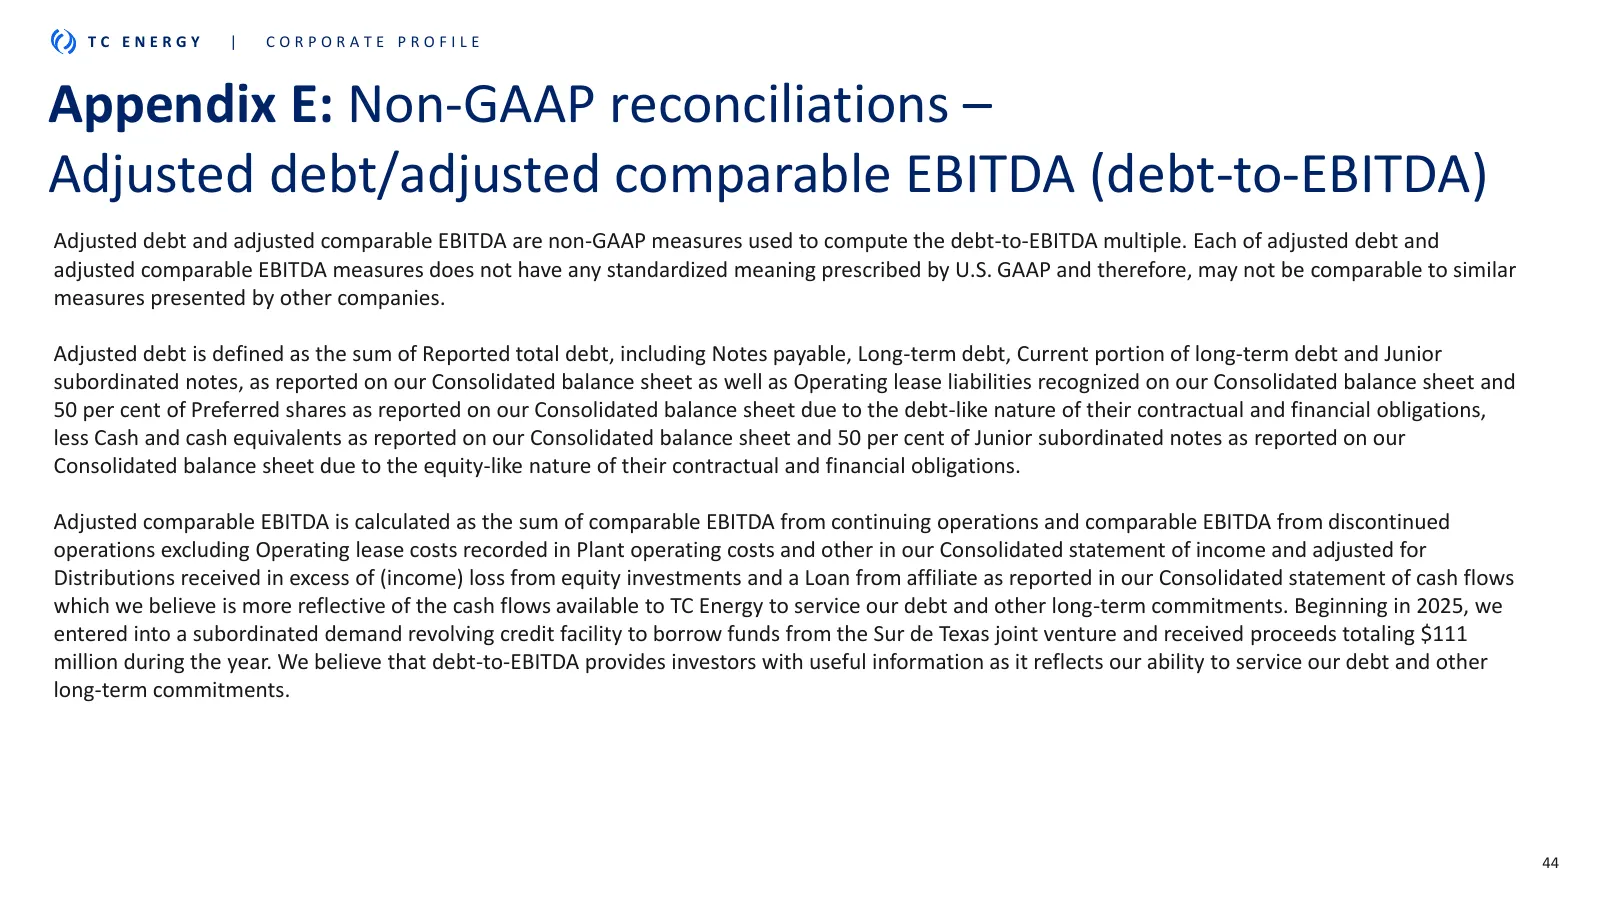
Slide 44: Appendix E: Non-GAAP reconciliations – Adjusted debt/adjusted comparable EBITDA
TC ENERGY | CORPORATE PROFILE Appendix E: Non-GAAP reconciliations – Adjusted debt/adjusted comparable EBITDA (debt-to-EBITDA) Adjusted debt and adjusted comparable EBITDA are non-GAAP measures used to compute the debt-to-EBITDA multiple. Each of adjusted debt and adjusted comparable EBITDA measures
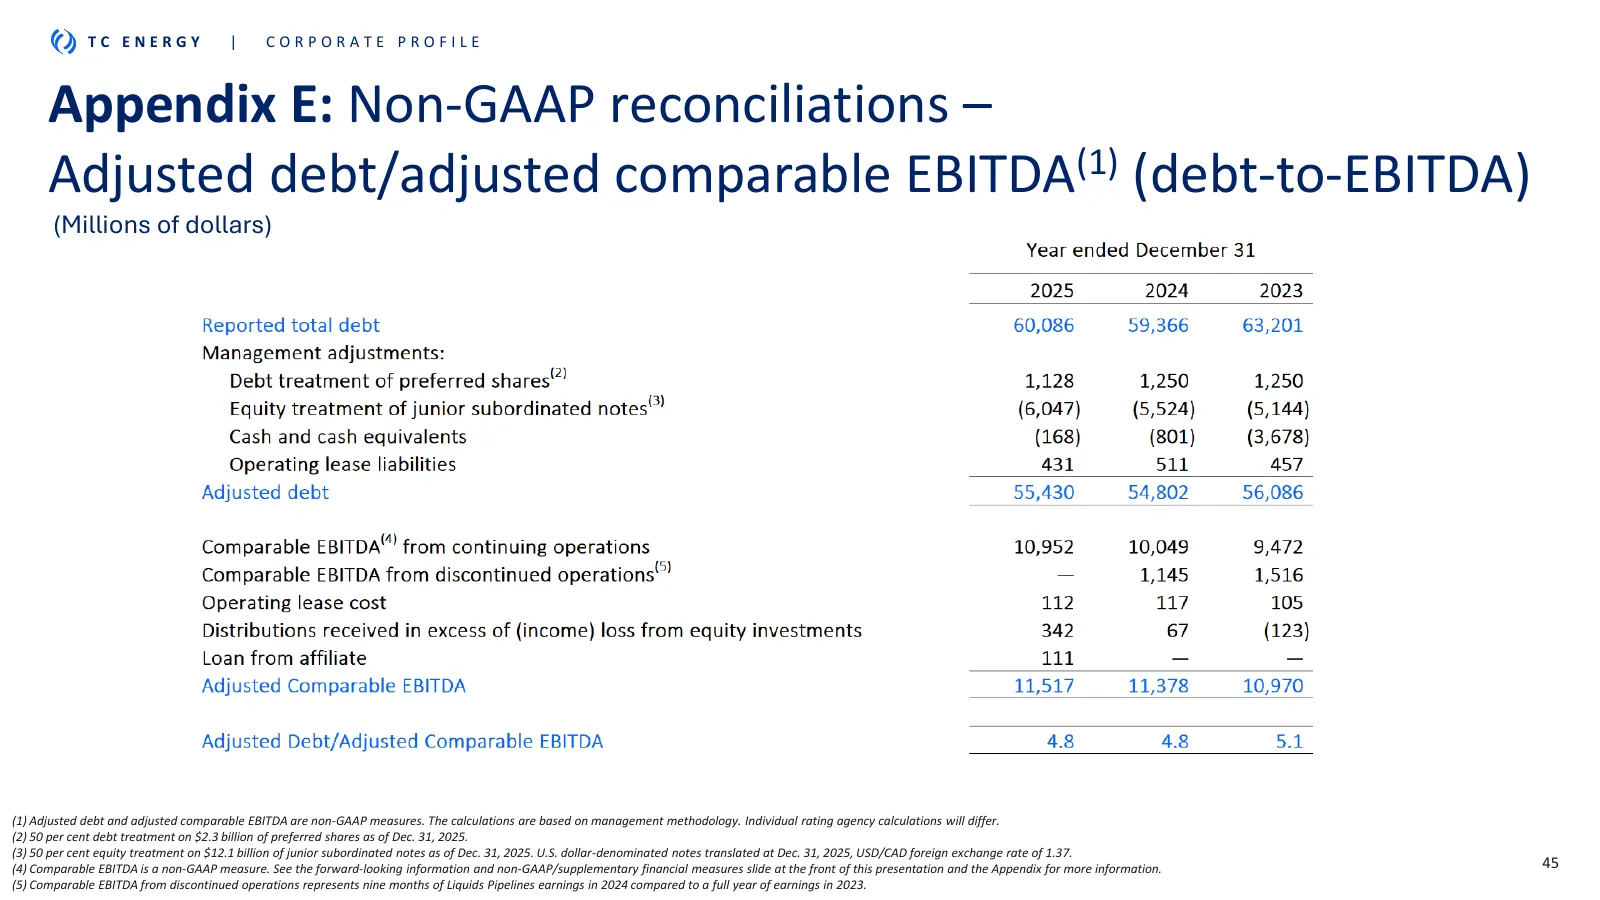
Slide 45: Appendix E: Non-GAAP reconciliations – Adjusted debt/adjusted comparable EBITDA
TC ENERGY | CORPORATE PROFILE Appendix E: Non-GAAP reconciliations – Adjusted debt/adjusted comparable EBITDA(1) (debt-to-EBITDA) (Millions of dollars) (1) Adjusted debt and adjusted comparable EBITDA are non-GAAP measures. The calculations are based on management methodology. Individual rating agen
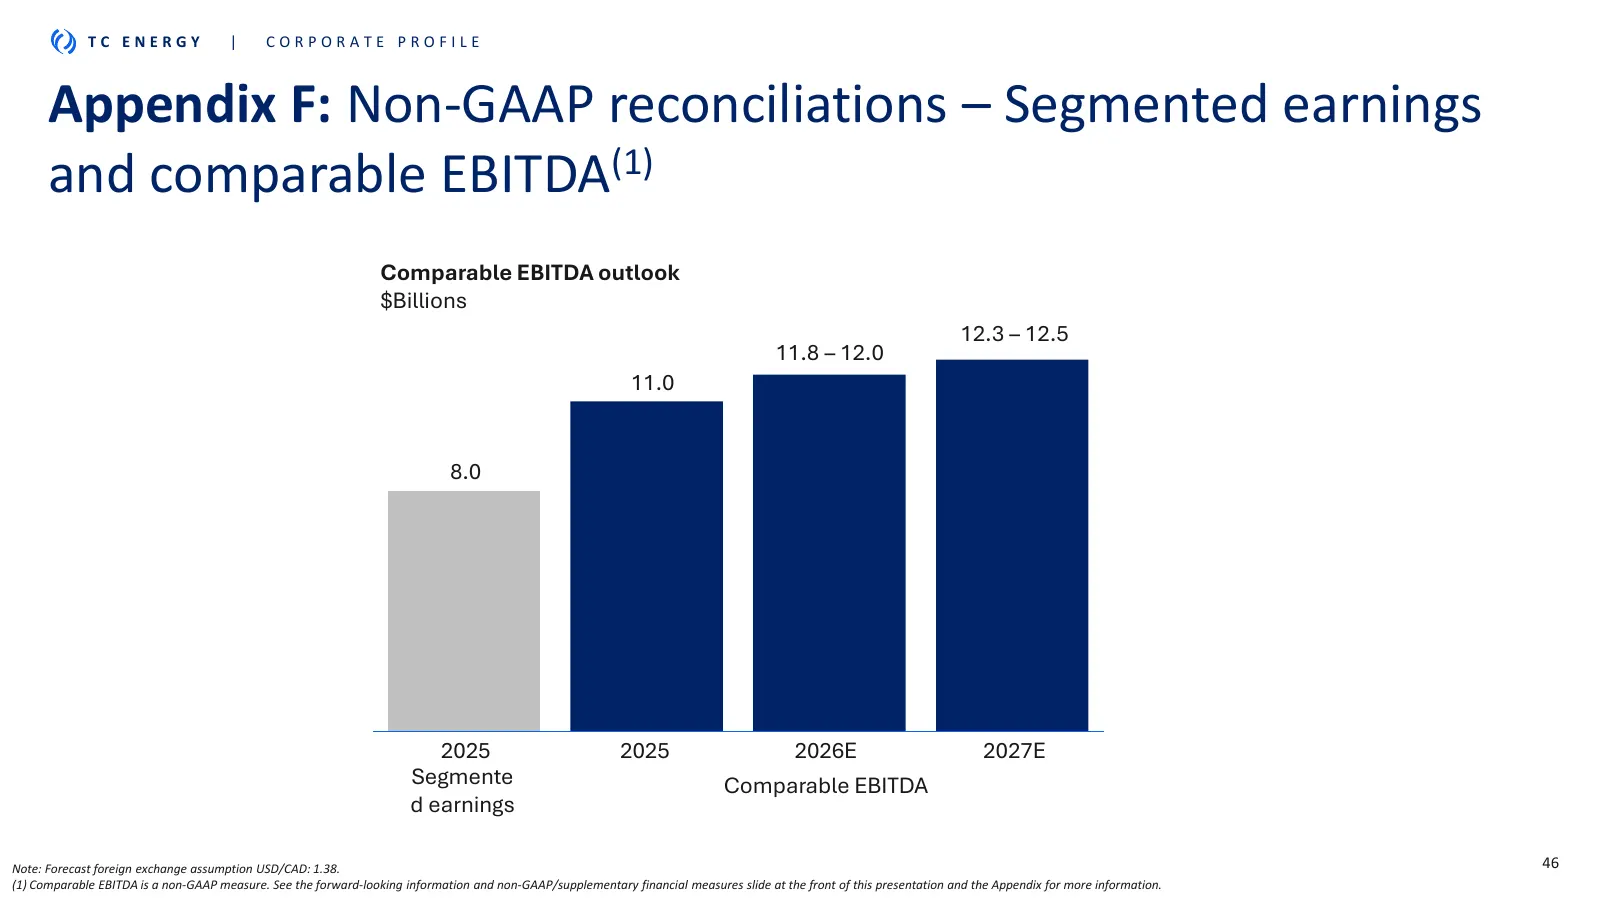
Slide 46: Appendix F: Non-GAAP reconciliations – Segmented earnings and comparable EBITDA
TC ENERGY | CORPORATE PROFILE Appendix F: Non-GAAP reconciliations – Segmented earnings and comparable EBITDA(1) Comparable EBITDA outlook $Billions 12.3 – 12.5 11.8 – 12.0 11.0 8.0 2025 2025 2026E 2027E Segmente Comparable EBITDA d earnings Note: Forecast foreign exchange assumption USD/CAD: 1.38.
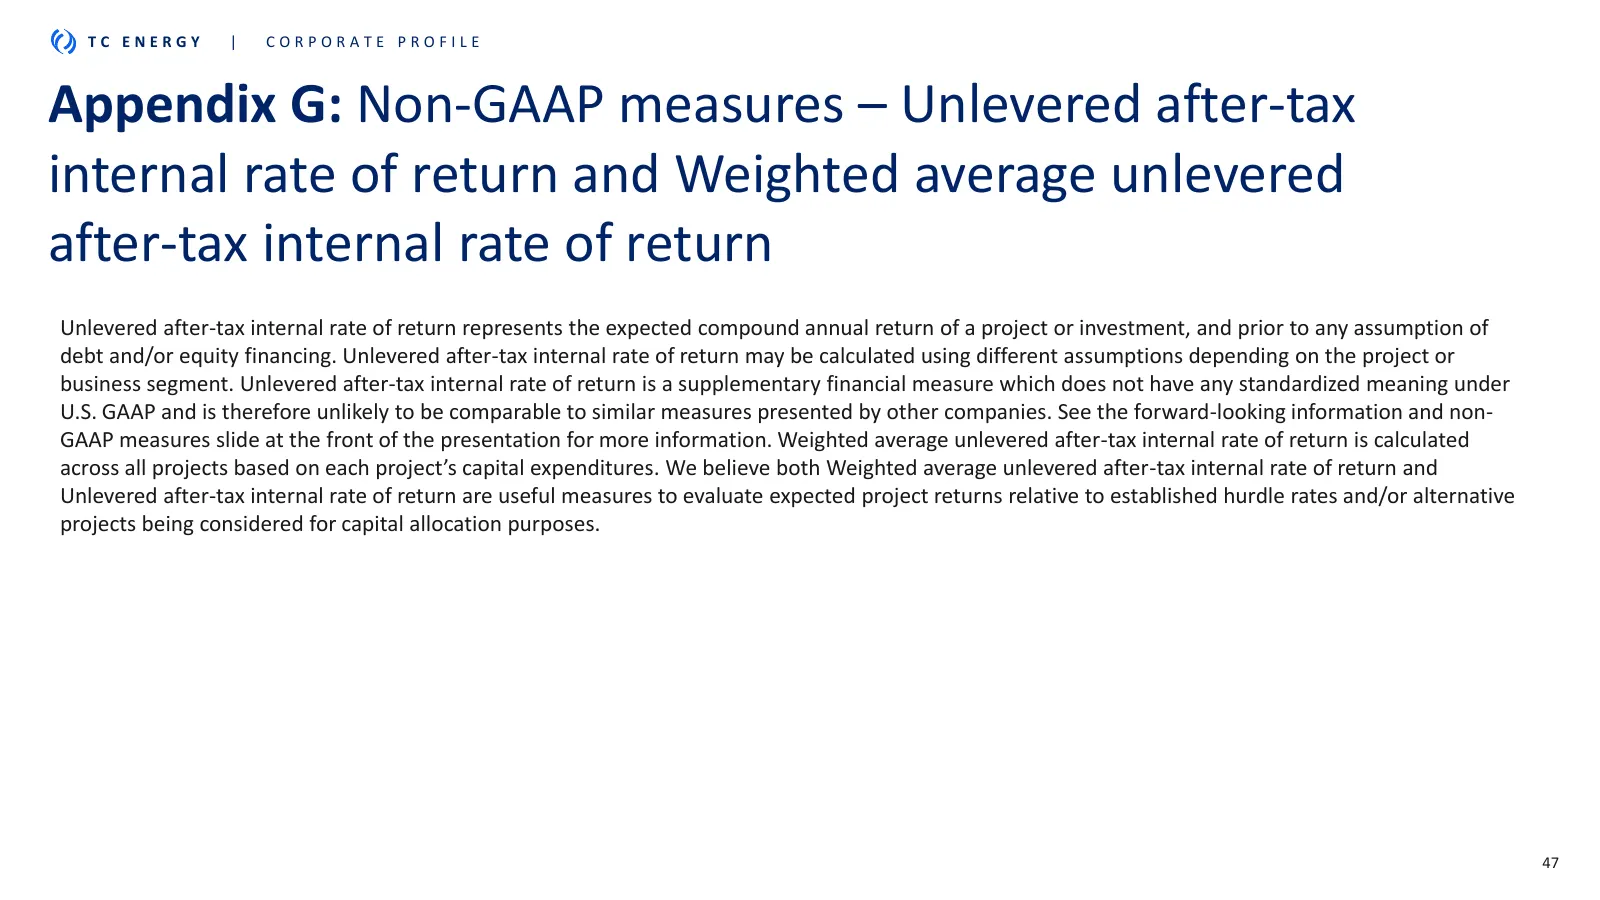
Slide 47: Appendix G: Non-GAAP measures – Unlevered after-tax internal rate of return
TC ENERGY | CORPORATE PROFILE Appendix G: Non-GAAP measures – Unlevered after-tax internal rate of return and Weighted average unlevered after-tax internal rate of return Unlevered after-tax internal rate of return represents the expected compound annual return of a project or investment, and prior
Source: company website
More decks from TC Energy Corporation
 Q3 2026 Earnings Presentation47 slides · Nov 5, 2026
 Investor Presentation (August 2026)46 slides · August 2026
 Q2 2026 Earnings Presentation23 slides · Jul 30, 2026
 Shareholder Meeting (May 2026)28 slides · May 7, 2026
 Q1 2026 Earnings Presentation25 slides · May 1, 2026
 Q4 2025 Earnings Presentation25 slides · Feb 13, 2026