National Penn Bancshares — Shareholder Meeting (April 2014)
25 slides from National Penn Bancshares's shareholder meeting presentation, Apr 29, 2014
Slide 1: Remarks Scott V. Fainor, President and CEO
Remarks Scott V. Fainor President and Chief Executive Officer, National Penn Bancshares, Inc. 1
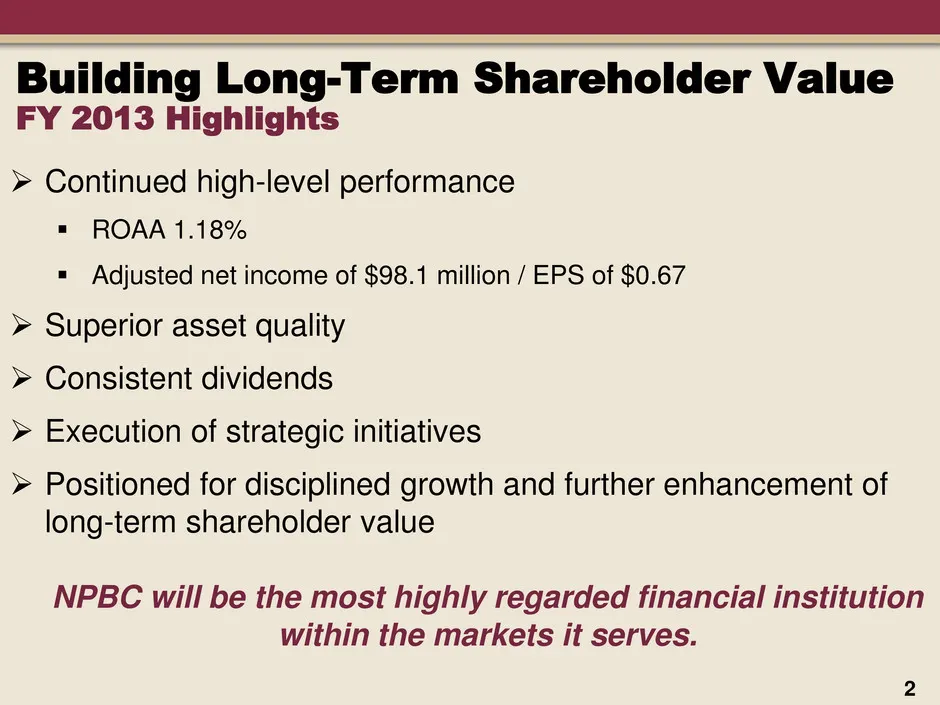
Slide 2: Building Long-Term Shareholder Value: FY 2013 Highlights
Continued high-level performance ROAA 1.18% Adjusted net income of $98.1 million / EPS of $0.67 Superior asset quality Consistent dividends Execution of strategic initiatives Positioned for disciplined growth and further enhancement of long-term shareholder value NPBC will be the most
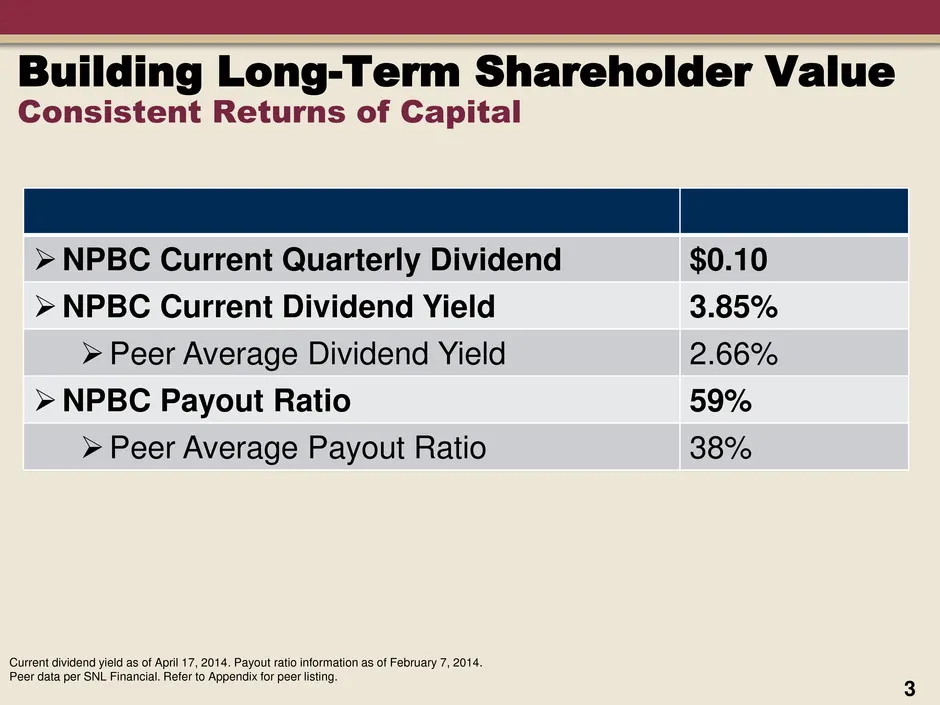
Slide 3: Consistent Returns of Capital
3 Building Long-Term Shareholder Value Consistent Returns of Capital Current dividend yield as of April 17, 2014. Payout ratio information as of February 7, 2014. Peer data per SNL Financial. Refer to Appendix for peer listing. NPBC Current Quarterly Dividend $0.10 NPBC Current Dividend Yield 3.85
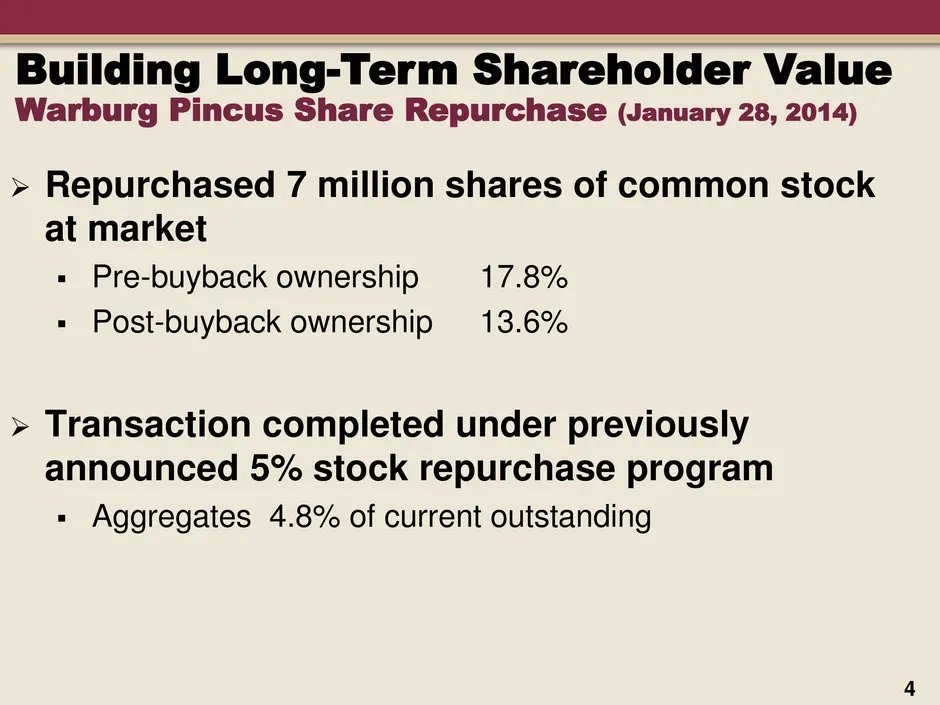
Slide 4: Warburg Pincus Share Repurchase (January 28, 2014)
Repurchased 7 million shares of common stock at market Pre-buyback ownership 17.8% Post-buyback ownership 13.6% Transaction completed under previously announced 5% stock repurchase program Aggregates 4.8% of current outstanding 4 Building Long-Term Shareholder Value Warburg Pincus Share Re
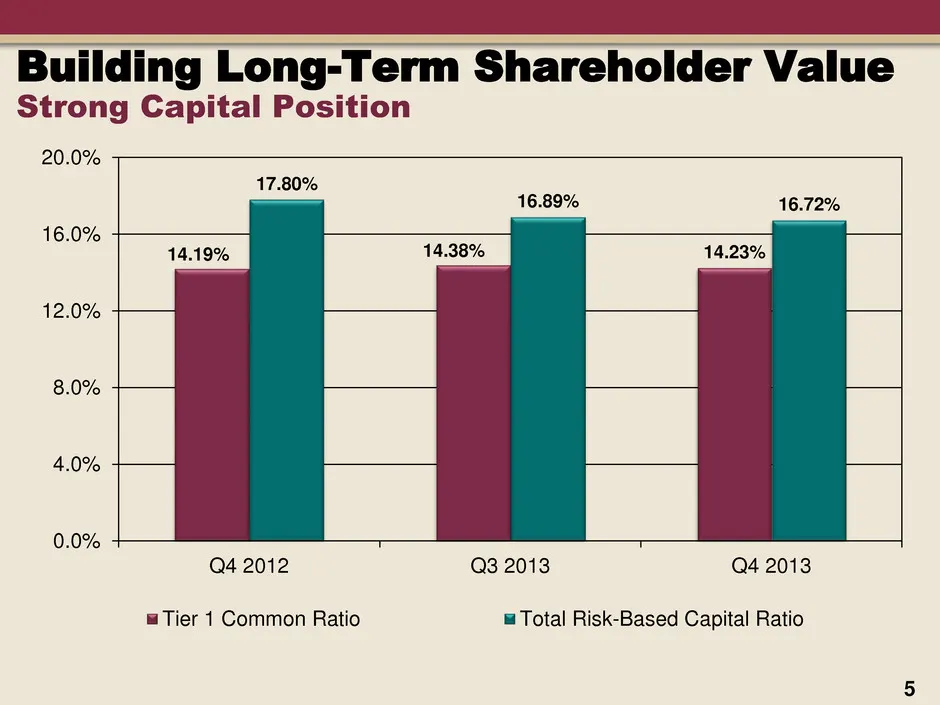
Slide 5: Strong Capital Position
5 Building Long-Term Shareholder Value Strong Capital Position 14.19% 14.38% 14.23% 17.80% 16.89% 16.72% 0.0% 4.0% 8.0% 12.0% 16.0% 20.0% Q4 2012 Q3 2013 Q4 2013 Tier 1 Common Ratio Total Risk-Based Capital Ratio
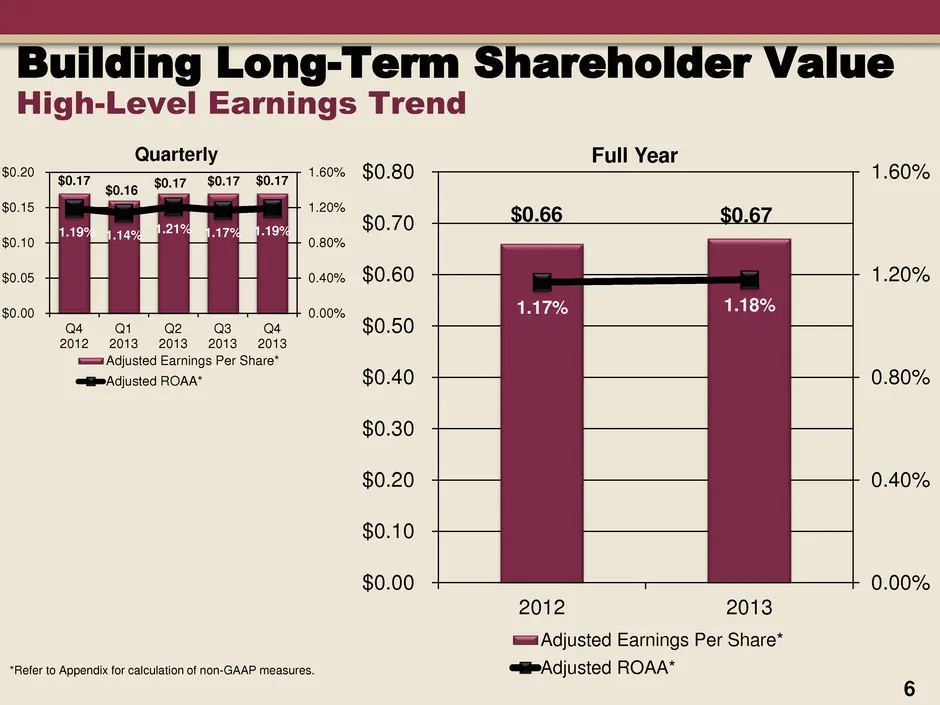
Slide 6: High-Level Earnings Trend
Building Long-Term Shareholder Value High-Level Earnings Trend 6 *Refer to Appendix for calculation of non-GAAP measures. $0.17 $0.16 $0.17 $0.17 $0.17 1.19% 1.14% 1.21% 1.17% 1.19% 0.00% 0.40% 0.80% 1.20% 1.60% $0.00 $0.05 $0.10 $0.15 $0.20 Q4 2012 Q1 2013 Q2 2013 Q3 2013 Q4 2013 Quarterly Adjusted
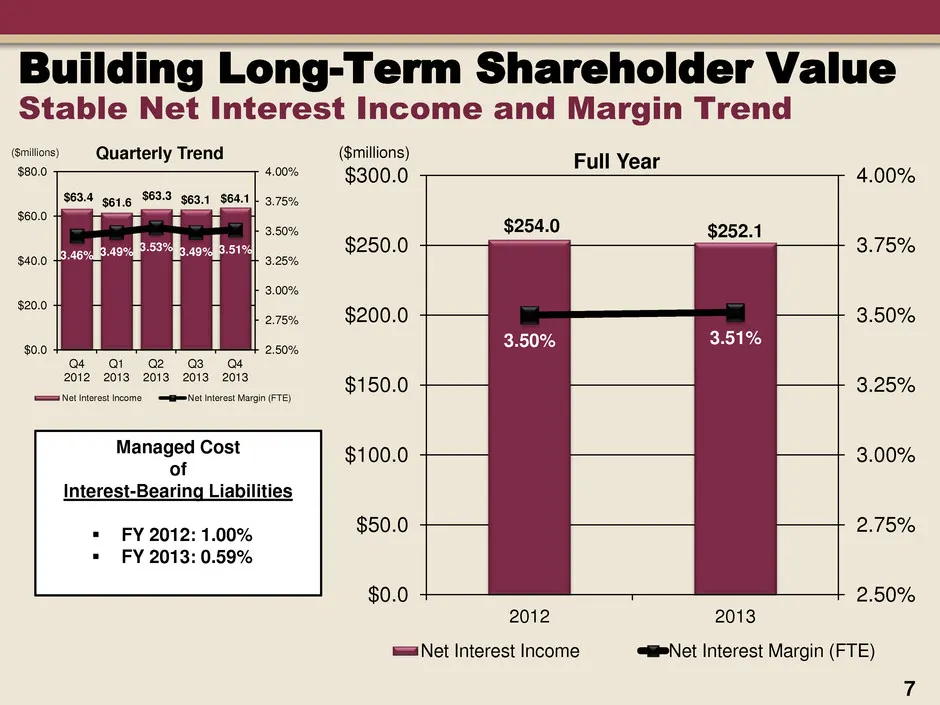
Slide 7: Stable Net Interest Income and Margin Trend
$254.0 $252.1 3.50% 3.51% 2.50% 2.75% 3.00% 3.25% 3.50% 3.75% 4.00% $0.0 $50.0 $100.0 $150.0 $200.0 $250.0 $300.0 2012 2013 Full Year Net Interest Income Net Interest Margin (FTE) Building Long-Term Shareholder Value Stable Net Interest Income and Margin Trend 7 $63.4 $61.6 $63.3 $63.1 $64.1 3.46% 3
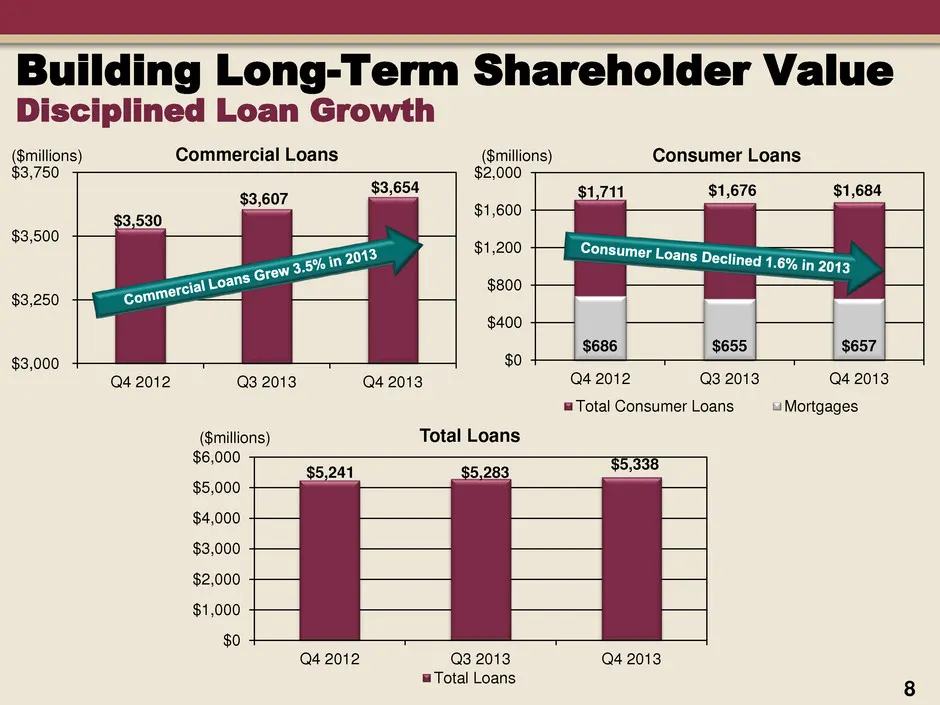
Slide 8: Disciplined Loan Growth
Building Long-Term Shareholder Value Disciplined Loan Growth 8 $3,530 $3,607 $3,654 $3,000 $3,250 $3,500 $3,750 Q4 2012 Q3 2013 Q4 2013 Commercial Loans $1,711 $1,676 $1,684 $686 $655 $657 $0 $400 $800 $1,200 $1,600 $2,000 Q4 2012 Q3 2013 Q4 2013 Consumer Loans Total Consumer Loans Mortgages ($milli
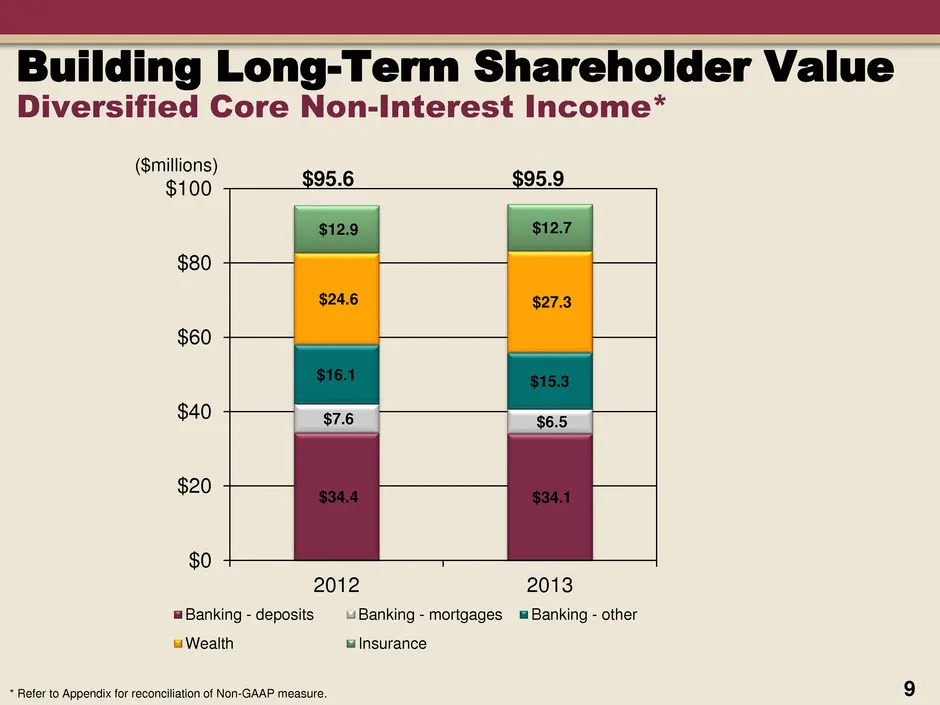
Slide 9: Diversified Core Non-Interest Income
9 * Refer to Appendix for reconciliation of Non-GAAP measure. $34.4 $34.1 $7.6 $6.5 $16.1 $15.3 $24.6 $27.3 $12.9 $12.7 $0 $20 $40 $60 $80 $100 2012 2013 Banking - deposits Banking - mortgages Banking - other Wealth Insurance $95.6 $95.9 ($millions) Building Long-Term Shareholder Value Diversified C
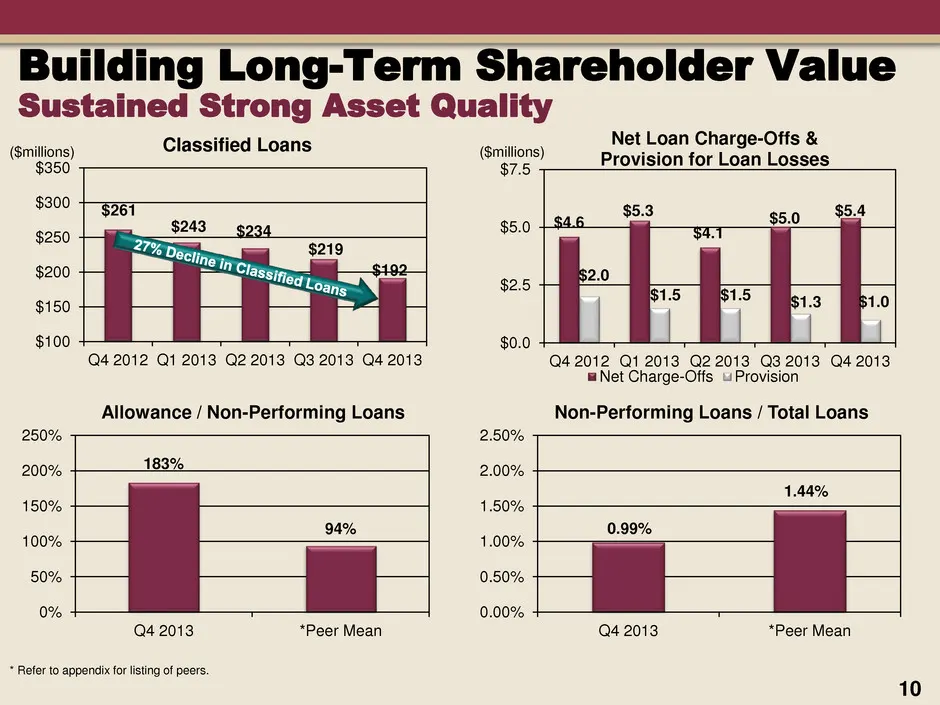
Slide 10: Sustained Strong Asset Quality
$261 $243 $234 $219 $192 $100 $150 $200 $250 $300 $350 Q4 2012 Q1 2013 Q2 2013 Q3 2013 Q4 2013 Classified Loans 10 ($millions) Building Long-Term Shareholder Value Sustained Strong Asset Quality $4.6 $5.3 $4.1 $5.0 $5.4 $2.0 $1.5 $1.5 $1.3 $1.0 $0.0 $2.5 $5.0 $7.5 Q4 2012 Q1 2013 Q2 2013 Q3 2013 Q4
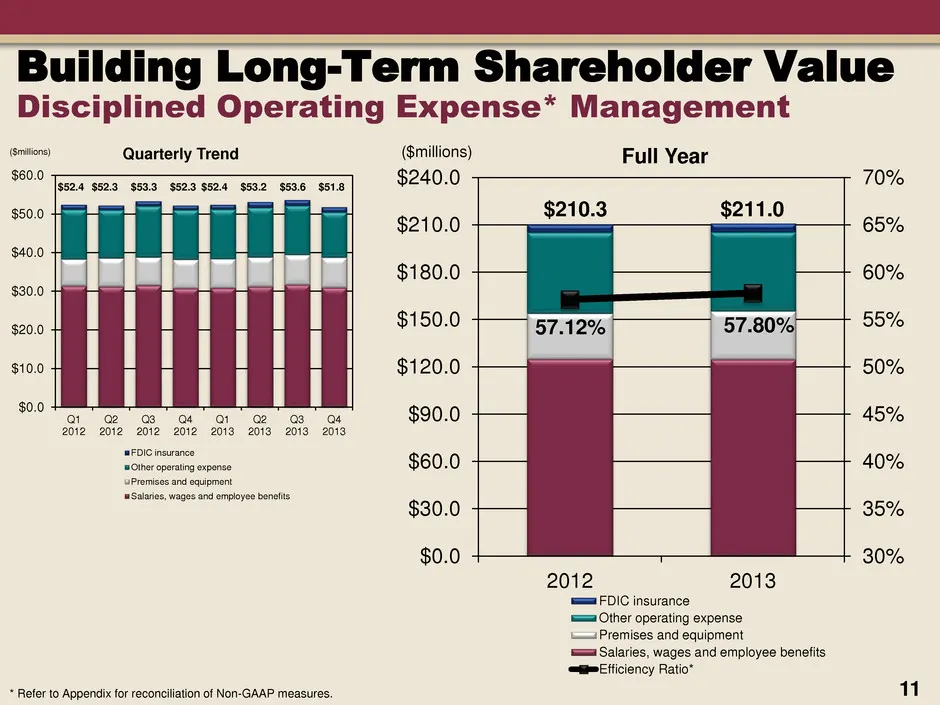
Slide 11: Disciplined Operating Expense Management
Building Long-Term Shareholder Value Disciplined Operating Expense* Management 11 $0.0 $10.0 $20.0 $30.0 $40.0 $50.0 $60.0 Q1 2012 Q2 2012 Q3 2012 Q4 2012 Q1 2013 Q2 2013 Q3 2013 Q4 2013 Quarterly Trend FDIC insurance Other operating expense Premises and equipment Salaries, wages and employee benefi
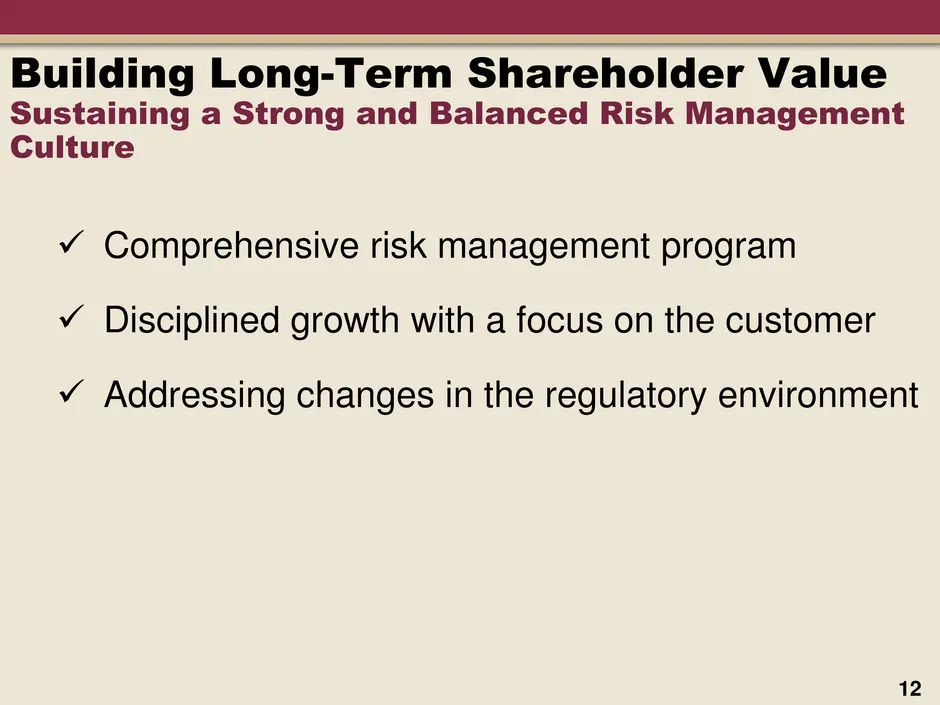
Slide 12: Sustaining a Strong and Balanced Risk Management Culture
Building Long-Term Shareholder Value Sustaining a Strong and Balanced Risk Management Culture Comprehensive risk management program Disciplined growth with a focus on the customer Addressing changes in the regulatory environment 12
Slide 13: Strategic M&A Considerations
Building Long-Term Shareholder Value Strategic M&A Considerations Relevant size Relative risk Operating leverage Franchise value 13
Slide 14: NPBC Corporate Headquarters - Allentown, PA
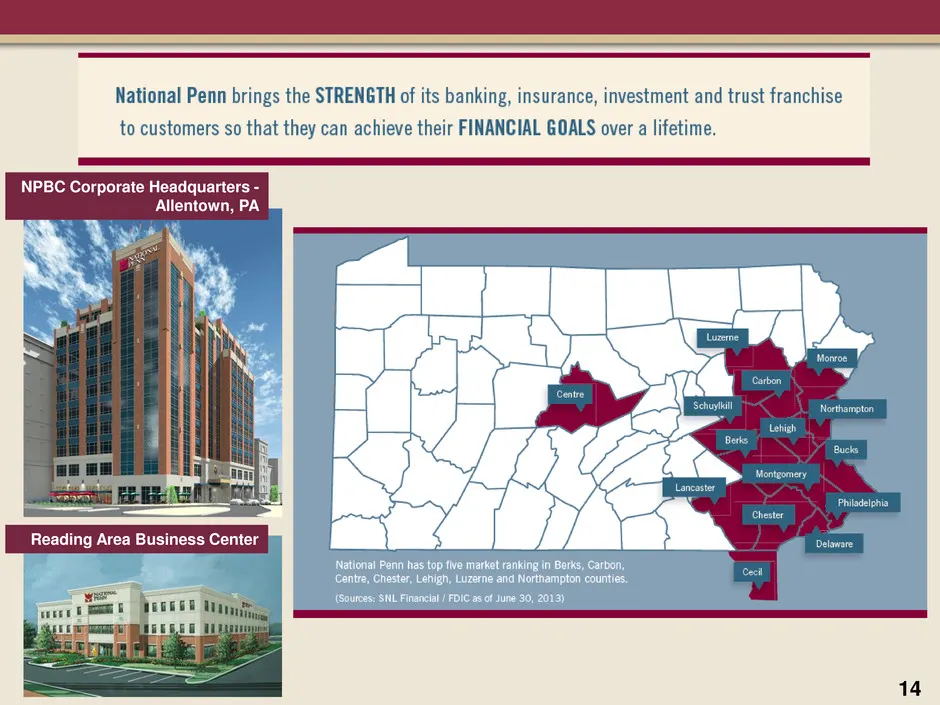
14 NPBC Corporate Headquarters - Allentown, PA Reading Area Business Center
Slide 15: Q1 2014 Highlights
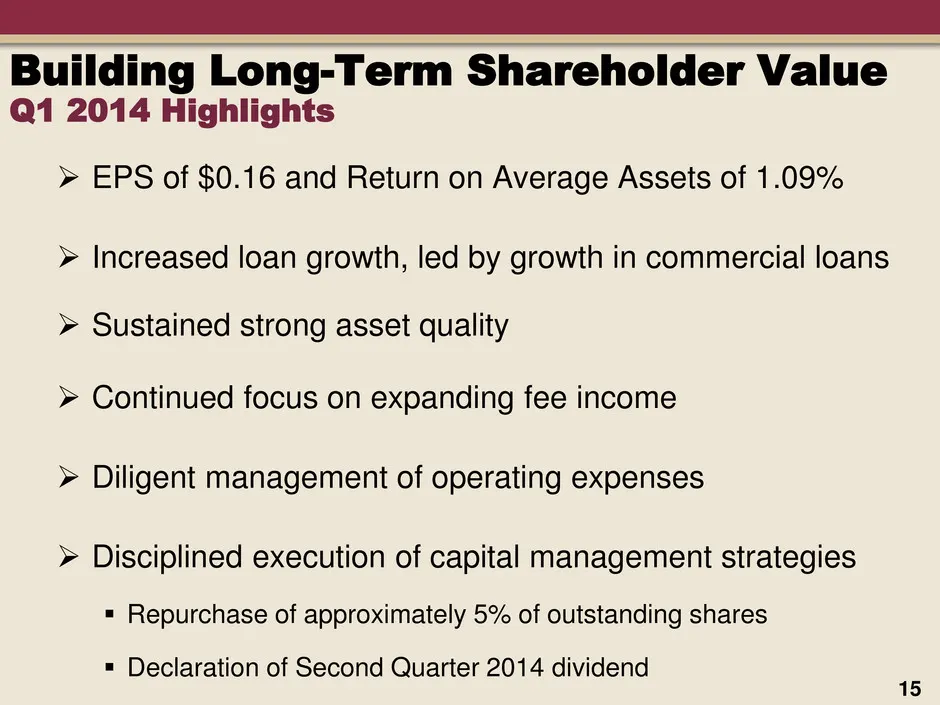
Building Long-Term Shareholder Value Q1 2014 Highlights EPS of $0.16 and Return on Average Assets of 1.09% Increased loan growth, led by growth in commercial loans Sustained strong asset quality Continued focus on expanding fee income Diligent management of operating expenses Disciplined
Slide 16: Strength of Capital Ratios
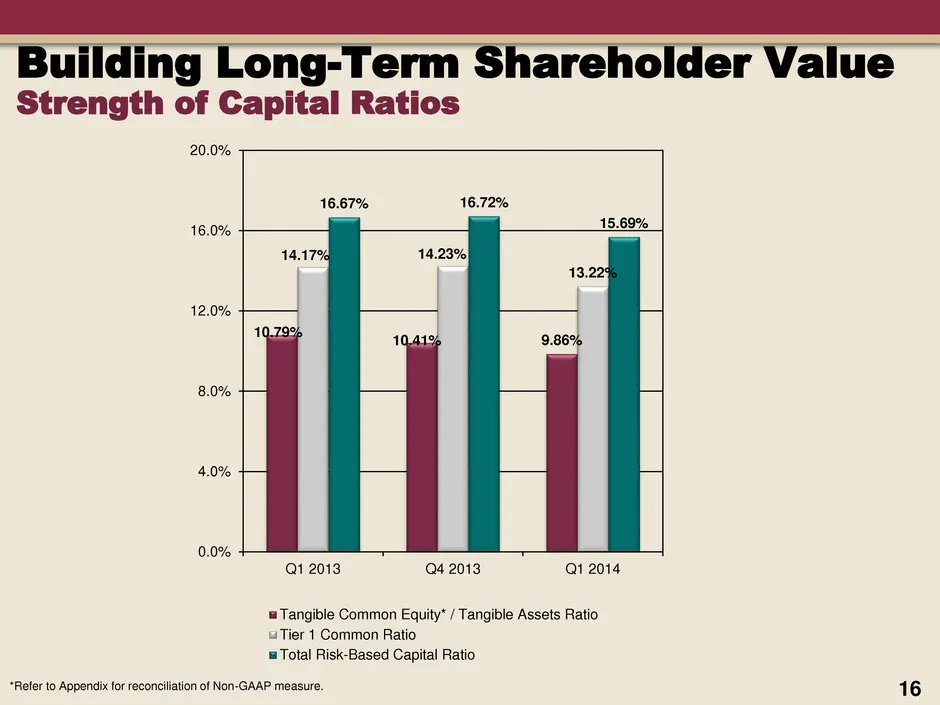
Building Long-Term Shareholder Value Strength of Capital Ratios 10.79% 10.41% 9.86% 14.17% 14.23% 13.22% 16.67% 16.72% 15.69% 0.0% 4.0% 8.0% 12.0% 16.0% 20.0% Q1 2013 Q4 2013 Q1 2014 Tangible Common Equity* / Tangible Assets Ratio Tier 1 Common Ratio Total Risk-Based Capital Ratio 16 *Refer to Appen
Slide 17: 2014 Strategic Objectives
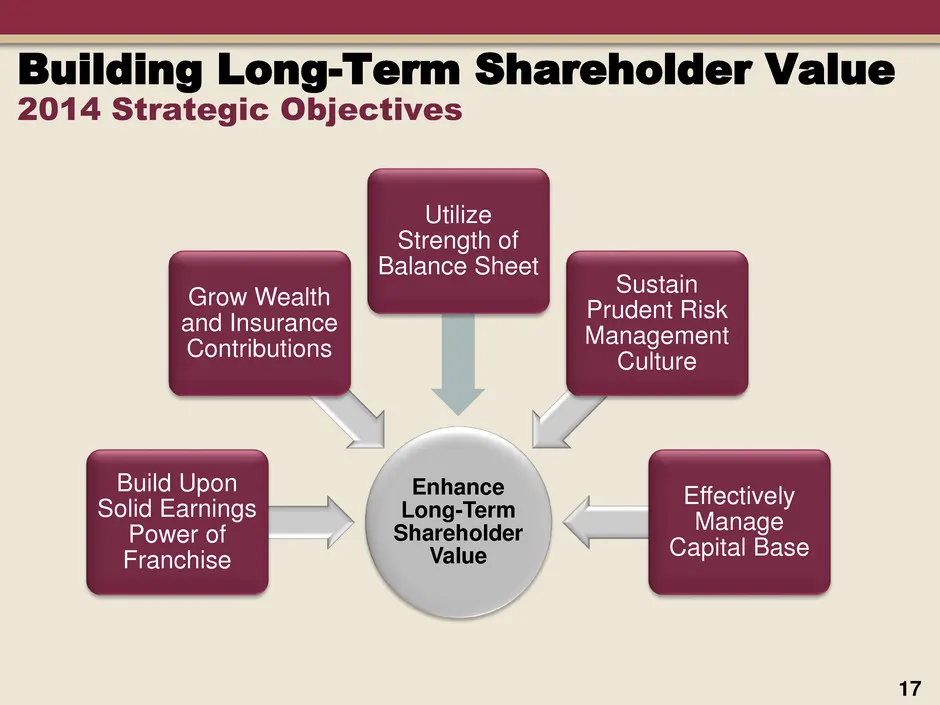
Building Long-Term Shareholder Value 2014 Strategic Objectives Enhance Long-Term Shareholder Value Build Upon Solid Earnings Power of Franchise Grow Wealth and Insurance Contributions Utilize Strength of Balance Sheet Sustain Prudent Risk Management Culture Effectively Manage Capital Base 17
Slide 18: NPBC Total Annual Return
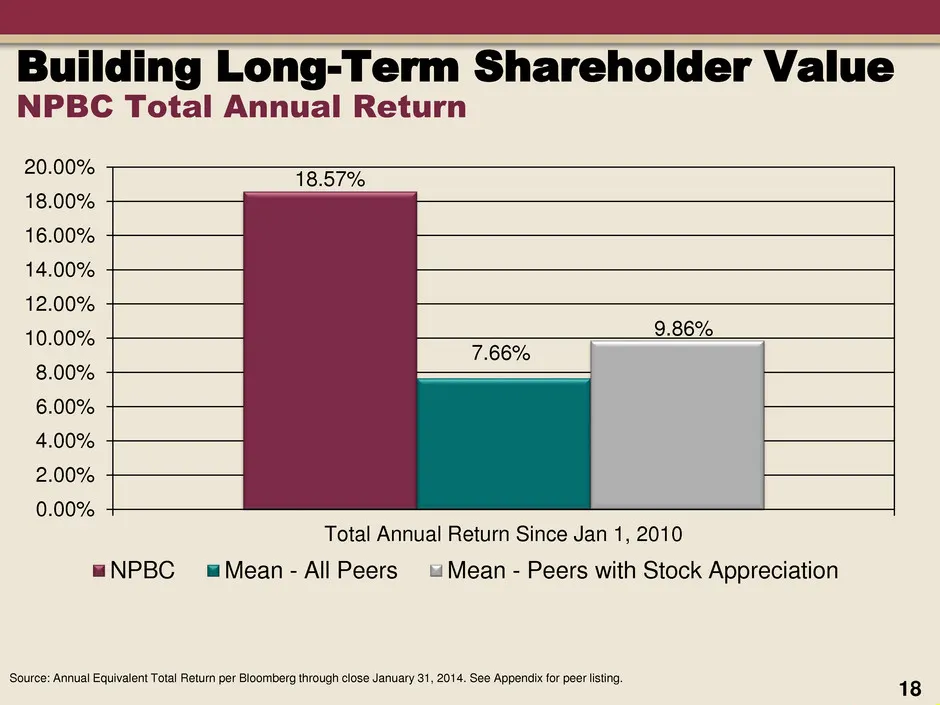
Building Long-Term Shareholder Value NPBC Total Annual Return 18 Source: Annual Equivalent Total Return per Bloomberg through close January 31, 2014. See Appendix for peer listing. 18.57% 7.66% 9.86% 0.00% 2.00% 4.00% 6.00% 8.00% 10.00% 12.00% 14.00% 16.00% 18.00% 20.00% Total Annual Return Since Ja
Slide 19: NPBC will be the most highly regarded financial institution
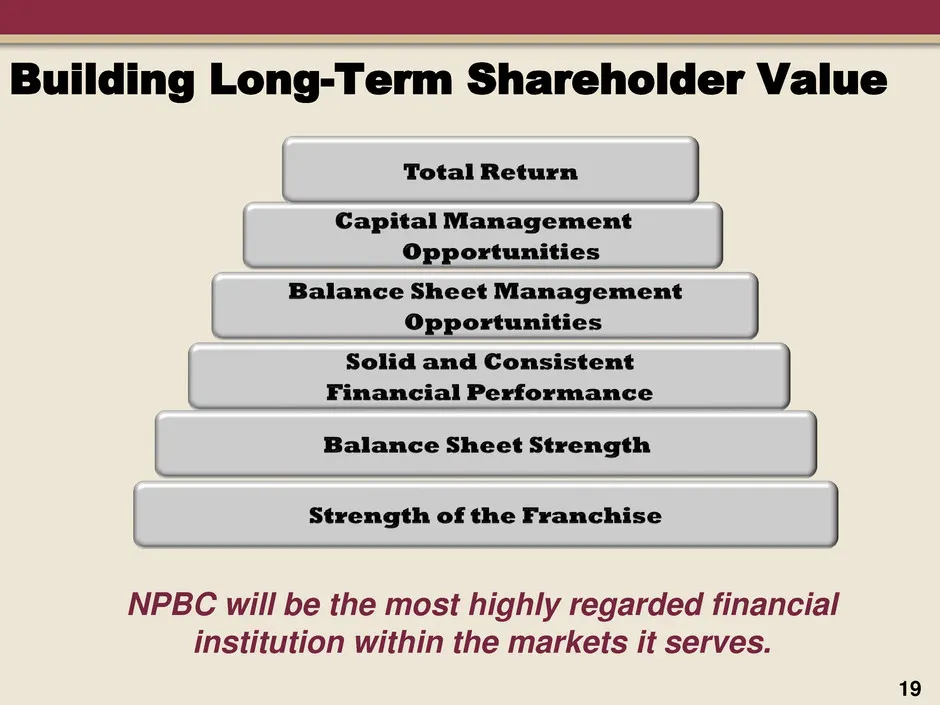
Building Long-Term Shareholder Value NPBC will be the most highly regarded financial institution within the markets it serves. 19
Slide 20: Appendix
APPENDIX 20
Slide 21: NPBC Peer Group
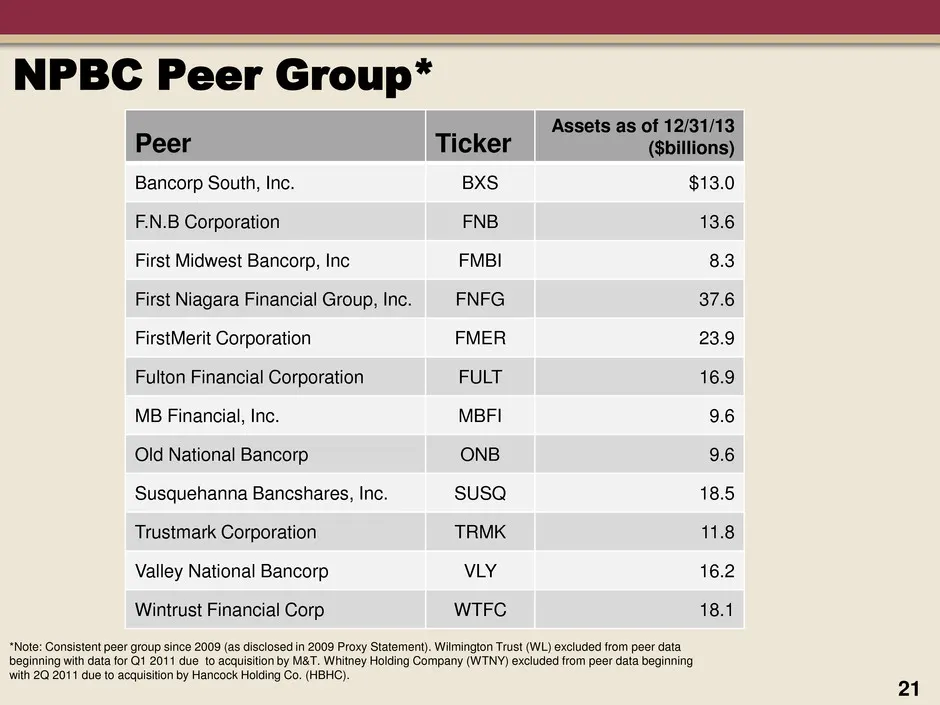
NPBC Peer Group* 21 *Note: Consistent peer group since 2009 (as disclosed in 2009 Proxy Statement). Wilmington Trust (WL) excluded from peer data beginning with data for Q1 2011 due to acquisition by M&T. Whitney Holding Company (WTNY) excluded from peer data beginning with 2Q 2011 due to acquisitio
Slide 22: Reconciliation of Non-GAAP Measures
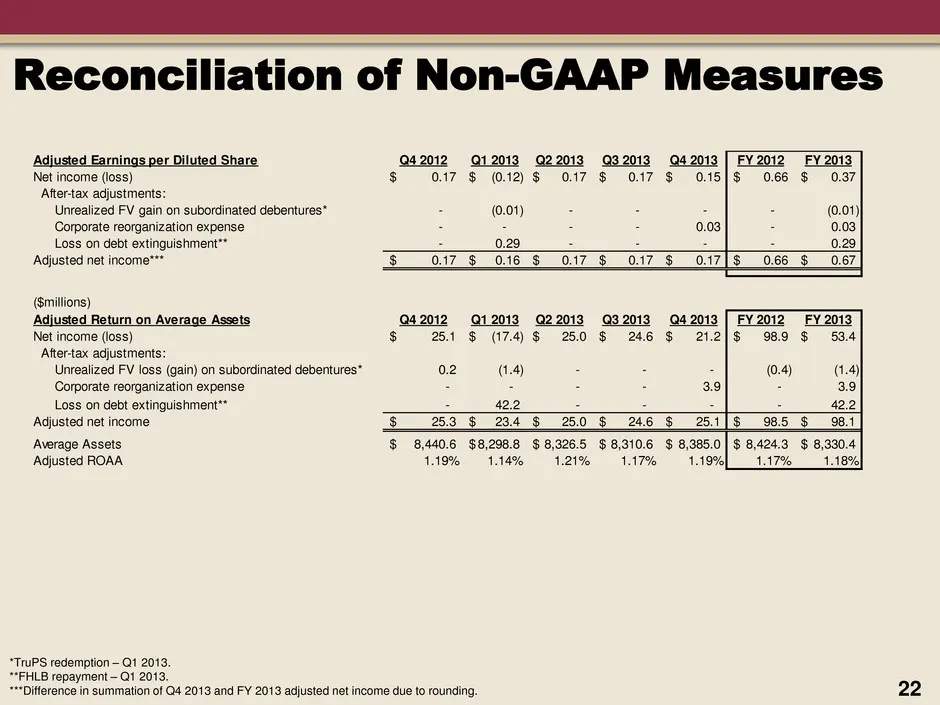
Reconciliation of Non-GAAP Measures 22 *TruPS redemption – Q1 2013. **FHLB repayment – Q1 2013. ***Difference in summation of Q4 2013 and FY 2013 adjusted net income due to rounding. Adjusted Earnings per Diluted Share Q4 2012 Q1 2013 Q2 2013 Q3 2013 Q4 2013 FY 2012 FY 2013 Net income (loss) 0.17$ (
Slide 23: Reconciliation of Non-GAAP Measures
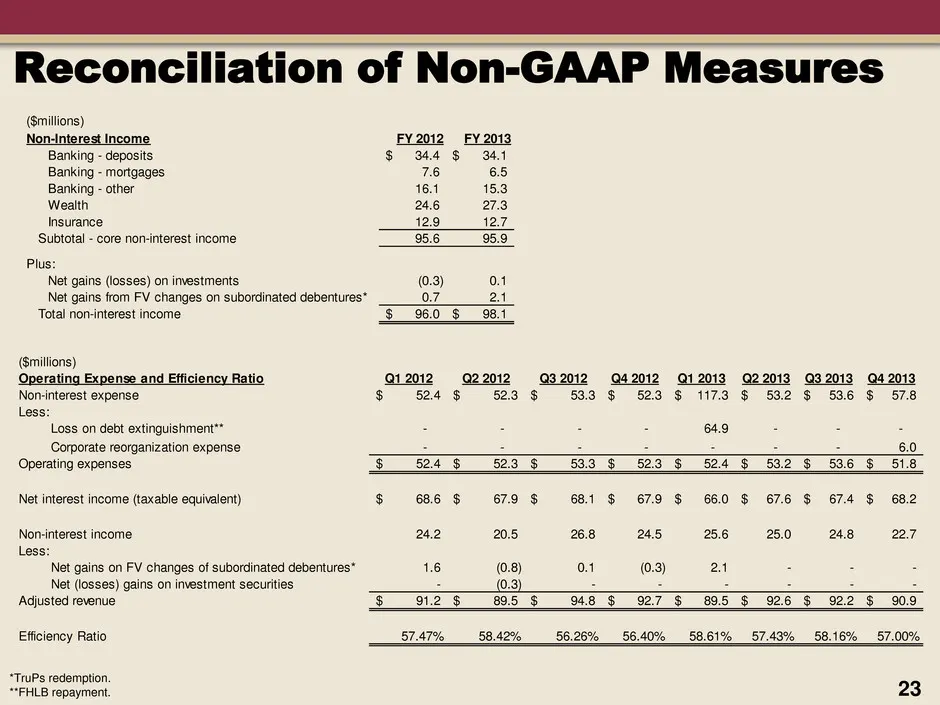
Reconciliation of Non-GAAP Measures 23 *TruPs redemption. **FHLB repayment. ($millions) Operating Expense and Efficiency Ratio Q1 2012 Q2 2012 Q3 2012 Q4 2012 Q1 2013 Q2 2013 Q3 2013 Q4 2013 Non-interest expen e 52.4$ 52.3$ 53.3$ 52.3$ 117.3$ 53.2$ 53.6$ 57.8$ Less: Loss on debt extinguishment** - -
Slide 24: Reconciliation of Non-GAAP Measures
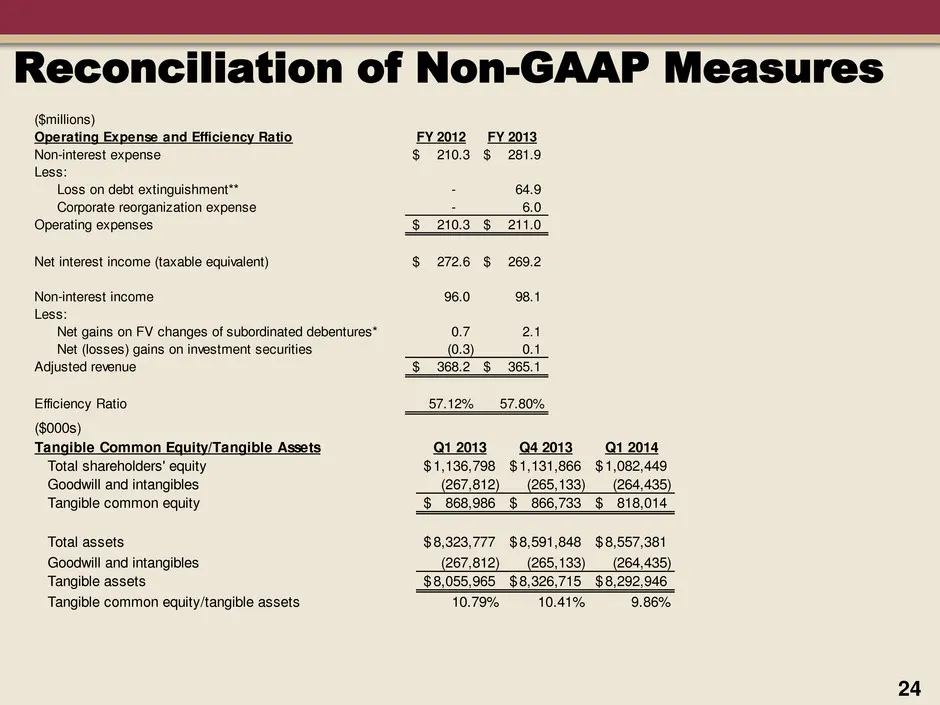
Reconciliation of Non-GAAP Measures 24 ($millions) Operating Expense and Efficiency Ratio FY 2012 FY 2013 Non-interest expense 210.3$ 281.9$ Less: Loss on debt extinguishment** - 64.9 Corporate reorganization expense - 6.0 Operating expenses 210.3$ 211.0$ Net interest income (taxable equivalent) 272

Slide 25: NATIONAL
<3 NATIONAL aN NCE | INVESTMENTS | TRUST 25
Source: SEC EDGAR · 8-K filed Apr 29, 2014
More decks from National Penn Bancshares
 BB&T Global Financial Services Conference (September 2015)33 slides · Sep 16, 2015
 Merger or Acquisition (August 2015)13 slides · Aug 18, 2015
 Q2 2015 Earnings Presentation17 slides · Jul 23, 2015
 Q1 2015 Earnings Presentation18 slides · Apr 24, 2015
 Investor Presentation (February 2015)36 slides · Feb 11, 2015
 Q4 2014 Earnings Presentation16 slides · Jan 22, 2015