IAC Inc. · NASDAQ:IAC
IAC — IAC/InterActiveCorp — Investor Day (November 2003)
100 slides from IAC's investor day presentation, Nov 11, 2003
Slide 1: Investor Day 2003
Investor Day 2003 November 11, 2003
Slide 2: Overview of the Day
Overview of the Day § Introduction § IAC Operating B’s § Financial Presentation § Strategy § Q&A
Slide 3: IAC's Mission and Strategy
IAC’s Mission and Strategy Mission: The largest, most profitable interactive commerce company in the world Strategy: By building a diversified portfolio of leading, specialized and global e-commerce brands
Slide 4: The Era of Ecommerce
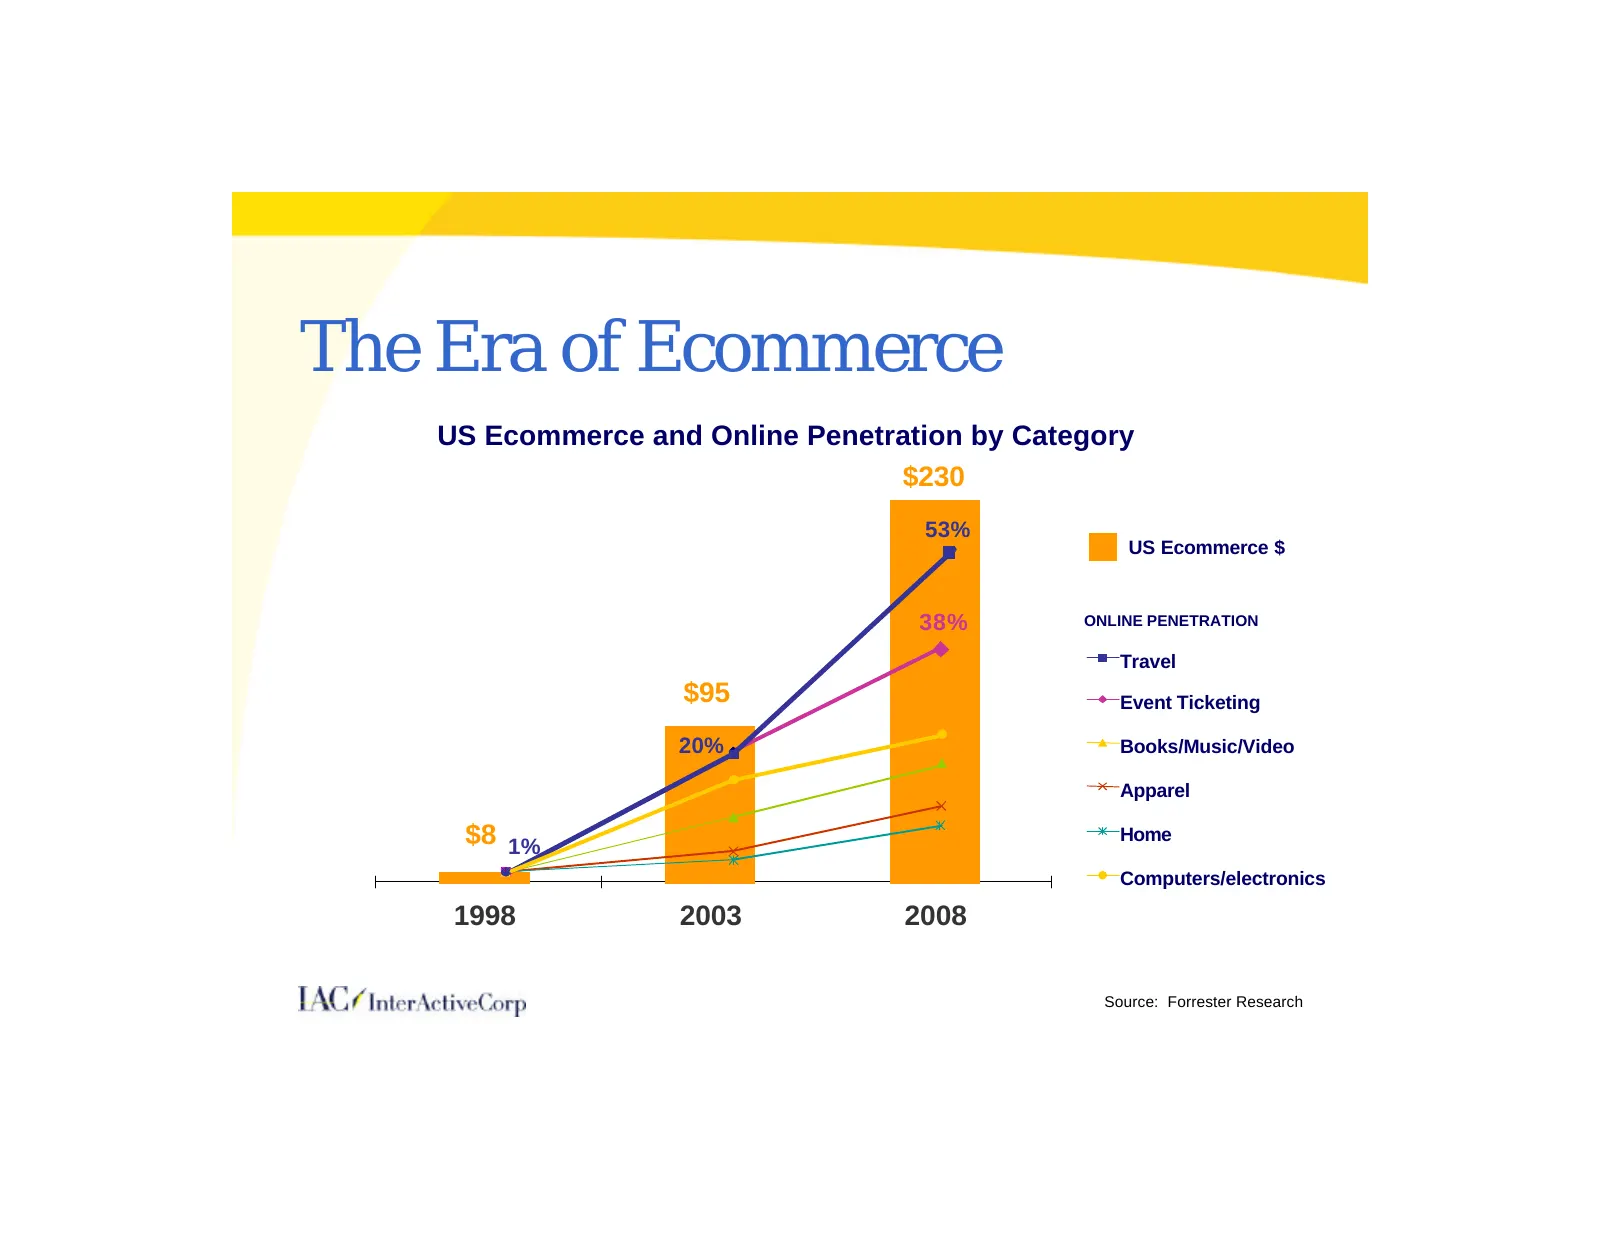
The Era of Ecommerce US Ecommerce and Online Penetration by Category $230 53% US Ecommerce $ 38% ONLINE PENETRATION Travel $95 Event Ticketing 20% Books/Music/Video Apparel $8 1% Home Computers/electronics 1998 2003 2008 Source: Forrester Research
Slide 5: Drivers of Economic Growth
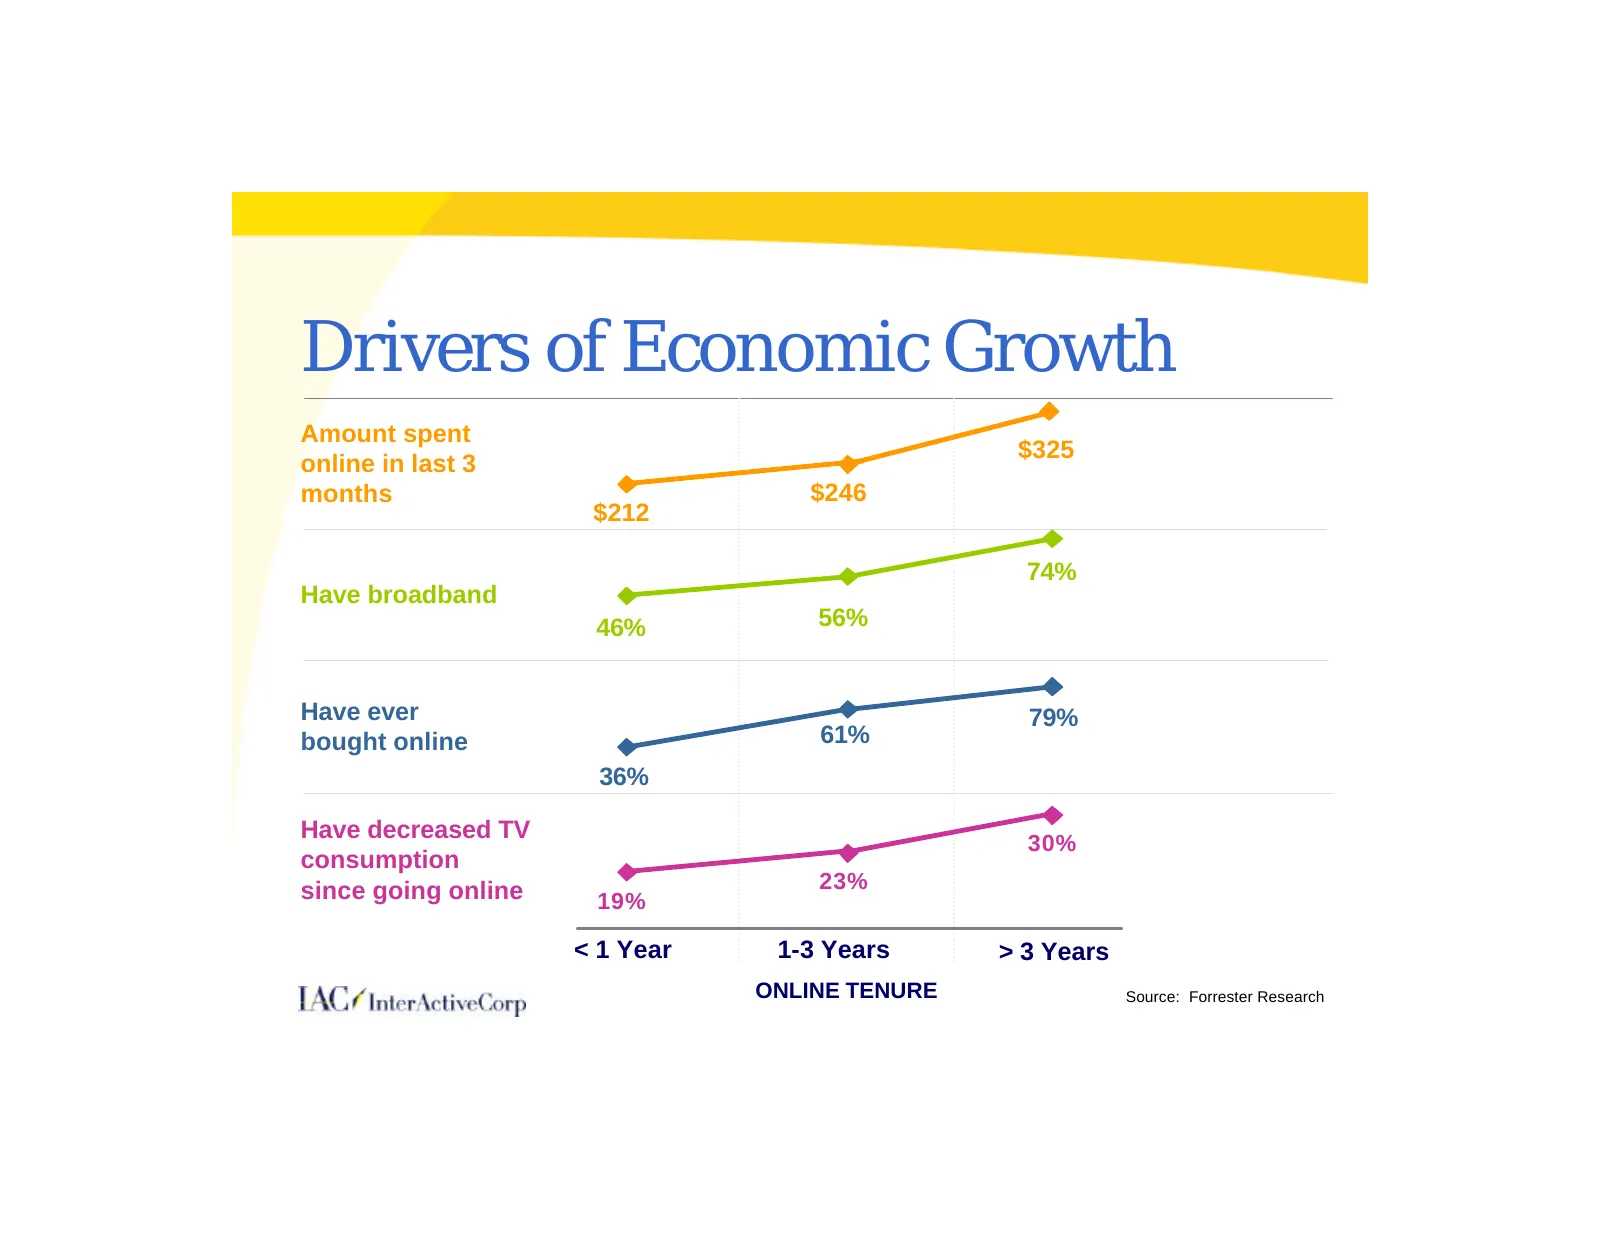
Drivers of Economic Growth Amount spent $325 online in last 3 months $246 $212 74% Have broadband 46% 56% Have ever 79% bought online 61% 36% Have decreased TV 30% consumption since going online 23% 19% < 1 Year 1-3 Years > 3 Years ONLINE TENURE Source: Forrester Research
Slide 6: The Power of Specialization
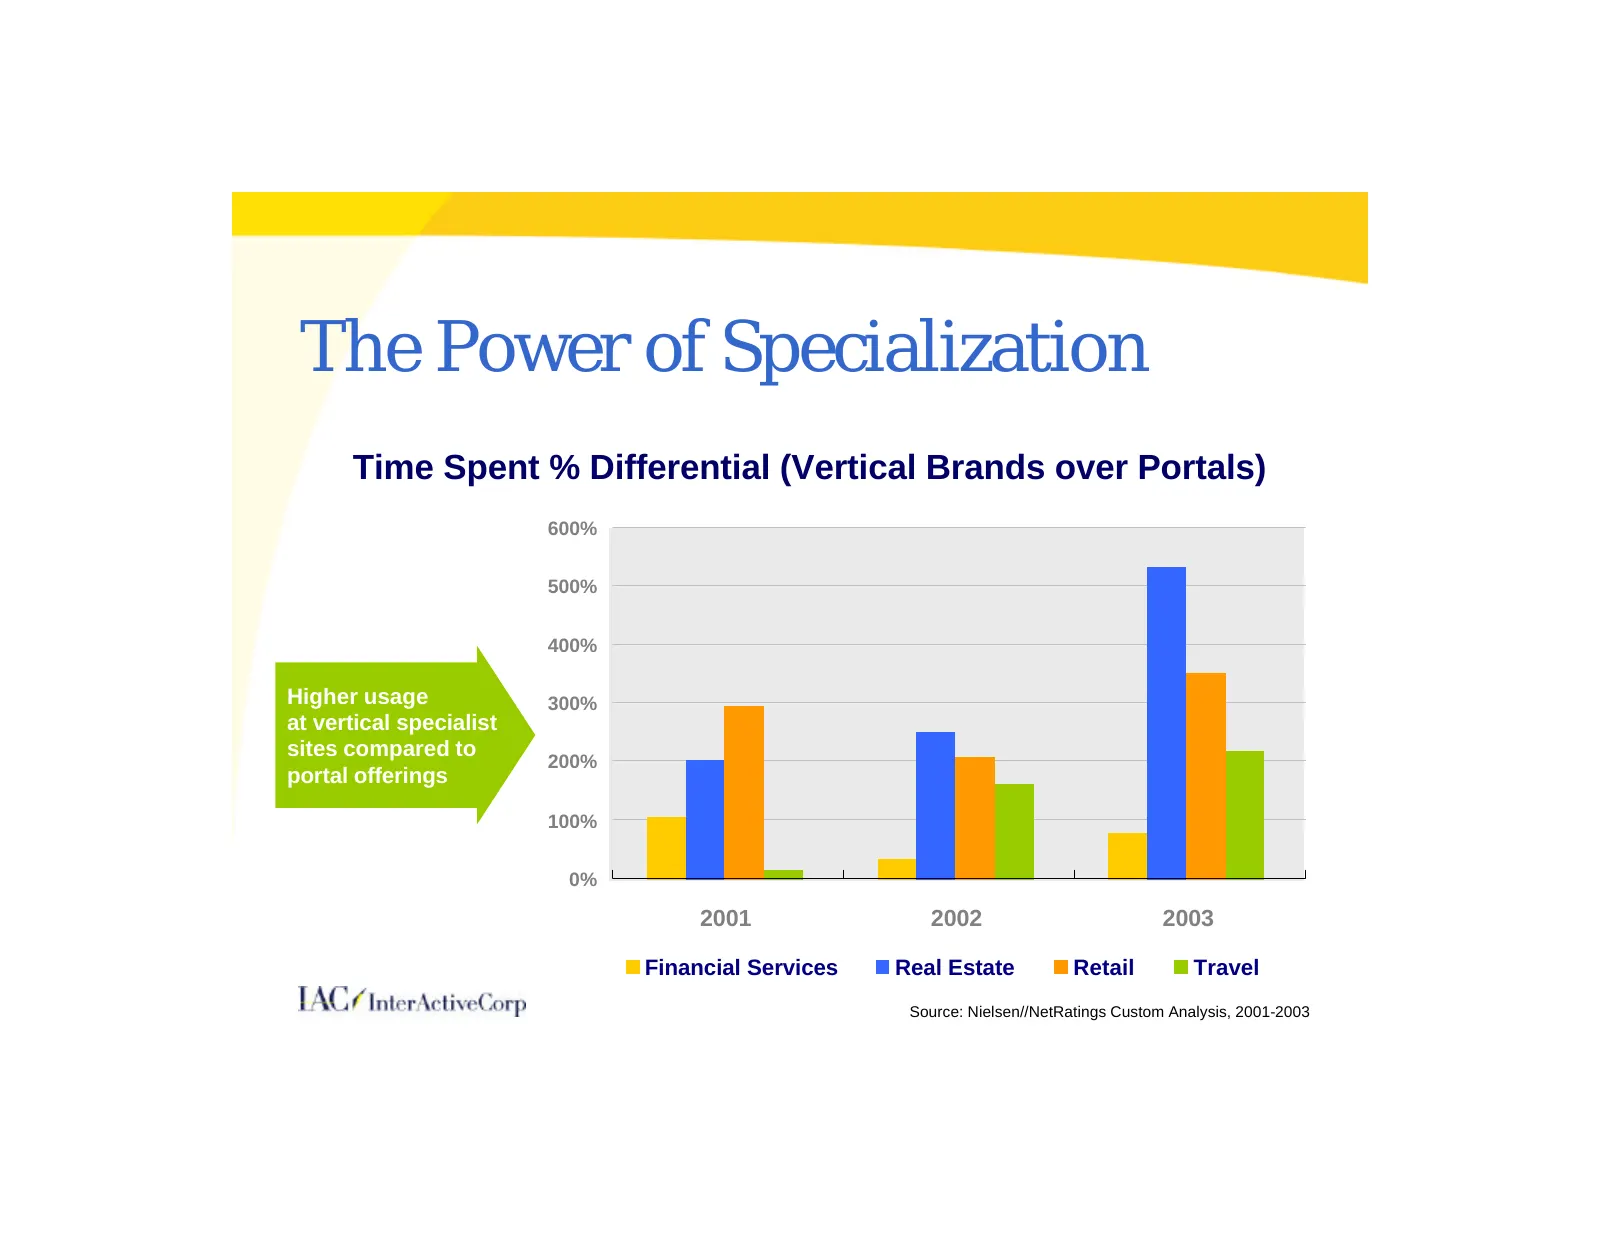
The Power of Specialization Time Spent % Differential (Vertical Brands over Portals) 600% 500% 400% Higher usage 300% at vertical specialist sites compared to 200% portal offerings 100% 0% 2001 2002 2003 Financial Services Real Estate Retail Travel Source: Nielsen//NetRatings Custom Analysis, 2001-2
Slide 7: The Importance of Category Leaders
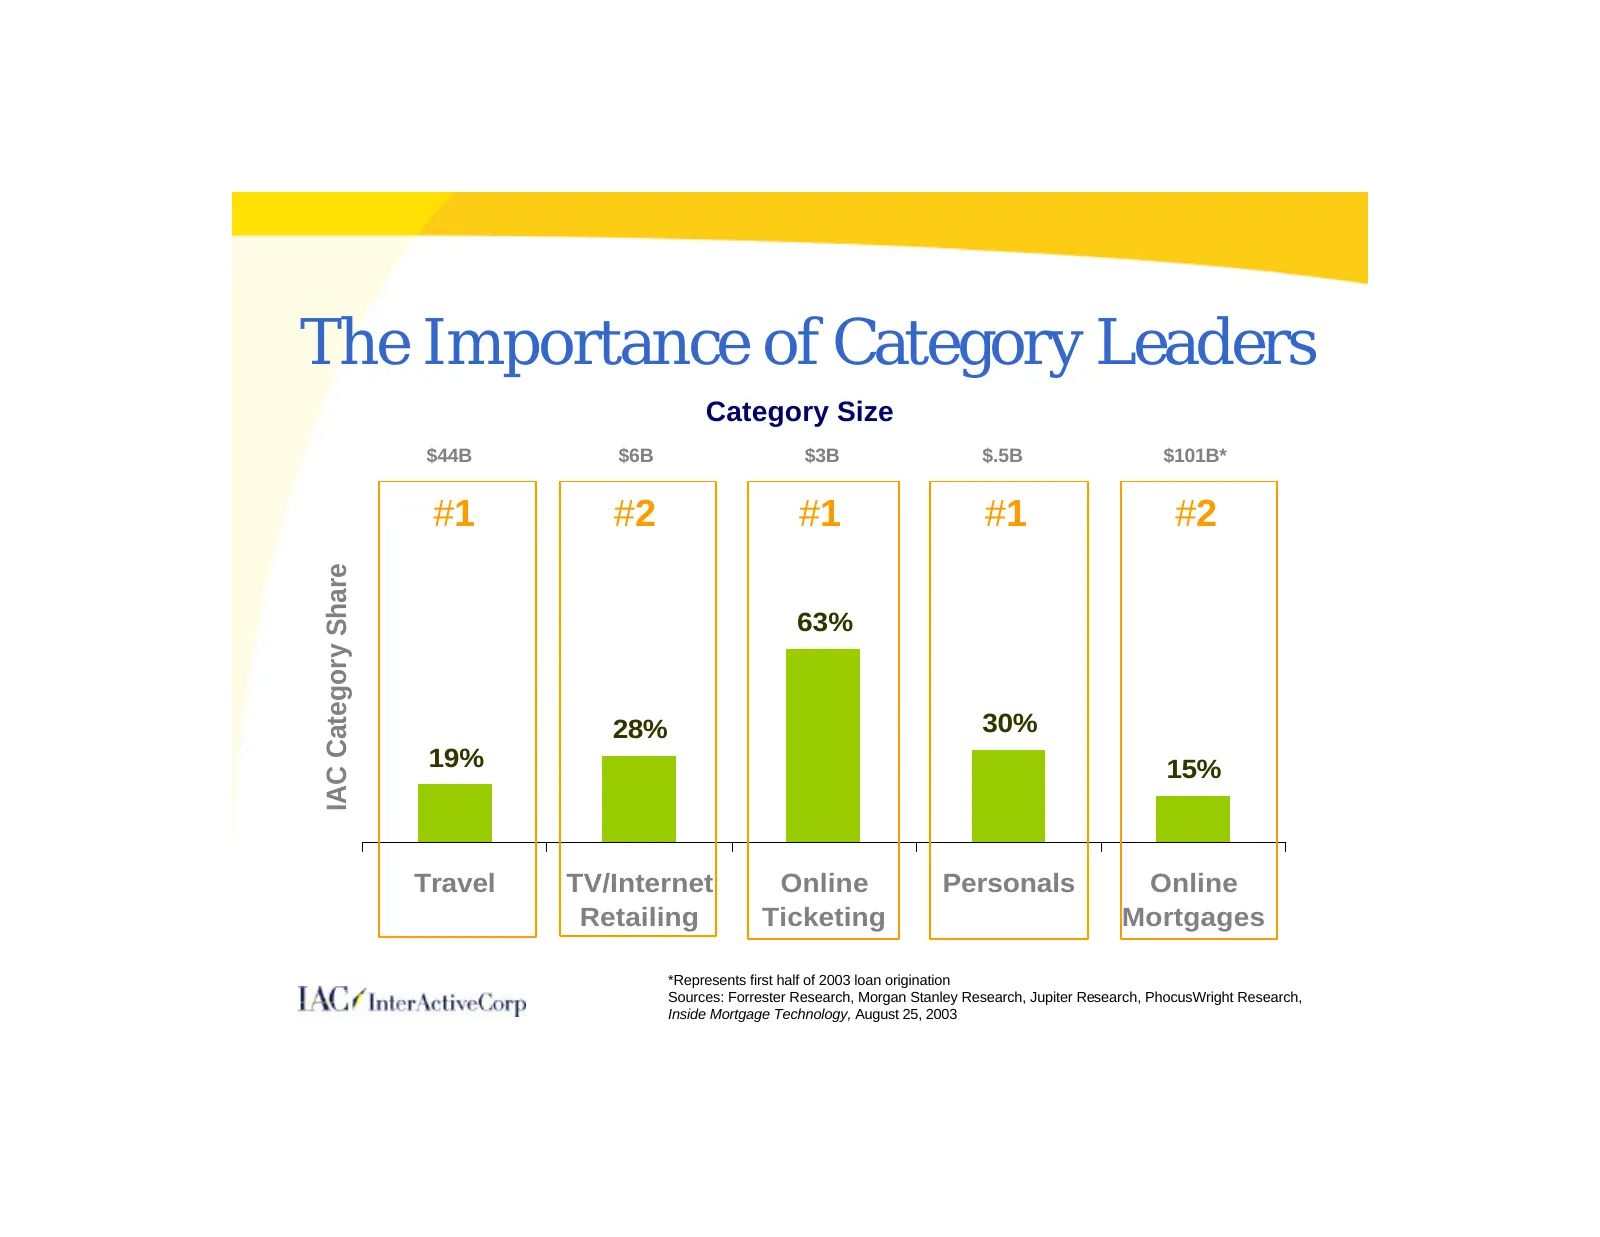
The Importance of Category Leaders Category Size $44B $6B $3B $.5B $101B* #1 #2 #1 #1 #2 IAC Category Share 63% 28% 30% 19% 15% Travel TV/Internet Online Personals Online Retailing Ticketing Mortgages *Represents first half of 2003 loan origination Sources: Forrester Research, Morgan Stanley Researc
Slide 8: The Benefits of Diversification
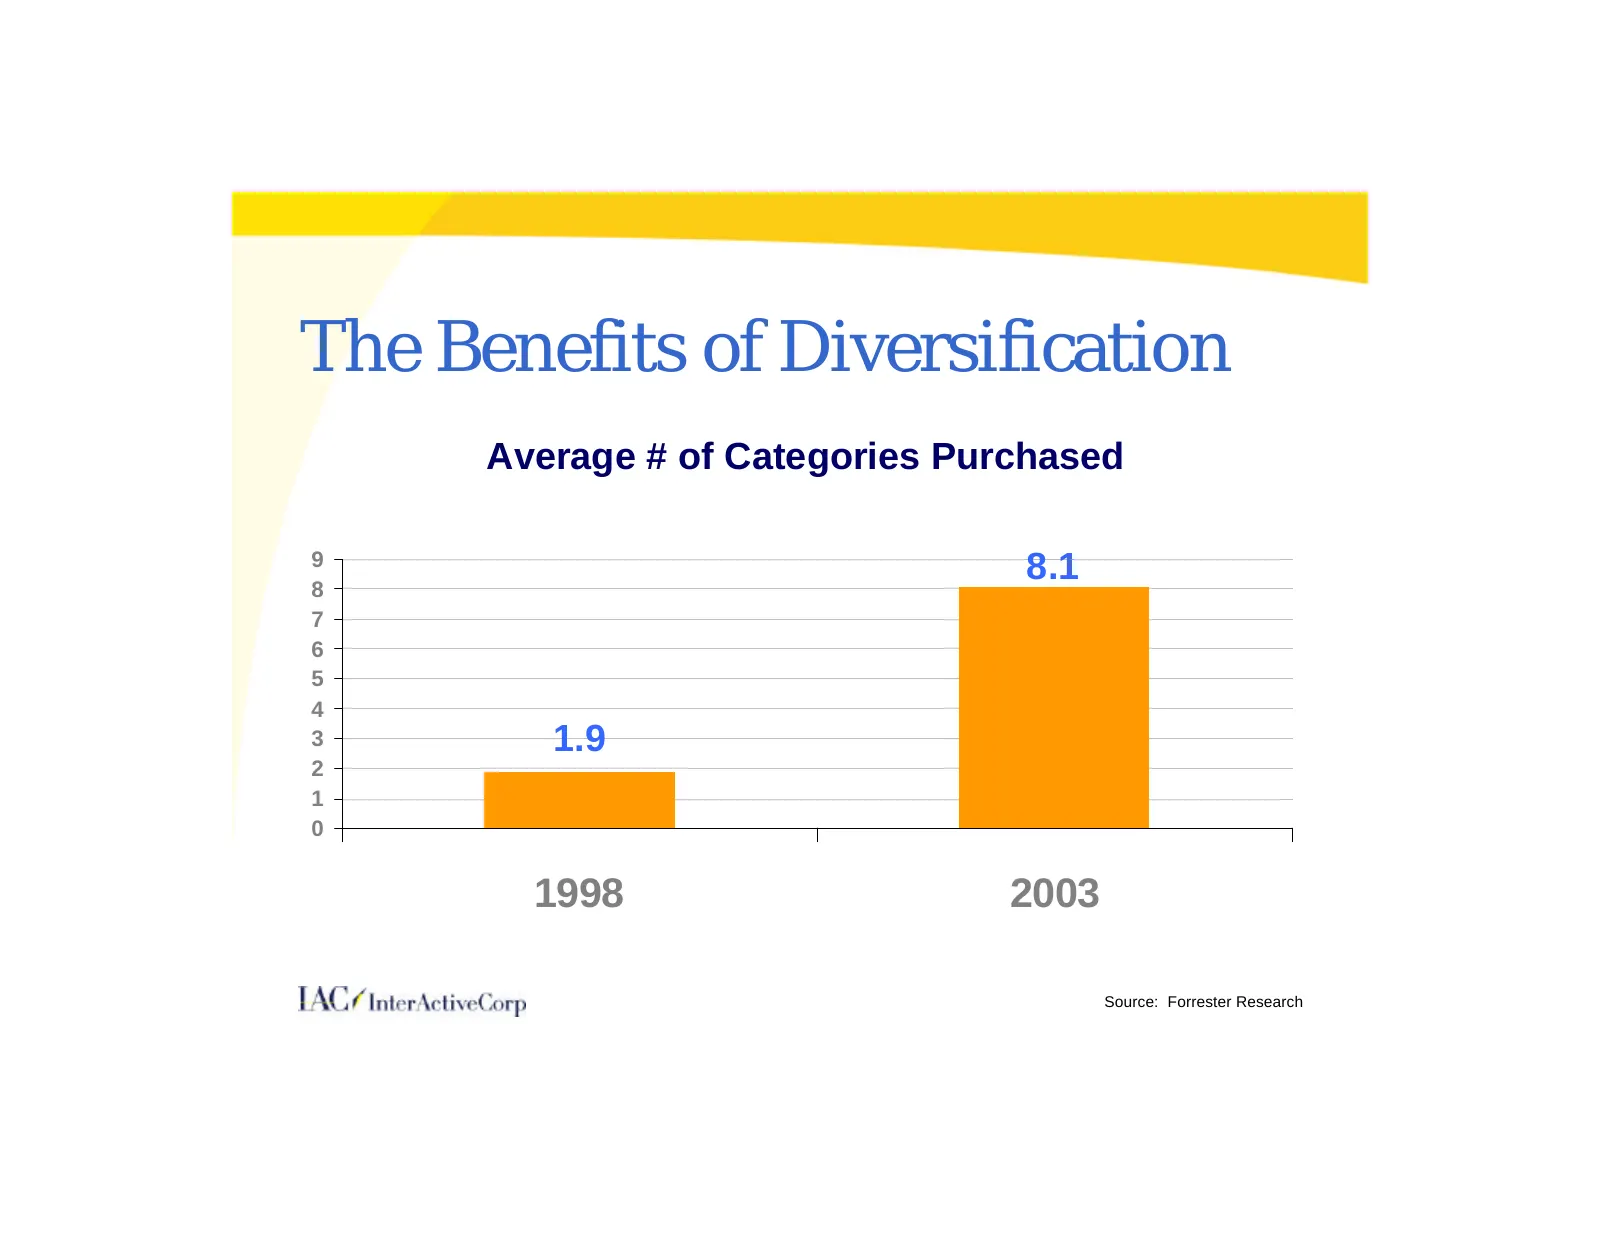
The Benefits of Diversification Average # of Categories Purchased 9 8 8.1 7 6 5 4 3 1.9 2 1 0 1998 2003 Source: Forrester Research
Slide 9: The Global Opportunity
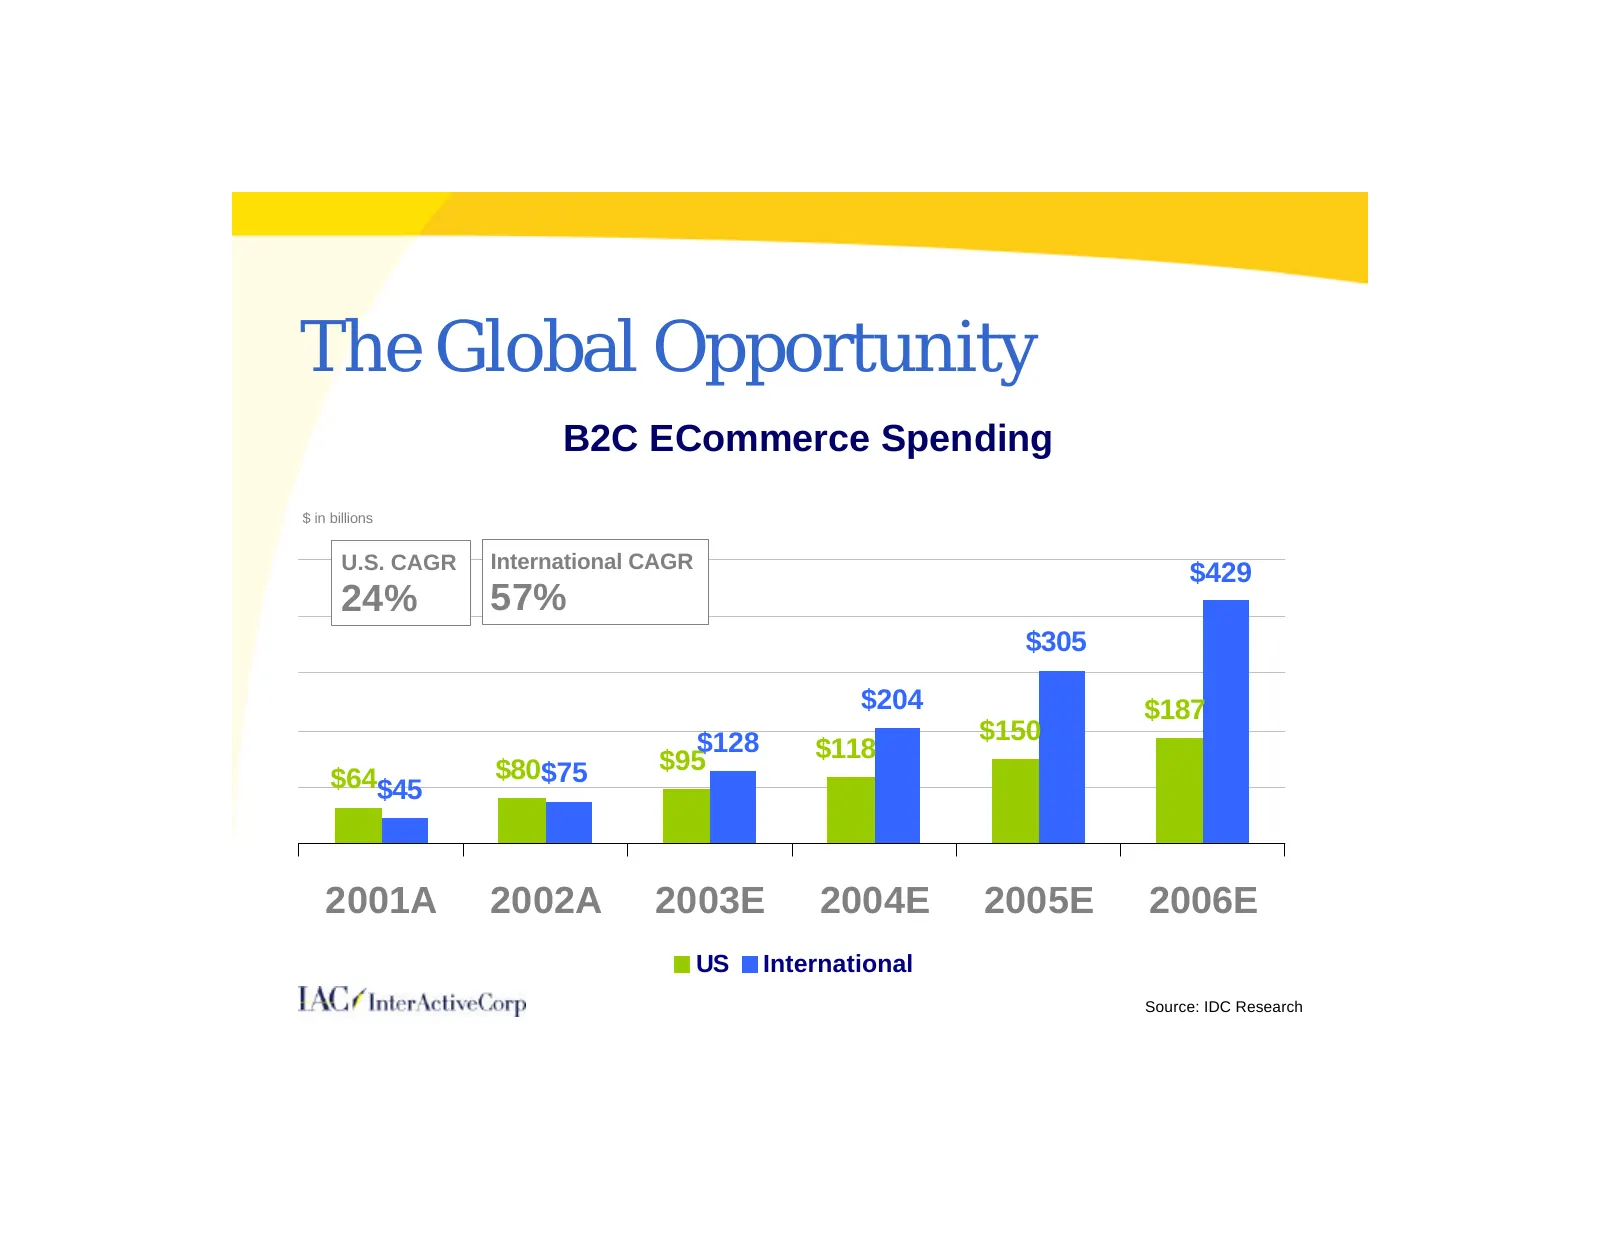
The Global Opportunity B2C ECommerce Spending $ in billions U.S. CAGR International CAGR $429 24% 57% $305 $204 $187 $128 $150 $95 $118 $64$45 $80$75 2001A 2002A 2003E 2004E 2005E 2006E US International Source: IDC Research
Slide 10: IAC's Brands
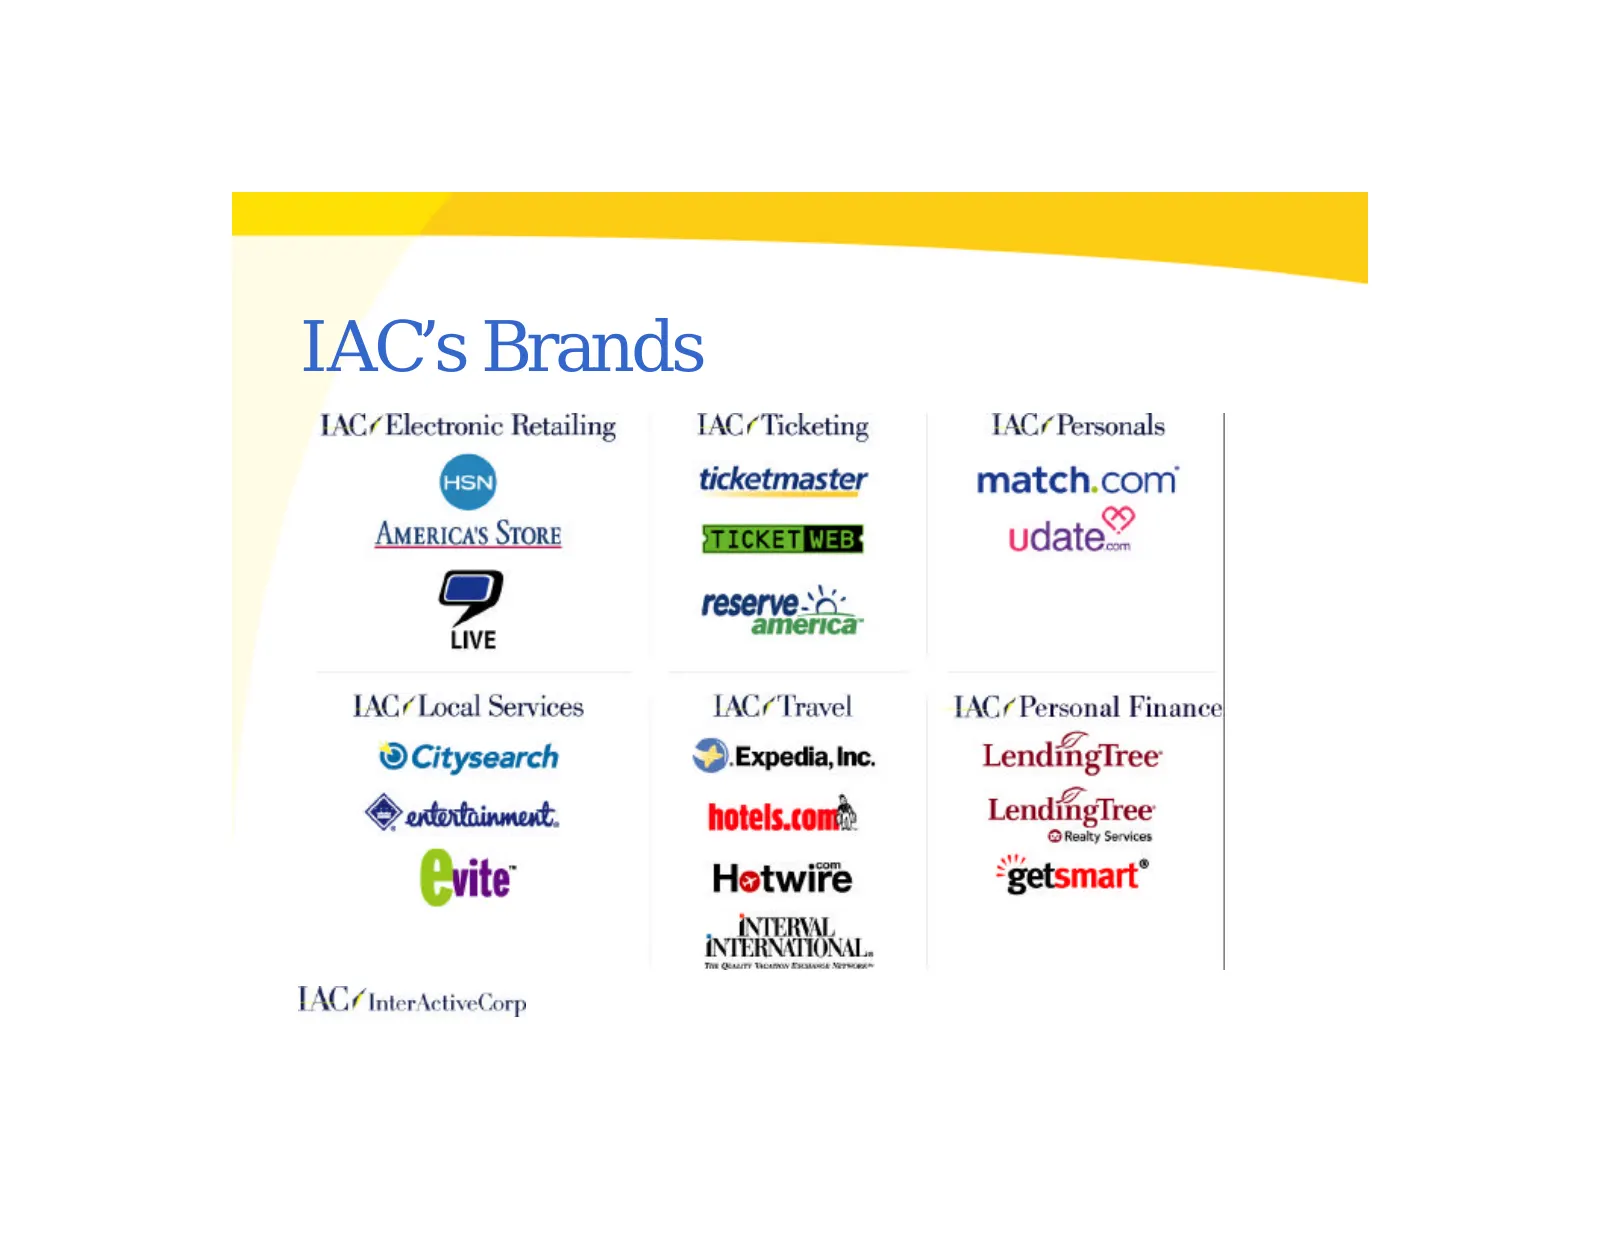
Lee IAC’s Brands TAC/ Electronic Retailing TACs Ticketing TAC/ Personals © ticketmaster match.com AMERICAS STORE TICKET udate? ive america LAC/ Local Services IACF Travel TAC¢ Personal Finance} ® Citysearch D.Expedia, Inc. LendingTree © extoxtrinment. hotels.com LendifigTree fe Realty Services Cvite
Slide 11: Organization: Before
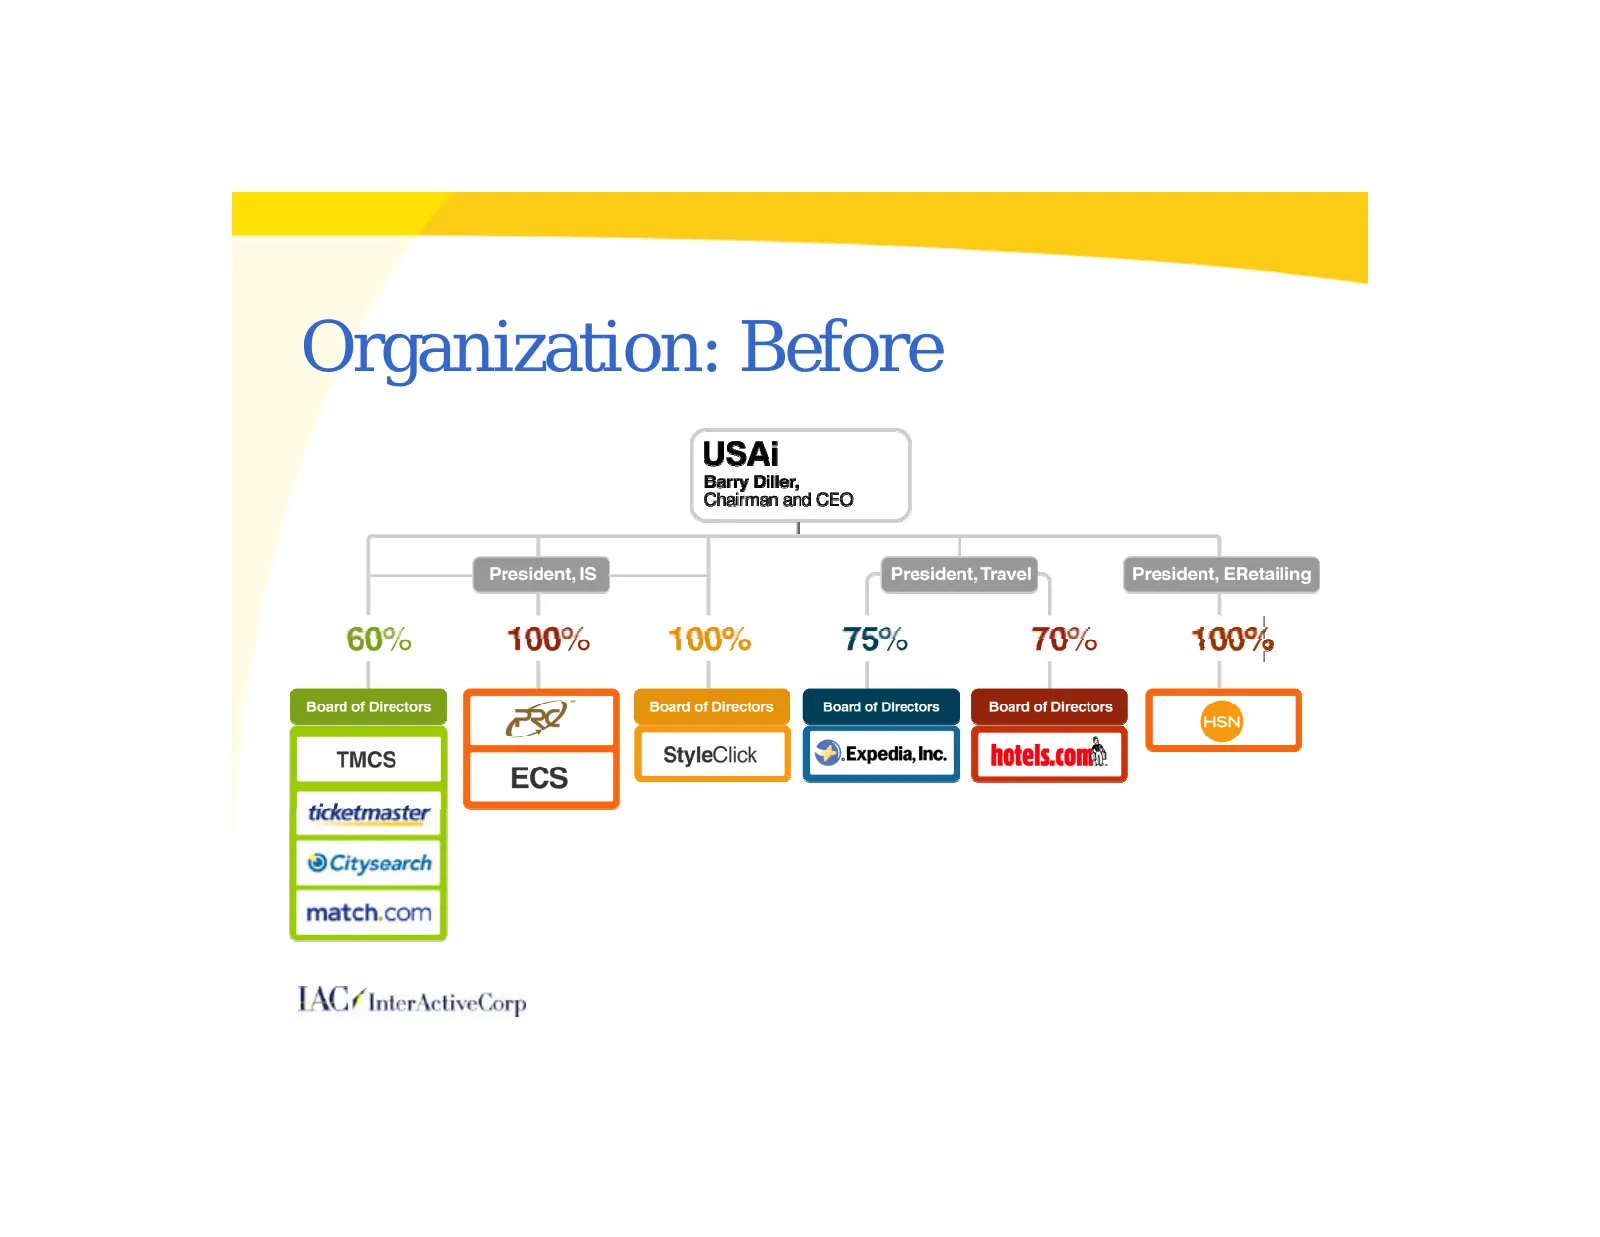
Lee Organization: Before USAi I 60% 100% 100% 75% 70% 100% ee Ue StyleClick | | .expedia,ine. | | hotels.cont TACS InterActive lorp
Slide 12: Organization: After
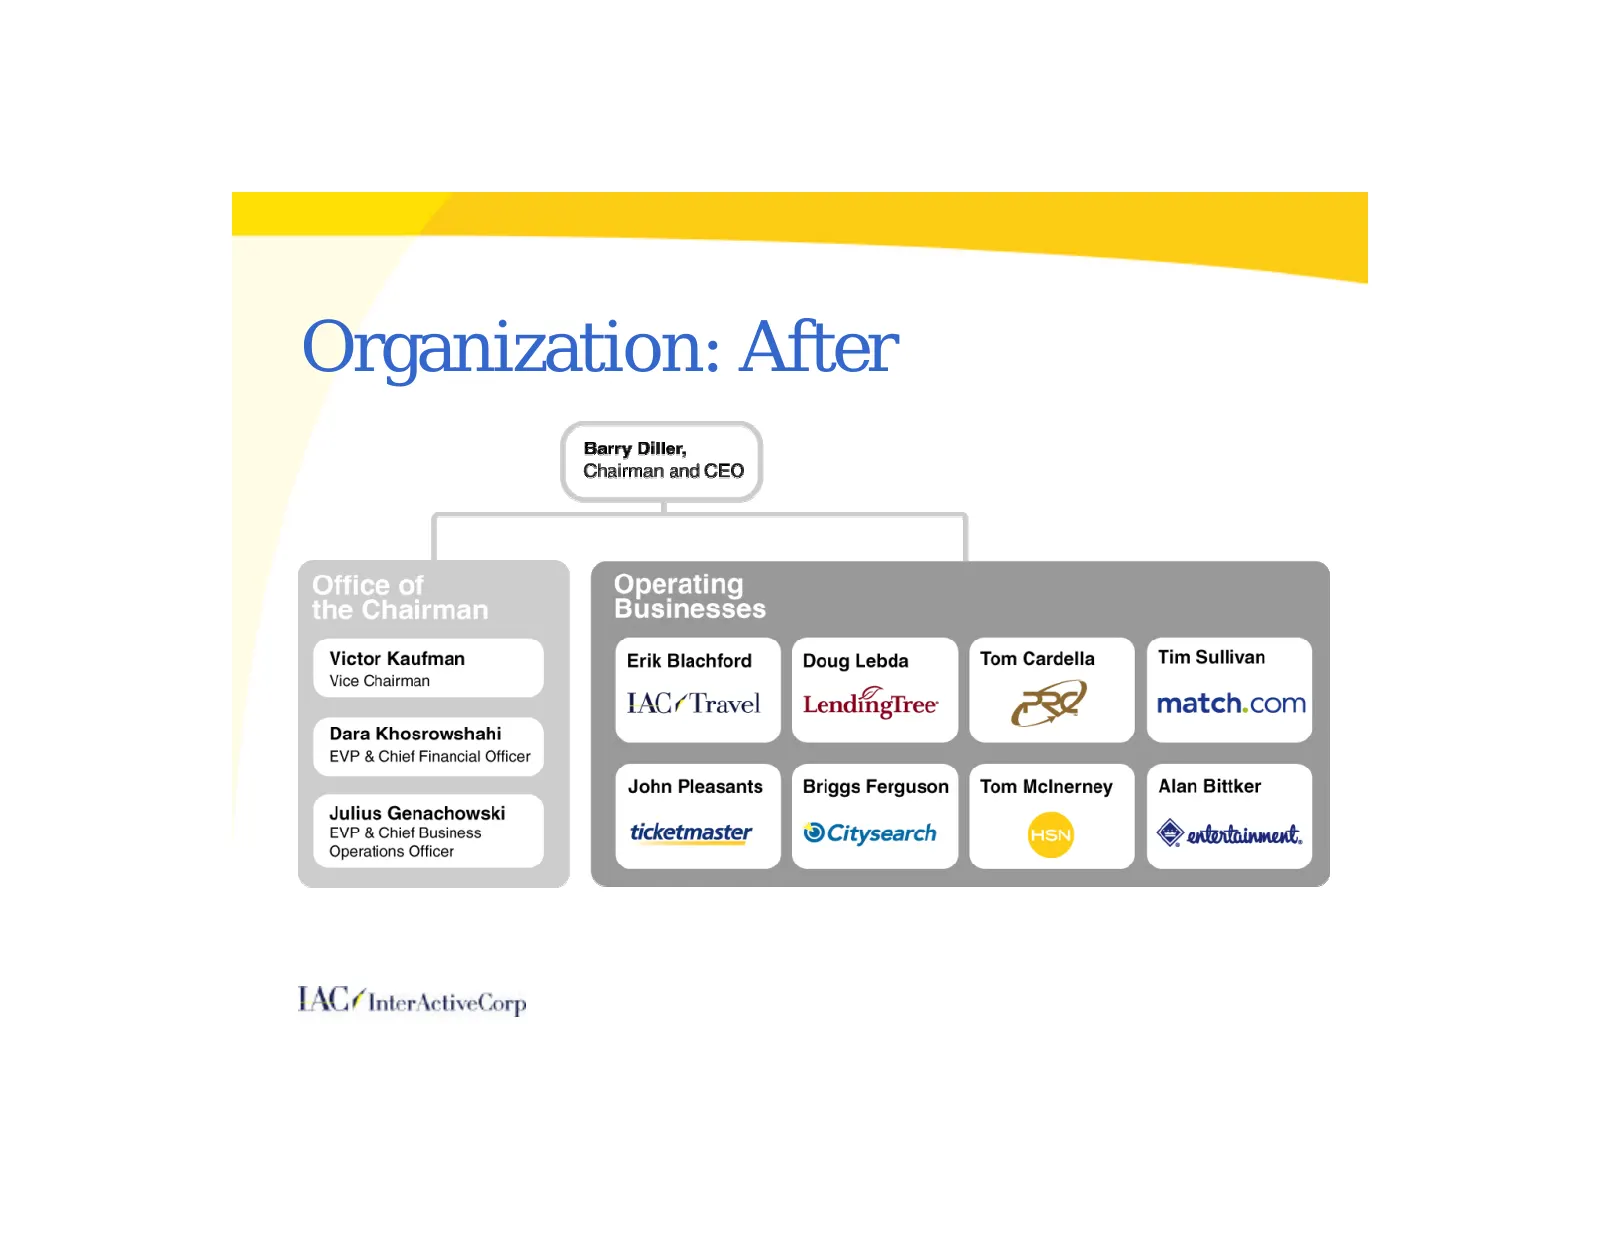
Organization: After Victor Kaufman Vice Chairman Dara Khosrowshahi EVP & Chief Financial Officer Julius Genachowski EVP & Chief Business Operations Officer TACS InterActive lorp Barry Diller, Chairman and CEO Operating Businesses Erik Blachford TAC/ Travel John Pleasants ticketmaster Doug Lebda Lend
Slide 13: Operating Principles
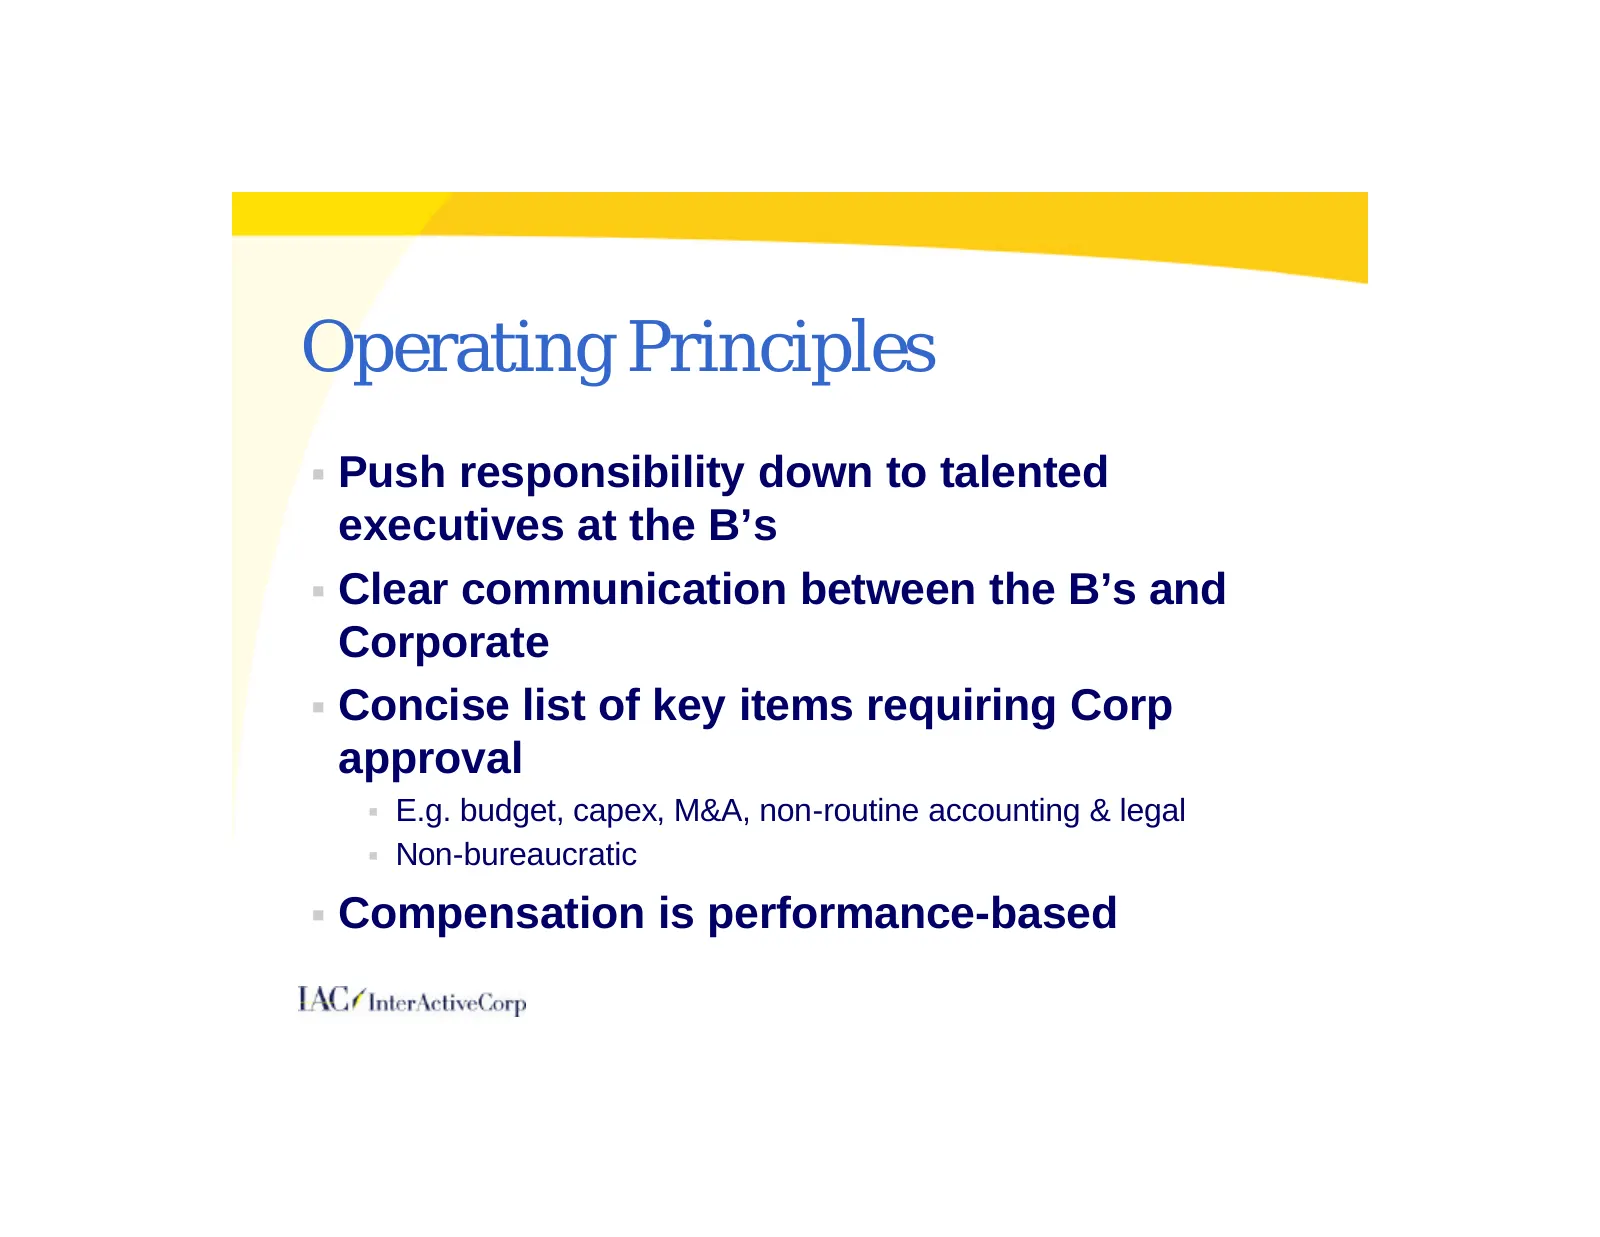
Operating Principles § Push responsibility down to talented executives at the B’s § Clear communication between the B’s and Corporate § Concise list of key items requiring Corp approval § E.g. budget, capex, M&A, non-routine accounting & legal § Non-bureaucratic § Compensation is performance-based
Slide 14: Business Intelligence
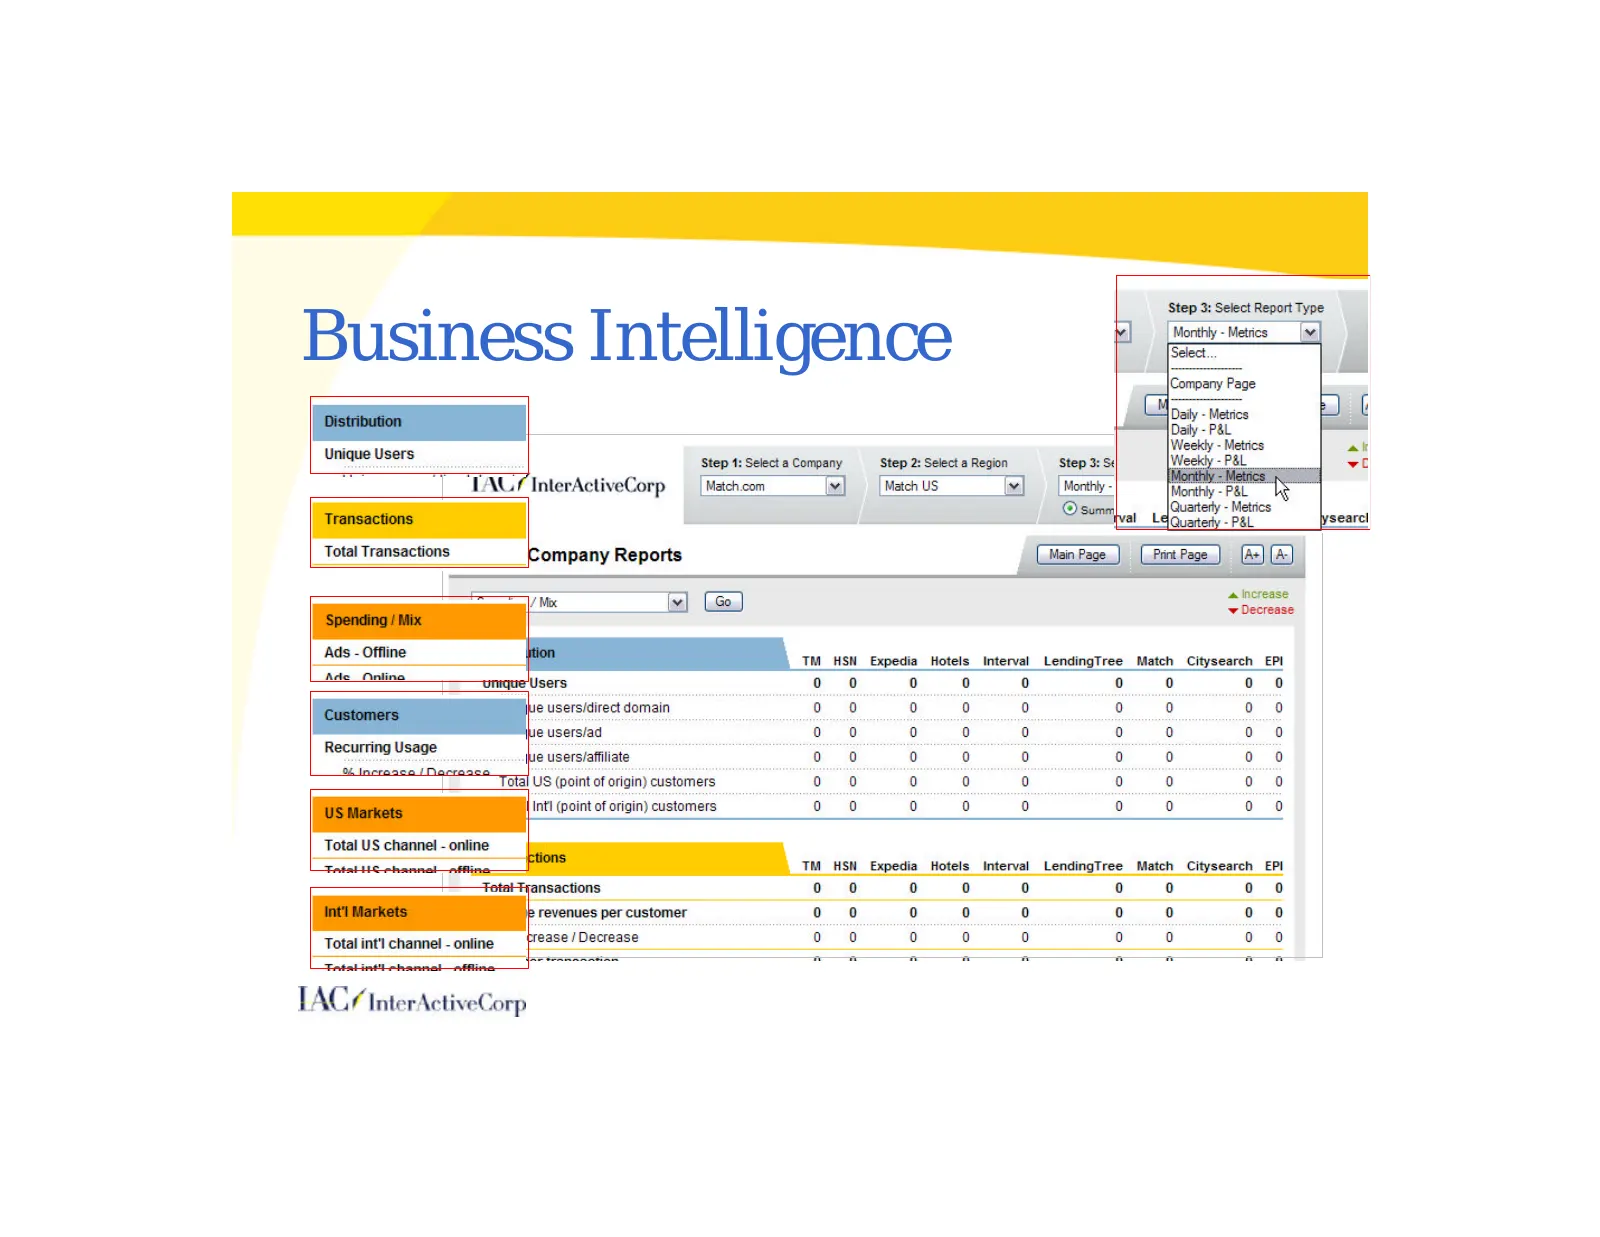
Business Intelligence Wee veers: Step: Selecta Company Step 2: Select a Region 7 TAU# InterActiveCorp [Match.com [¥) [Match us =) Total Transactions Company Reports | 7 ~ ‘TM HSN Expedia Hotels Interval LendingTree oo oo 0 fe usersidirect domain oo oo 0 ie users/ad 0 0 0 0 0 Je users/afiliate 0 0 oo
Slide 15: Themes You Will Hear Today
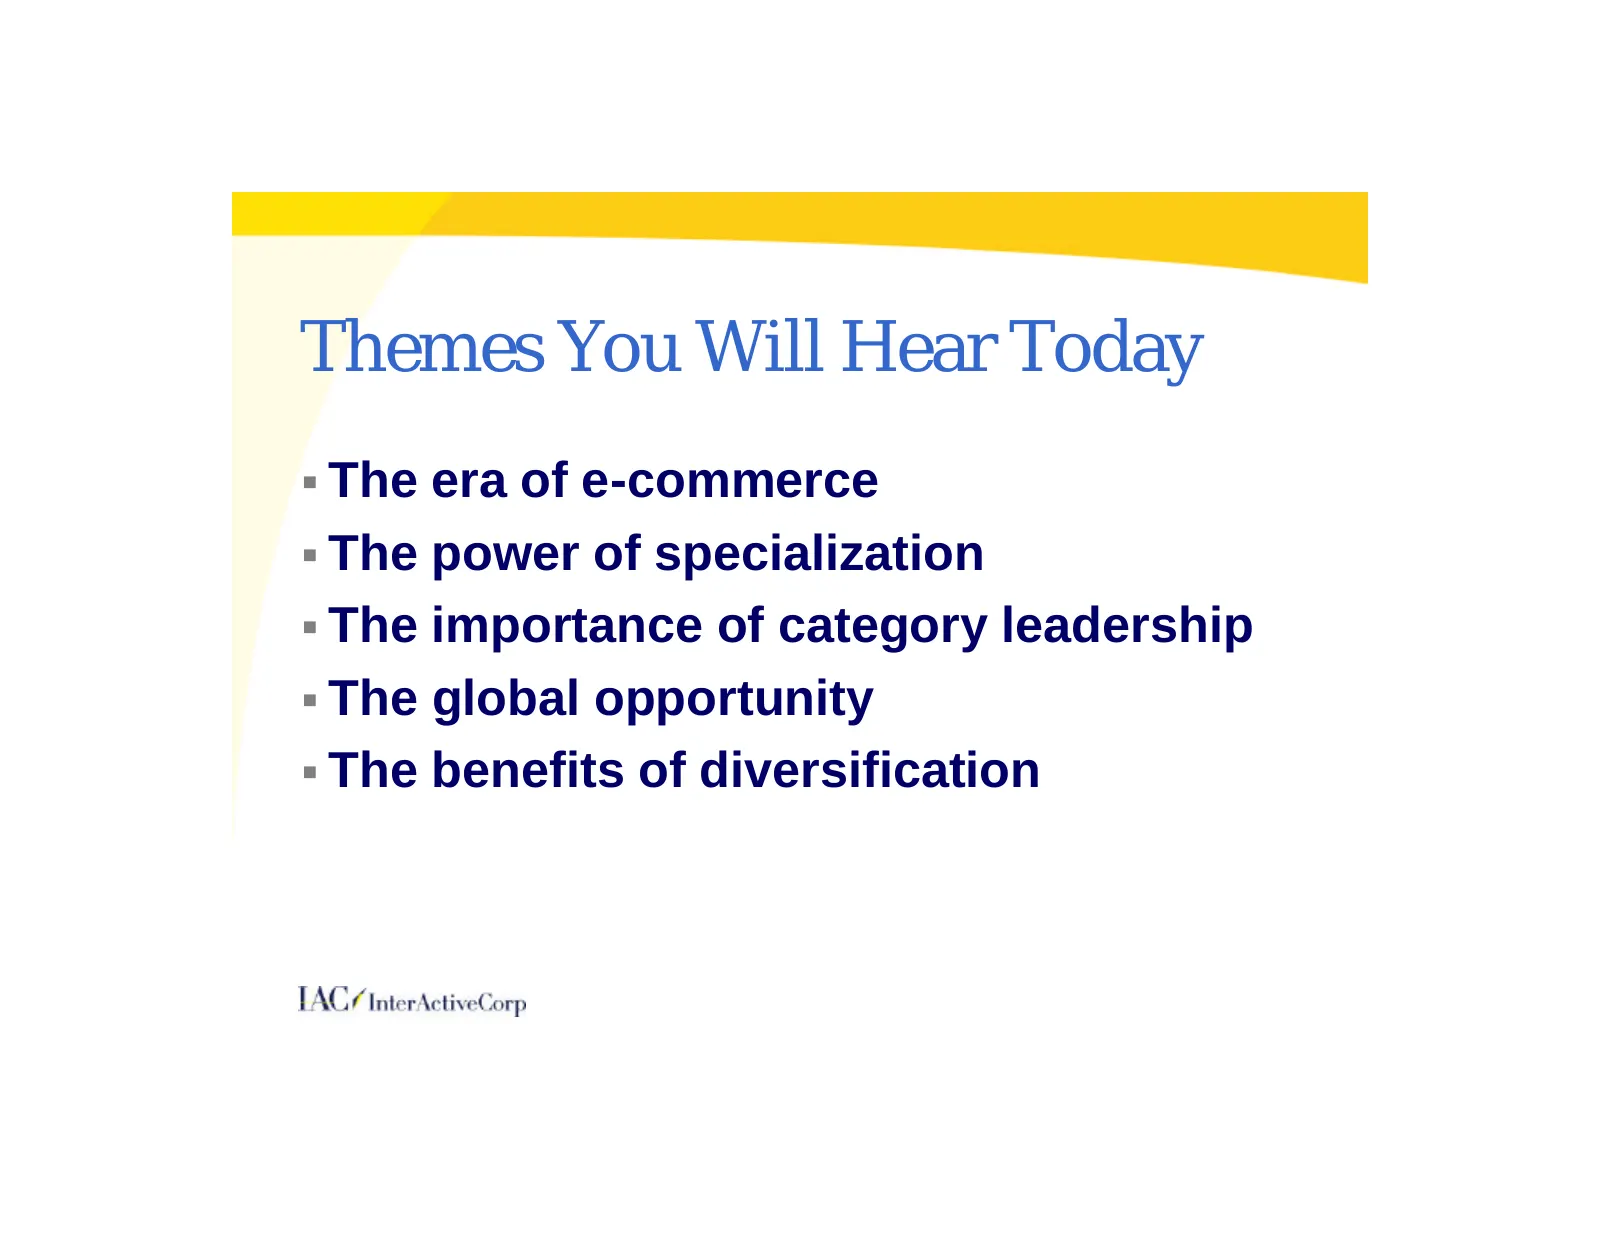
Themes You Will Hear Today § The era of e-commerce § The power of specialization § The importance of category leadership § The global opportunity § The benefits of diversification
Slide 16: Recent Financial Results
Recent Financial Results Dara Khosrowshahi Executive Vice President & CFO
Slide 17: Gross Transaction Value
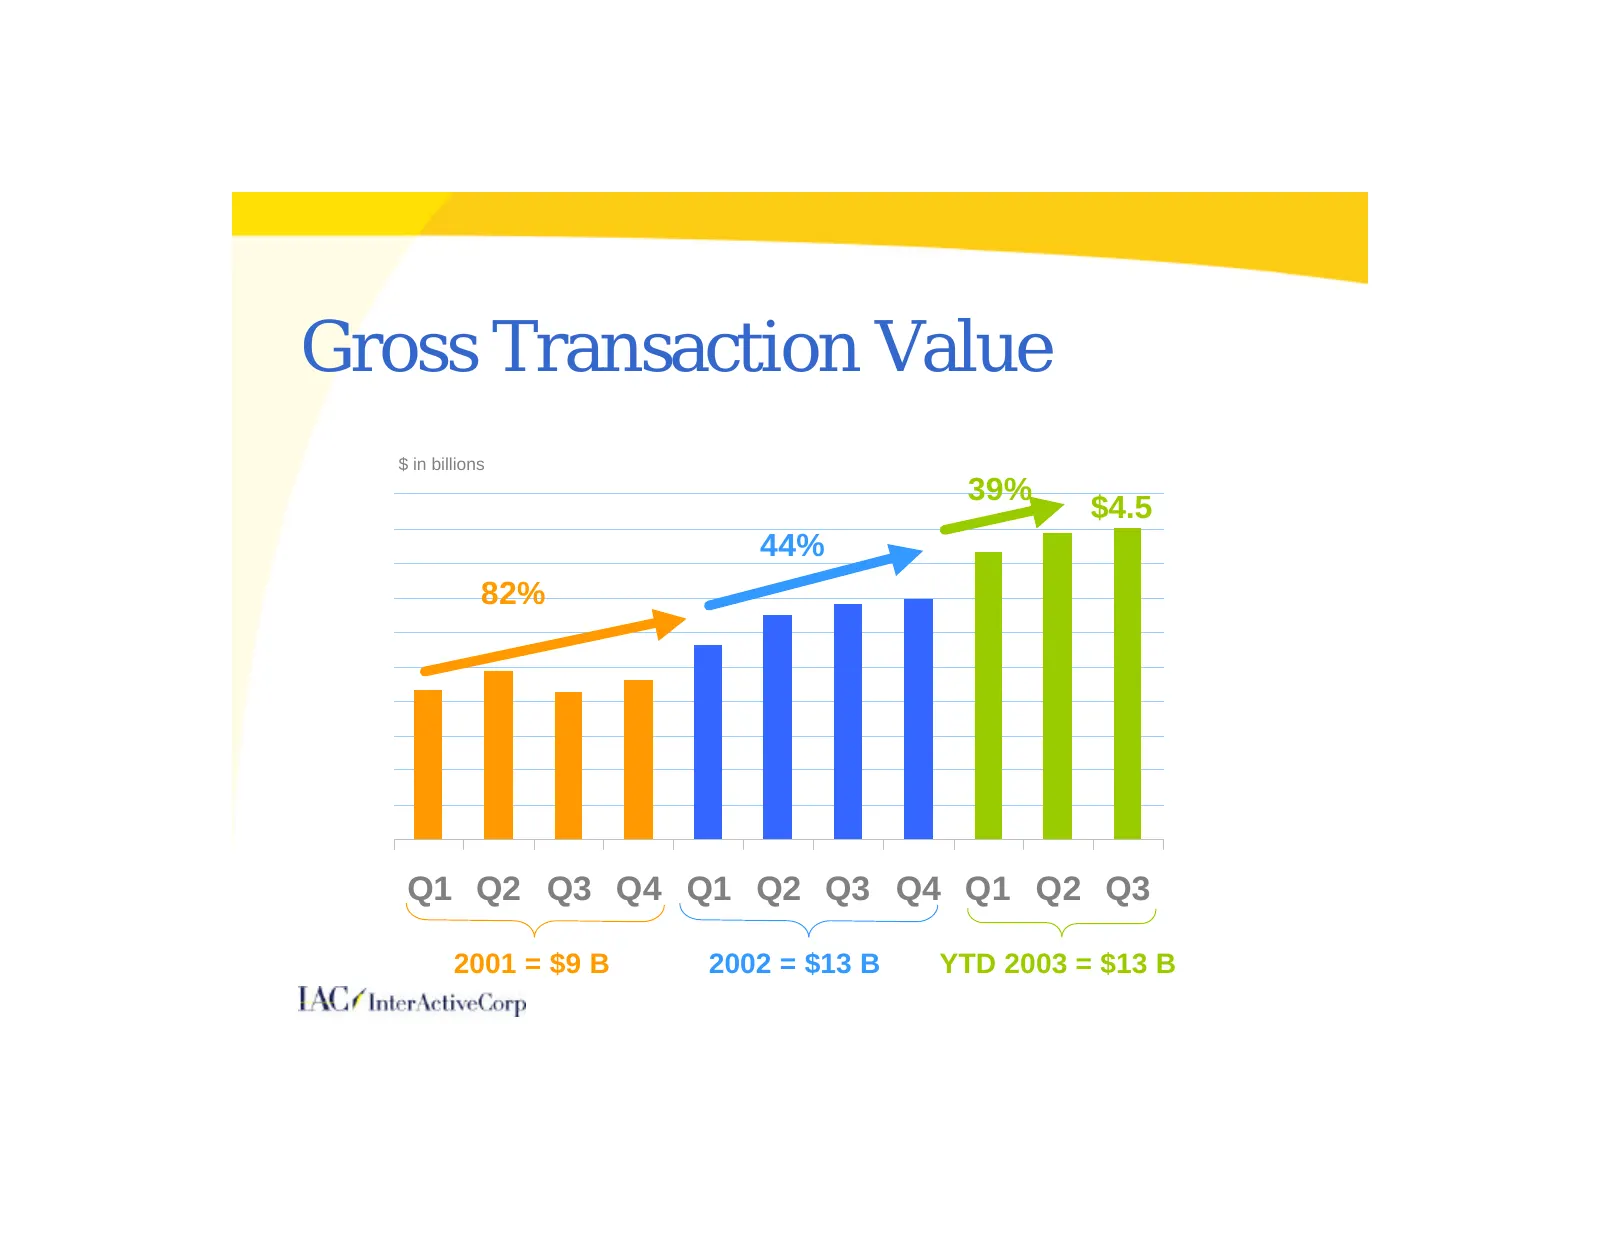
Gross Transaction Value $ in billions 39% $4.5 44% 82% Q1 Q2 Q3 Q4 Q1 Q2 Q3 Q4 Q1 Q2 Q3 2001 = $9 B 2002 = $13 B YTD 2003 = $13 B
Slide 18: Revenue
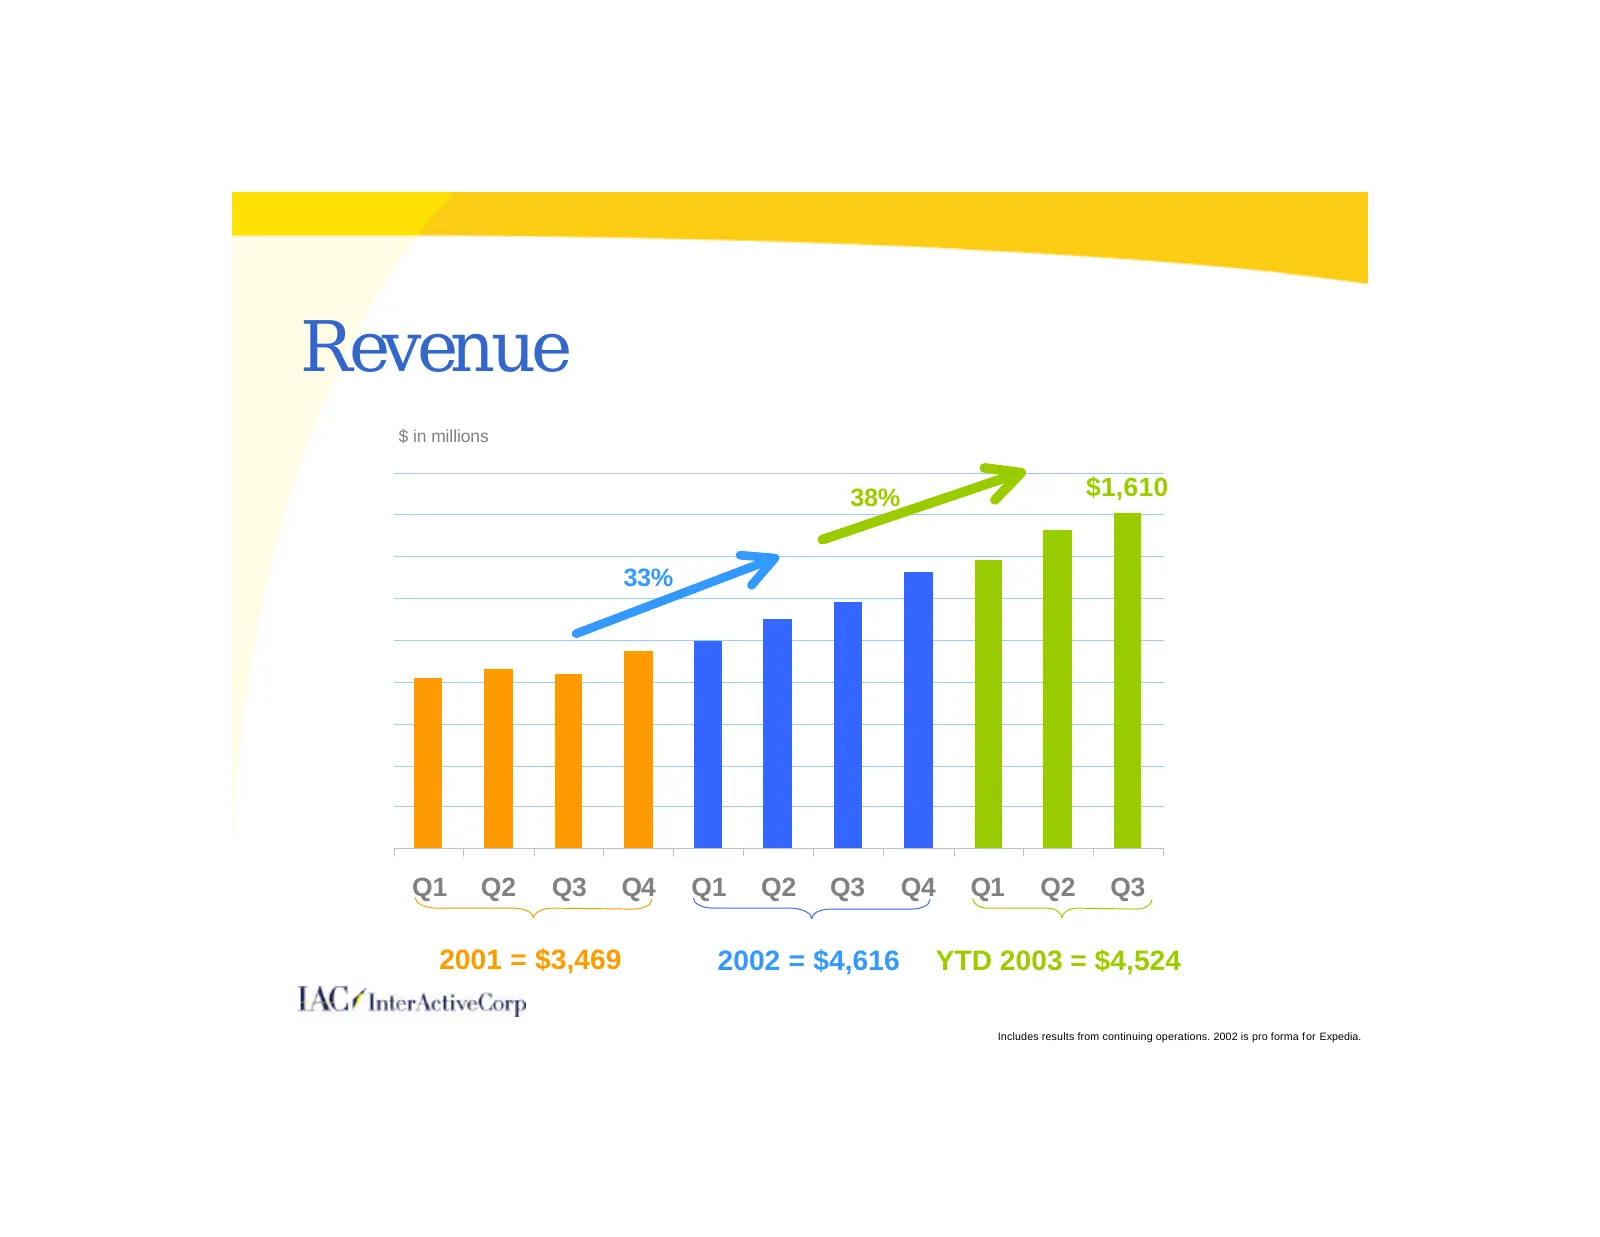
Revenue $ in millions 38% $1,610 33% Q1 Q2 Q3 Q4 Q1 Q2 Q3 Q4 Q1 Q2 Q3 2001 = $3,469 2002 = $4,616 YTD 2003 = $4,524 Includes results from continuing operations. 2002 is pro forma f or Expedia.
Slide 19: OIBA
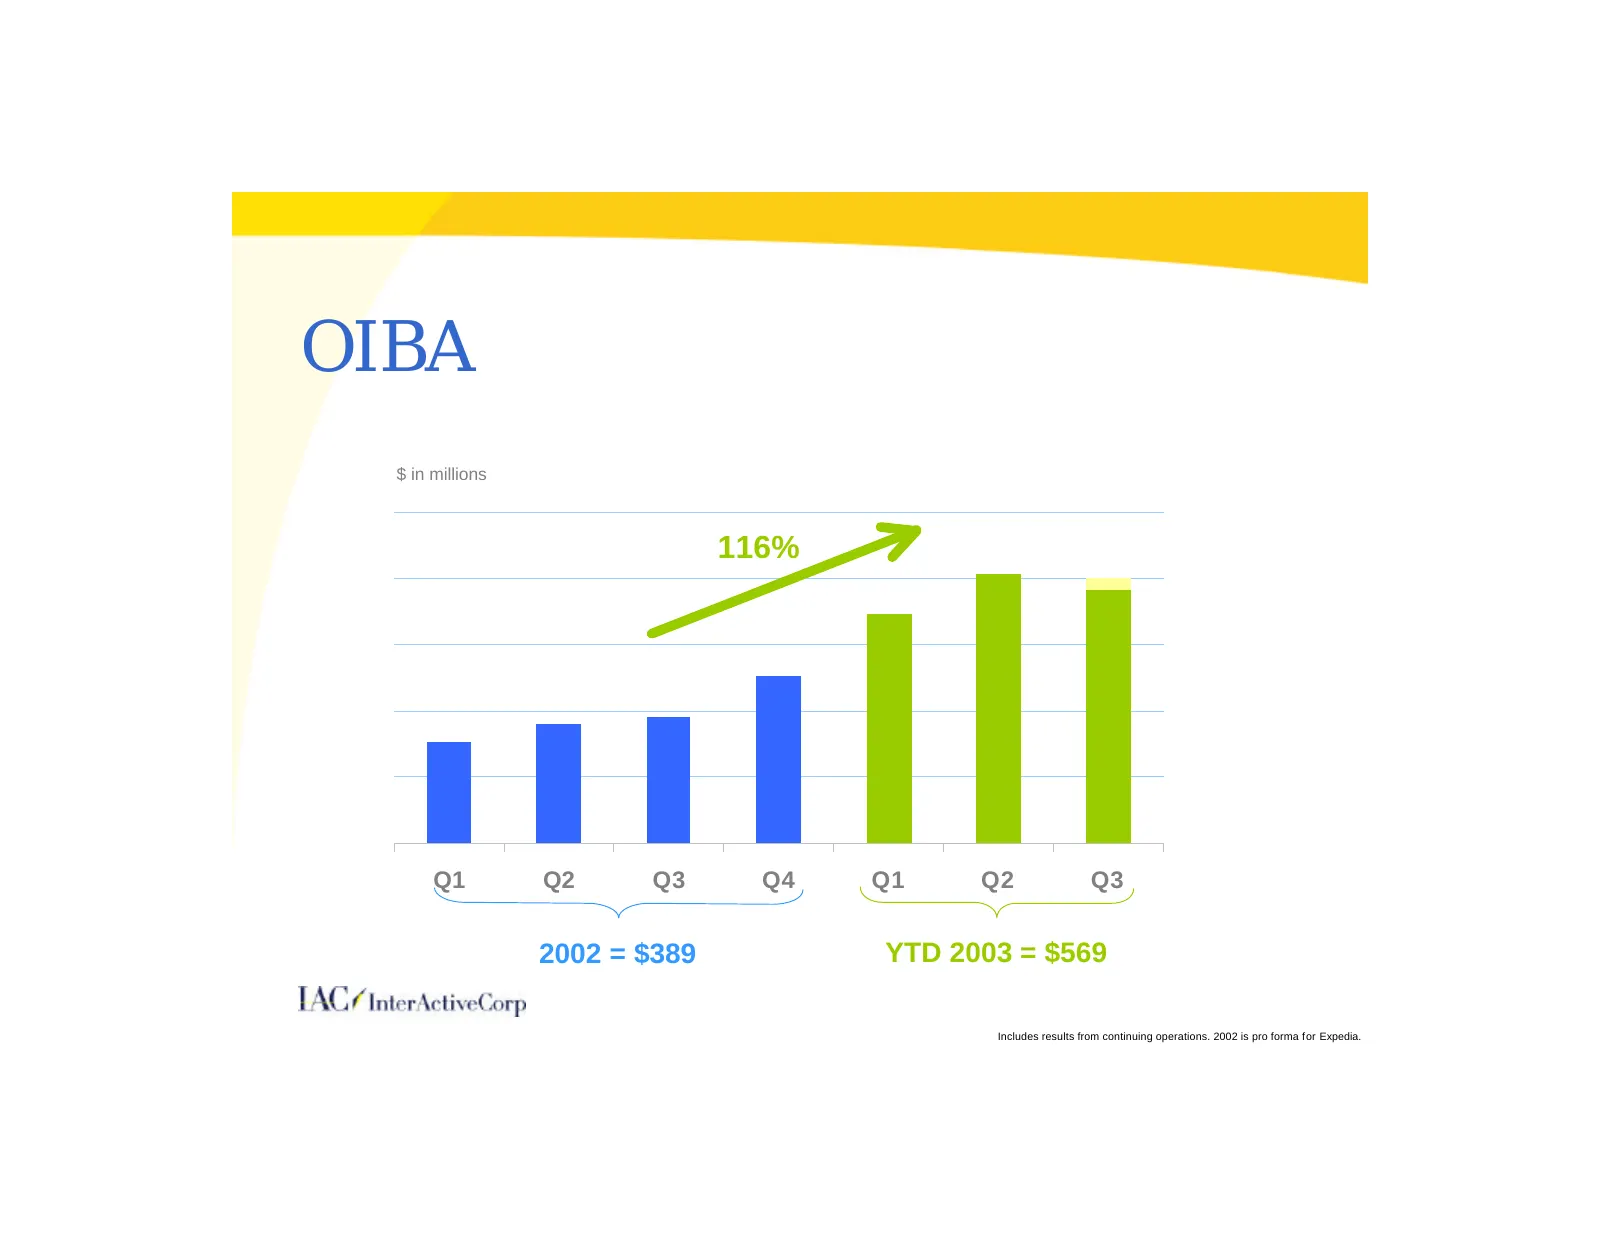
OIBA $ in millions 116% Q1 Q2 Q3 Q4 Q1 Q2 Q3 2002 = $389 YTD 2003 = $569 Includes results from continuing operations. 2002 is pro forma f or Expedia.
Slide 20: Q3 P&L Summary
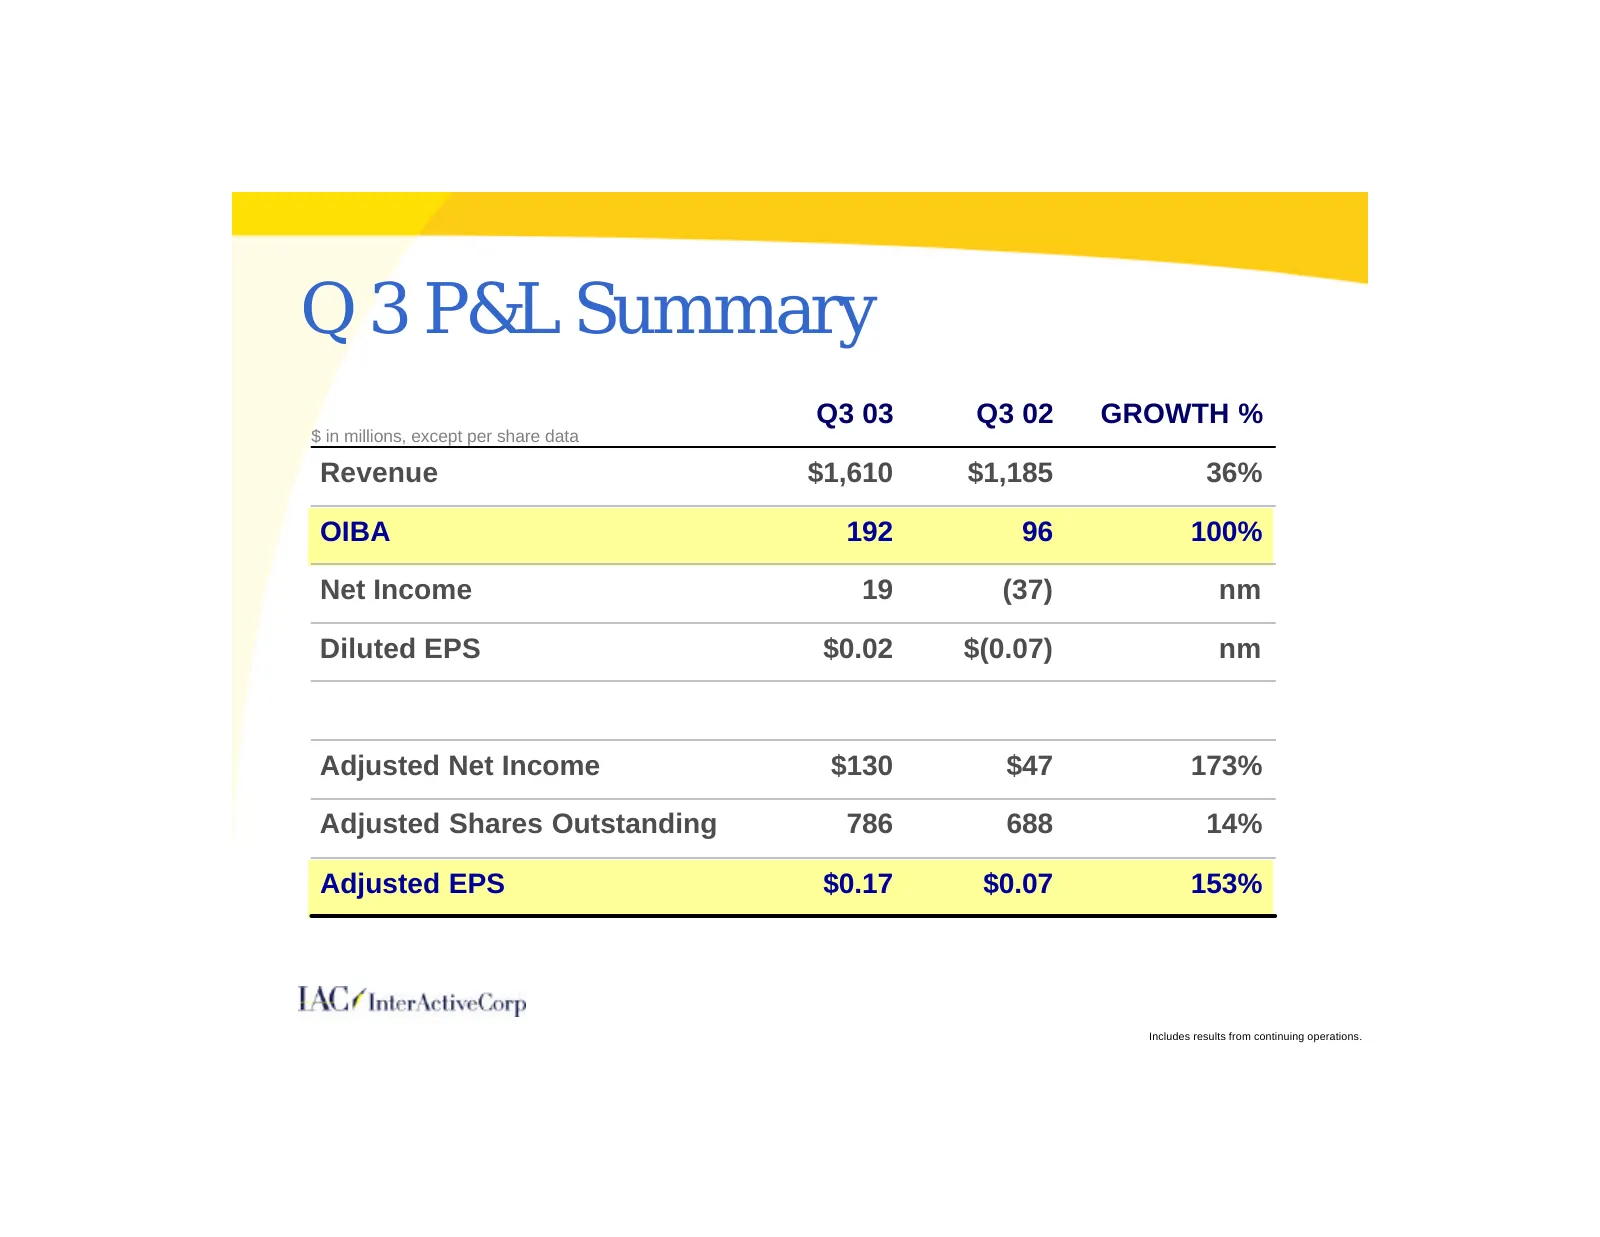
Q 3 P&L Summary Q3 03 Q3 02 GROWTH % $ in millions, except per share data Revenue $1,610 $1,185 36% OIBA 192 96 100% Net Income 19 (37) nm Diluted EPS $0.02 $(0.07) nm Adjusted Net Income $130 $47 173% Adjusted Shares Outstanding 786 688 14% Adjusted EPS $0.17 $0.07 153% Includes results from contin
Slide 21: Q3 Charges
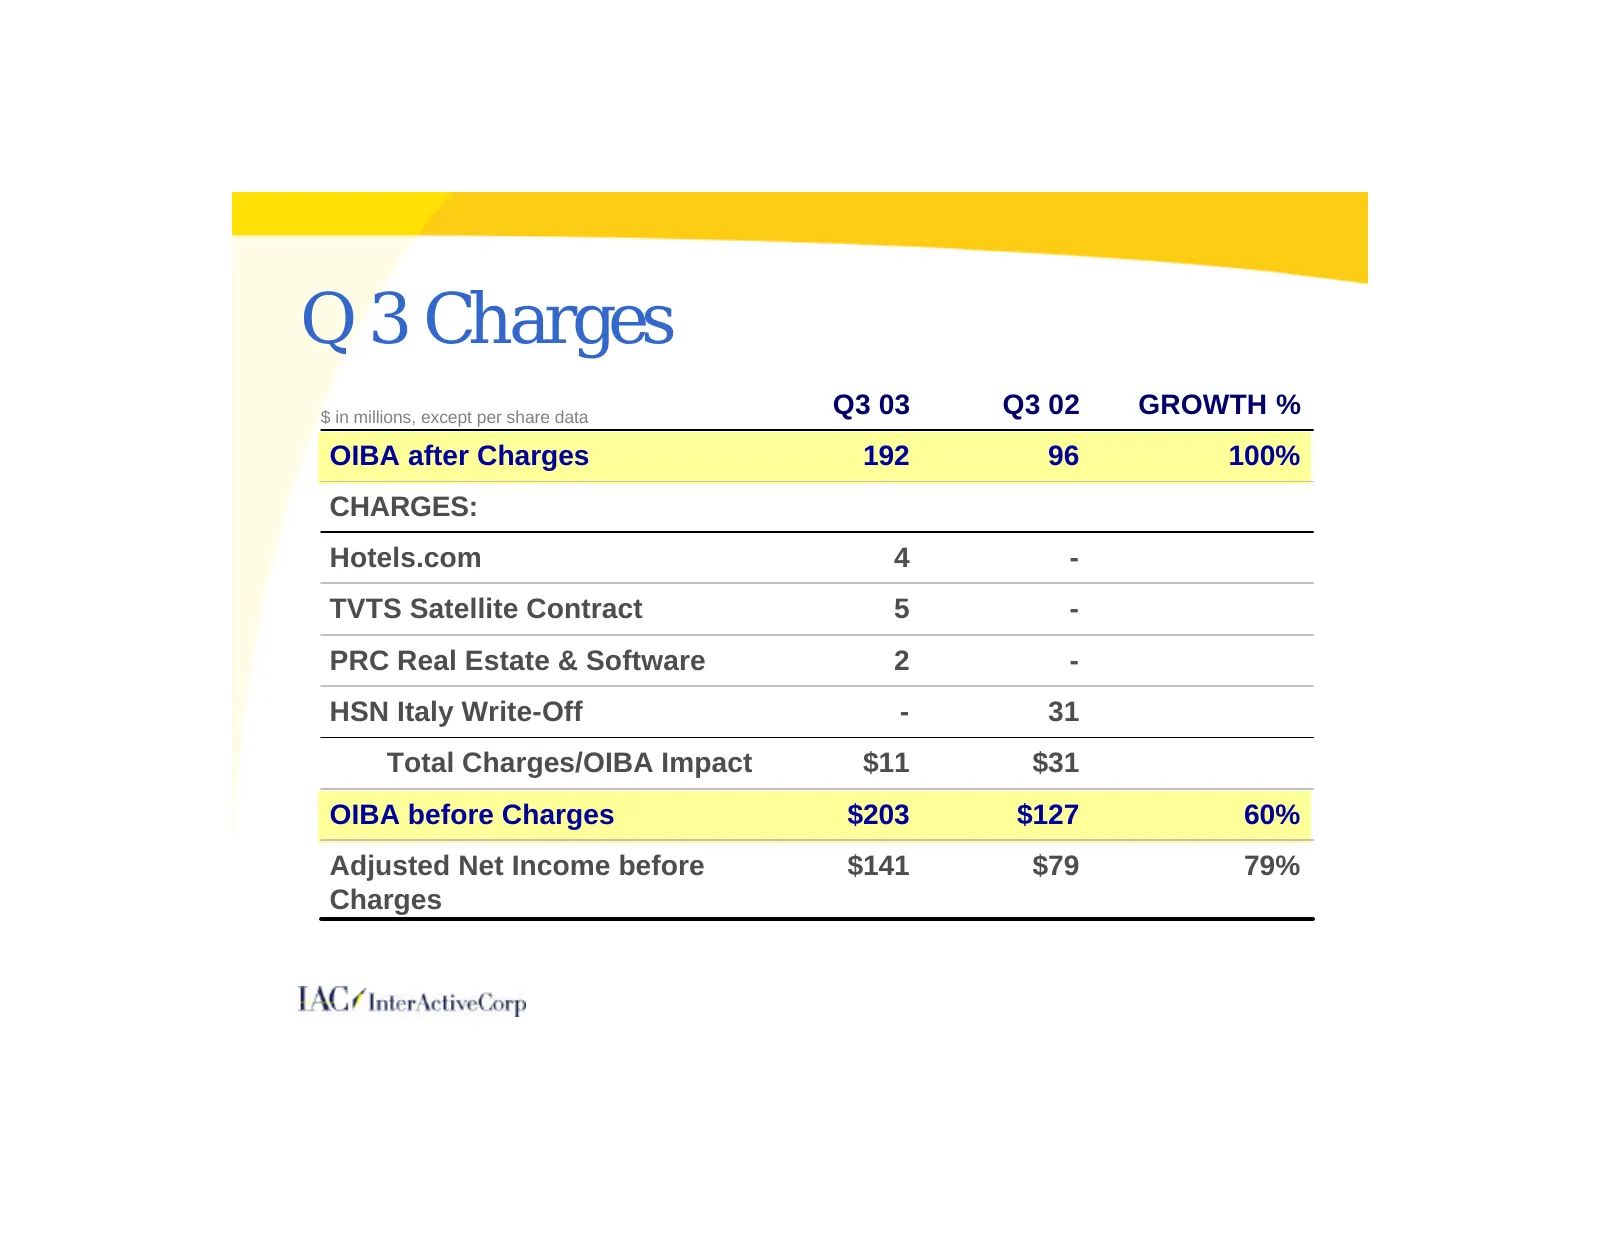
Q 3 Charges $ in millions, except per share data Q3 03 Q3 02 GROWTH % OIBA after Charges 192 96 100% CHARGES: Hotels.com 4 - TVTS Satellite Contract 5 - PRC Real Estate & Software 2 - HSN Italy Write-Off - 31 Total Charges/OIBA Impact $11 $31 OIBA before Charges $203 $127 60% Adjusted Net Income bef
Slide 22: Q3 Segment Financials
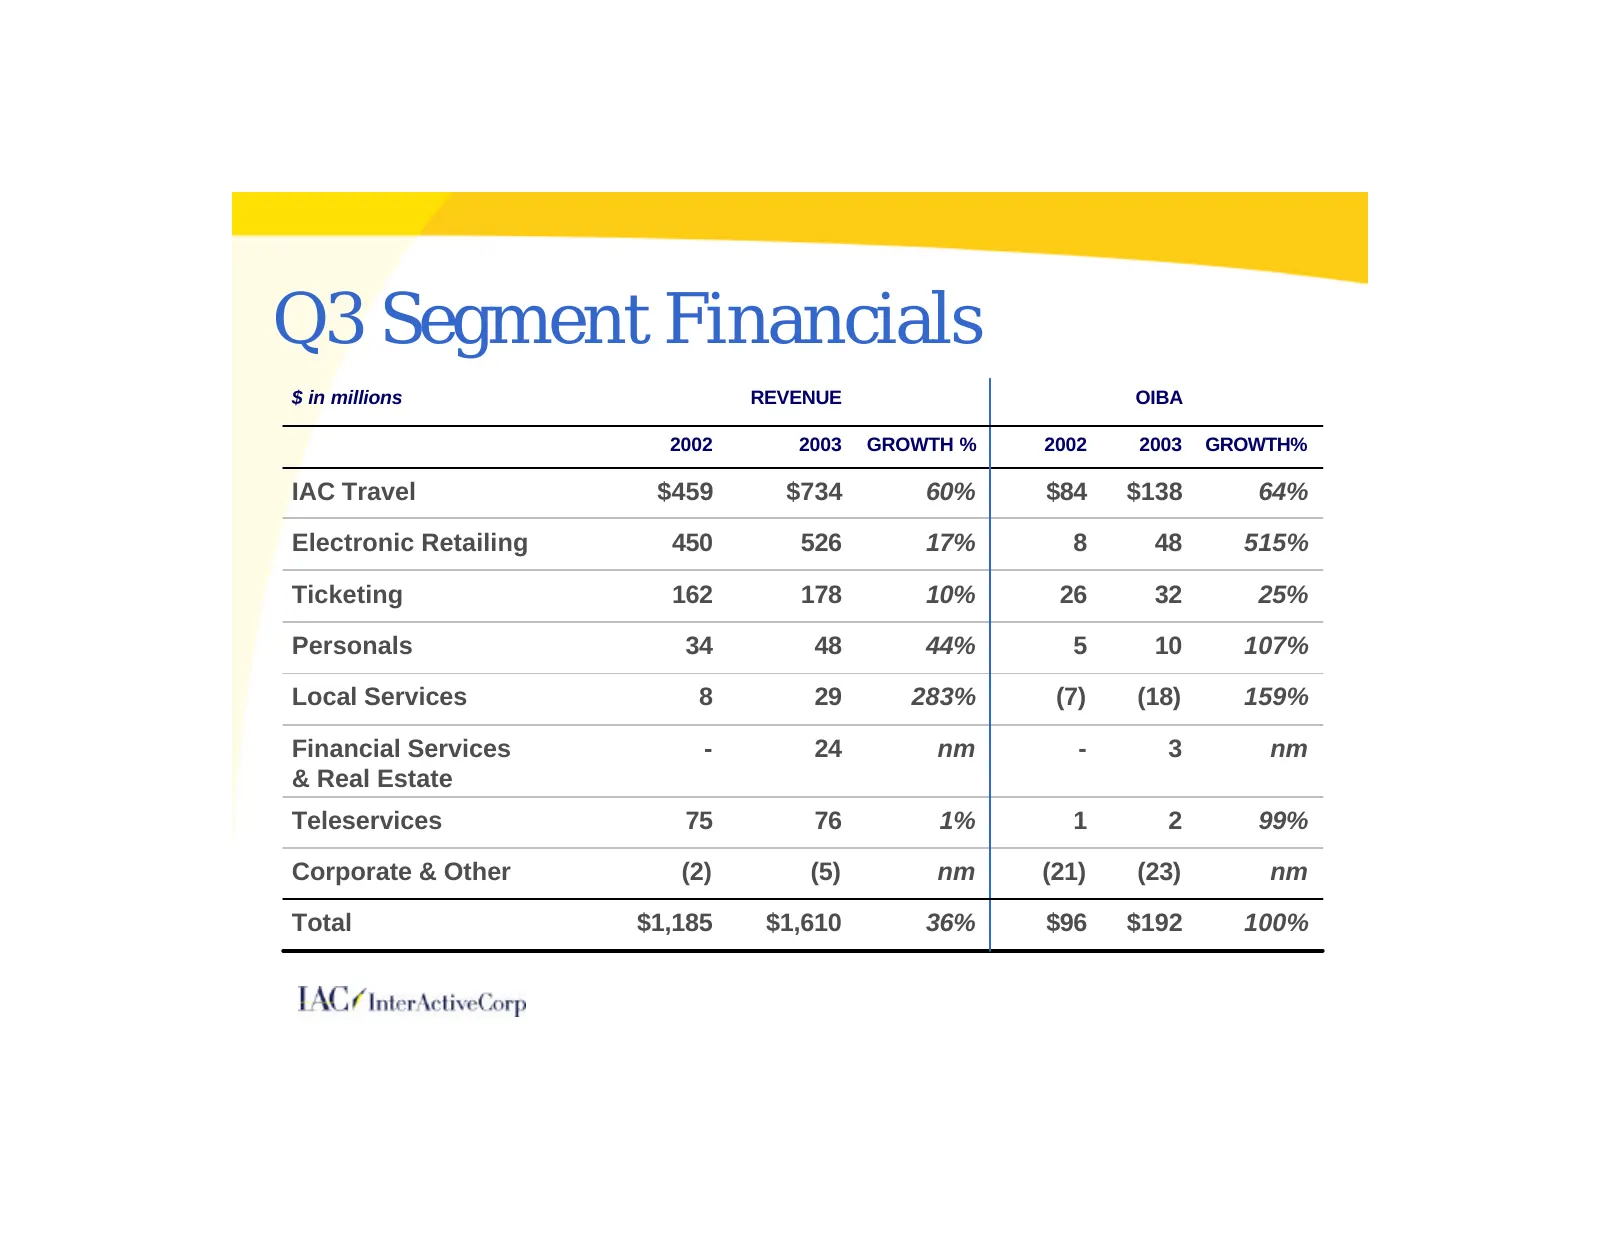
Q3 Segment Financials $ in millions REVENUE OIBA 2002 2003 GROWTH % 2002 2003 GROWTH% IAC Travel $459 $734 60% $84 $138 64% Electronic Retailing 450 526 17% 8 48 515% Ticketing 162 178 10% 26 32 25% Personals 34 48 44% 5 10 107% Local Services 8 29 283% (7) (18) 159% Financial Services - 24 nm - 3 n
Slide 23: Leverage
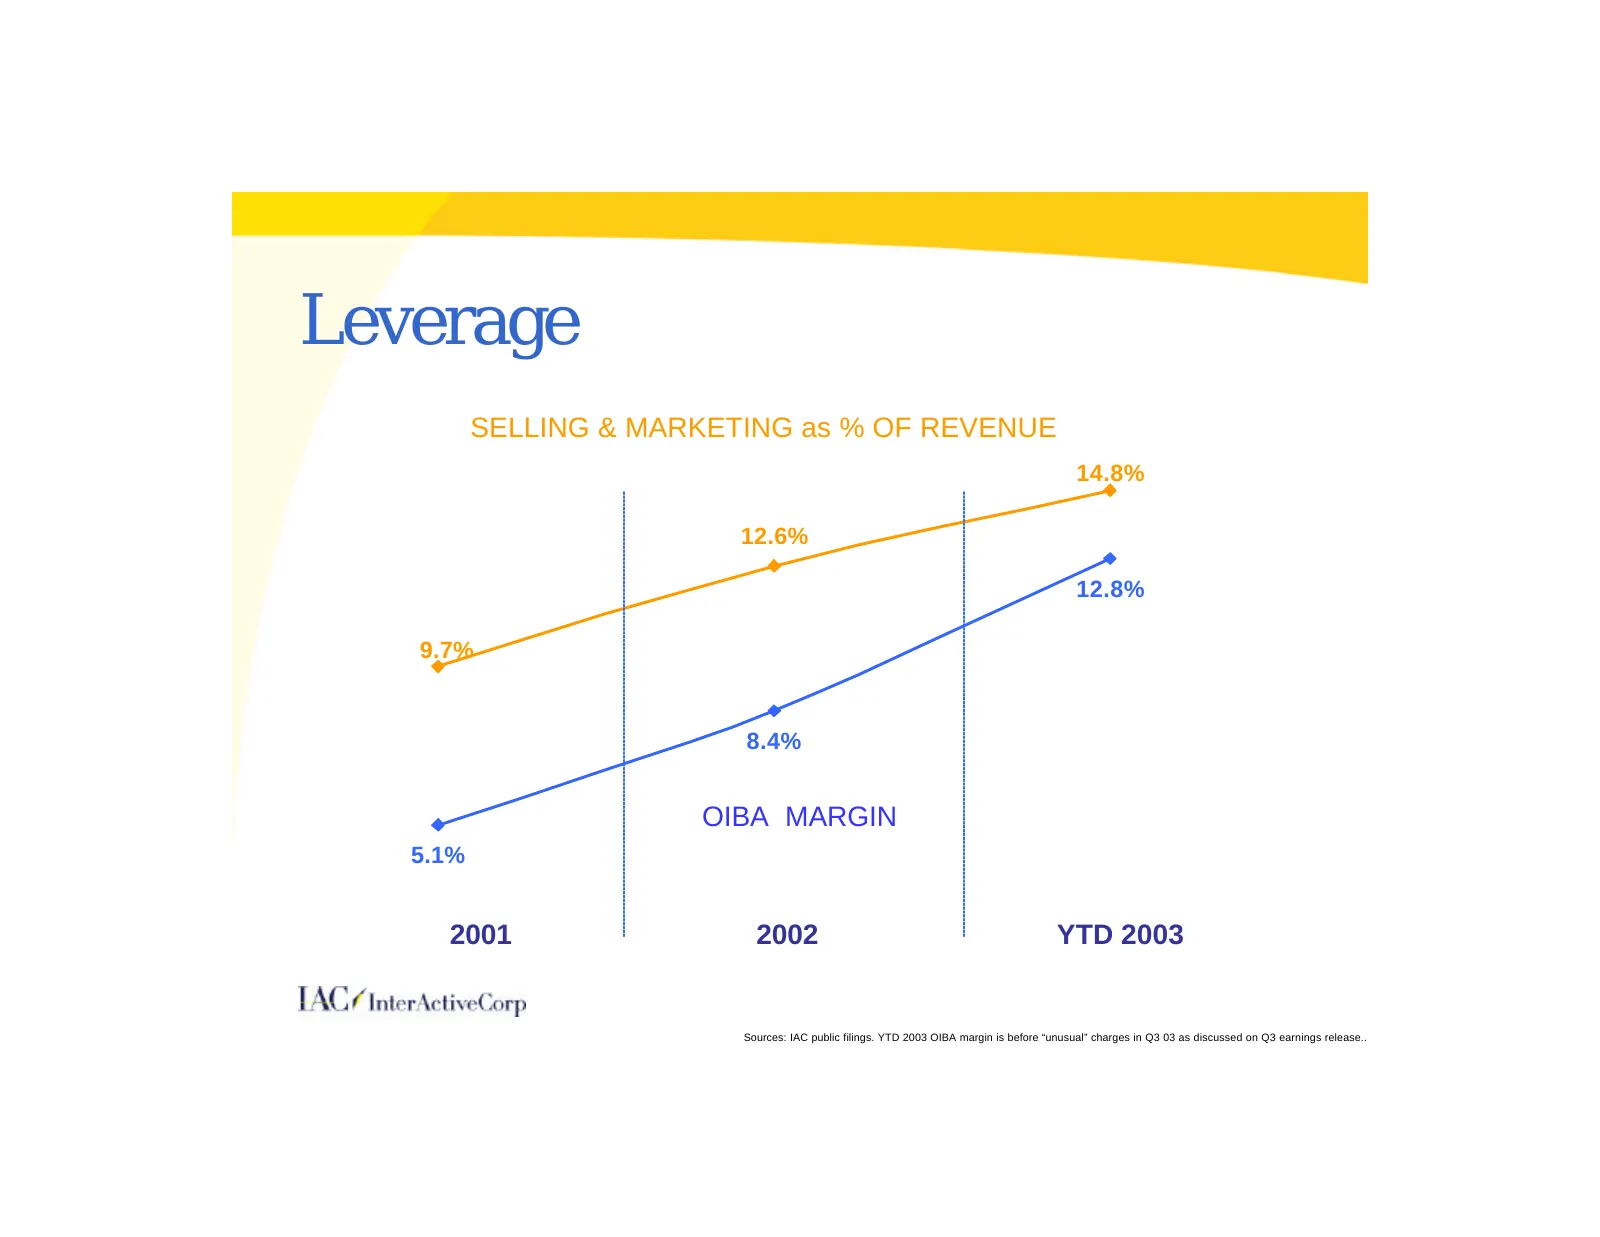
Leverage SELLING & MARKETING as % OF REVENUE 14.8% 15% 12.6% 12.8% 9.7% 10% 8.4% OIBA MARGIN 5% 5.1% 2001 2002 YTD 2003 0% Sources: IAC public filings. YTD 2003 OIBA margin is before “unusual” charges in Q3 03 as discussed on Q3 earnings release..
Slide 24: Free Cash Flow
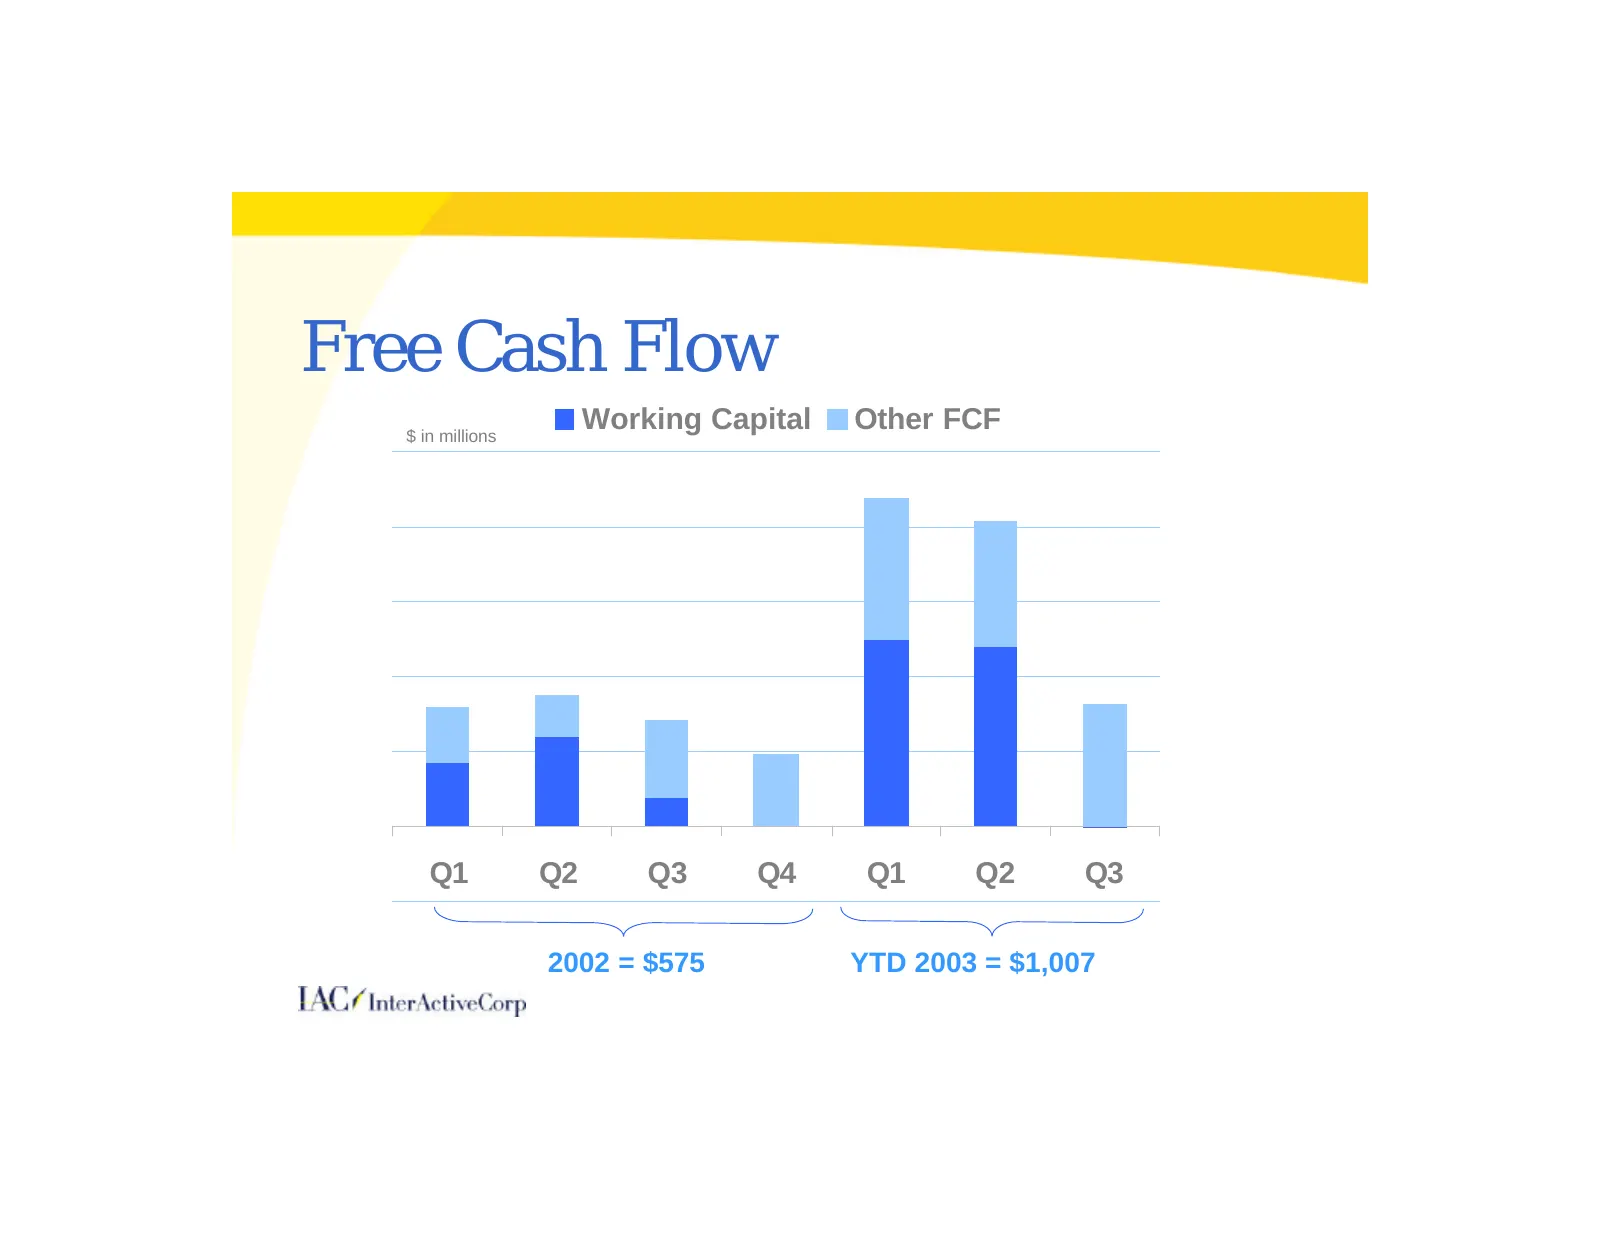
Free Cash Flow $ in millions Working Capital Other FCF Q1 Q2 Q3 Q4 Q1 Q2 Q3 2002 = $575 YTD 2003 = $1,007
Slide 25: Travel Working Capital
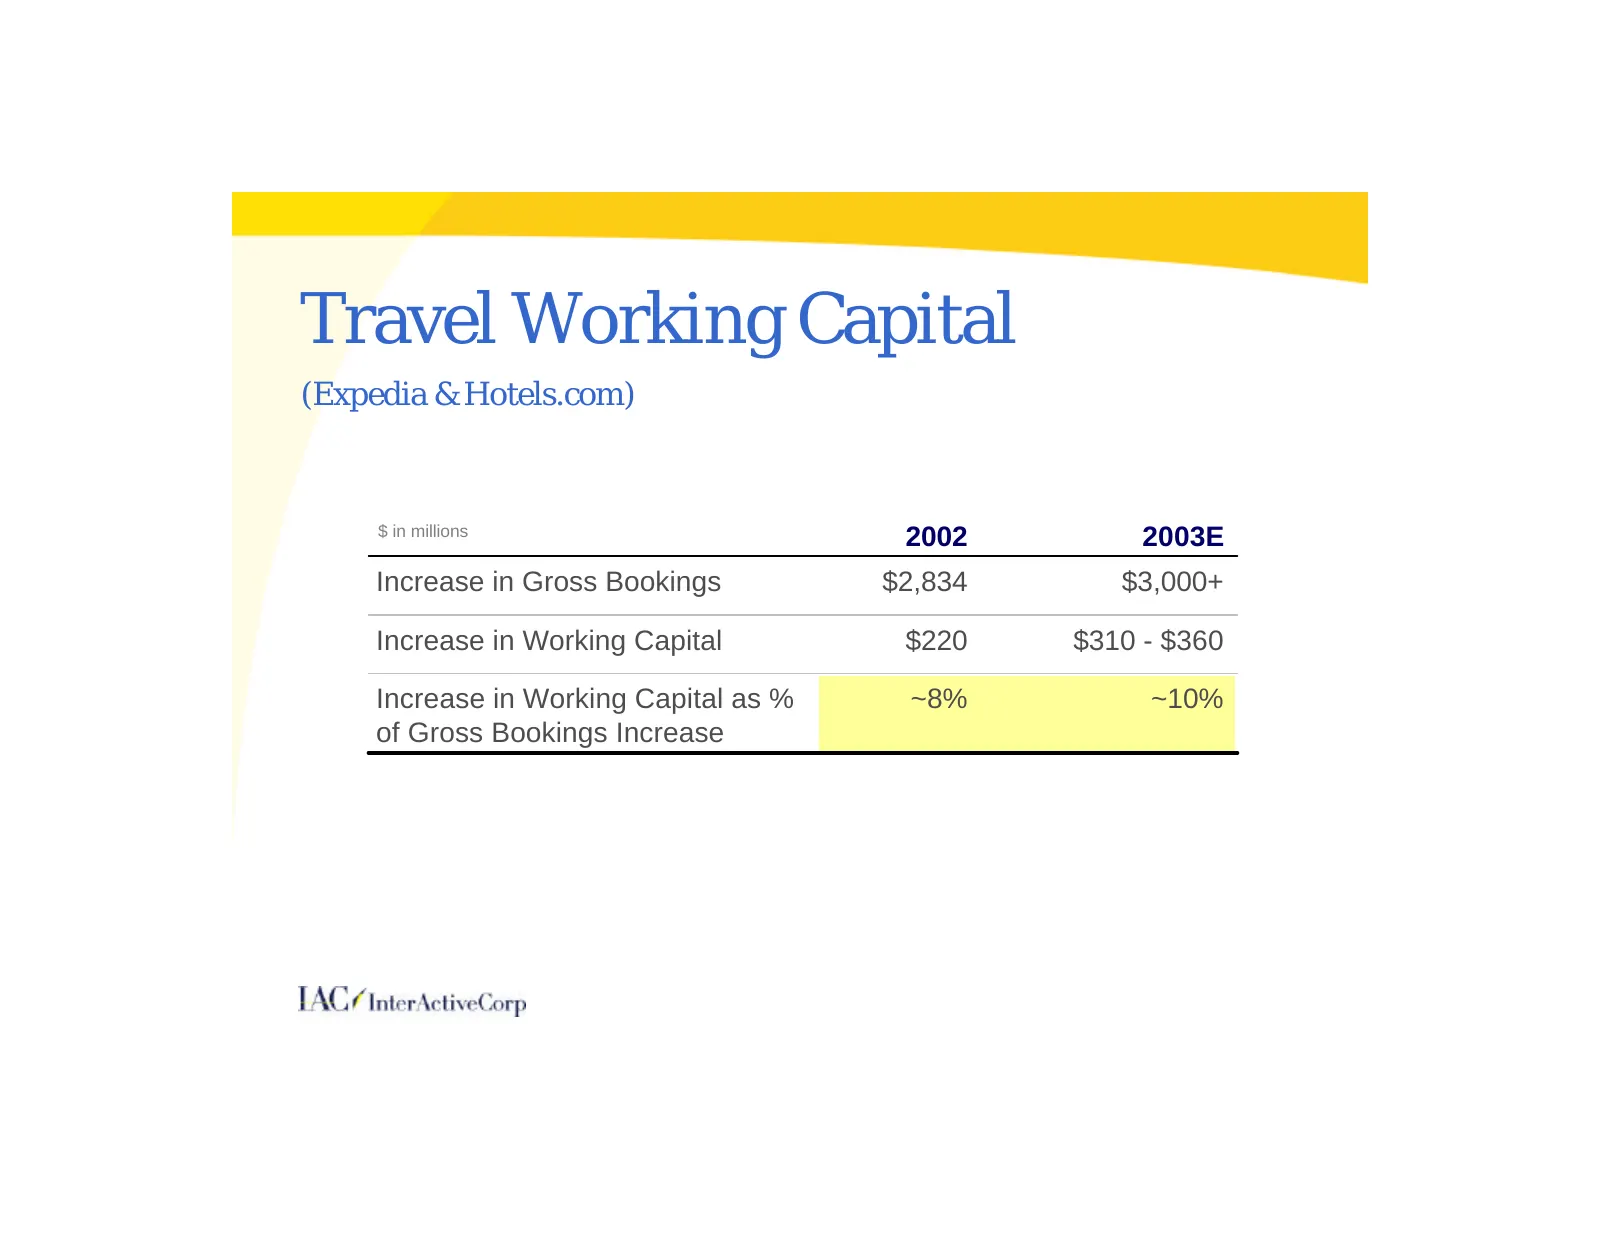
Travel Working Capital (Expedia & Hotels.com) $ in millions 2002 2003E Increase in Gross Bookings $2,834 $3,000+ Increase in Working Capital $220 $310 - $360 Increase in Working Capital as % ~8% ~10% of Gross Bookings Increase
Slide 26: YTD Cash Deployment
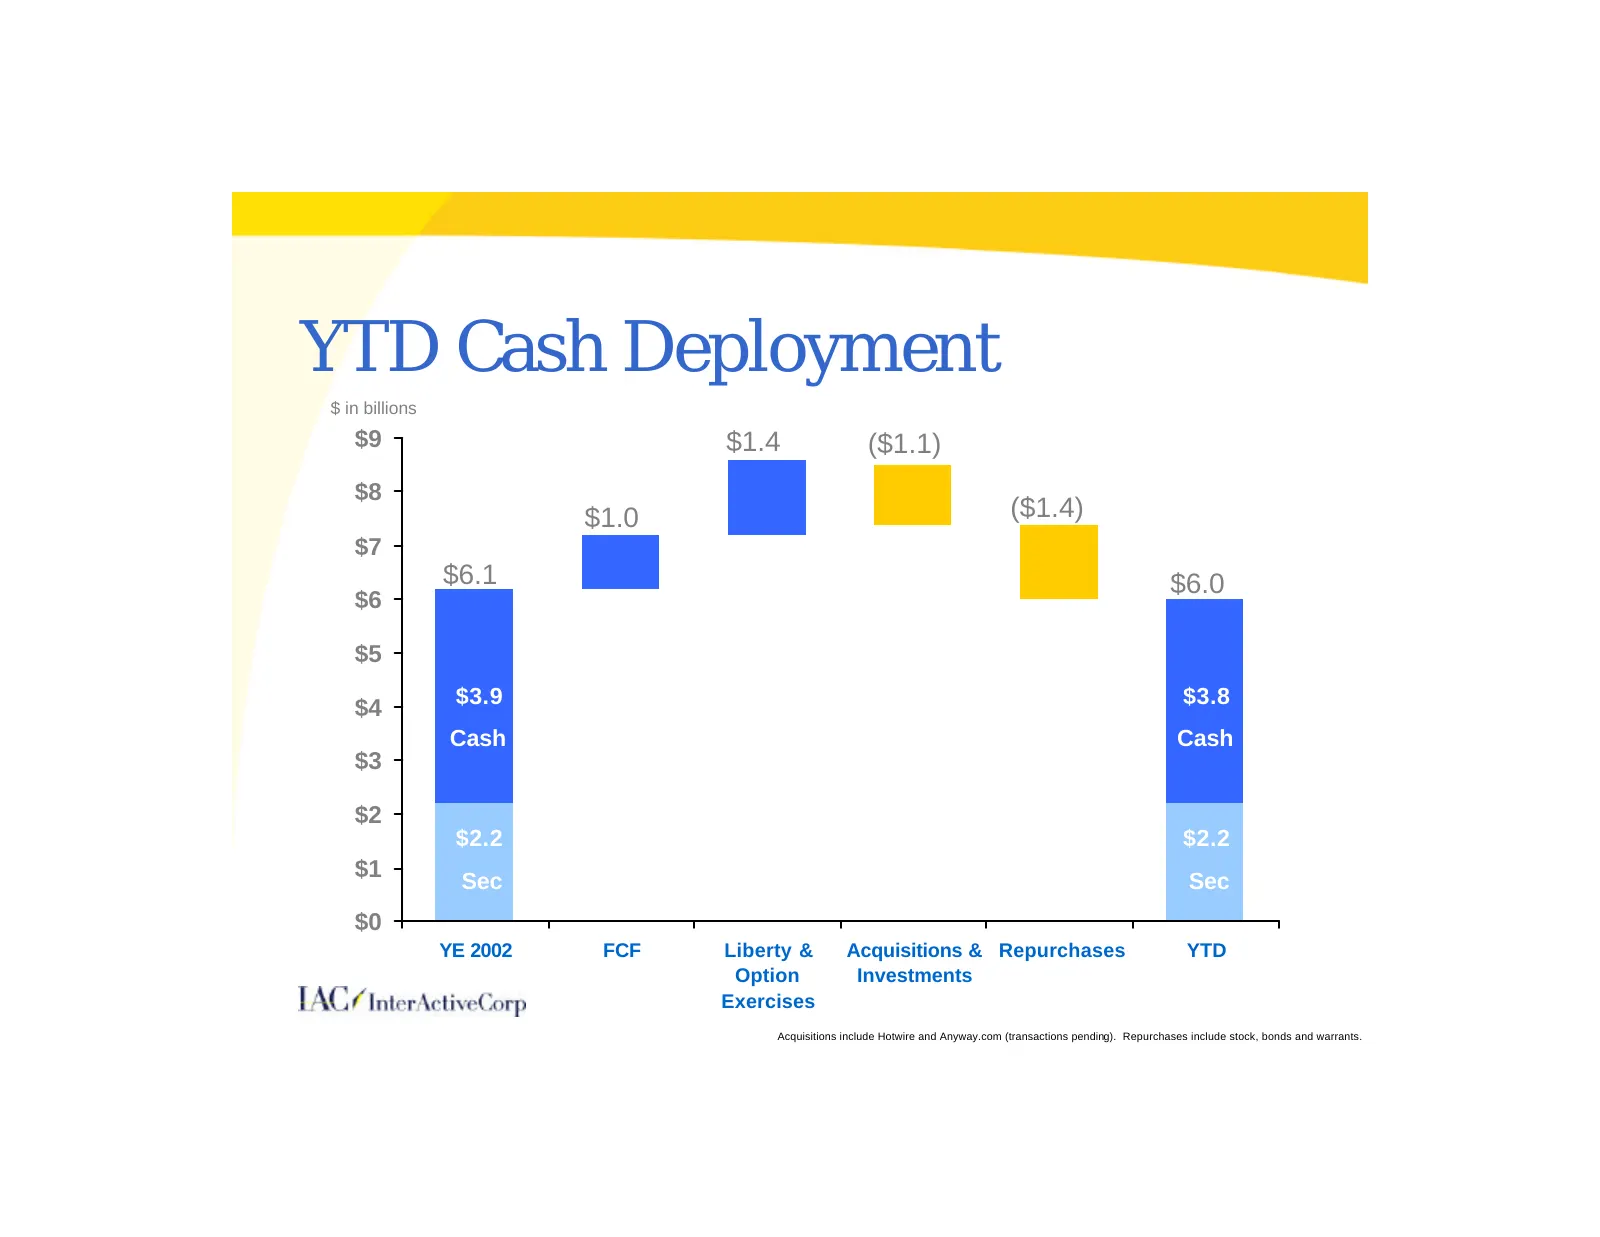
YTD Cash Deployment $ in billions $9 $1.4 ($1.1) $8 $1.0 ($1.4) $7 $6.1 $6.0 $6 $5 $3.9 $3.8 $4 Cash Cash $3 $2 $2.2 $2.2 $1 Sec Sec $0 YE 2002 FCF Liberty & Acquisitions & Repurchases YTD Option Investments Exercises Acquisitions include Hotwire and Anyway.com (transactions pending). Repurchases in
Slide 27: Current Capitalization
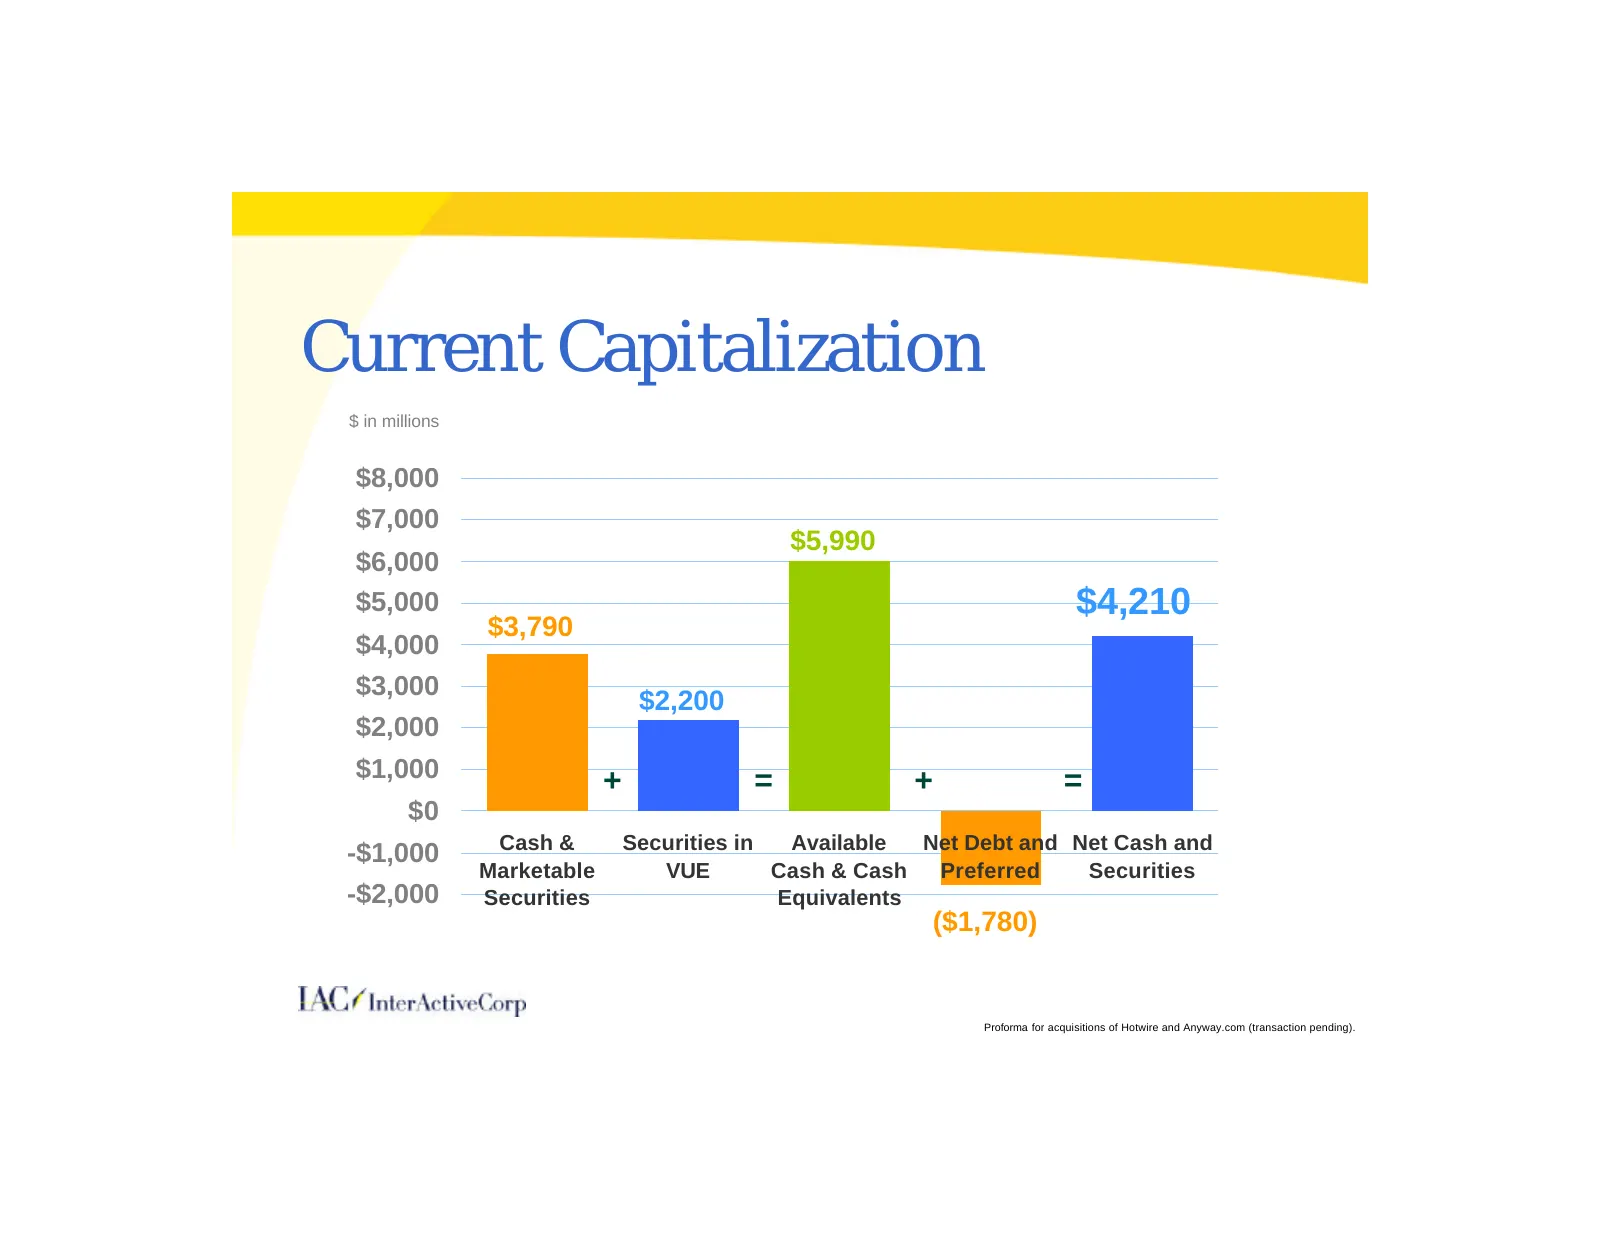
Current Capitalization $ in millions $8,000 $7,000 $5,990 $6,000 $5,000 $4,210 $3,790 $4,000 $3,000 $2,200 $2,000 $1,000 + = + = $0 Cash & Securities in Available Net Debt and Net Cash and -$1,000 Marketable VUE Cash & Cash Preferred Securities -$2,000 Securities Equivalents ($1,780) Proforma for ac
Slide 28: Cash Cushion
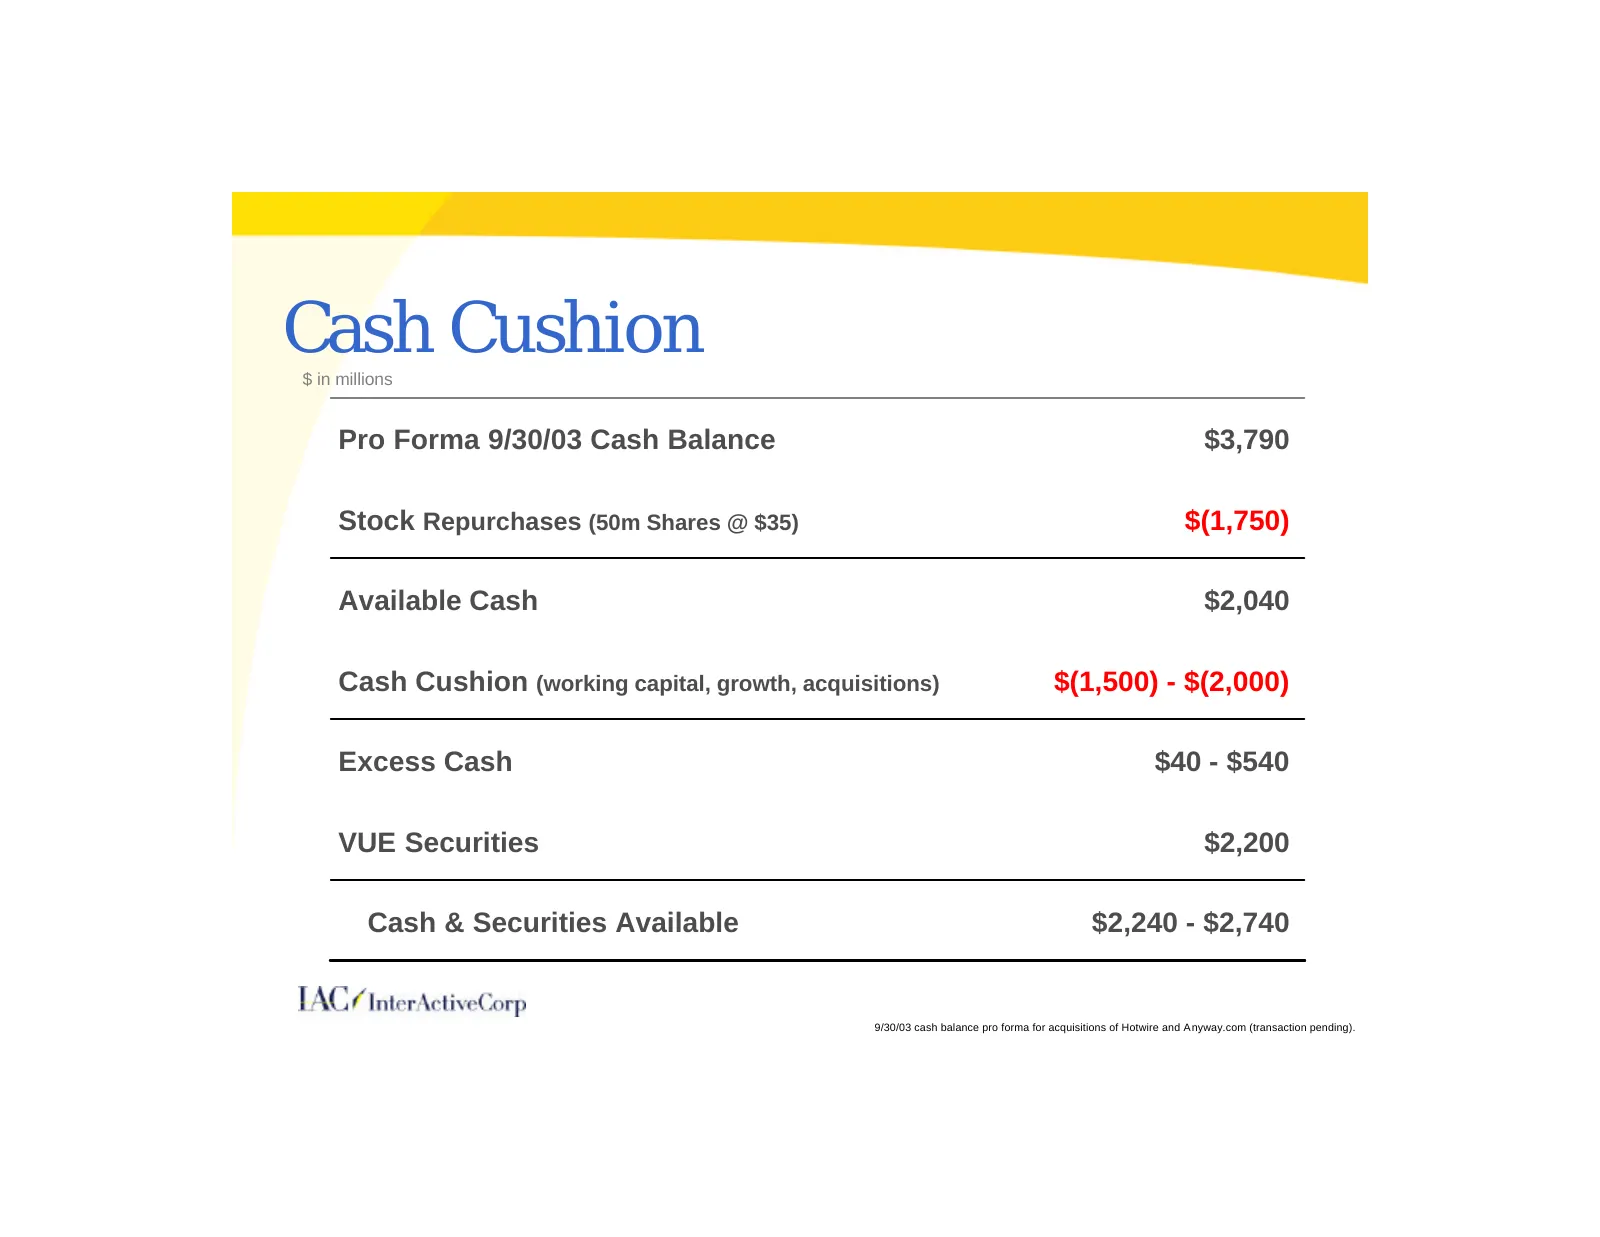
Cash Cushion $ in millions Pro Forma 9/30/03 Cash Balance $3,790 Stock Repurchases (50m Shares @ $35) $(1,750) Available Cash $2,040 Cash Cushion (working capital, growth, acquisitions) $(1,500) - $(2,000) Excess Cash $40 - $540 VUE Securities $2,200 Cash & Securities Available $2,240 - $2,740 9/30/
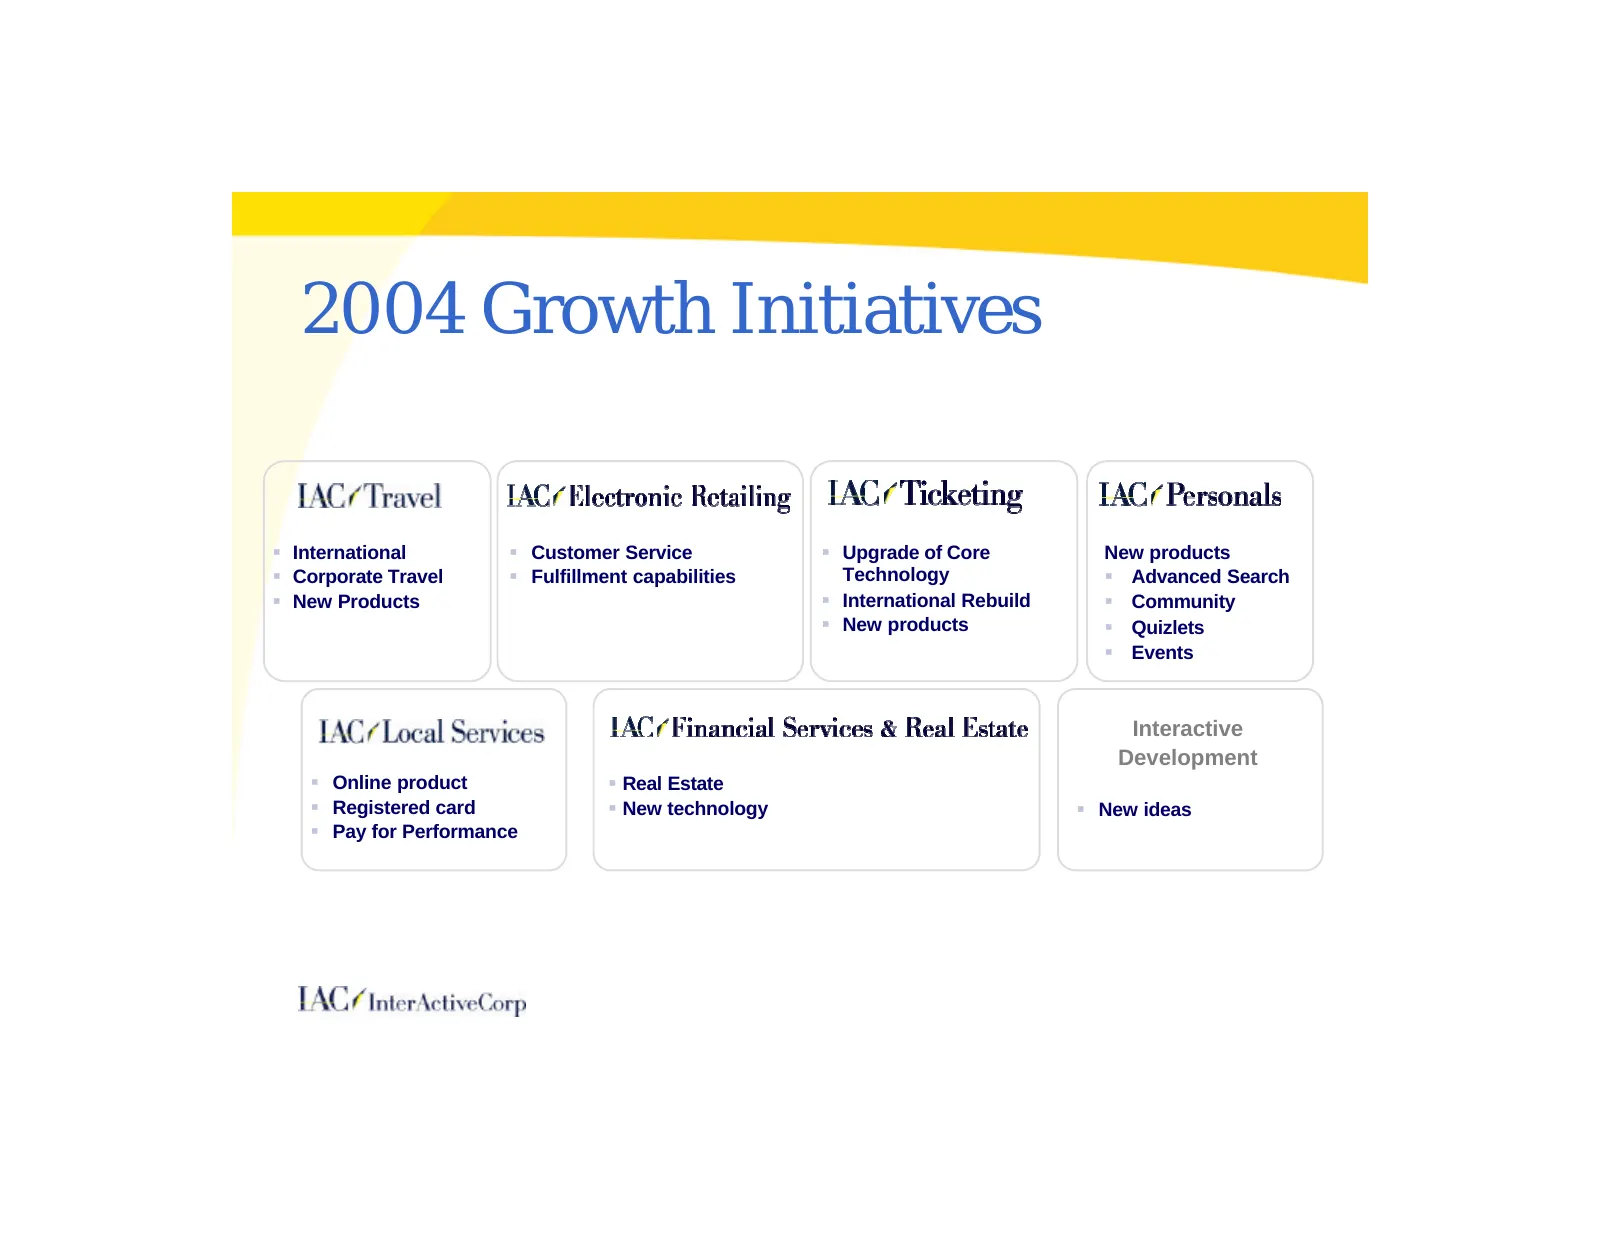
Slide 29: 2004 Growth Initiatives
2004 Growth Initiatives § International § Customer Service § Upgrade of Core New products § Corporate Travel § Fulfillment capabilities Technology § Advanced Search § New Products § International Rebuild § Community § New products § Quizlets § Events Interactive Development § Online product § Real E
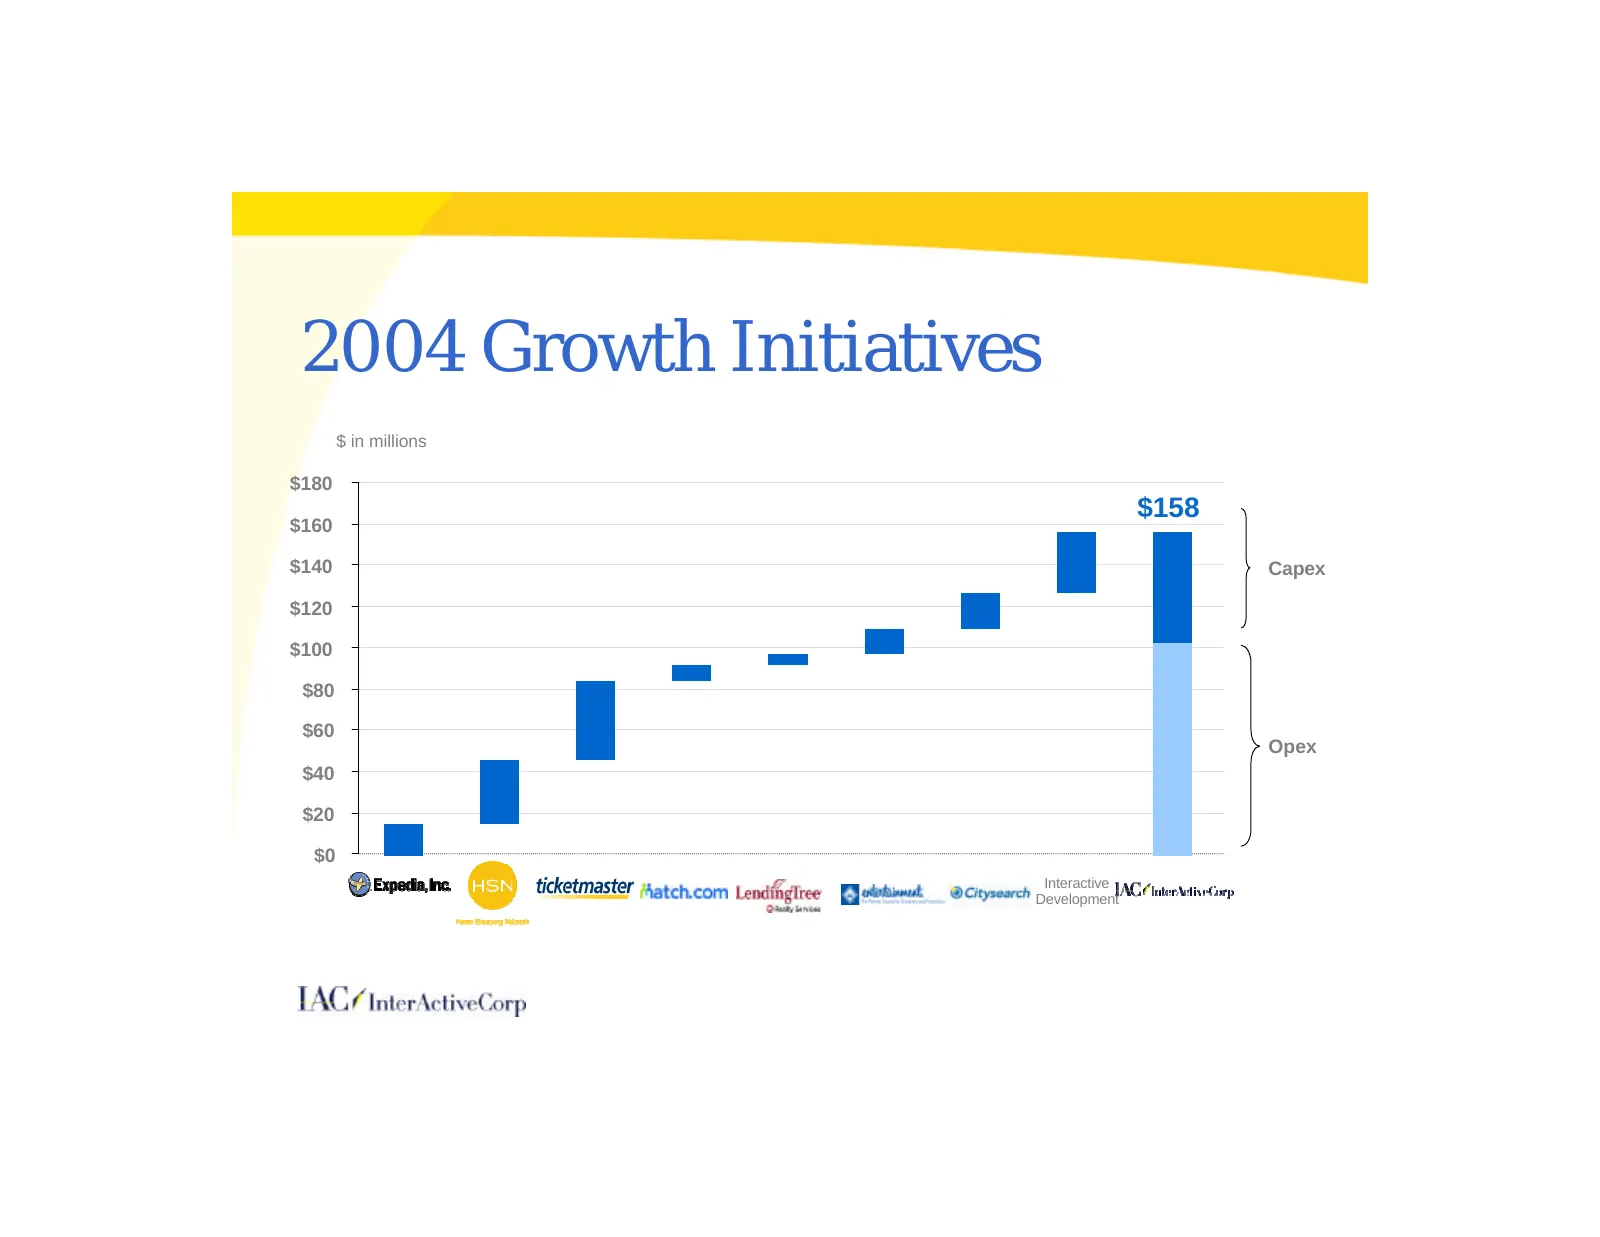
Slide 30: 2004 Growth Initiatives
2004 Growth Initiatives $ in millions $180 $158 $160 $140 Capex $120 $100 $80 $60 Opex $40 $20 $0 Interactive Development
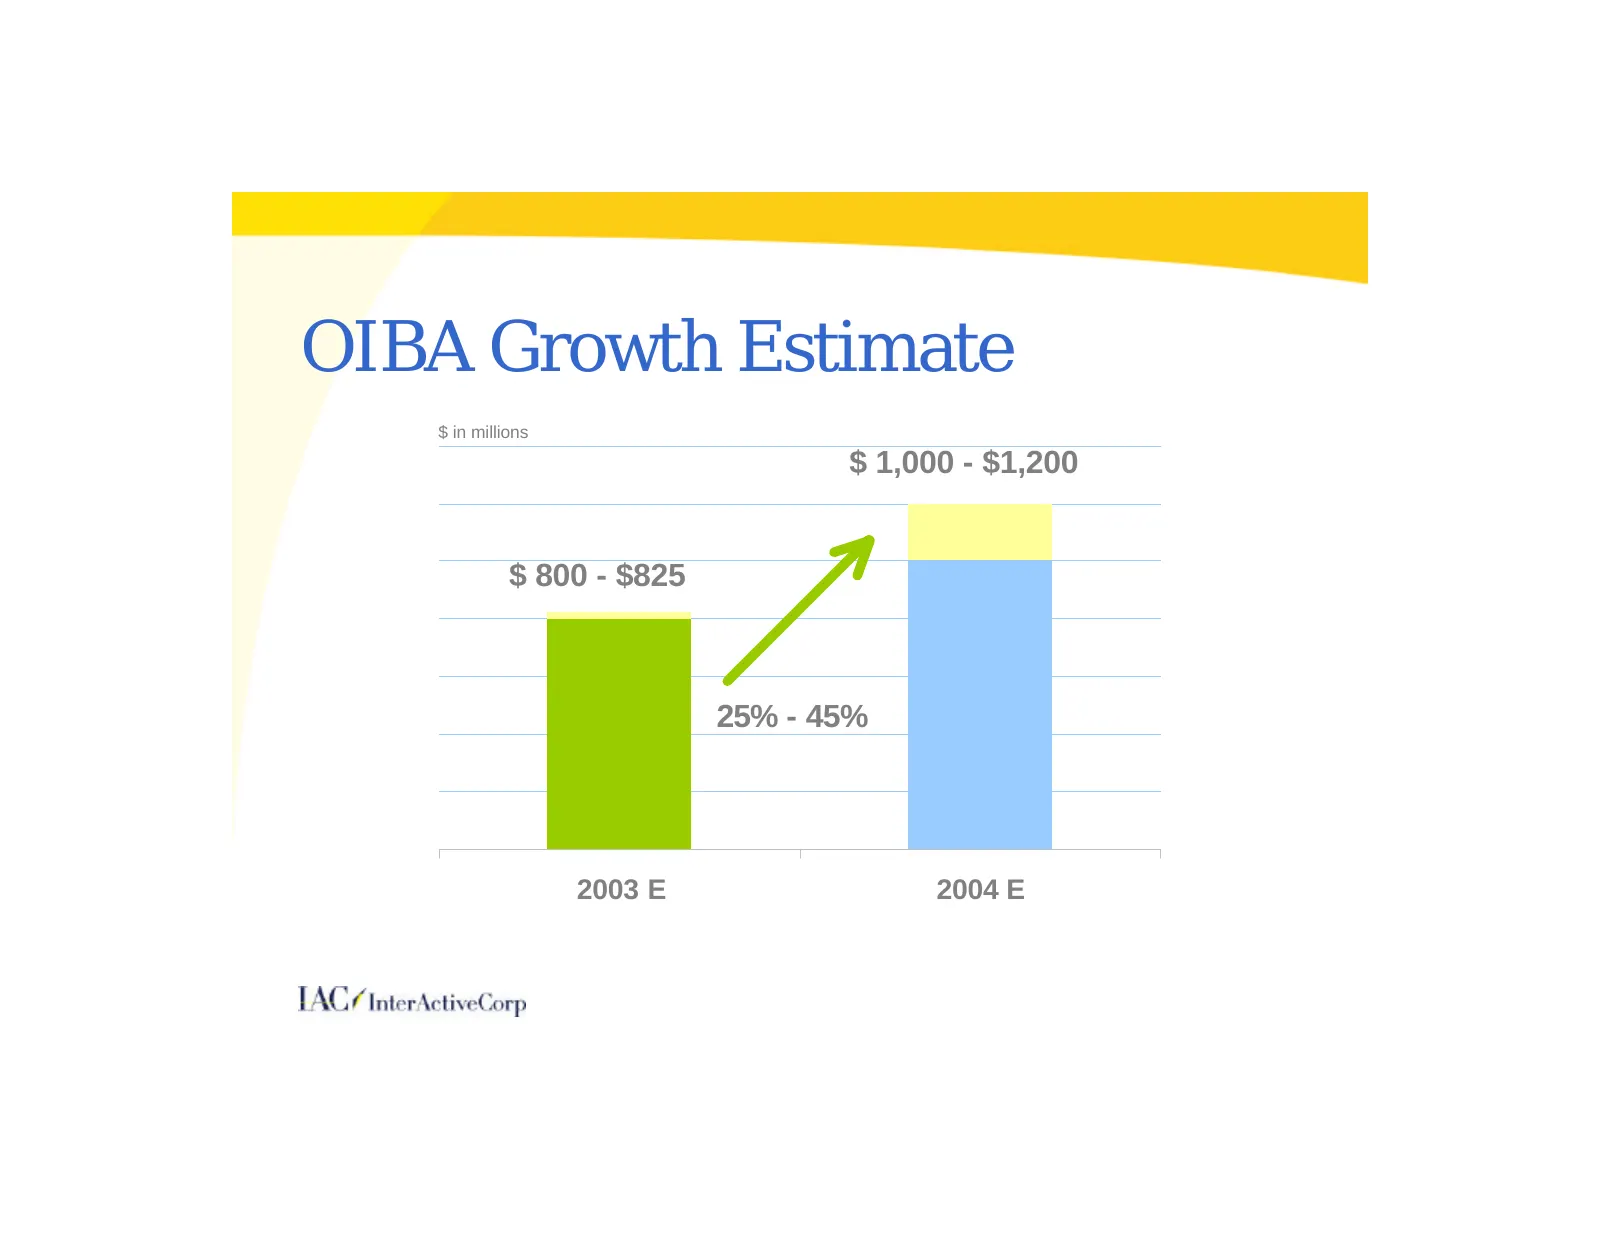
Slide 31: OIBA Growth Estimate
OIBA Growth Estimate $ in millions $ 1,000 - $1,200 $ 800 - $825 25% - 45% 2003 E 2004 E
Slide 32: Perspective
Perspective § Focus on near term and long term financial performance § Significant free cash flow generation § Strong balance sheet § Use business leverage to invest in growth initiatives
Slide 33: Tom McInerney
Tom McInerney President & CEO
Slide 34: Overview
Overview § Very large market opportunity § Unique combination of assets § Competitive momentum § Clear strategies within our control § Expansion opportunities which leverage unique position
Slide 35: Electronic Retailing Today
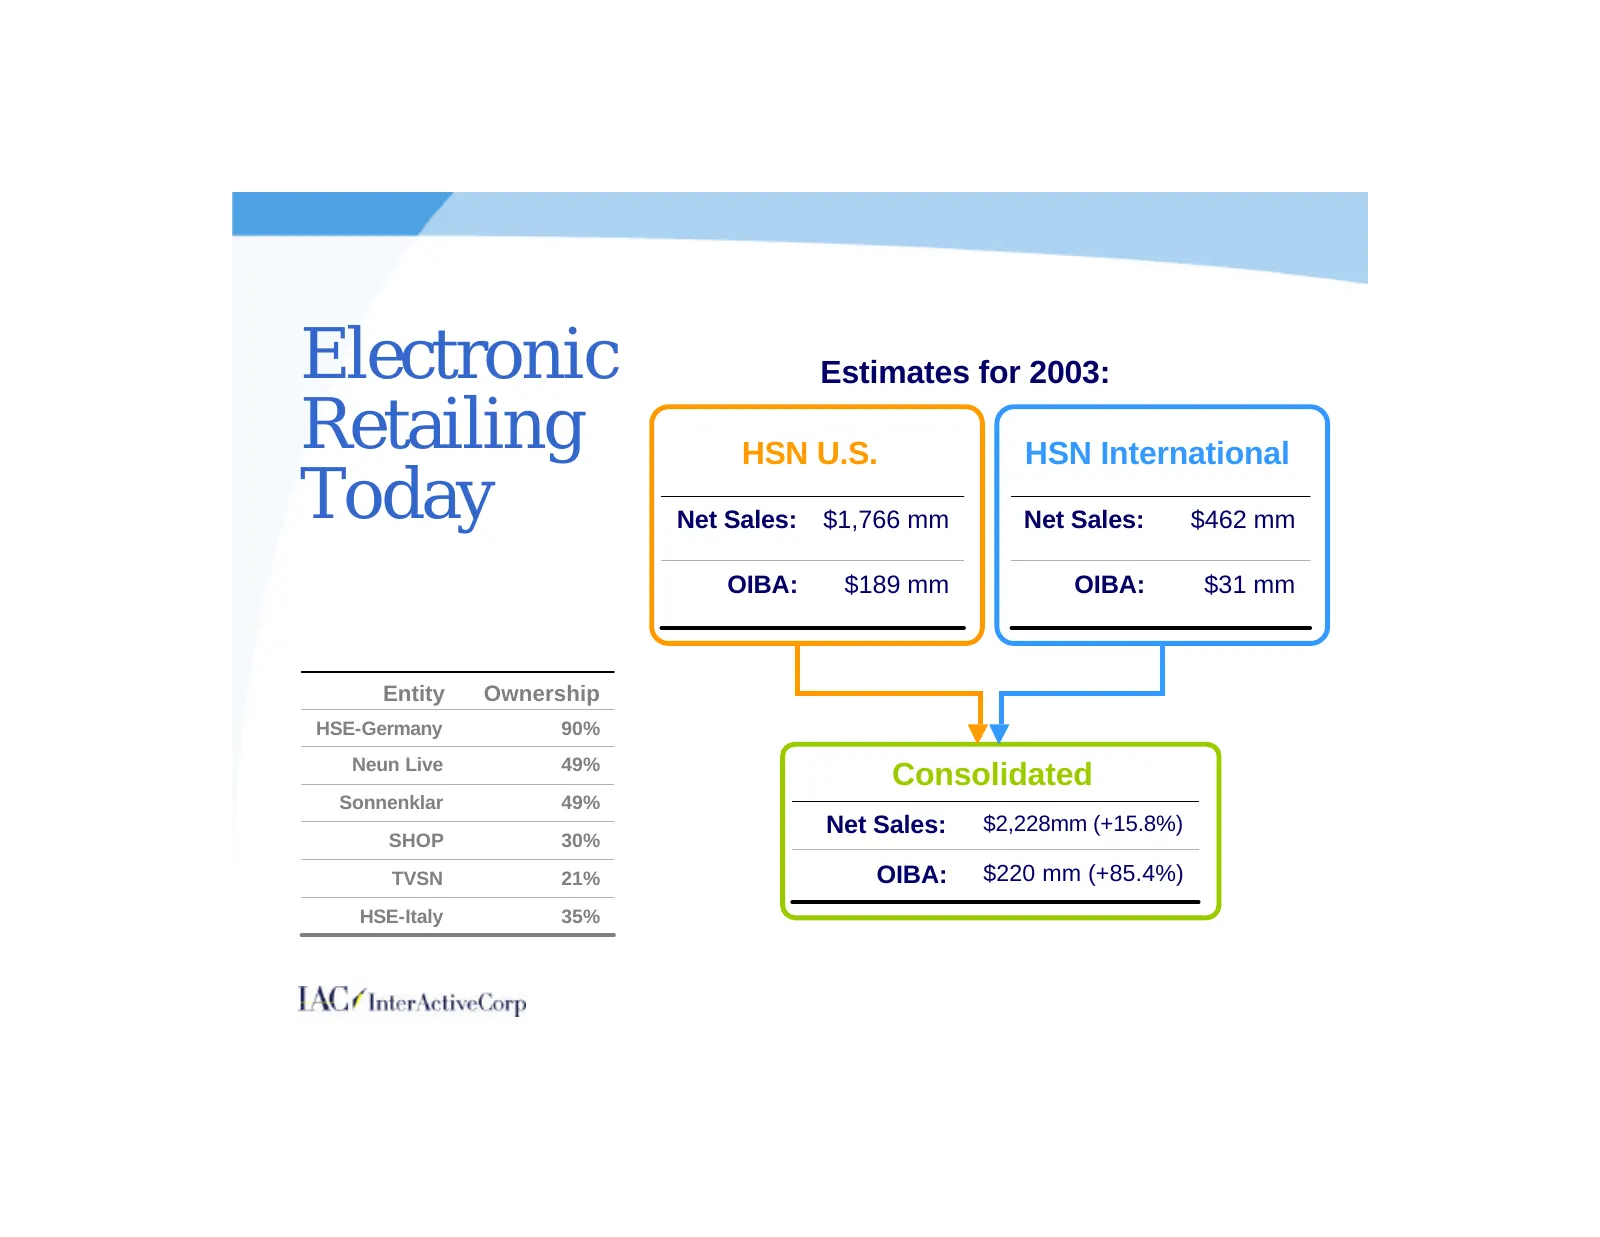
Electronic Estimates for 2003: Retailing HSN U.S. HSN International Today Net Sales: $1,766 mm Net Sales: $462 mm OIBA: $189 mm OIBA: $31 mm Entity Ownership HSE-Germany 90% Neun Live 49% Consolidated Sonnenklar 49% Net Sales: $2,228mm (+15.8%) SHOP 30% TVSN 21% OIBA: $220 mm (+85.4%) HSE-Italy 35%
Slide 36: HSN U.S. Business Overview
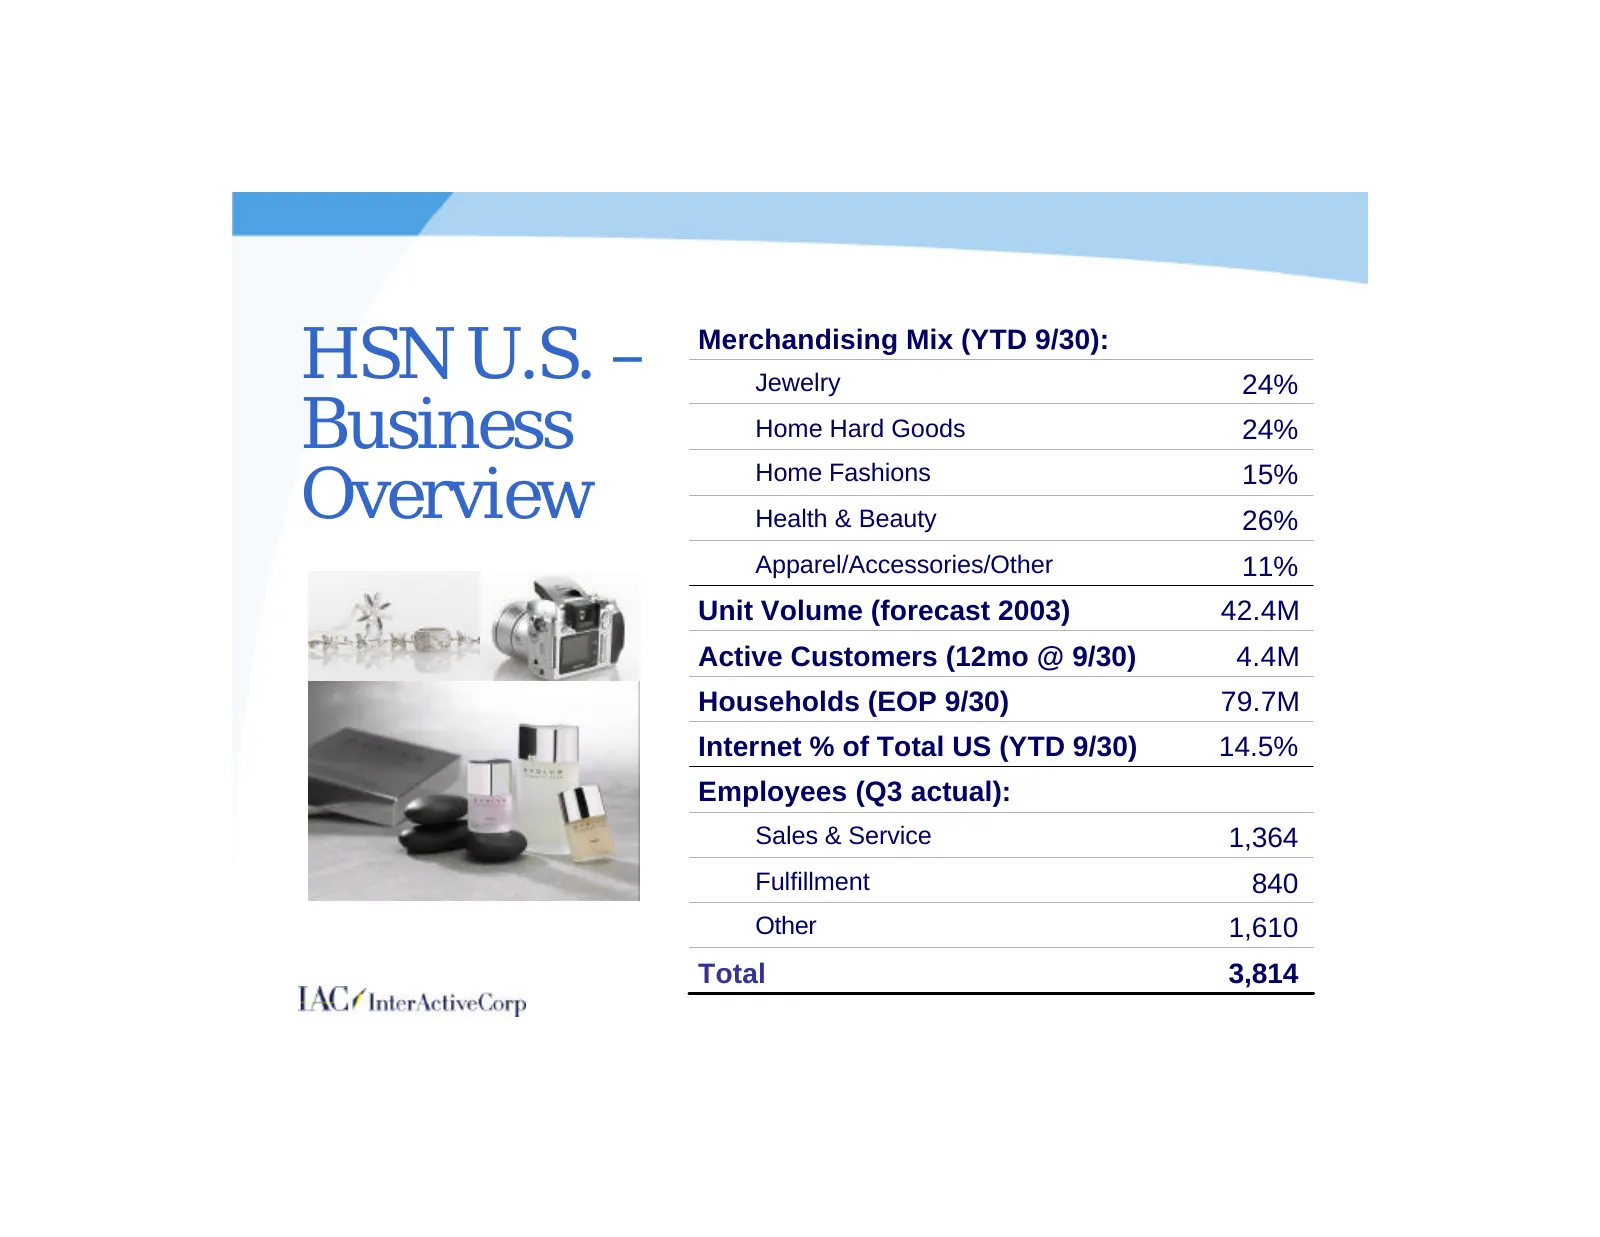
HSN U.S. – Merchandising Mix (YTD 9/30): Jewelry 24% Business Home Hard Goods 24% Overview Home Fashions 15% Health & Beauty 26% Apparel/Accessories/Other 11% Unit Volume (forecast 2003) 42.4M Active Customers (12mo @ 9/30) 4.4M Households (EOP 9/30) 79.7M Internet % of Total US (YTD 9/30) 14.5% Emp
Slide 37: HSN U.S. Financial Summary
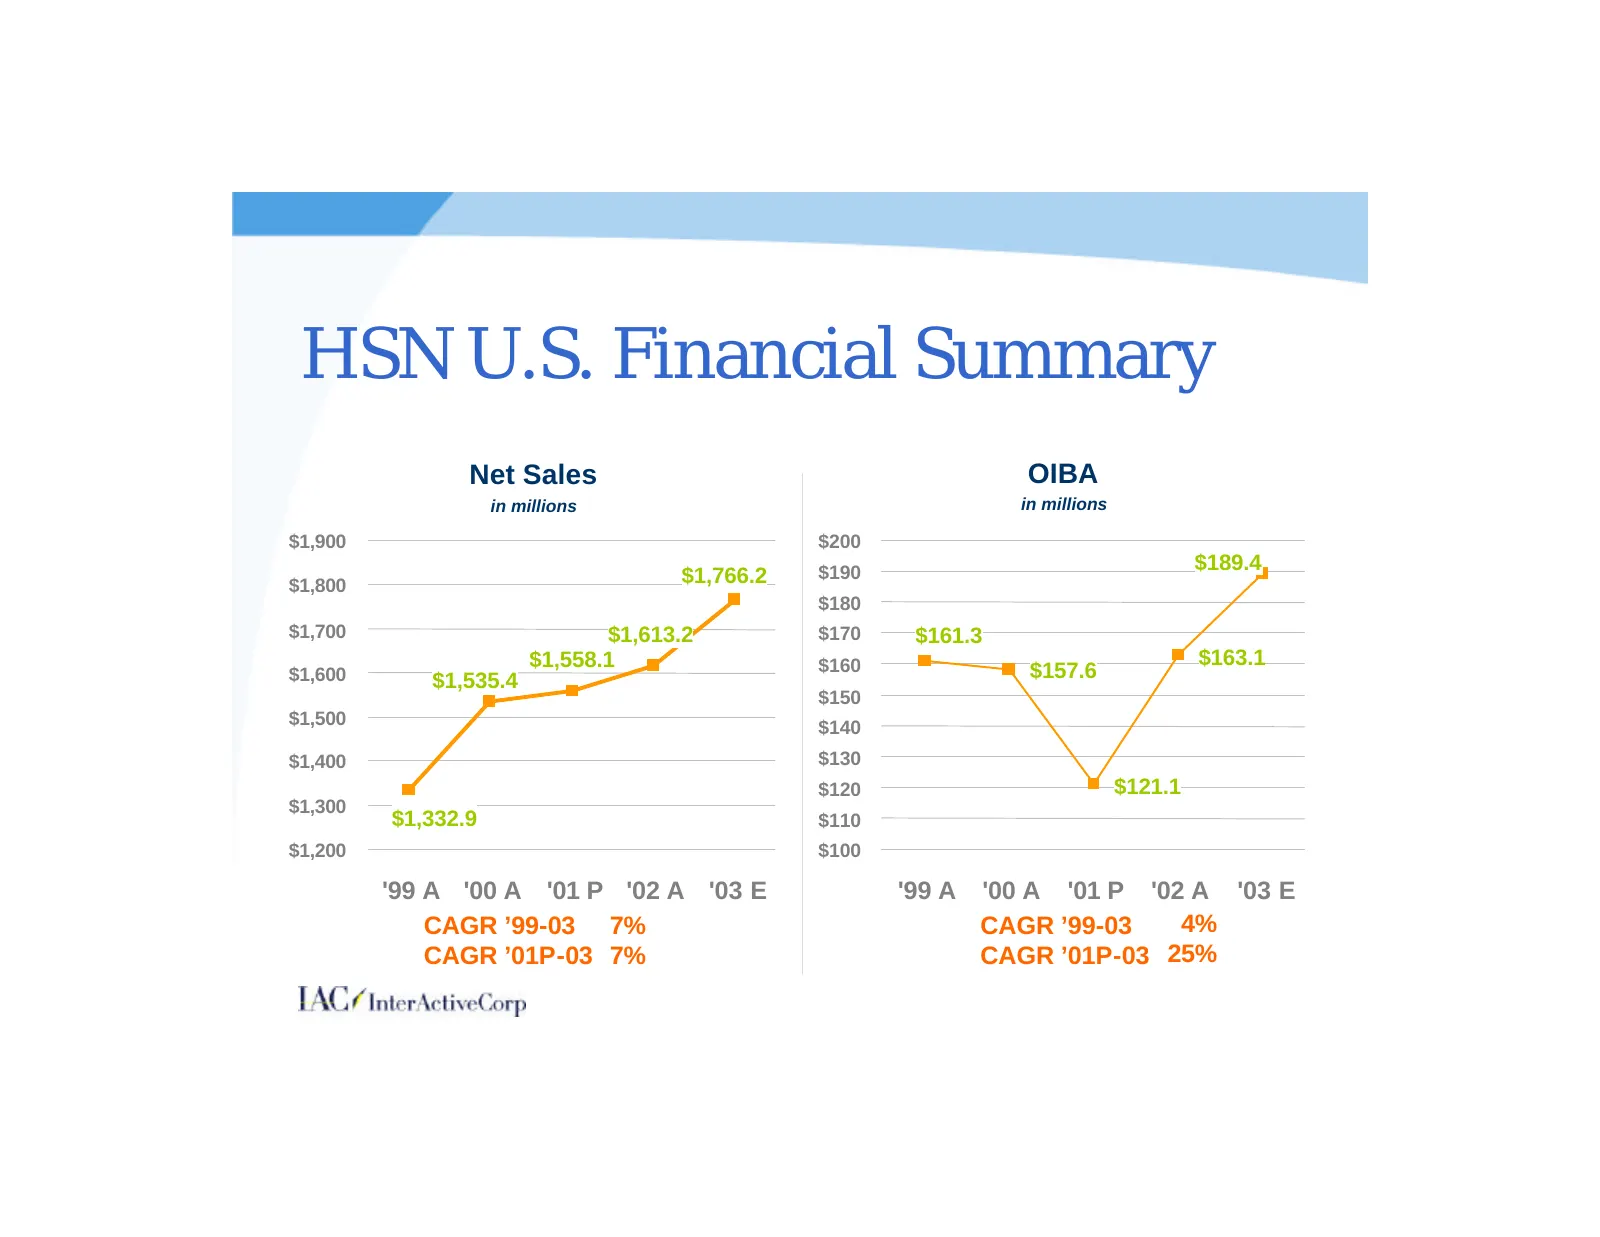
HSN U.S. Financial Summary Net Sales OIBA in millions in millions $1,900 $200 $190 $189.4 $1,800 $1,766.2 $180 $1,700 $1,613.2 $170 $161.3 $1,558.1 $160 $163.1 $1,600 $1,535.4 $157.6 $150 $1,500 $140 $1,400 $130 $120 $121.1 $1,300 $1,332.9 $110 $1,200 $100 '99 A '00 A '01 P '02 A '03 E '99 A '00 A '
Slide 38: Television Retailing Grows Faster
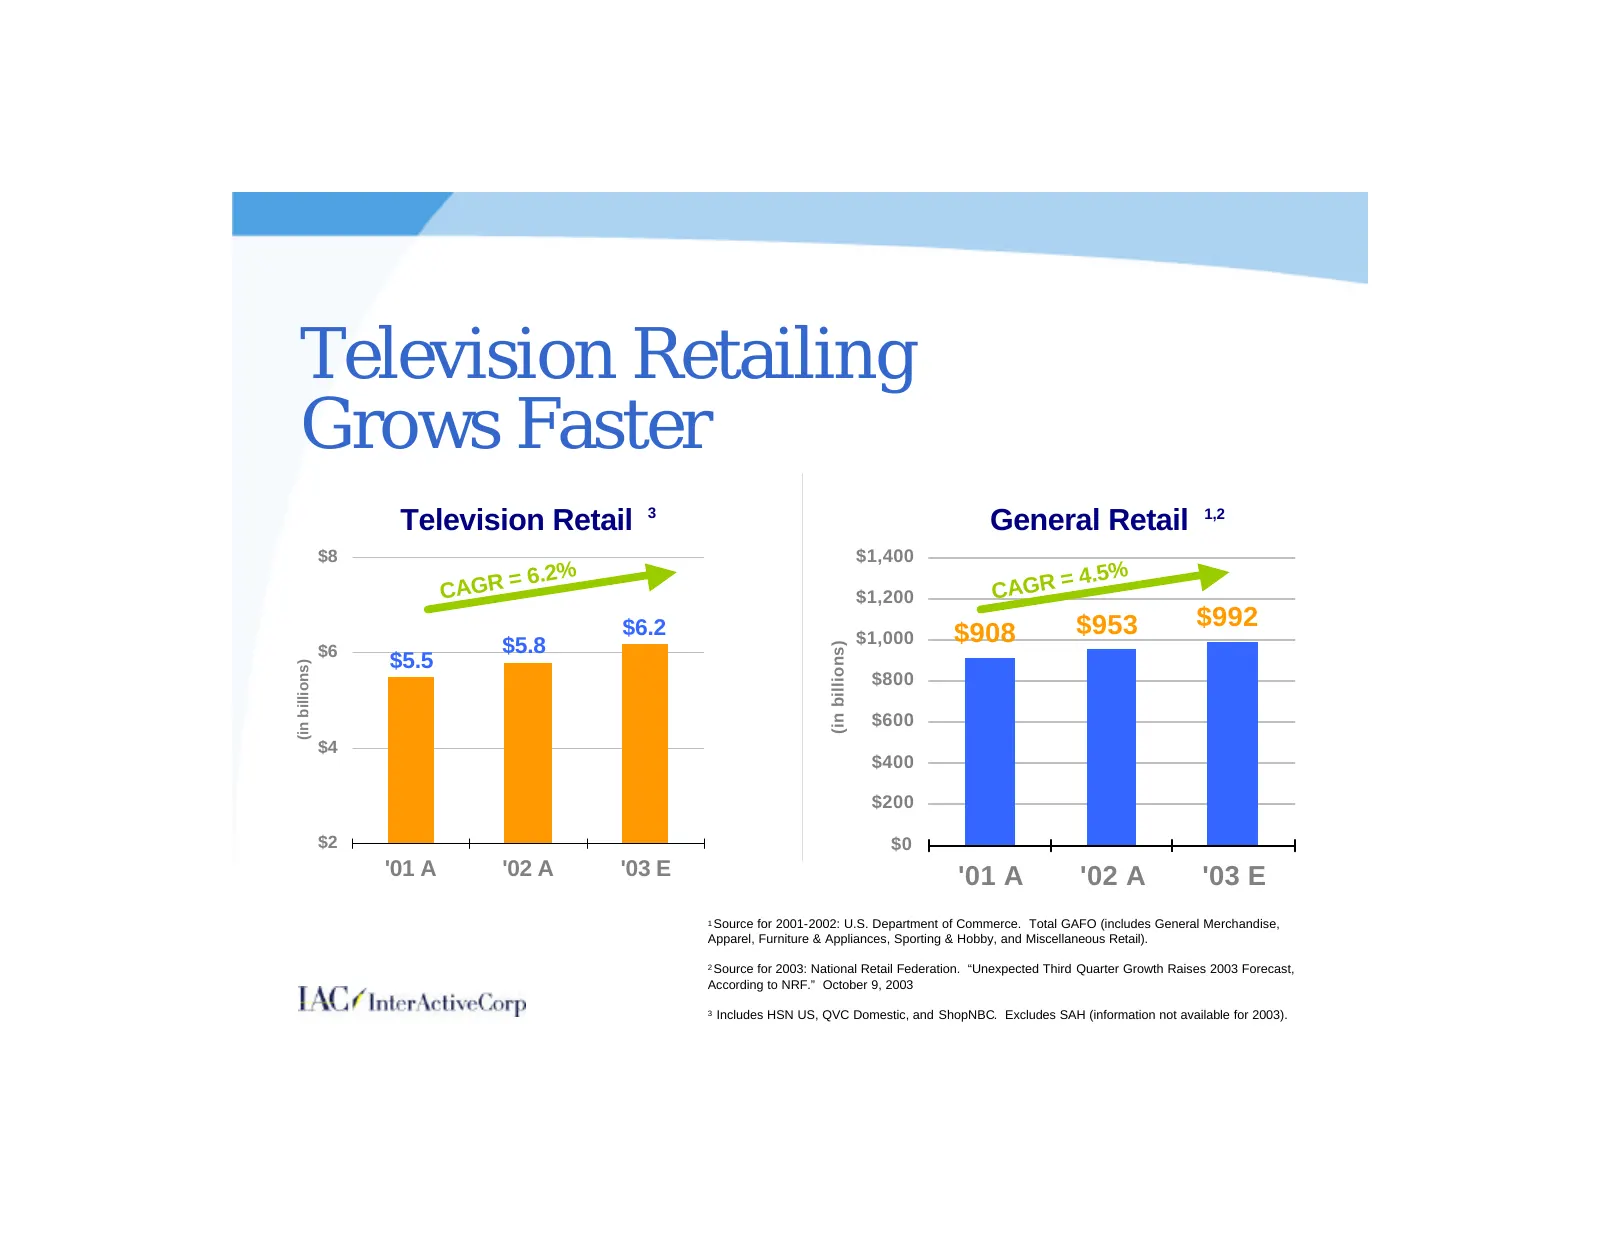
Television Retailing Grows Faster Television Retail 3 General Retail 1,2 $8 $1,400 = 6.2% = 4.5% CAGR $1,200 CAGR $6.2 $953 $992 $5.8 $1,000 $908 (in billions) $6 $5.5 (in billions) $800 $600 $4 $400 $200 $2 $0 '01 A '02 A '03 E '01 A '02 A '03 E 1Source for 2001-2002: U.S. Department of Commerce. T
Slide 39: Electronic Retailing – Domestic Opportunity
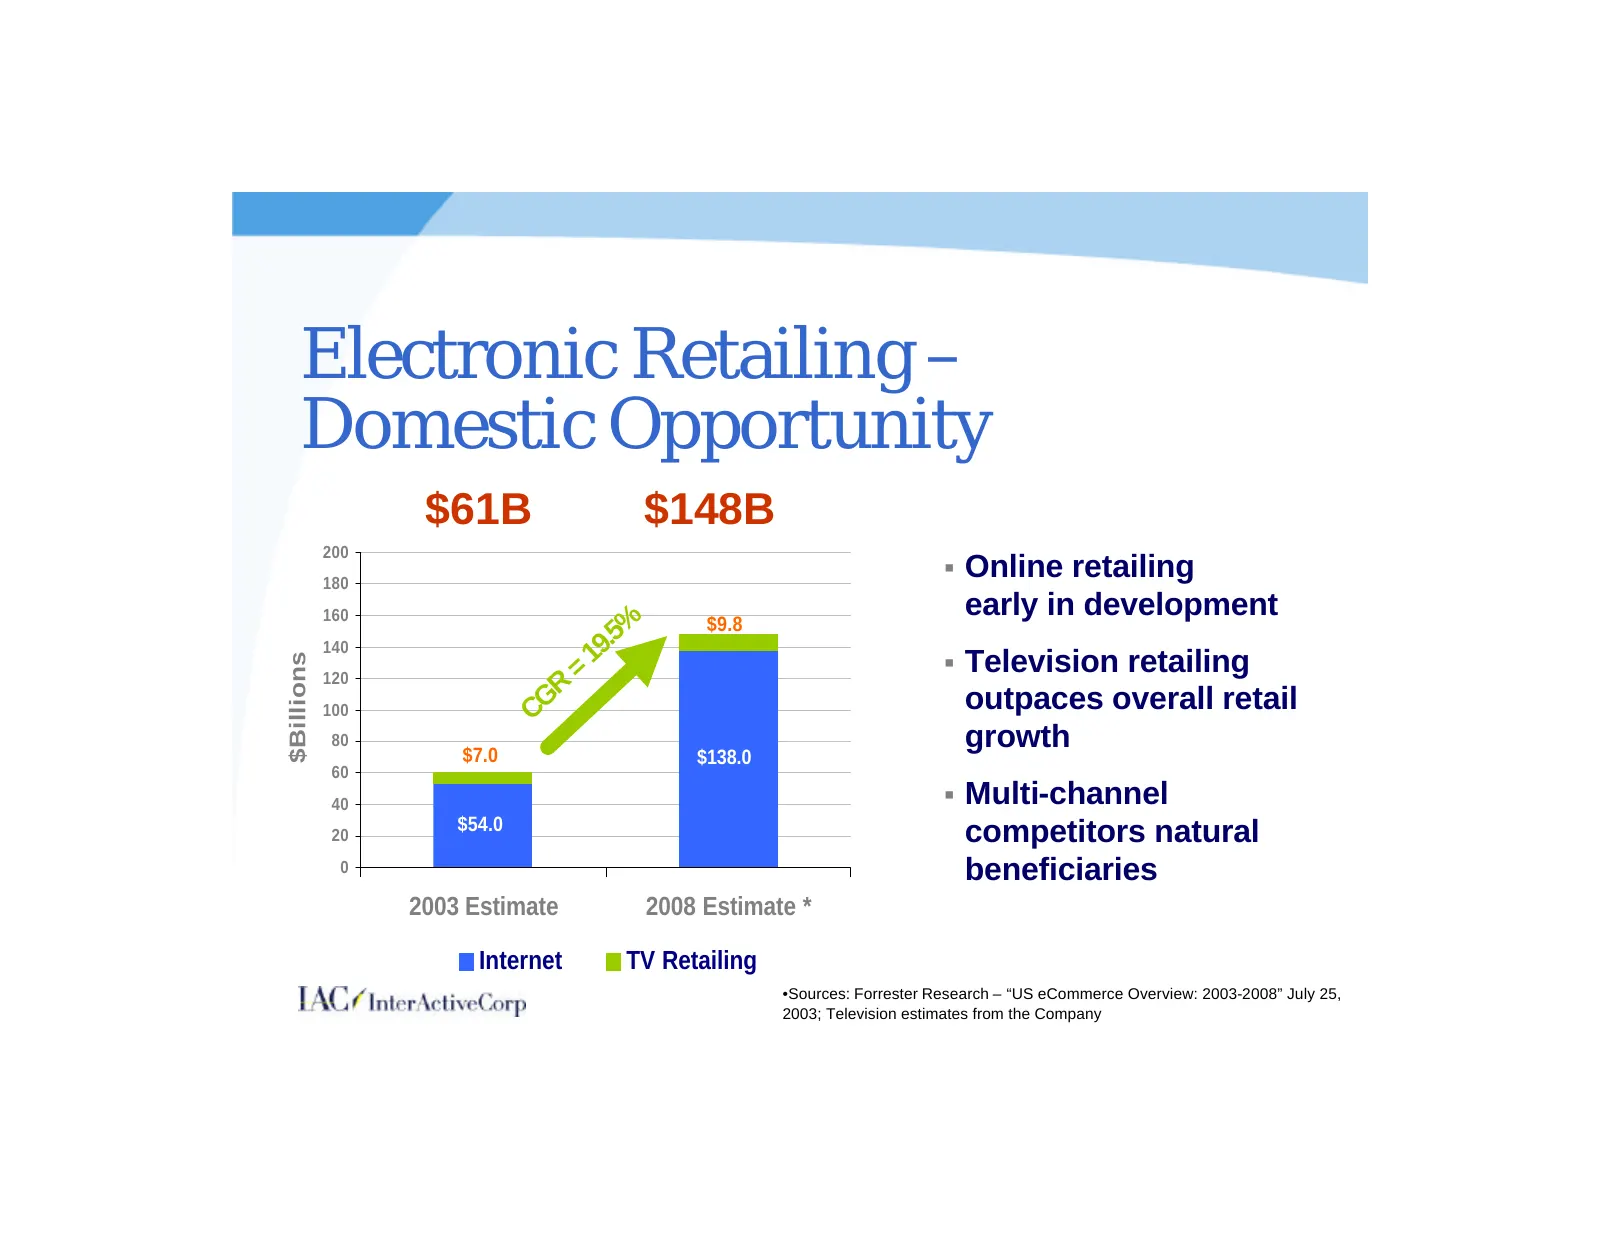
Electronic Retailing – Domestic Opportunity $61B $148B 200 180 § Online retailing 160 early in development .5% $9.8 140 19 § Television retailing $Billions 120 = R outpaces overall retail 100 CG 80 $7.0 growth $138.0 60 40 § Multi-channel $54.0 20 competitors natural 0 beneficiaries 2003 Estimate 20
Slide 40: HSN U.S. Growing Faster than the Market
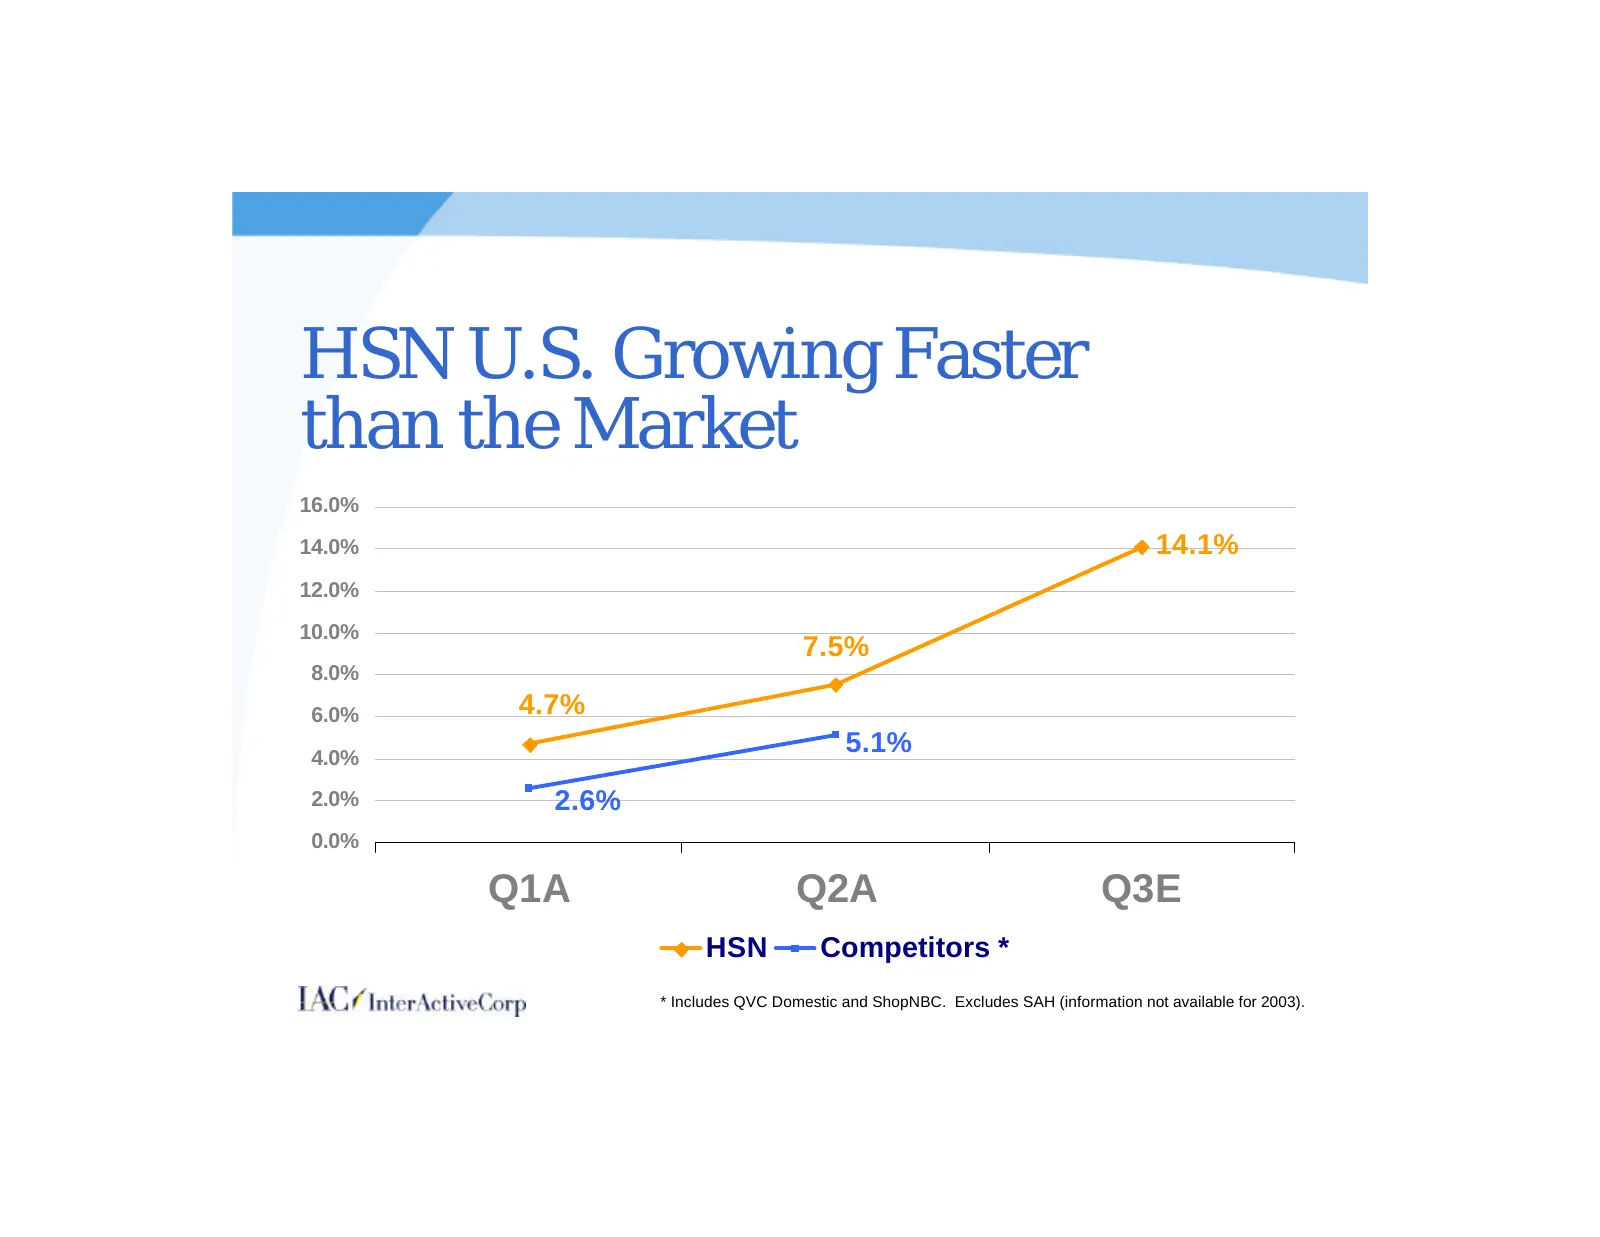
HSN U.S. Growing Faster than the Market 16.0% 14.0% 14.1% 12.0% 10.0% 7.5% 8.0% 6.0% 4.7% 4.0% 5.1% 2.0% 2.6% 0.0% Q1A Q2A Q3E HSN Competitors * * Includes QVC Domestic and ShopNBC. Excludes SAH (information not available for 2003).
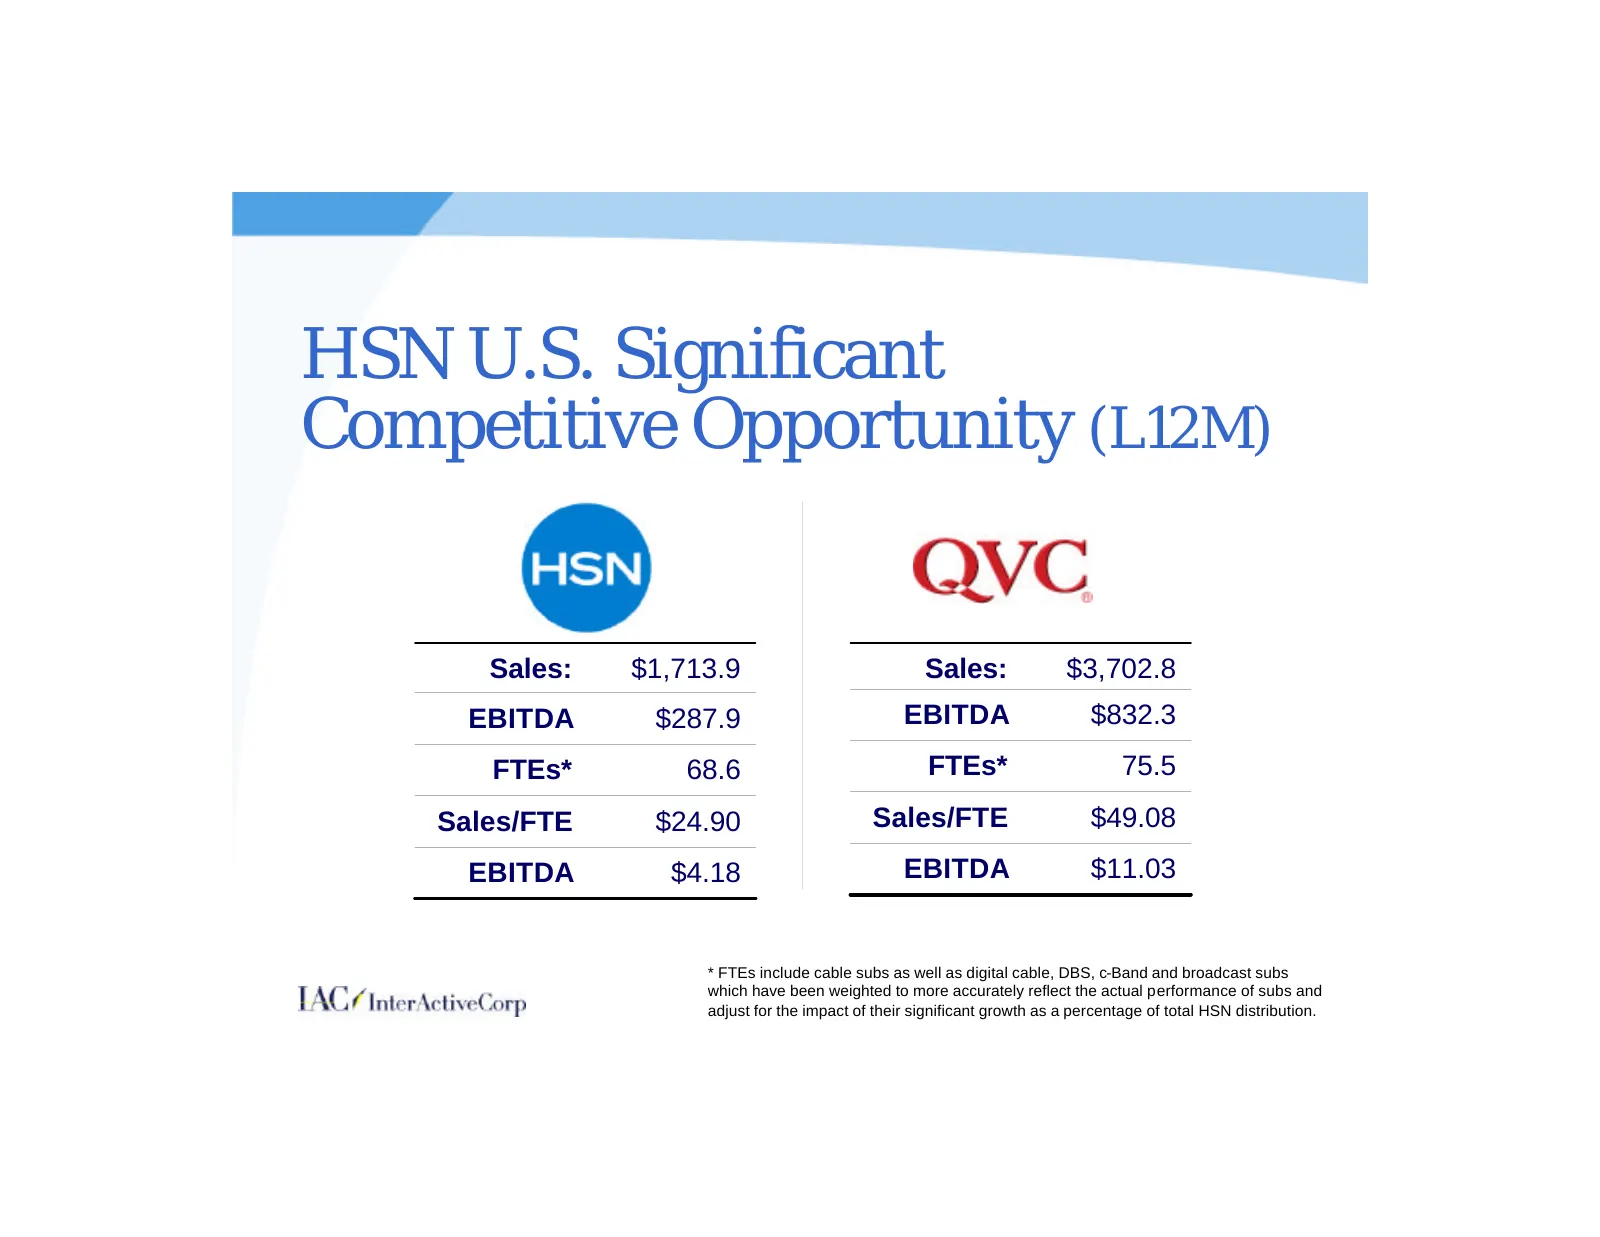
Slide 41: HSN U.S. Significant Competitive Opportunity
HSN U.S. Significant Competitive Opportunity (L12M) Sales: $1,713.9 Sales: $3,702.8 EBITDA $287.9 EBITDA $832.3 FTEs* 68.6 FTEs* 75.5 Sales/FTE $24.90 Sales/FTE $49.08 EBITDA $4.18 EBITDA $11.03 * FTEs include cable subs as well as digital cable, DBS, c-Band and broadcast subs which have been weight
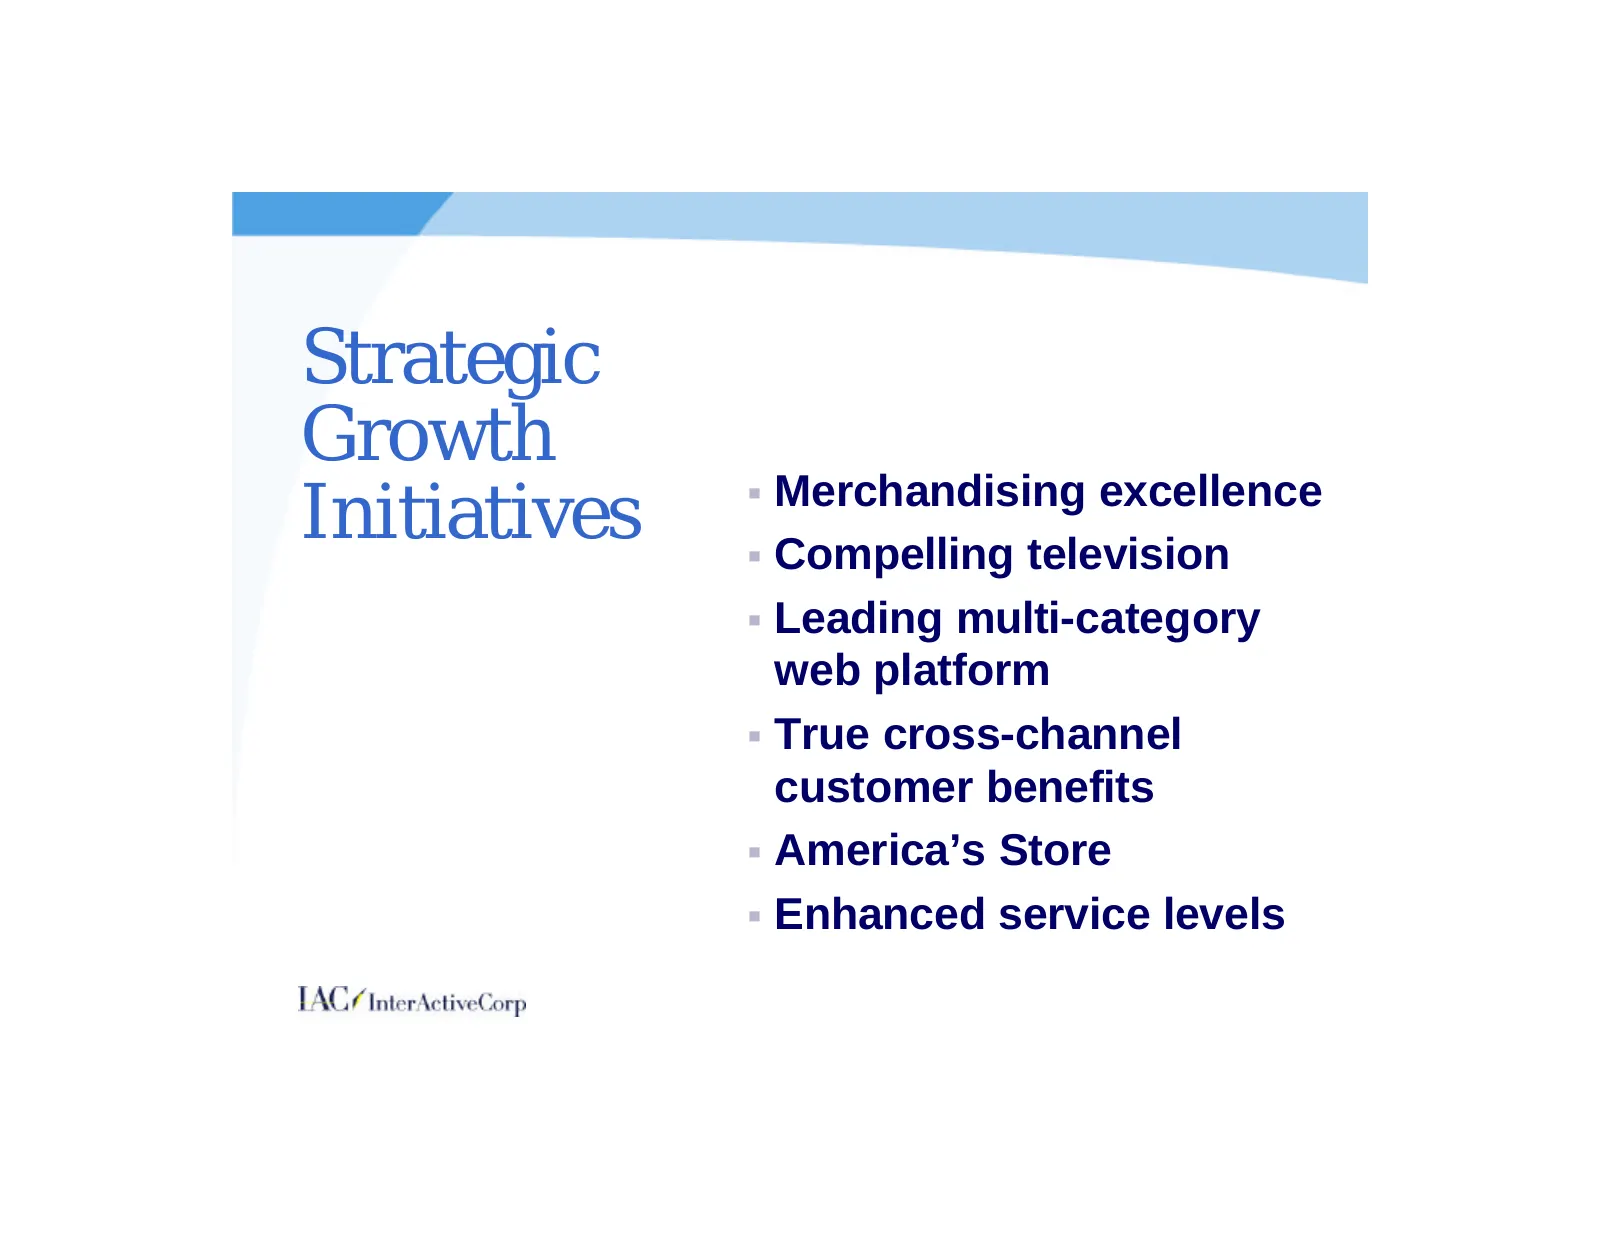
Slide 42: Strategic Growth Initiatives
Strategic Growth Initiatives § Merchandising excellence § Compelling television § Leading multi-category web platform § True cross-channel customer benefits § America’s Store § Enhanced service levels
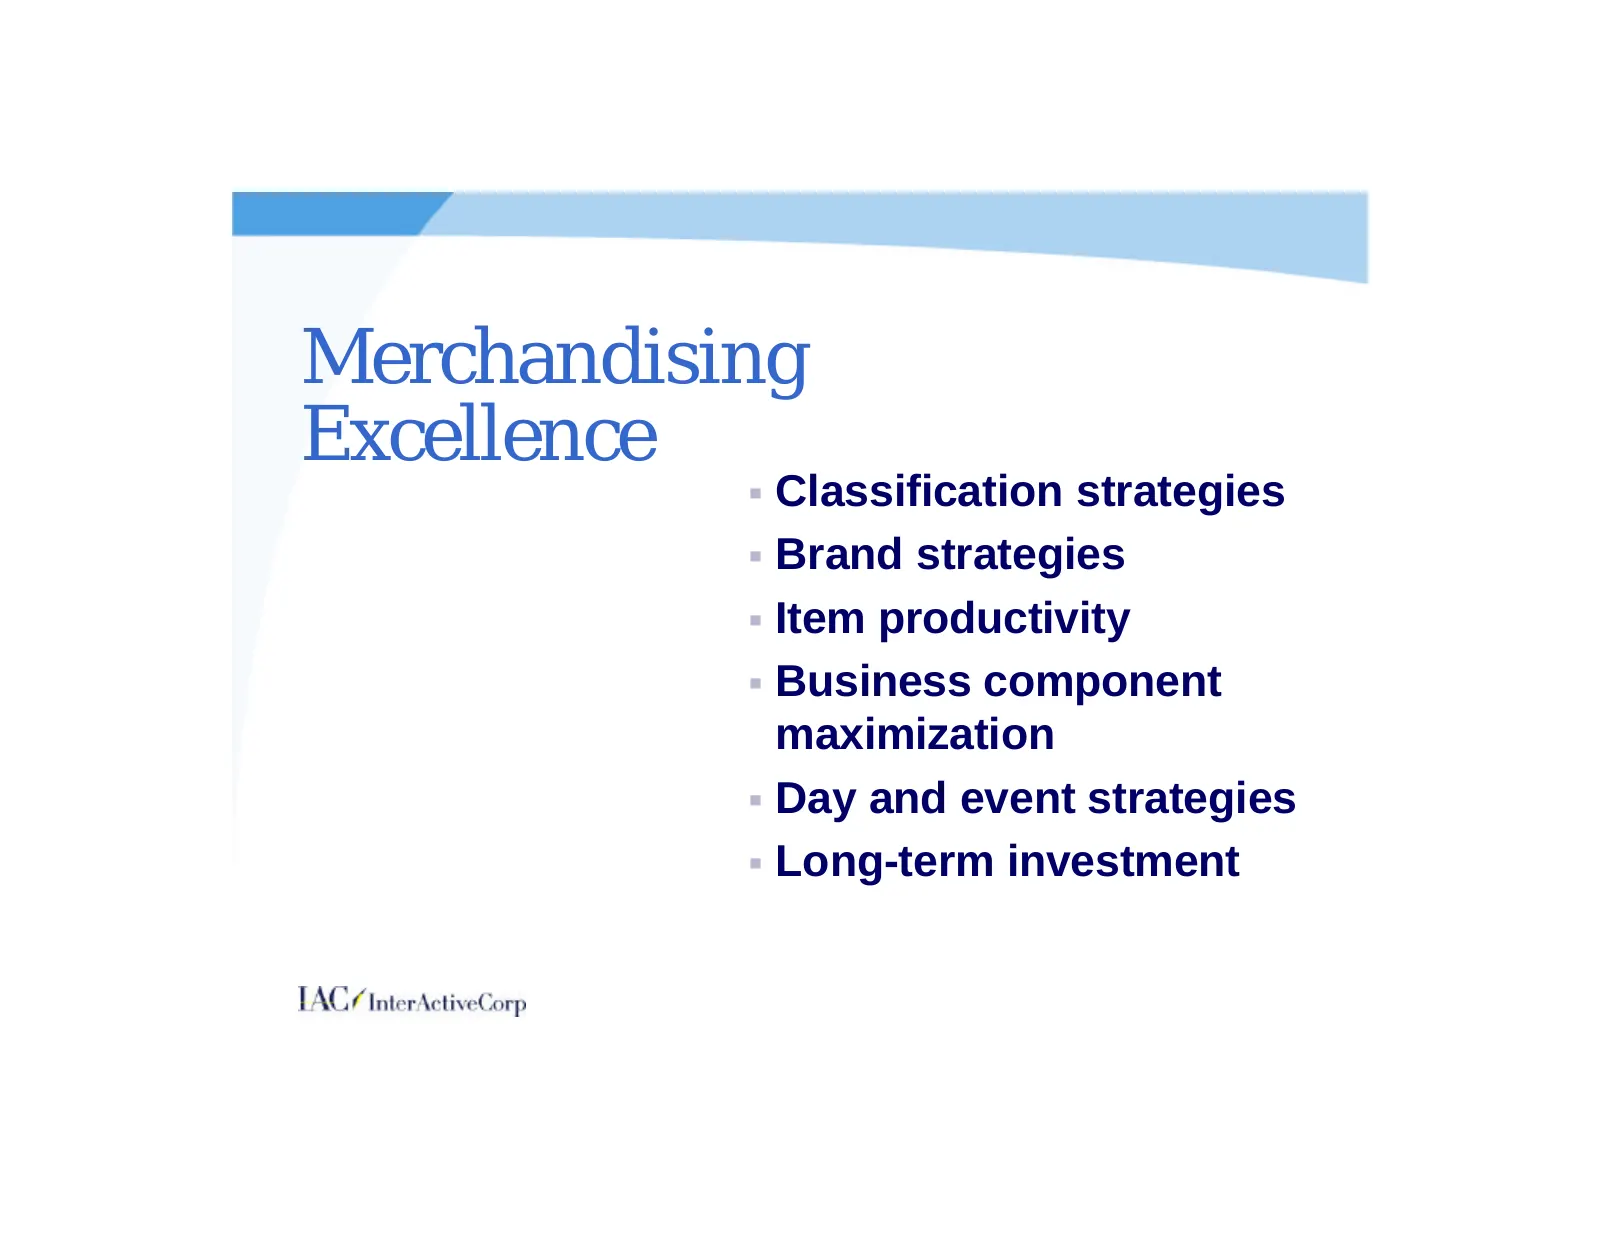
Slide 43: Merchandising Excellence
Merchandising Excellence § Classification strategies § Brand strategies § Item productivity § Business component maximization § Day and event strategies § Long-term investment
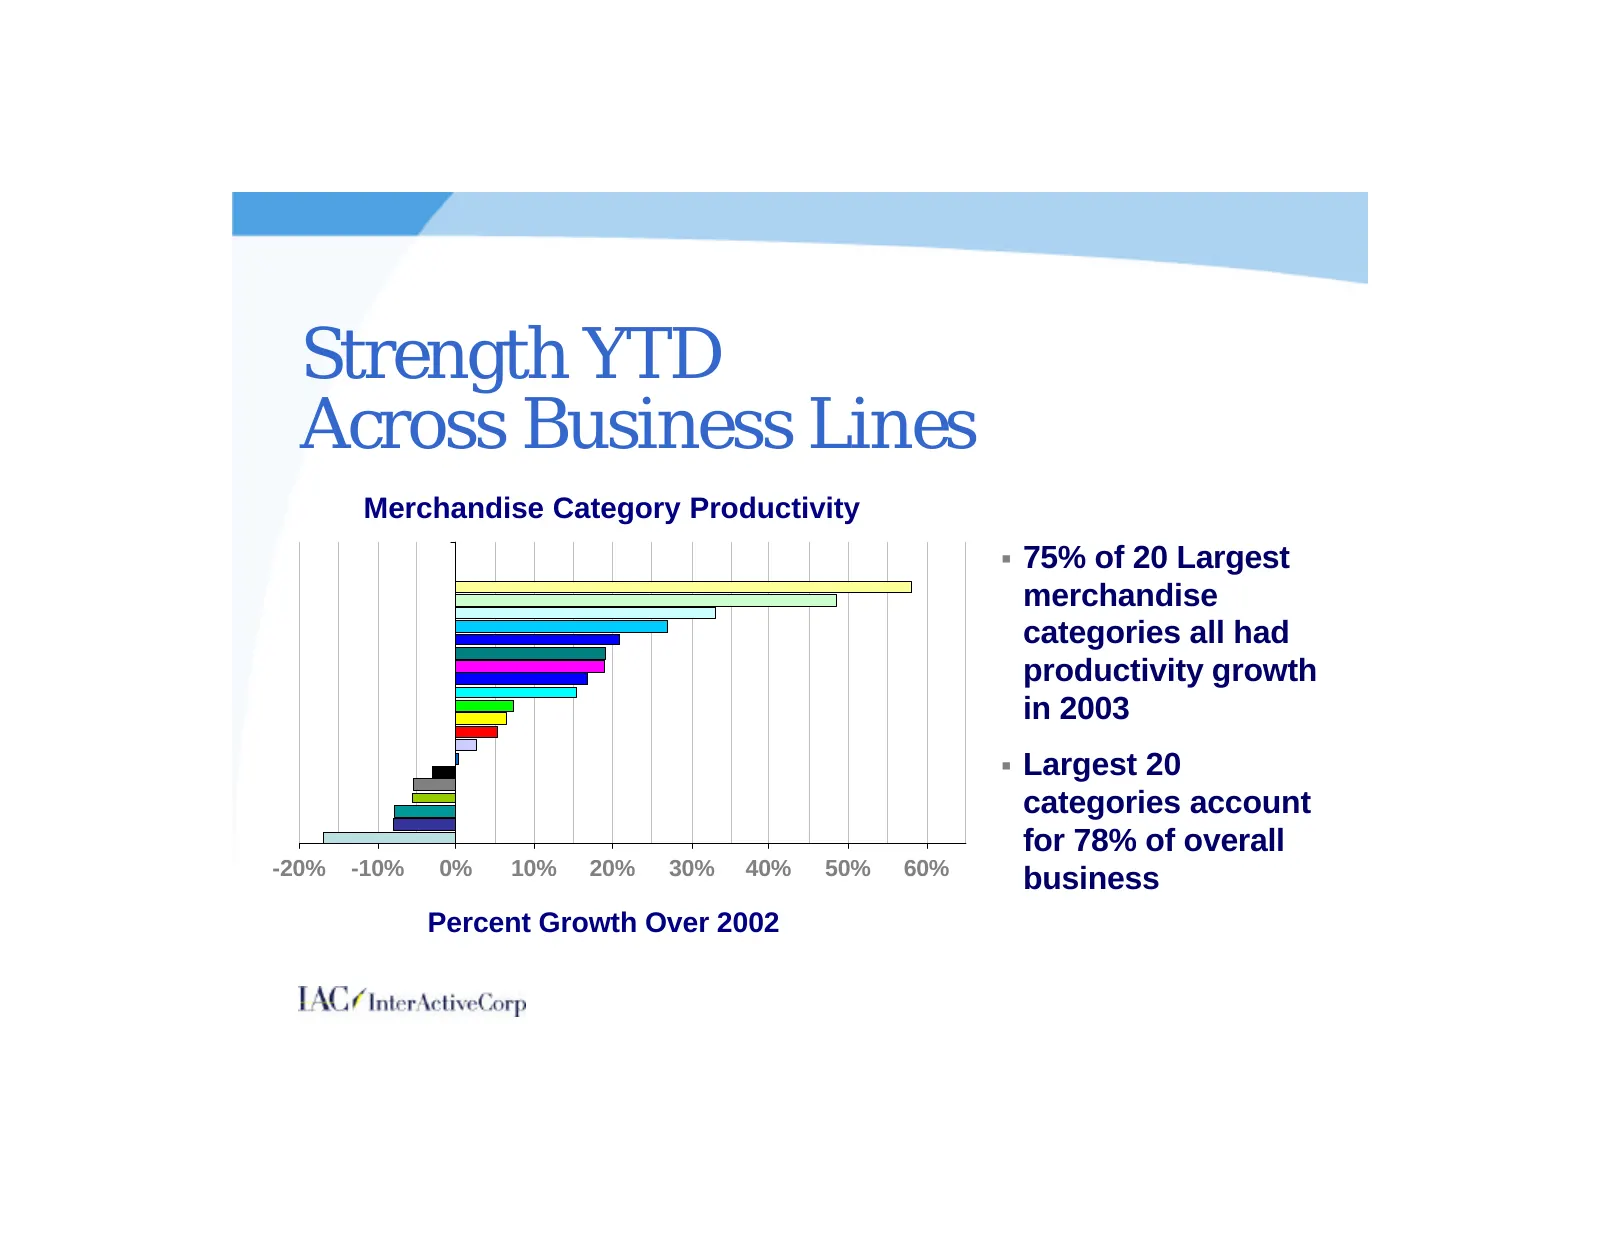
Slide 44: Strength YTD Across Business Lines
Strength YTD Across Business Lines Merchandise Category Productivity § 75% of 20 Largest merchandise categories all had productivity growth in 2003 § Largest 20 categories account for 78% of overall -20% -10% 0% 10% 20% 30% 40% 50% 60% business Percent Growth Over 2002
Slide 45: Execution Drives Success
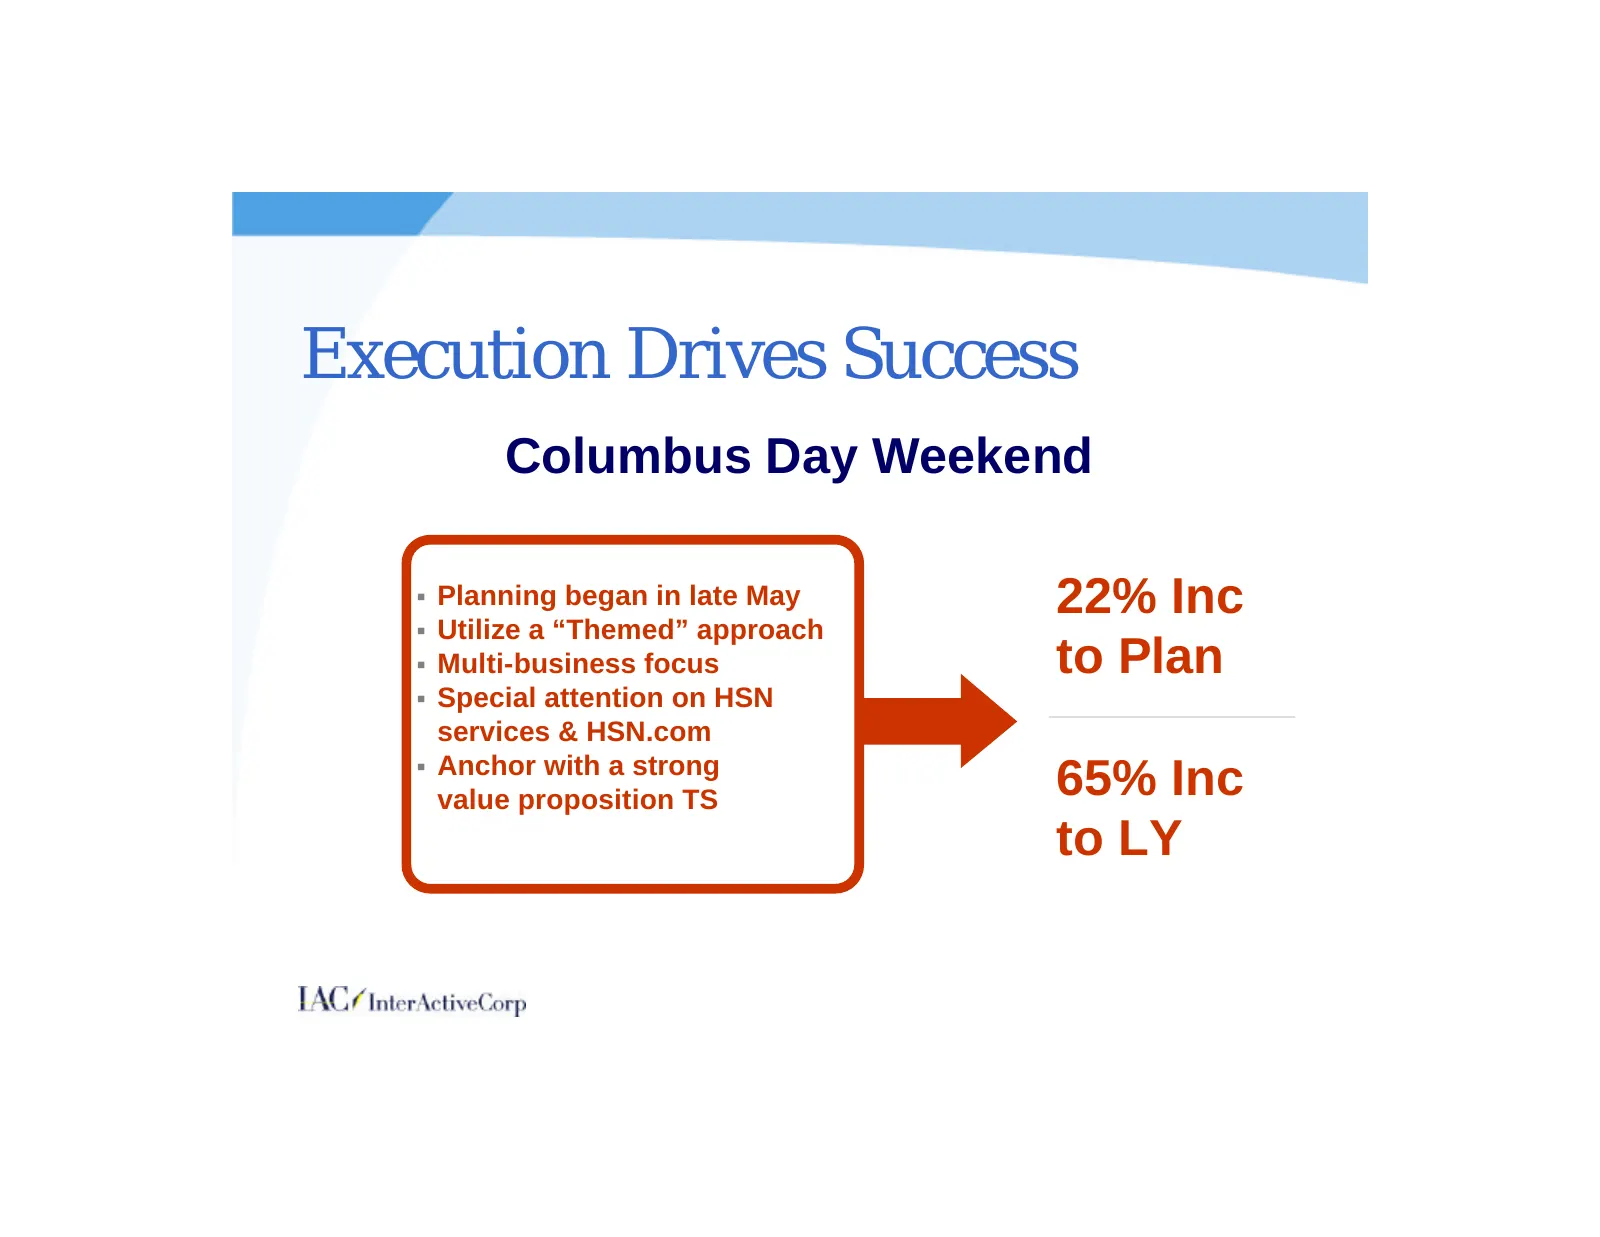
Execution Drives Success Columbus Day Weekend § Planning began in late May 22% Inc § Utilize a “Themed” approach § Multi-business focus to Plan § Special attention on HSN services & HSN.com § Anchor with a strong value proposition TS 65% Inc to LY
Slide 46: Creating the Leading Multi-Category Web Platform
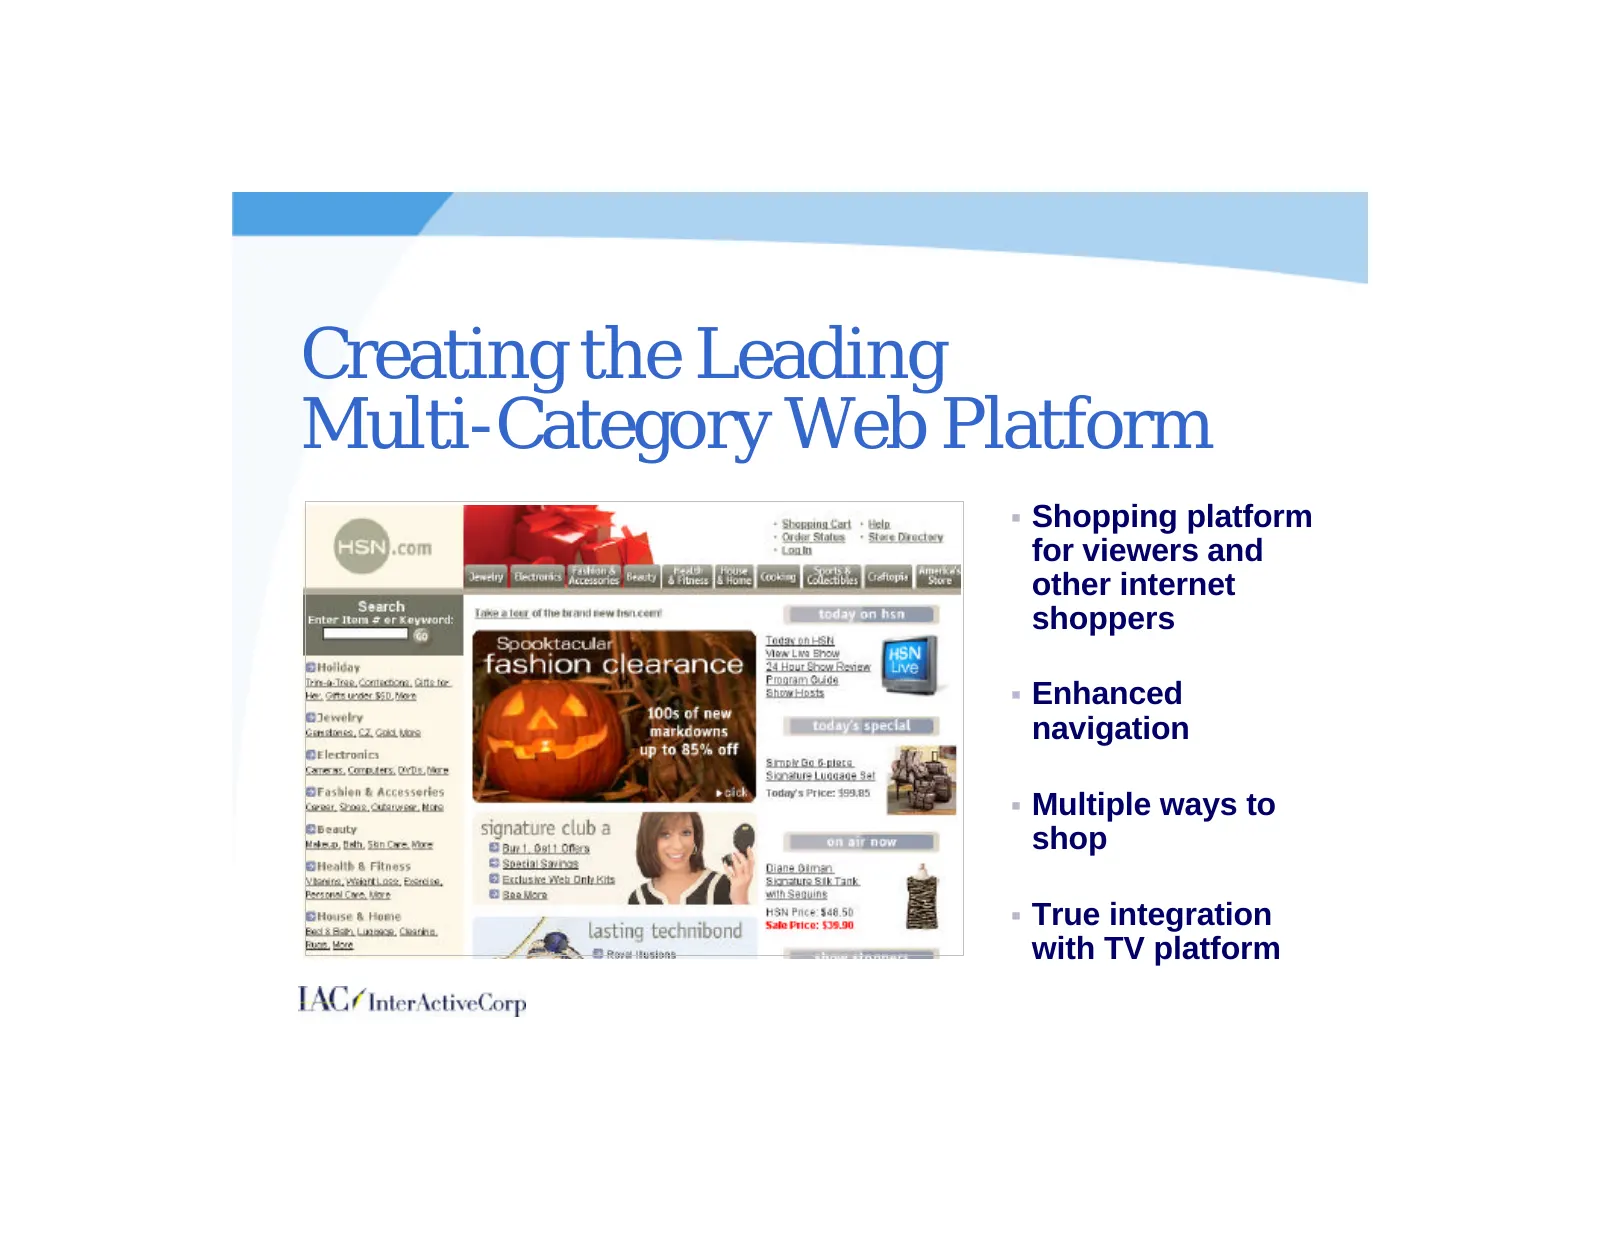
Creating the Leading Multi-Category Web Platform § Shopping platform for viewers and other internet shoppers § Enhanced navigation § Multiple ways to shop § True integration with TV platform
Slide 47: Highly Complimentary Sales Channels
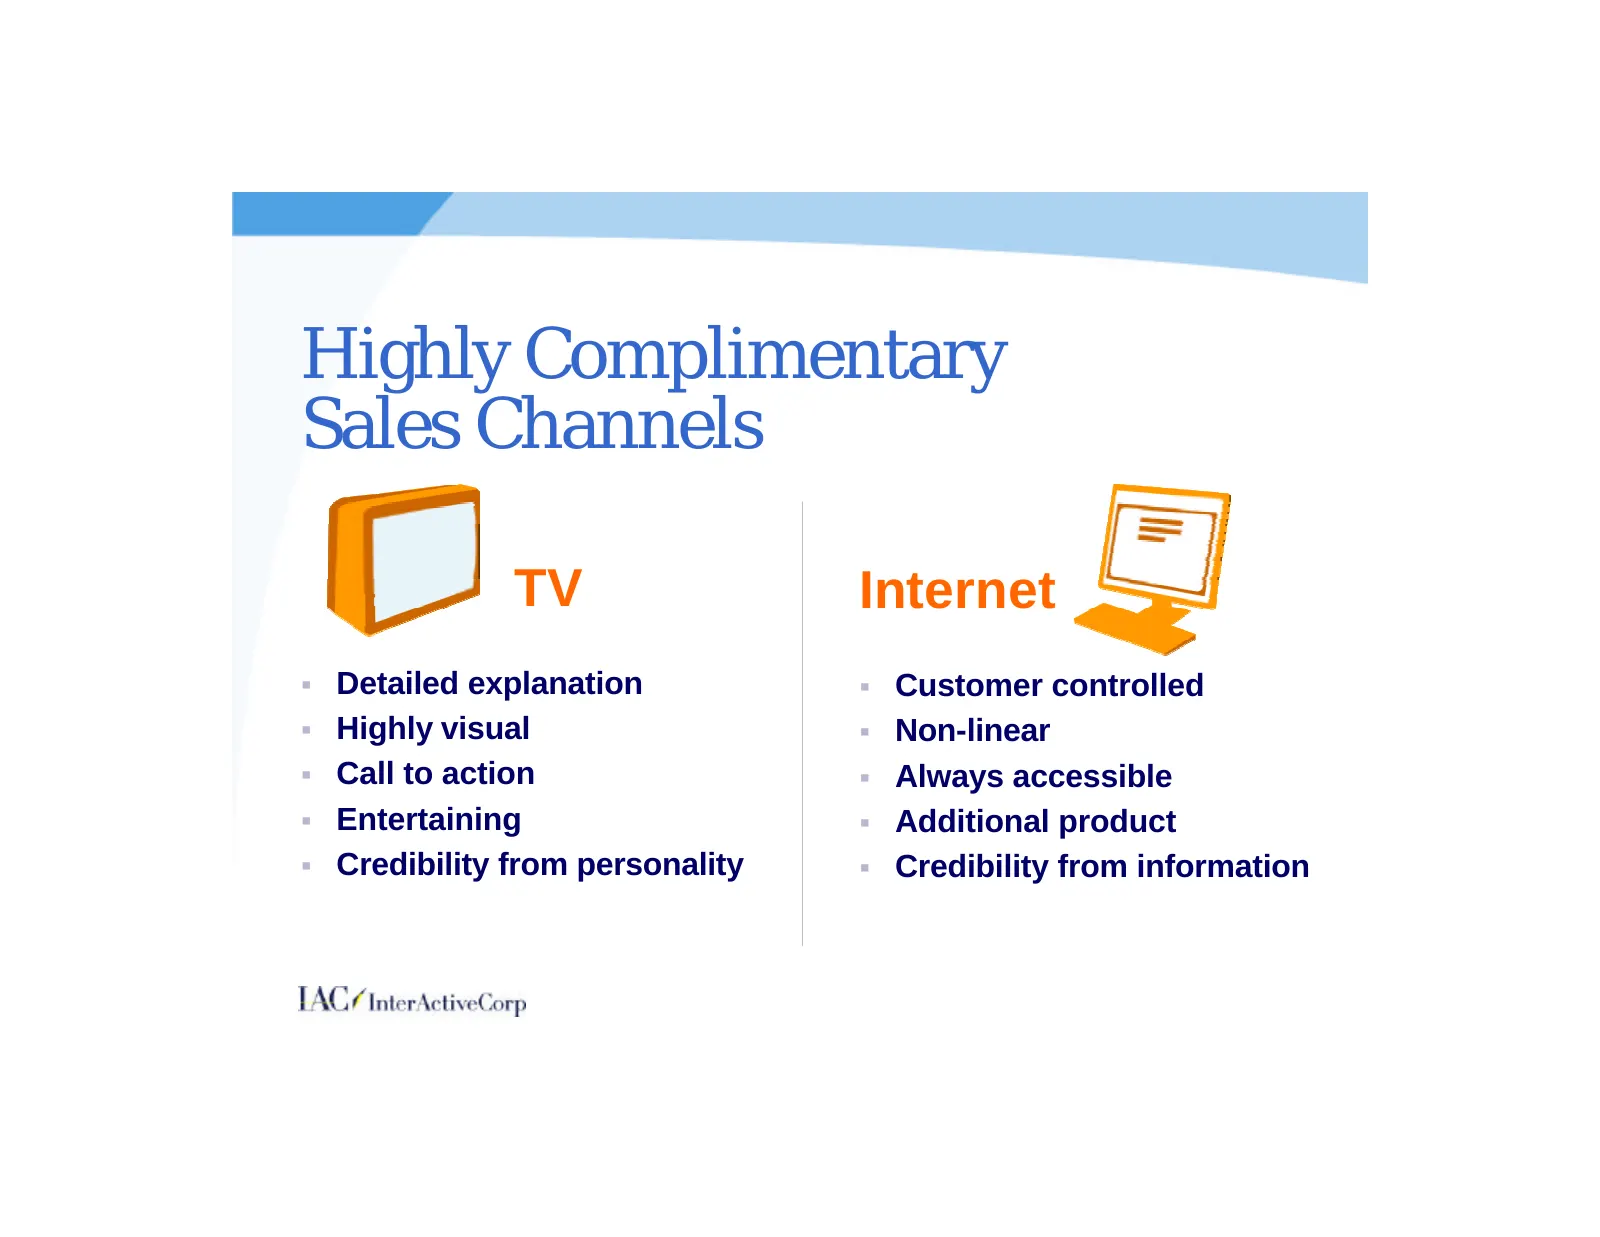
Highly Complimentary Sales Channels TV Internet § Detailed explanation § Customer controlled § Highly visual § Non-linear § Call to action § Always accessible § Entertaining § Additional product § Credibility from personality § Credibility from information
Slide 48: HSN.com Provides Real Customer Benefits
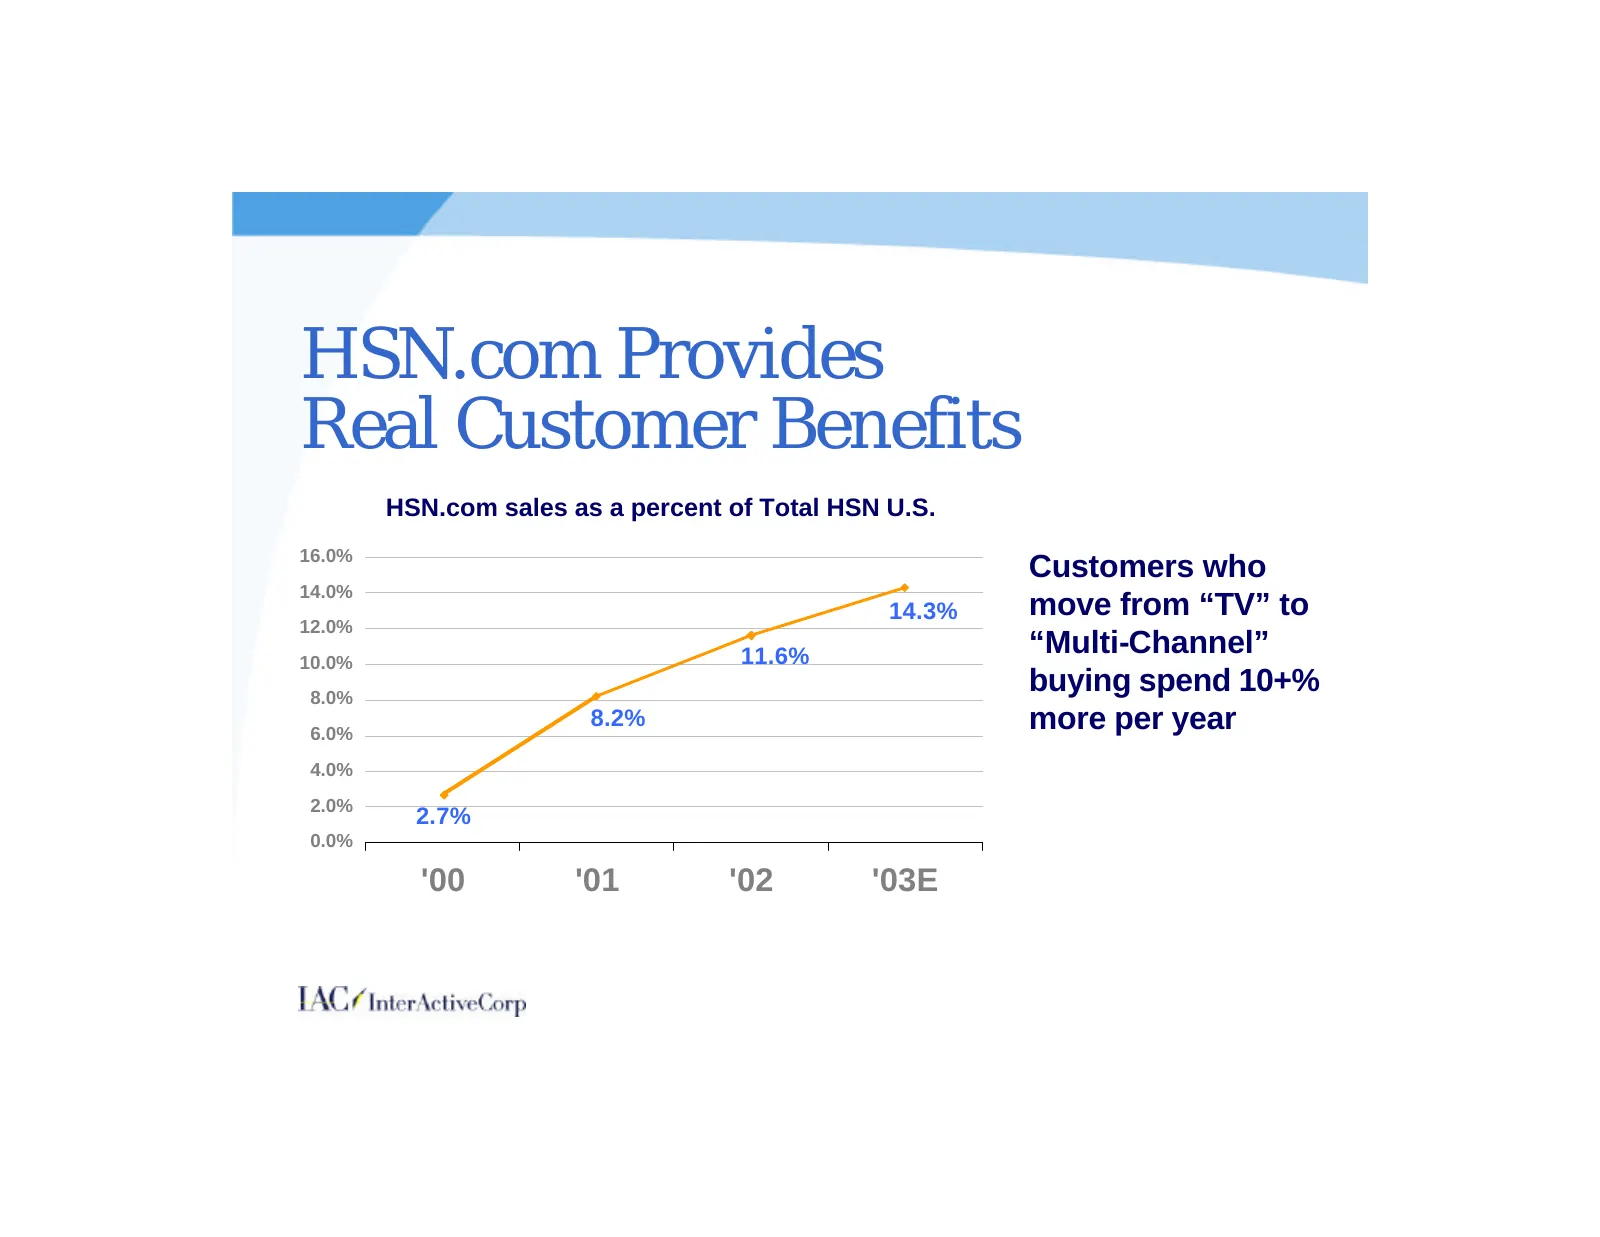
HSN.com Provides Real Customer Benefits HSN.com sales as a percent of Total HSN U.S. 16.0% Customers who 14.0% 14.3% move from “TV” to 12.0% 10.0% 11.6% “Multi-Channel” 8.0% buying spend 10+% 6.0% 8.2% more per year 4.0% 2.0% 2.7% 0.0% '00 '01 '02 '03E
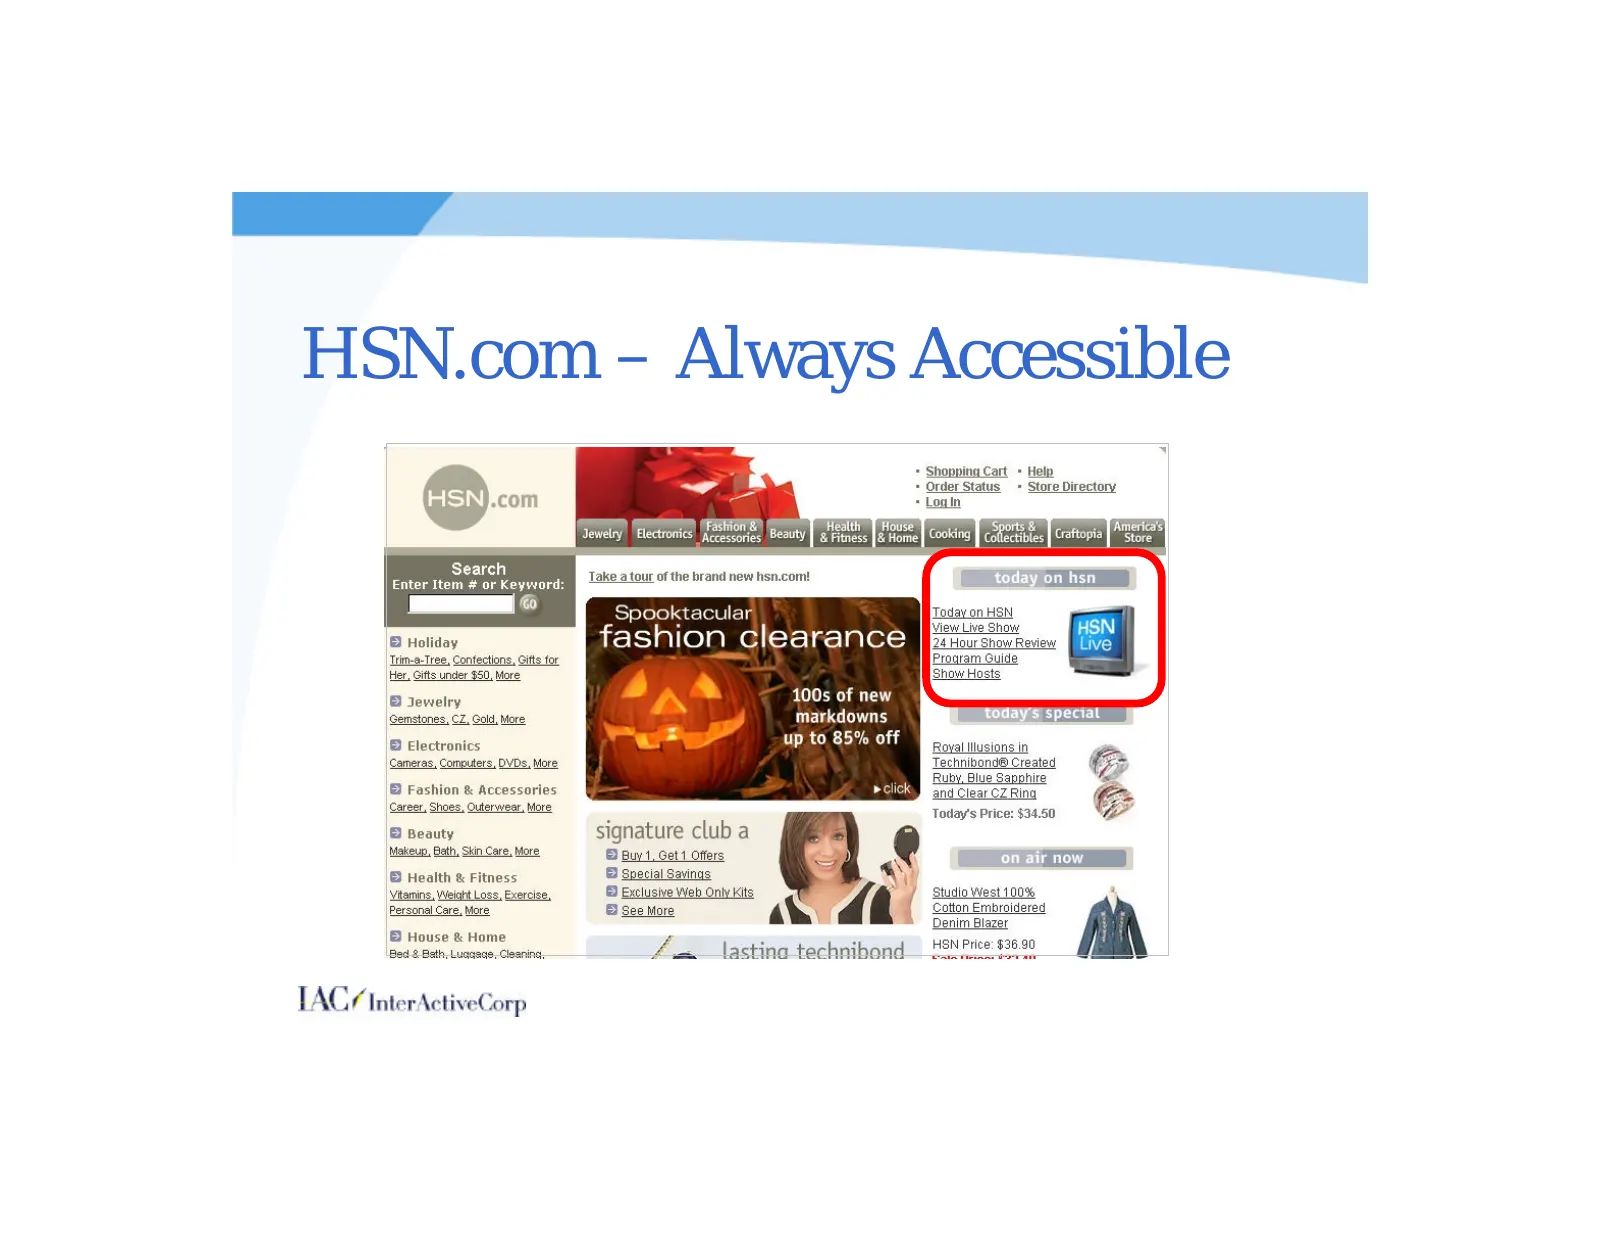
Slide 49: HSN.com – Always Accessible
HSN.com - Always Accessible com Search Enter Item # or Keyword: a Holiday ‘Trin-a-Tree, Confections, Gitts for Her, Gifts under $50, More Jewelry Gemstones, CZ, Gold, More Electronics Cameras, Computers, DVDs, More Fashion & Accessories Career, Shoes, Outerwear, More Beauty Makeup, Bath, Skin Care,
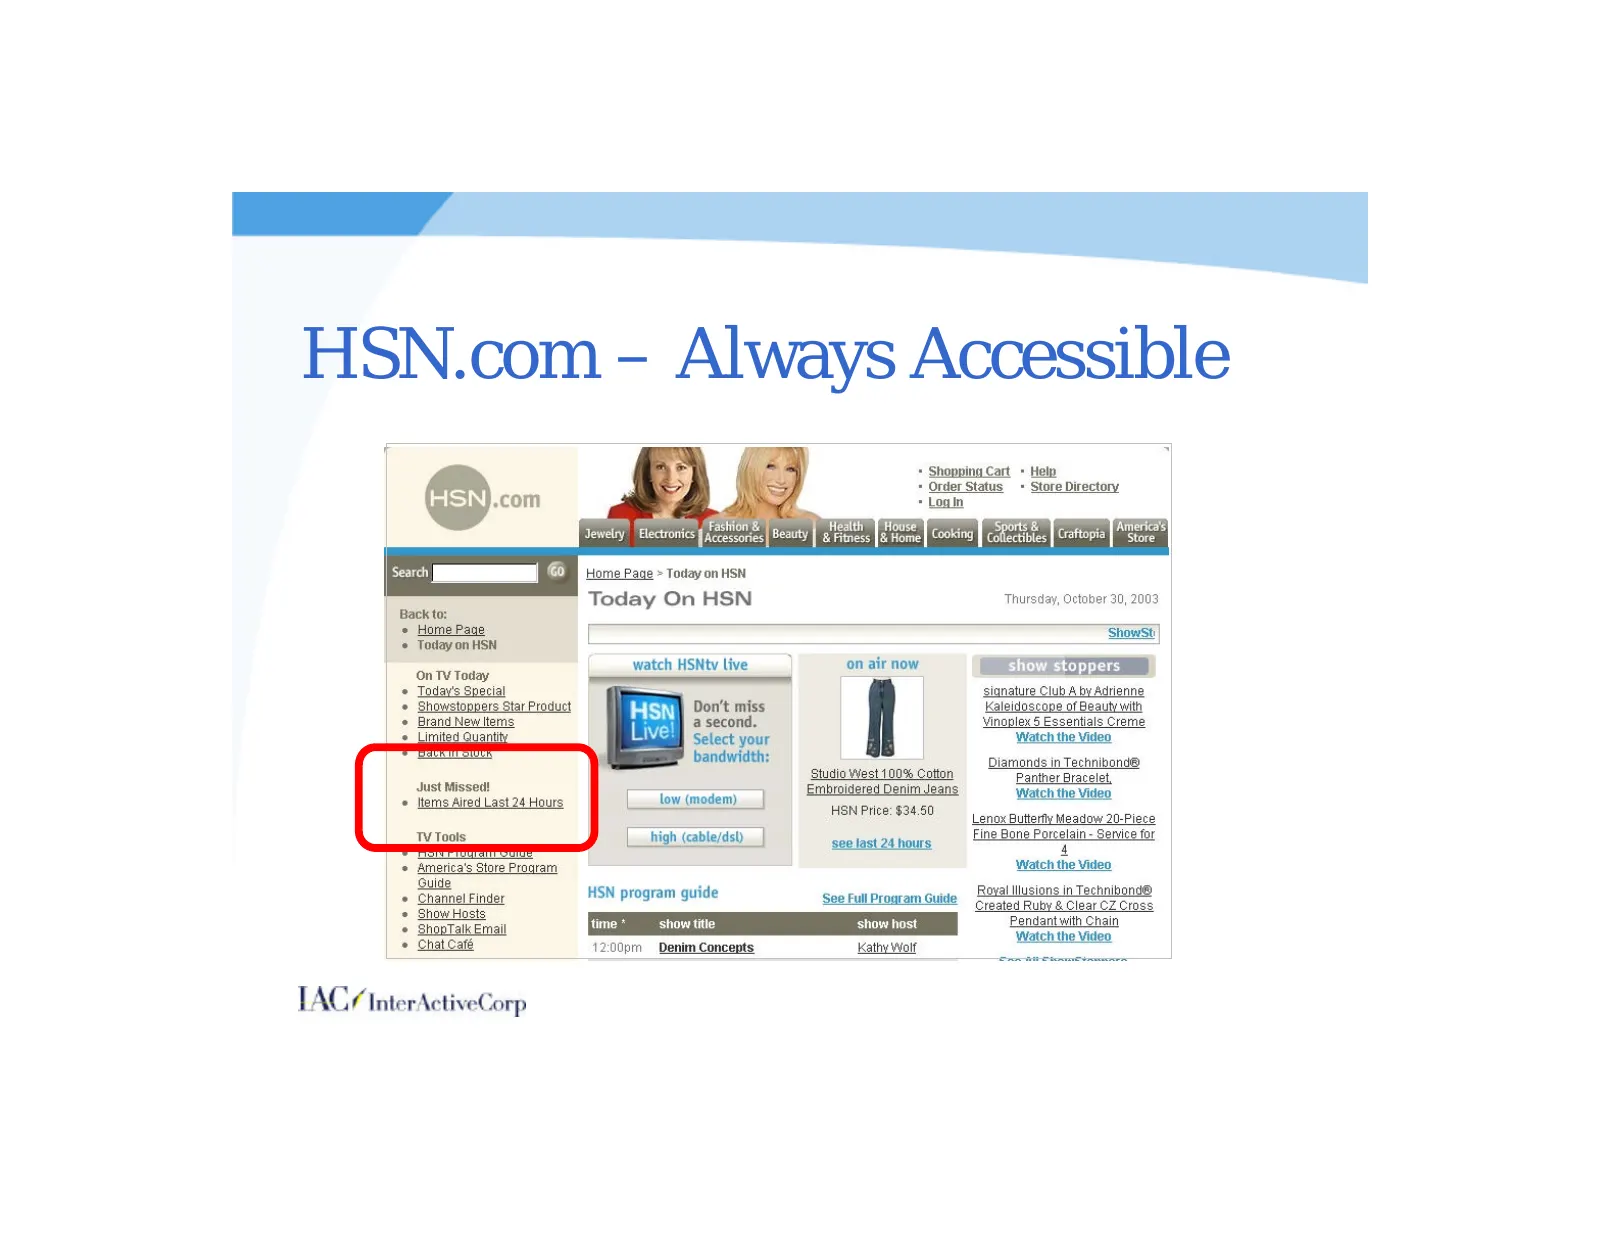
Slide 50: HSN.com – Always Accessible
HSN.com - Always Accessible * Shopping Cart + Help + Order Status + Store Directory com Hecronics {acres Home Page > Today on HSN Today On HSN Thursday, October 30, 2003 Back to: + Home Pave i Shows] + Tovayon HSN watch HSNtv live easienow) | __show stoppers | cv meh ish ne )onainow EEE + Todays Spe
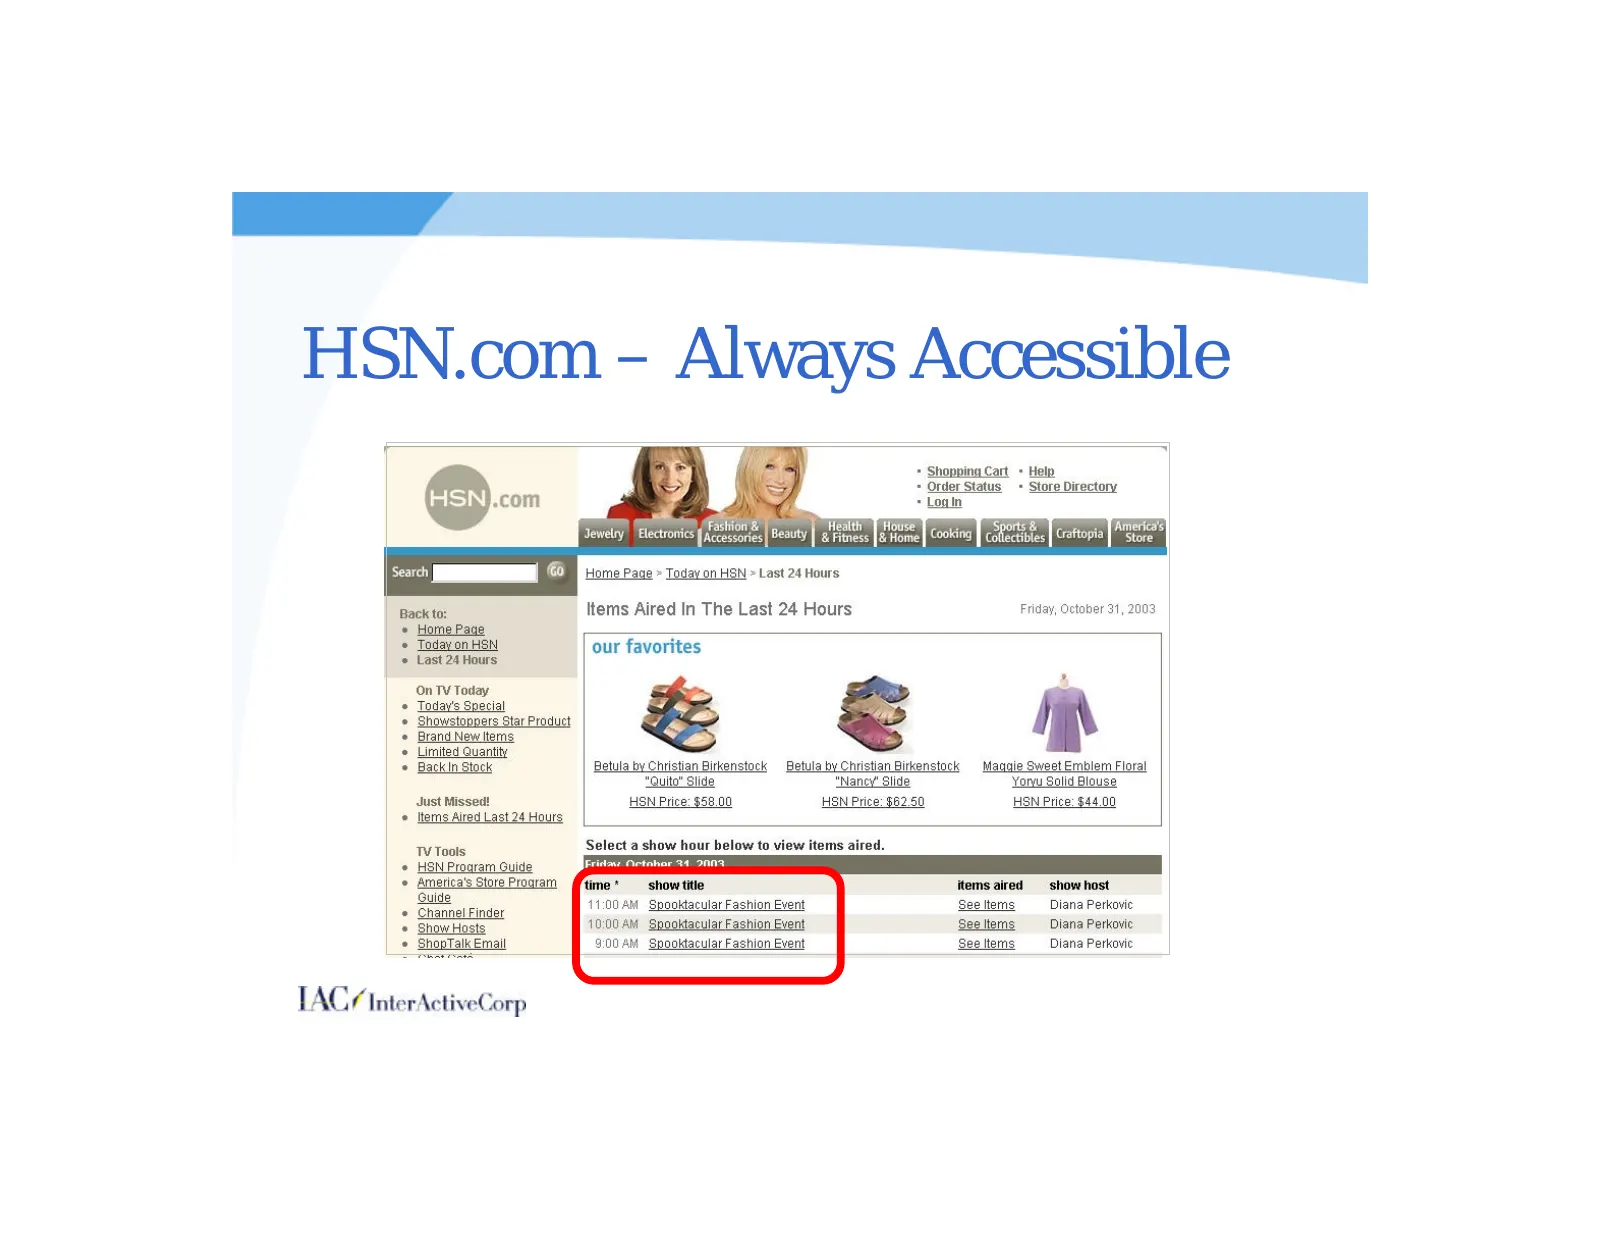
Slide 51: HSN.com – Always Accessible
HSN.com - Always Accessible * Shopping Cart - Help + Order Status + Store Directory .com Login Health Fitness Fastion & Sports & ‘Amerkcas Cooking | collectibles Store House /& Home Sewelry, [Electronics fc Beauty | g Craftopia Sch a ‘Home Page » Today on HSN » Last 24 Hours Back to: Items Aired In
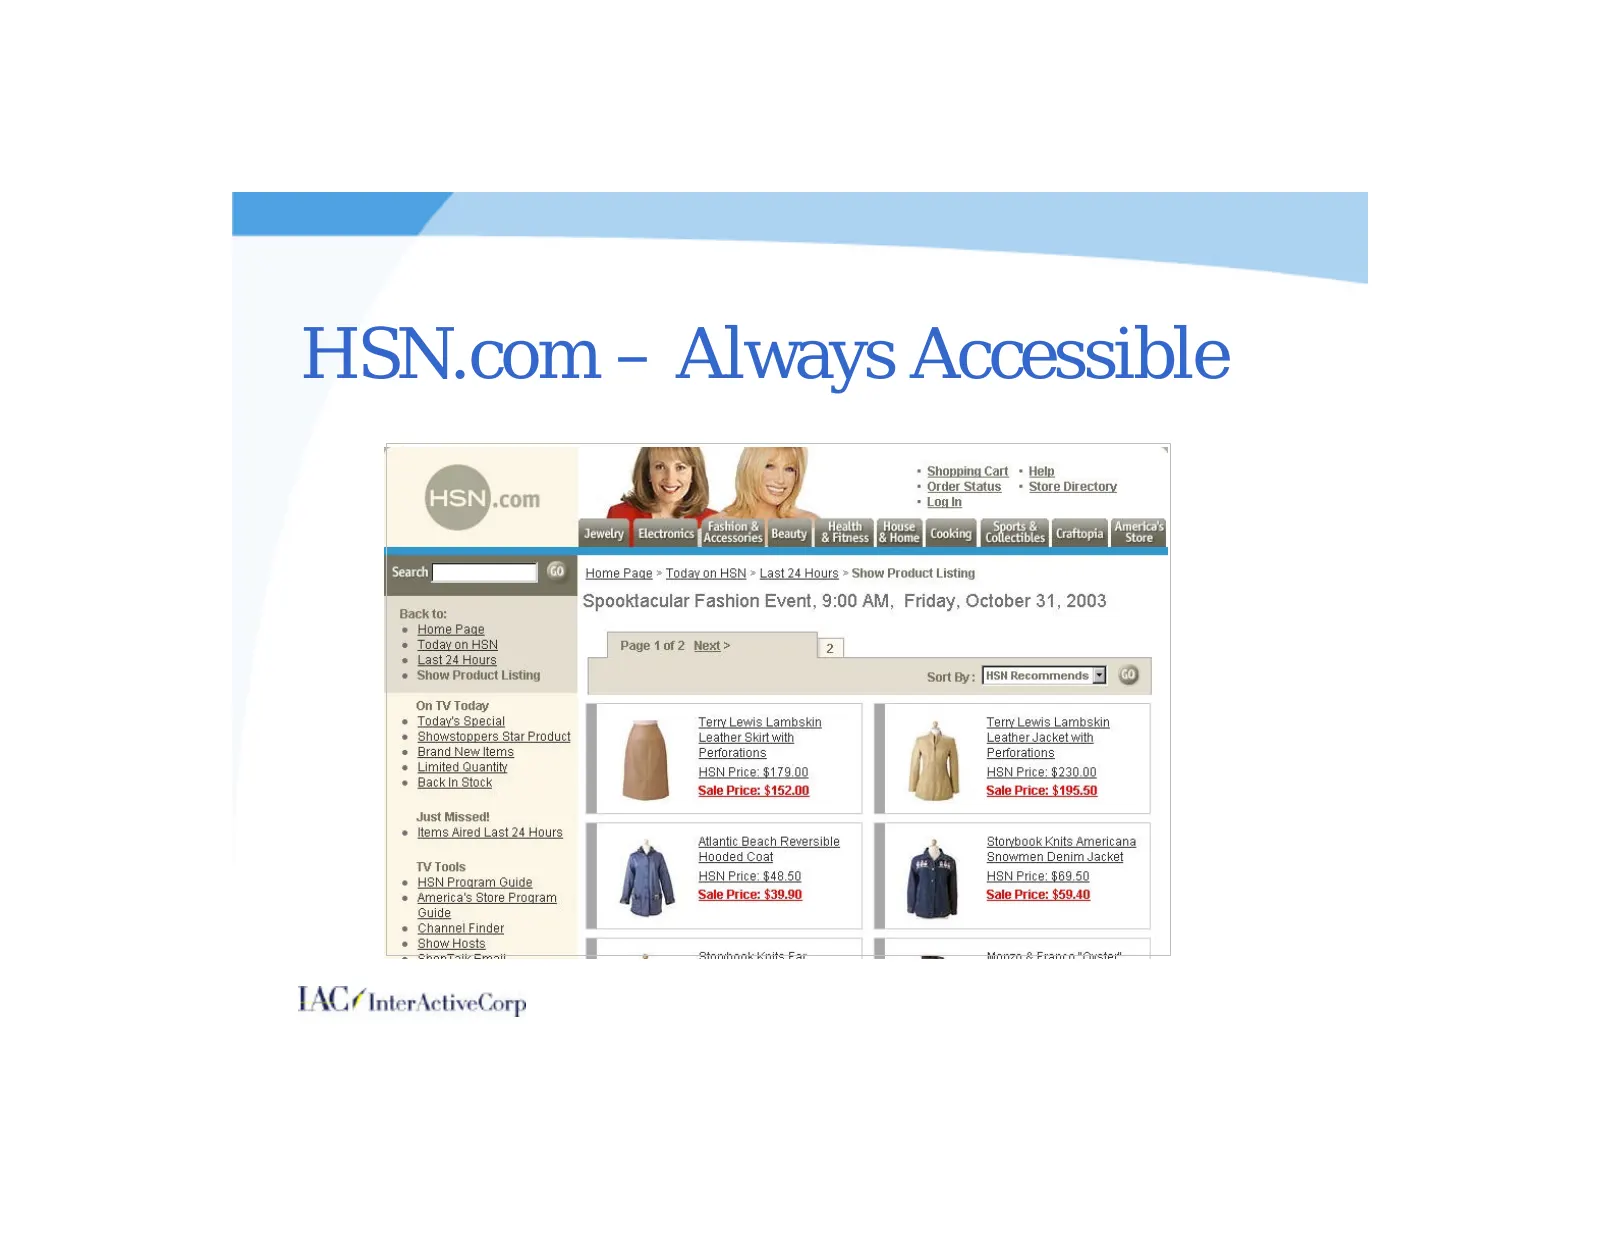
Slide 52: HSN.com – Always Accessible
HSN.com - Always Accessible .com th Brand New terns toppers St ‘Back In Stock Just Missed! items Aired Last 24 Hours TVTools ‘HSN Program Guide America’s Store Program Guide Channel Finder iow Hosts fasion Meath House eressres| Beauty | gitness [a Rome Jewelry | Electronic Page 10f2 Next> 2] + Order
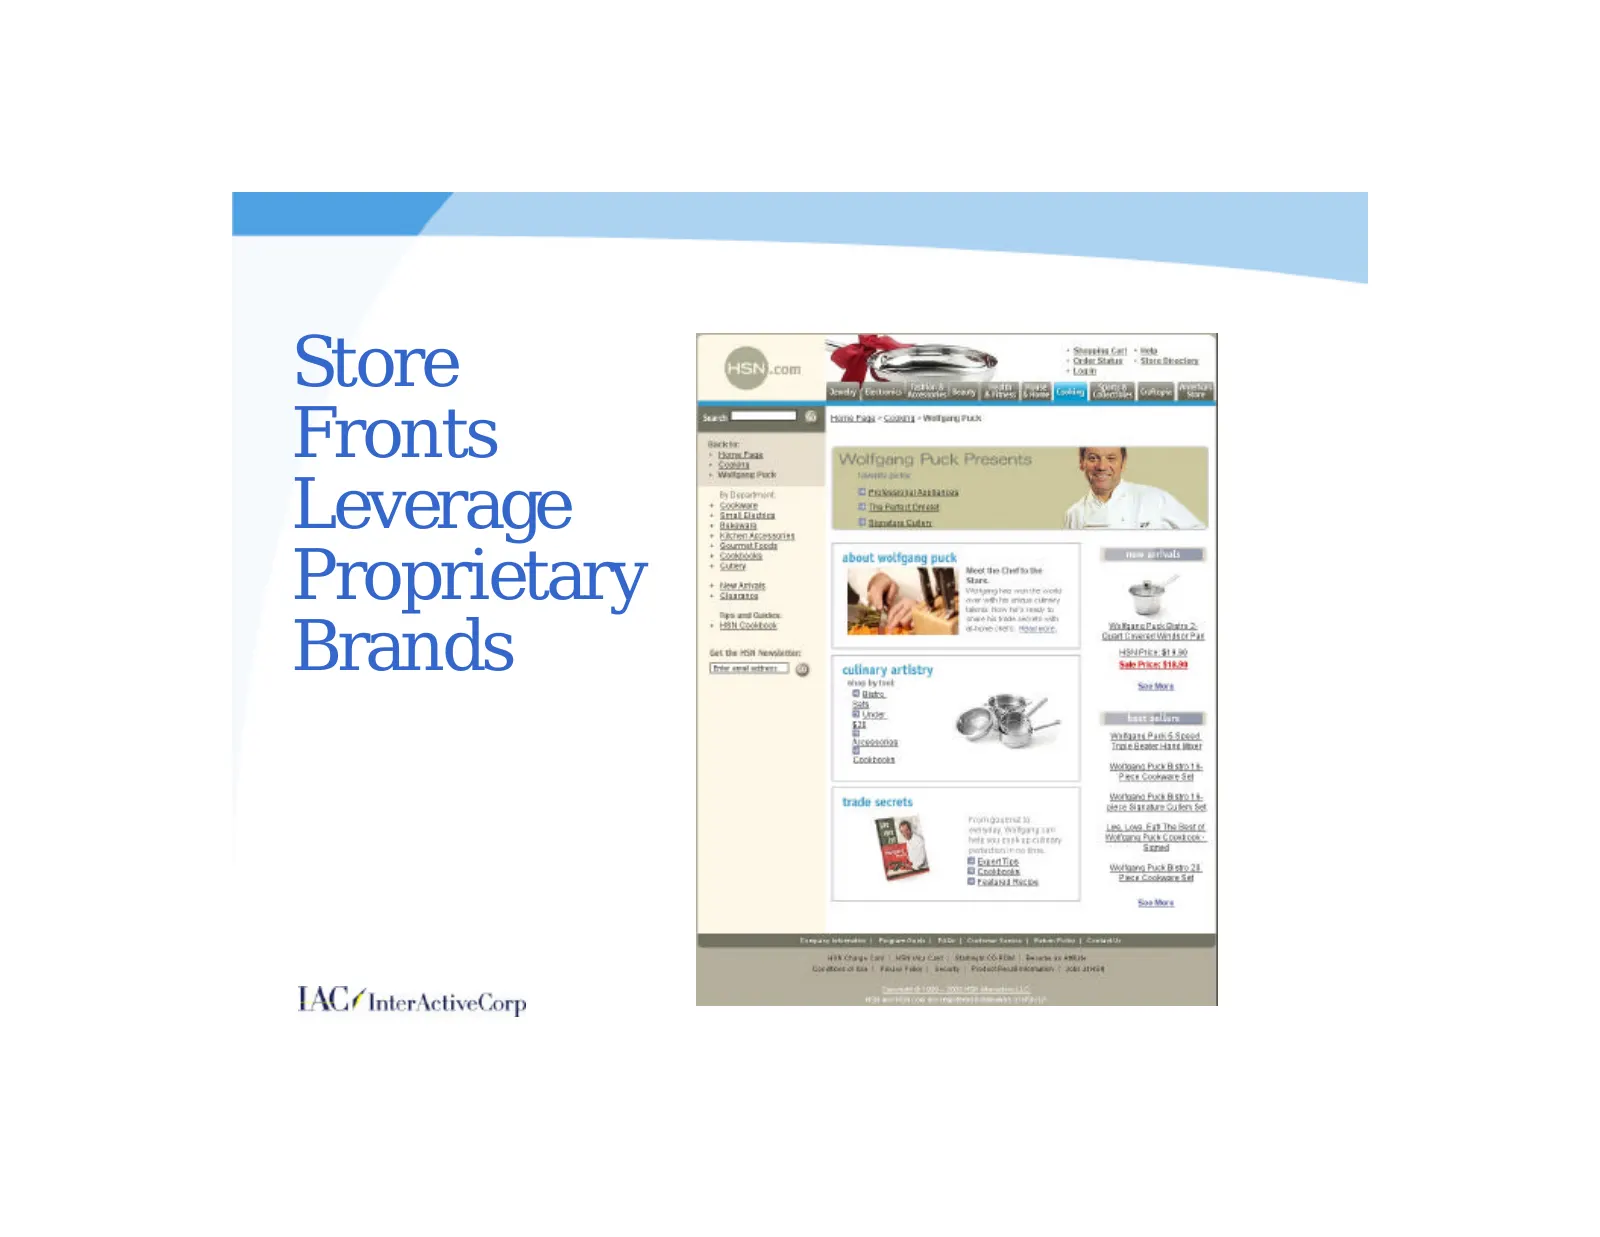
Slide 53: Store Fronts Leverage Proprietary Brands
Store Fronts Leverage Proprietary Brands
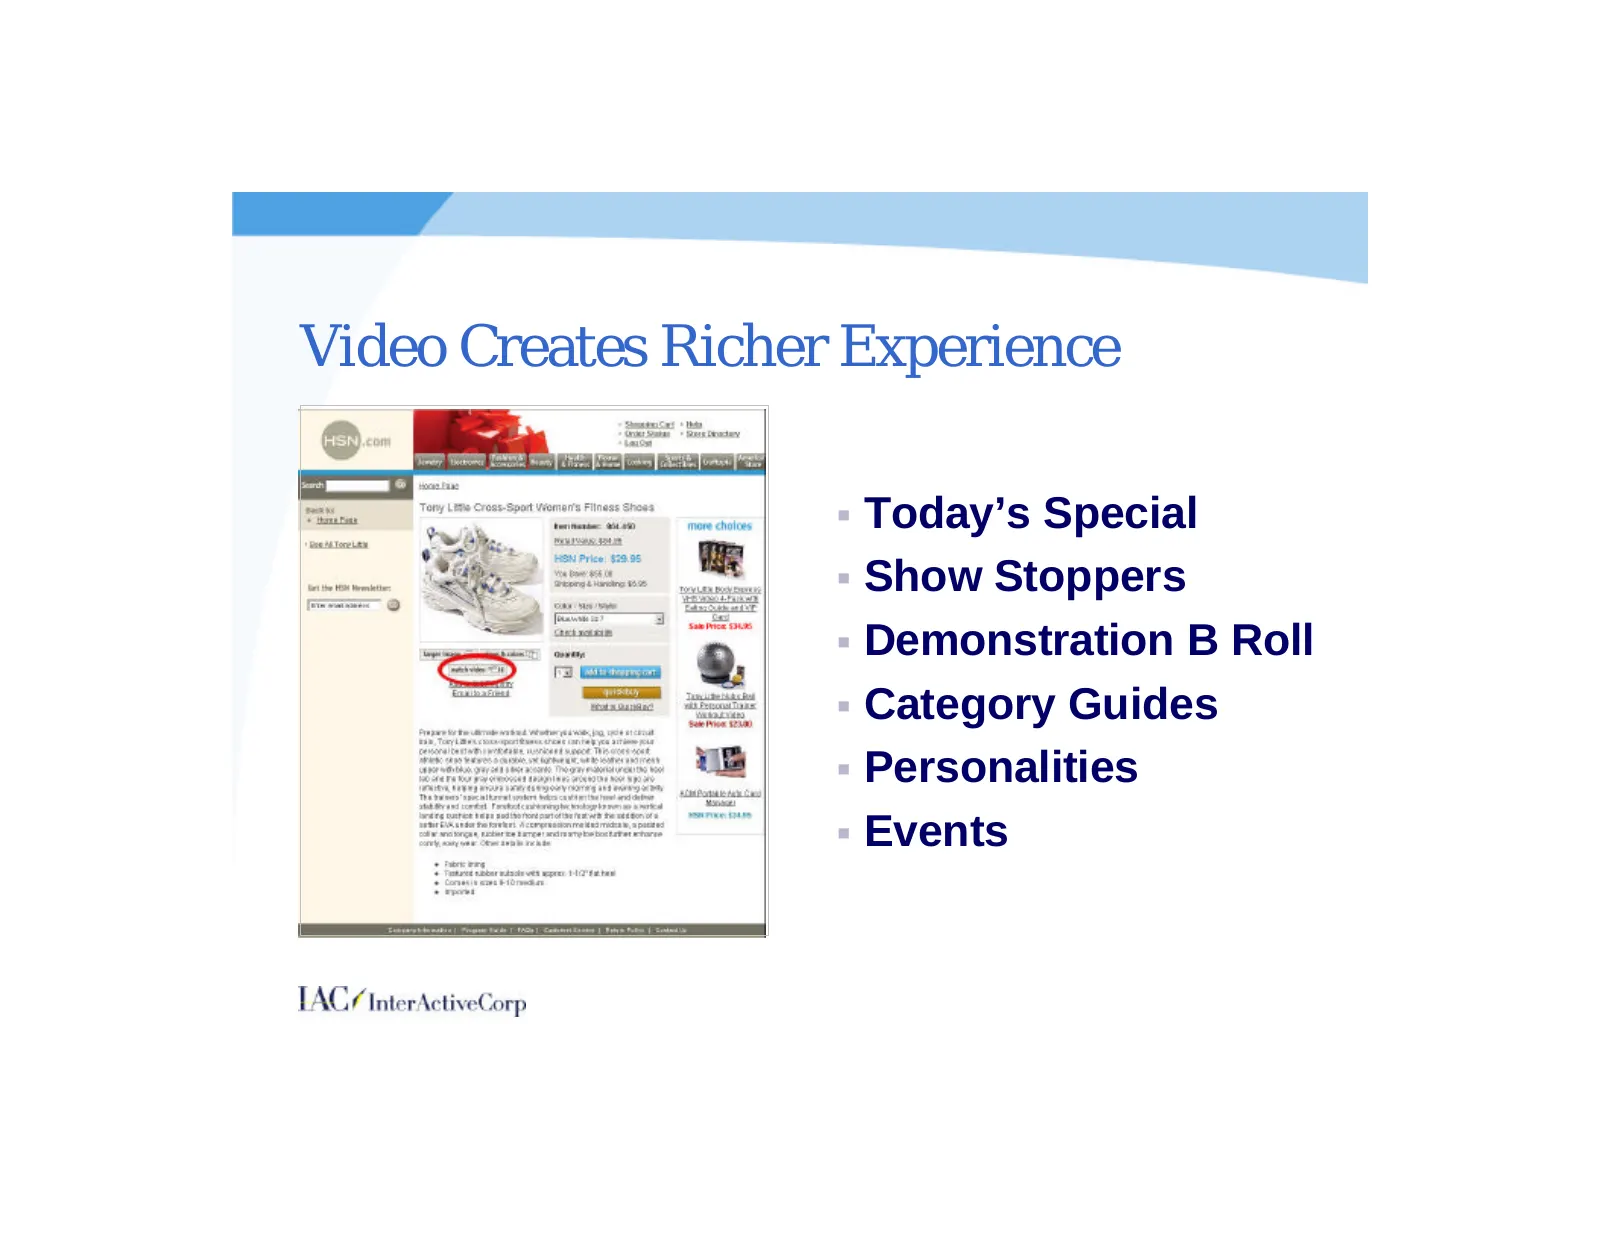
Slide 54: Video Creates Richer Experience
Video Creates Richer Experience § Today’s Special § Show Stoppers § Demonstration B Roll § Category Guides § Personalities § Events
Slide 55: HSN.com and HSN TV combine for increased customer benefit
HSN.com and HSN TV combine for increased customer benefit
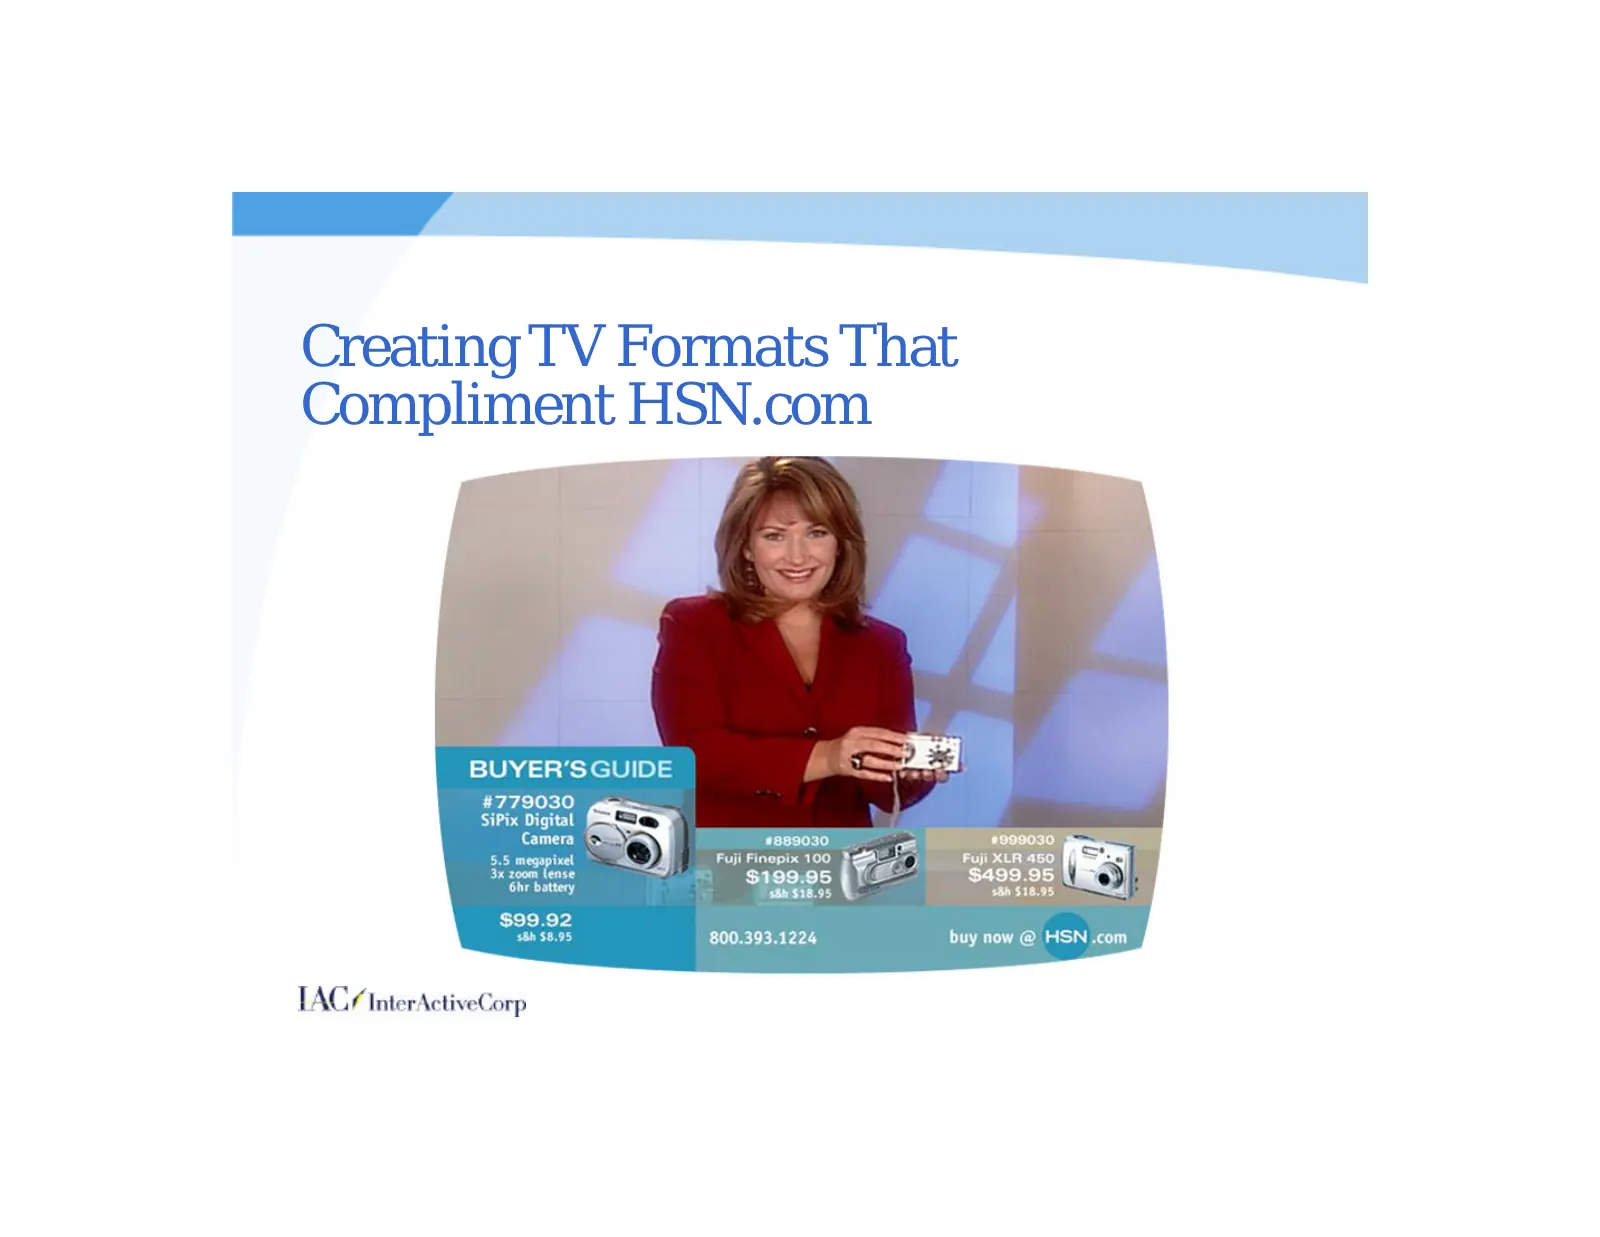
Slide 56: Creating TV Formats That Compliment HSN.com
Creating TV Formats That Compliment HSN.com
Slide 57: Building America's Store
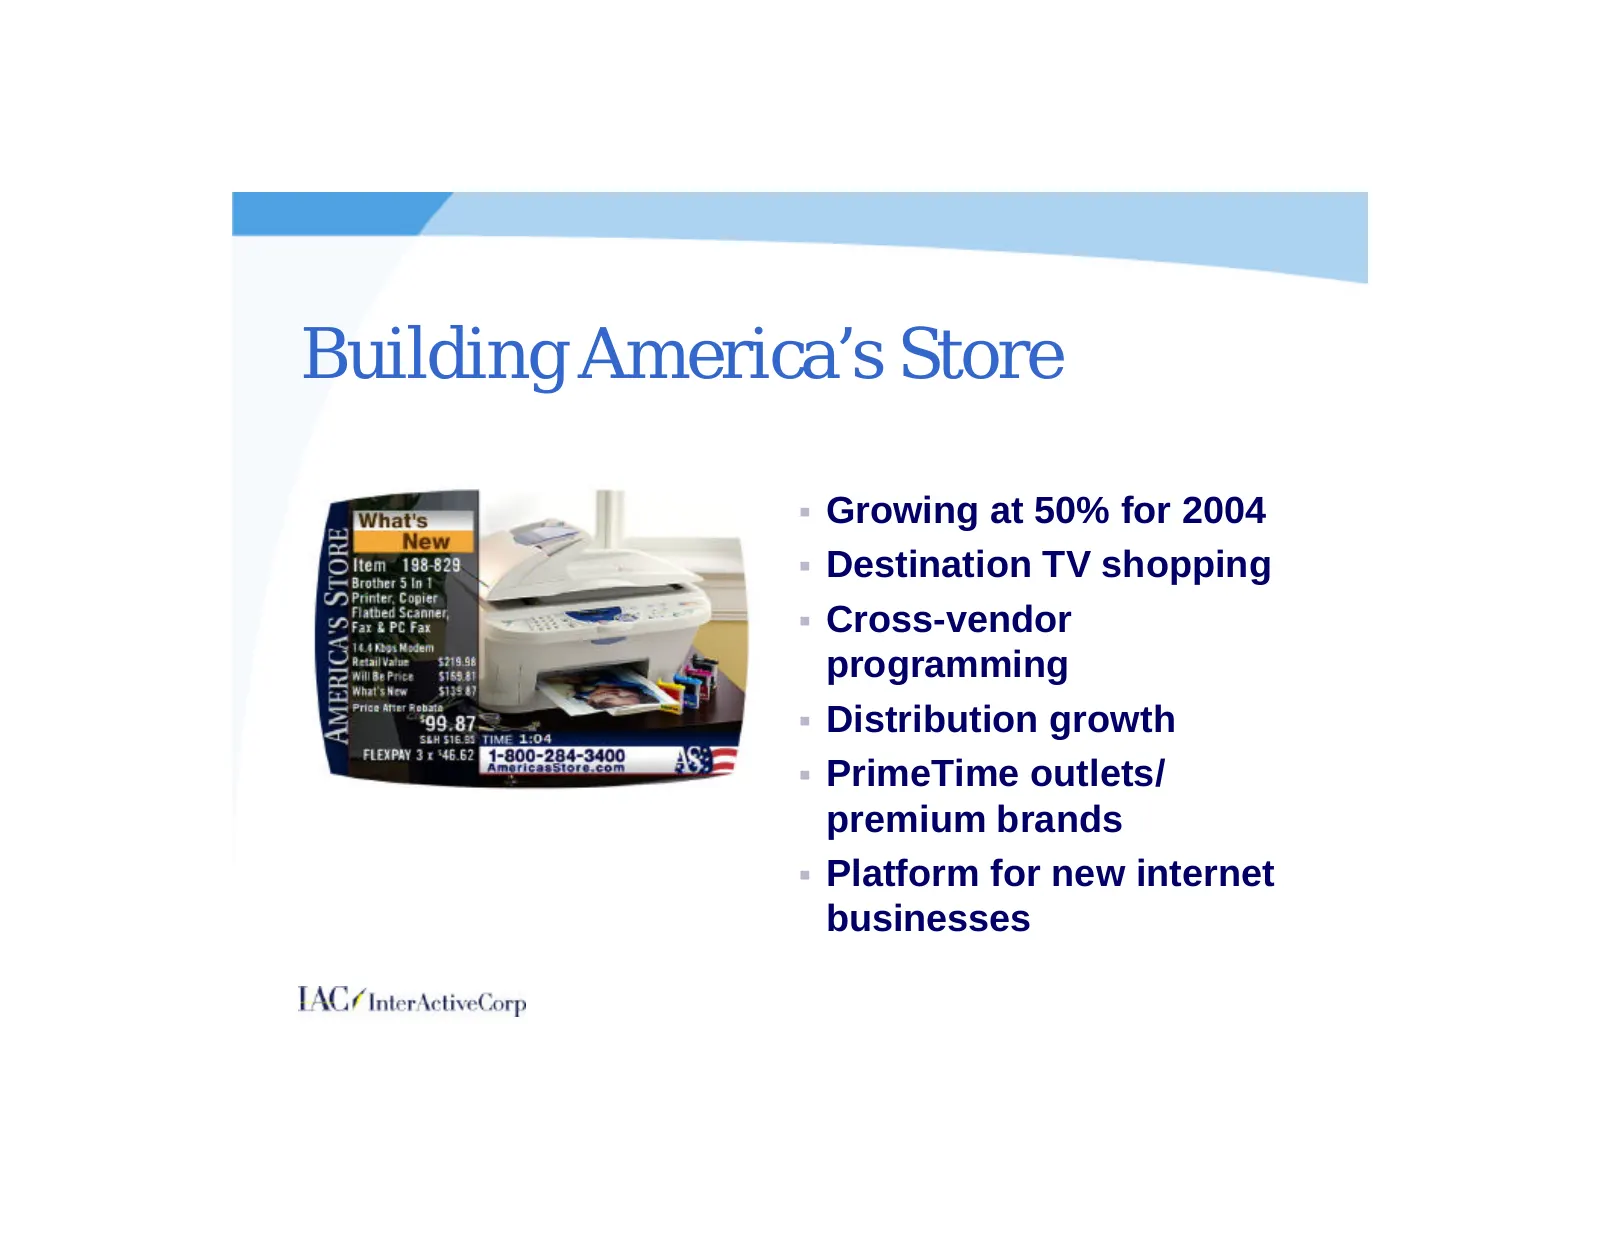
Building America’s Store § Growing at 50% for 2004 § Destination TV shopping § Cross-vendor programming § Distribution growth § PrimeTime outlets/ premium brands § Platform for new internet businesses
Slide 58: Enhanced Service Levels
Enhanced Service Levels Over the last 2 years ... Over the next year ... § Packages shipped within 2 days of order § Delivery times will be materially shorter from 86% to 97% § Phone service will be materially more § Variable labor per unit has decreased by flexible and faster 29% § Returns processi
Slide 59: International Consolidated Summary
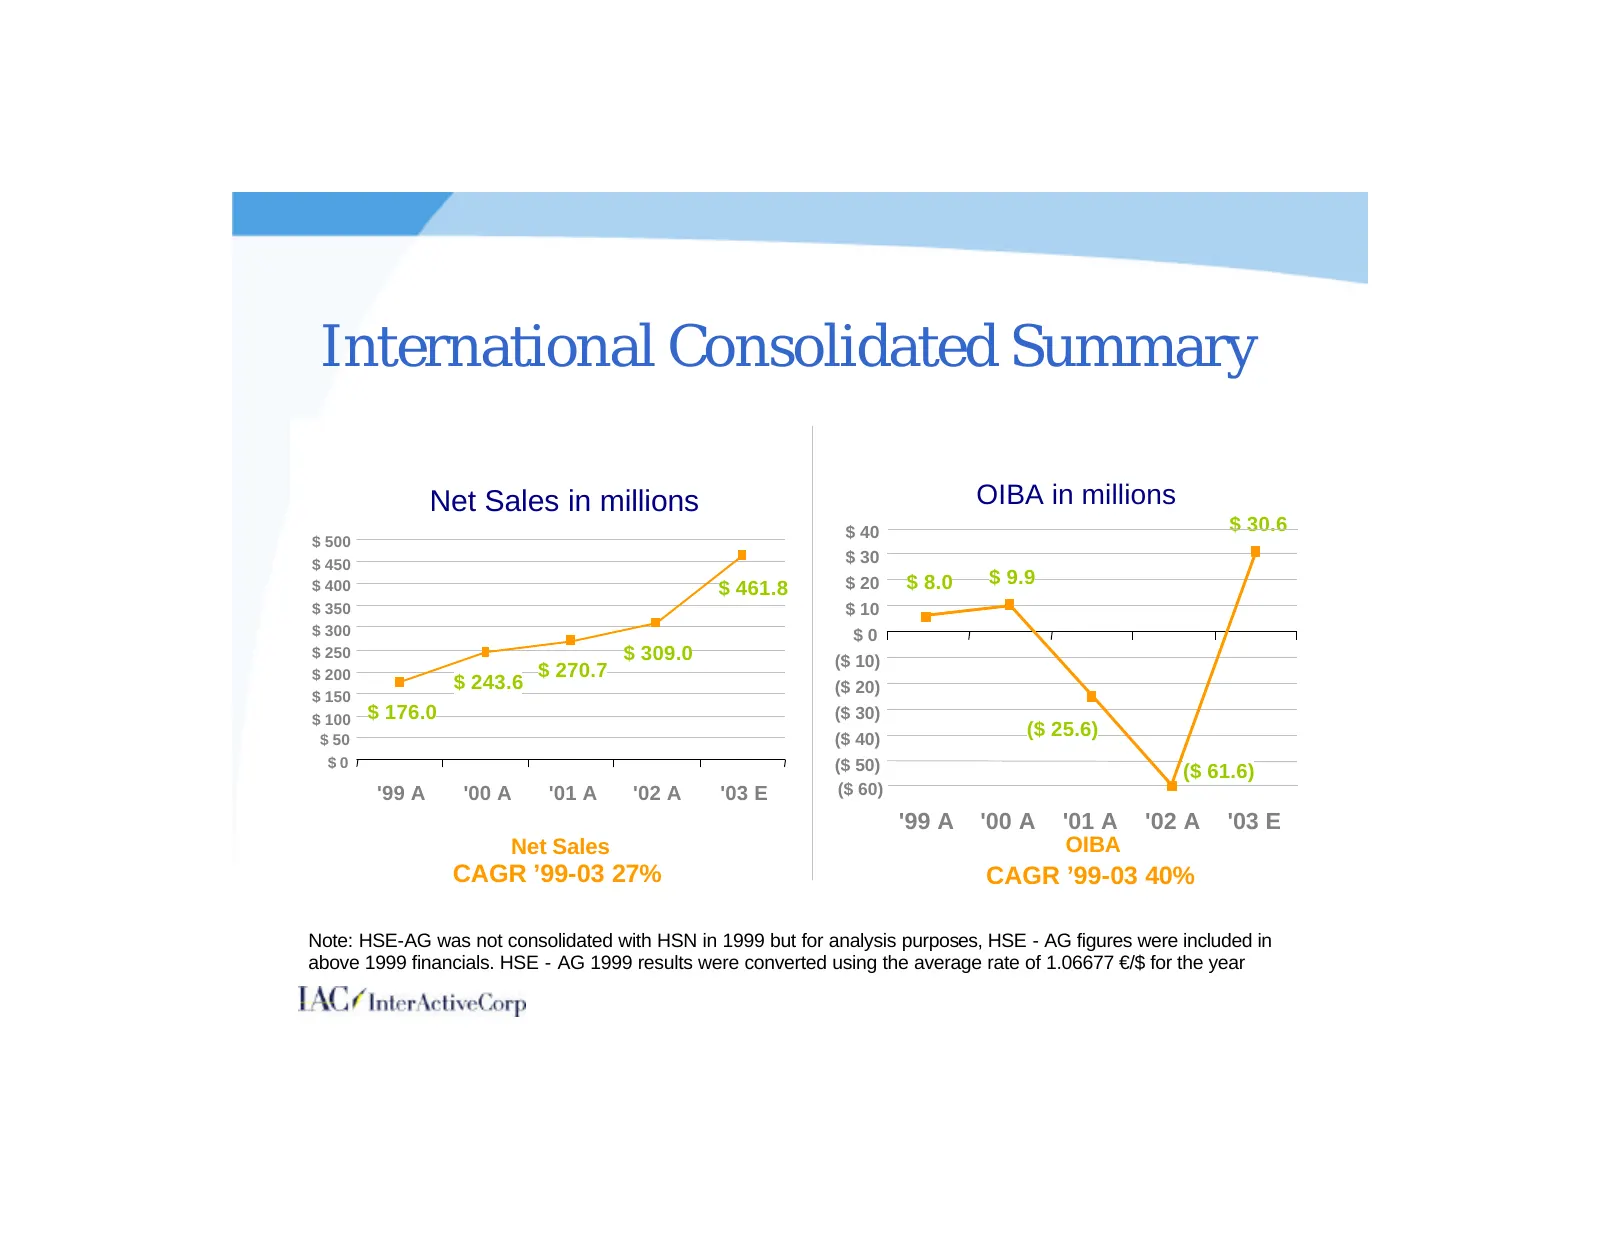
International Consolidated Summary Net Sales in millions OIBA in millions $ 40 $ 30.6 $ 500 $ 450 $ 30 $ 400 $ 20 $ 8.0 $ 9.9 $ 461.8 $ 350 $ 10 $ 300 $0 $ 250 $ 309.0 ($ 10) $ 200 $ 270.7 $ 243.6 ($ 20) $ 150 $ 100 $ 176.0 ($ 30) $ 50 ($ 40) ($ 25.6) $0 ($ 50) ($ 61.6) '99 A '00 A '01 A '02 A '03 E
Slide 60: HSE – AG Business Overview
HSE – Merchandising Mix (YTD 9/30): Jewelry 27% AG Business Wellness/Beauty 39% Overview Fashion/Apparel Collectibles/Household 5% 24% Multimedia/Home Electronics 5% Unit Volume (forecast 2003) 9.9M Active Customers (12mo @ 9/30) 1.5M Households (EOP 9/30) 31.9M Internet % of HSE-AG (YTD 9/30) 5.9%
Slide 61: Sales Trend Comparison (US & HSE-AG)
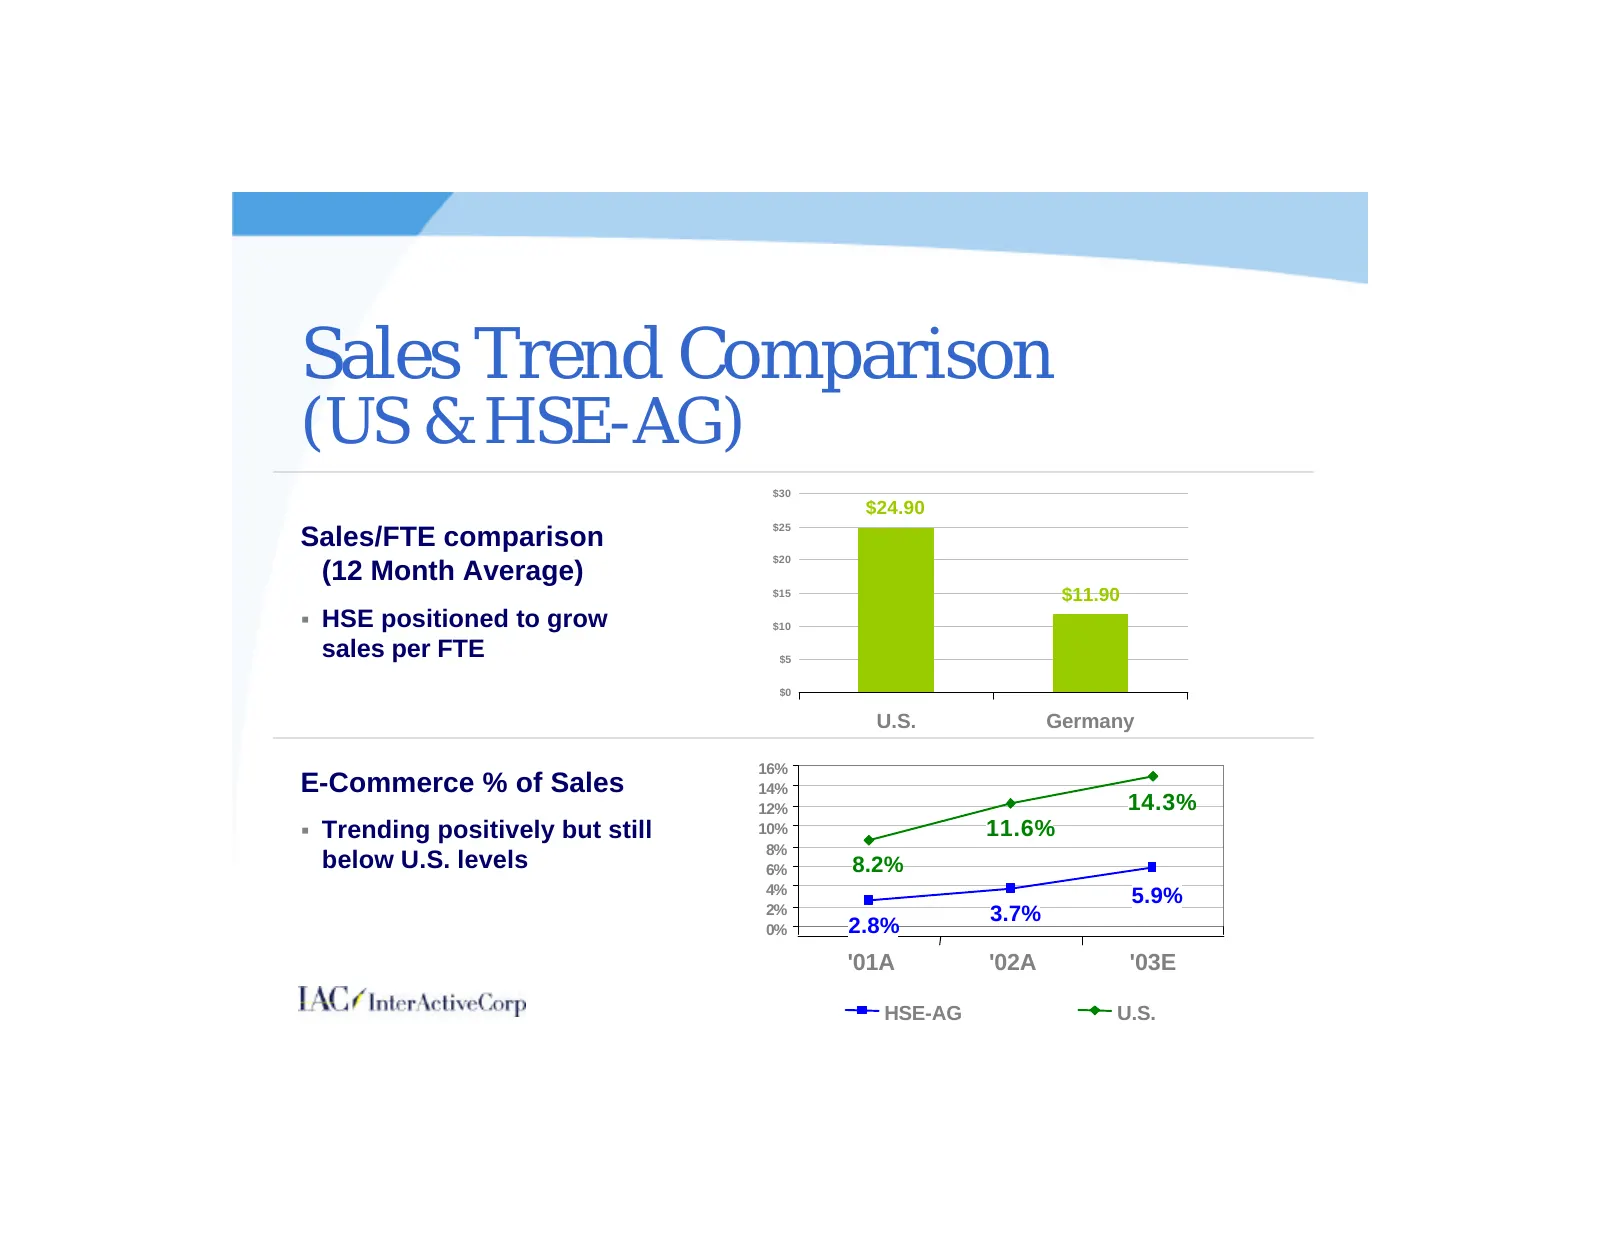
Sales Trend Comparison (US & HSE-AG) $30 $24.90 $25 Sales/FTE comparison $20 (12 Month Average) $15 $11.90 § HSE positioned to grow $10 sales per FTE $5 $0 U.S. Germany 16% E-Commerce % of Sales 14% 12% 14.3% § Trending positively but still 10% 11.6% 8% below U.S. levels 6% 8.2% 4% 5.9% 2% 3.7% 0% 2
Slide 62: HSE – AG Growth Drivers
HSE – AG Growth Drivers § Improve core merchandising capability § Finish service transition and enhance levels § Establish off-air business § Grow HSE.de online (currently 6%) § Introduce credit and debit card payment methods § Establish drop ship capability § Expand distribution
Slide 63: NeunLive
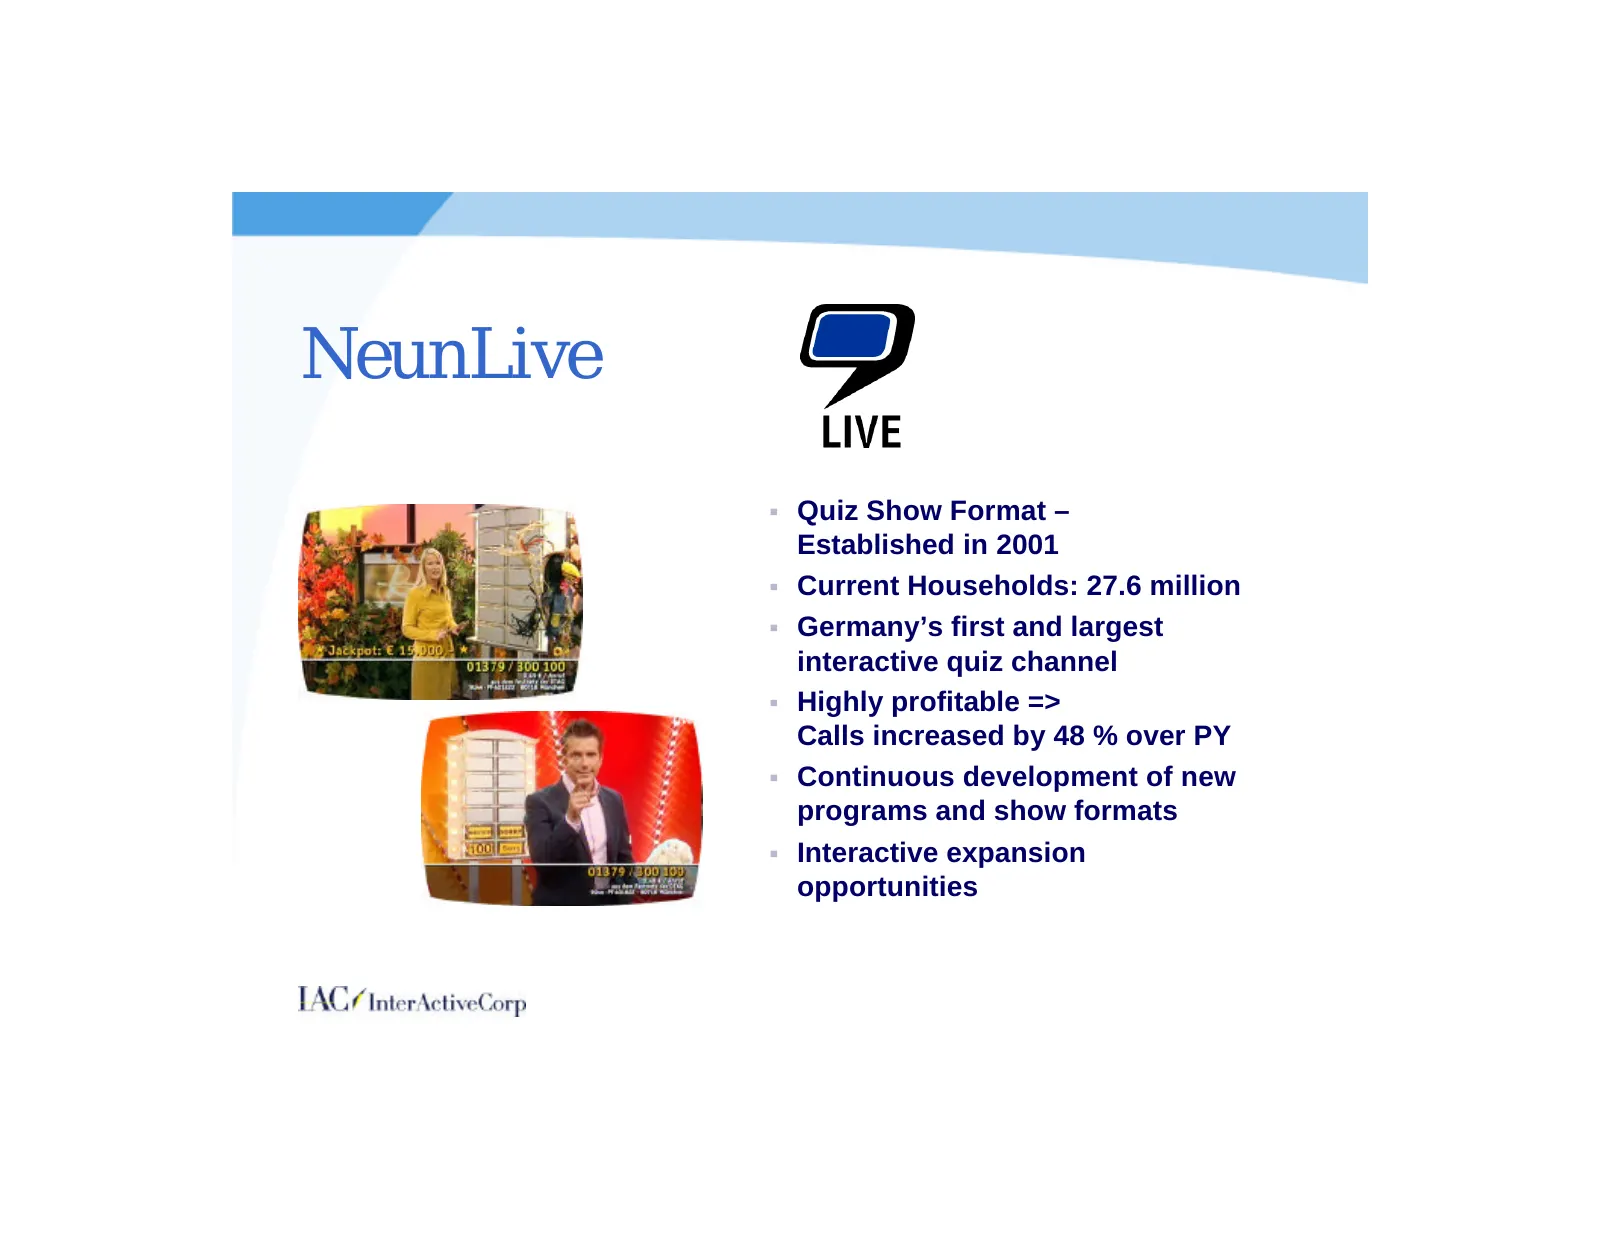
NeunLive § Quiz Show Format – Established in 2001 § Current Households: 27.6 million § Germany’s first and largest interactive quiz channel § Highly profitable => Calls increased by 48 % over PY § Continuous development of new programs and show formats § Interactive expansion opportunities
Slide 64: HSN – See the Possibilities
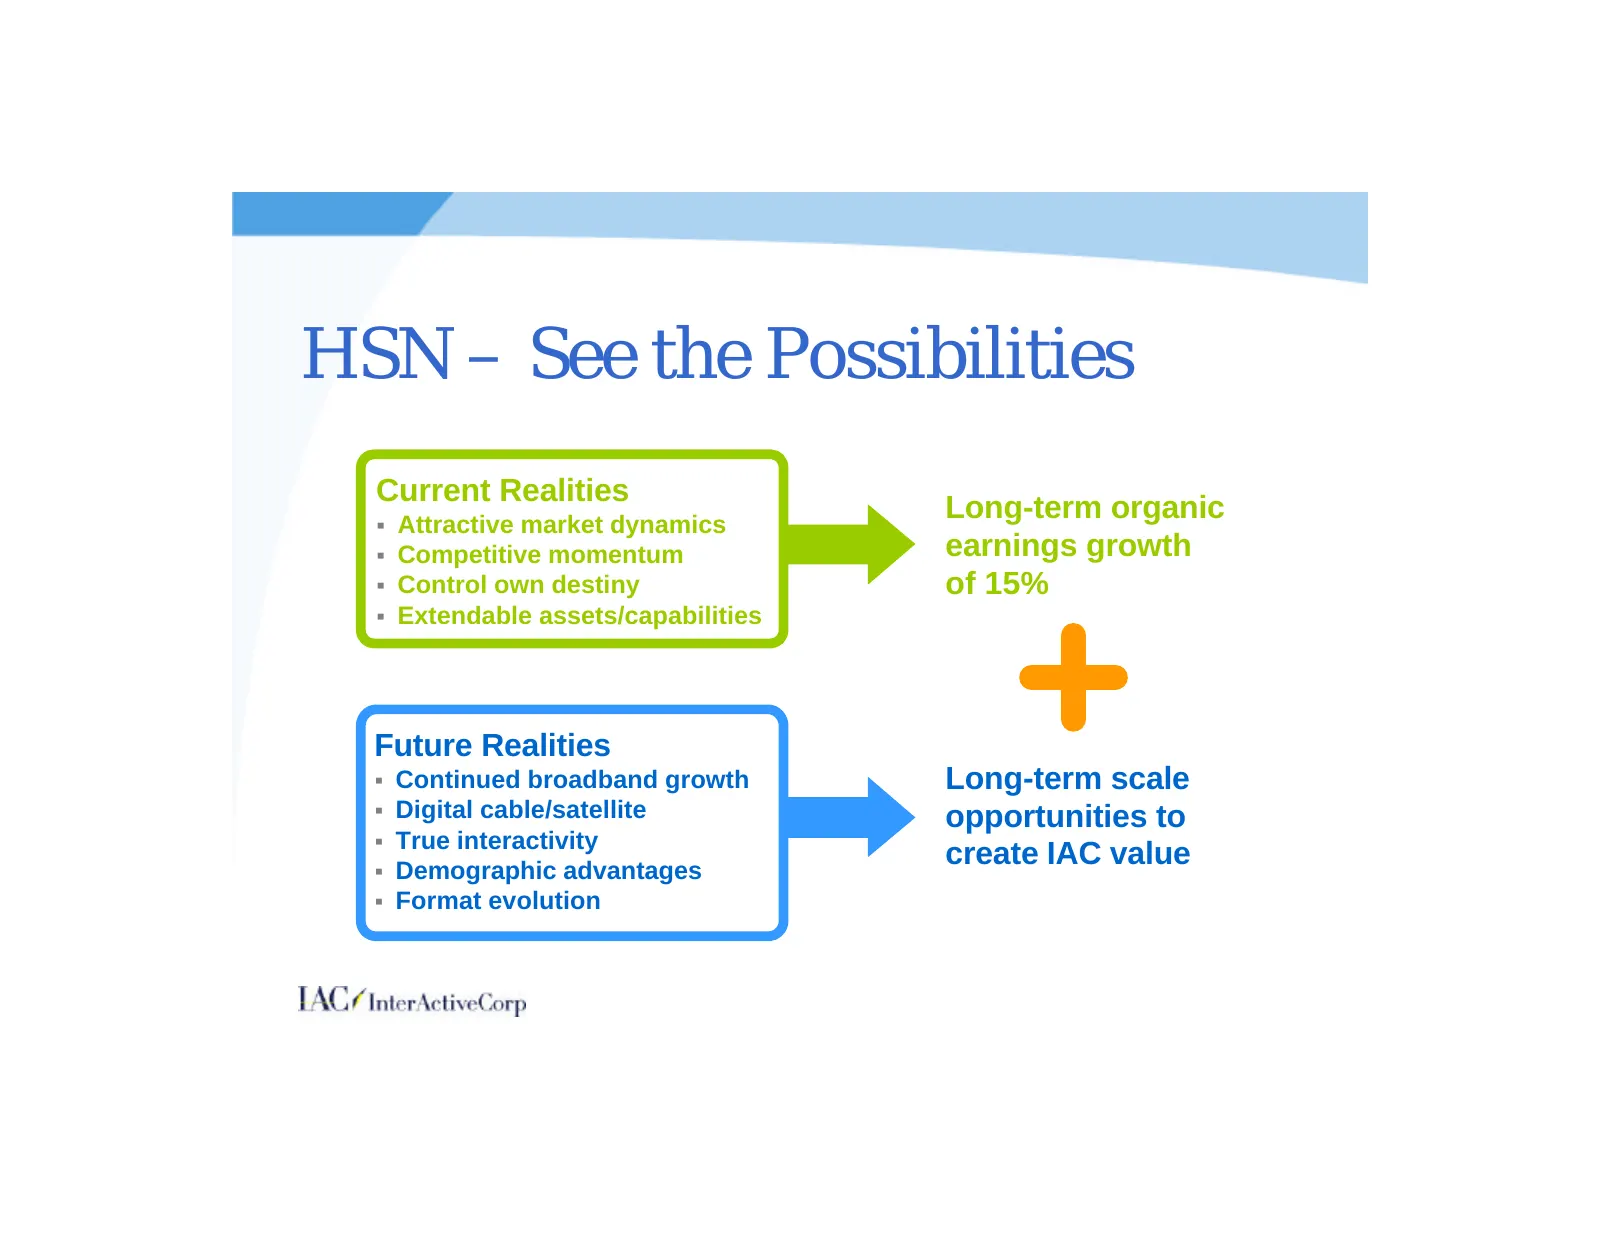
HSN – See the Possibilities Current Realities § Attractive market dynamics Long-term organic § Competitive momentum earnings growth § Control own destiny of 15% § Extendable assets/capabilities Future Realities § Continued broadband growth Long-term scale § Digital cable/satellite opportunities to §

Slide 65: IAC Electronic Retailing Q&A
Ce TACr Electronic Retailing Q&A TAC¢ InterActiveCorp
Slide 66: John Pleasants
John Pleasants President & CEO
Slide 67: Mission – Efficiently connect performances & consumers
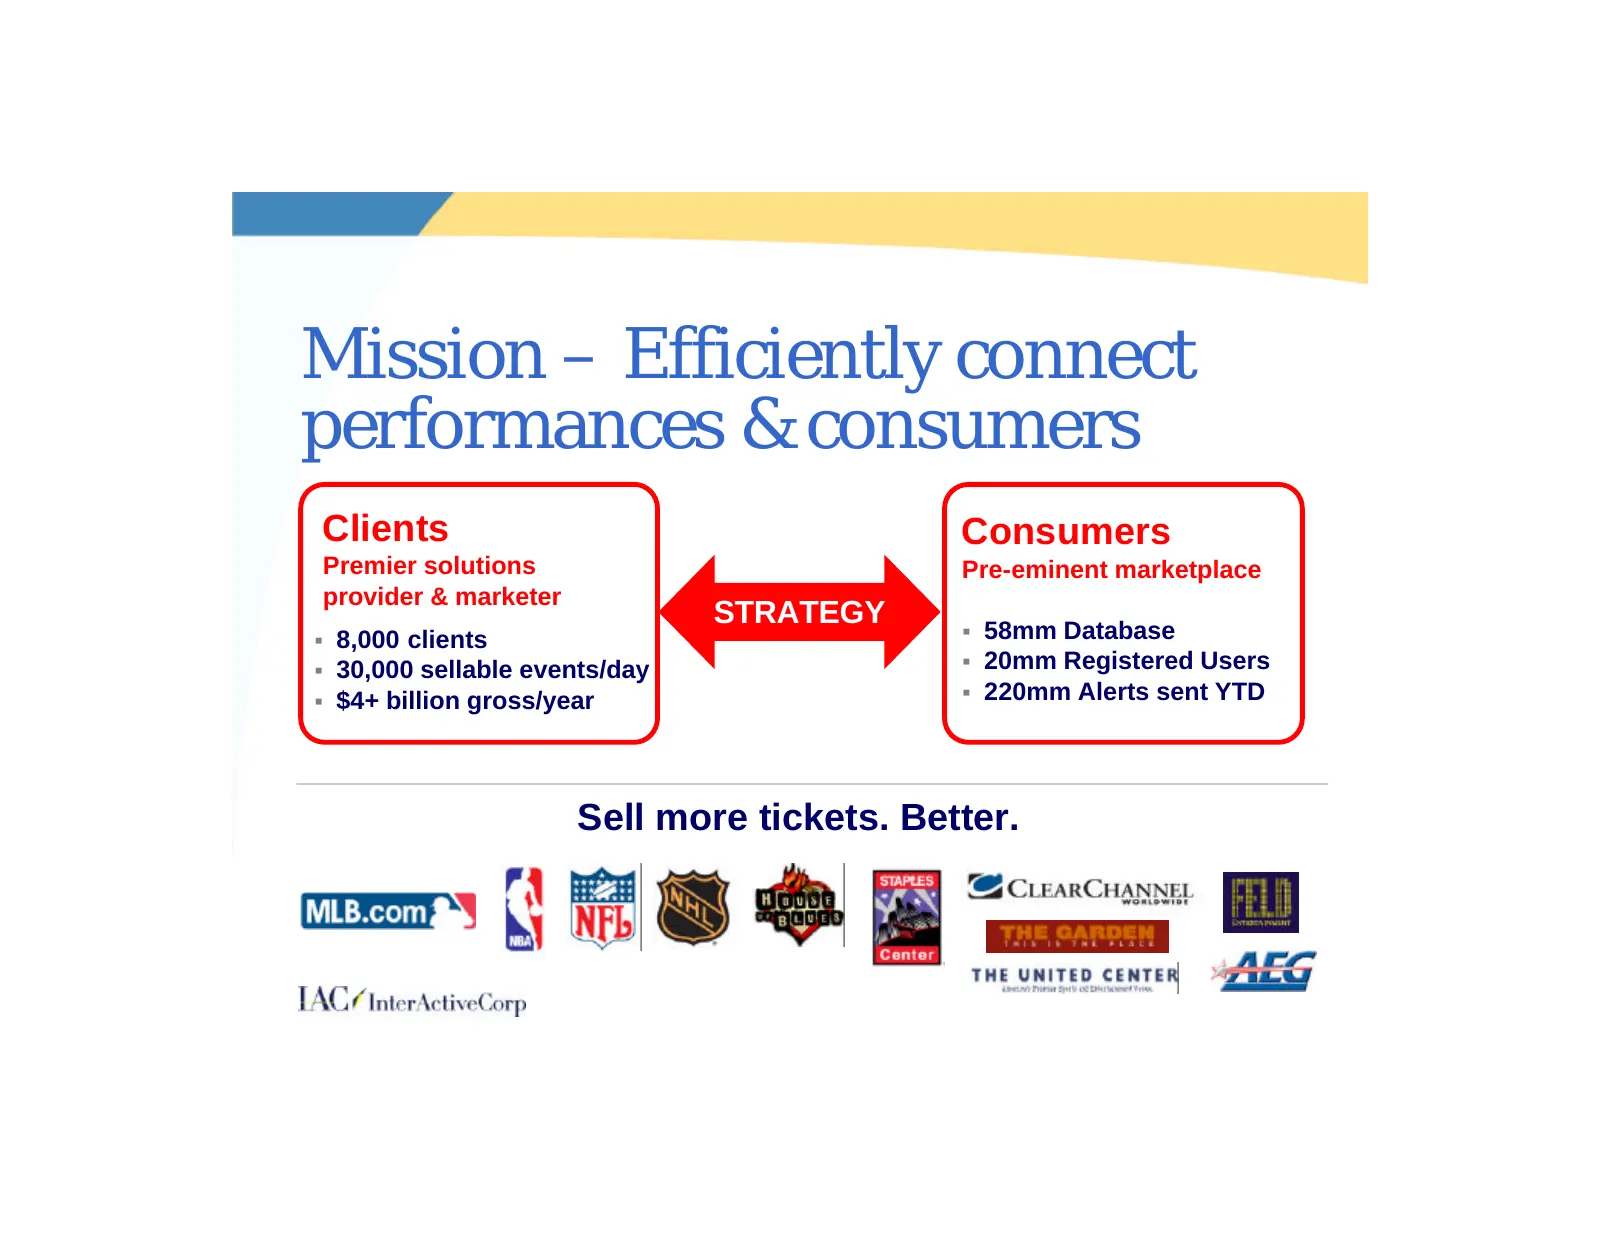
Mission – Efficiently connect performances & consumers Clients Consumers Premier solutions Pre-eminent marketplace provider & marketer STRATEGY § 58mm Database § 8,000 clients § 30,000 sellable events/day § 20mm Registered Users § $4+ billion gross/year § 220mm Alerts sent YTD Sell more tickets. Bet
Slide 68: Results have been strong
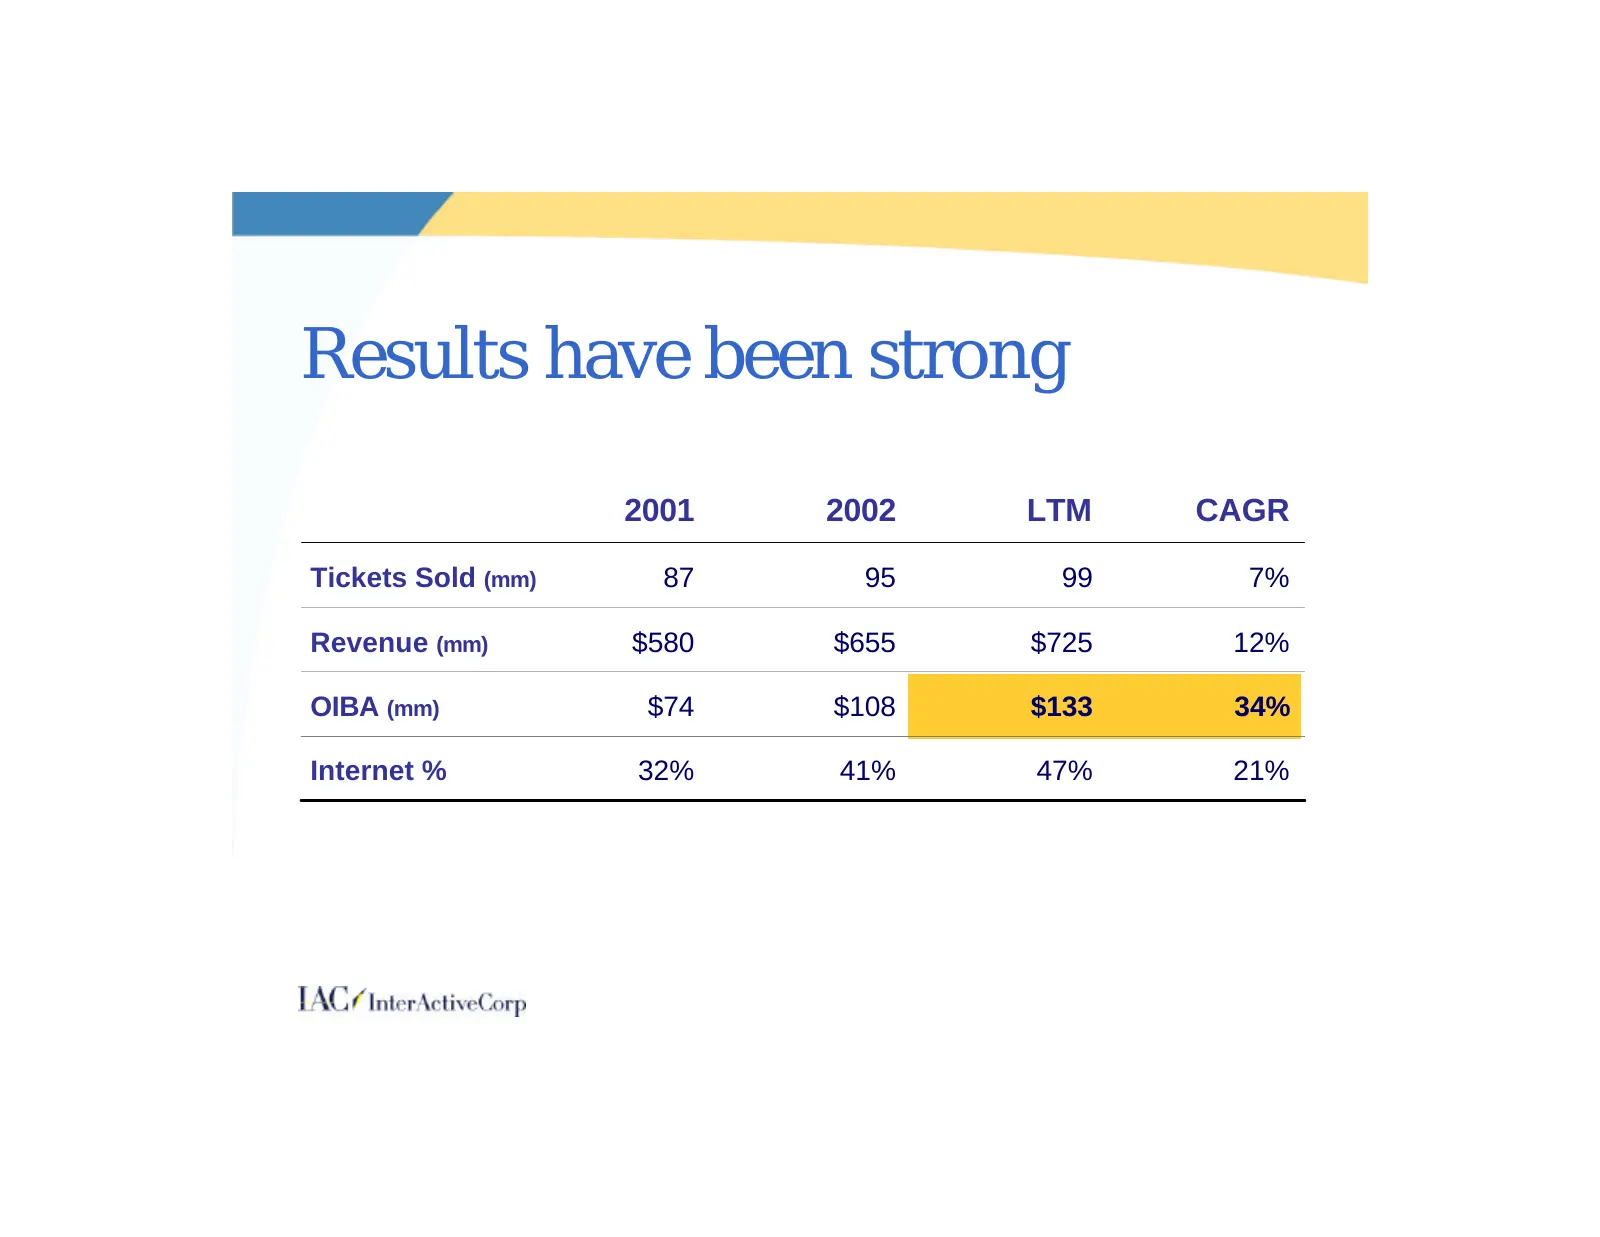
Results have been strong 2001 2002 LTM CAGR Tickets Sold (mm) 87 95 99 7% Revenue (mm) $580 $655 $725 12% OIBA (mm) $74 $108 $133 34% Internet % 32% 41% 47% 21%
Slide 69: The Internet fuels our growth opportunities
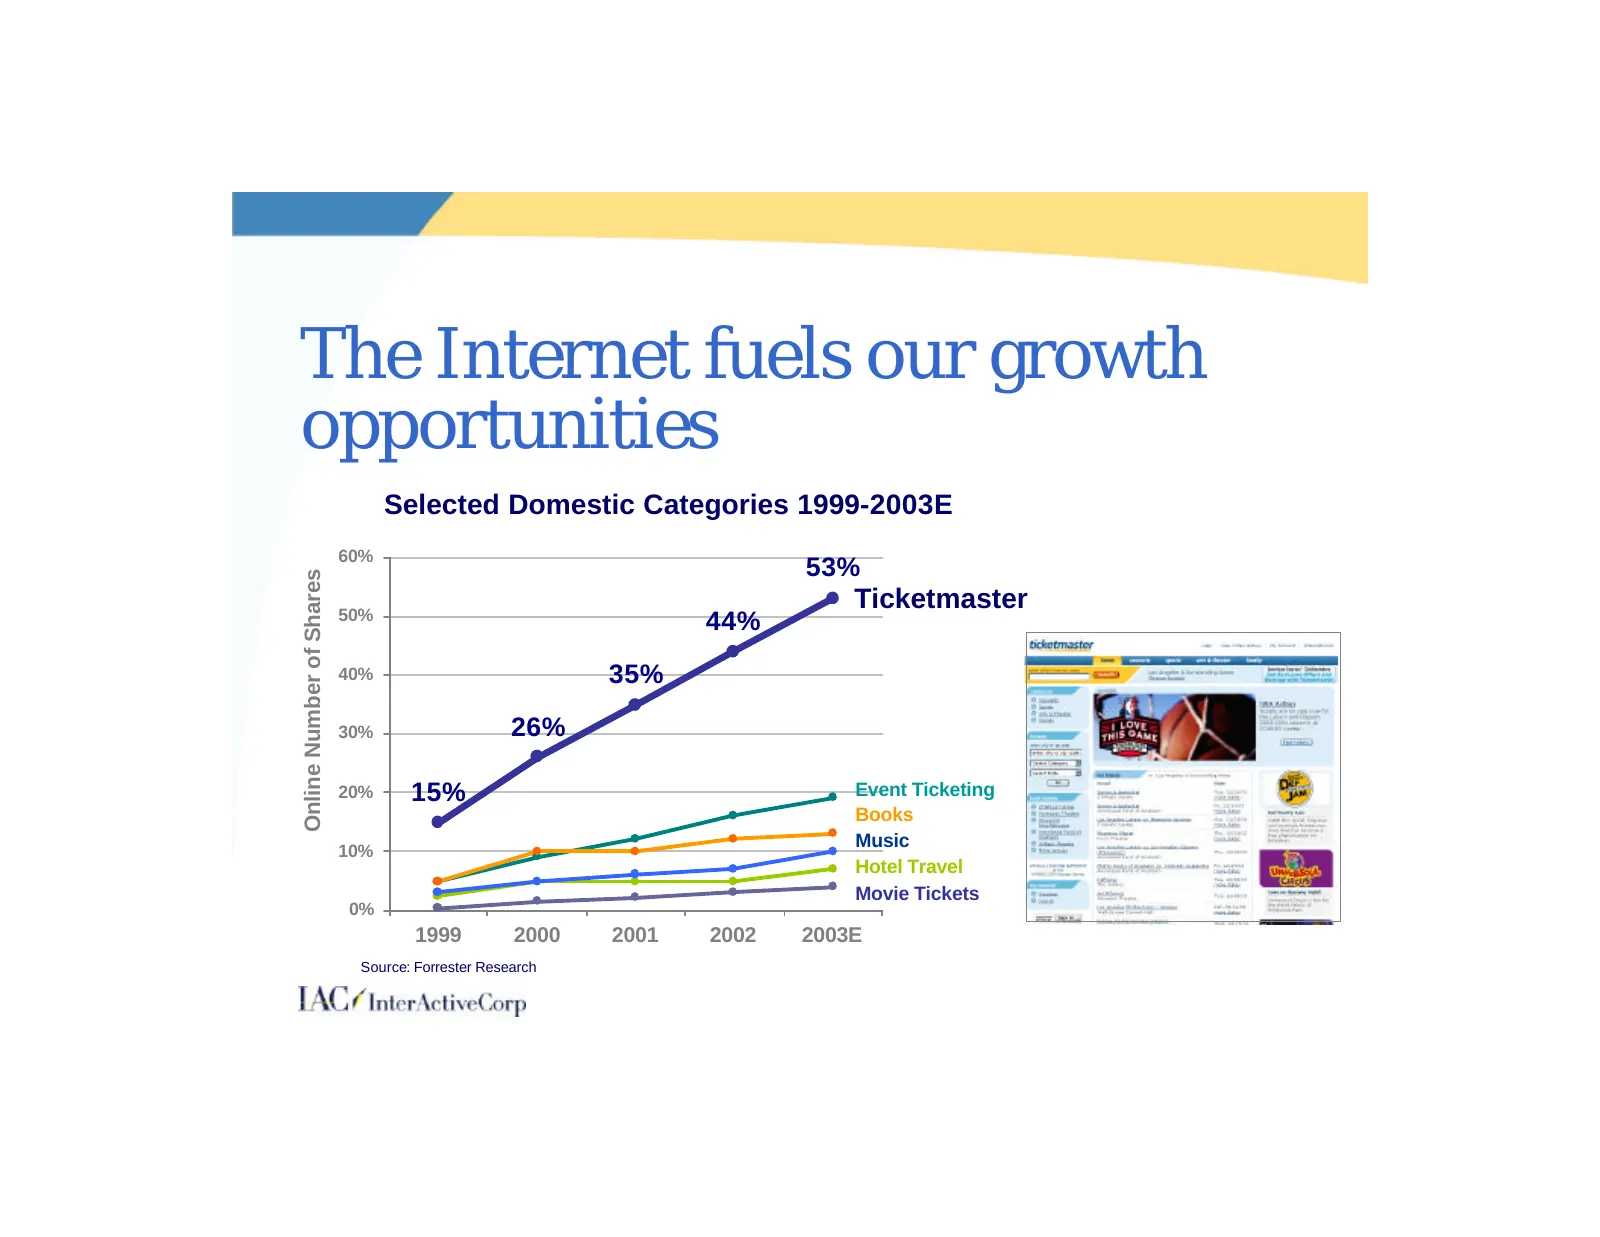
The Internet fuels our growth opportunities Selected Domestic Categories 1999-2003E 60% 53% Online Number of Shares 50% Ticketmaster 44% 40% 35% 30% 26% 20% 15% Event Ticketing Books 10% Music Hotel Travel Movie Tickets 0% 1999 2000 2001 2002 2003E Source: Forrester Research
Slide 70: Growth drivers
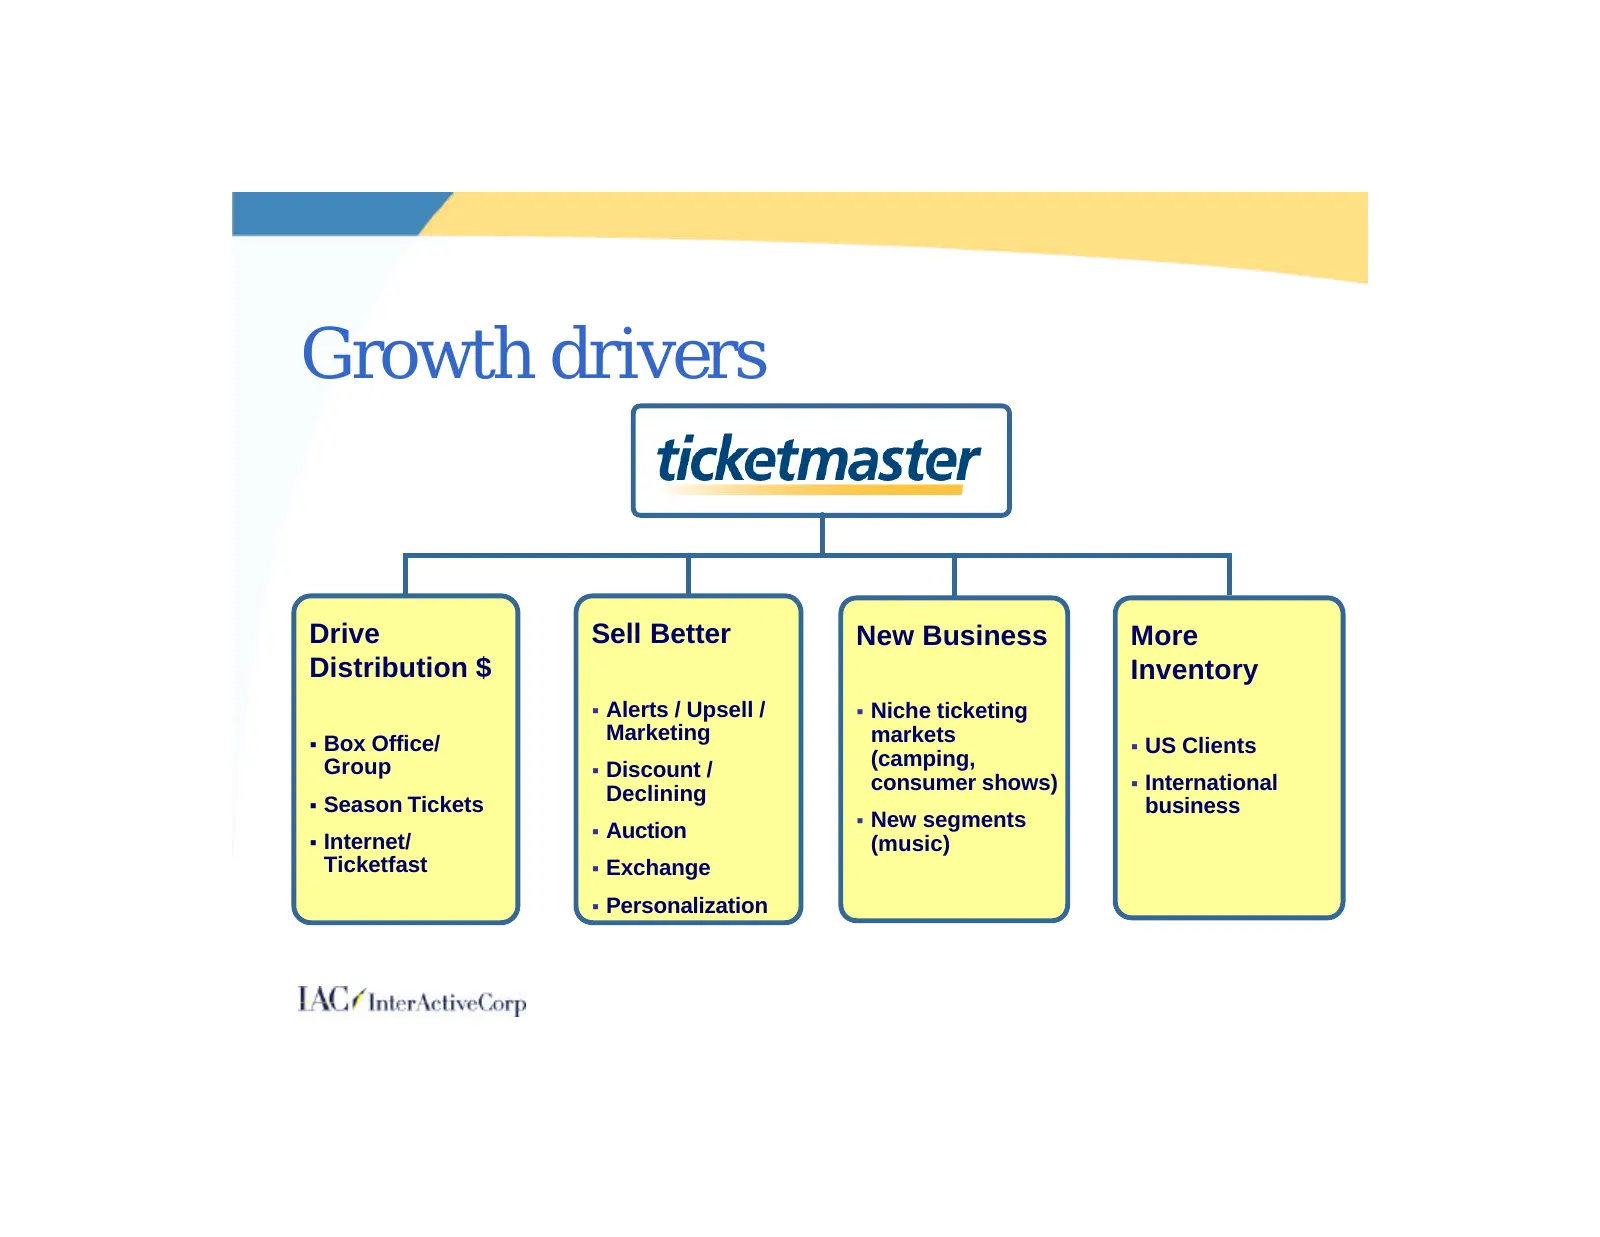
Growth drivers Drive Sell Better New Business More Distribution $ Inventory § Alerts / Upsell / § Niche ticketing § Box Office/ Marketing markets § US Clients Group (camping, § Discount / consumer shows) § International § Season Tickets Declining business § New segments § Auction § Internet/ (music)
Slide 71: Ticketmaster already has the inventory to grow
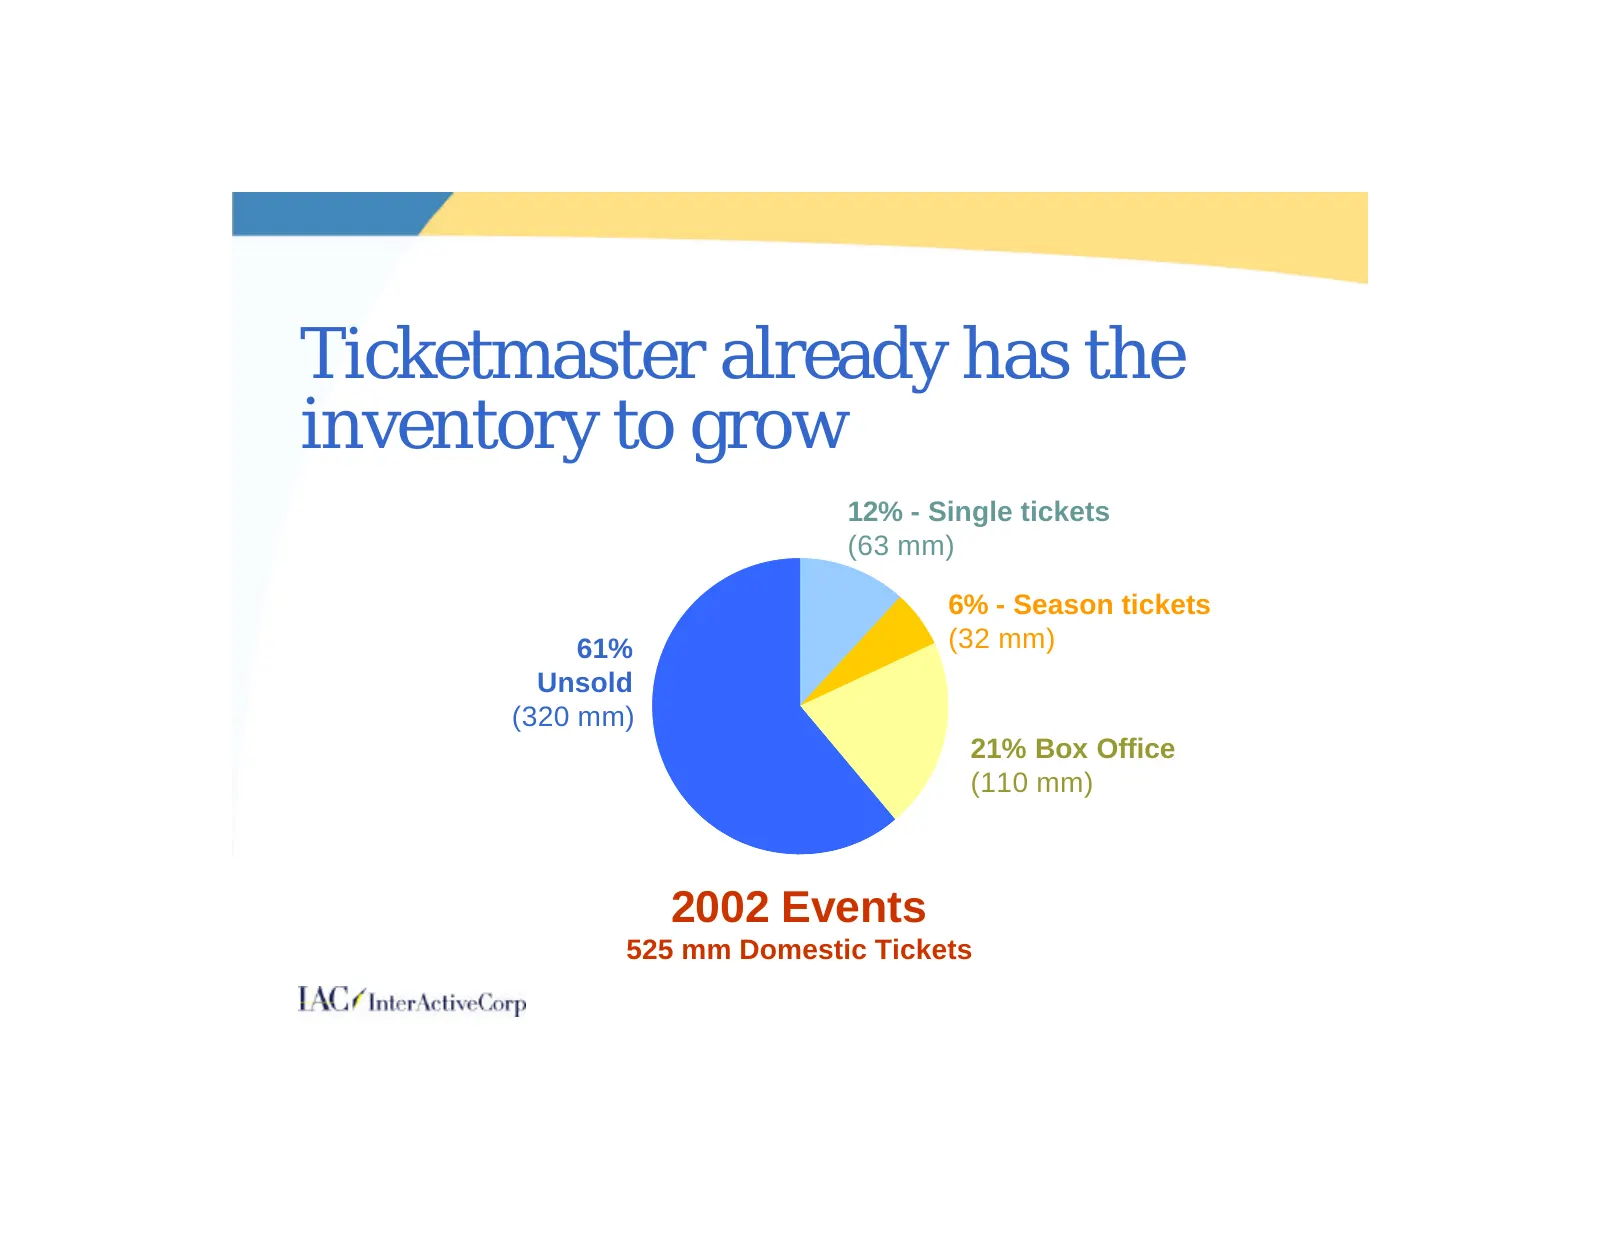
Ticketmaster already has the inventory to grow 12% - Single tickets (63 mm) 6% - Season tickets 61% (32 mm) Unsold (320 mm) 21% Box Office (110 mm) 2002 Events 525 mm Domestic Tickets
Slide 72: Box office migration is a significant opportunity
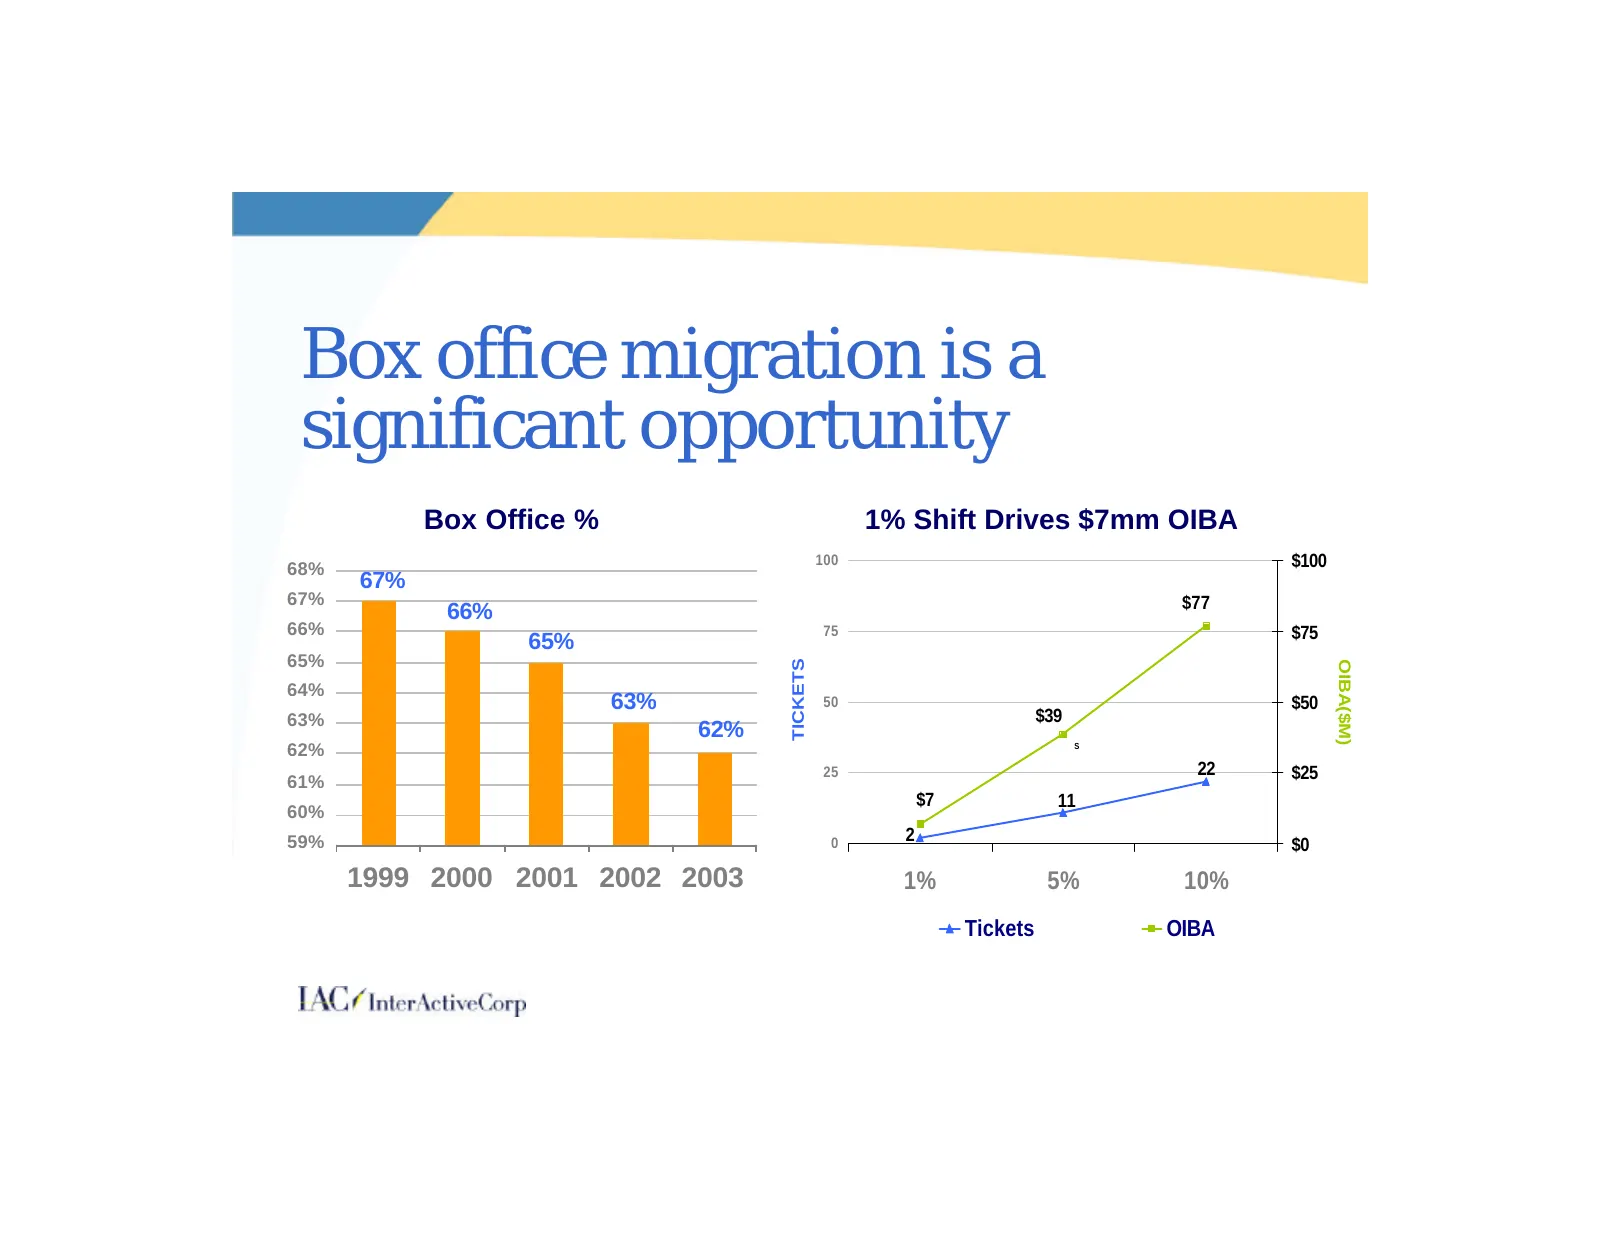
Box office migration is a significant opportunity Box Office % 1% Shift Drives $7mm OIBA 68% 100 $100 67% 67% $77 66% 66% 75 $75 65% 65% TICKETS OIBA($M) 64% 63% 50 $50 63% $39 62% 62% S 25 22 $25 61% $7 11 60% 59% 0 2 $0 1999 2000 2001 2002 2003 1% 5% 10% Tickets OIBA
Slide 73: Growth in TM Alerts 2002 – YTD 2003
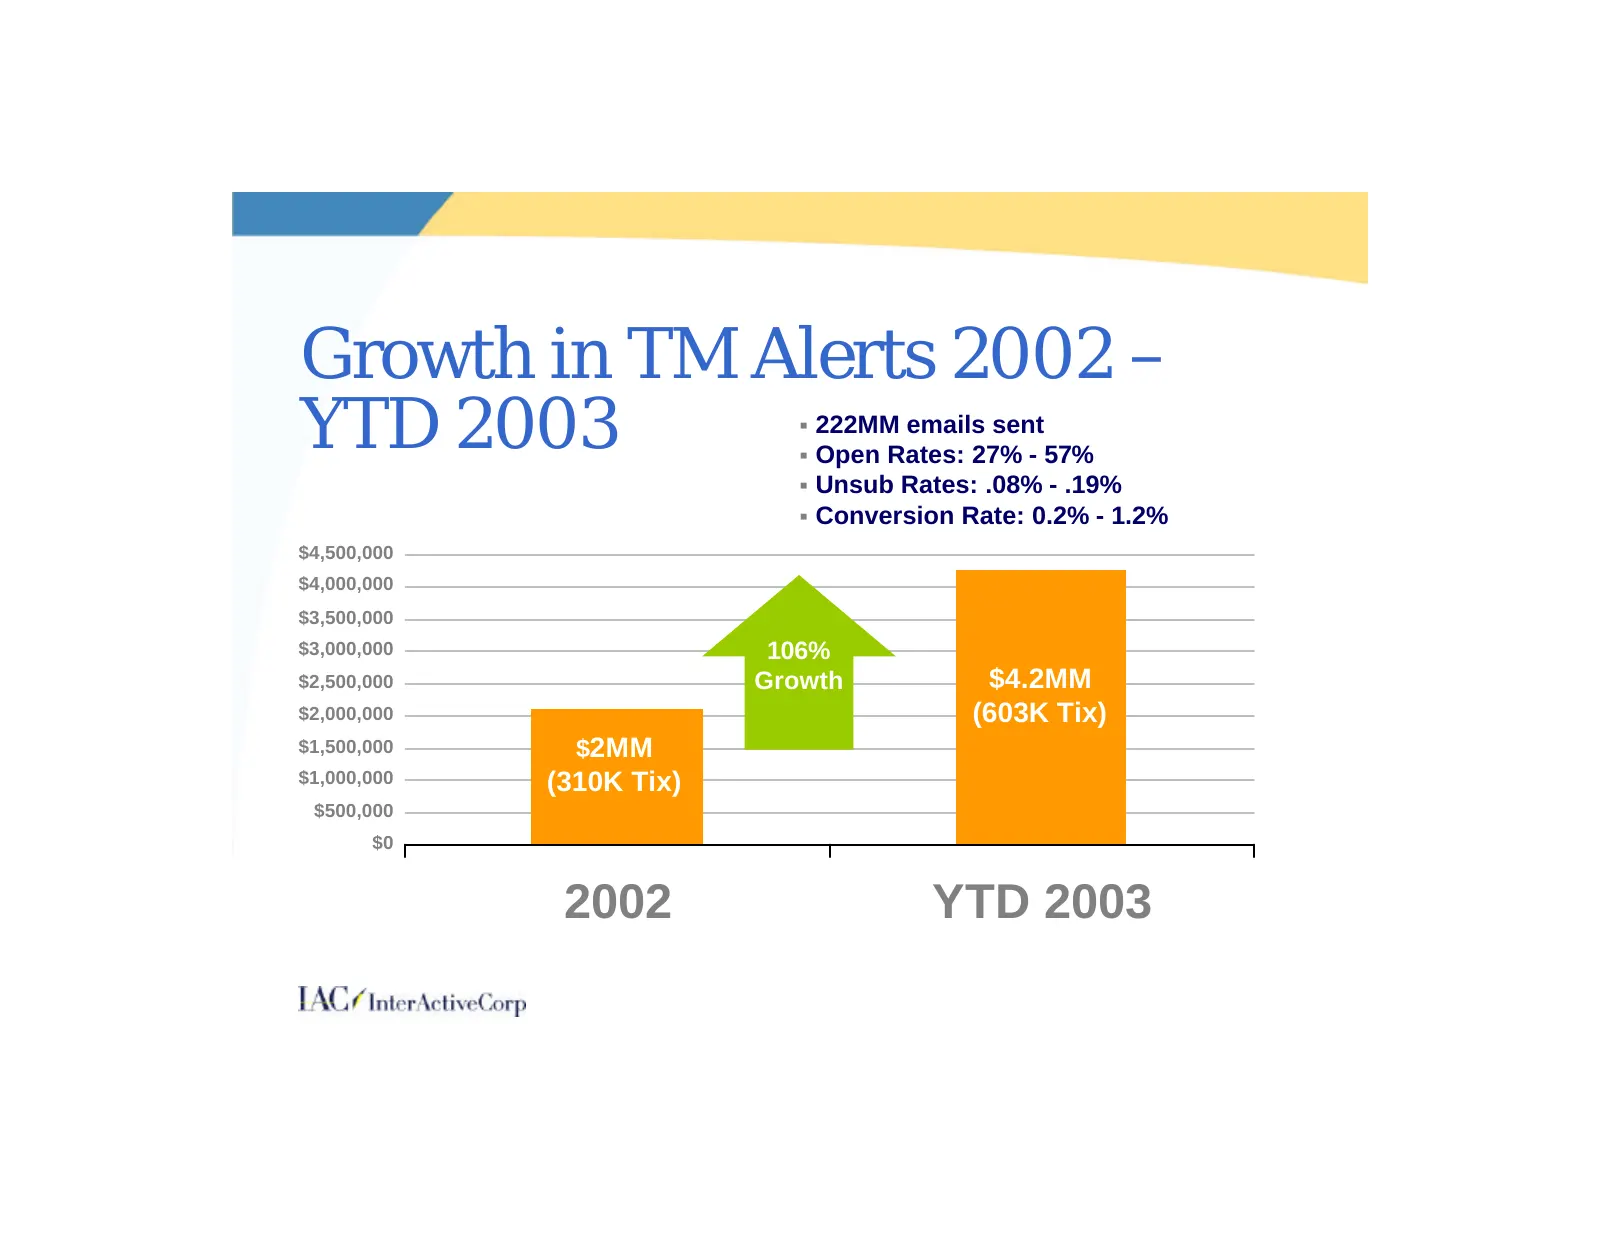
Growth in TM Alerts 2002 – YTD 2003 § 222MM emails sent § Open Rates: 27% - 57% § Unsub Rates: .08% - .19% § Conversion Rate: 0.2% - 1.2% 106% $4,500,000 Growth $4,000,000 $3,500,000 $3,000,000 106% $2,500,000 Growth $4.2MM $2,000,000 (603K Tix) $1,500,000 $2MM $1,000,000 (310K Tix) $500,000 $0 2002
Slide 74: Discount channels
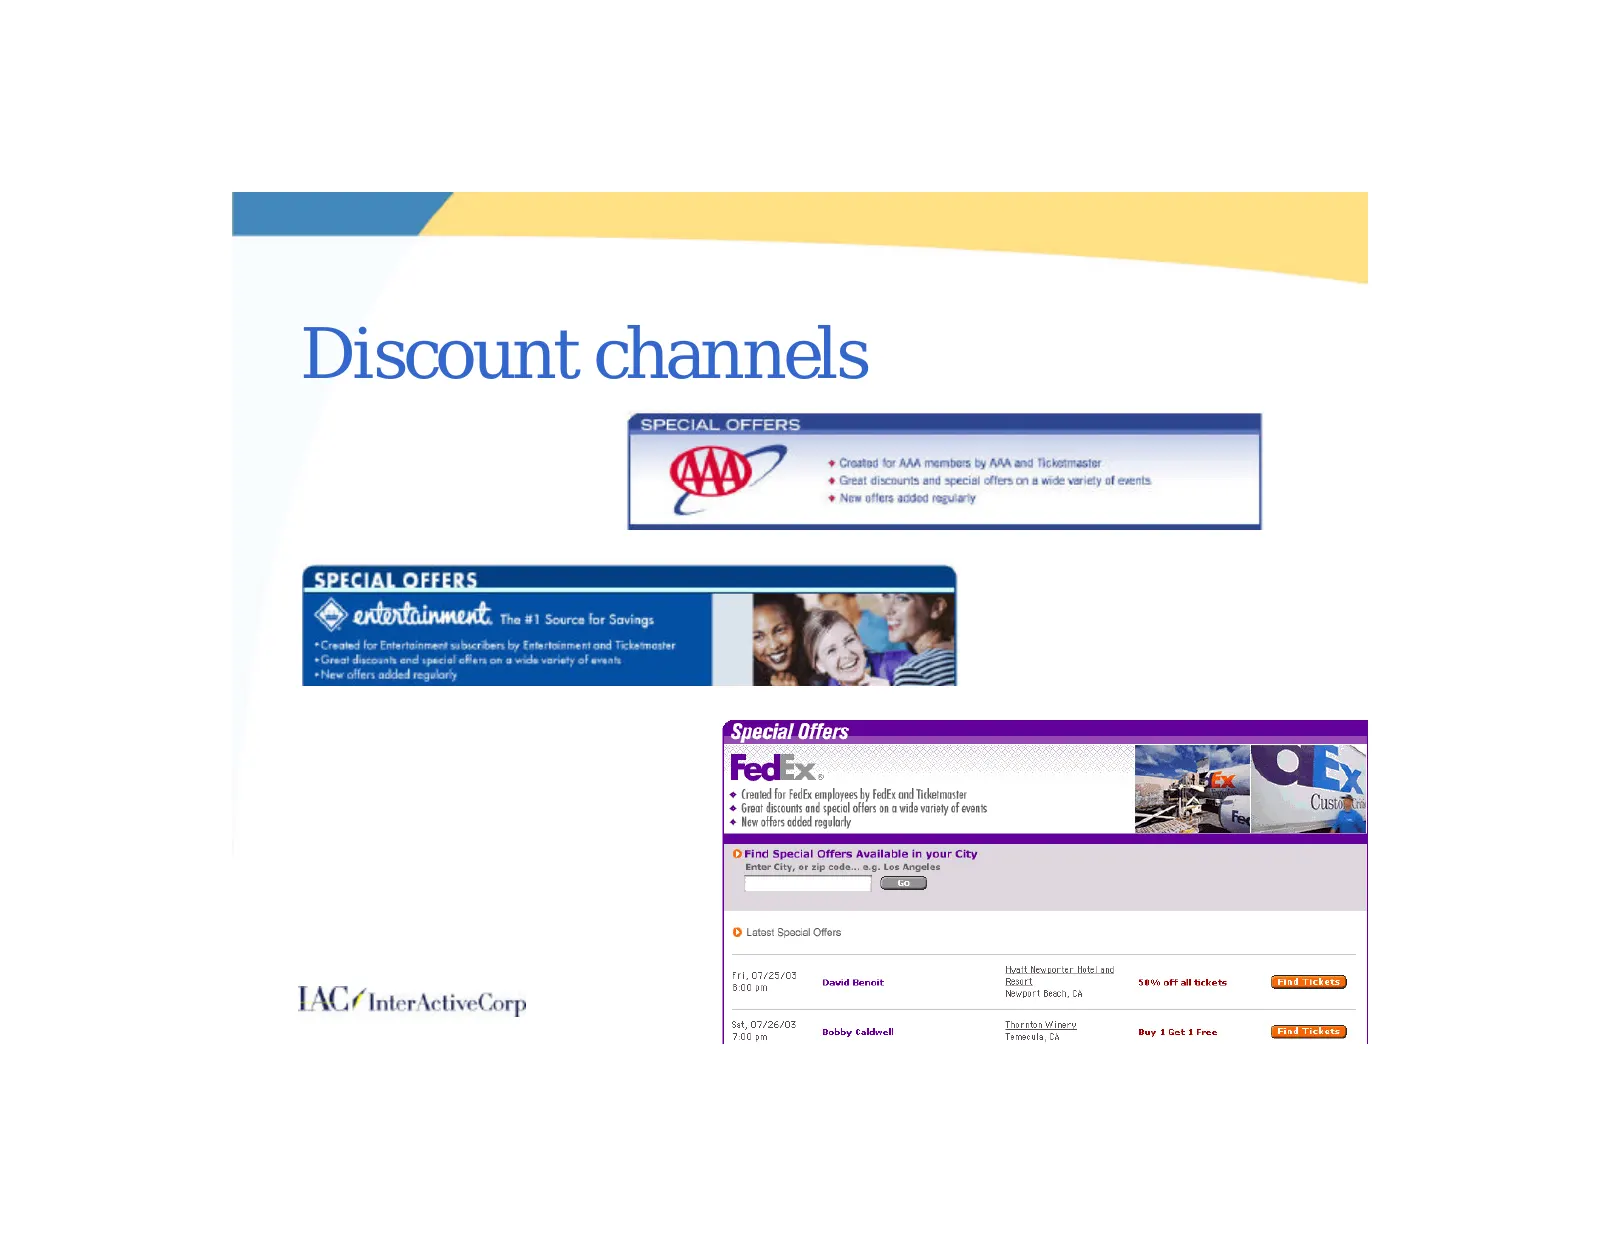
Discount channels TACS InterActiveCorp ++ Created for AAA members by AAA and Ticketmaster Great discounts and special offers on a wide variety of events + New offers acded reguiarly Special Offers. ‘Coe for Fe employes by Fel ond Tissier * Groat scuns an spel offs on avid varity of evo + New ofr ded
Slide 75: Dynamic pricing: The landscape
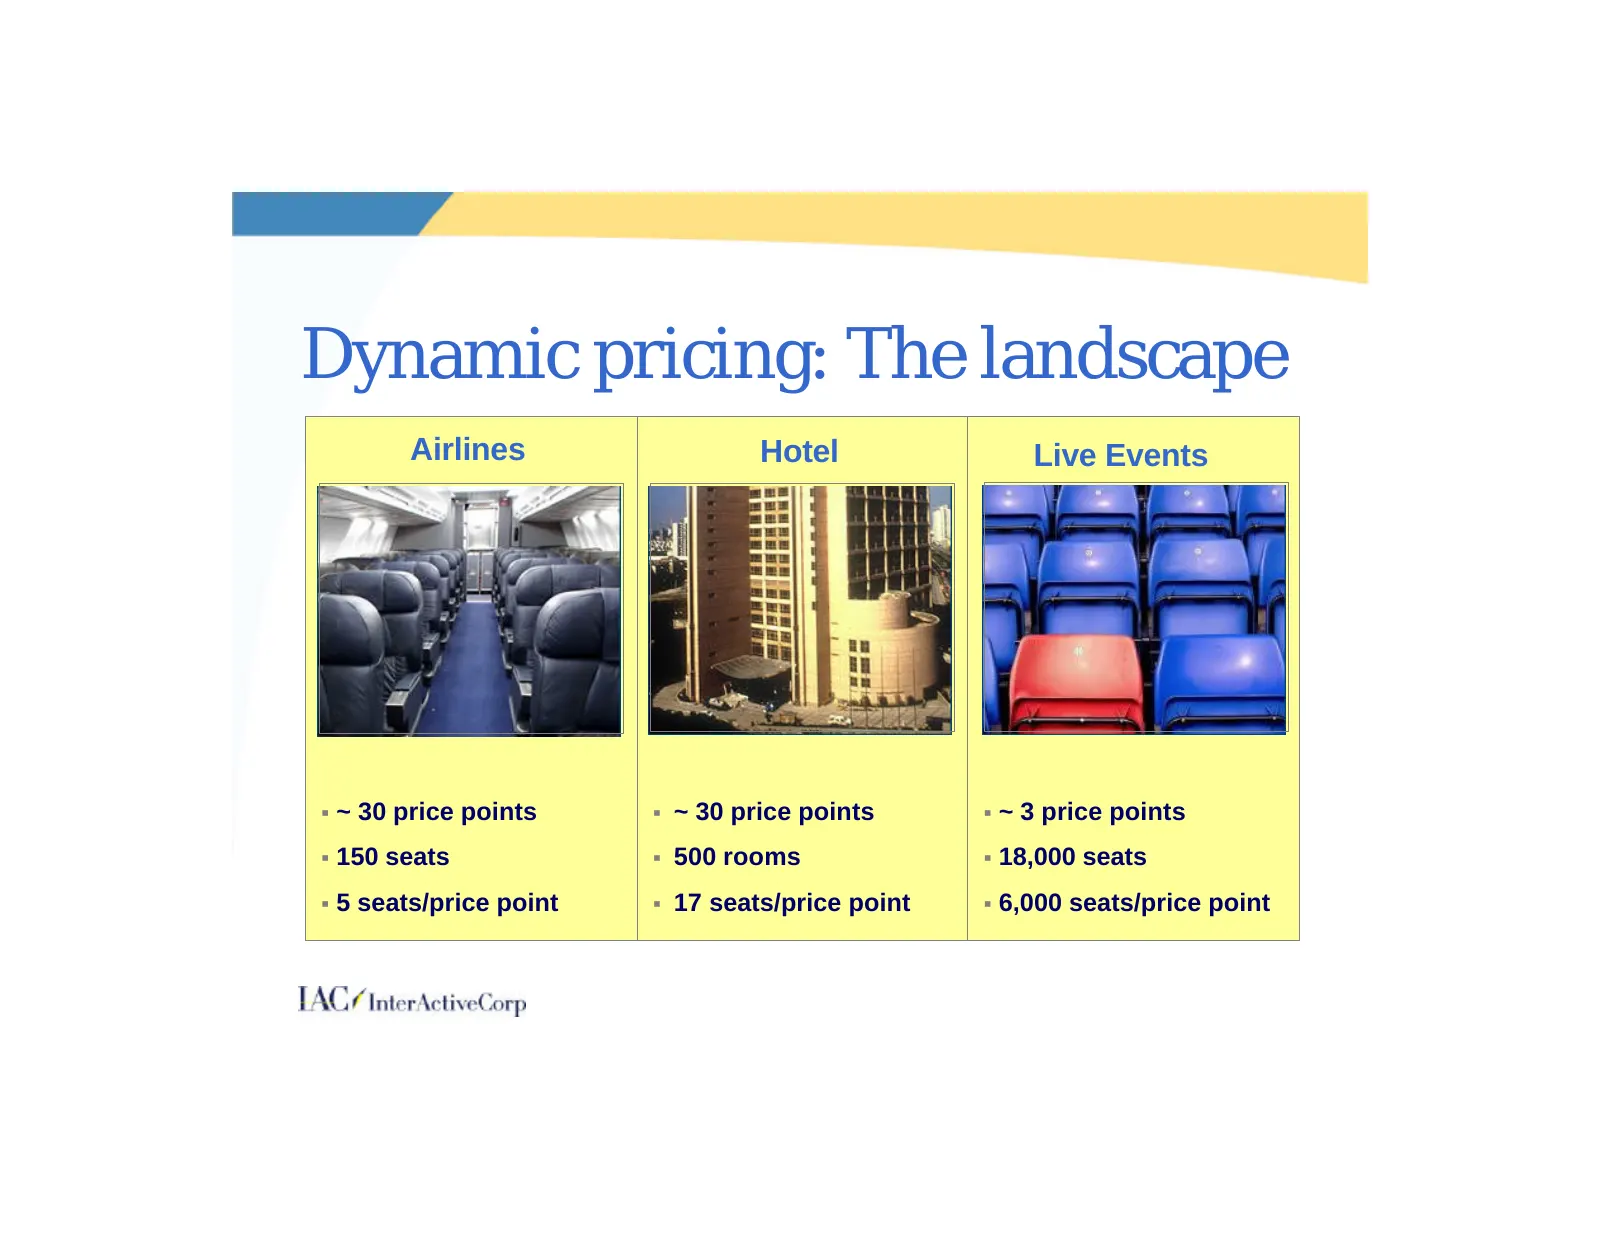
Dynamic pricing: The landscape Airlines Hotel Live Events § ~ 30 price points § ~ 30 price points § ~ 3 price points § 150 seats § 500 rooms § 18,000 seats § 5 seats/price point § 17 seats/price point § 6,000 seats/price point
Slide 76: Efficient pricing offers significant value
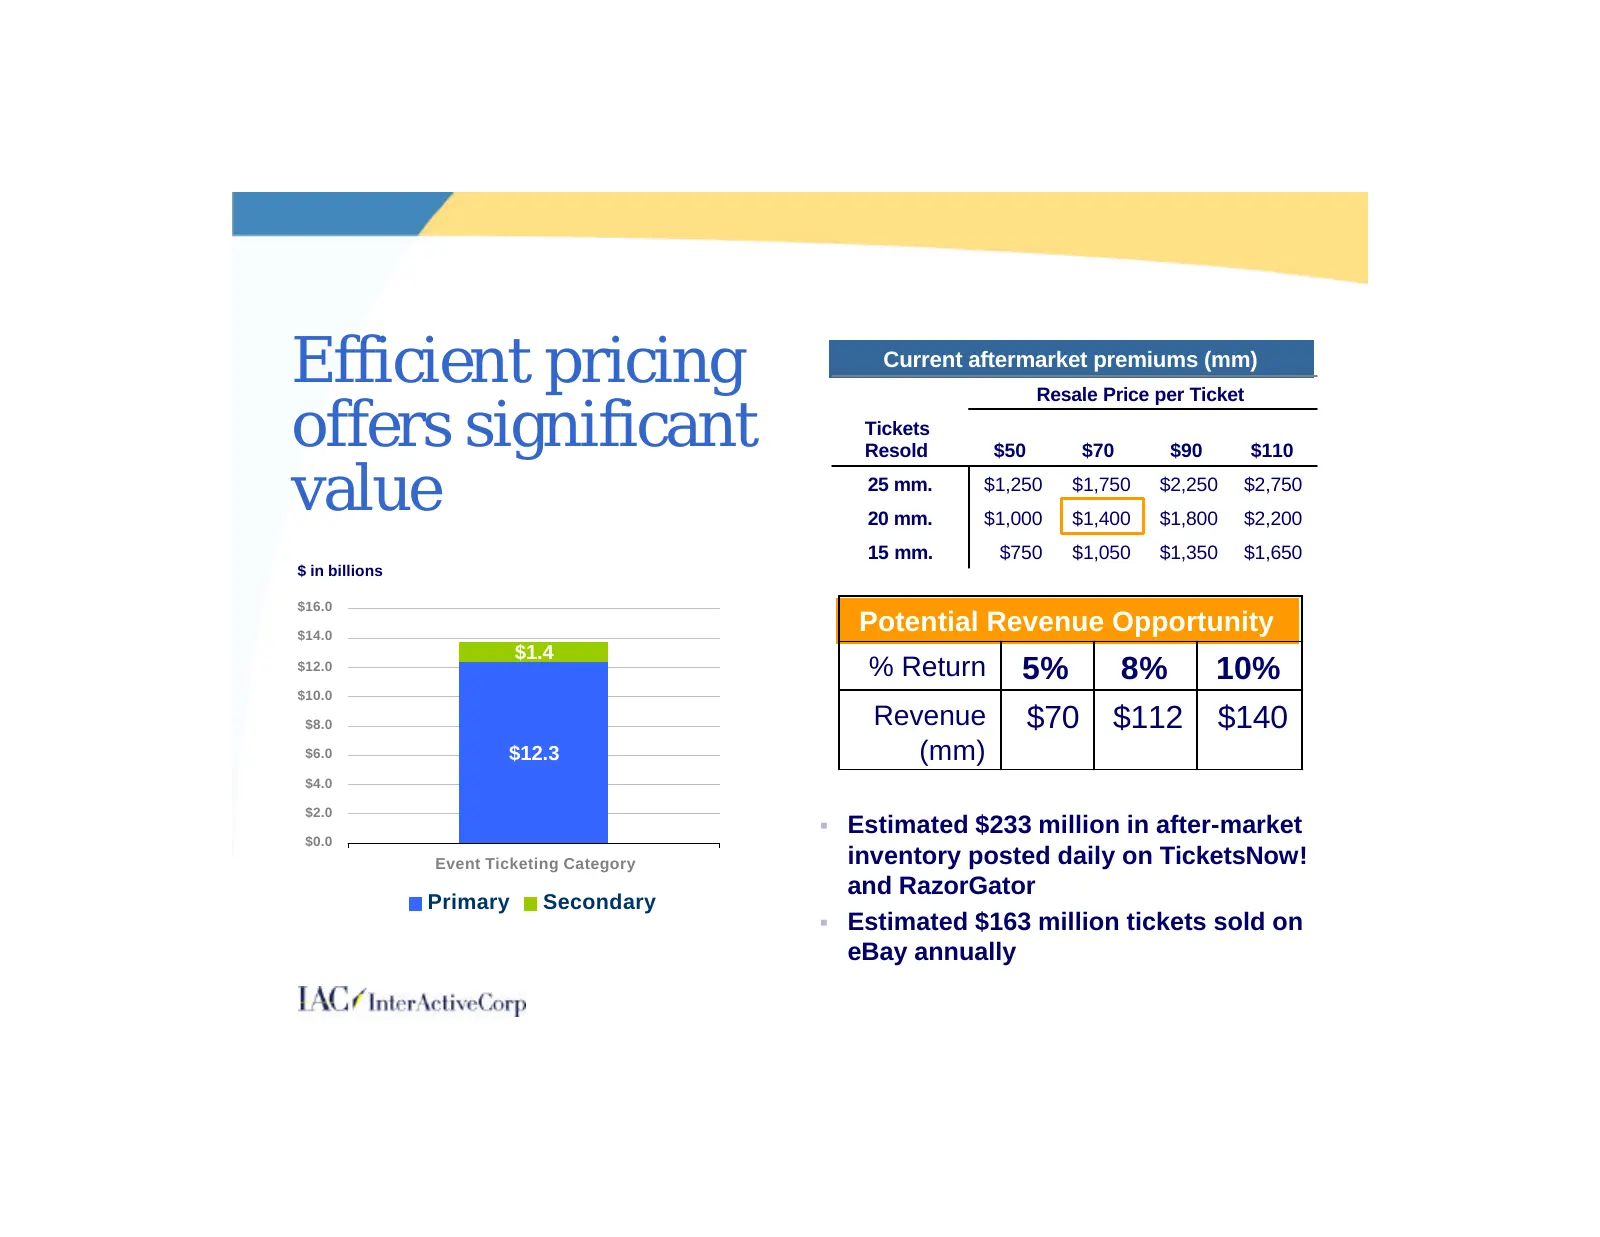
Efficient pricing Current aftermarket premiums (mm) Resale Price per Ticket offers significant Tickets Resold $50 $70 $90 $110 value 25 mm. 20 mm. $1,250 $1,000 $1,750 $1,400 $2,250 $1,800 $2,750 $2,200 15 mm. $750 $1,050 $1,350 $1,650 $ in billions $16.0 $14.0 Potential Revenue Opportunity $1.4 $12
Slide 77: Primary market auctions
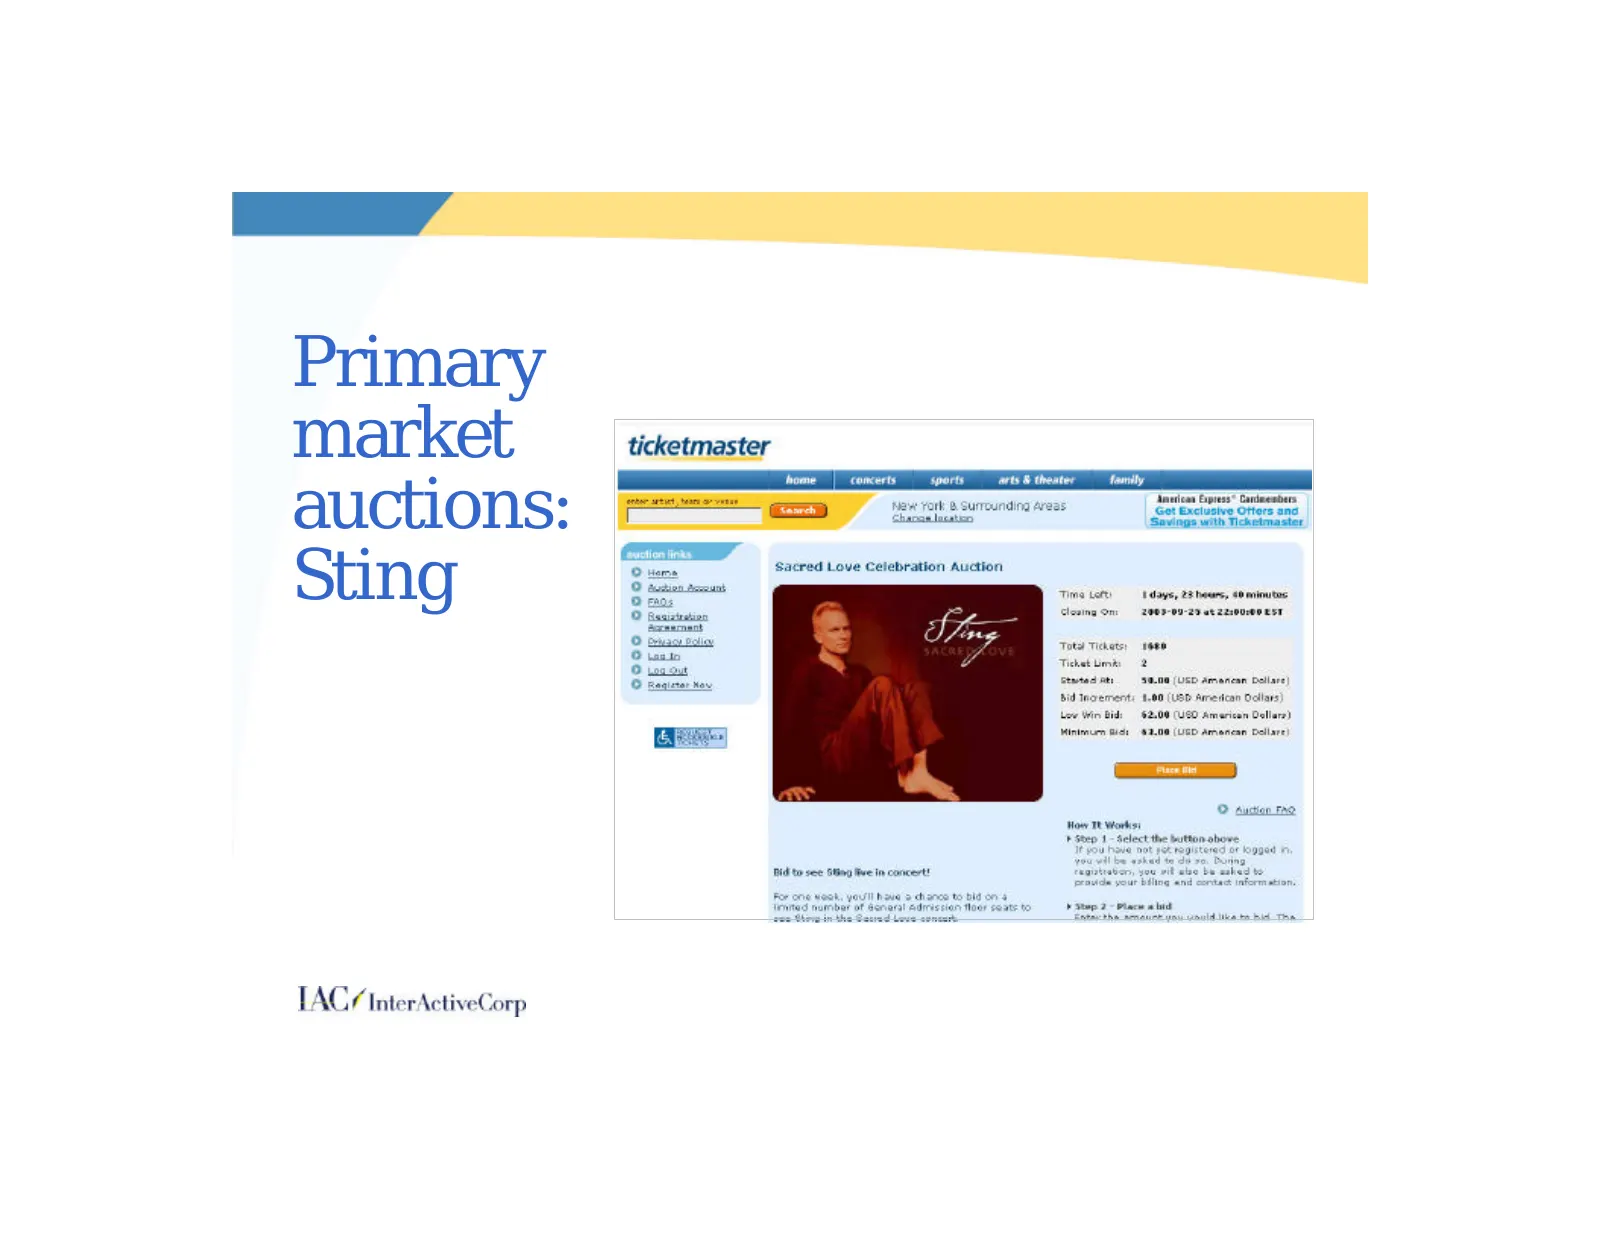
Primary market auctions: Sting
Slide 78: Participation in season ticket sales and transactions
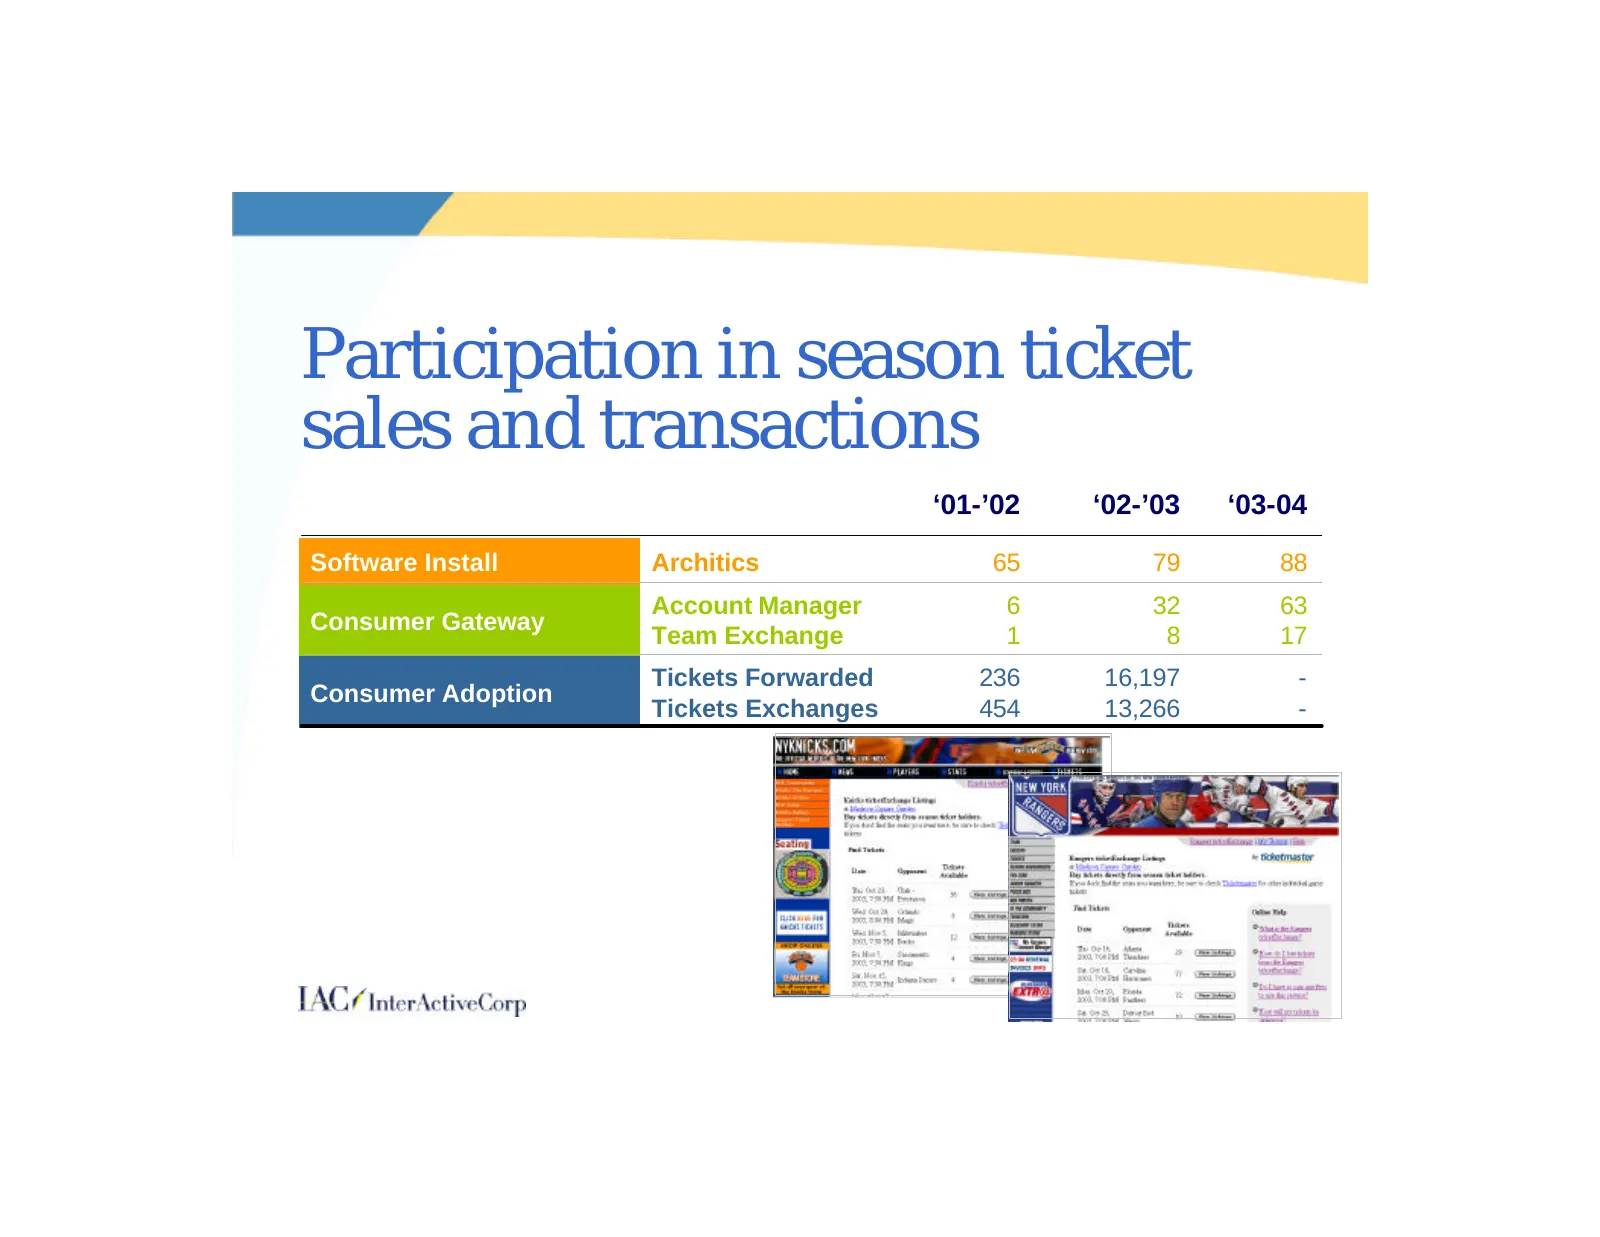
Participation in season ticket sales and transactions ‘01-’02 ‘02-’03 ‘03-04 Software Install Architics 65 79 88 Account Manager 6 32 63 Consumer Gateway Team Exchange 1 8 17 Tickets Forwarded 236 16,197 - Consumer Adoption Tickets Exchanges 454 13,266 -
Slide 79: Digital Music – Soundclips test
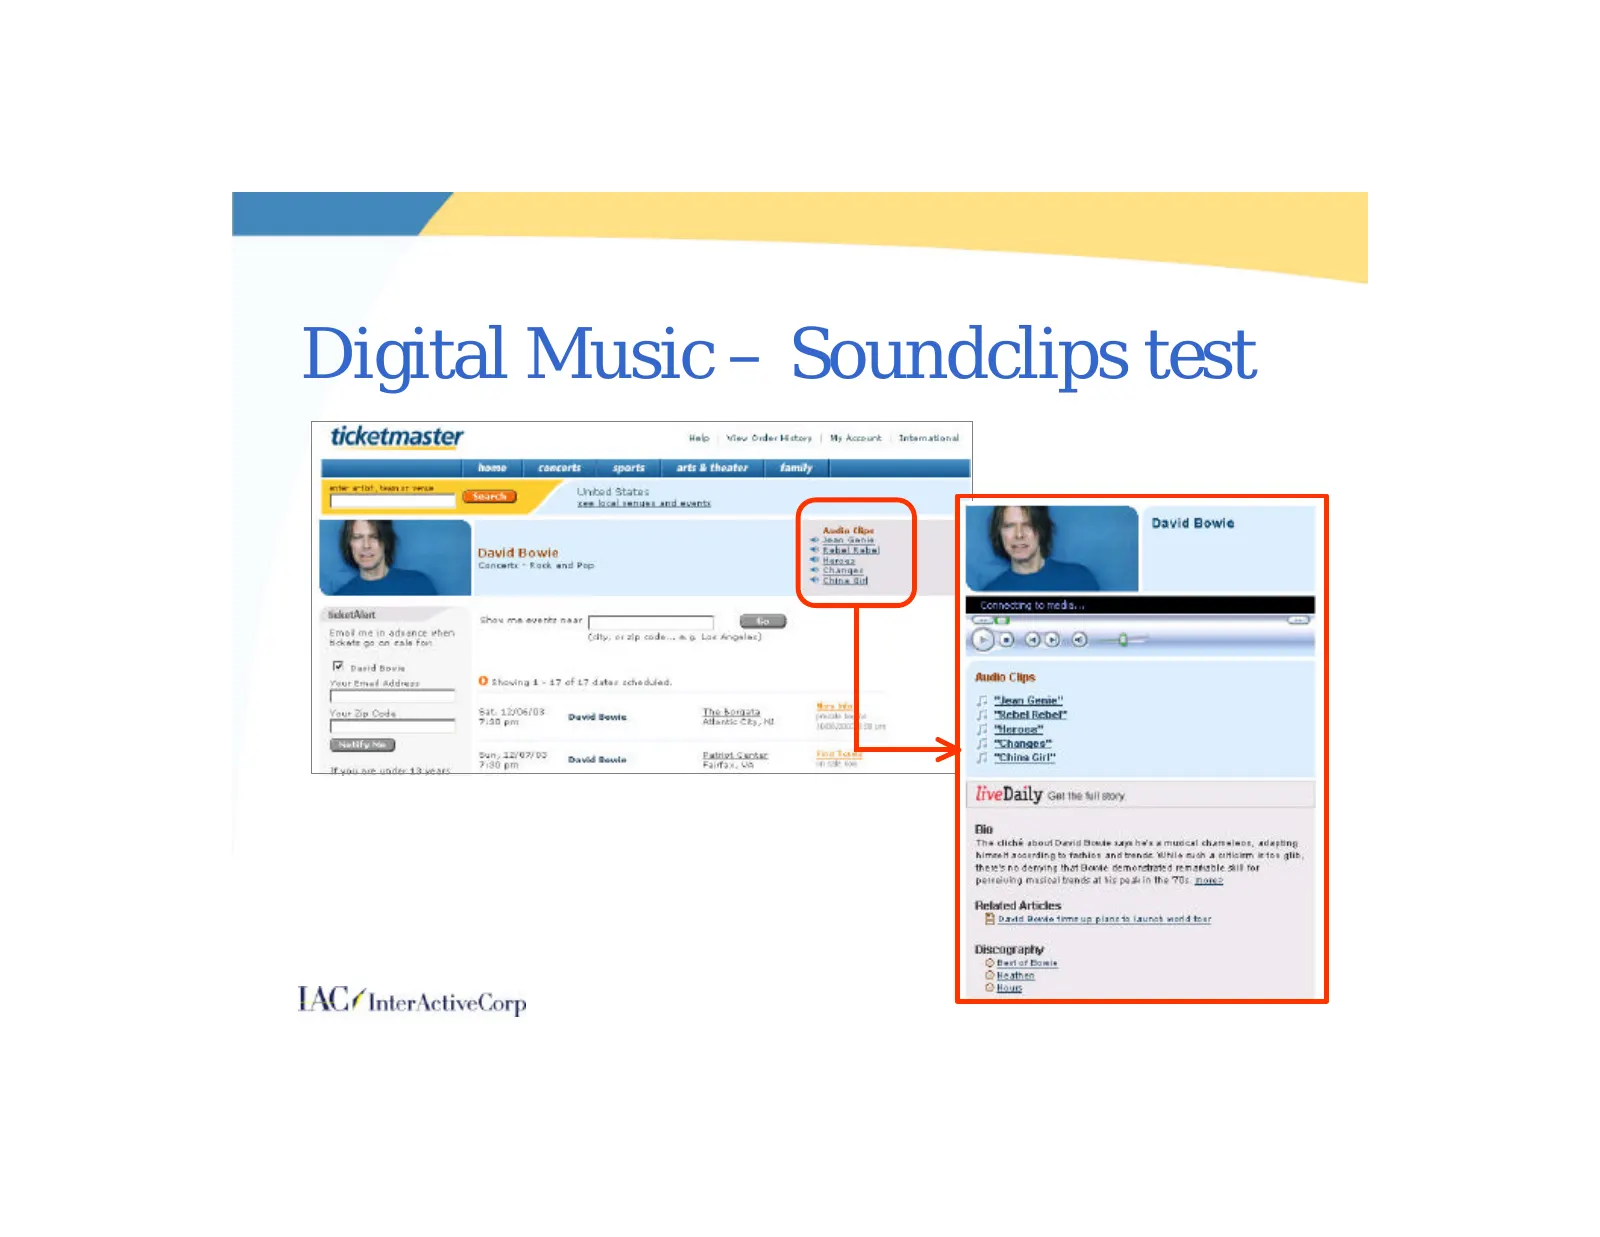
Digital Music – Soundclips test
Slide 80: Personalization will drive consumer behavior
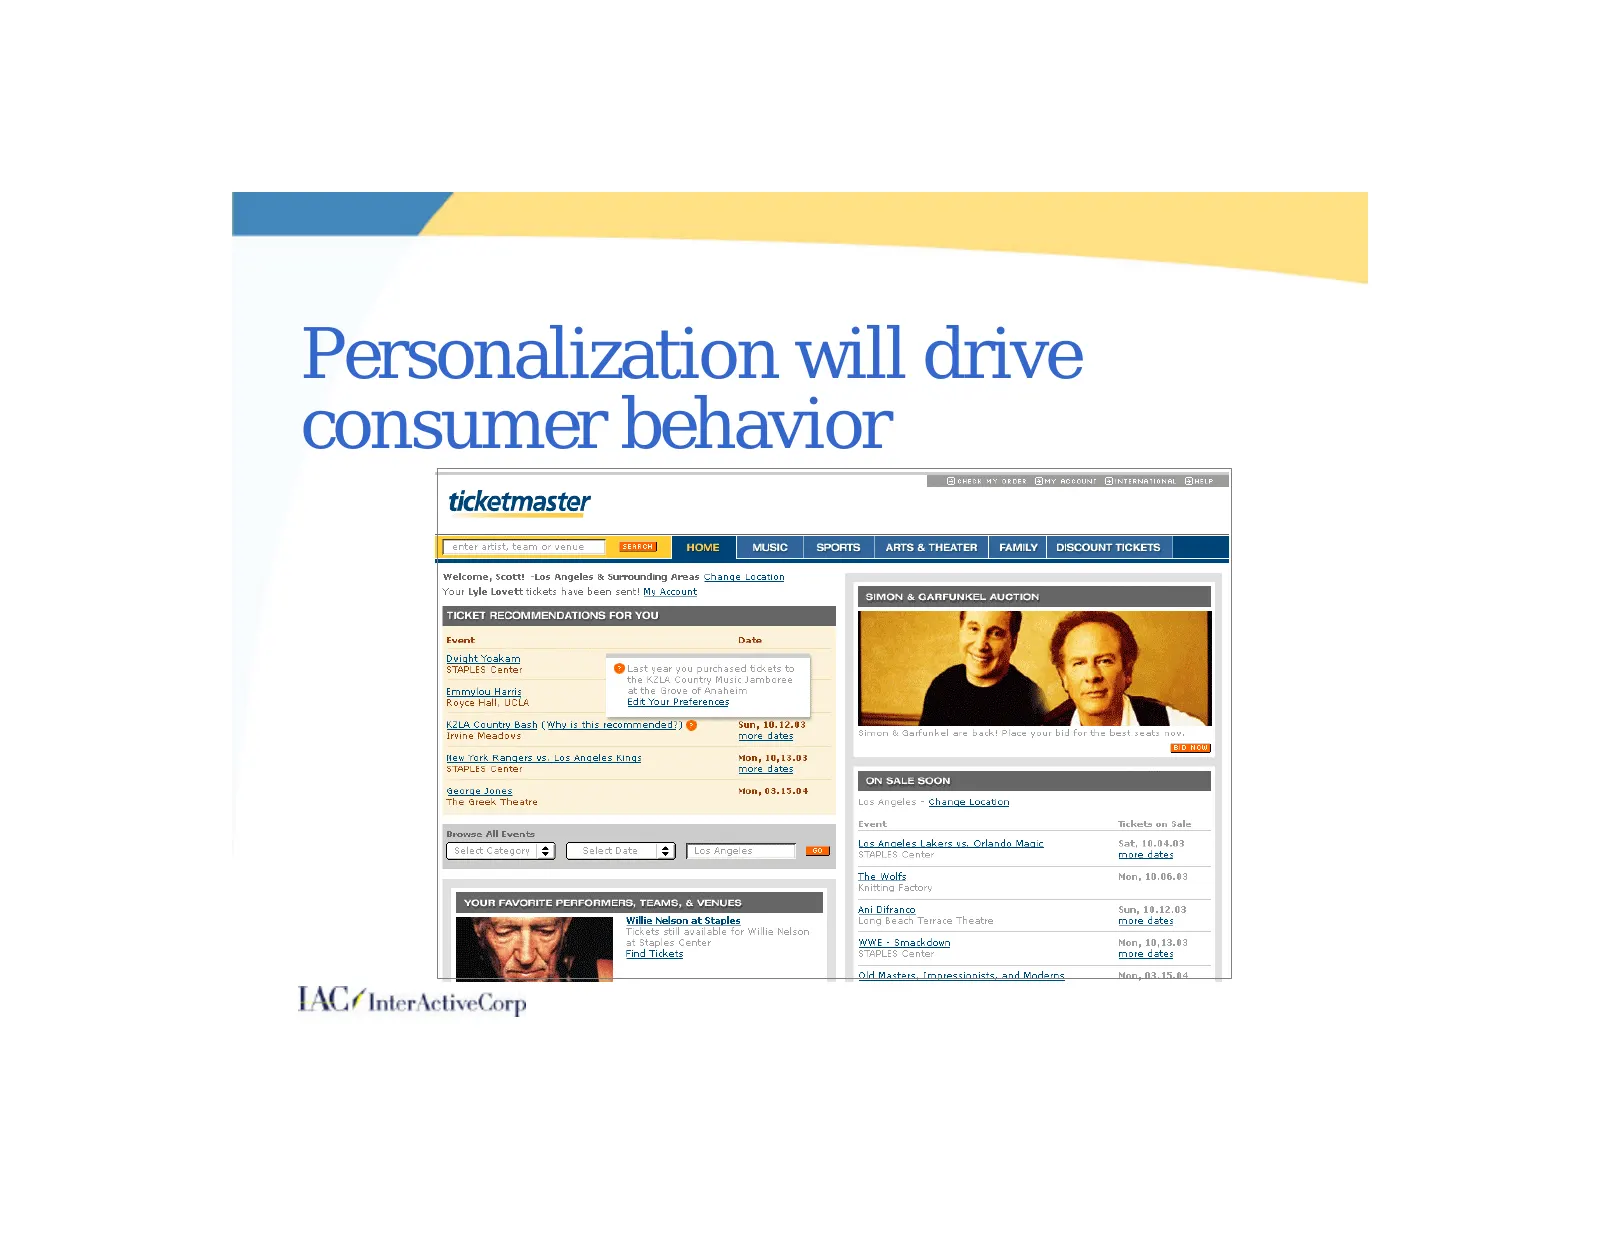
Personalization will drive consumer behavior
Slide 81: Niche Segments: ReserveAmerica & Ticketweb
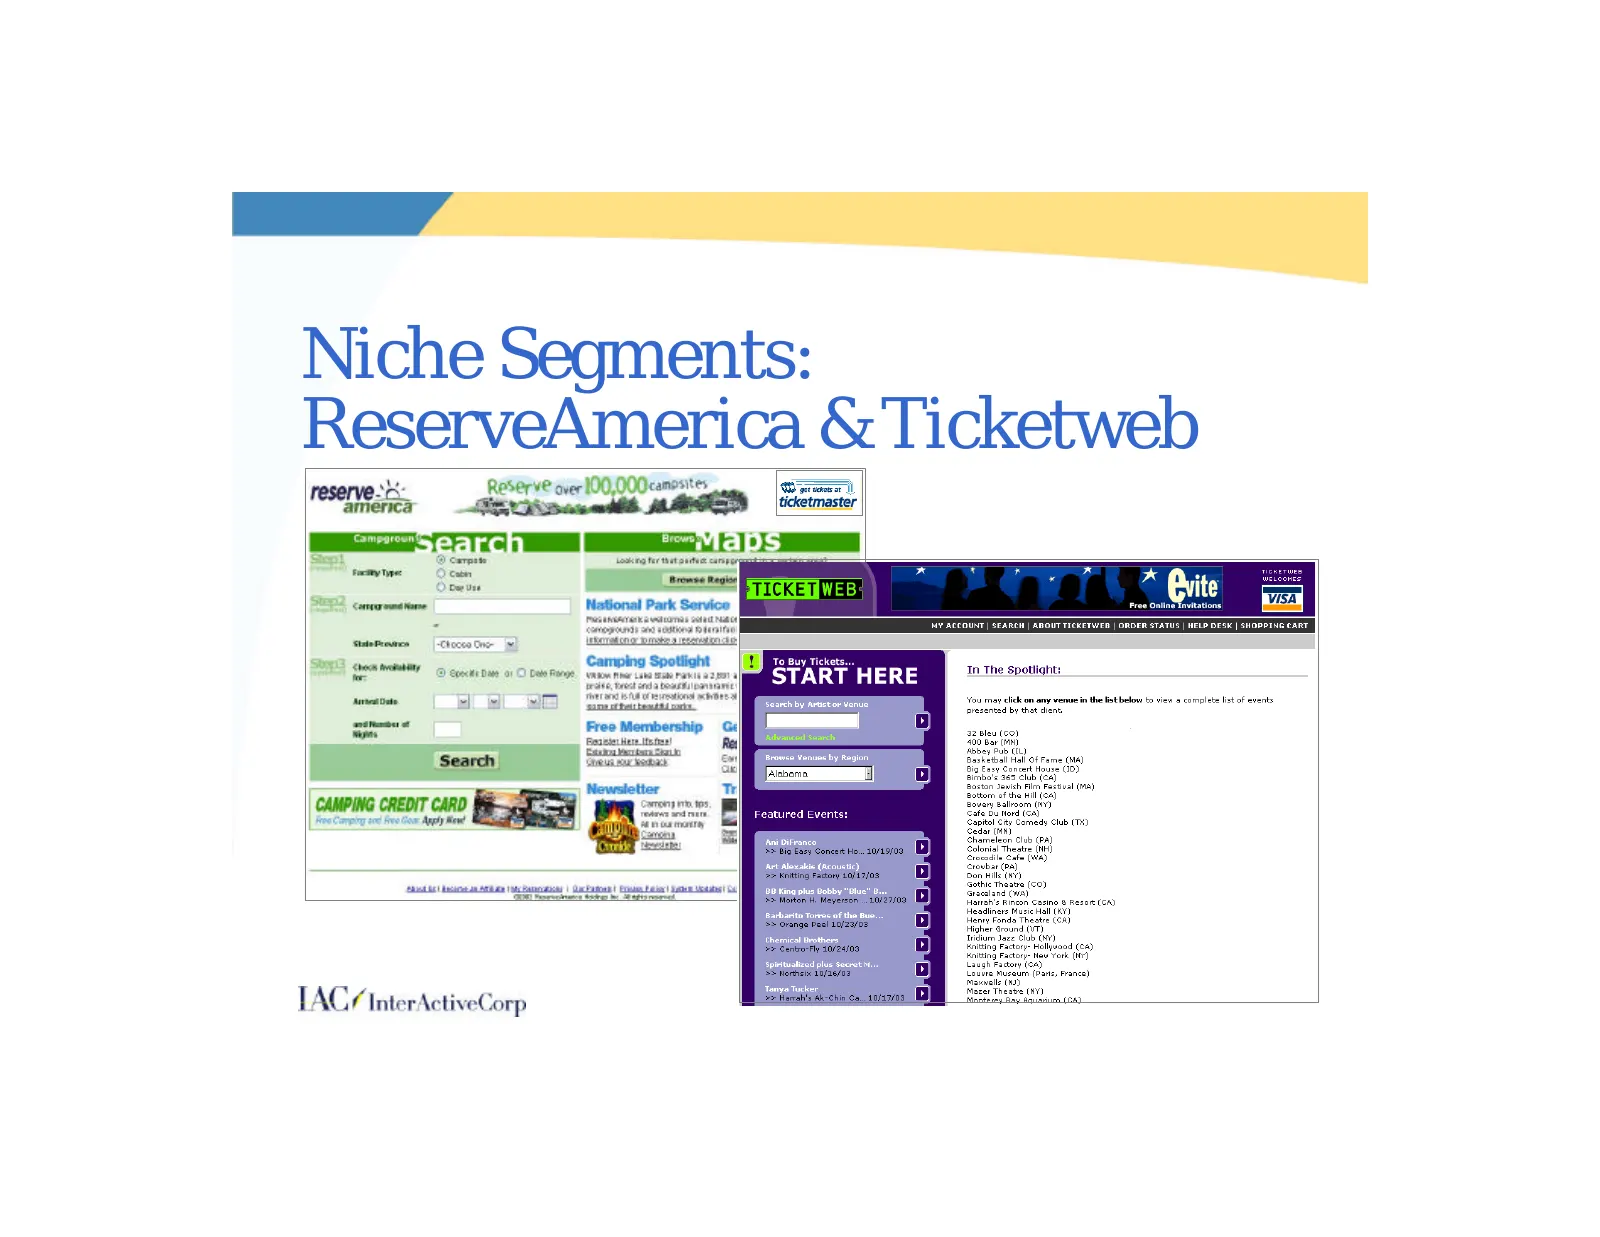
Niche Segments: ReserveAmerica & Ticketweb
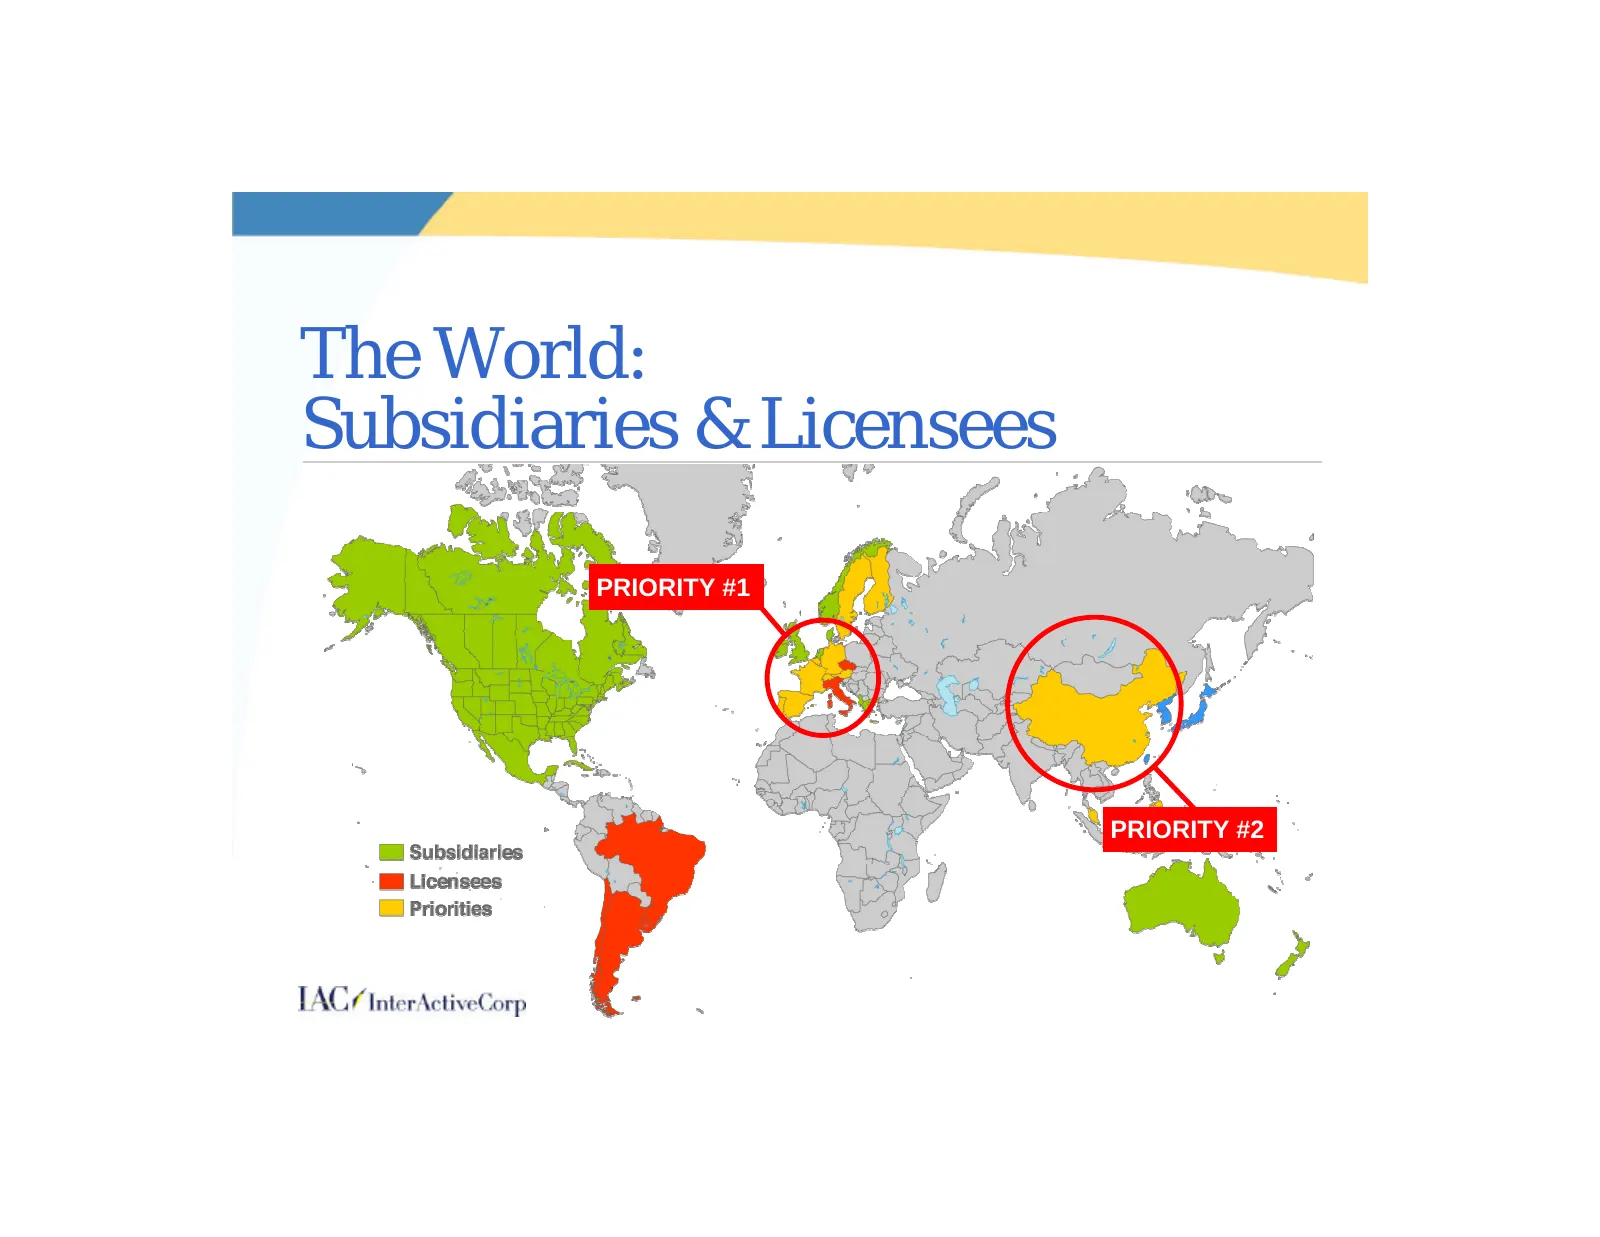
Slide 82: The World: Subsidiaries & Licensees
The World: Subsidiaries & Licensees PRIORITY #1 PRIORITY #2
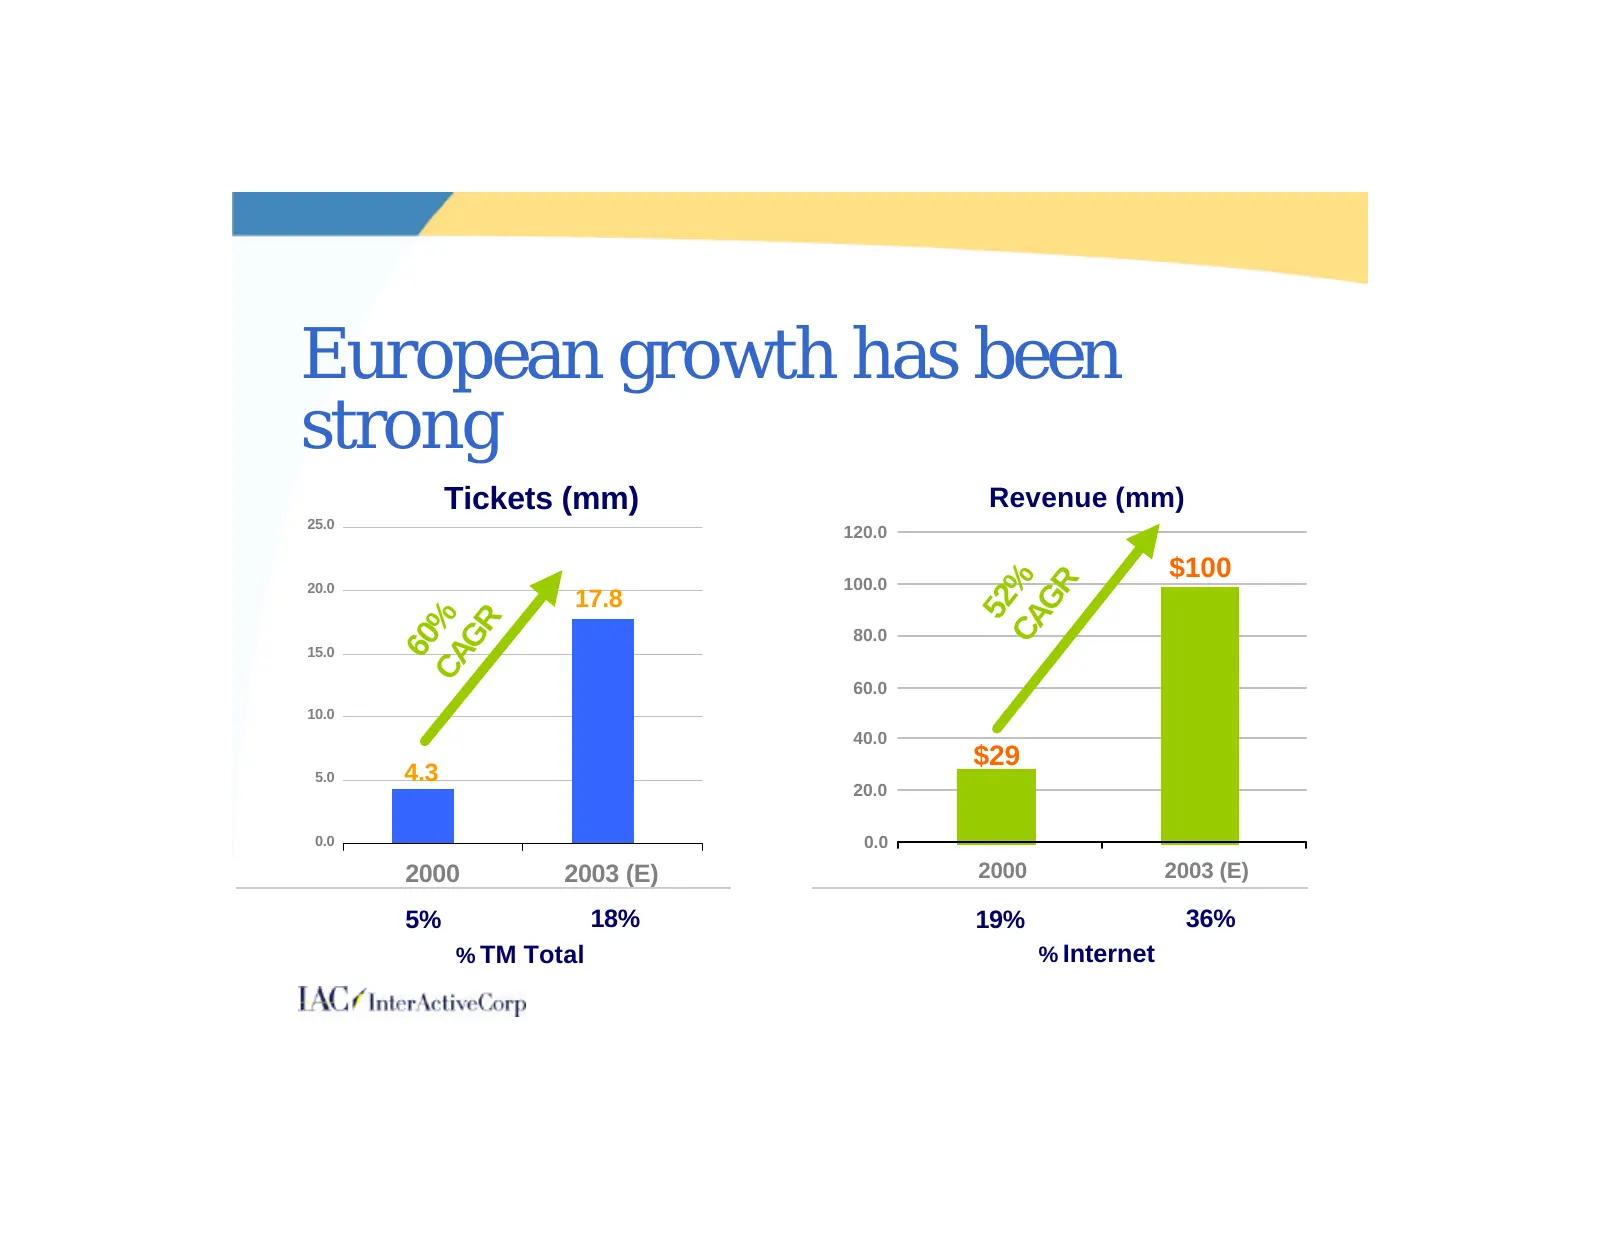
Slide 83: European growth has been strong
European growth has been strong Tickets (mm) Revenue (mm) 25.0 120.0 $100 CA % GR 20.0 100.0 17.8 52 CA % GR 80.0 60 15.0 60.0 10.0 40.0 $29 5.0 4.3 20.0 0.0 0.0 2000 2003 (E) 2000 2003 (E) 5% 18% 19% 36% % TM Total % Internet
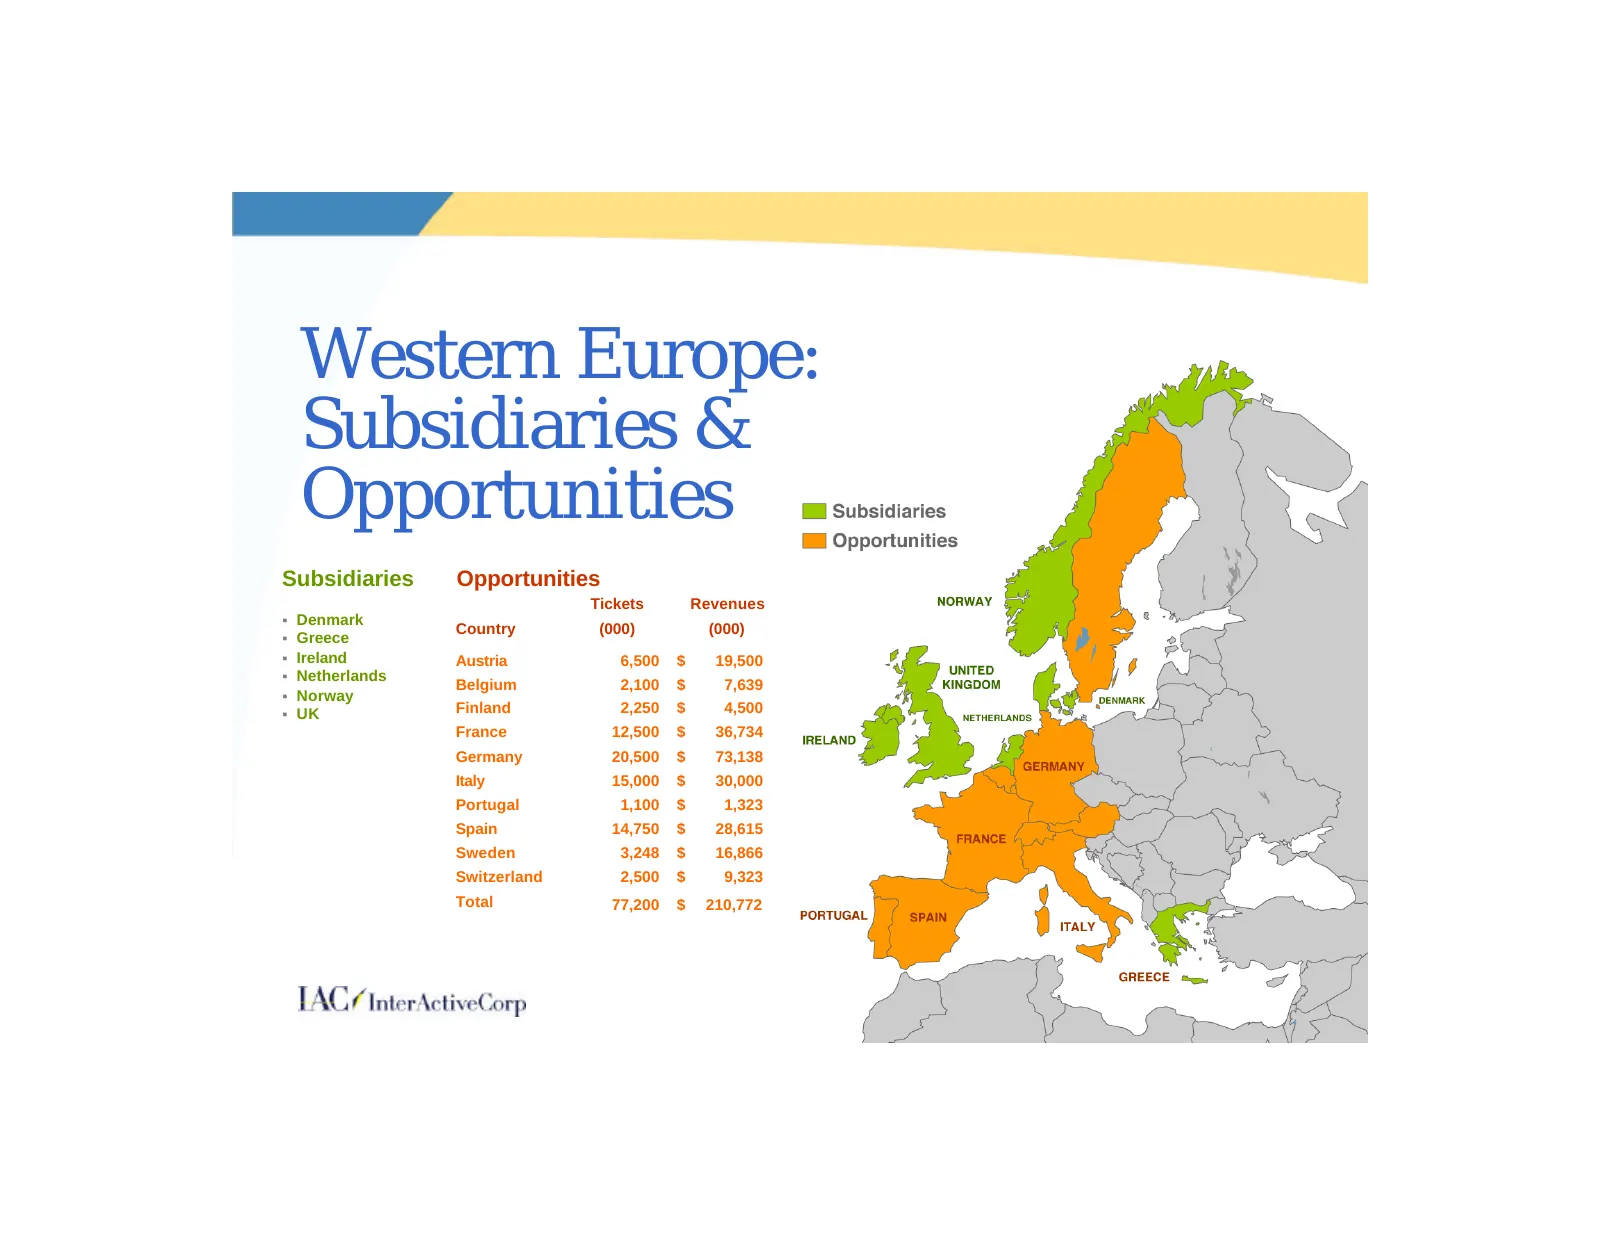
Slide 84: Western Europe: Subsidiaries & Opportunities
Western Europe: Subsidiaries & Opportunities Subsidiaries Opportunities Tickets Revenues § Denmark Country (000) (000) § Greece § Ireland Austria 6,500 $ 19,500 § Netherlands Belgium 2,100 $ 7,639 § Norway § UK Finland 2,250 $ 4,500 France 12,500 $ 36,734 Germany 20,500 $ 73,138 Italy 15,000 $ 30,00
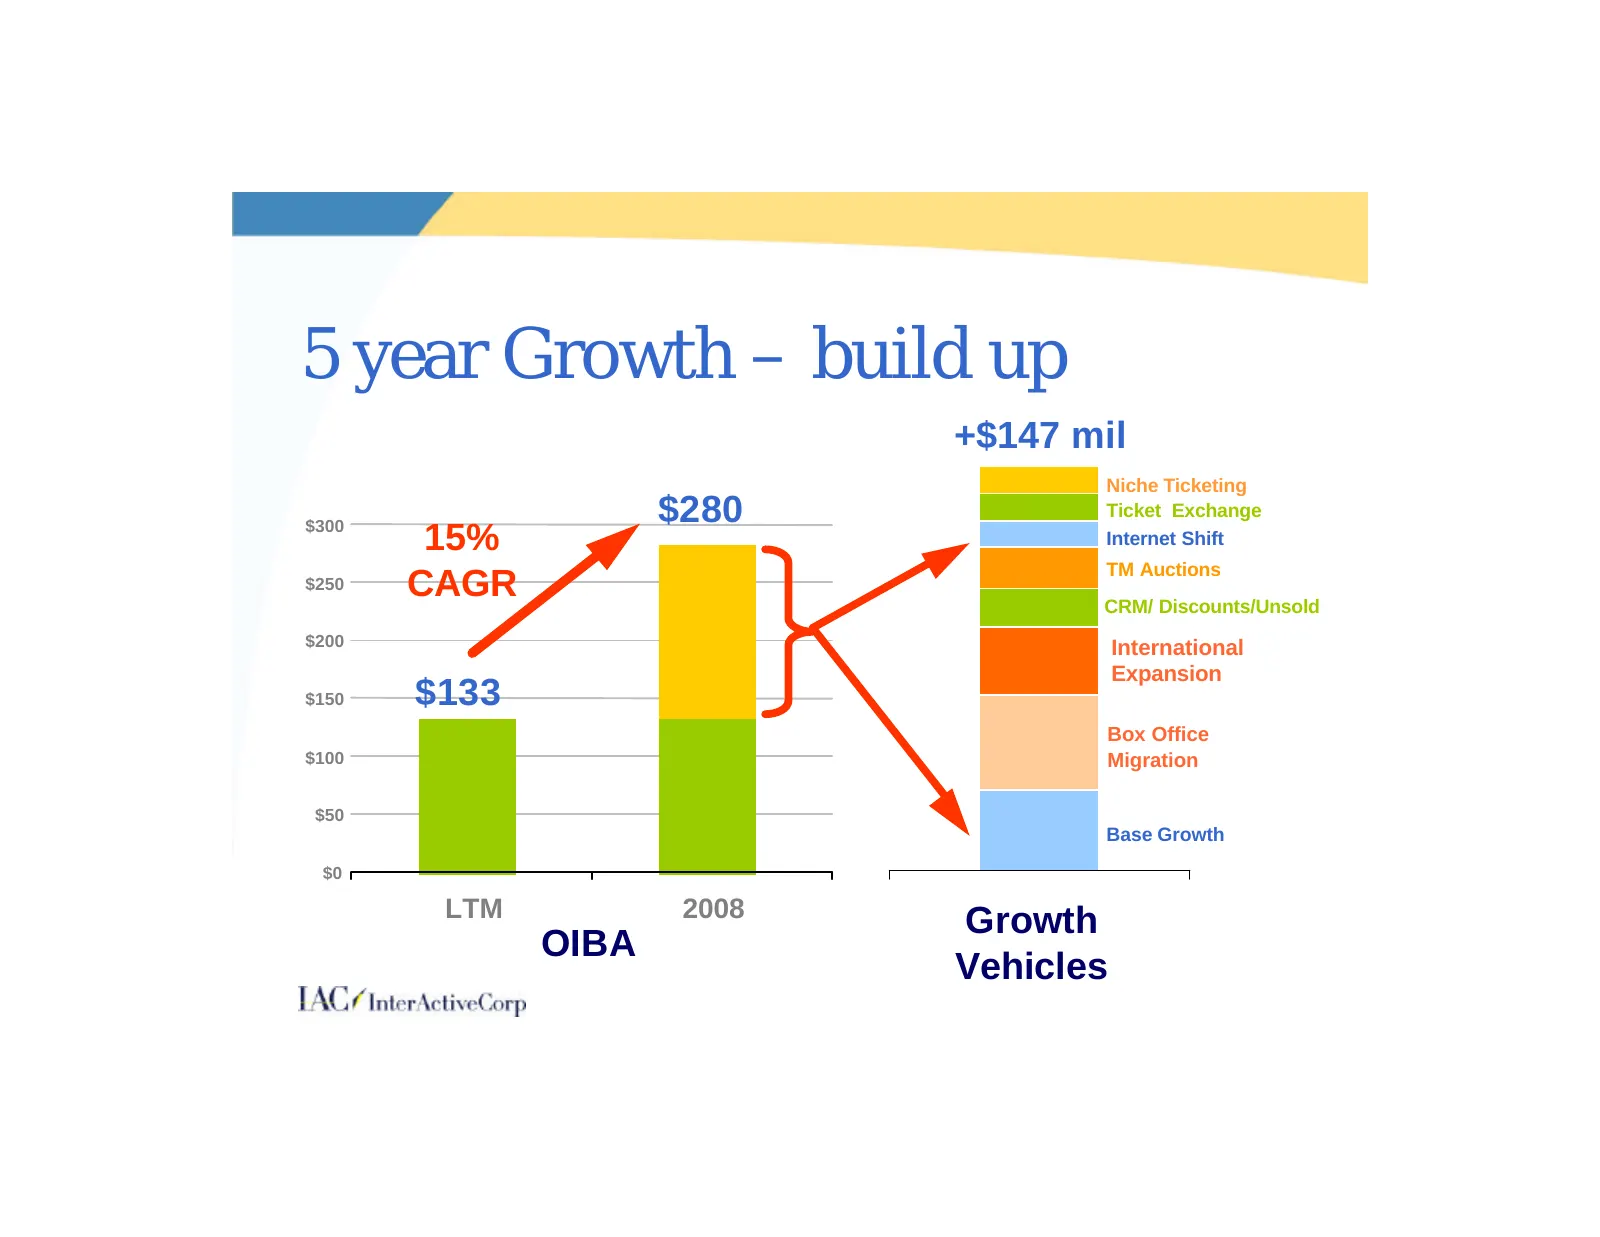
Slide 85: 5 year Growth – build up
5 year Growth – build up +$147 mil $150 Niche Ticketing $300 $280 Ticket Exchange 15% Internet Shift TM Auctions $250 CAGR CRM/ Discounts/Unsold $200 International Expansion $150 $133 Box Office $100 Migration $50 Base Growth $0 $0 LTM 2008 Growth OIBA Vehicles
Slide 86: IAC Ticketing Q&A
Ne TACr Ticketing Q&A TACS InterActive lorp
Slide 87: John Pleasants
John Pleasants President & CEO
Slide 88: Mission – Efficiently connect performances & consumers
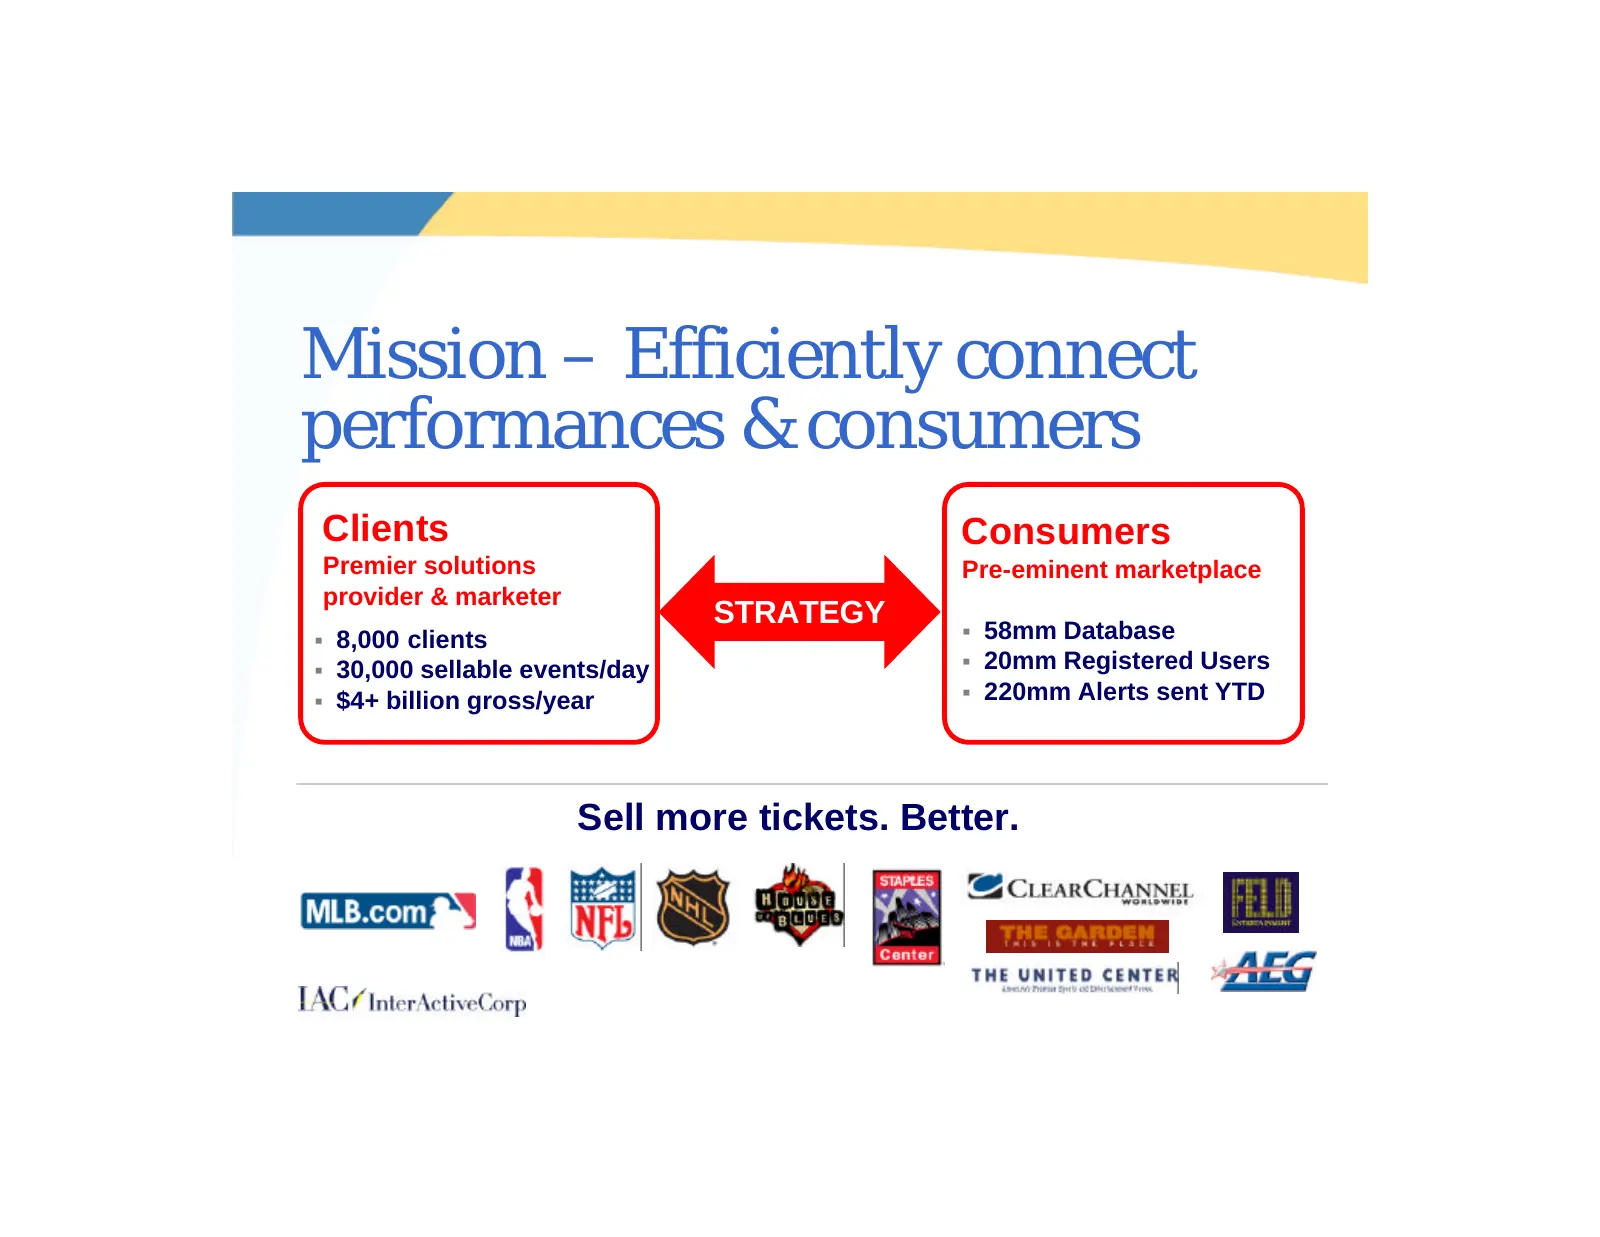
Mission – Efficiently connect performances & consumers Clients Consumers Premier solutions Pre-eminent marketplace provider & marketer STRATEGY § 58mm Database § 8,000 clients § 30,000 sellable events/day § 20mm Registered Users § $4+ billion gross/year § 220mm Alerts sent YTD Sell more tickets. Bet
Slide 89: Results have been strong
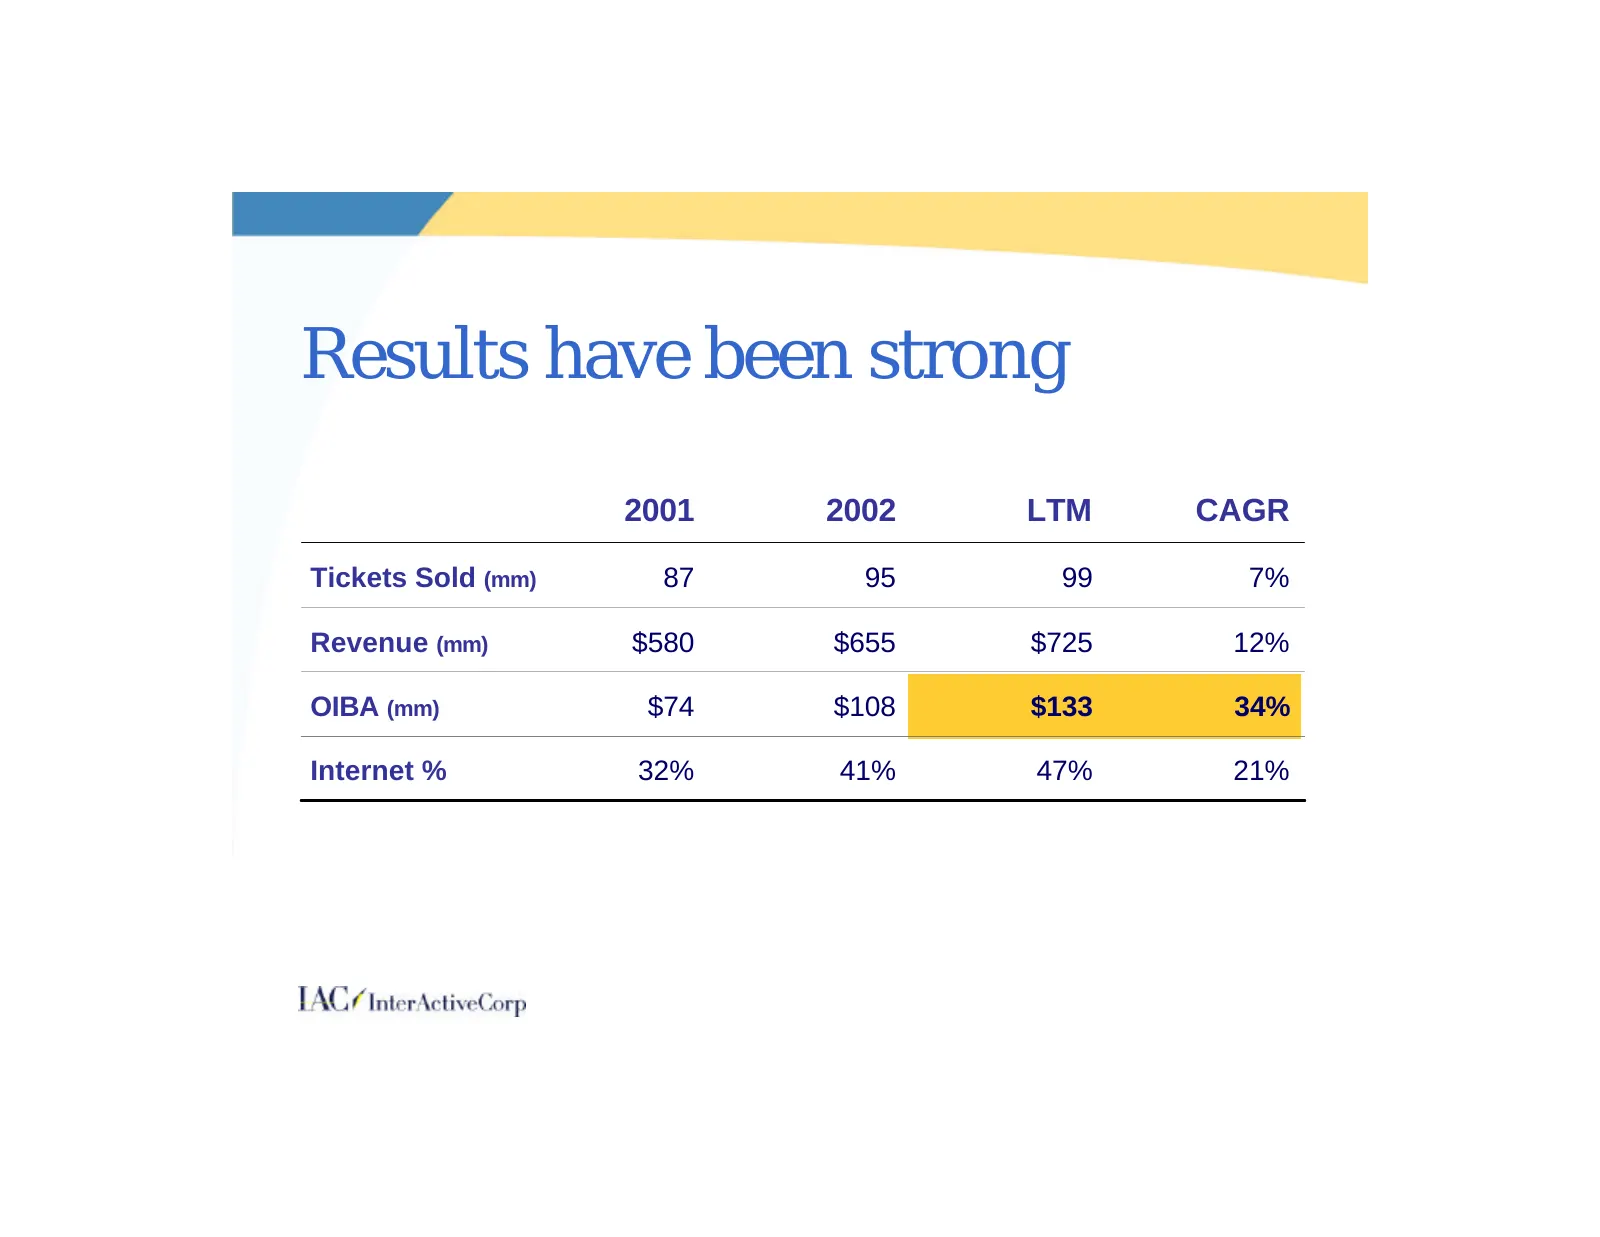
Results have been strong 2001 2002 LTM CAGR Tickets Sold (mm) 87 95 99 7% Revenue (mm) $580 $655 $725 12% OIBA (mm) $74 $108 $133 34% Internet % 32% 41% 47% 21%
Slide 90: The Internet fuels our growth opportunities
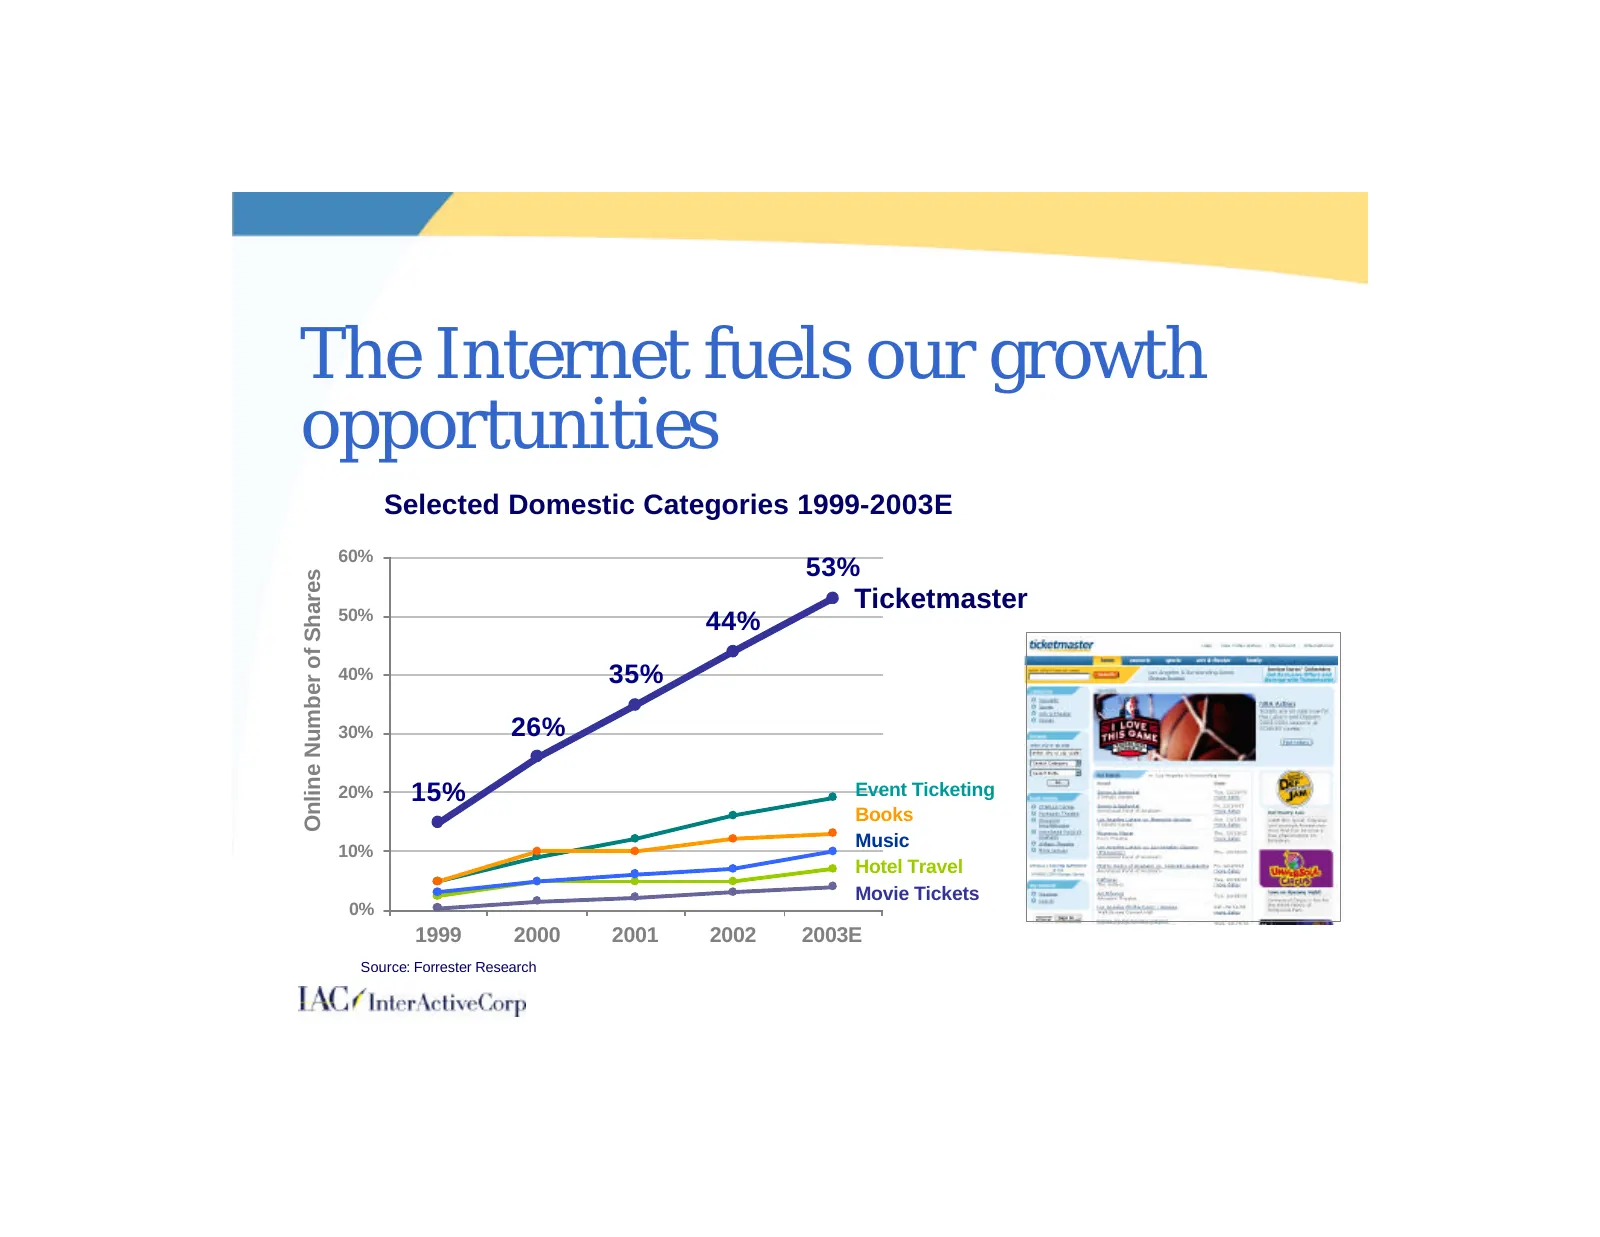
The Internet fuels our growth opportunities Selected Domestic Categories 1999-2003E 60% 53% Online Number of Shares 50% Ticketmaster 44% 40% 35% 30% 26% 20% 15% Event Ticketing Books 10% Music Hotel Travel Movie Tickets 0% 1999 2000 2001 2002 2003E Source: Forrester Research
Slide 91: Growth drivers
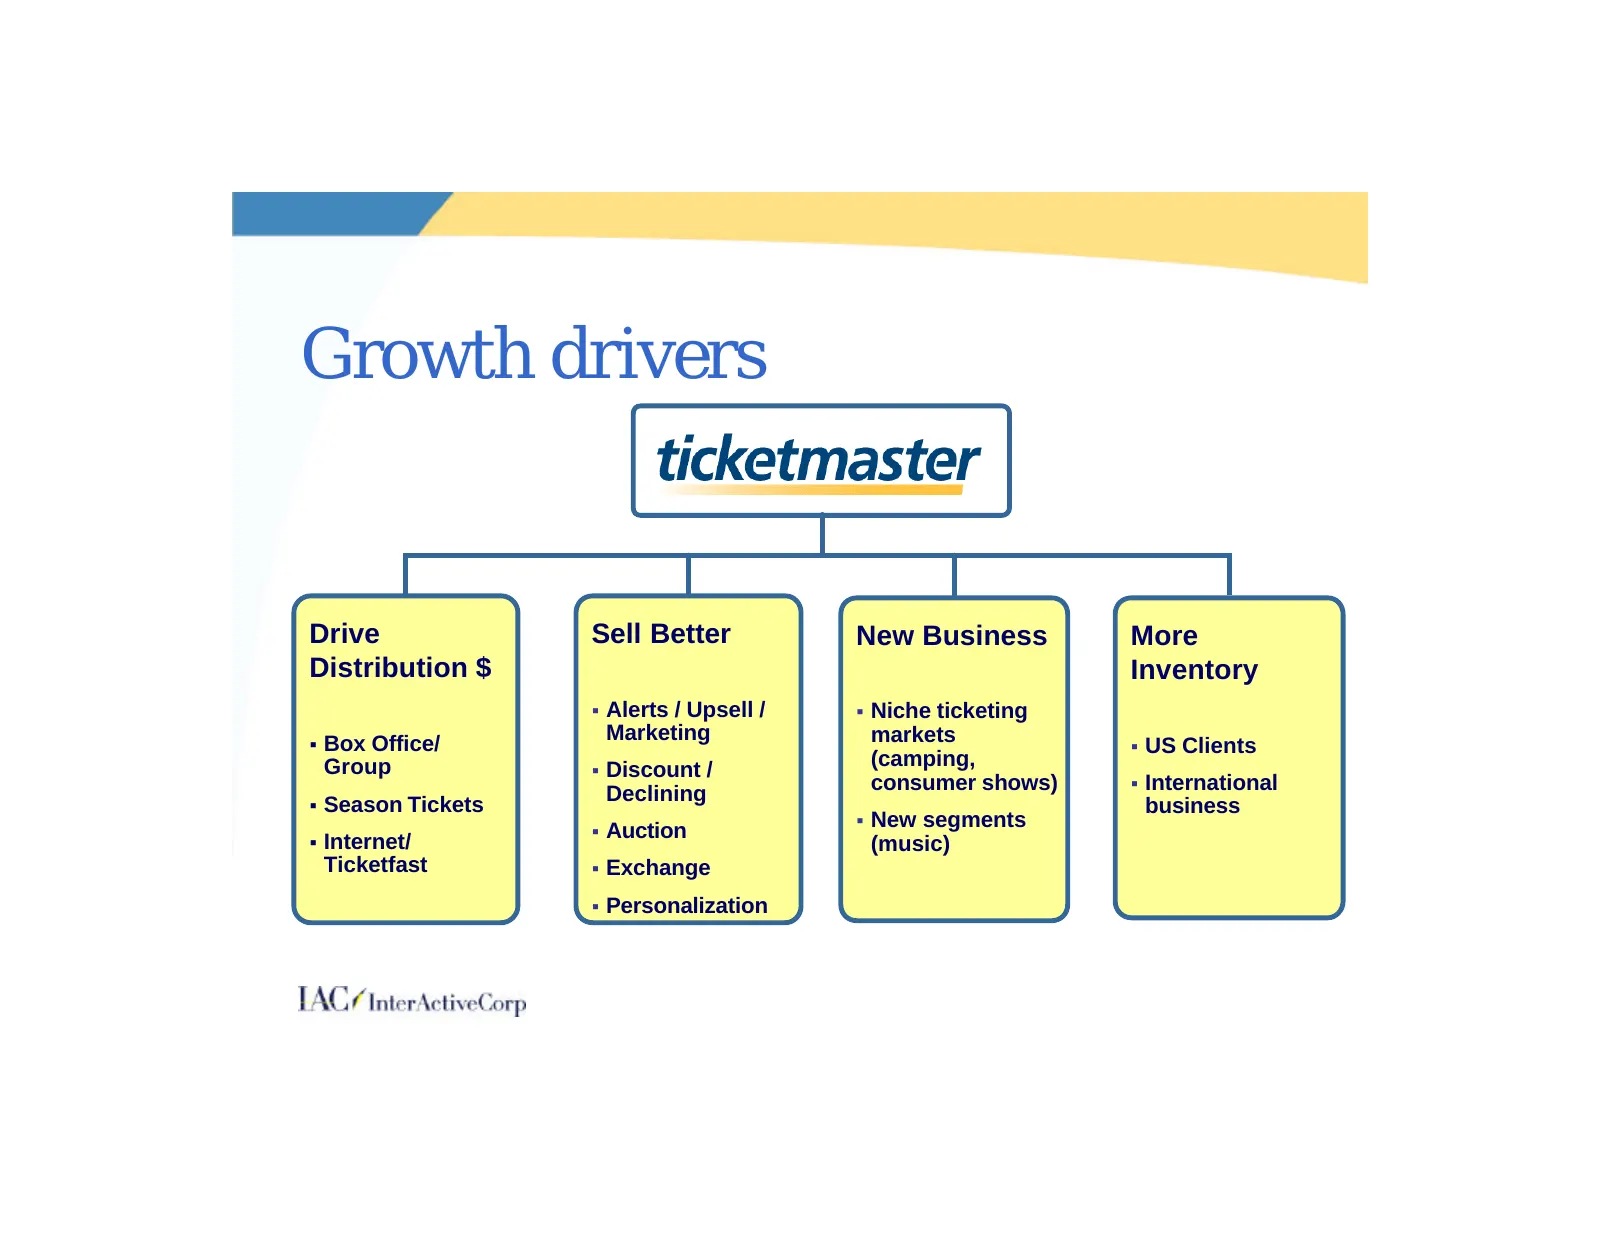
Growth drivers Drive Sell Better New Business More Distribution $ Inventory § Alerts / Upsell / § Niche ticketing § Box Office/ Marketing markets § US Clients Group (camping, § Discount / consumer shows) § International § Season Tickets Declining business § New segments § Auction § Internet/ (music)
Slide 92: Ticketmaster already has the inventory to grow
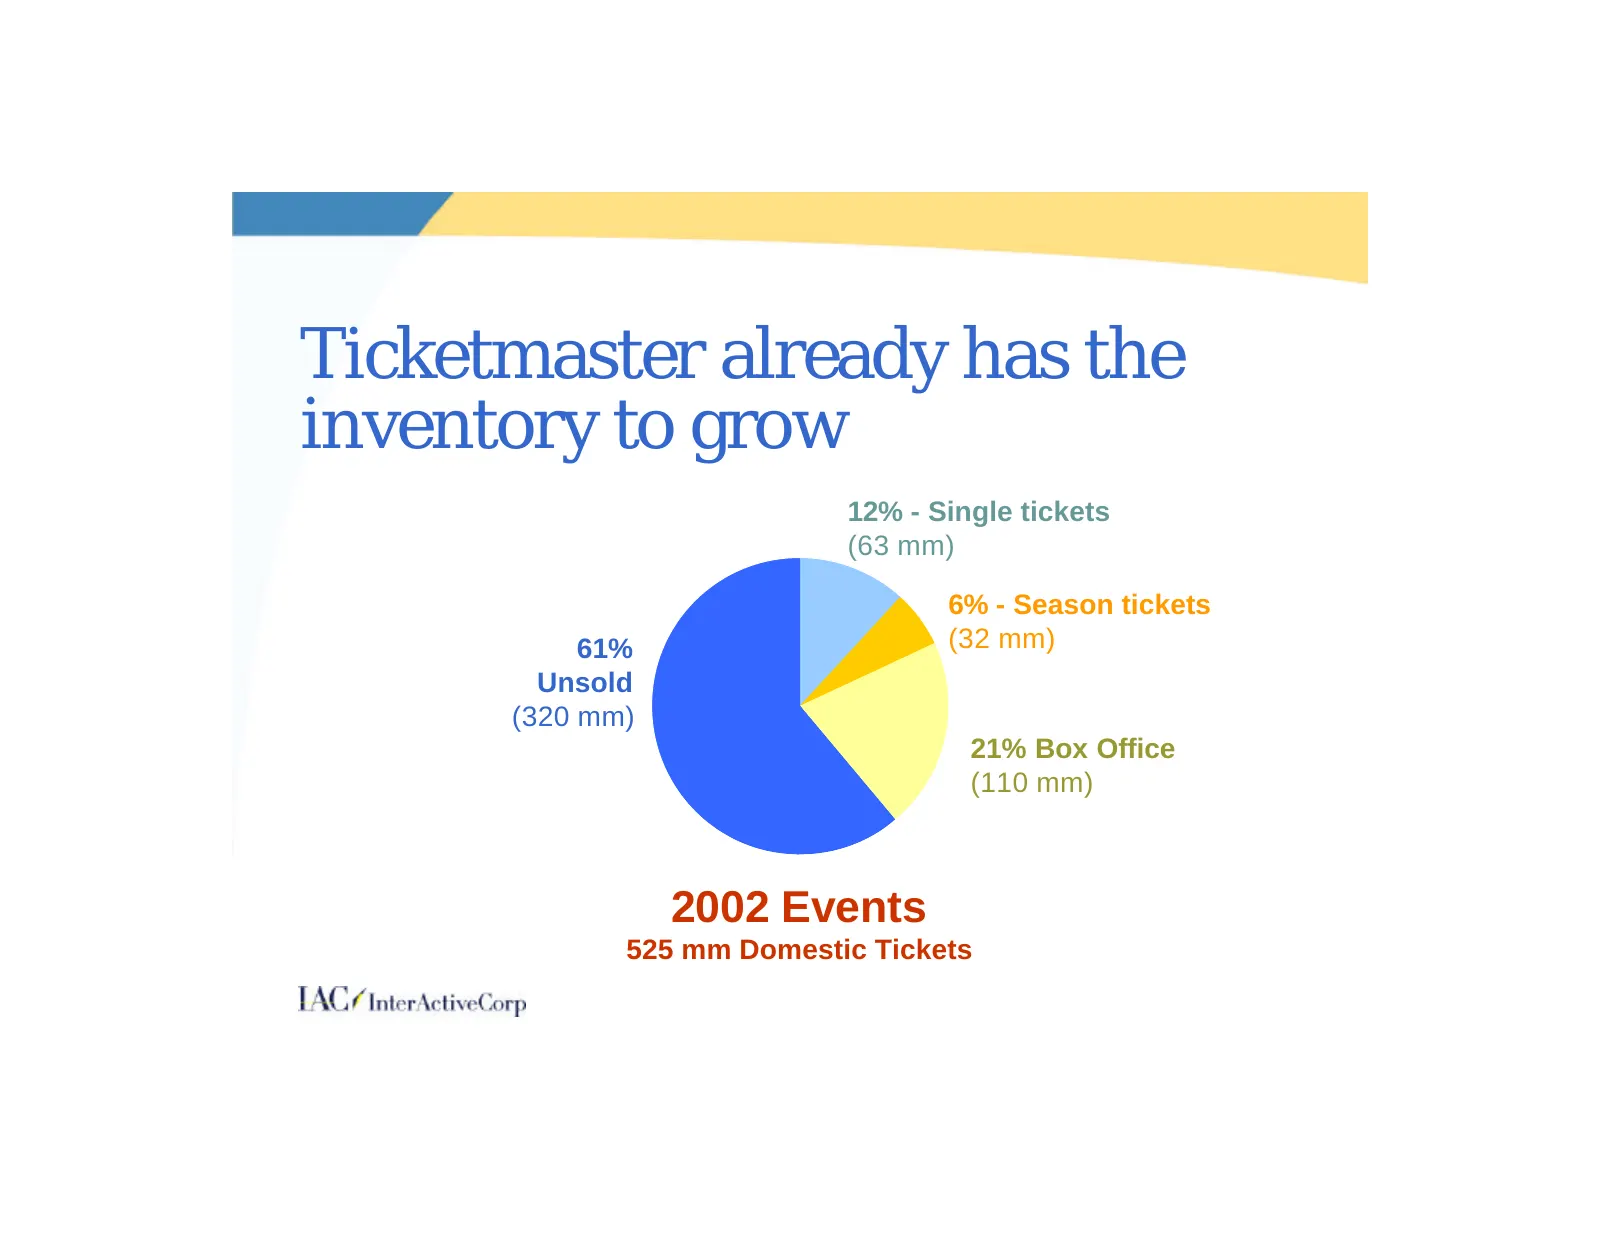
Ticketmaster already has the inventory to grow 12% - Single tickets (63 mm) 6% - Season tickets 61% (32 mm) Unsold (320 mm) 21% Box Office (110 mm) 2002 Events 525 mm Domestic Tickets
Slide 93: Box office migration is a significant opportunity
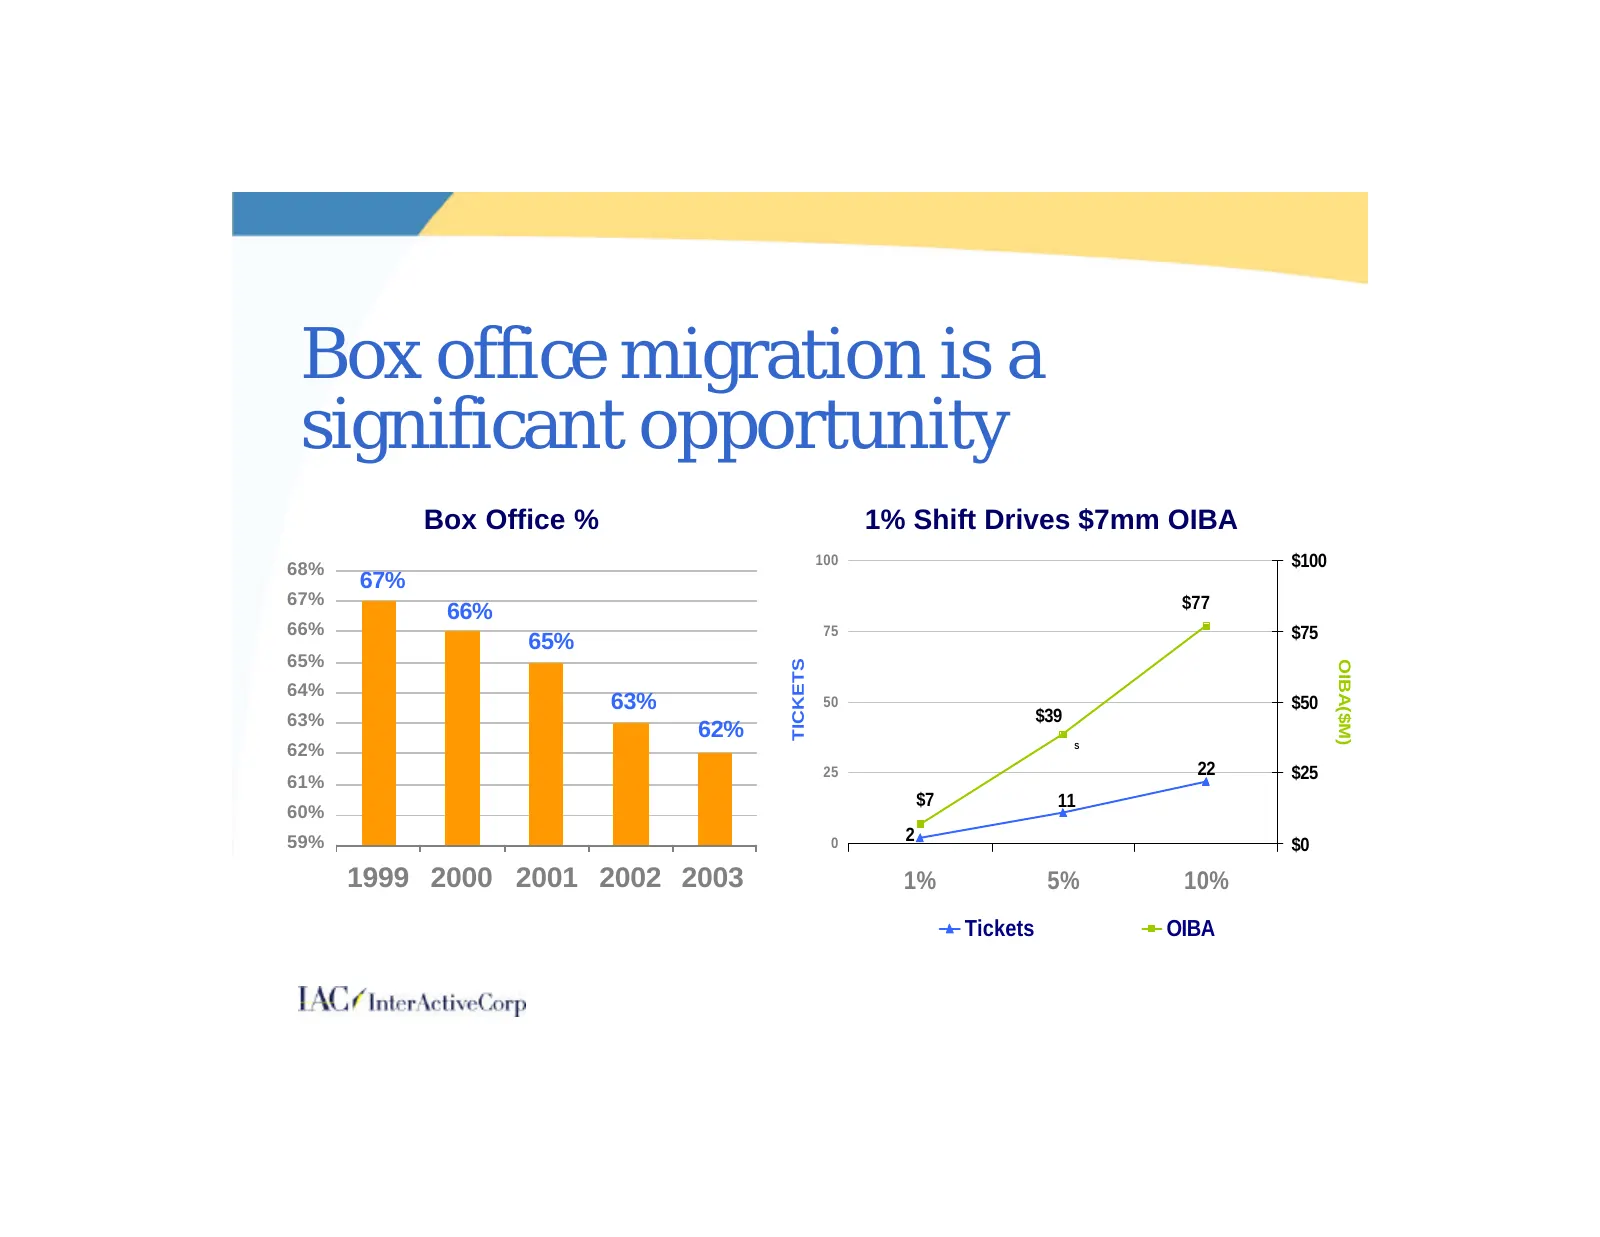
Box office migration is a significant opportunity Box Office % 1% Shift Drives $7mm OIBA 68% 100 $100 67% 67% $77 66% 66% 75 $75 65% 65% TICKETS OIBA($M) 64% 63% 50 $50 63% $39 62% 62% S 25 22 $25 61% $7 11 60% 59% 0 2 $0 1999 2000 2001 2002 2003 1% 5% 10% Tickets OIBA
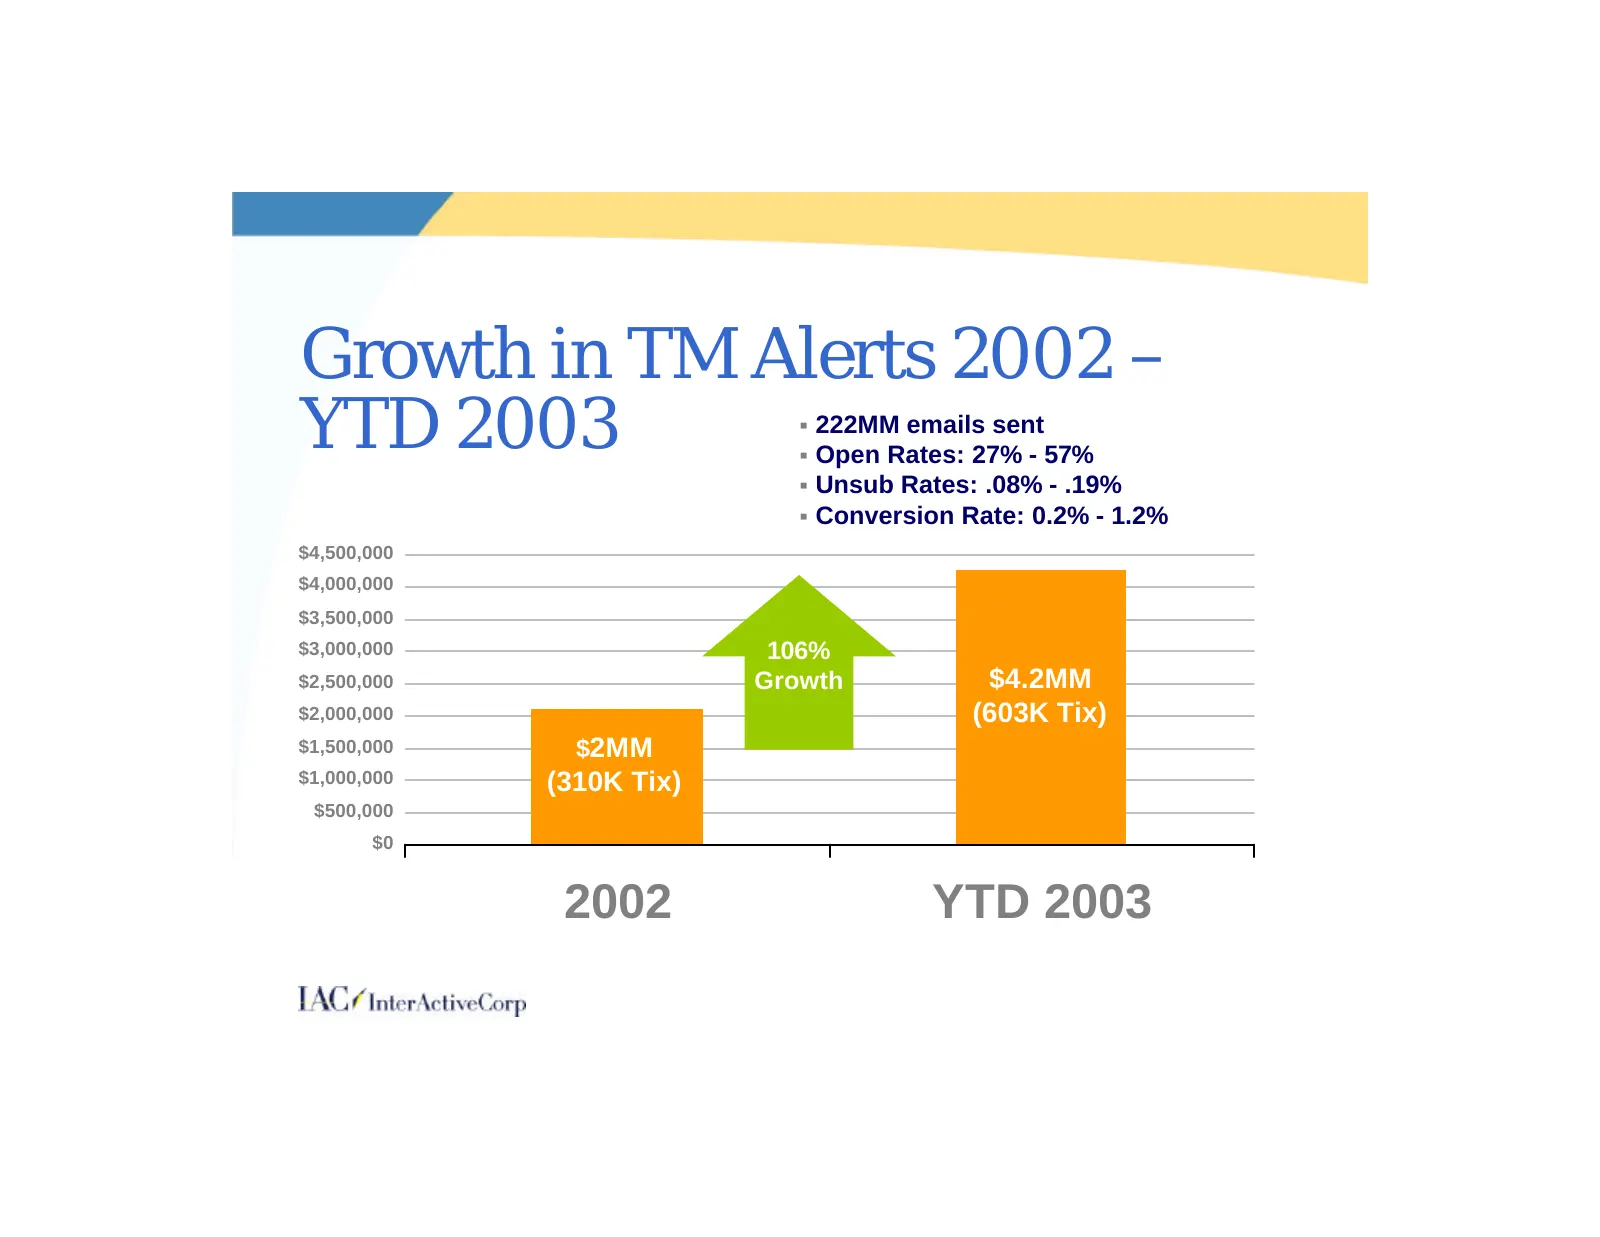
Slide 94: Growth in TM Alerts 2002 – YTD 2003
Growth in TM Alerts 2002 – YTD 2003 § 222MM emails sent § Open Rates: 27% - 57% § Unsub Rates: .08% - .19% § Conversion Rate: 0.2% - 1.2% 106% $4,500,000 Growth $4,000,000 $3,500,000 $3,000,000 106% $2,500,000 Growth $4.2MM $2,000,000 (603K Tix) $1,500,000 $2MM $1,000,000 (310K Tix) $500,000 $0 2002
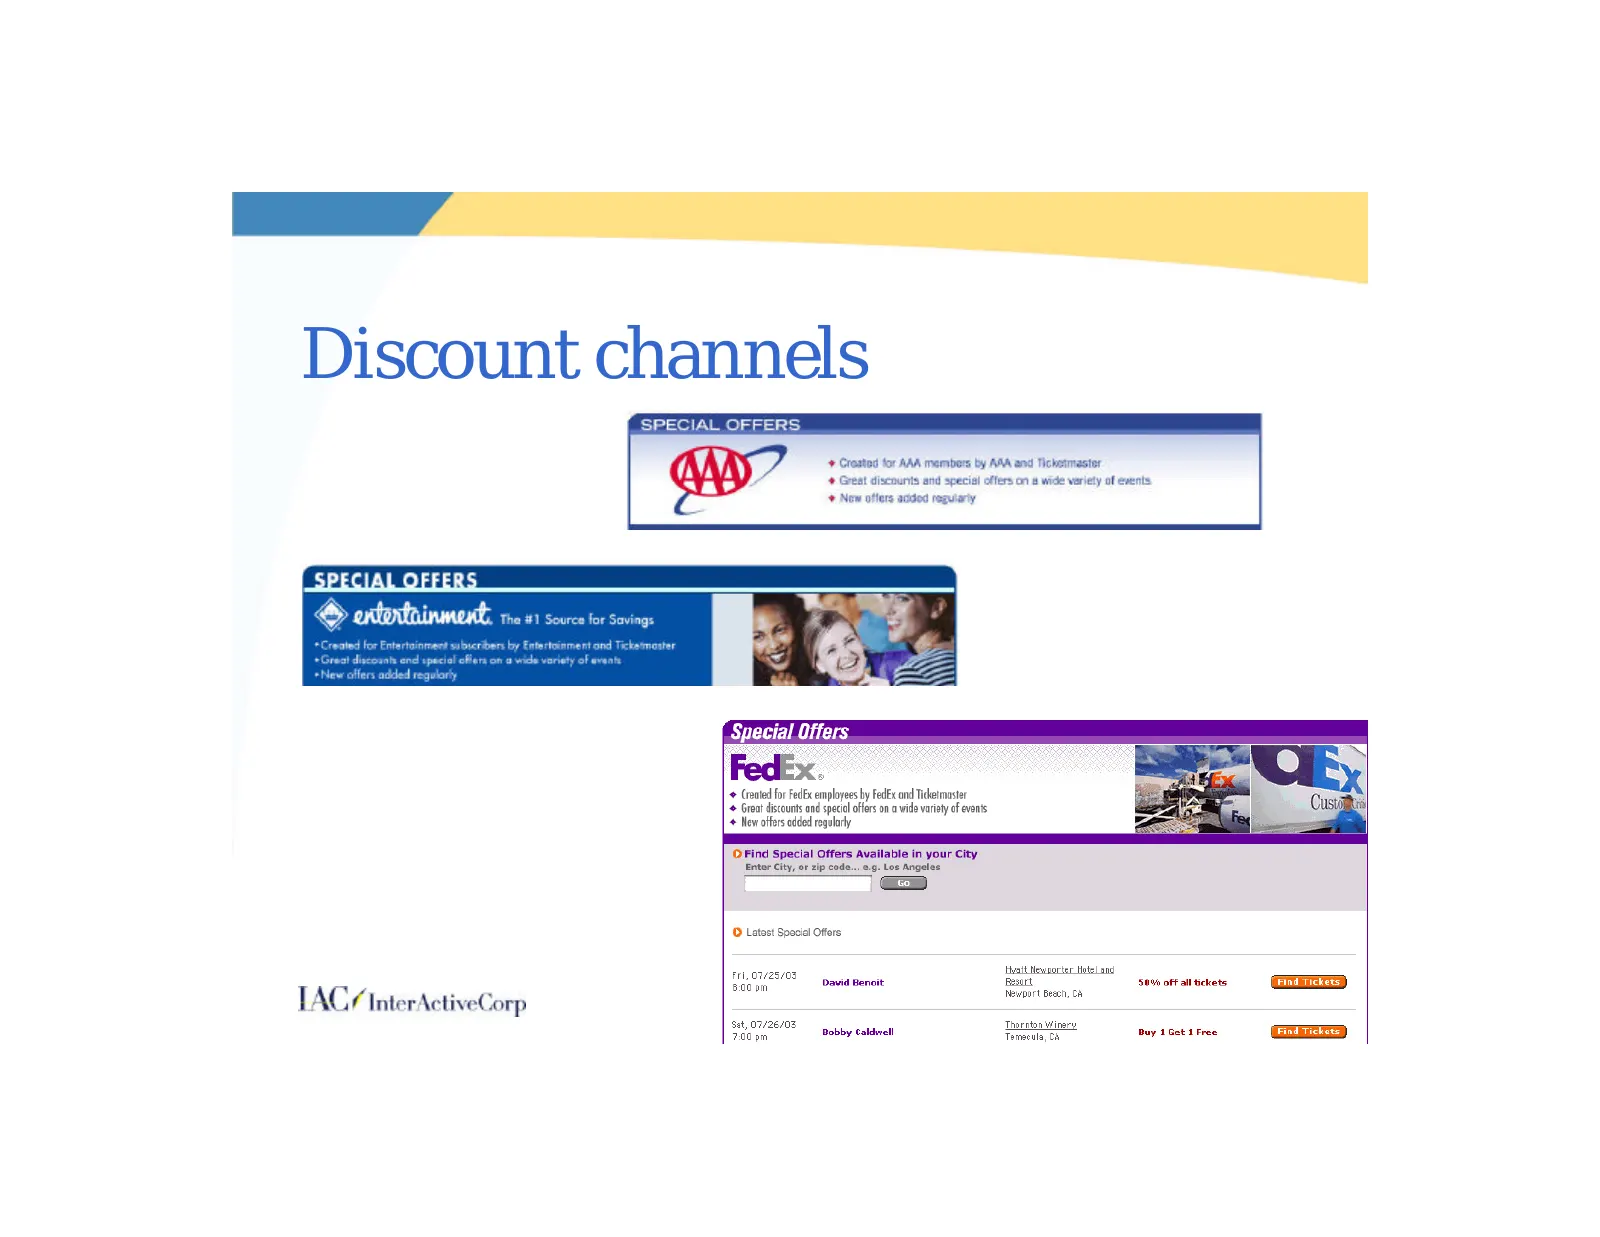
Slide 95: Discount channels
Discount channels TACS InterActiveCorp ++ Created for AAA members by AAA and Ticketmaster Great discounts and special offers on a wide variety of events + New offers acded reguiarly Special Offers. ‘Coe for Fe employes by Fel ond Tissier * Groat scuns an spel offs on avid varity of evo + New ofr ded
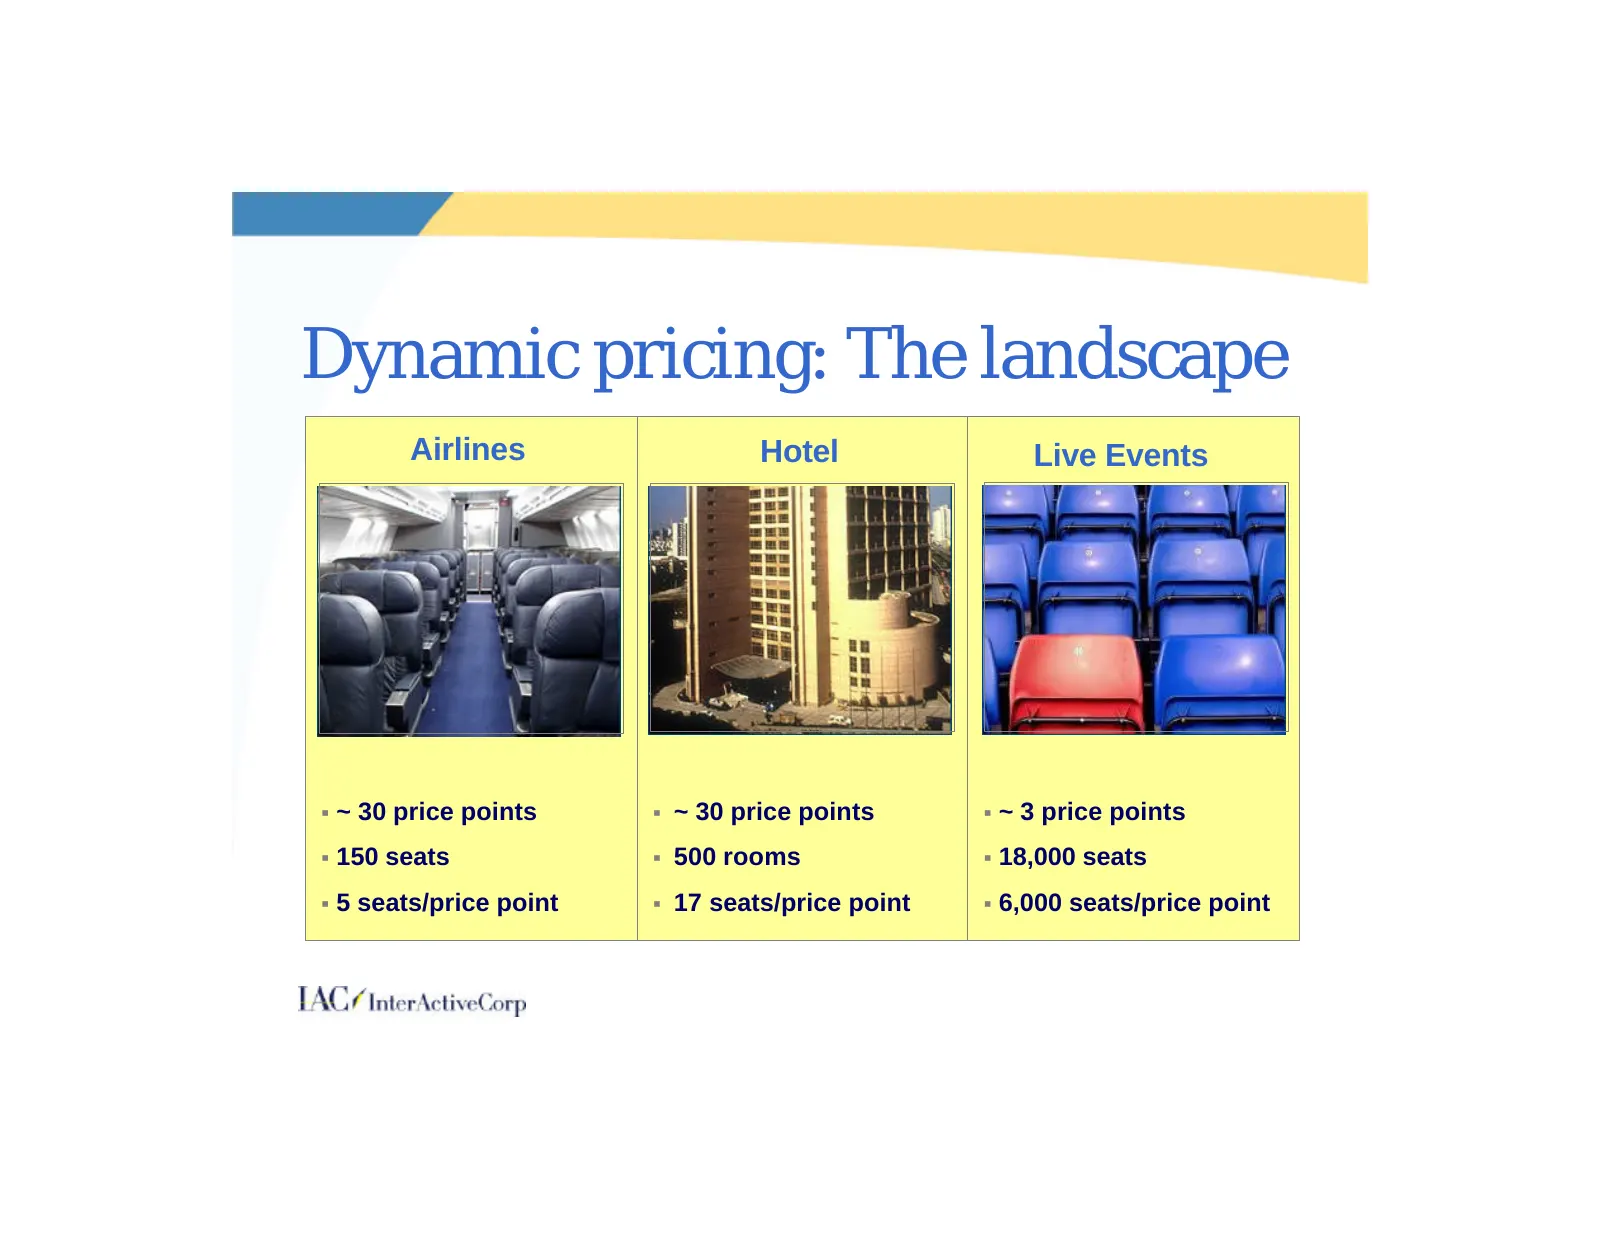
Slide 96: Dynamic pricing: The landscape
Dynamic pricing: The landscape Airlines Hotel Live Events § ~ 30 price points § ~ 30 price points § ~ 3 price points § 150 seats § 500 rooms § 18,000 seats § 5 seats/price point § 17 seats/price point § 6,000 seats/price point
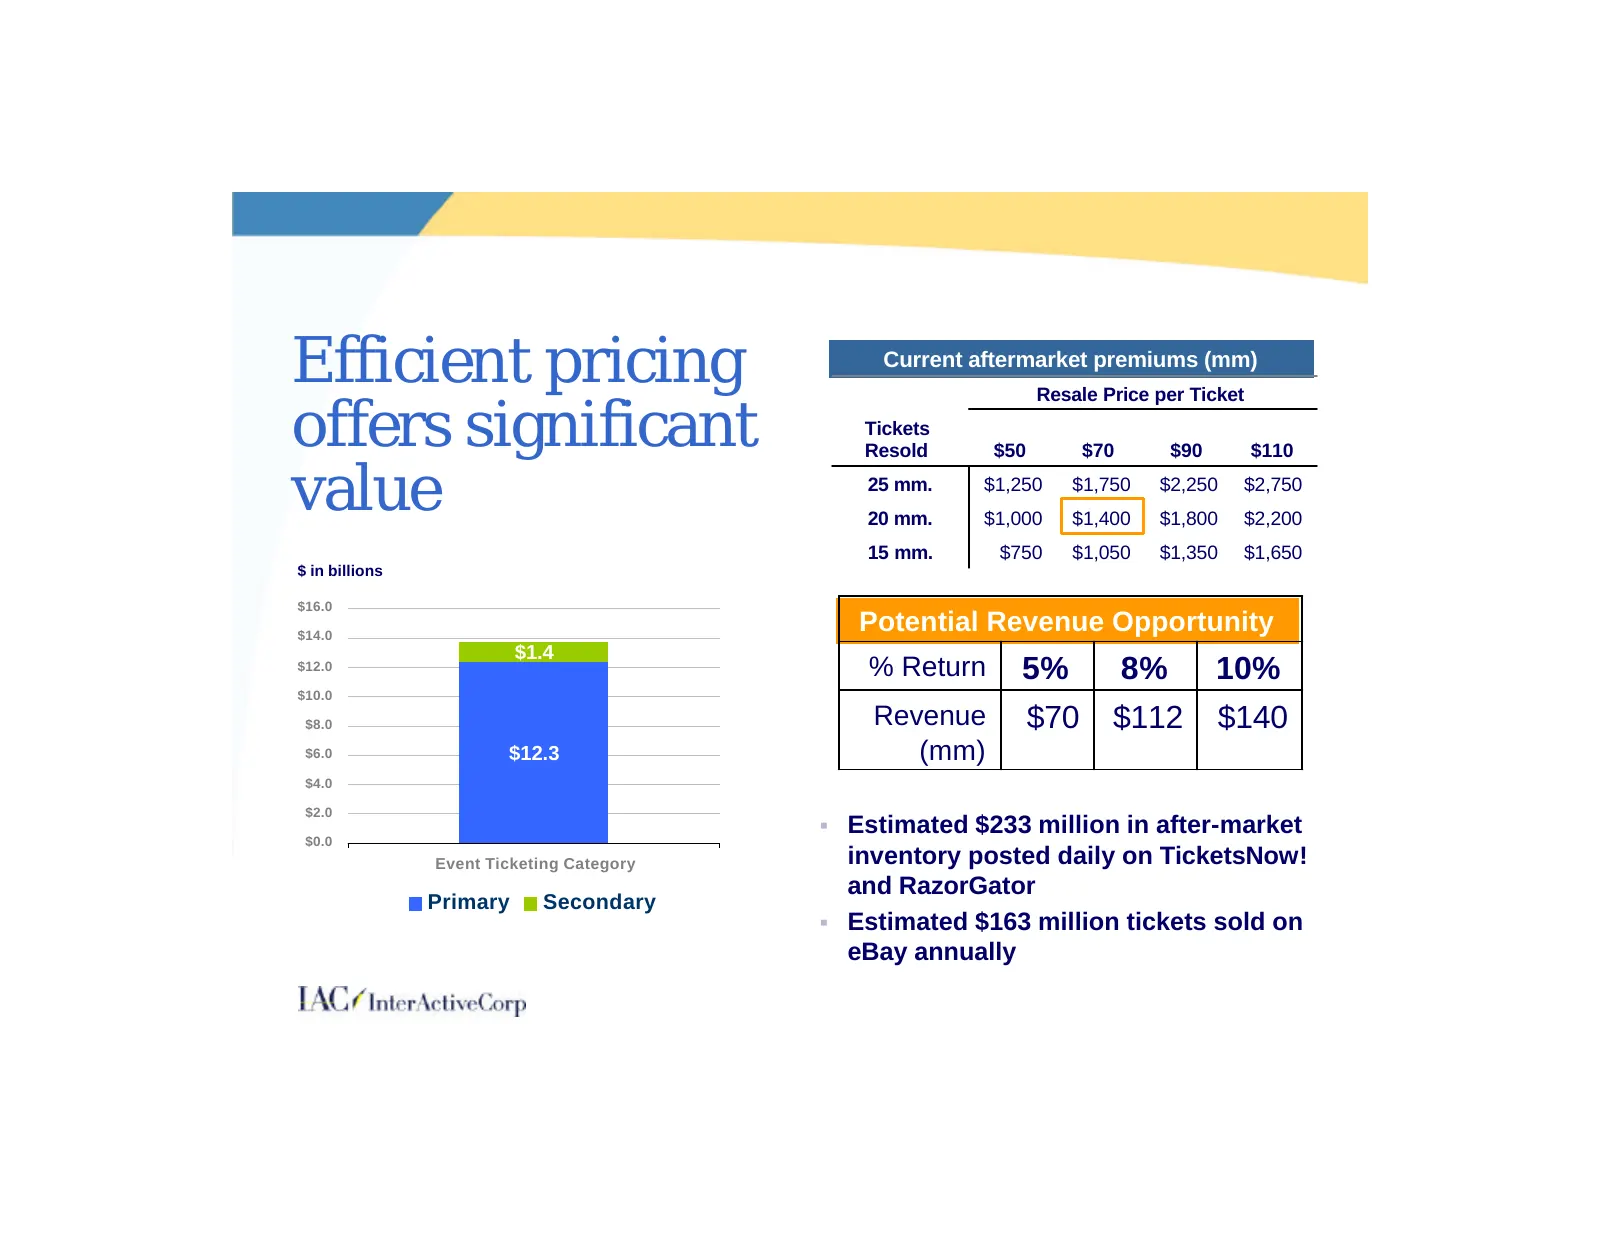
Slide 97: Efficient pricing offers significant value
Efficient pricing Current aftermarket premiums (mm) Resale Price per Ticket offers significant Tickets Resold $50 $70 $90 $110 value 25 mm. 20 mm. $1,250 $1,000 $1,750 $1,400 $2,250 $1,800 $2,750 $2,200 15 mm. $750 $1,050 $1,350 $1,650 $ in billions $16.0 $14.0 Potential Revenue Opportunity $1.4 $12
Slide 98: Primary market auctions
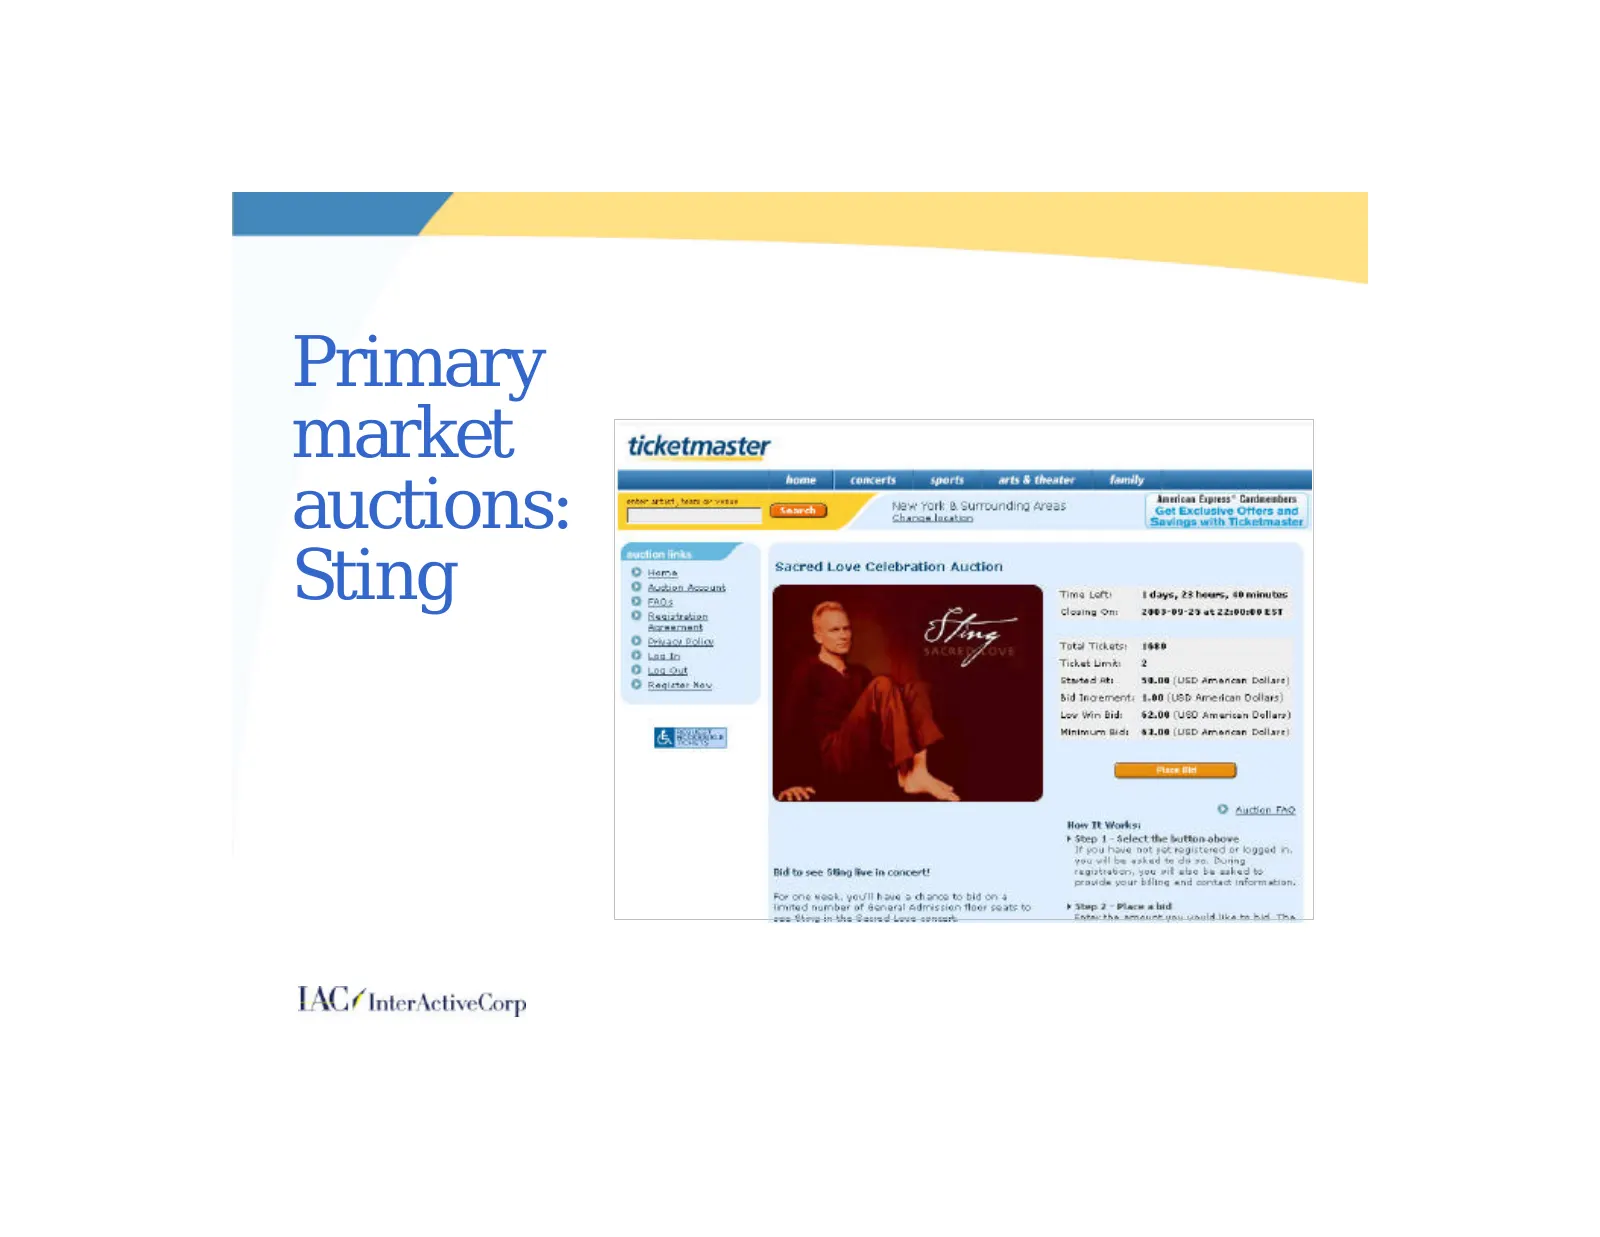
Primary market auctions: Sting
Slide 99: Participation in season ticket sales and transactions
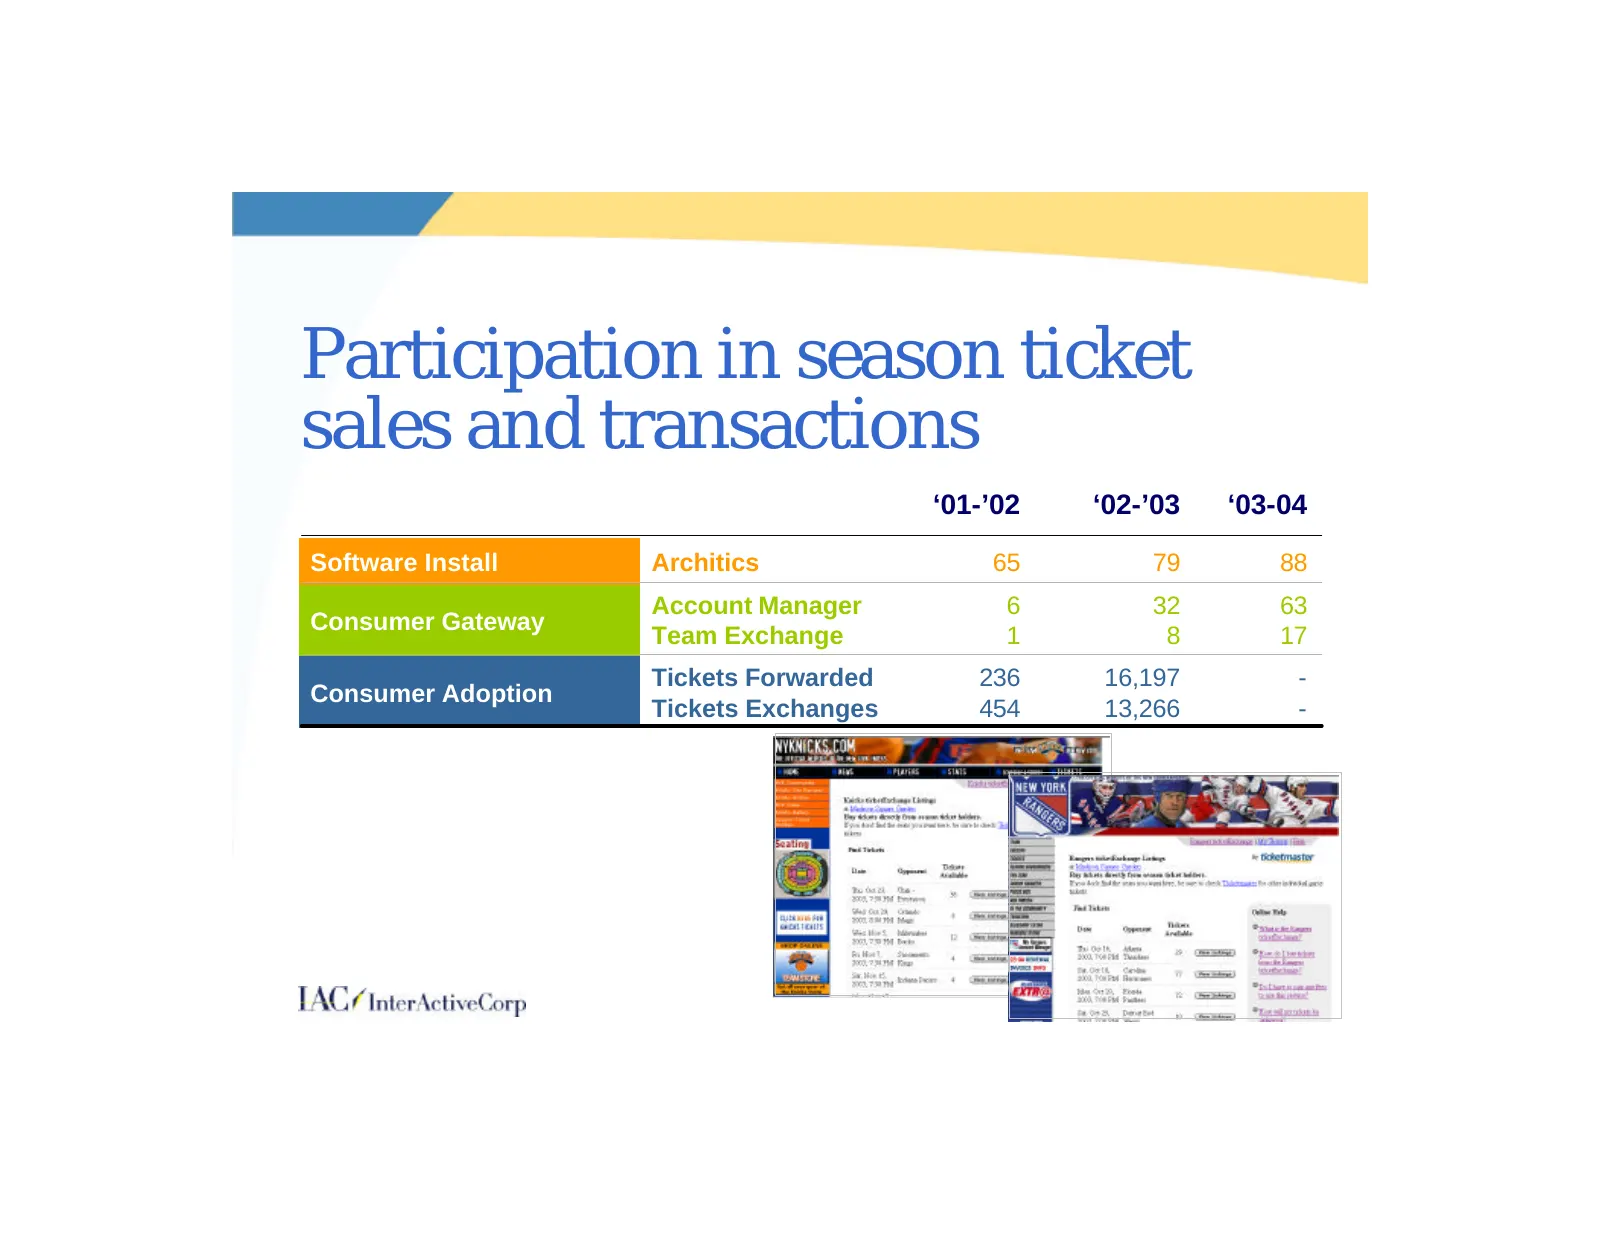
Participation in season ticket sales and transactions ‘01-’02 ‘02-’03 ‘03-04 Software Install Architics 65 79 88 Account Manager 6 32 63 Consumer Gateway Team Exchange 1 8 17 Tickets Forwarded 236 16,197 - Consumer Adoption Tickets Exchanges 454 13,266 -
Slide 100: Digital Music – Soundclips test
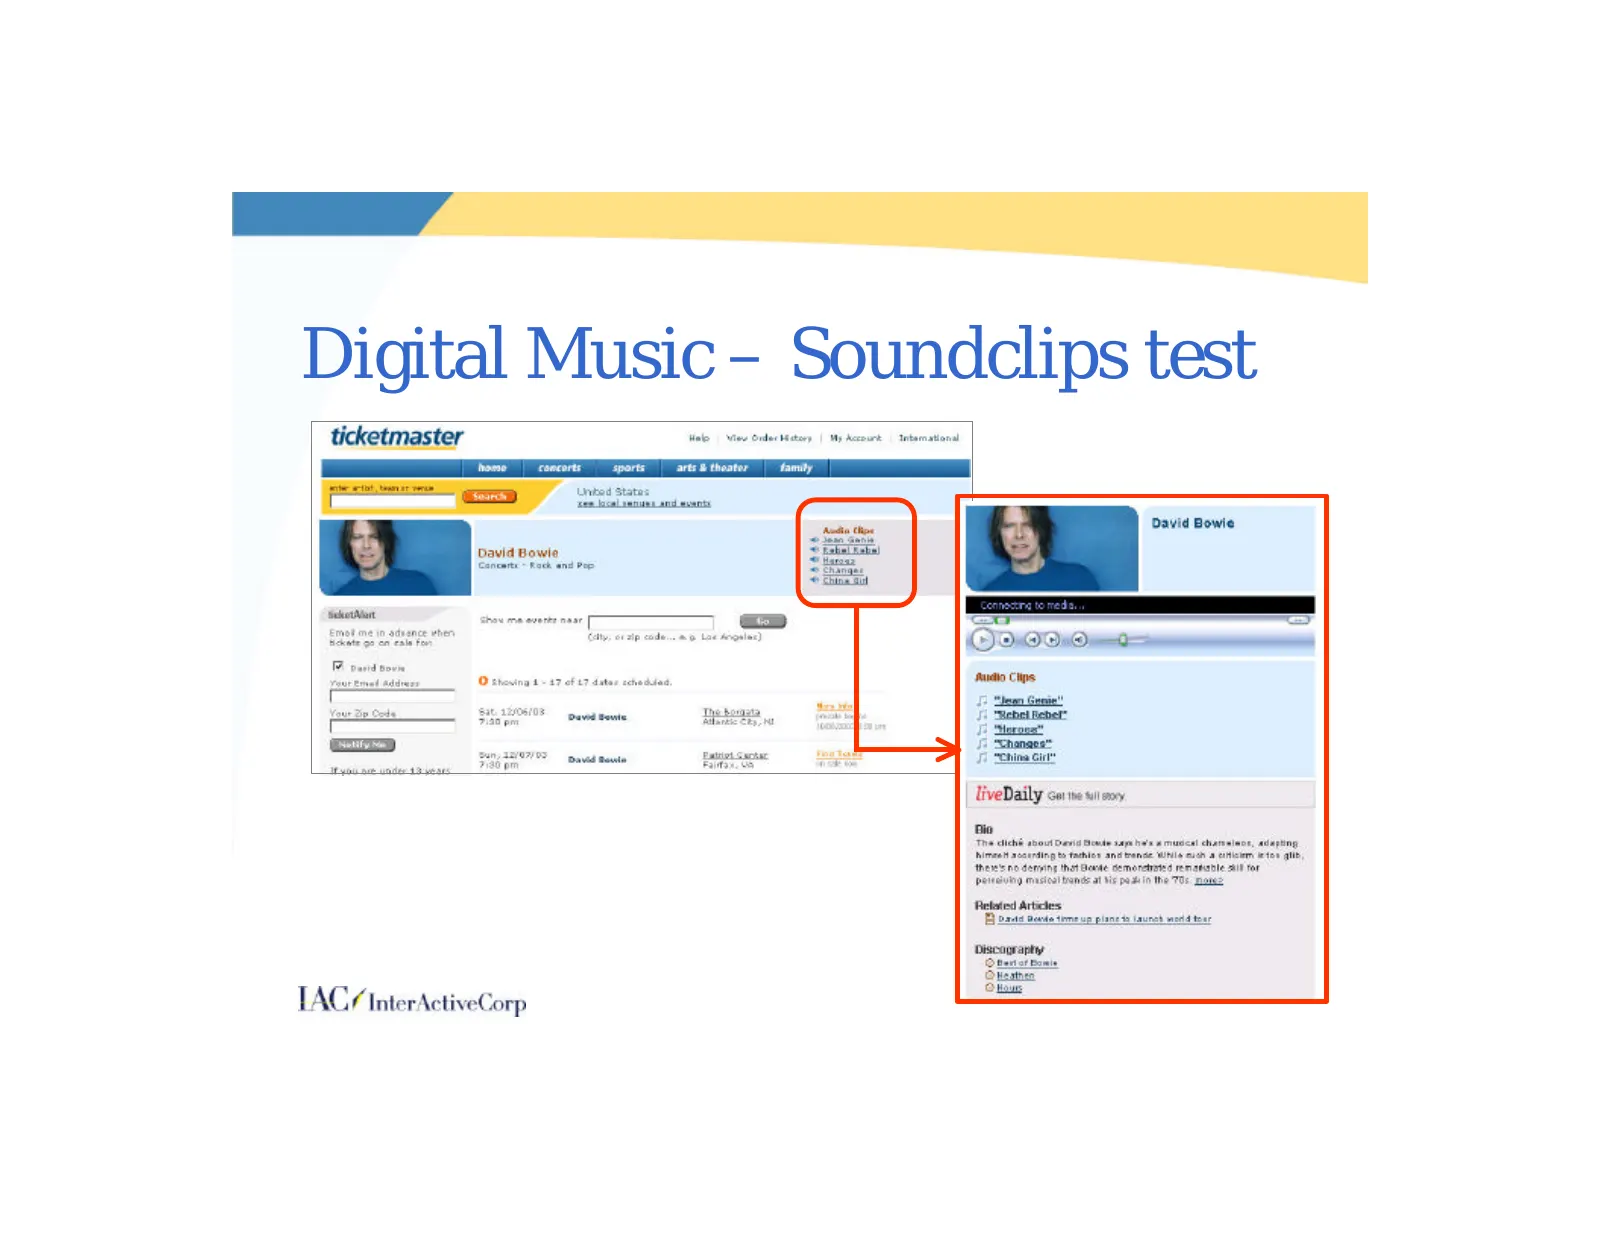
Digital Music – Soundclips test
Source: Internet Archive copy of iac.com
More decks from IAC Inc.
 People — Q2 2026 Earnings Presentation23 slides · Aug 3, 2026
 Q1 2026 Earnings Presentation19 slides · May 5, 2026
 Q4 2025 Earnings Presentation21 slides · Feb 4, 2026
 Q3 2025 Earnings Presentation21 slides · Nov 3, 2025
 Q2 2025 Earnings Presentation20 slides · Aug 5, 2025
 Q1 2025 Earnings Presentation11 slides · May 6, 2025