Raute Oyj Class A · OMXHEX:RAUTE
Raute Oyj Class A — H1 2023 Earnings Presentation
24 slides from Raute Oyj Class A's earnings presentation, Aug 25, 2023
Slide 1: Half-year report H1 2023
Half-year report H1 2023 Mika Saariaho, President and CEO Ville Halttunen, CFO 25 August 2023
Slide 2: Content
Content • Highlights and Group performance • Segment performance • Cash flow, financial position and key figures KUVA • Outlook 2023 2 www.raute.com
Slide 3: Where are we now
Where are we now ✓ Strong order intake despite the market uncertainty • All-time high quarterly order intake of EUR 112 million in Q2, and order backlog of EUR 202 million at the end of the period • Complete mill-sized orders demonstrating Raute’s strong competitive position • Demand for Analyzer so
Slide 4: Highlights of H1/2023 and Q2/2023
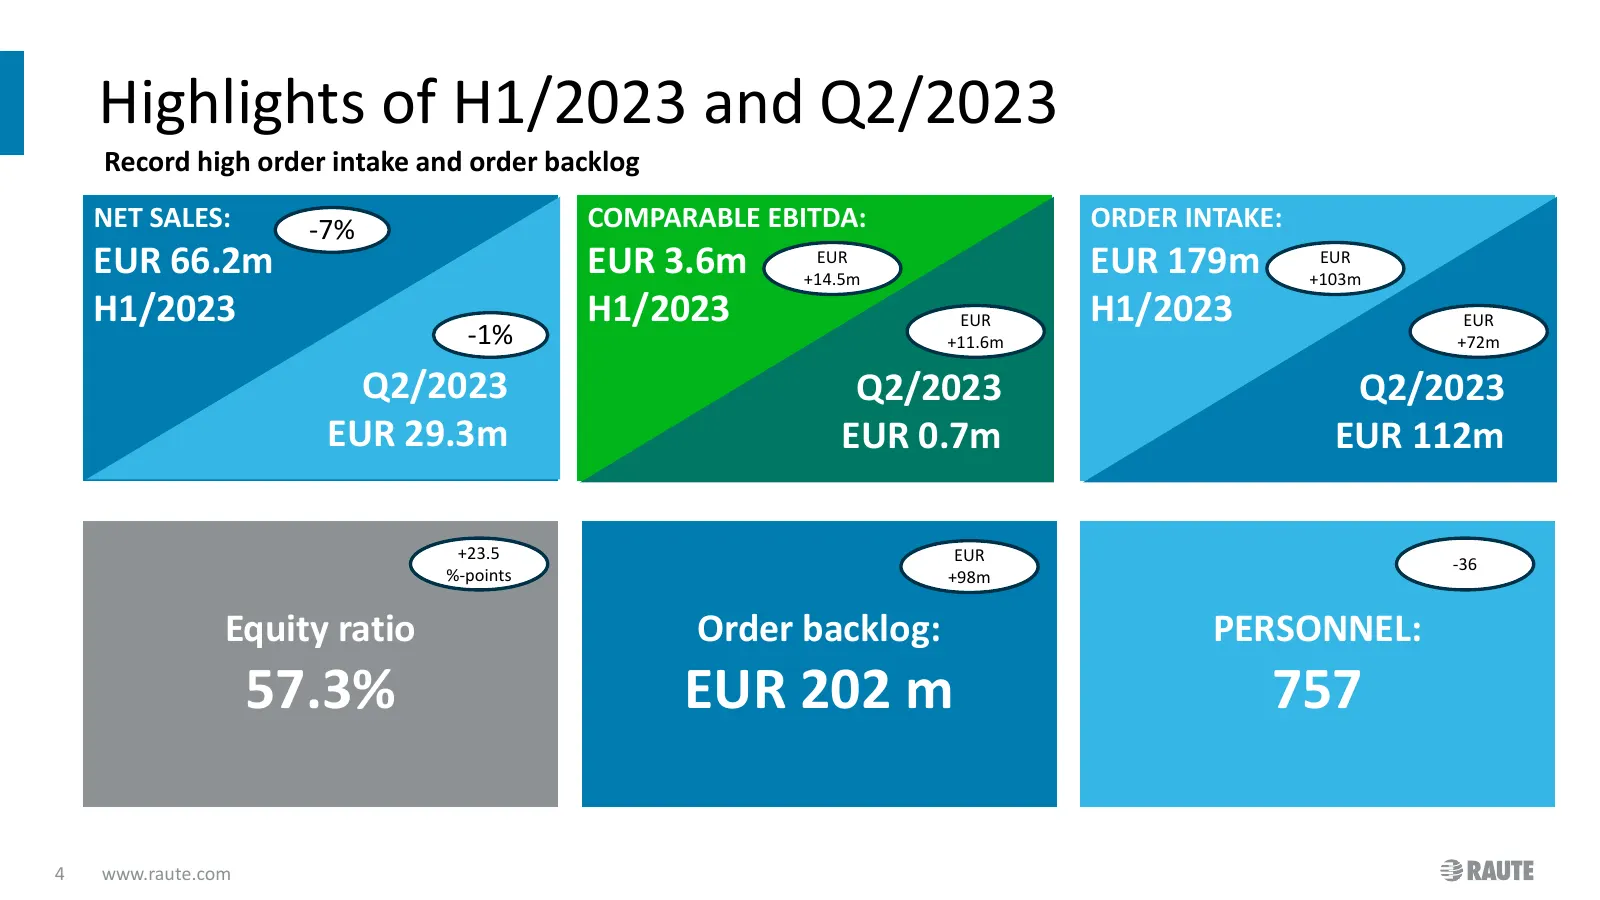
Highlights of H1/2023 and Q2/2023 Record high order intake and order backlog NET SALES: -7% COMPARABLE EBITDA: ORDER INTAKE: EUR 66.2m EUR 3.6m EUR +14.5m EUR 179m EUR +103m H1/2023 H1/2023 EUR H1/2023 EUR -1% +11.6m +72m Q2/2023 Q2/2023 Q2/2023 EUR 29.3m EUR 0.7m EUR 112m +23.5 EUR -36 %-points +98
Slide 5: Order intake
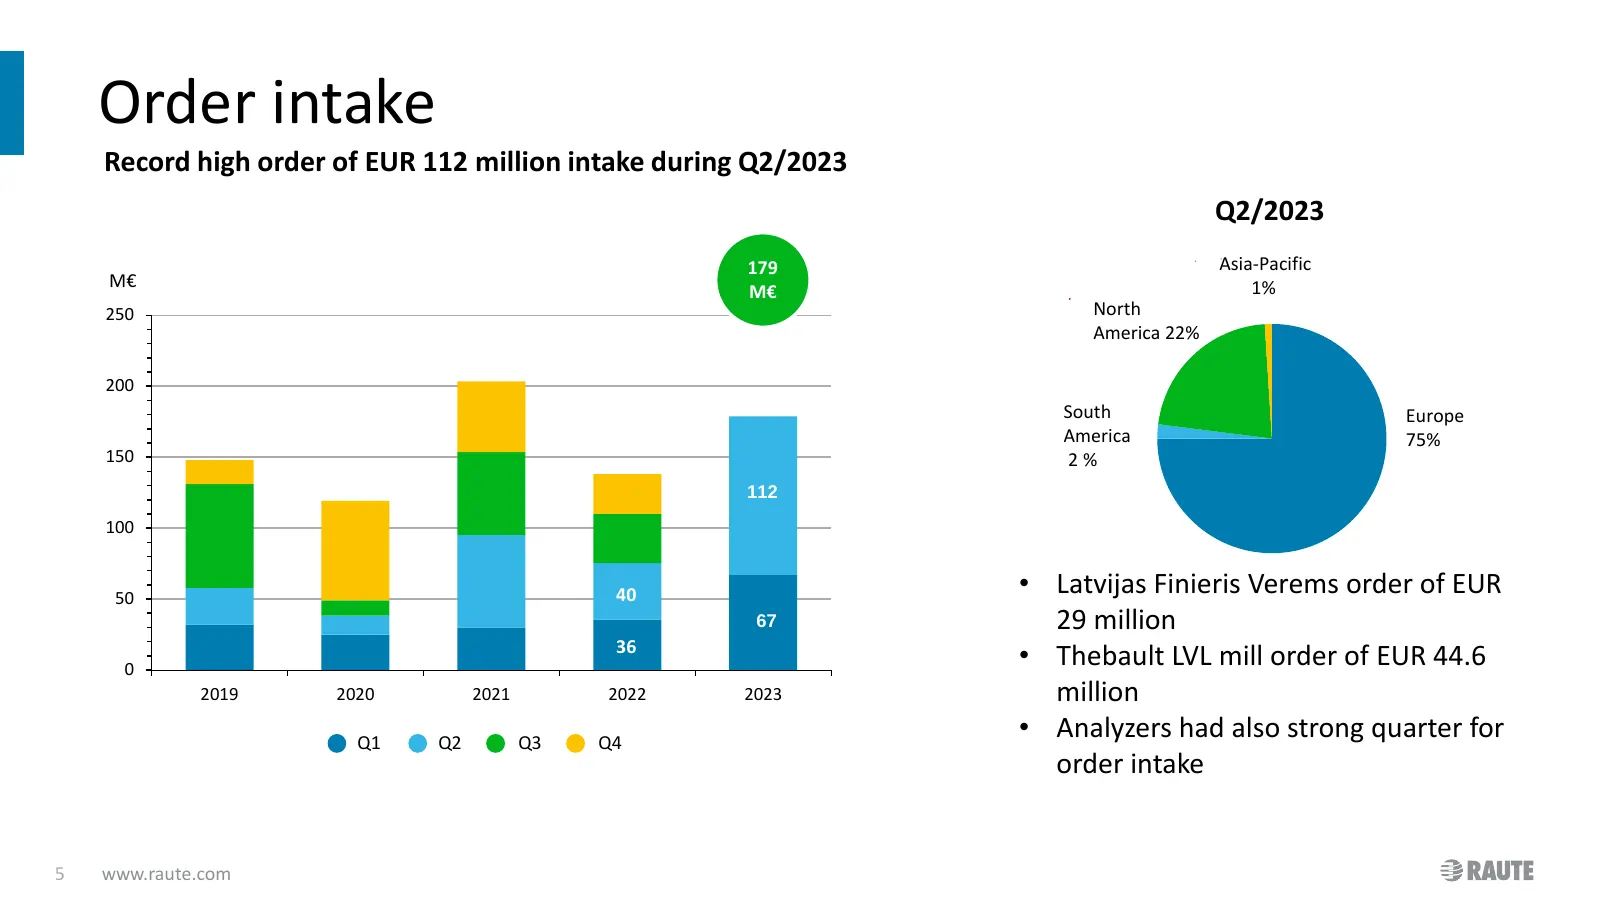
Order intake Record high order of EUR 112 million intake during Q2/2023 Q2/2023 179 Asia-Pacific M€ 1% M€ 250 North America 22% 200 South Europe America 75% 150 2% 112 100 50 40 • Latvijas Finieris Verems order of EUR 67 29 million 0 36 • Thebault LVL mill order of EUR 44.6 2019 2020 2021 2022 2023
Slide 6: Order book
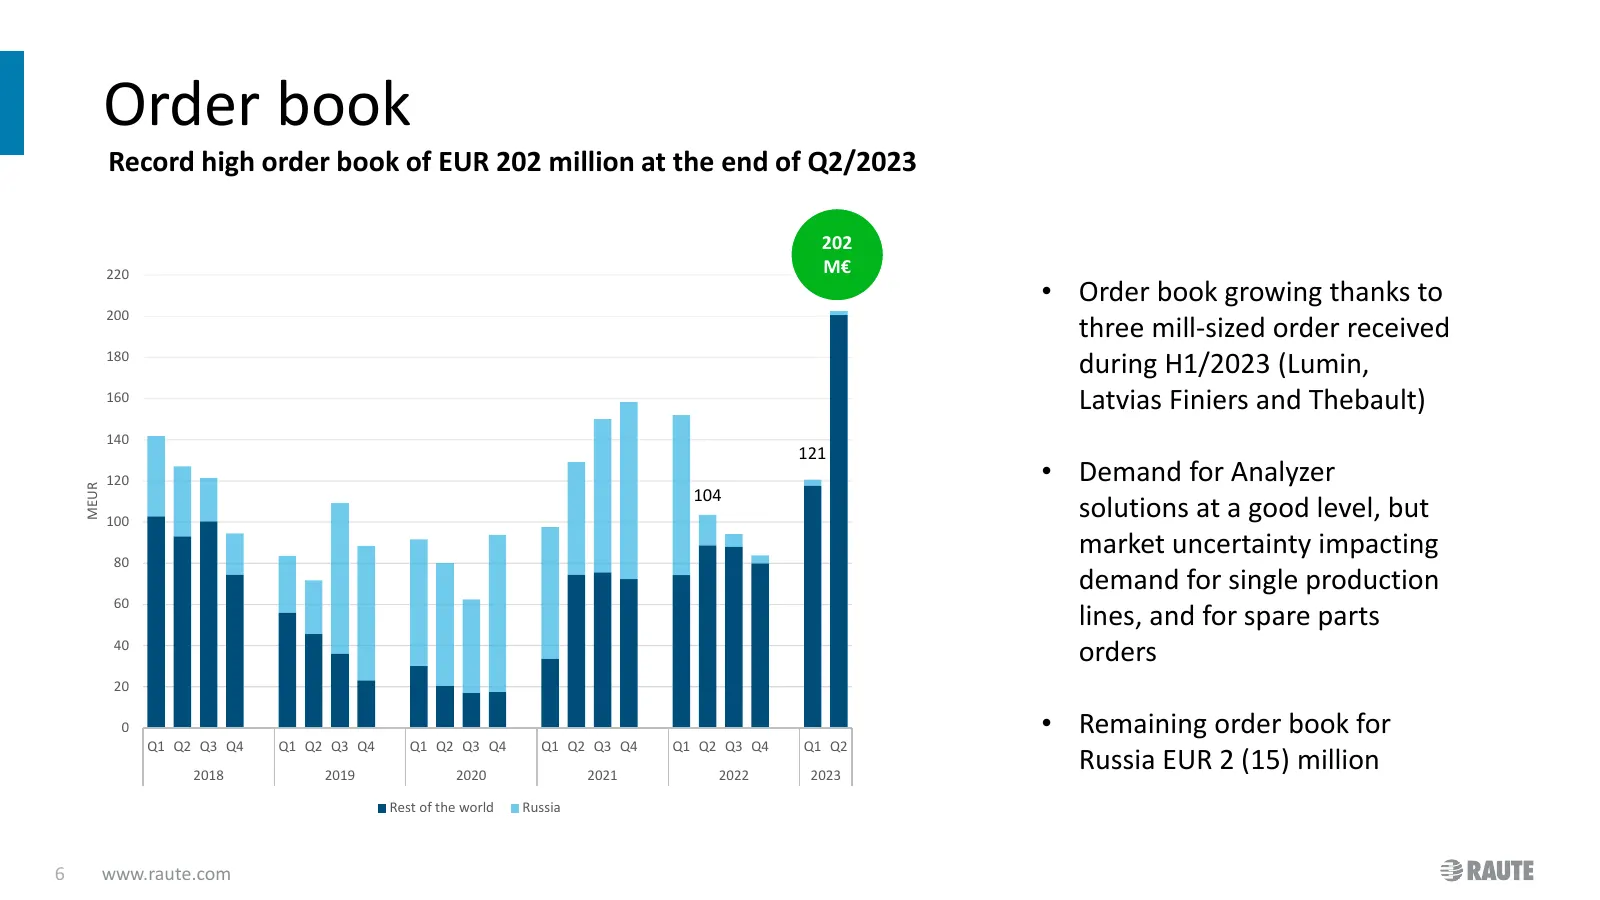
Order book Record high order book of EUR 202 million at the end of Q2/2023 202 220 M€ • Order book growing thanks to 200 three mill-sized order received 180 during H1/2023 (Lumin, 160 Latvias Finiers and Thebault) 140 121 120 • Demand for Analyzer MEUR 104 100 solutions at a good level, but 80 marke
Slide 7: Net sales
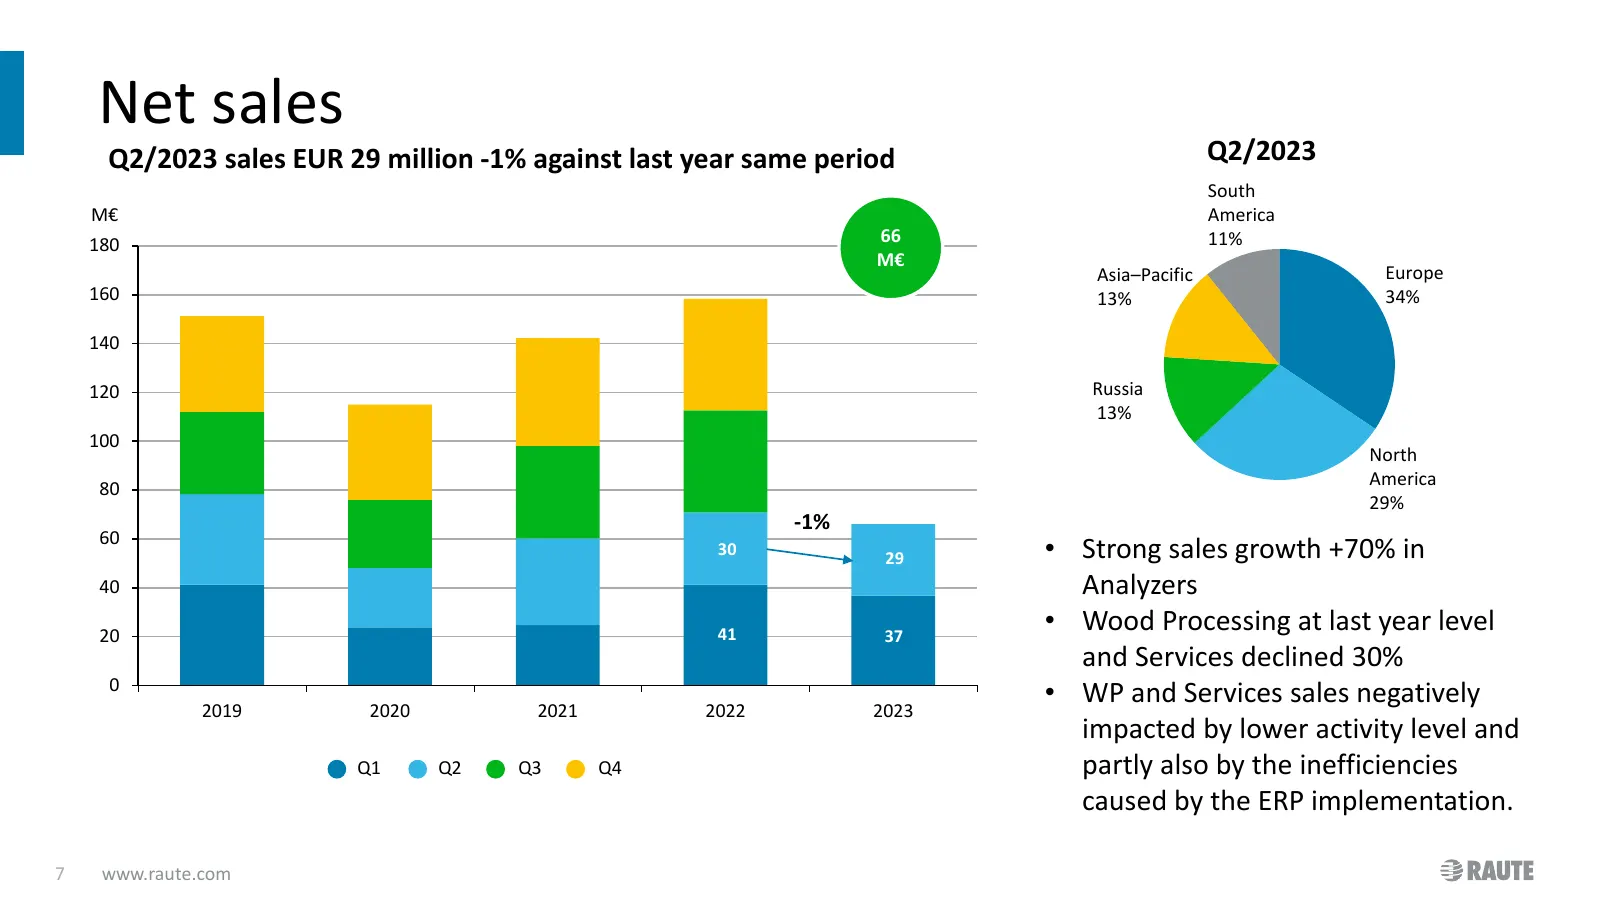
Net sales Q2/2023 sales EUR 29 million -1% against last year same period Q2/2023 South M€ America 180 66 11% M€ Asia–Pacific Europe 160 13% 34% 140 120 Russia 13% 100 North America 80 29% -1% 60 30 29 • Strong sales growth +70% in 40 Analyzers 20 41 37 • Wood Processing at last year level and Servic
Slide 8: Comparable EBITDA
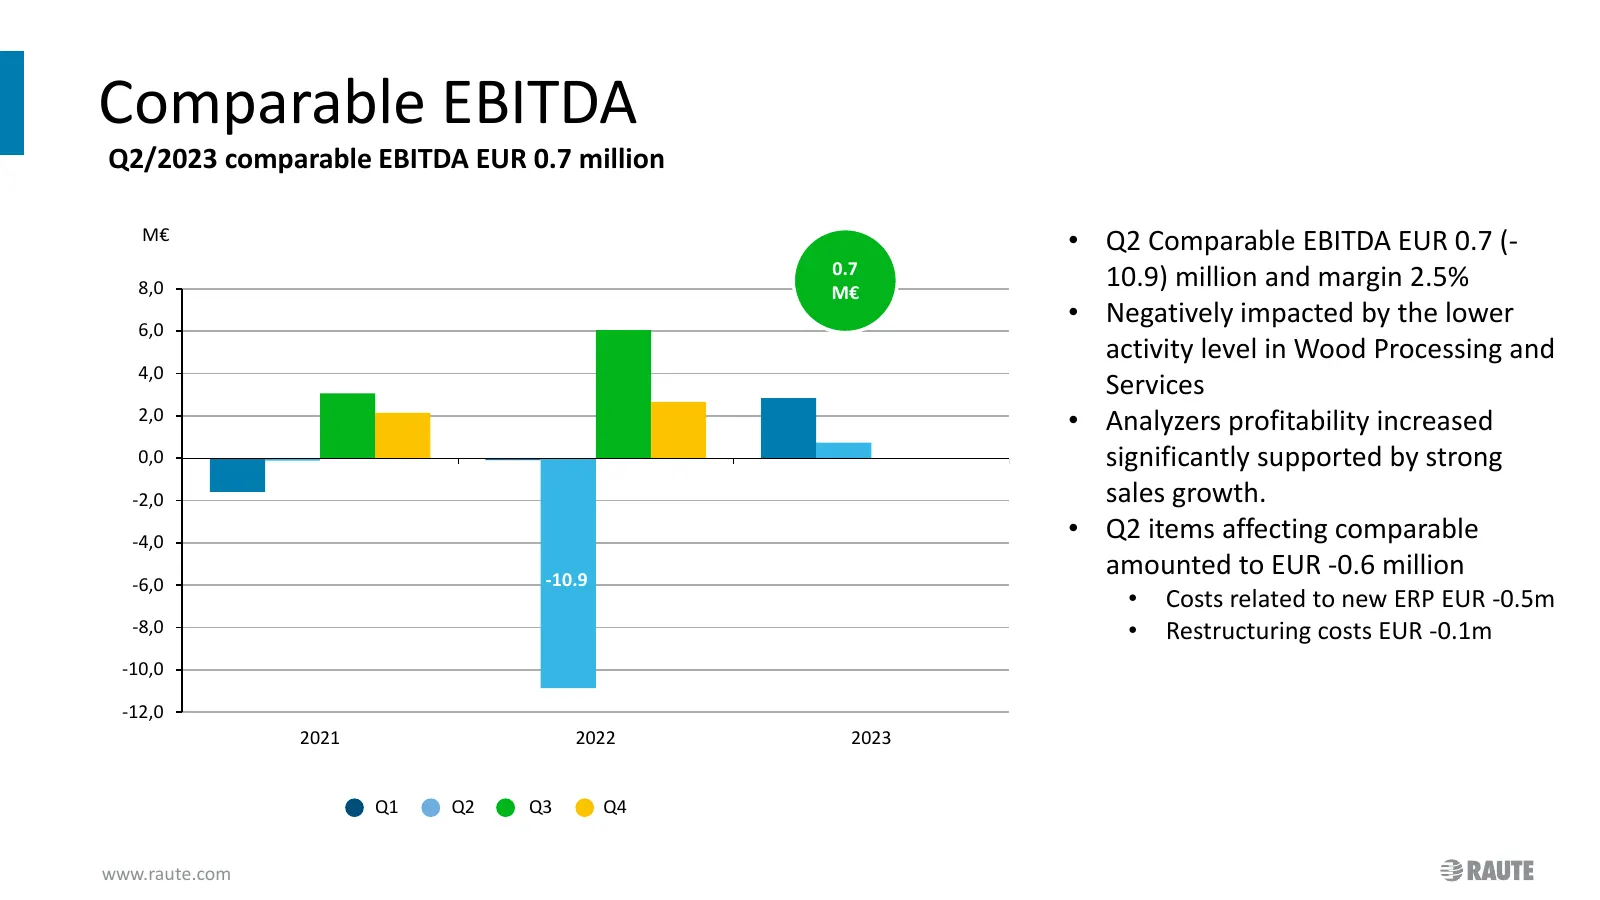
Comparable EBITDA Q2/2023 comparable EBITDA EUR 0.7 million M€ • Q2 Comparable EBITDA EUR 0.7 (- 0.7 8,0 M€ 10.9) million and margin 2.5% 6,0 • Negatively impacted by the lower activity level in Wood Processing and 4,0 Services 2,0 • Analyzers profitability increased 0,0 significantly supported by s
Slide 9: Operating profit (YTD)
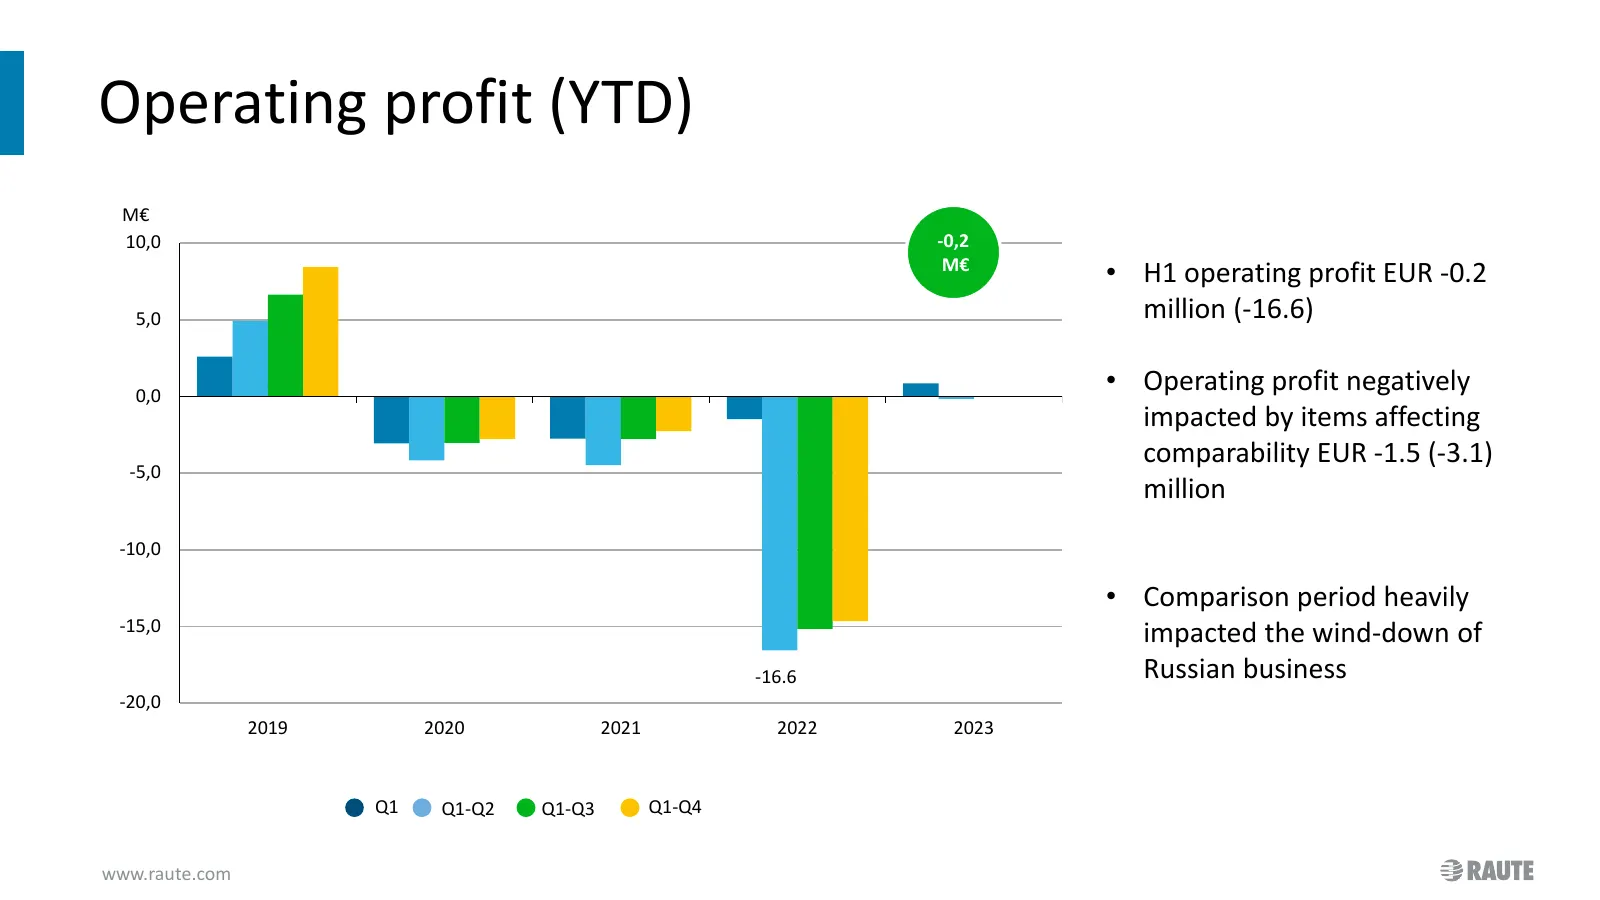
Operating profit (YTD) M€ 10,0 -0,2 M€ • H1 operating profit EUR -0.2 5,0 million (-16.6) 0,0 • Operating profit negatively impacted by items affecting comparability EUR -1.5 (-3.1) -5,0 million -10,0 • Comparison period heavily -15,0 impacted the wind-down of -16.6 Russian business -20,0 2019 2020
Slide 10: Personnel
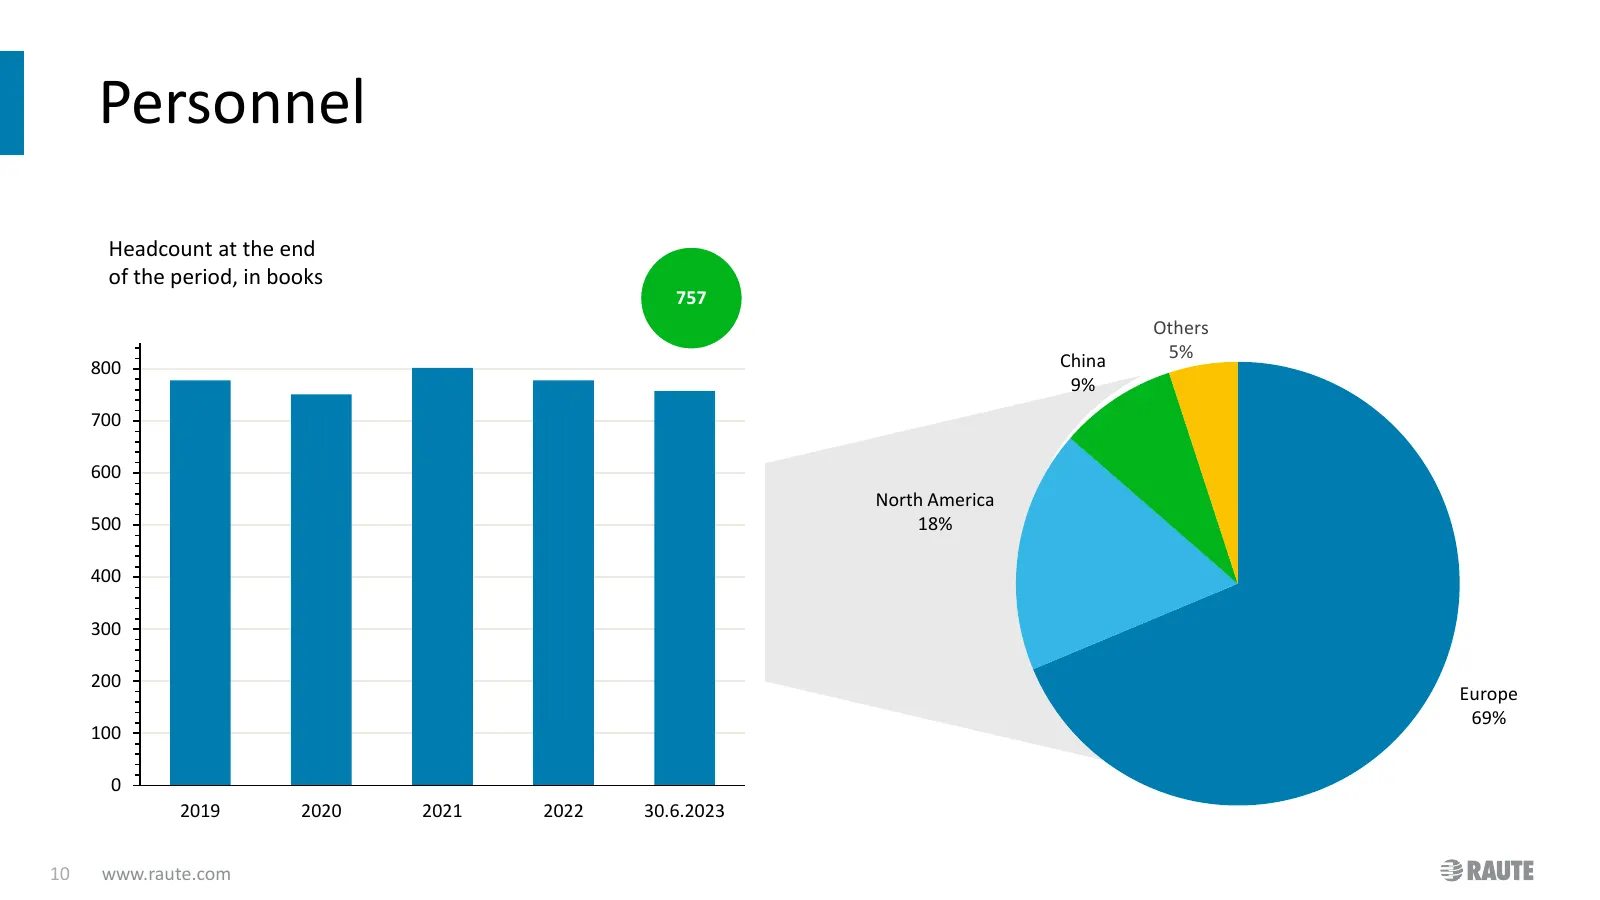
Personnel Headcount at the end of the period, in books 757 Others China 5% 800 9% 700 600 North America 500 18% 400 300 200 Europe 69% 100 0 2019 2020 2021 2022 30.6.2023 10 www.raute.com
Slide 11: Content
Content • Highlights and Group performance • Segment performance • Cash flow, financial position and key figures • Outlook 2023 11 www.raute.com
Slide 12: Wood processing
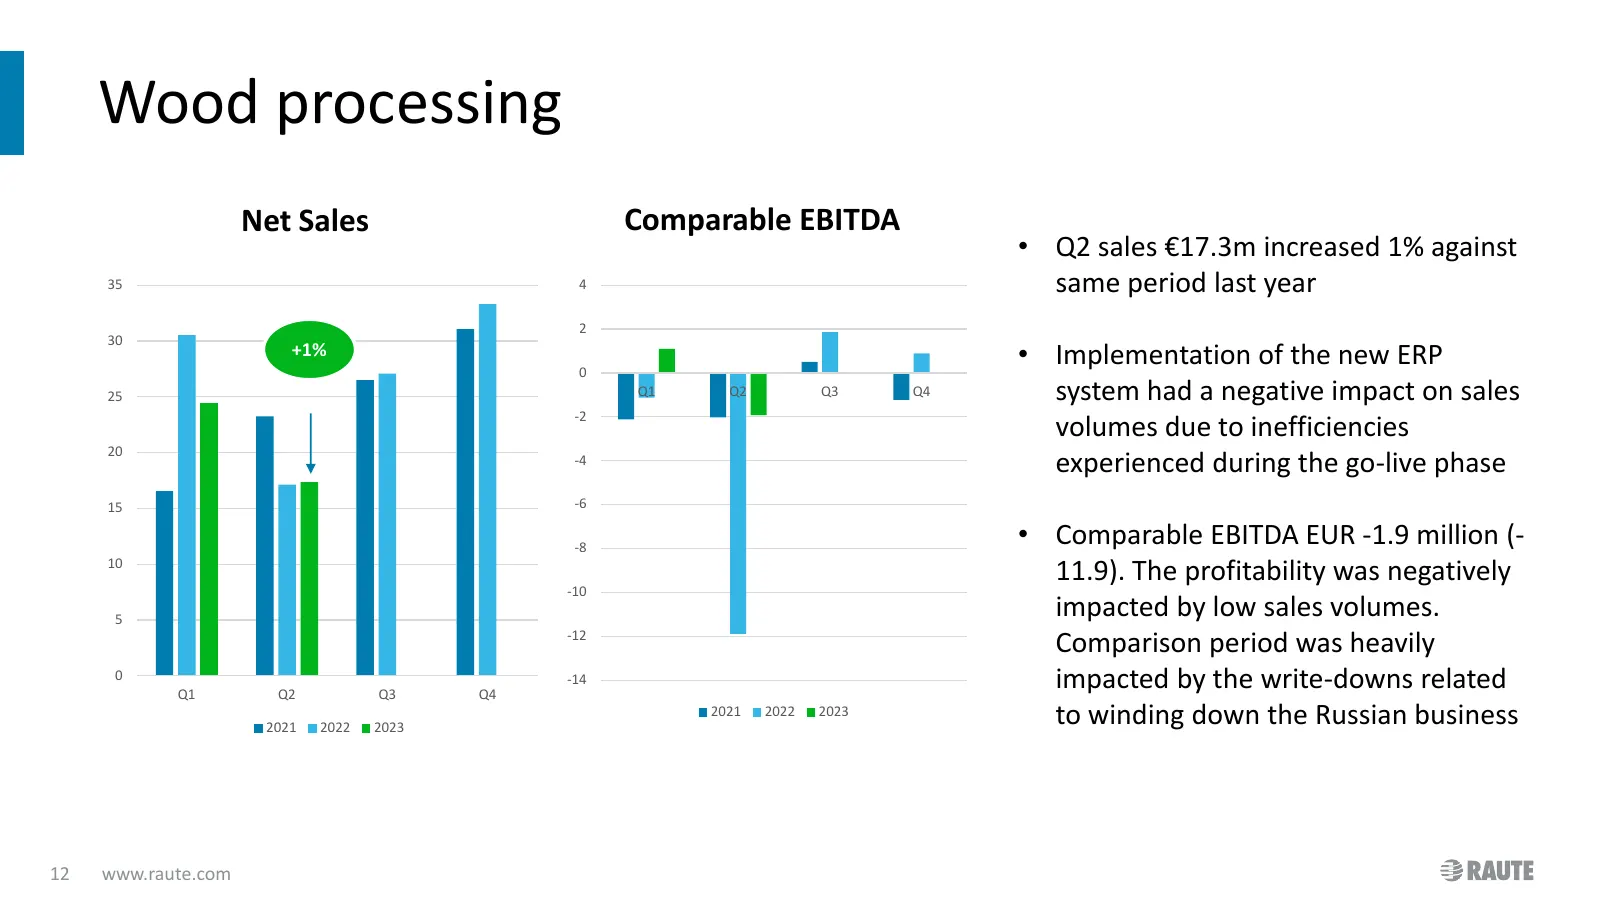
Wood processing Net Sales Comparable EBITDA • Q2 sales €17.3m increased 1% against 35 4 same period last year 2 30 +1% 0 • Implementation of the new ERP 25 Q1 Q2 Q3 Q4 system had a negative impact on sales -2 volumes due to inefficiencies 20 -4 experienced during the go-live phase 15 -6 -8 • Compara
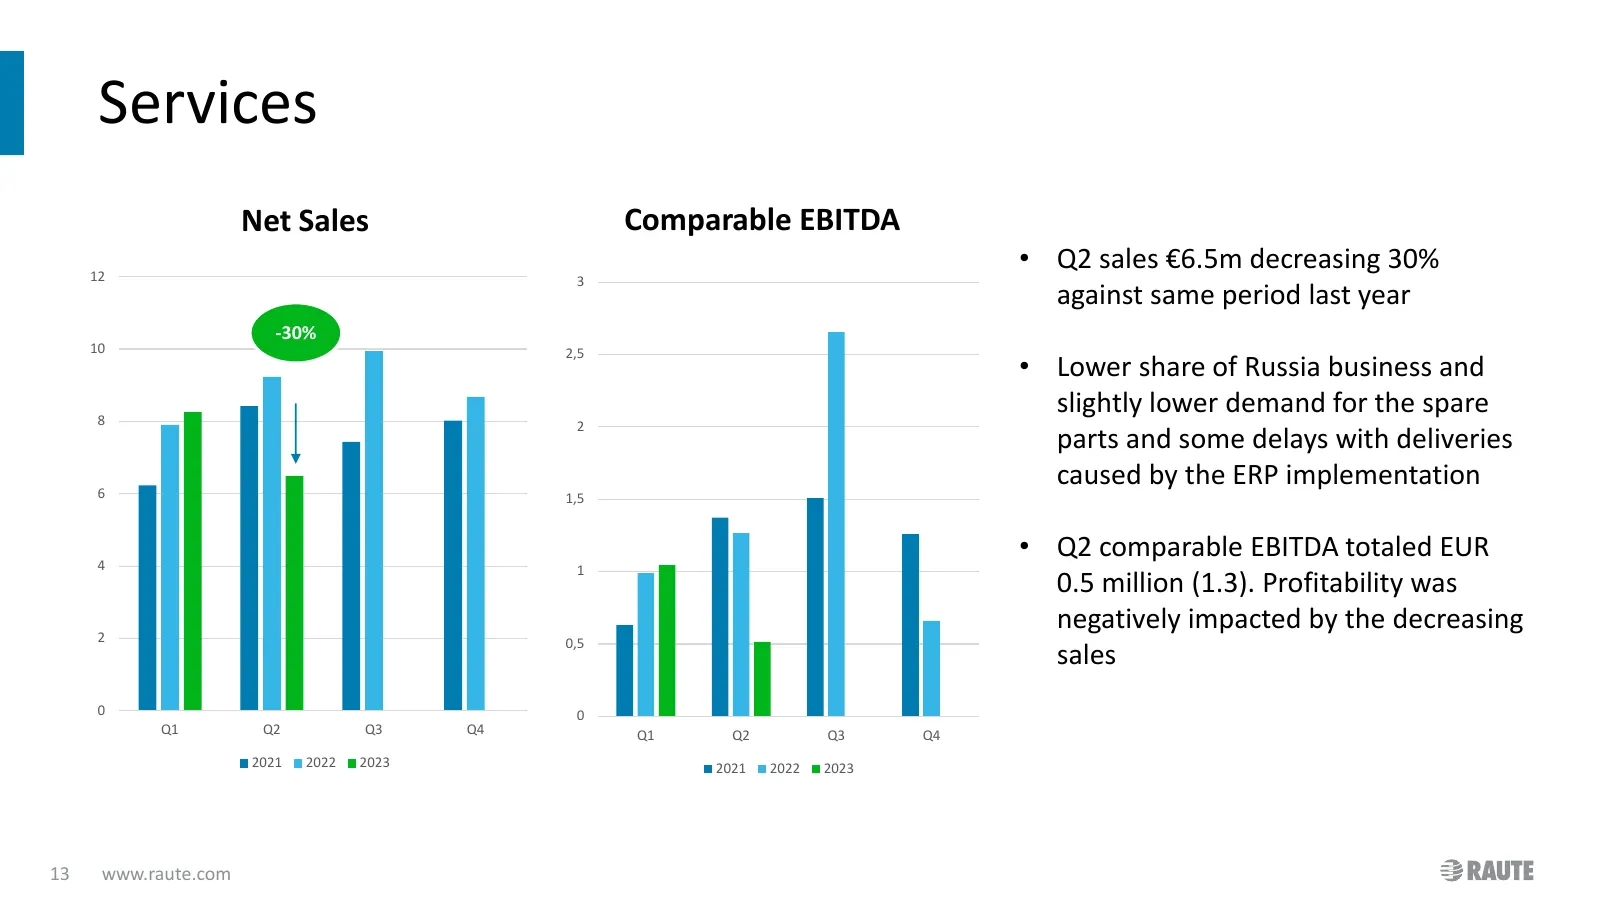
Slide 13: Services
Services Net Sales Comparable EBITDA 12 • Q2 sales €6.5m decreasing 30% 3 against same period last year -30% 10 2,5 • Lower share of Russia business and 8 slightly lower demand for the spare 2 parts and some delays with deliveries 6 caused by the ERP implementation 1,5 4 • Q2 comparable EBITDA total
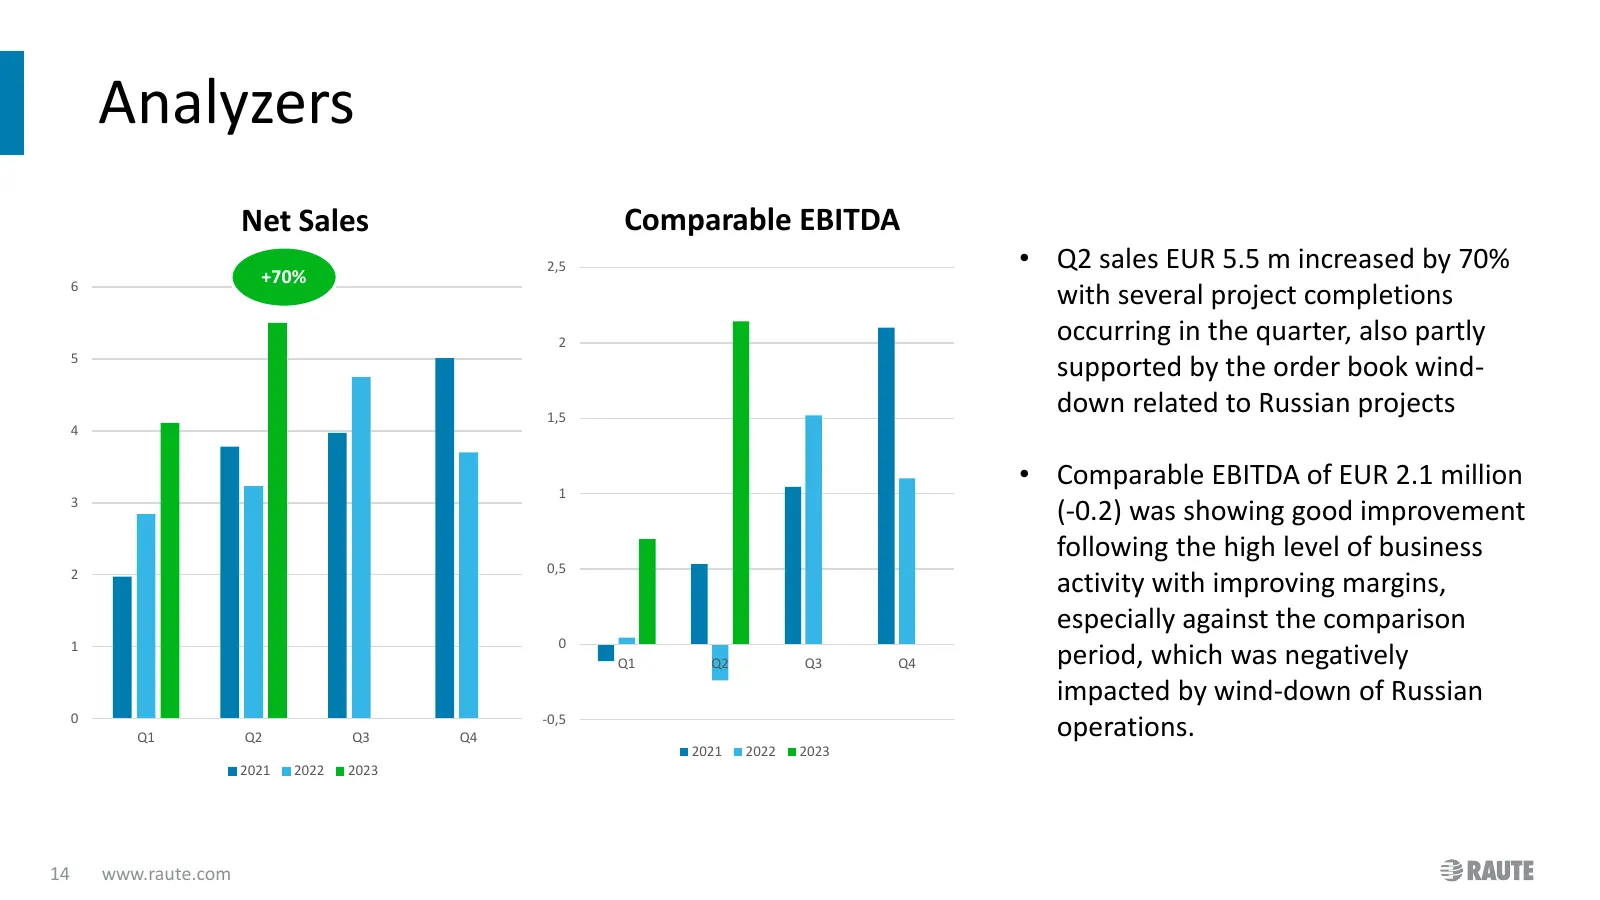
Slide 14: Analyzers
Analyzers Net Sales Comparable EBITDA 2,5 • Q2 sales EUR 5.5 m increased by 70% 6 +70% with several project completions -30% 2 occurring in the quarter, also partly 5 supported by the order book wind- 1,5 down related to Russian projects 4 1 • Comparable EBITDA of EUR 2.1 million 3 (-0.2) was showin
Slide 15: Content
Content • Highlights and Group performance • Segment performance • Cash flow, financial position and key figures • Outlook 2023 15 www.raute.com
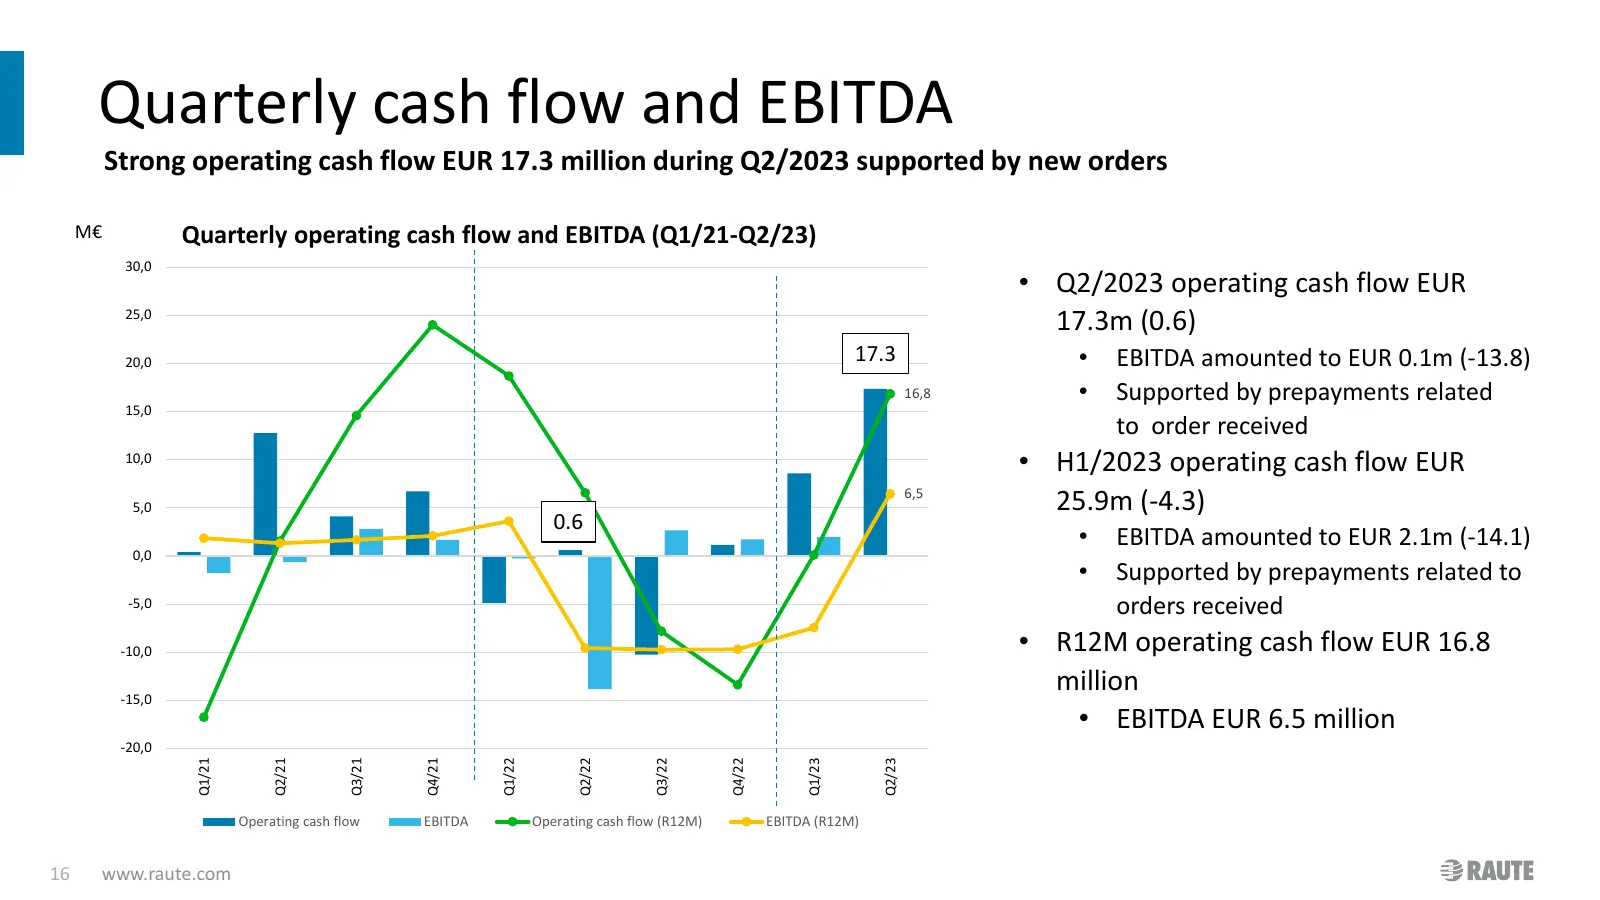
Slide 16: Quarterly cash flow and EBITDA
Quarterly cash flow and EBITDA Strong operating cash flow EUR 17.3 million during Q2/2023 supported by new orders M€ Quarterly operating cash flow and EBITDA (Q1/21-Q2/23) 30,0 • Q2/2023 operating cash flow EUR 25,0 17.3m (0.6) 20,0 17.3 • EBITDA amounted to EUR 0.1m (-13.8) 16,8 • Supported by prep
Slide 17: Net working capital
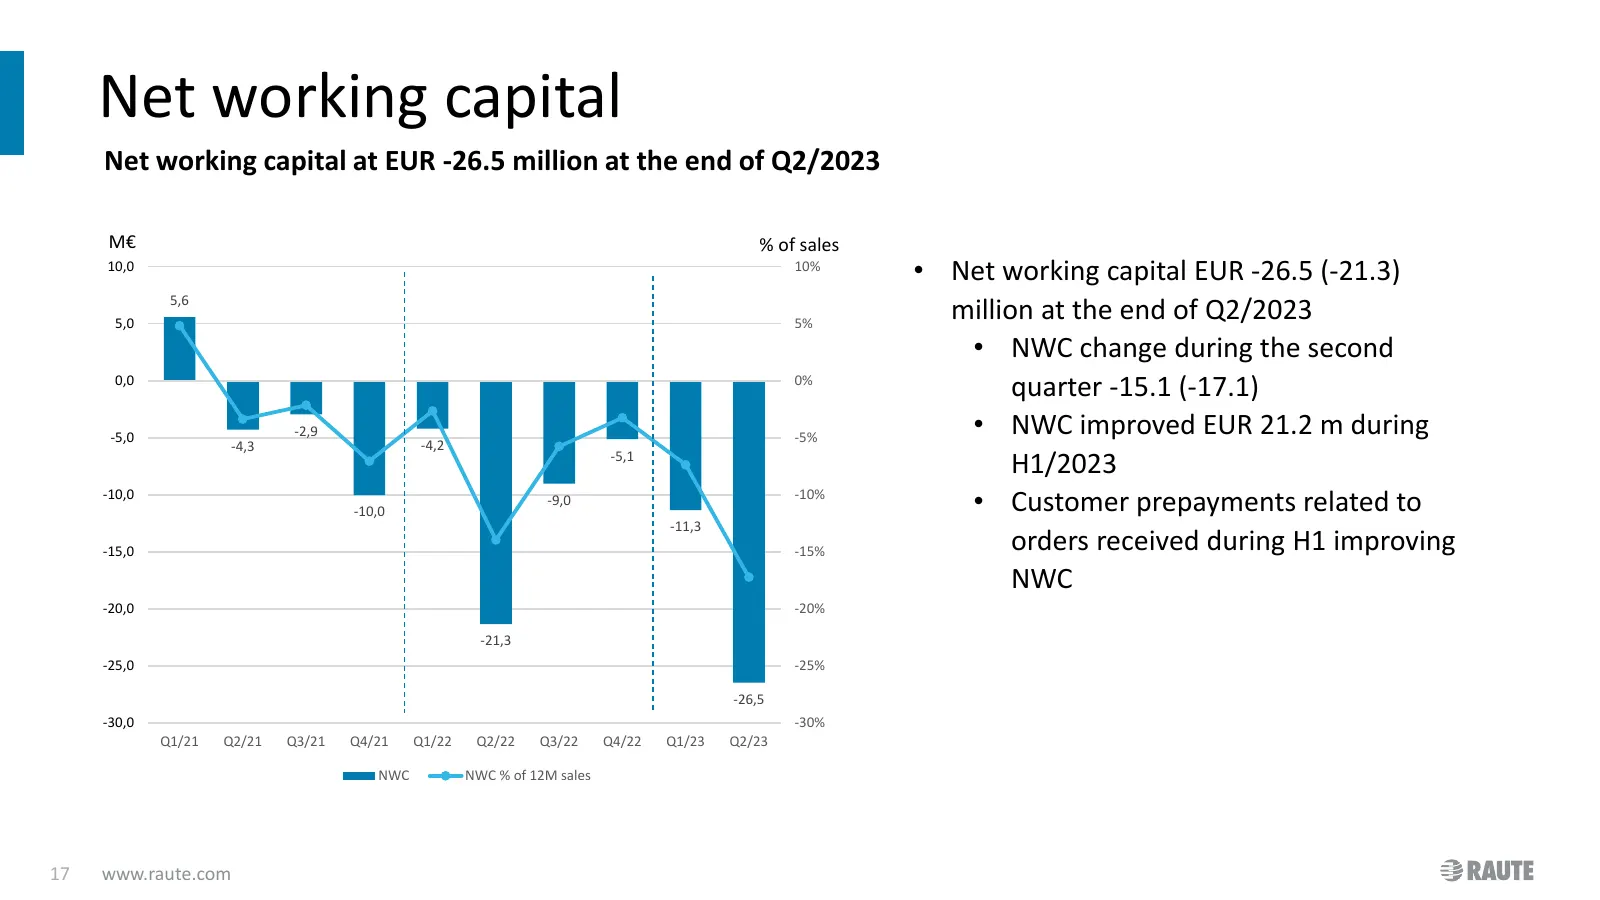
Net working capital Net working capital at EUR -26.5 million at the end of Q2/2023 M€ % of sales 10,0 10% • Net working capital EUR -26.5 (-21.3) 5,6 5,0 5% million at the end of Q2/2023 • NWC change during the second 0,0 0% quarter -15.1 (-17.1) -5,0 -2,9 -5% • NWC improved EUR 21.2 m during -4,3 -
Slide 18: Equity ratio
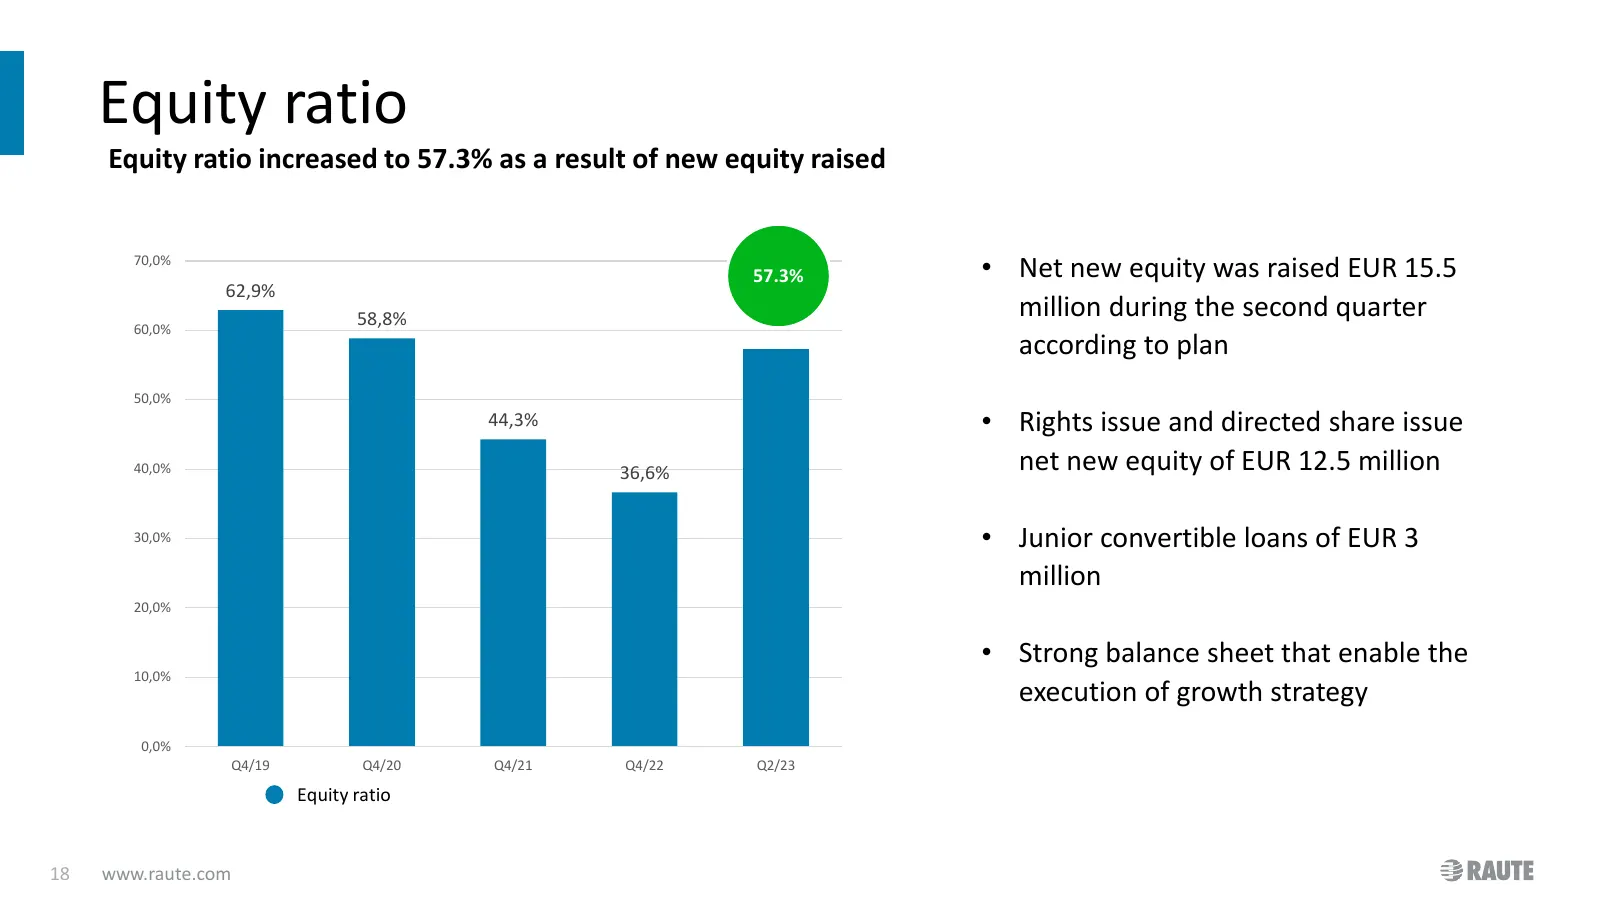
Equity ratio Equity ratio increased to 57.3% as a result of new equity raised 70,0% 57.3% • Net new equity was raised EUR 15.5 62,9% 58,8% million during the second quarter 60,0% according to plan 50,0% 44,3% • Rights issue and directed share issue 40,0% 36,6% net new equity of EUR 12.5 million 30,0
Slide 19: Capex and depreciation and amortization
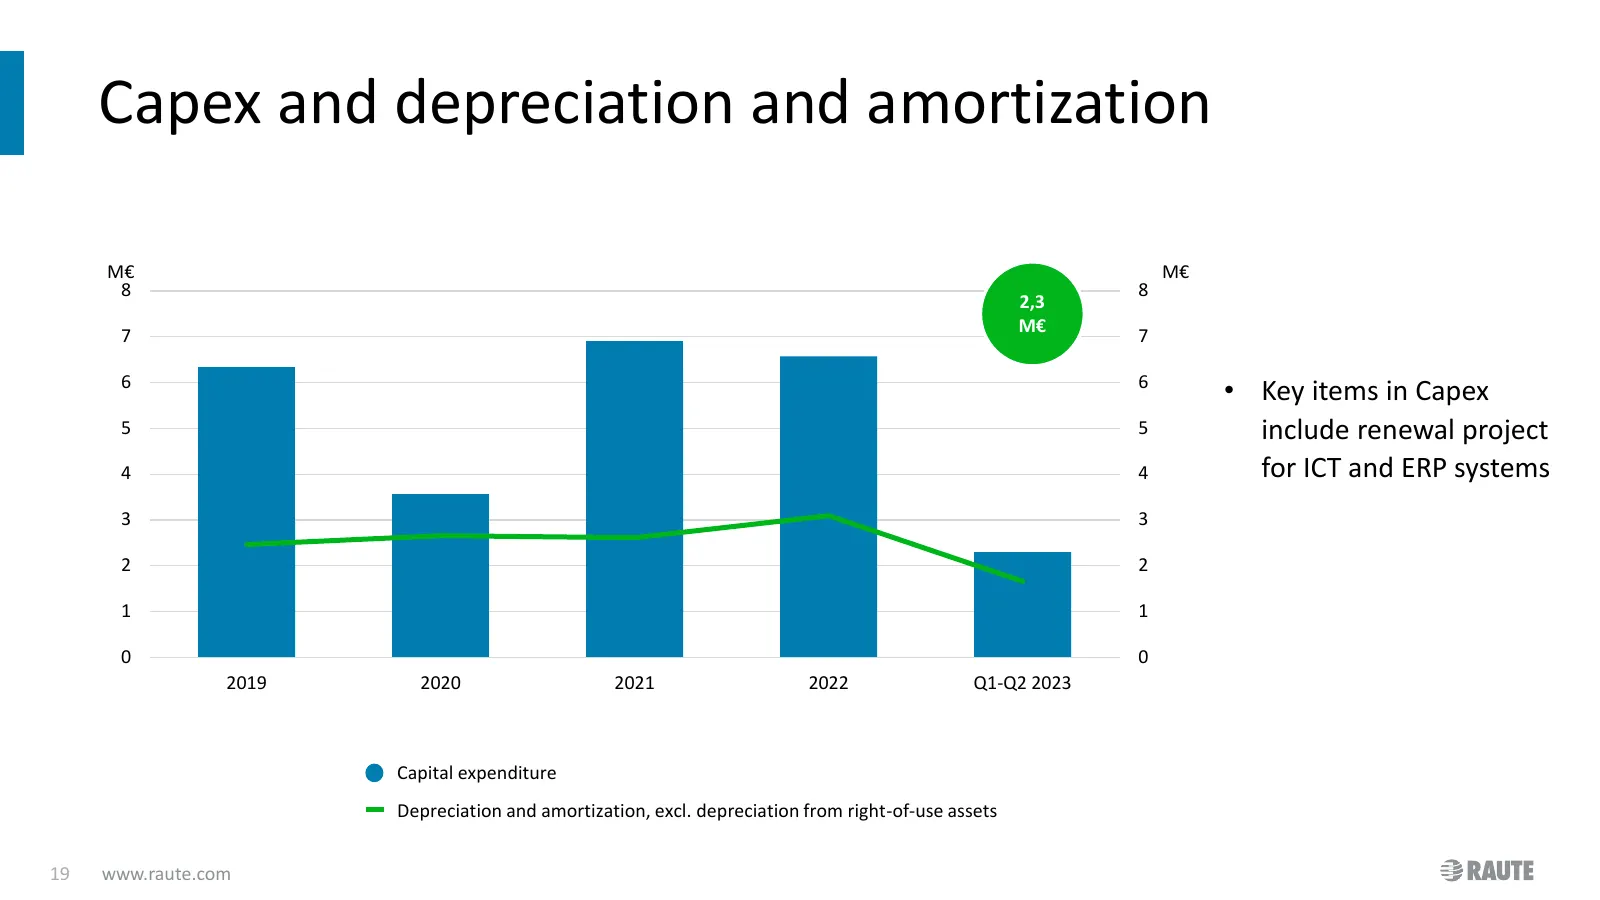
Capex and depreciation and amortization M€ M€ 8 8 2,3 7 M€ 7 6 6 • Key items in Capex 5 5 include renewal project 4 4 for ICT and ERP systems 3 3 2 2 1 1 0 0 2019 2020 2021 2022 Q1-Q2 2023 Capital expenditure Depreciation and amortization, excl. depreciation from right-of-use assets 19 www.raute.com
Slide 20: Research and Development
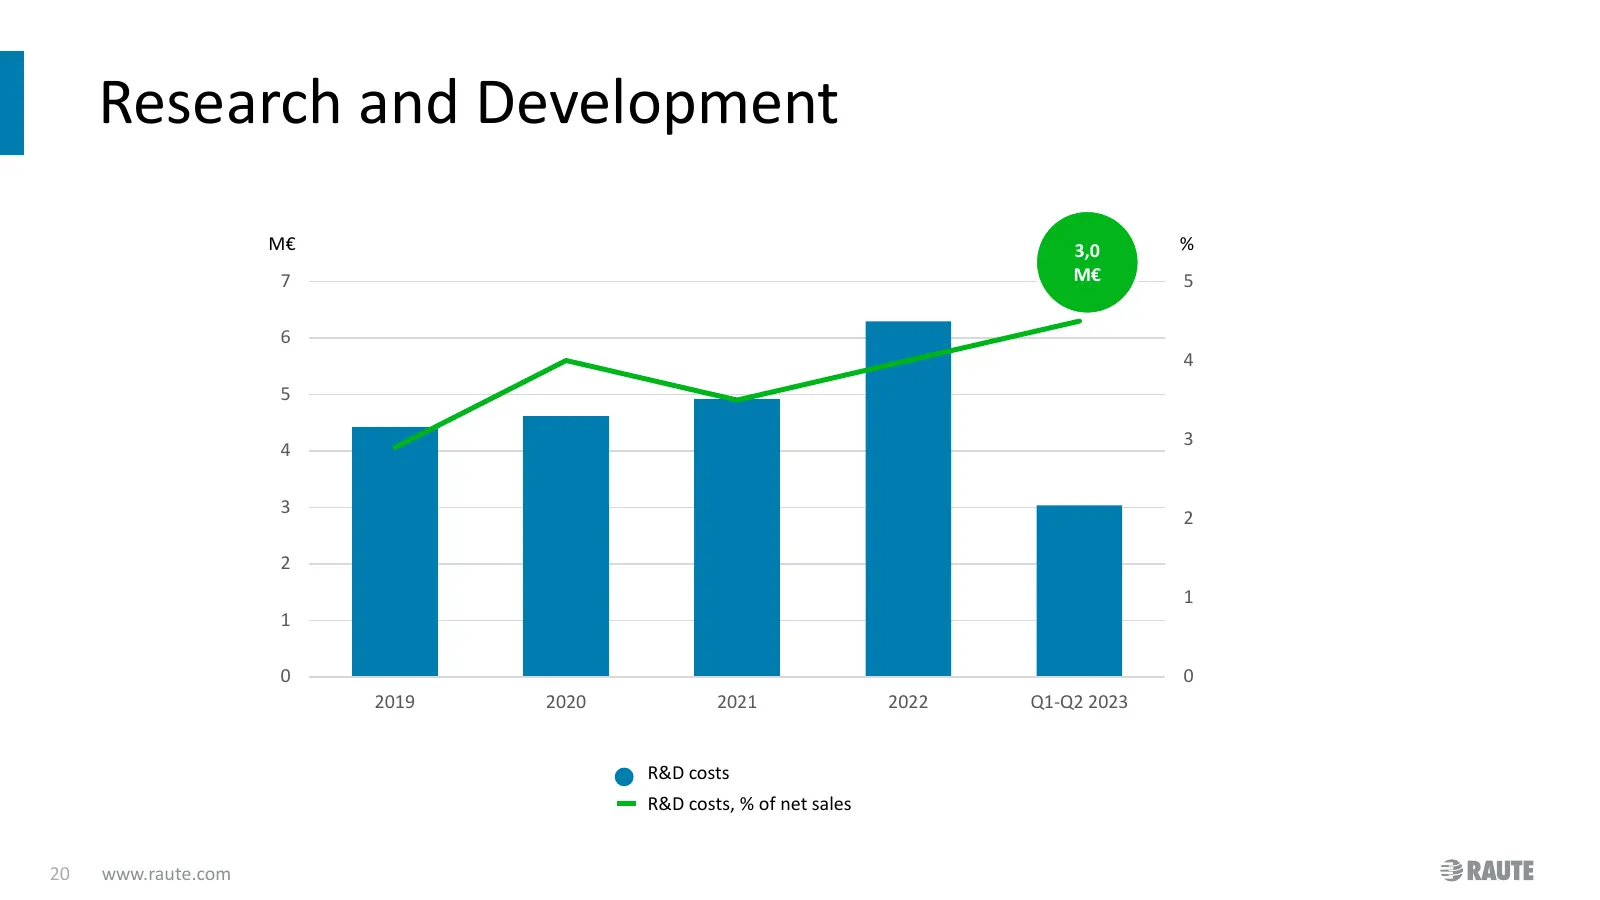
Research and Development M€ 3,0 % 7 M€ 5 6 4 5 3 4 3 2 2 1 1 0 0 2019 2020 2021 2022 Q1-Q2 2023 R&D costs R&D costs, % of net sales 20 www.raute.com
Slide 21: Content
Content • Highlights and Group performance • Segment performance • Cash flow, financial position and key figures • Outlook 2023 21 www.raute.com
Slide 22: Outlook for 2023
Outlook for 2023 Business environment Raute • The global economy has remained uncertain during • Mill-sized orders are expected to start H1/2023; increasing interest rates and overall uncertainty generate sales and profit during the latter part of are impacting the market outlook. High inflation, as
Slide 23: Further information
Further information Mika Saariaho President and CEO +358 40 1549393 mika.saariaho@raute.com Ville Halttunen CFO +358 50 3460868 ville.halttunen@raute.com.com 23 www.raute.com

Slide 24: Thank you for your interest!
Thank you for Follow us online: your interest! www.raute.com LinkedIn: Raute Oyj Youtube: www.youtube.com/RauteMachinery Facebook: Raute Corporation Instagram: @rautecorporation
Source: Internet Archive copy of materials.raute.com
More decks from Raute Oyj Class A
 H1 2026 Earnings Presentation29 slides · Aug 12, 2026
 Q1 2026 Earnings Presentation29 slides · May 7, 2026
 FY2025 Earnings Presentation30 slides · Feb 12, 2026
 Q3 2025 Earnings Presentation29 slides · Oct 30, 2025
 H1 2025 Earnings Presentation29 slides · Aug 12, 2025
 Q1 2025 Earnings Presentation29 slides · May 7, 2025