Varex Imaging Corporation · NASDAQ:VREX
Varex Imaging — Q3 FY2022 Earnings Presentation
25 slides from Varex Imaging's earnings presentation, Aug 2, 2022

Slide 1: Q3 FY22 Earnings Presentation
Solutions in Sight® Q3 FY22 Earnings Presentation August 2, 2022
Slide 2: Forward Looking Statements / Non-GAAP Measures
Forward Looking Statements / Non-GAAP Measures Forward Looking Statements Certain statements in this supplement contain “forward-looking statements” within the meaning of Section 27A of the Securities Act of 1933 and Section 21E of the Securities Exchange Act of 1934. Forward looking statements incl
Slide 3: Q3 FY22 Results
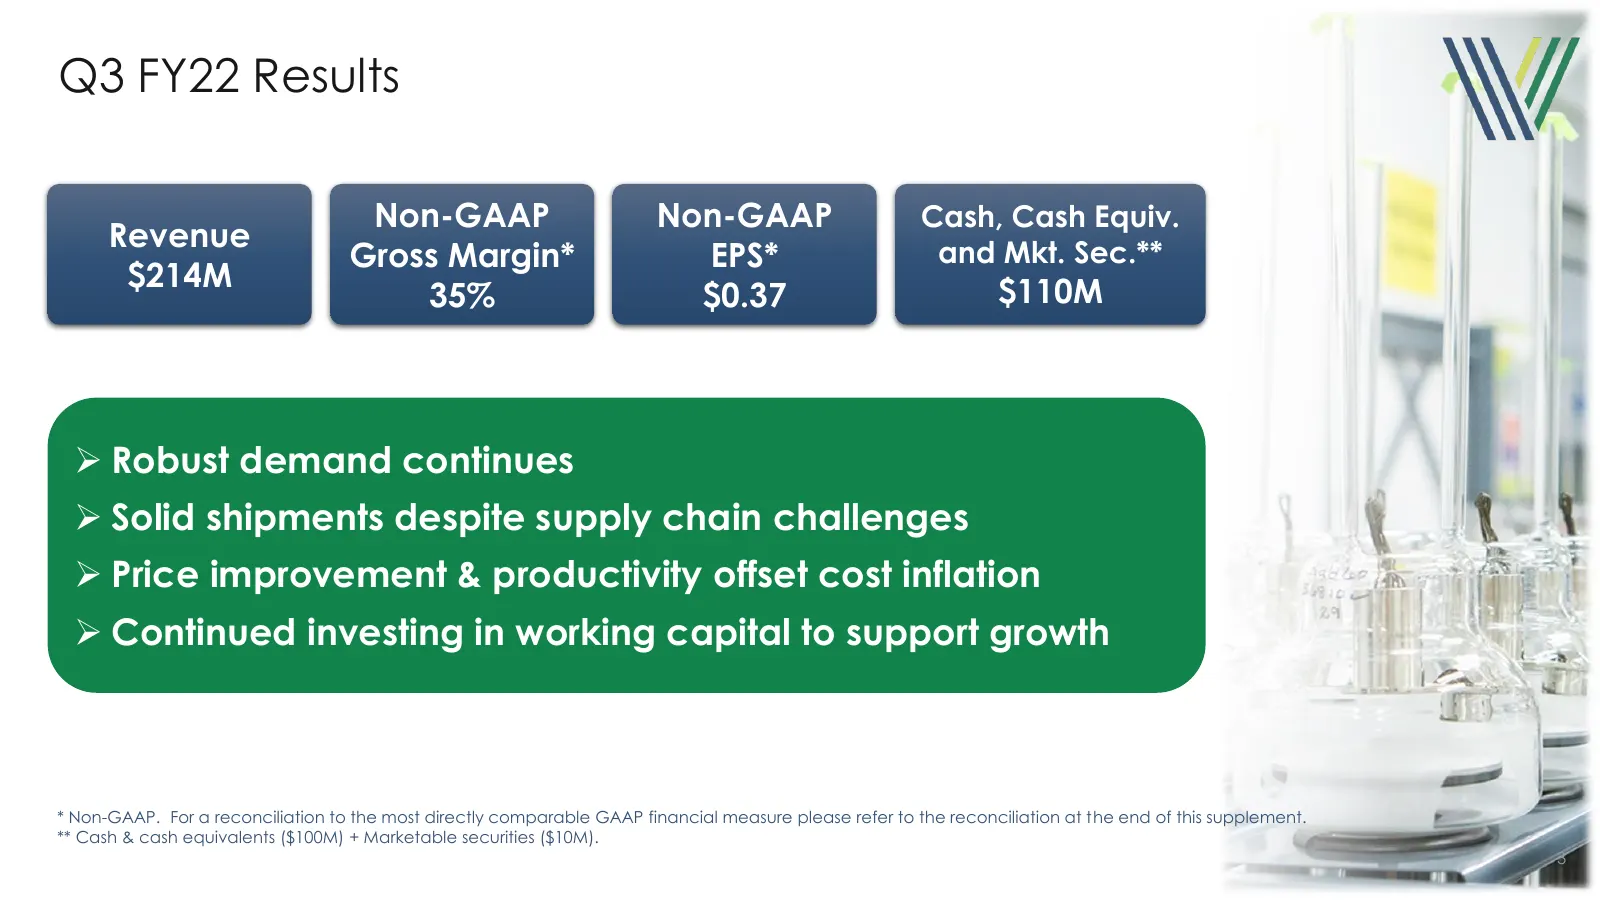
Q3 FY22 Results Non-GAAP Non-GAAP Cash, Cash Equiv. Revenue Gross Margin* EPS* and Mkt. Sec.** $214M $110M 35% $0.37 ➢ Robust demand continues ➢ Solid shipments despite supply chain challenges ➢ Price improvement & productivity offset cost inflation ➢ Continued investing in working capital to suppor
Slide 4: Q3 FY22 Sequential Performance
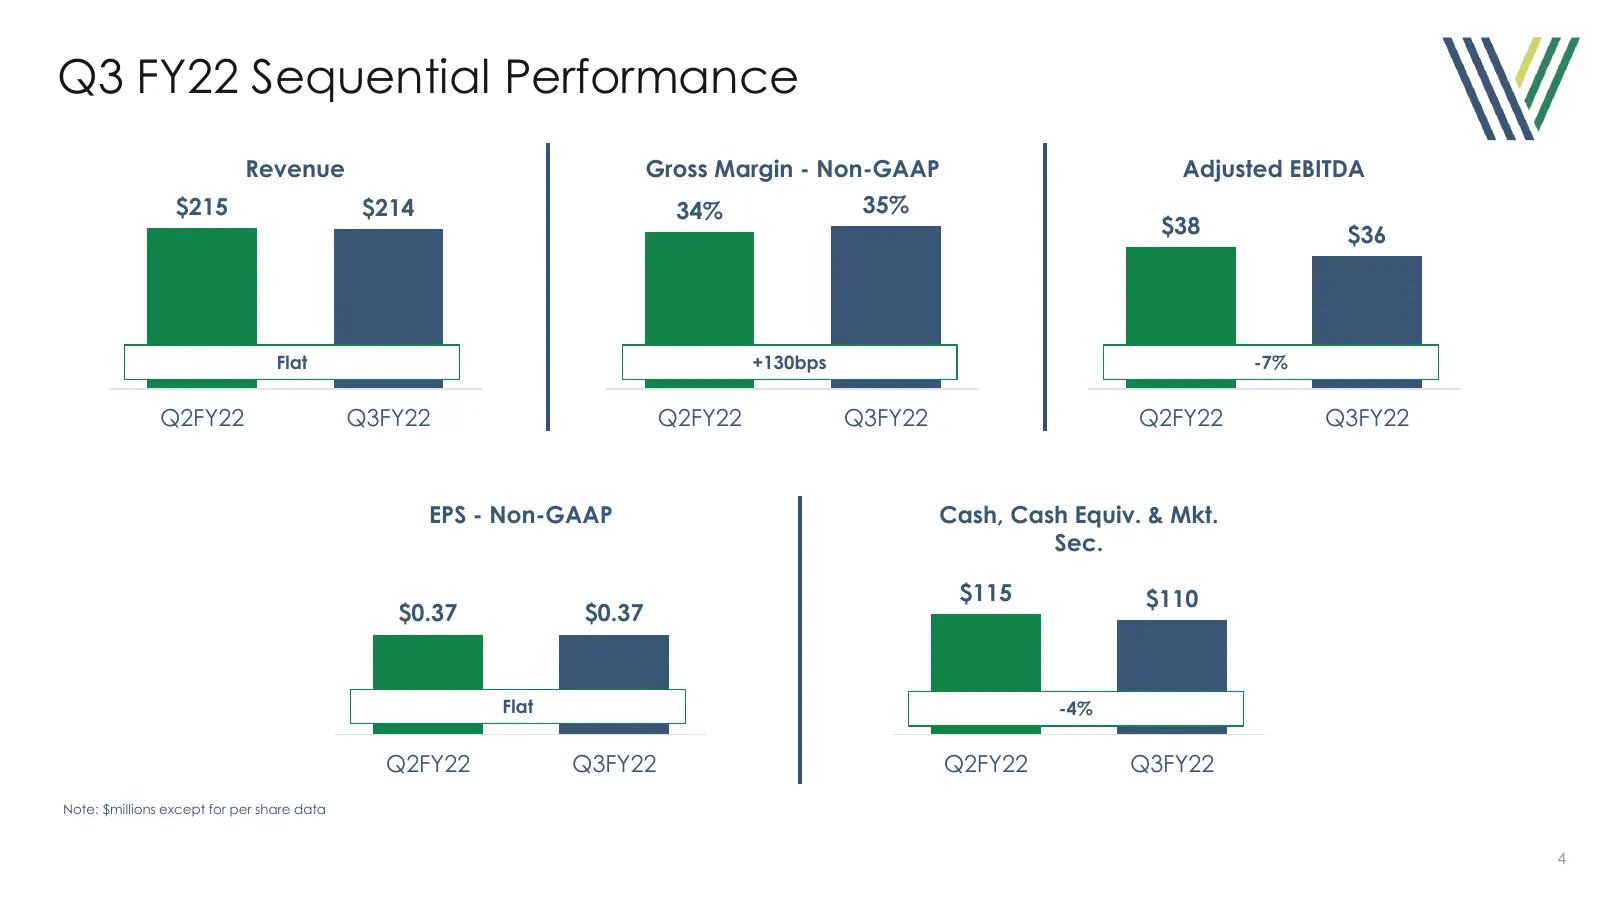
Q3 FY22 Sequential Performance Revenue Gross Margin - Non-GAAP Adjusted EBITDA $215 $214 34% 35% $38 $36 Flat +130bps -7% Q2FY22 Q3FY22 Q2FY22 Q3FY22 Q2FY22 Q3FY22 EPS - Non-GAAP Cash, Cash Equiv. & Mkt. Sec. $115 $110 $0.37 $0.37 Flat -4% Q2FY22 Q3FY22 Q2FY22 Q3FY22 Note: $millions except for per s
Slide 5: Current Demand Environment
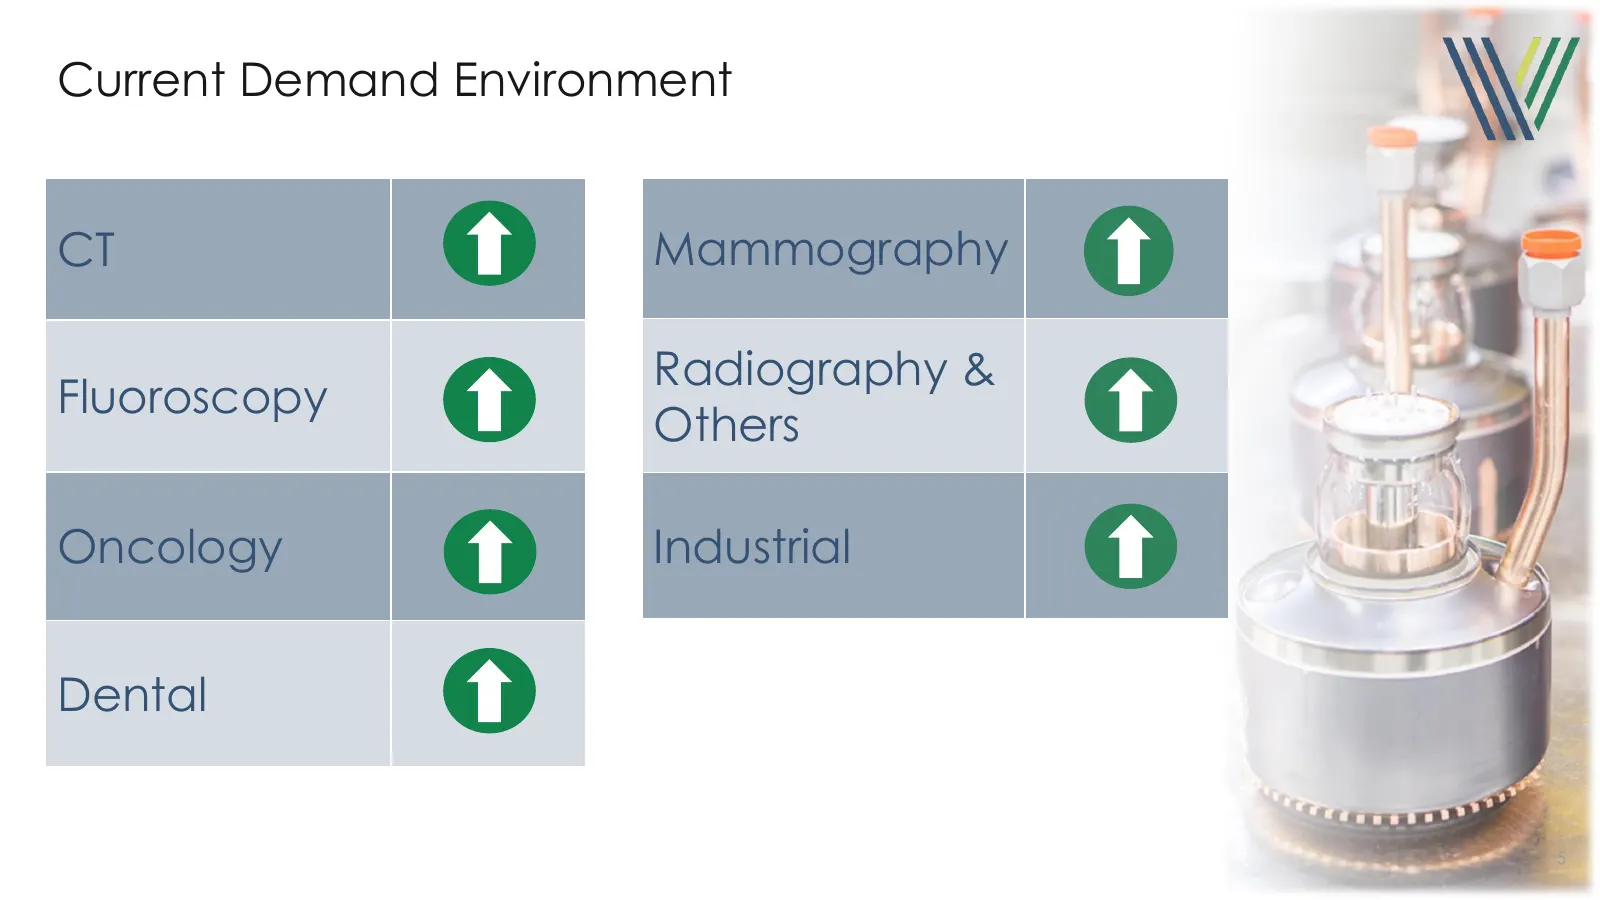
Current Demand Environment CT Mammography Radiography & Fluoroscopy Others Oncology Industrial Dental 5
Slide 6: Industrial Segment Overview
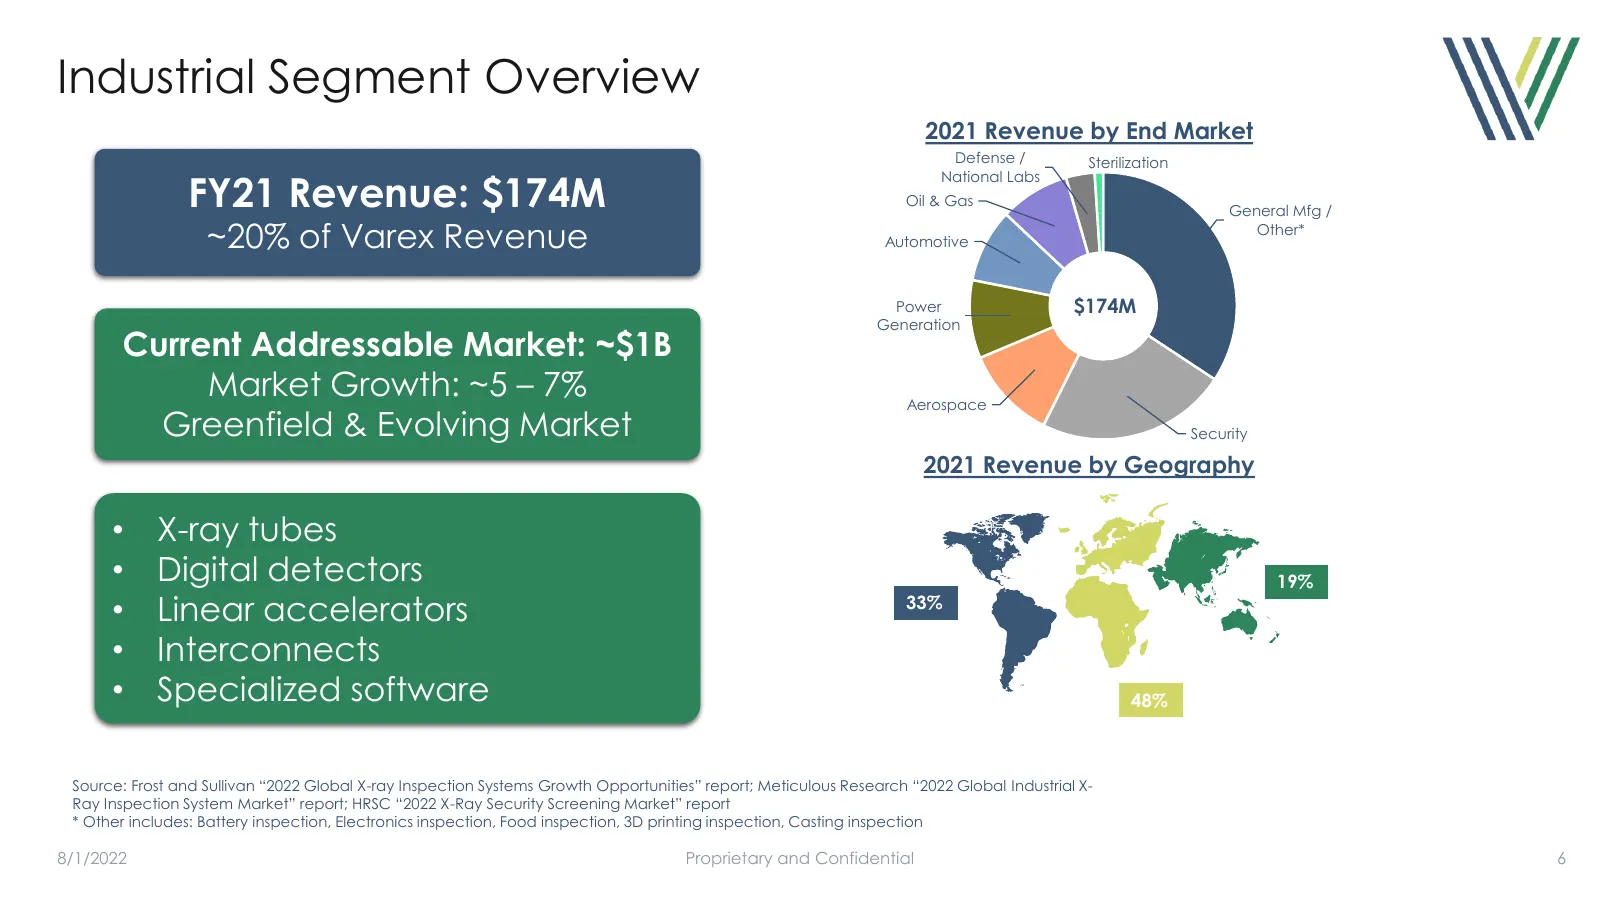
Industrial Segment Overview 2021 Revenue by End Market Defense / Sterilization National Labs FY21 Revenue: $174M Oil & Gas General Mfg / ~20% of Varex Revenue Automotive Other* Power $174M Generation Current Addressable Market: ~$1B Market Growth: ~5 – 7% Aerospace Greenfield & Evolving Market Secur
Slide 7: Industrial Revenues Returning to Pre-Pandemic Level
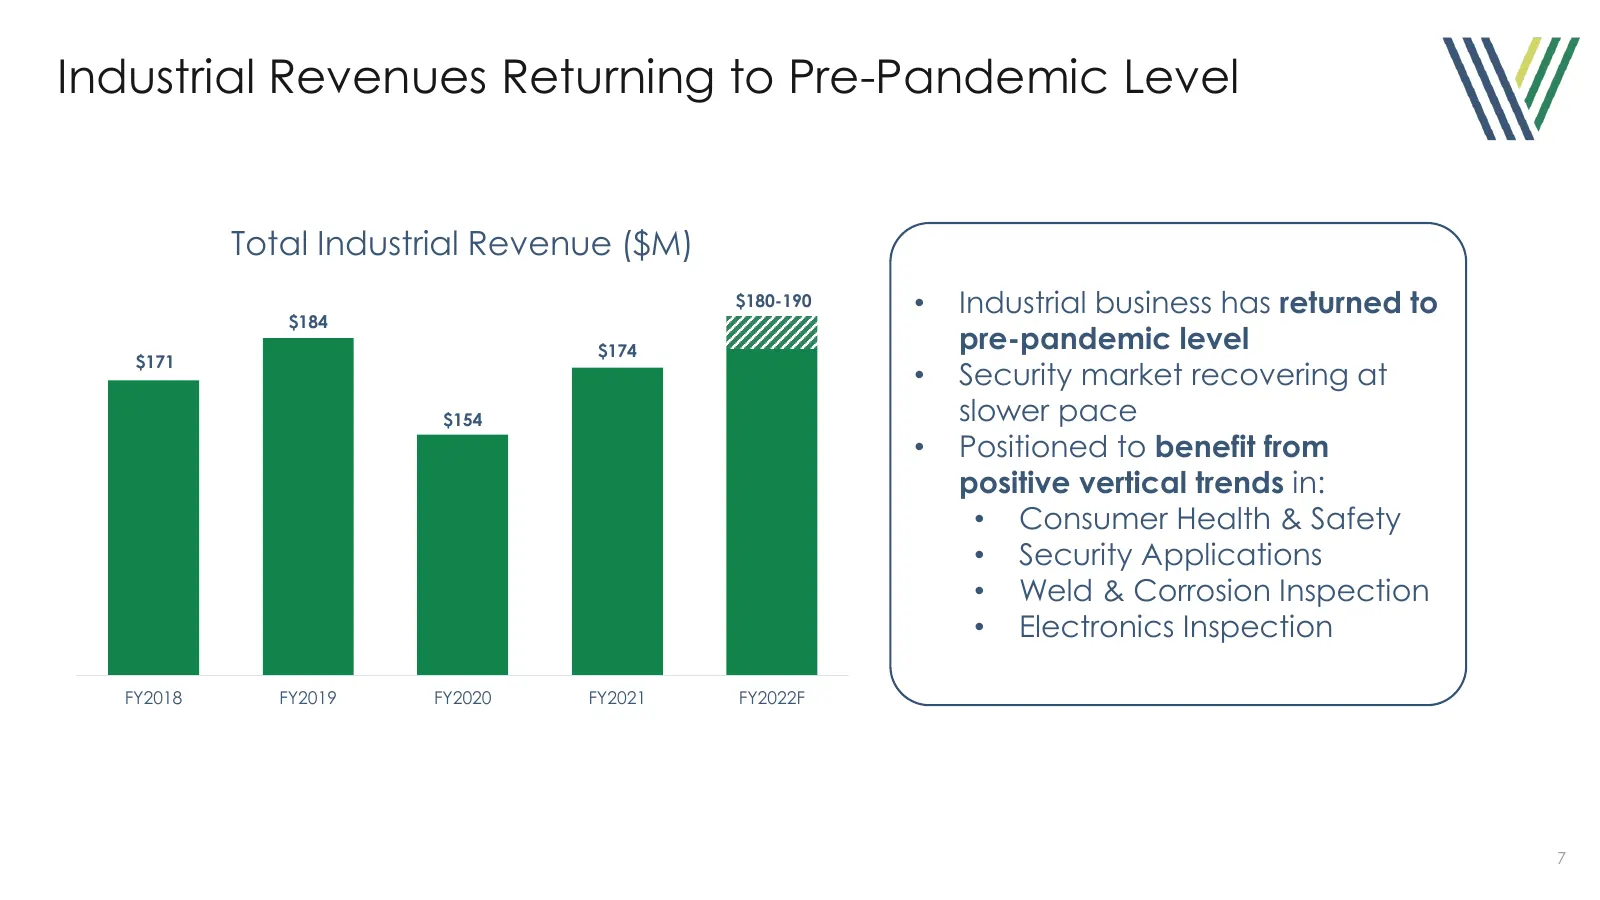
Industrial Revenues Returning to Pre-Pandemic Level Total Industrial Revenue ($M) $184 $180-190 • Industrial business has returned to $174 pre-pandemic level $171 • Security market recovering at $154 slower pace • Positioned to benefit from positive vertical trends in: • Consumer Health & Safety • S
Slide 8: Industrial Growth Drivers
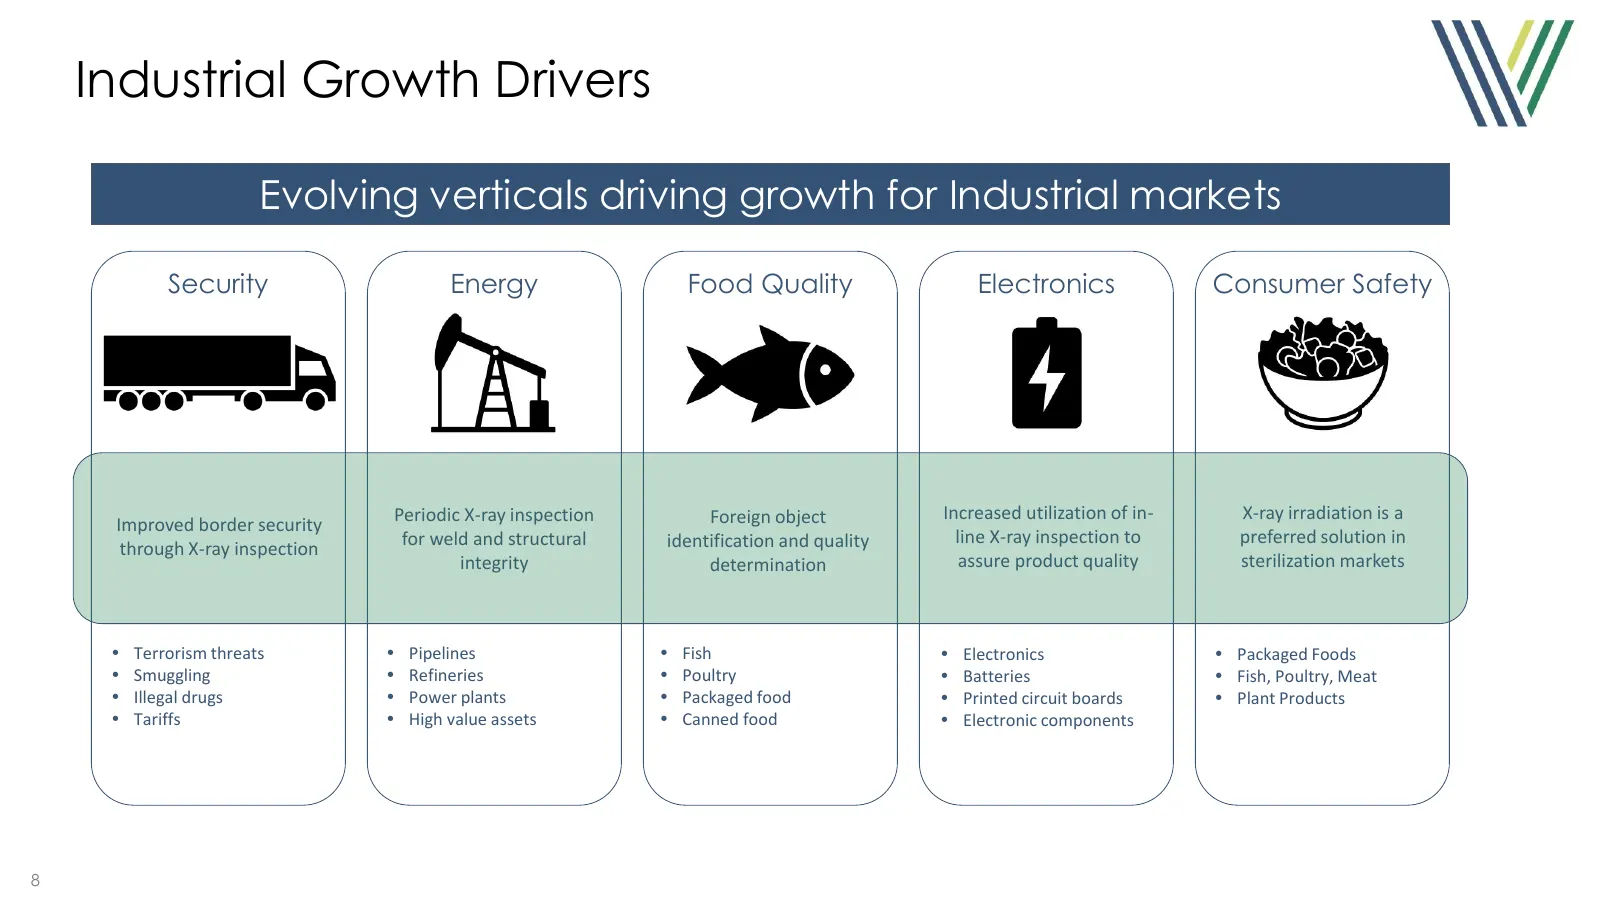
Industrial Growth Drivers Evolving verticals driving growth for Industrial markets Security Energy Food Quality Electronics Consumer Safety Periodic X-ray inspection Foreign object Increased utilization of in- X-ray irradiation is a Improved border security for weld and structural identification and
Slide 9: Significantly Expanding our Industrial TAM
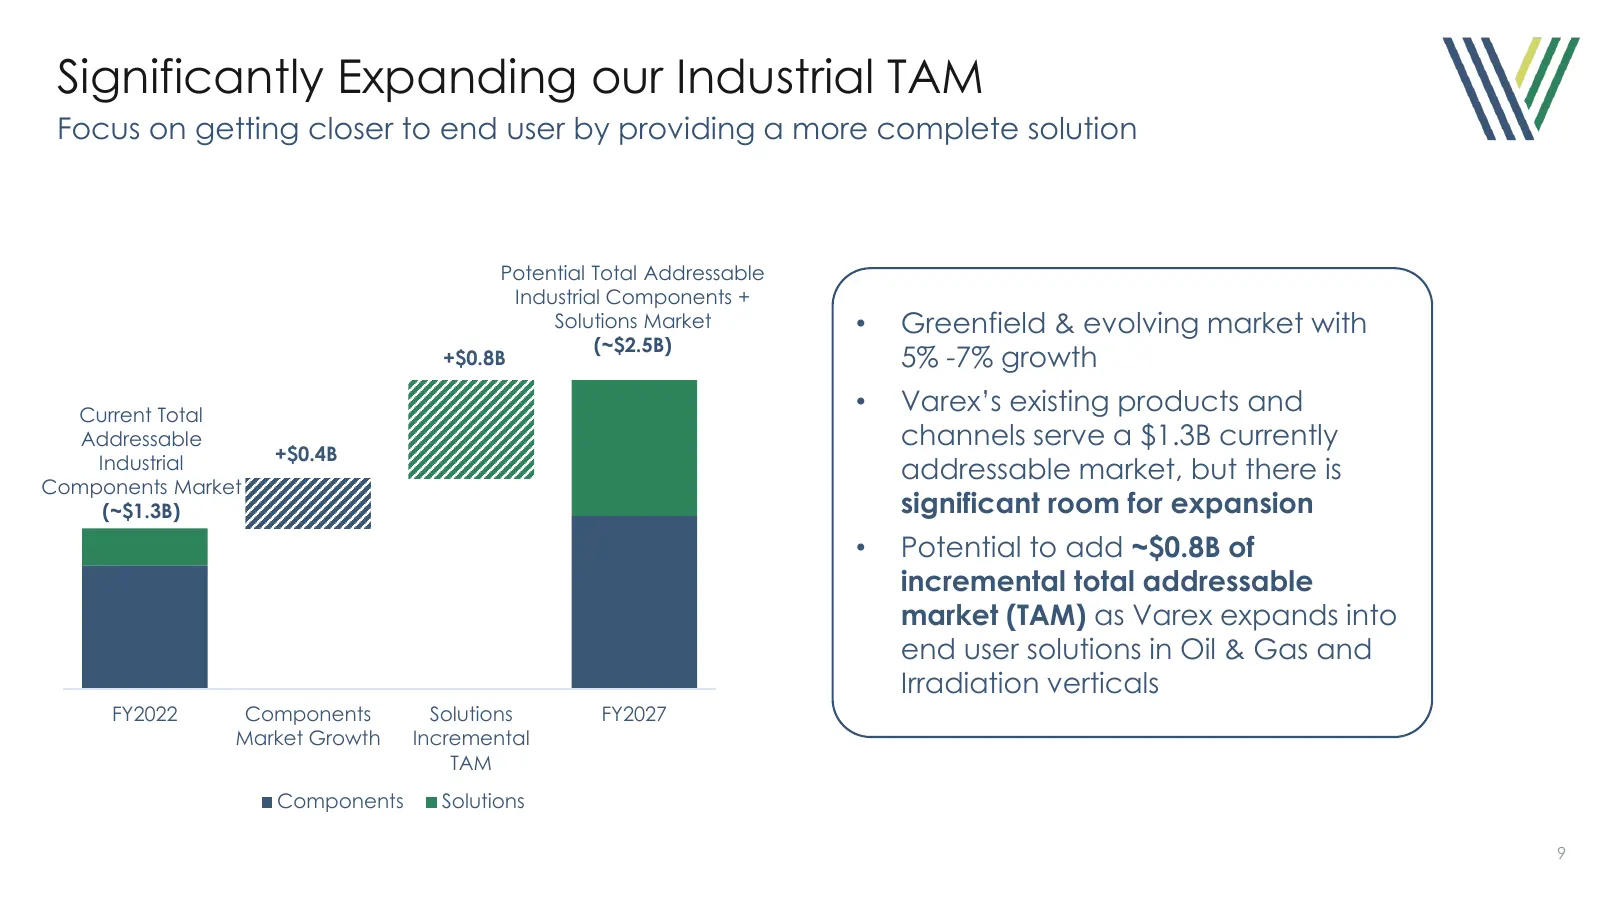
Significantly Expanding our Industrial TAM Focus on getting closer to end user by providing a more complete solution Potential Total Addressable Industrial Components + Solutions Market • Greenfield & evolving market with (~$2.5B) +$0.8B 5% -7% growth Current Total • Varex’s existing products and Ad
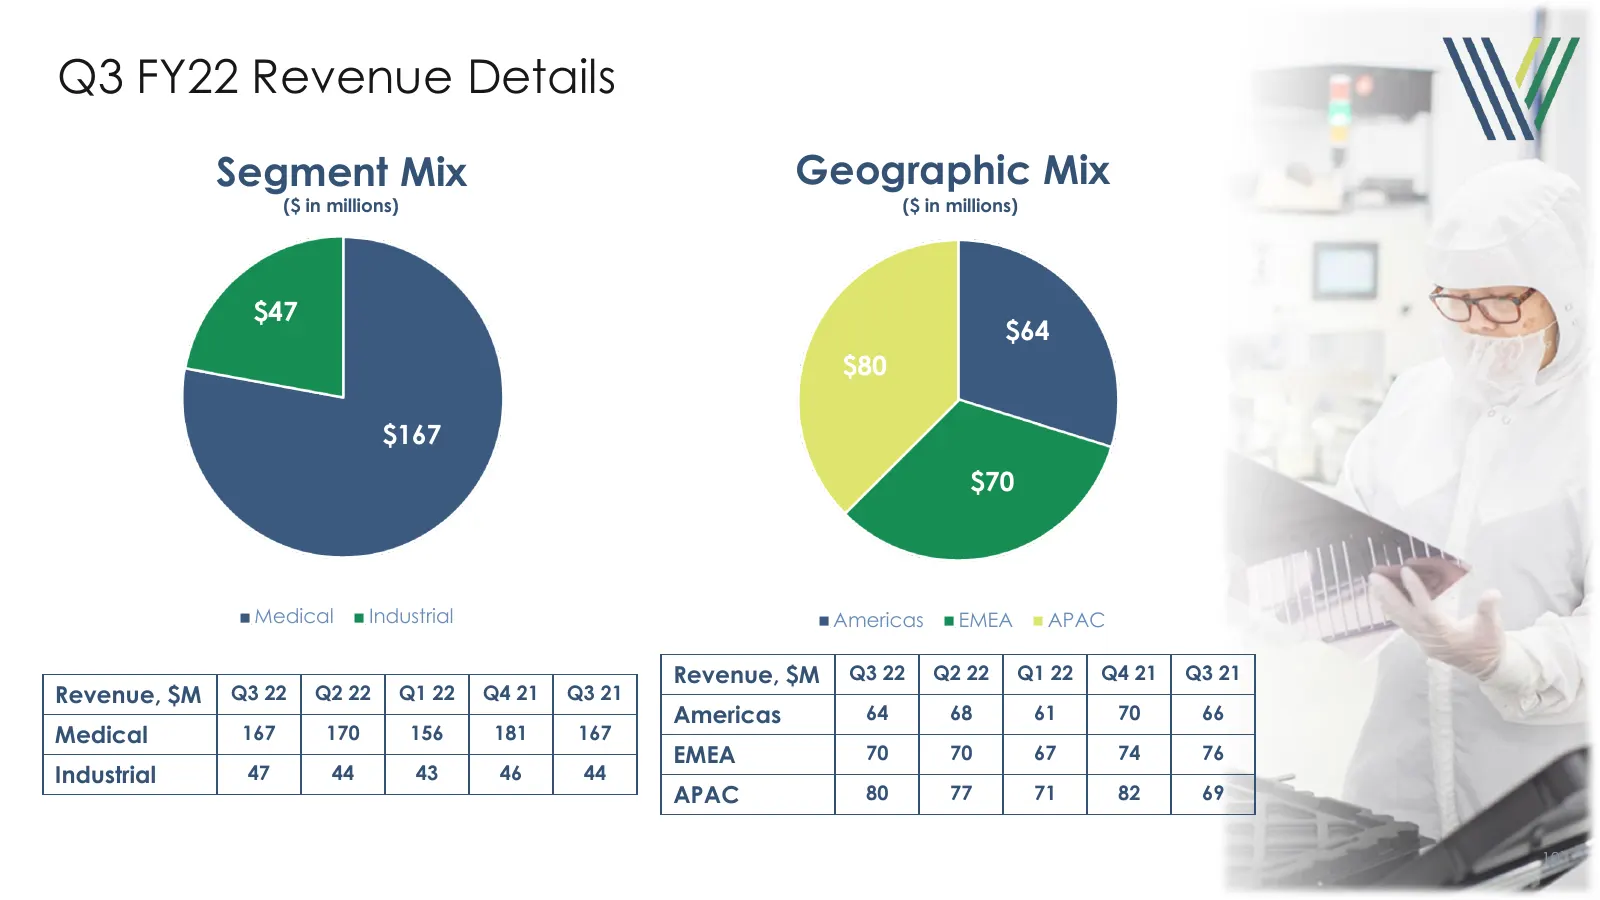
Slide 10: Q3 FY22 Revenue Details
Q3 FY22 Revenue Details Segment Mix Geographic Mix ($ in millions) ($ in millions) $47 $64 $80 $167 $70 Medical Industrial Americas EMEA APAC Revenue, $M Q3 22 Q2 22 Q1 22 Q4 21 Q3 21 Revenue, $M Q3 22 Q2 22 Q1 22 Q4 21 Q3 21 Americas 64 68 61 70 66 Medical 167 170 156 181 167 EMEA 70 70 67 74 76 In
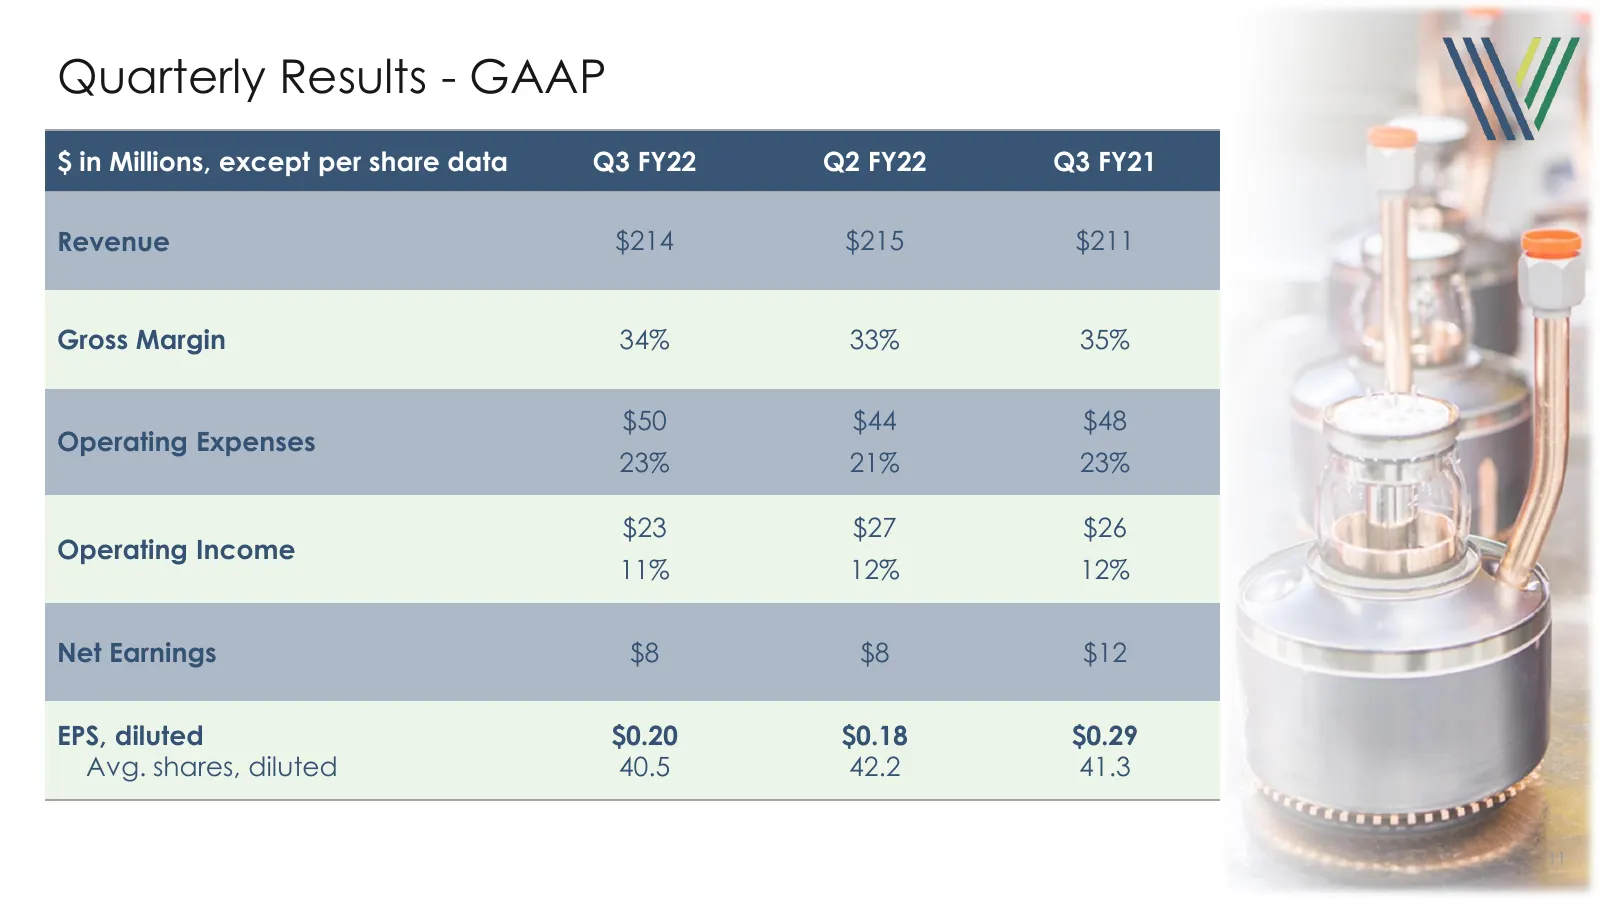
Slide 11: Quarterly Results - GAAP
Quarterly Results - GAAP $ in Millions, except per share data Q3 FY22 Q2 FY22 Q3 FY21 Revenue $214 $215 $211 Gross Margin 34% 33% 35% $50 $44 $48 Operating Expenses 23% 21% 23% $23 $27 $26 Operating Income 11% 12% 12% Net Earnings $8 $8 $12 EPS, diluted $0.20 $0.18 $0.29 Avg. shares, diluted 40.5 42
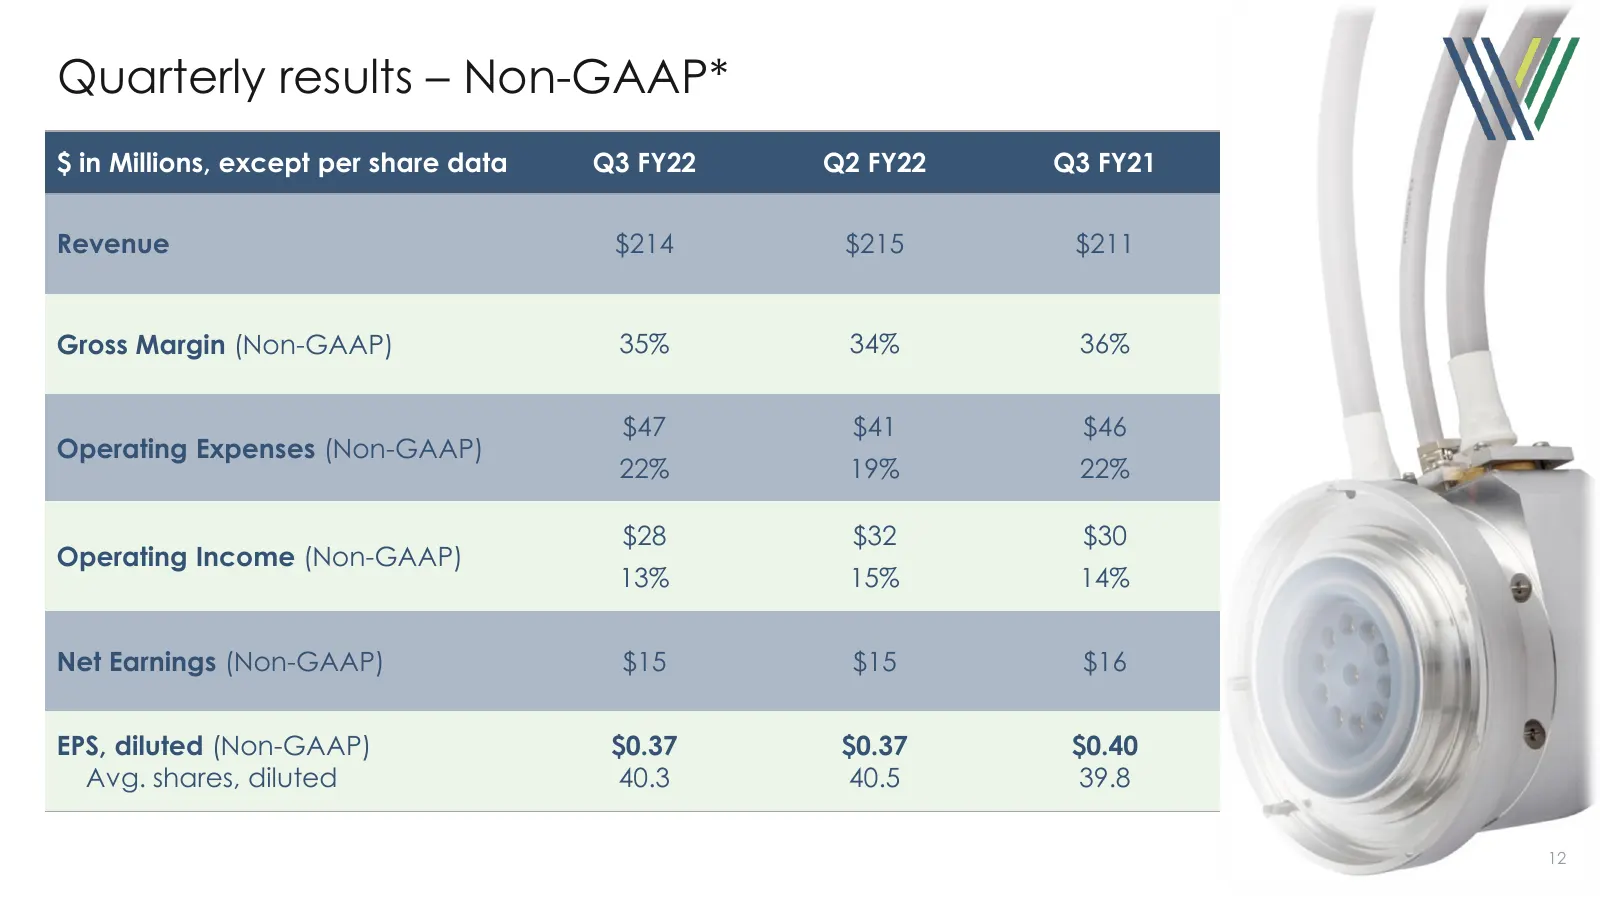
Slide 12: Quarterly results – Non-GAAP
Quarterly results – Non-GAAP* $ in Millions, except per share data Q3 FY22 Q2 FY22 Q3 FY21 Revenue $214 $215 $211 Gross Margin (Non-GAAP) 35% 34% 36% $47 $41 $46 Operating Expenses (Non-GAAP) 22% 19% 22% $28 $32 $30 Operating Income (Non-GAAP) 13% 15% 14% Net Earnings (Non-GAAP) $15 $15 $16 EPS, dil
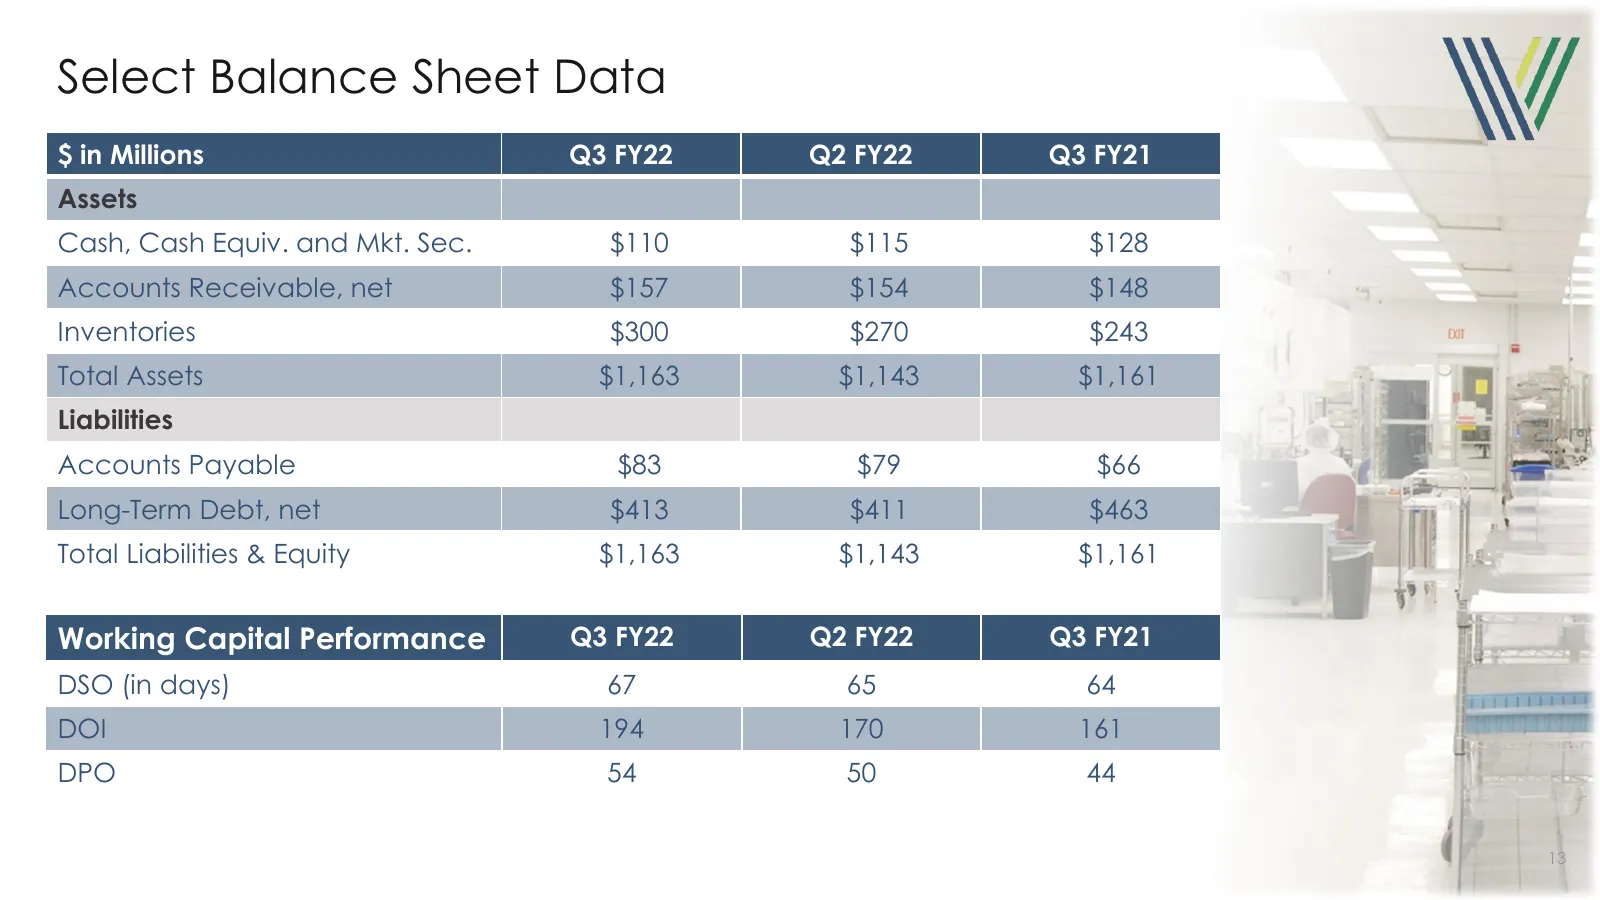
Slide 13: Select Balance Sheet Data
Select Balance Sheet Data $ in Millions Q3 FY22 Q2 FY22 Q3 FY21 Assets Cash, Cash Equiv. and Mkt. Sec. $110 $115 $128 Accounts Receivable, net $157 $154 $148 Inventories $300 $270 $243 Total Assets $1,163 $1,143 $1,161 Liabilities Accounts Payable $83 $79 $66 Long-Term Debt, net $413 $411 $463 Total
Slide 14: Select Debt and Cash Flow Data
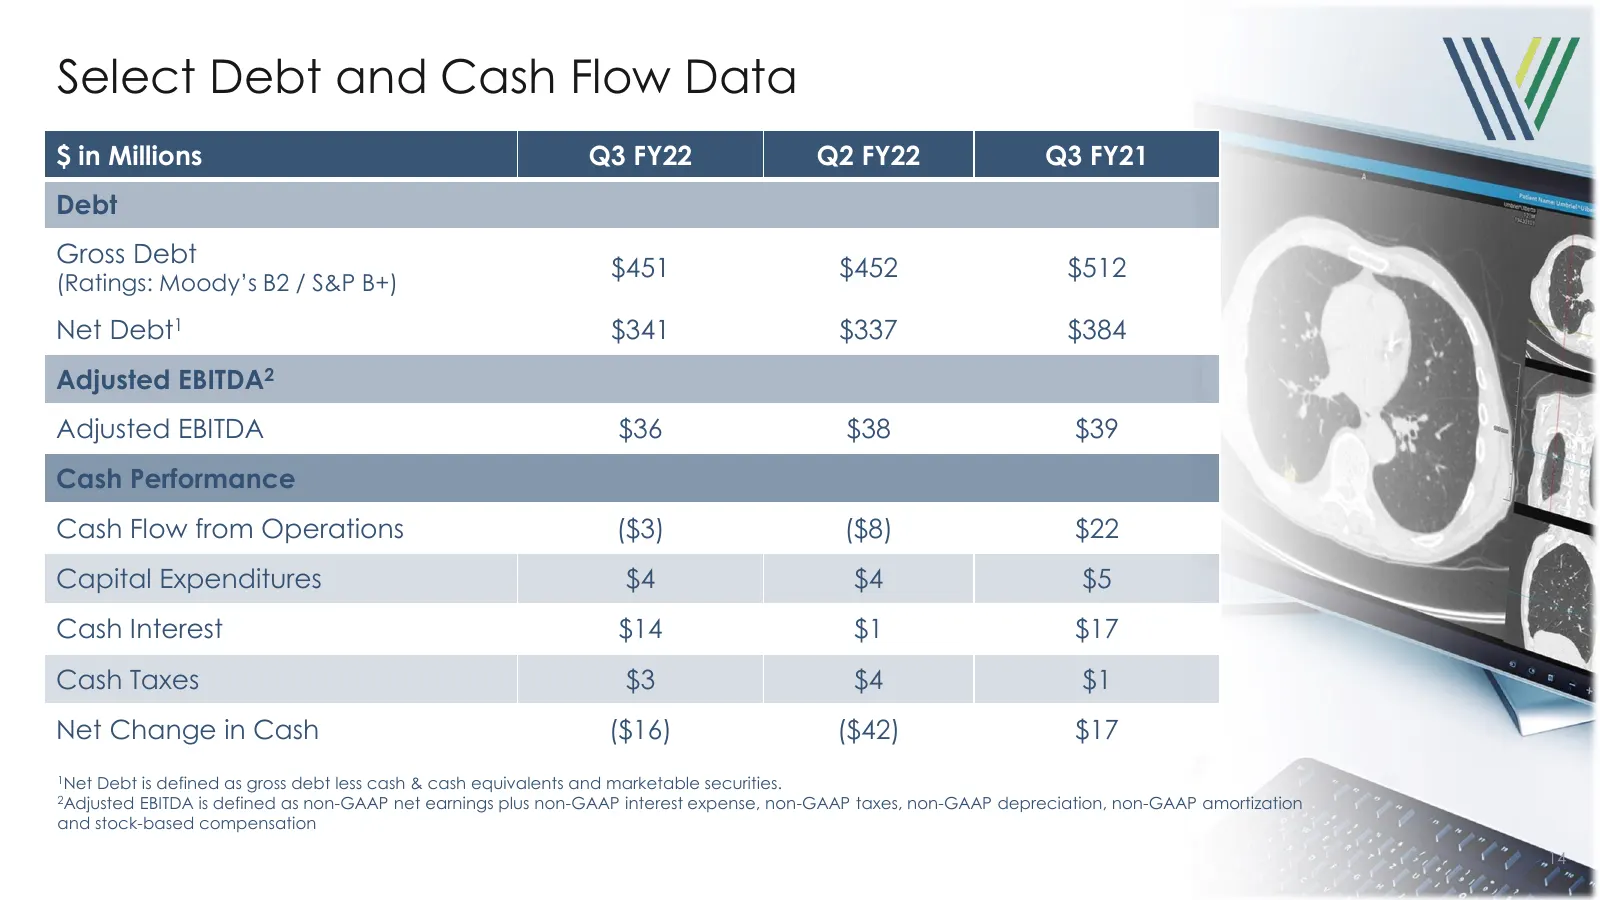
Select Debt and Cash Flow Data $ in Millions Q3 FY22 Q2 FY22 Q3 FY21 Debt Gross Debt $451 $452 $512 (Ratings: Moody’s B2 / S&P B+) Net Debt1 $341 $337 $384 Adjusted EBITDA2 Adjusted EBITDA $36 $38 $39 Cash Performance Cash Flow from Operations ($3) ($8) $22 Capital Expenditures $4 $4 $5 Cash Interes
Slide 15: Outlook Q4 FY22
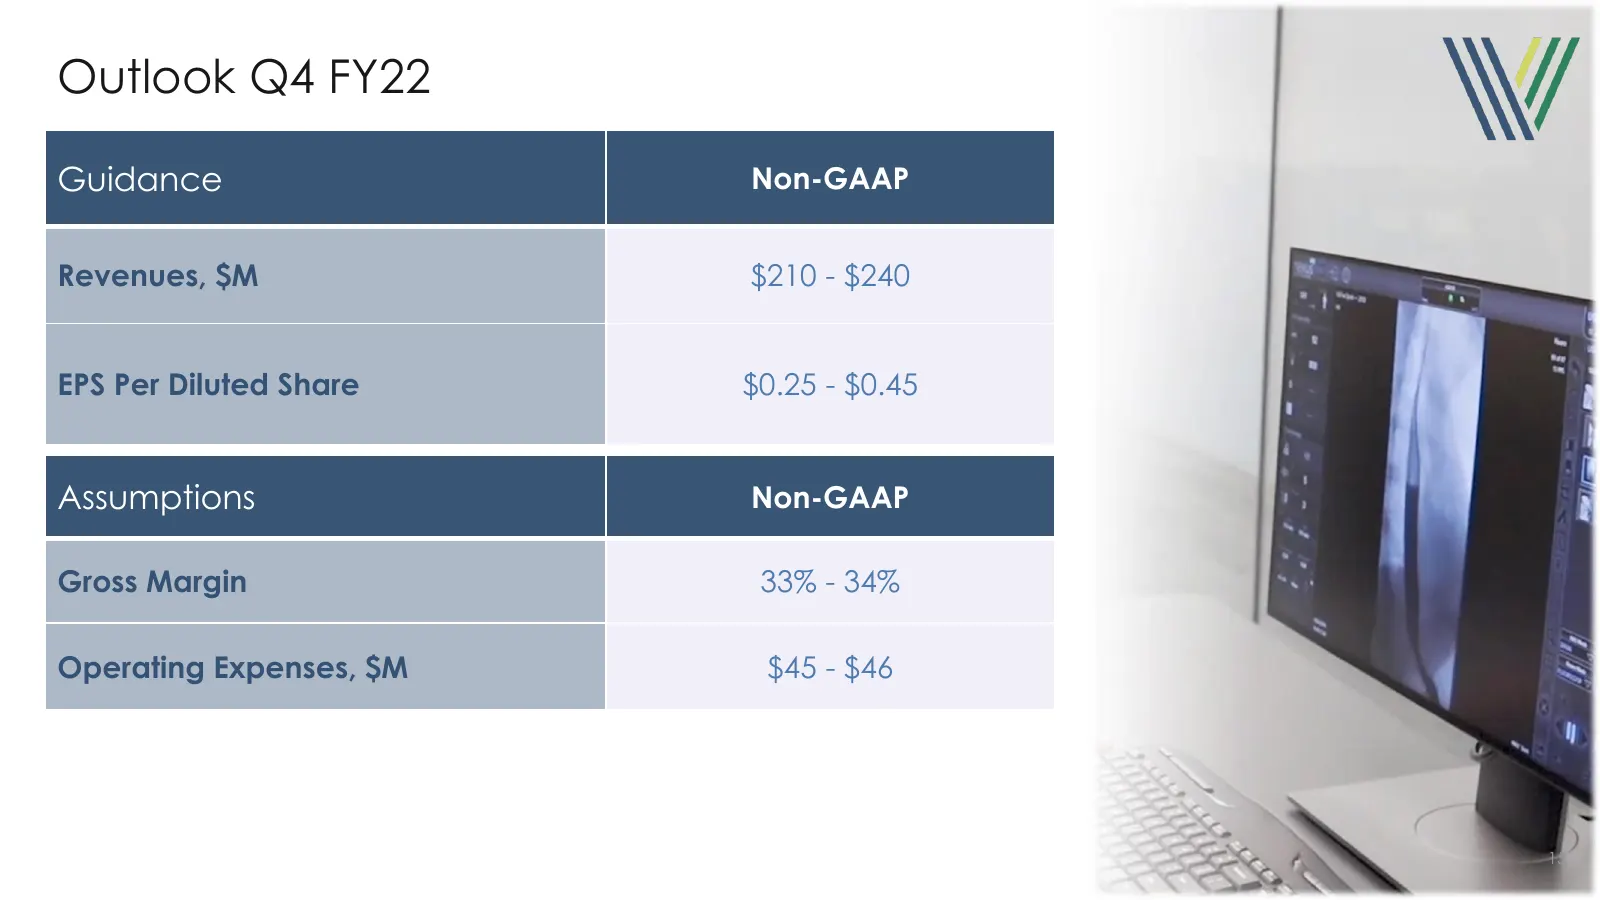
Outlook Q4 FY22 Guidance Non-GAAP Revenues, $M $210 - $240 EPS Per Diluted Share $0.25 - $0.45 Assumptions Non-GAAP Gross Margin 33% - 34% Operating Expenses, $M $45 - $46 15

Slide 16: Q&A
W VAREX MA G Solutions in Sight® VREX Nasdaq isted Pf Nasdaq Q&A

Slide 17: Non-GAAP Reconciliation
Solutions in Sight® Non – GAAP Reconciliation 17
Slide 18: Reconciliation between GAAP and Non-GAAP Financial measures (unaudited)
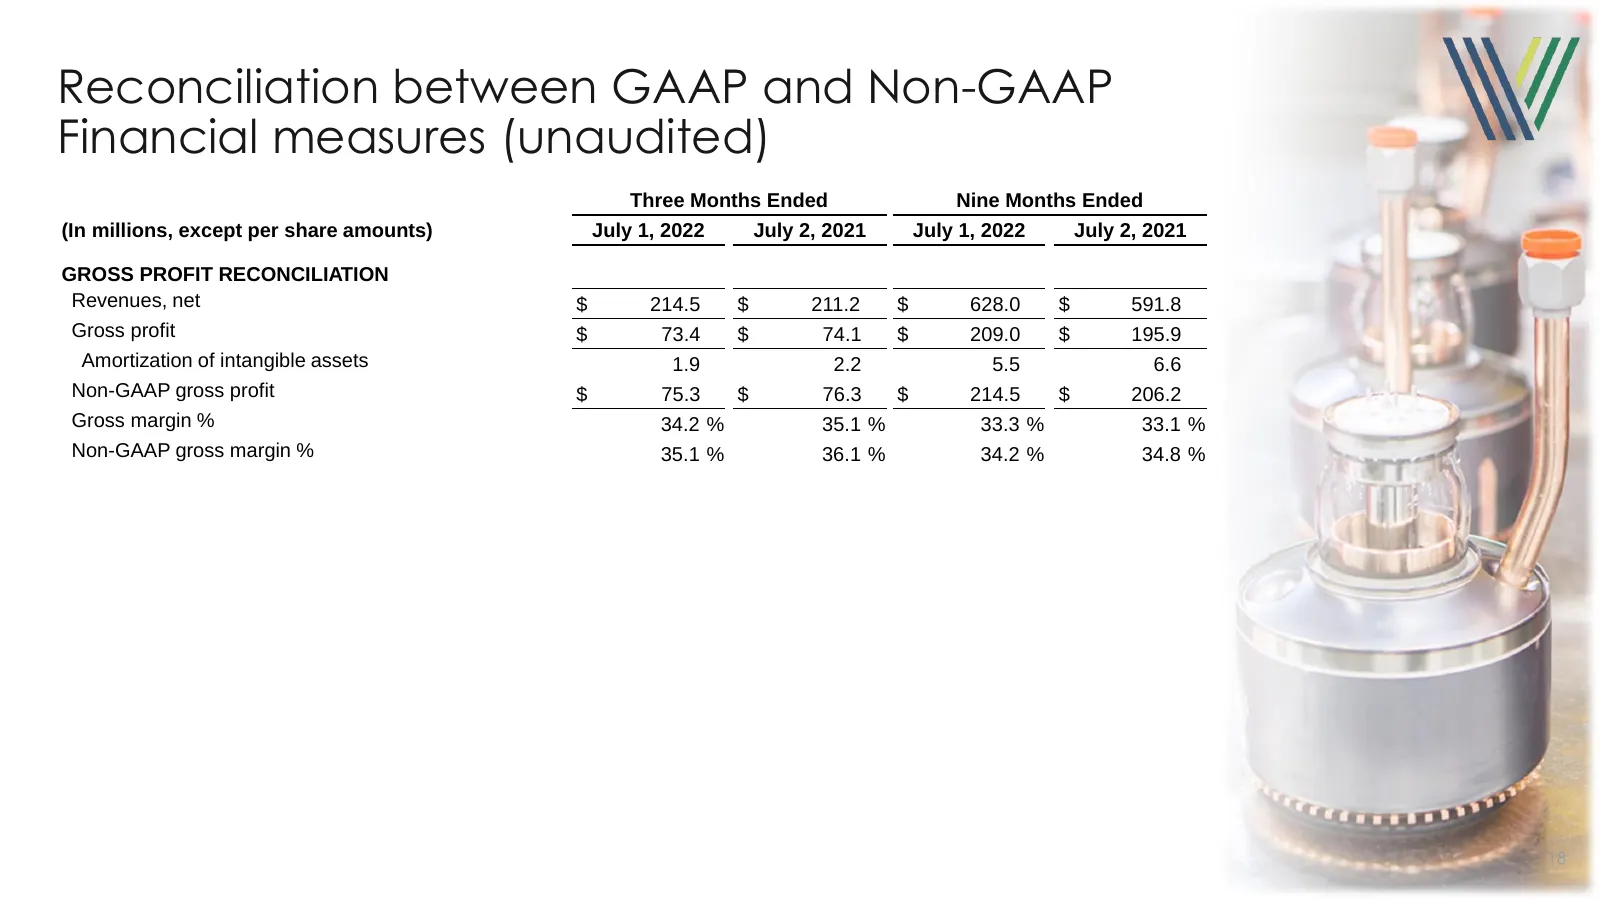
Reconciliation between GAAP and Non-GAAP Financial measures (unaudited) Three Months Ended Nine Months Ended (In millions, except per share amounts) July 1, 2022 July 2, 2021 July 1, 2022 July 2, 2021 GROSS PROFIT RECONCILIATION Revenues, net $ 214.5 $ 211.2 $ 628.0 $ 591.8 Gross profit $ 73.4 $ 74.
Slide 19: Reconciliation between GAAP and Non-GAAP Financial measures (unaudited)
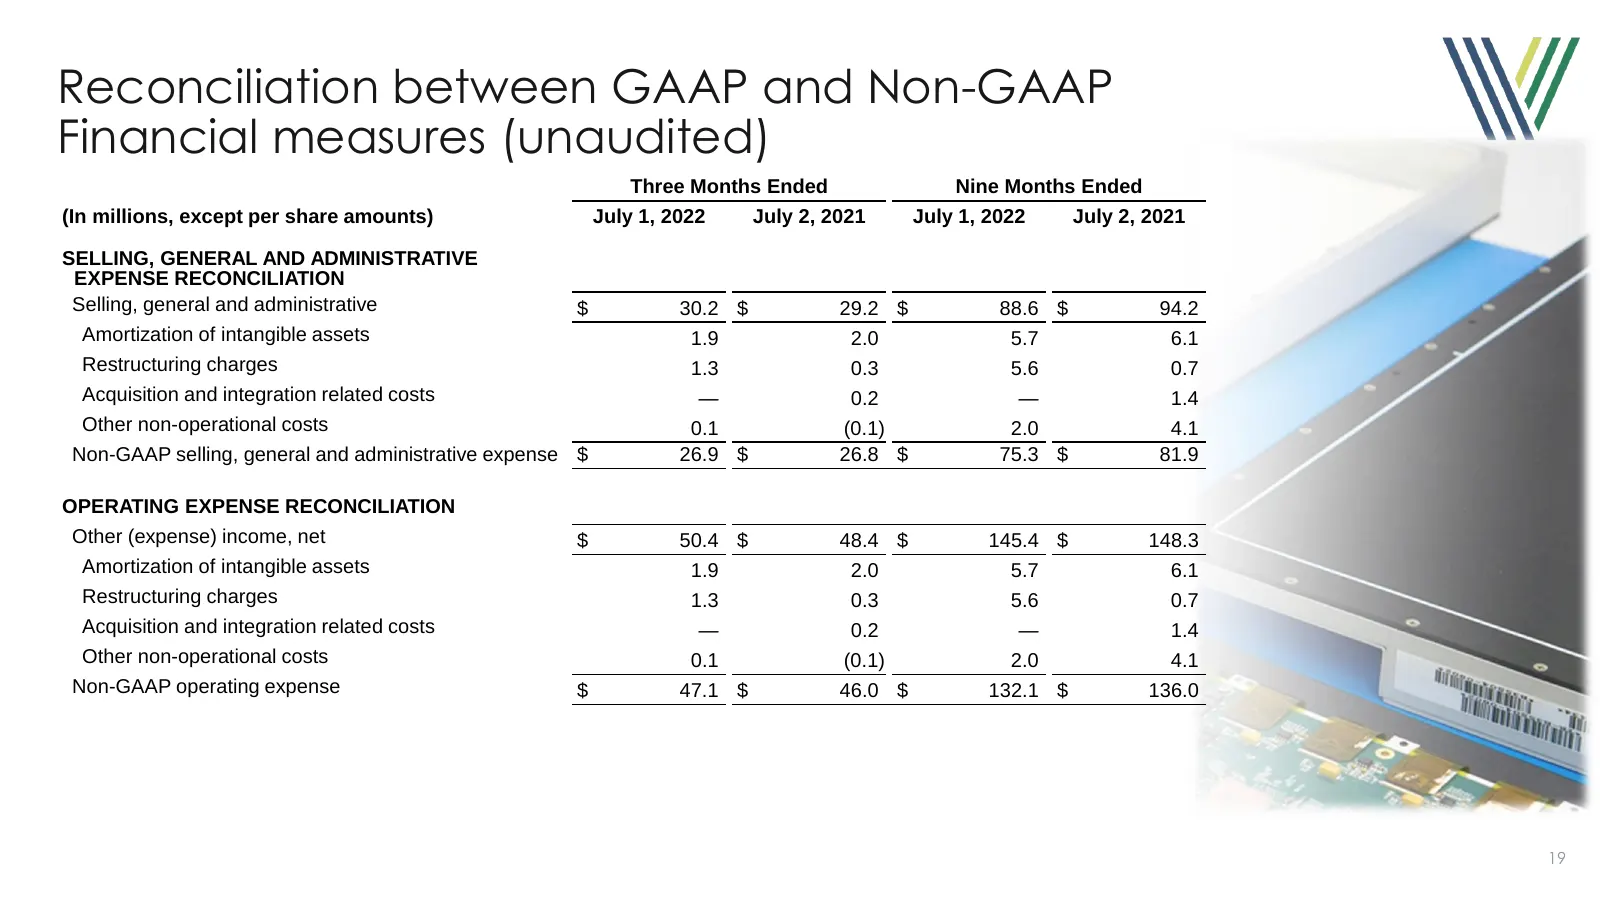
Reconciliation between GAAP and Non-GAAP Financial measures (unaudited) Three Months Ended Nine Months Ended (In millions, except per share amounts) July 1, 2022 July 2, 2021 July 1, 2022 July 2, 2021 SELLING, GENERAL AND ADMINISTRATIVE EXPENSE RECONCILIATION Selling, general and administrative $ 30
Slide 20: Reconciliation between GAAP and Non-GAAP Financial measures (unaudited)
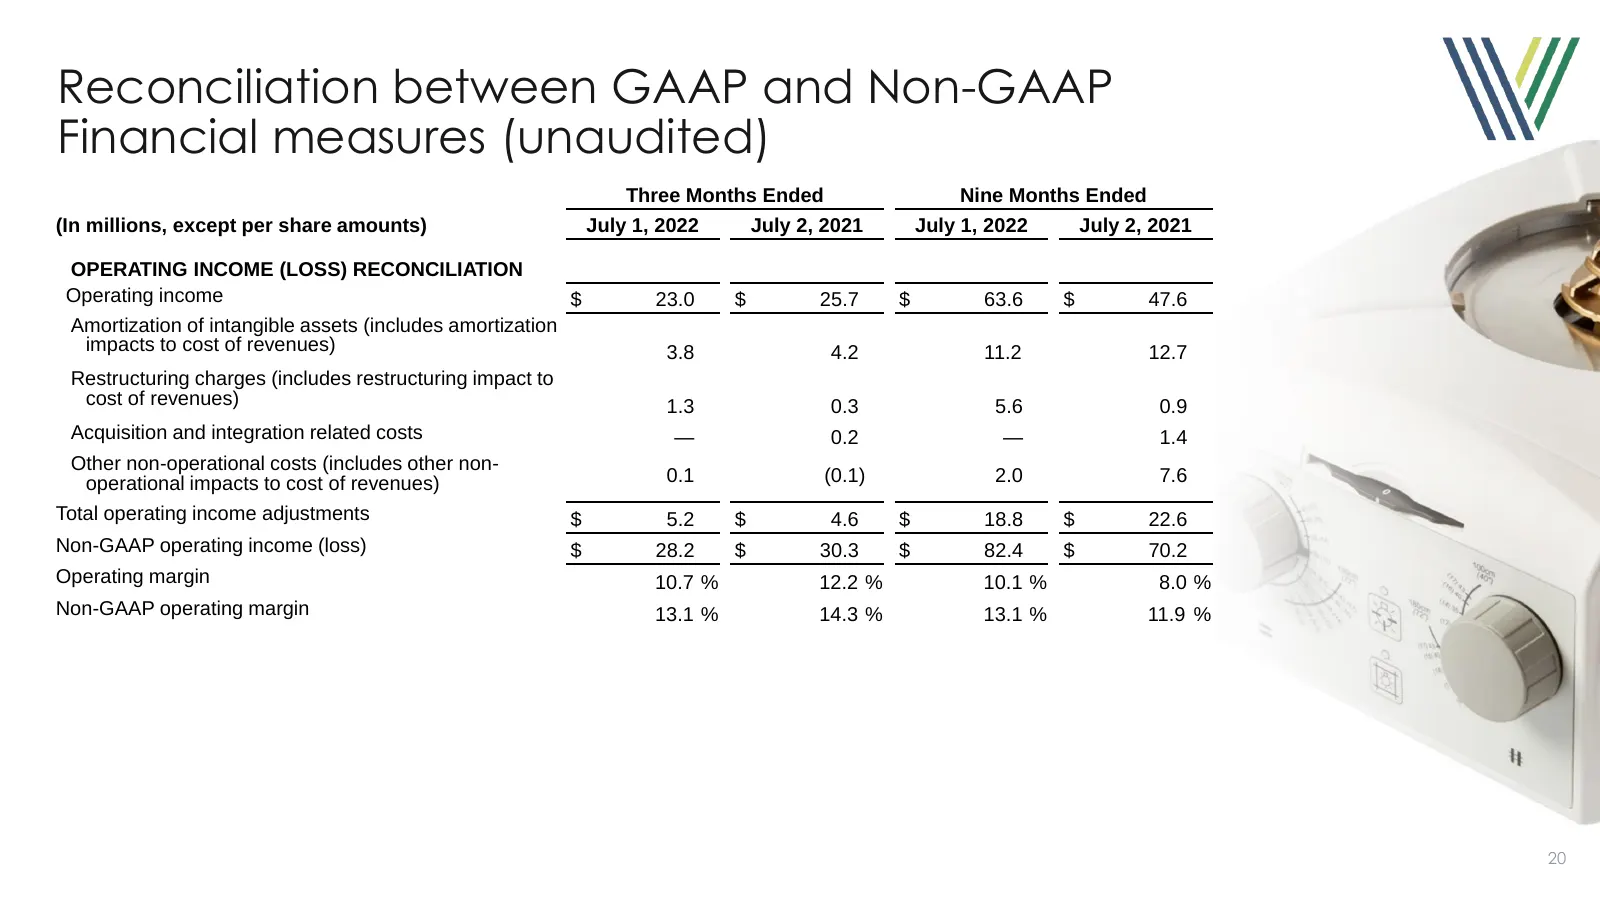
Reconciliation between GAAP and Non-GAAP Financial measures (unaudited) Three Months Ended Nine Months Ended (In millions, except per share amounts) July 1, 2022 July 2, 2021 July 1, 2022 July 2, 2021 OPERATING INCOME (LOSS) RECONCILIATION Operating income $ 23.0 $ 25.7 $ 63.6 $ 47.6 Amortization of
Slide 21: Reconciliation between GAAP and Non-GAAP Financial measures (unaudited)
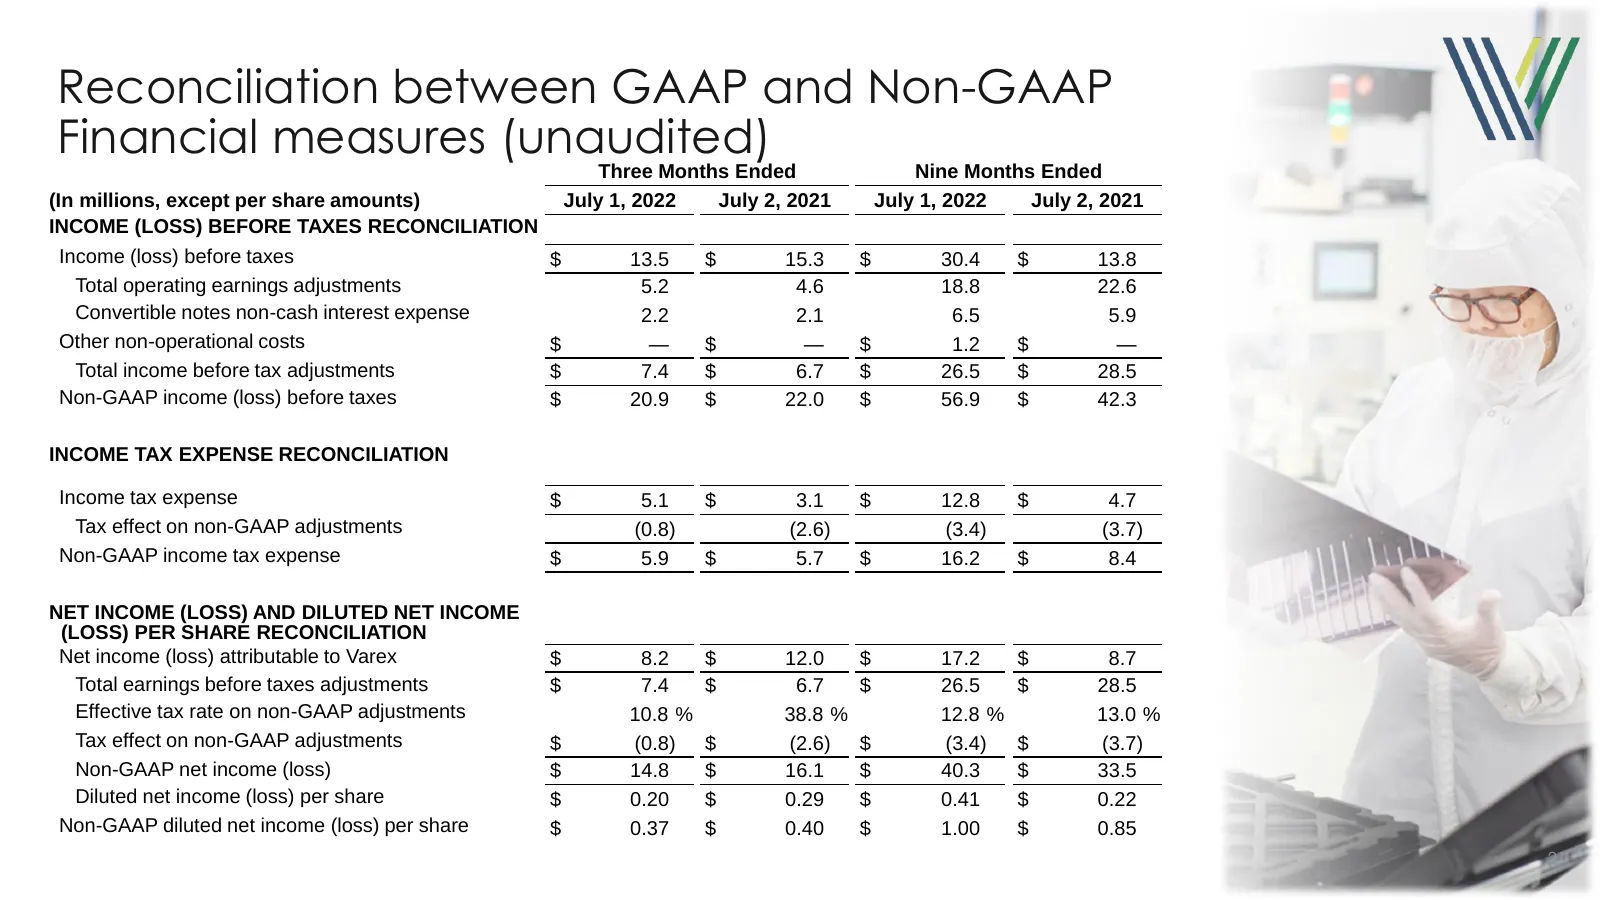
Reconciliation between GAAP and Non-GAAP Financial measures (unaudited) Three Months Ended Nine Months Ended (In millions, except per share amounts) July 1, 2022 July 2, 2021 July 1, 2022 July 2, 2021 INCOME (LOSS) BEFORE TAXES RECONCILIATION Income (loss) before taxes $ 13.5 $ 15.3 $ 30.4 $ 13.8 To
Slide 22: Reconciliation between GAAP and Non-GAAP Financial measures (unaudited)
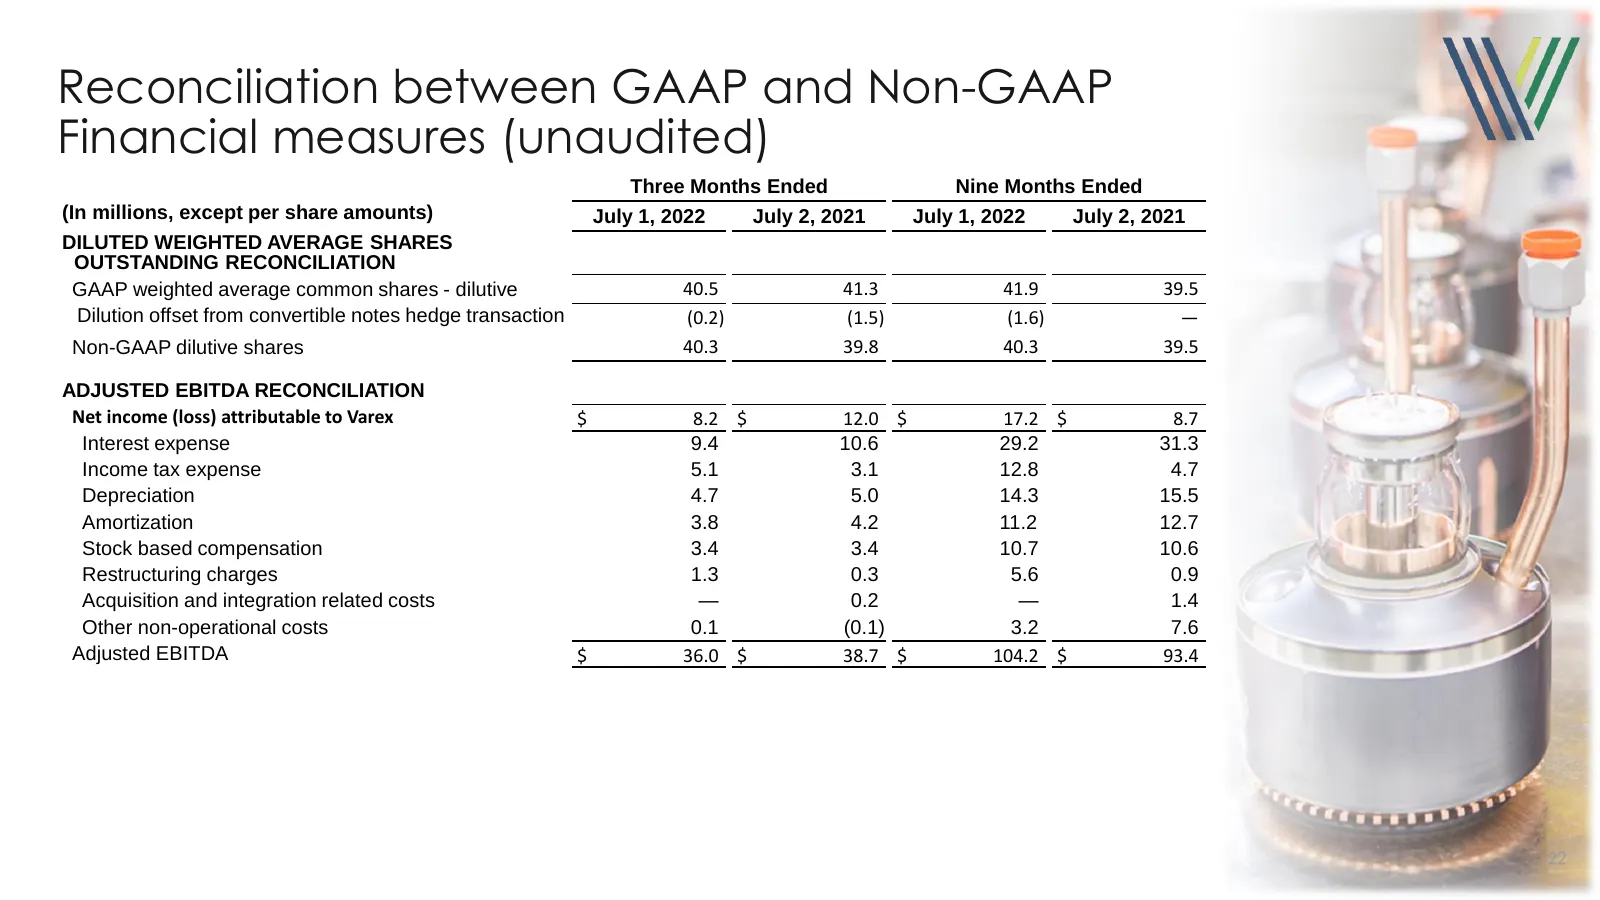
Reconciliation between GAAP and Non-GAAP Financial measures (unaudited) Three Months Ended Nine Months Ended (In millions, except per share amounts) July 1, 2022 July 2, 2021 July 1, 2022 July 2, 2021 DILUTED WEIGHTED AVERAGE SHARES OUTSTANDING RECONCILIATION GAAP weighted average common shares - di
Slide 23: Effect of Convertible Loan and Warrants on Diluted Share count
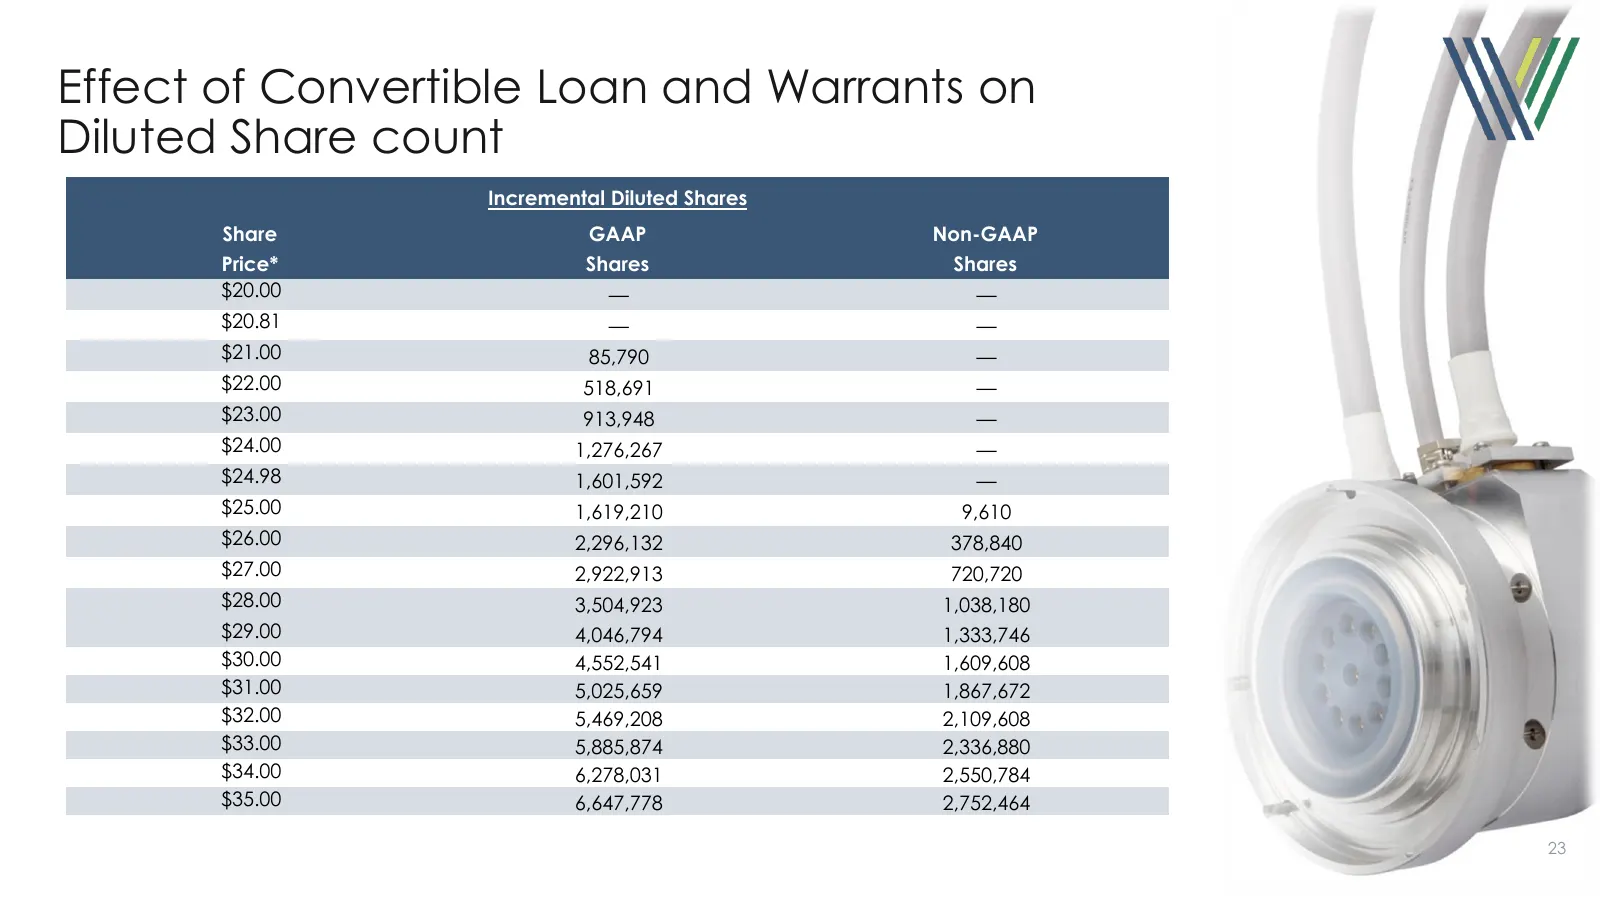
Effect of Convertible Loan and Warrants on Diluted Share count Incremental Diluted Shares Share GAAP Non-GAAP Price* Shares Shares $20.00 — — $20.81 — — $21.00 85,790 — $22.00 518,691 — $23.00 913,948 — $24.00 1,276,267 — $24.98 1,601,592 — $25.00 1,619,210 9,610 $26.00 2,296,132 378,840 $27.00 2,92
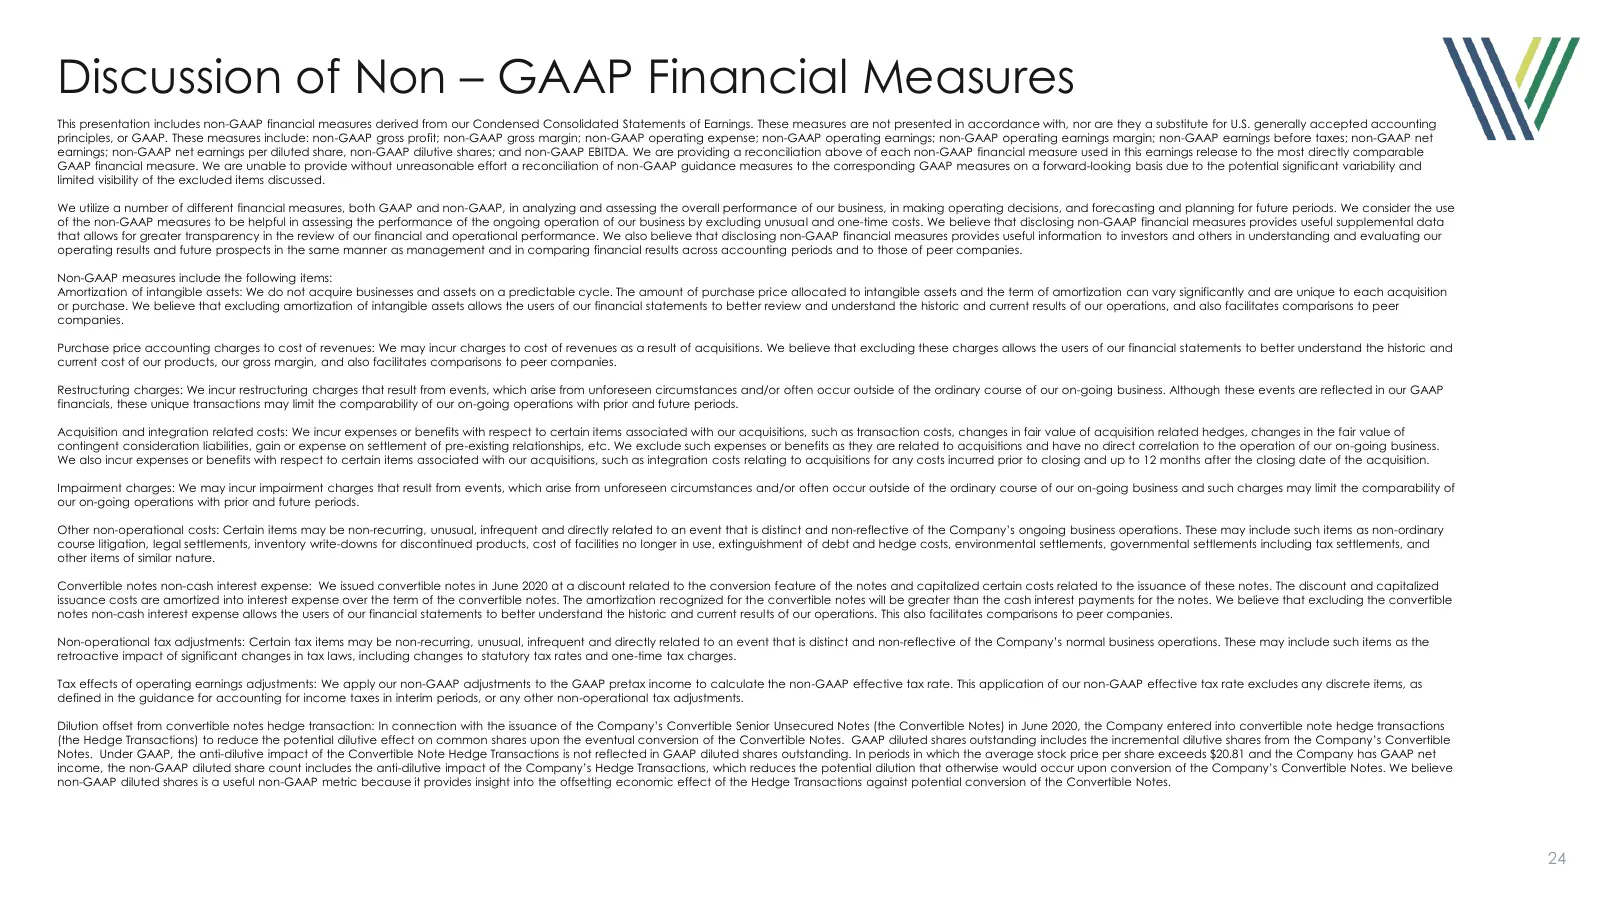
Slide 24: Discussion of Non – GAAP Financial Measures
Discussion of Non – GAAP Financial Measures This presentation includes non-GAAP financial measures derived from our Condensed Consolidated Statements of Earnings. These measures are not presented in accordance with, nor are they a substitute for U.S. generally accepted accounting principles, or GAAP

Slide 25: Solutions in Sight®
Solutions in Sight®
Source: Internet Archive copy of vareximaging.com
More decks from Varex Imaging Corporation
 Q2 2026 Earnings Presentation21 slides · May 7, 2026
 Q1 2026 Earnings Presentation22 slides · Feb 10, 2026
 Q4 2025 Earnings Presentation23 slides · Nov 18, 2025
 Q3 2025 Earnings Presentation21 slides · Aug 7, 2025
 Q2 2025 Earnings Presentation22 slides · May 8, 2025
 Investor Presentation (March 2025)23 slides · March 2025