Nedbank Group · JSE:NED
Nedbank — H1 2018 Earnings Presentation
98 slides from Nedbank's earnings presentation, 2018

Slide 1: Nedbank Group Interim Results 2018
NEDBANK GROUP LIMITED ir INTERIM RESULTS 2018 FOR THE SIX MONTHS ENDED 30 JUNE 2018
Slide 2: Overview
OVERVIEW A strong financial performance in a difficult environment, boosted by the ongoing ETI turnaround. MIKE BROWN ir NEDBANK GROUP LIMITED – Interim Results 2018 2
Slide 3: Overview of our H1 2018 performance
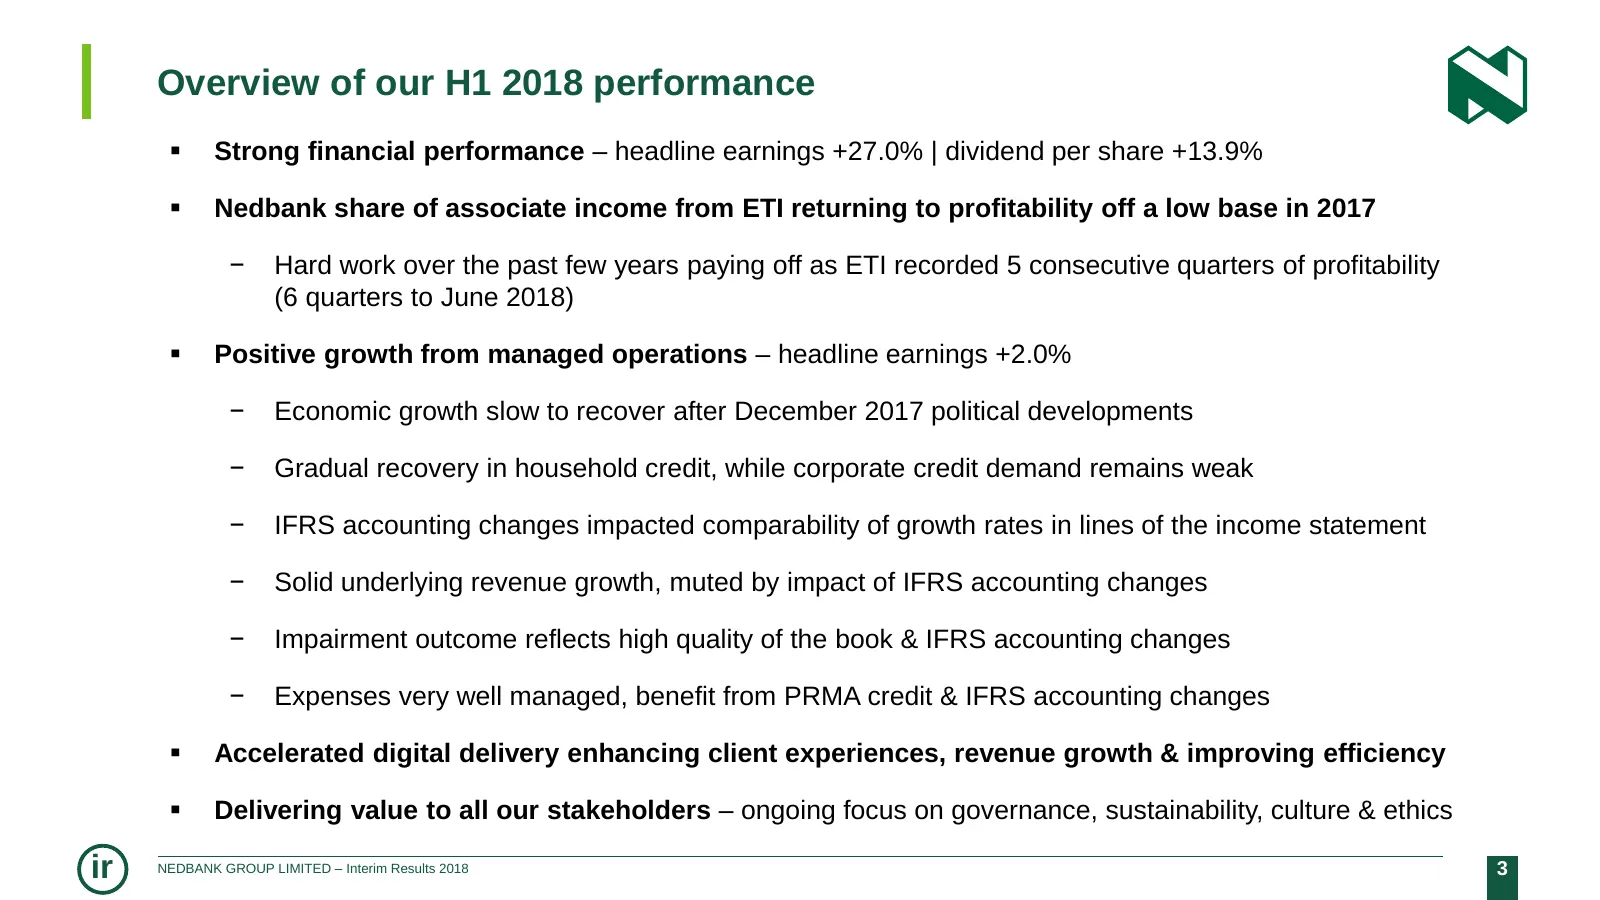
Overview of our H1 2018 performance Strong financial performance – headline earnings +27.0% | dividend per share +13.9% Nedbank share of associate income from ETI returning to profitability off a low base in 2017 − Hard work over the past few years paying off as ETI recorded 5 consecutive quarte
Slide 4: Stronger economic growth dependent on structural reforms, policy certainty, confidence
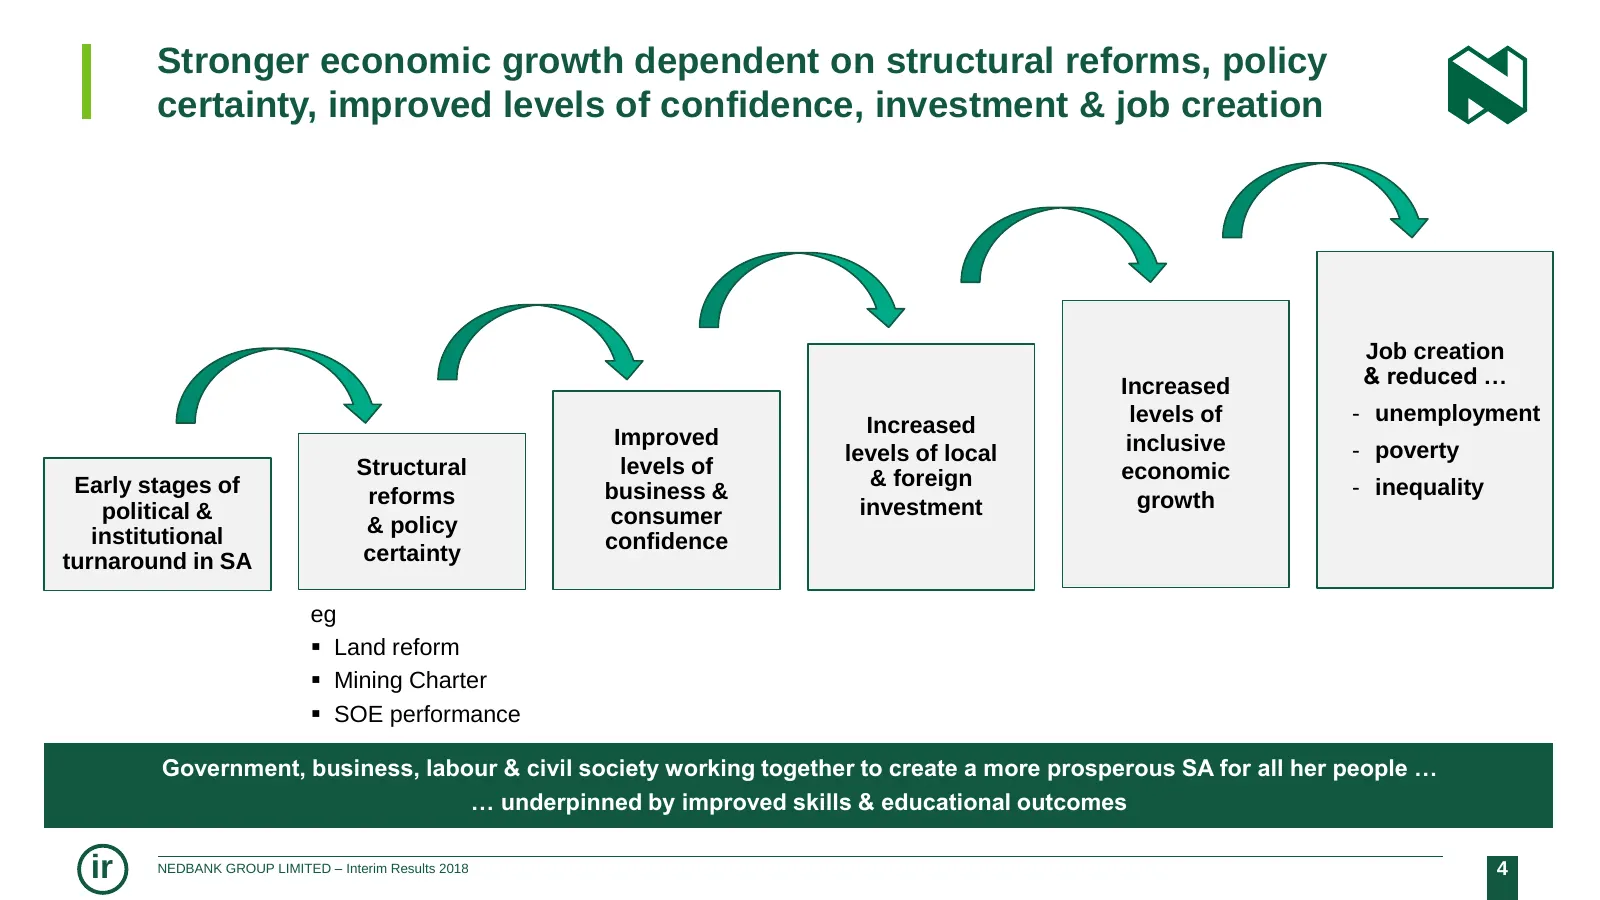
Stronger economic growth dependent on structural reforms, policy certainty, improved levels of confidence, investment & job creation Job creation Increased & reduced … levels of - unemployment Increased Improved inclusive levels of local - poverty Structural levels of economic Early stages of & fore
Slide 5: Economic growth slow to recover after December 2017 political developments
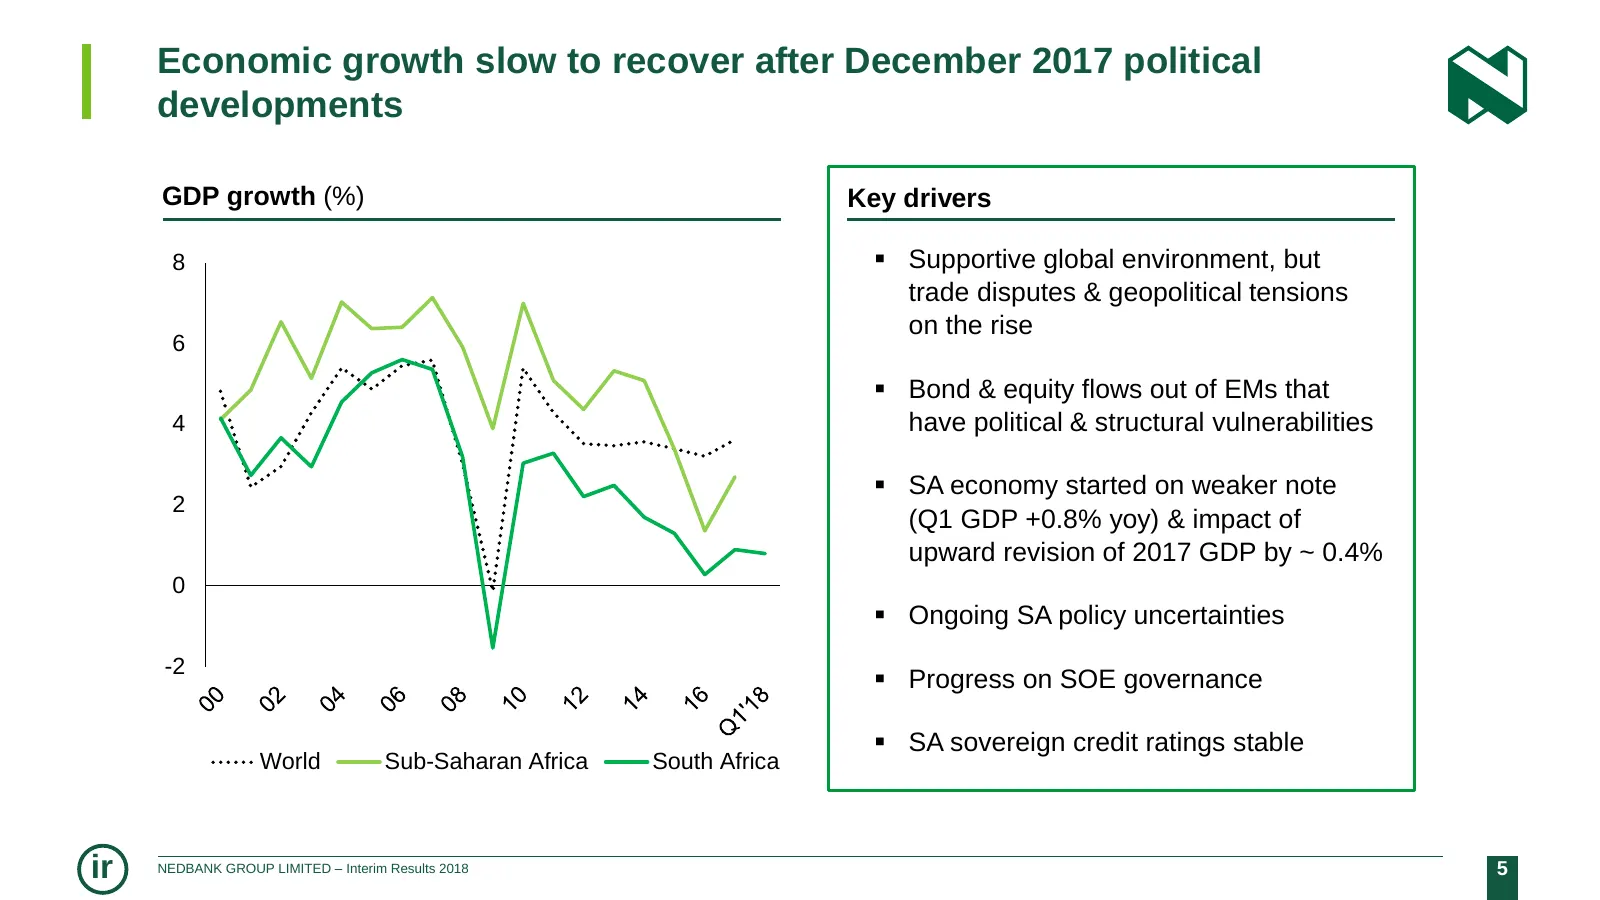
Economic growth slow to recover after December 2017 political developments GDP growth (%) Key drivers 8 Supportive global environment, but trade disputes & geopolitical tensions on the rise 6 Bond & equity flows out of EMs that 4 have political & structural vulnerabilities SA economy started o
Slide 6: Gradual recovery in retail credit, but corporate credit demand weak
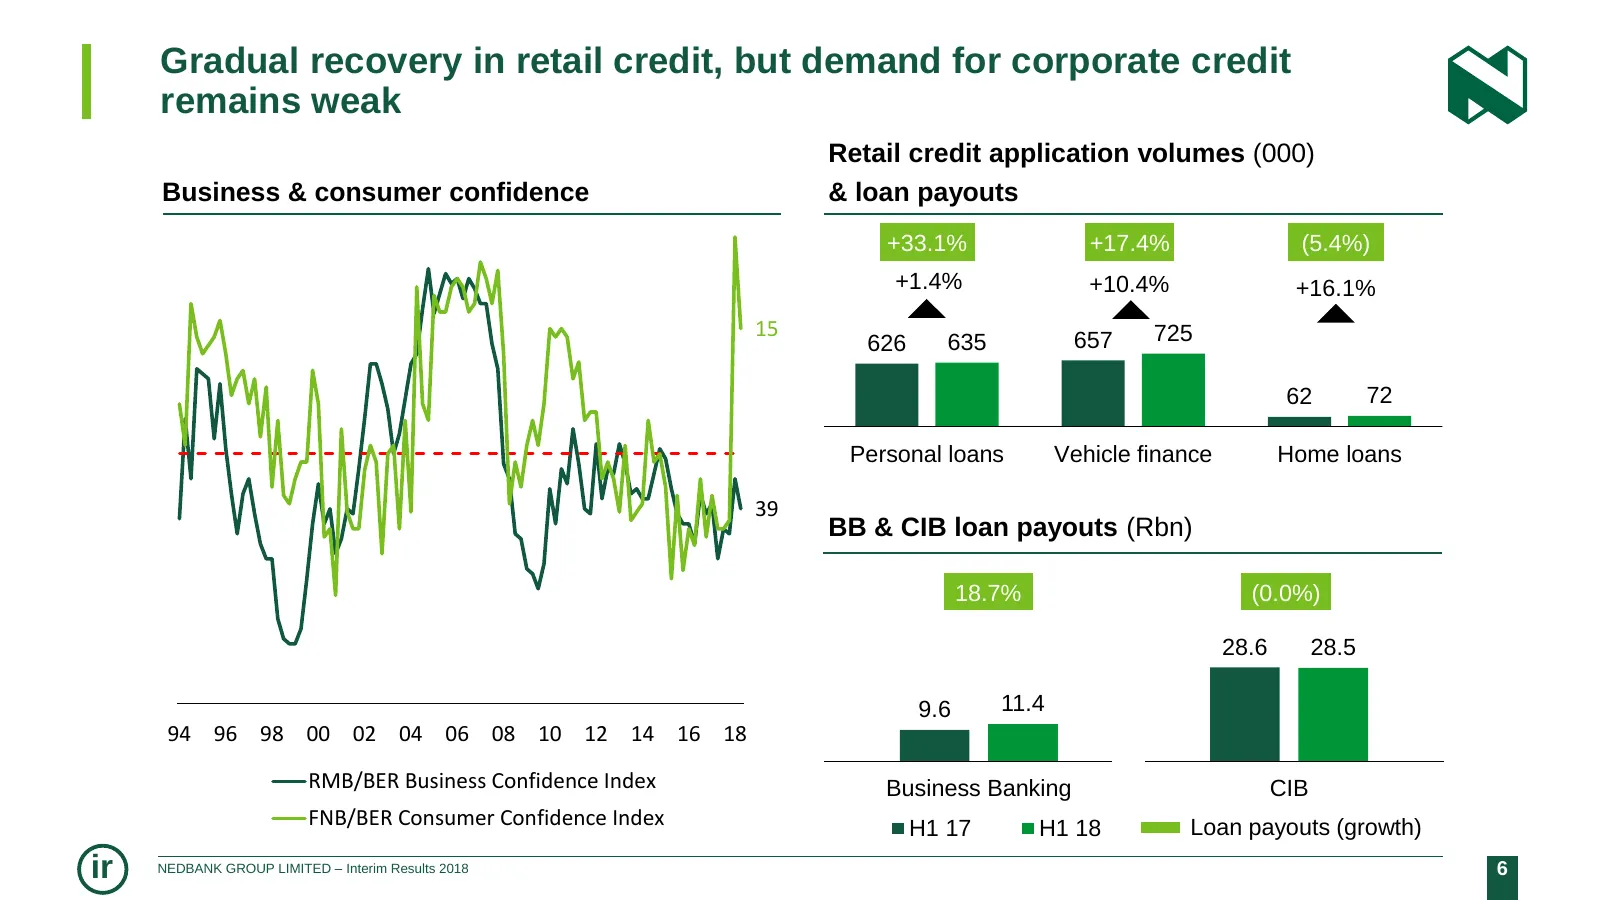
Gradual recovery in retail credit, but demand for corporate credit remains weak Retail credit application volumes (000) Business & consumer confidence & loan payouts +33.1% +17.4% (5.4%) +1.4% +10.4% +16.1% 15 657 725 626 635 62 72 Personal loans Vehicle finance Home loans 39 BB & CIB loan payouts (
Slide 7: Delivering value to shareholders
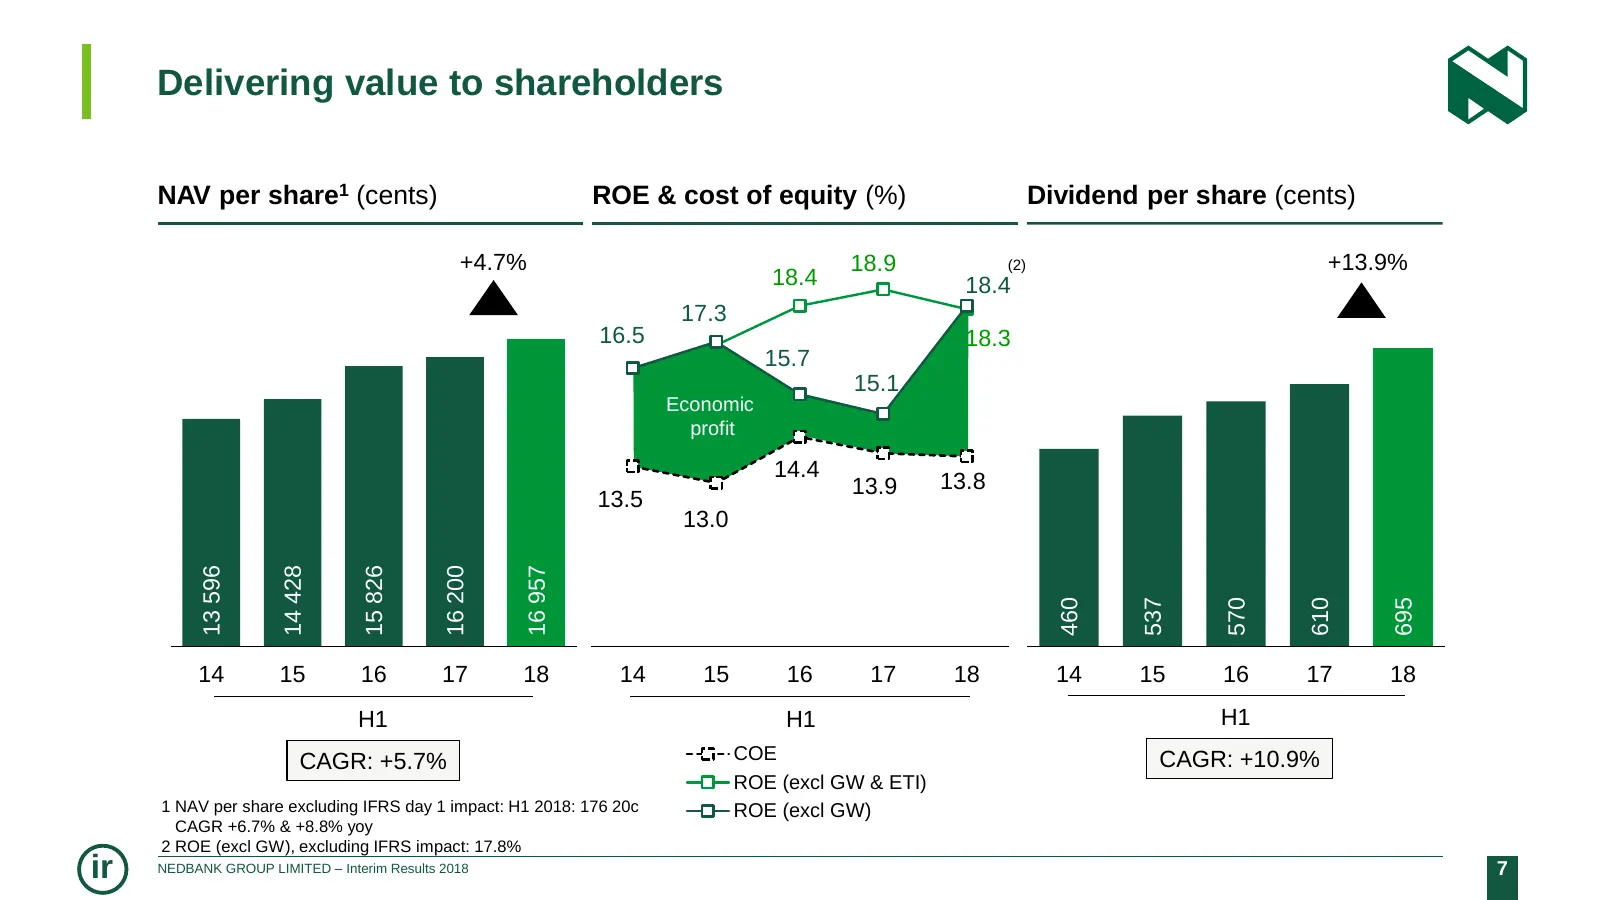
Delivering value to shareholders NAV per share1 (cents) ROE & cost of equity (%) Dividend per share (cents) +4.7% 18.9 (2) +13.9% 18.4 18.4 17.3 16.5 18.3 15.7 15.1 Economic profit 14.4 13.9 13.8 13.5 13.0 13 596 14 428 15 826 16 200 16 957 460 537 570 610 695 14 15 16 17 18 14 15 16 17 18 14 15 16
Slide 8: Our role in society – delivering value to all stakeholders
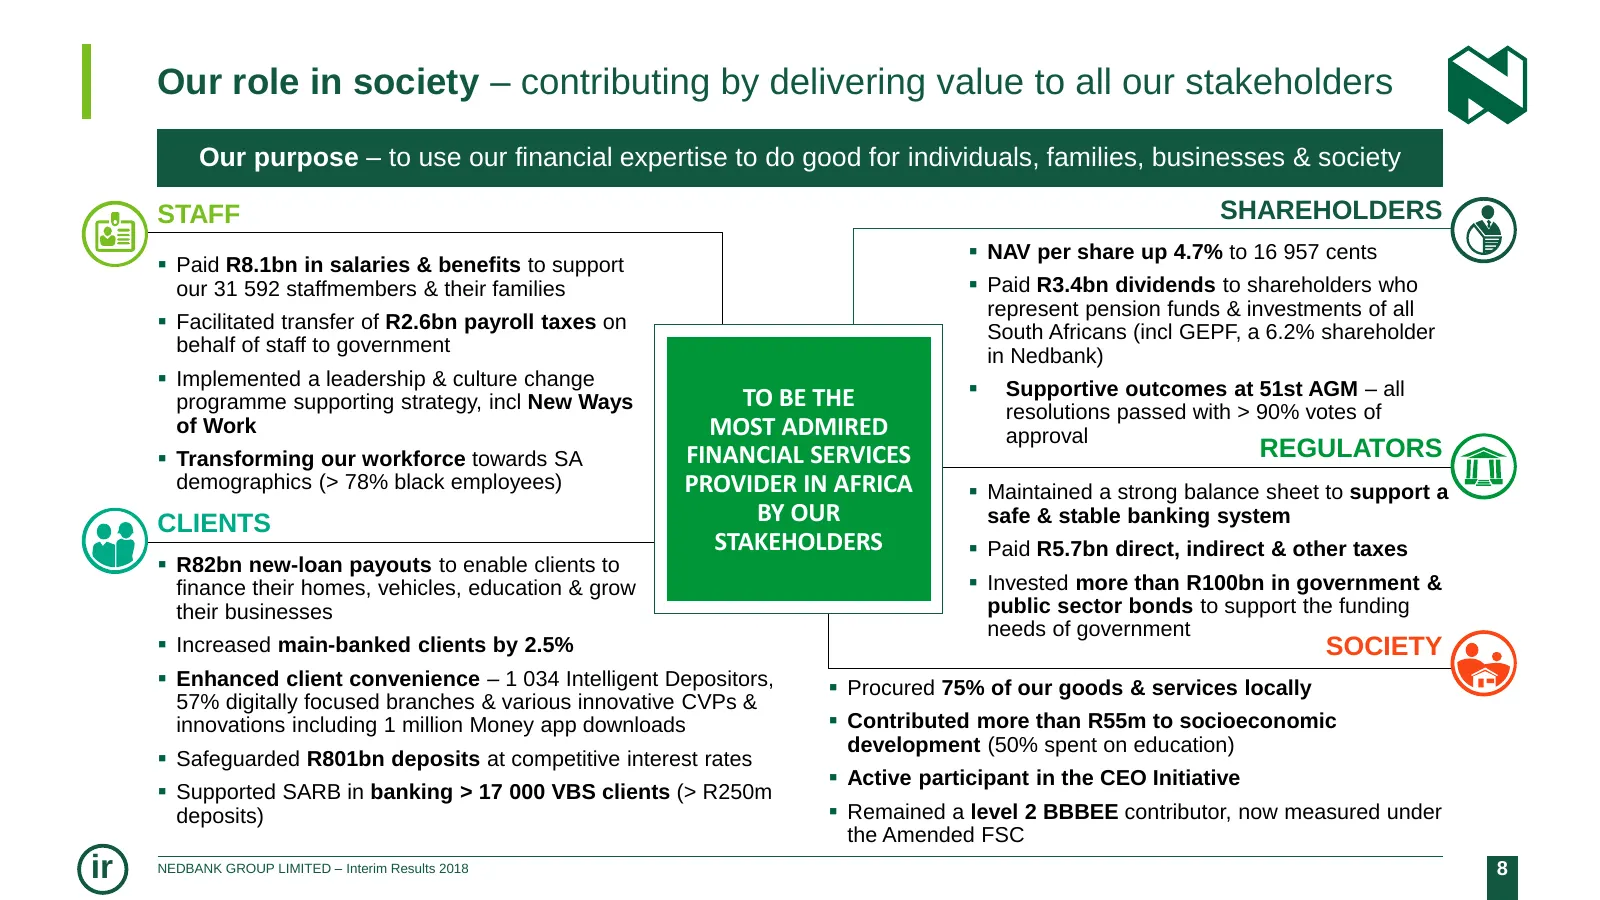
Our role in society – contributing by delivering value to all our stakeholders Our purpose – to use our financial expertise to do good for individuals, families, businesses & society STAFF SHAREHOLDERS NAV per share up 4.7% to 16 957 cents Paid R8.1bn in salaries & benefits to support our 31 592
Slide 9: Financial Overview
FINANCIAL OVERVIEW Strong financial performance RAISIBE MORATHI ir NEDBANK GROUP LIMITED – Interim Results 2018 9
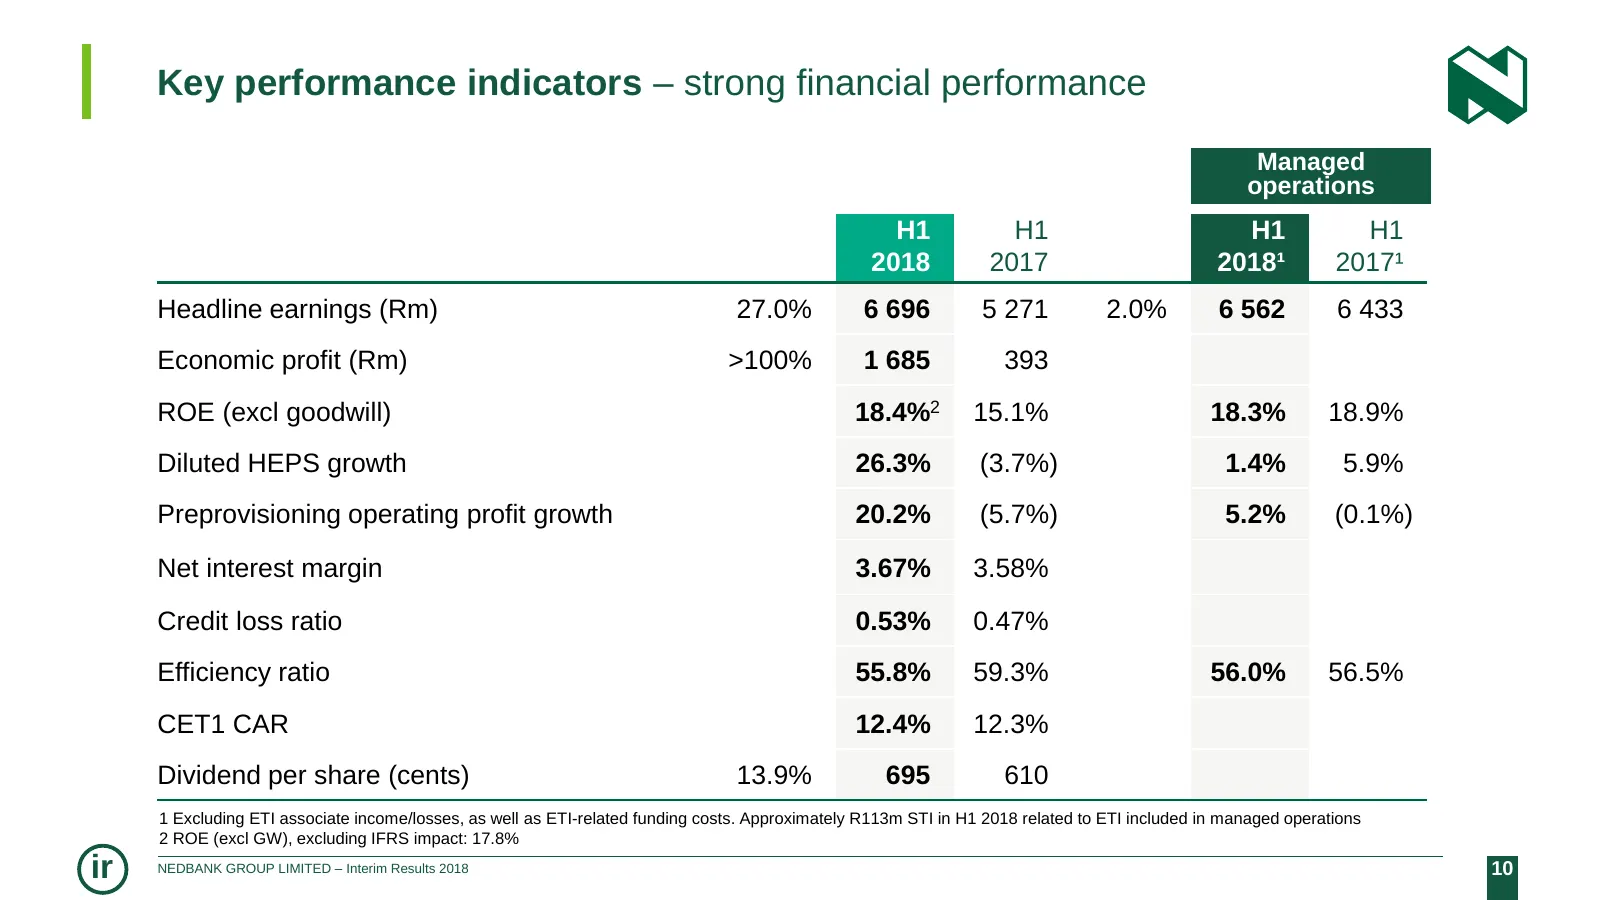
Slide 10: Key performance indicators – strong financial performance
Key performance indicators – strong financial performance Managed operations H1 H1 H1 H1 2018 2017 2018¹ 2017¹ Headline earnings (Rm) 27.0% 6 696 5 271 2.0% 6 562 6 433 Economic profit (Rm) >100% 1 685 393 ROE (excl goodwill) 18.4%2 15.1% 18.3% 18.9% Diluted HEPS growth 26.3% (3.7%) 1.4% 5.9% Prepro
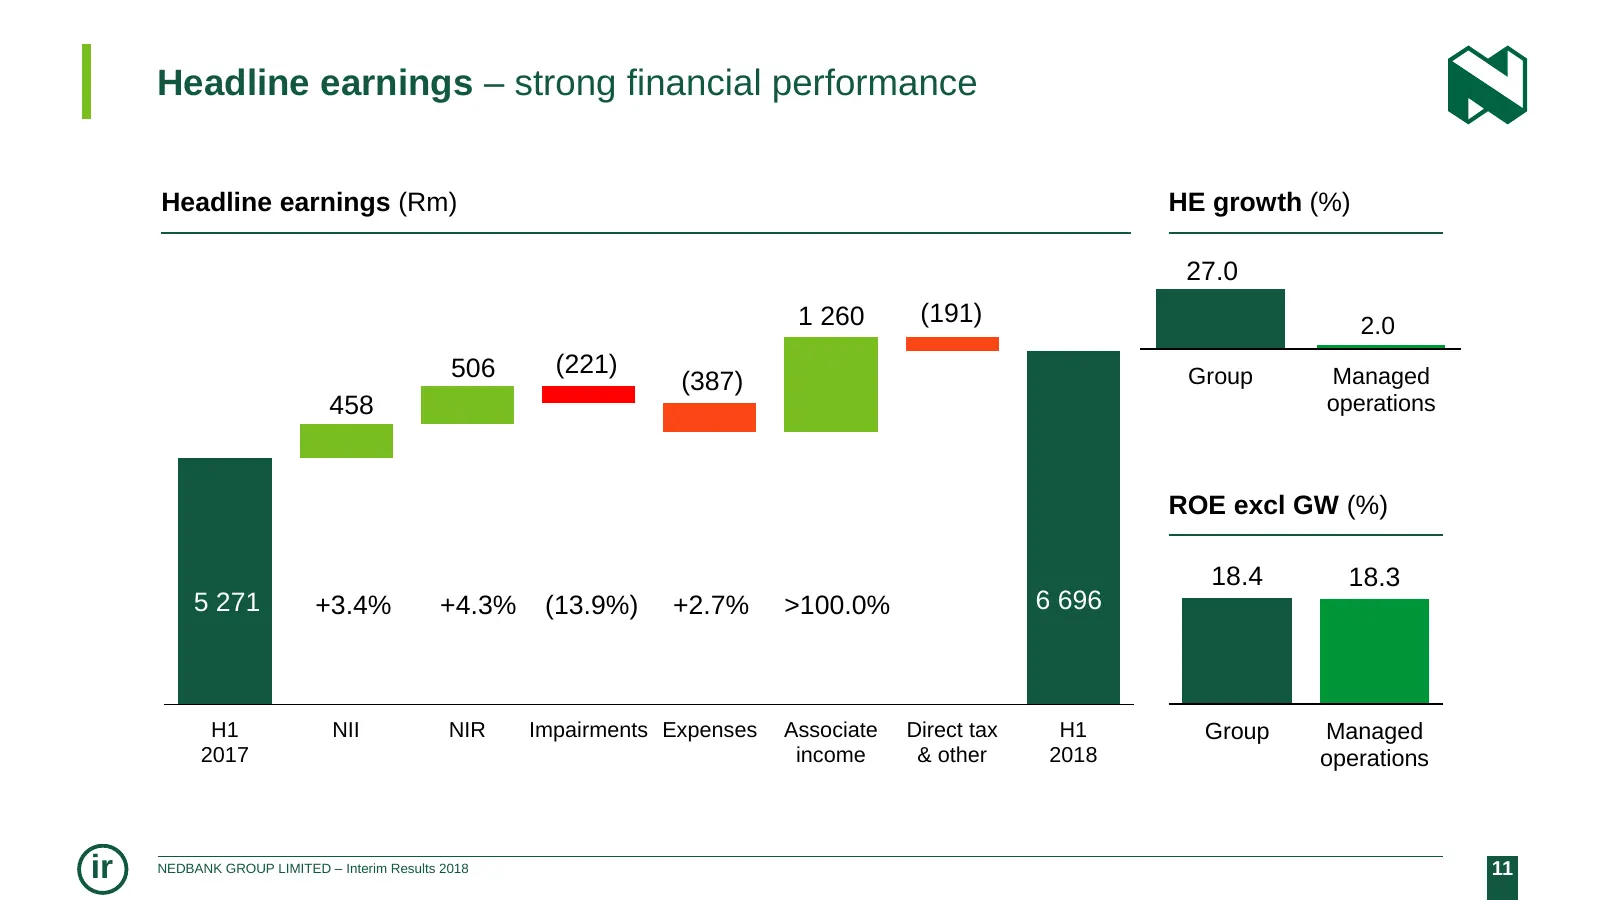
Slide 11: Headline earnings – strong financial performance
Headline earnings – strong financial performance Headline earnings (Rm) HE growth (%) 27.0 1 260 (191) 2.0 506 (221) Group Managed (387) 458 operations ROE excl GW (%) 18.4 18.3 5 271 +3.4% +4.3% (13.9%) +2.7% >100.0% 6 696 H1 NII NIR Impairments Expenses Associate Direct tax H1 Group Managed 2017 i
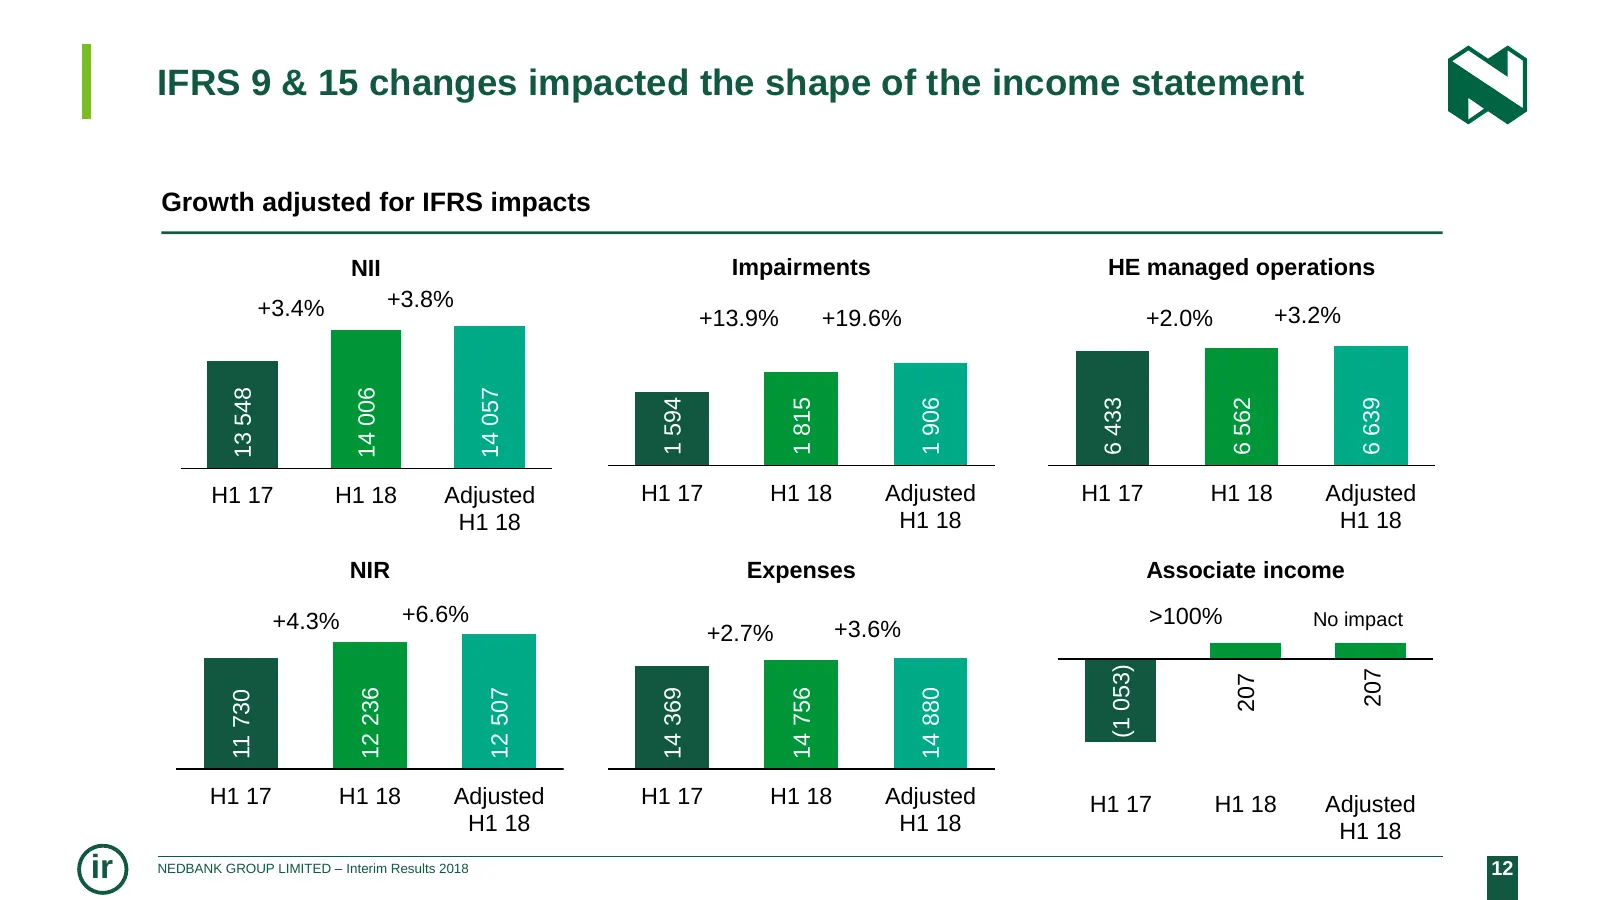
Slide 12: IFRS 9 & 15 changes impacted the shape of the income statement
IFRS 9 & 15 changes impacted the shape of the income statement Growth adjusted for IFRS impacts NII Impairments HE managed operations +3.4% +3.8% +13.9% +19.6% +2.0% +3.2% 13 548 14 006 14 057 6 433 6 562 6 639 1 594 1 815 1 906 H1 17 H1 18 Adjusted H1 17 H1 18 Adjusted H1 17 H1 18 Adjusted H1 18 H1
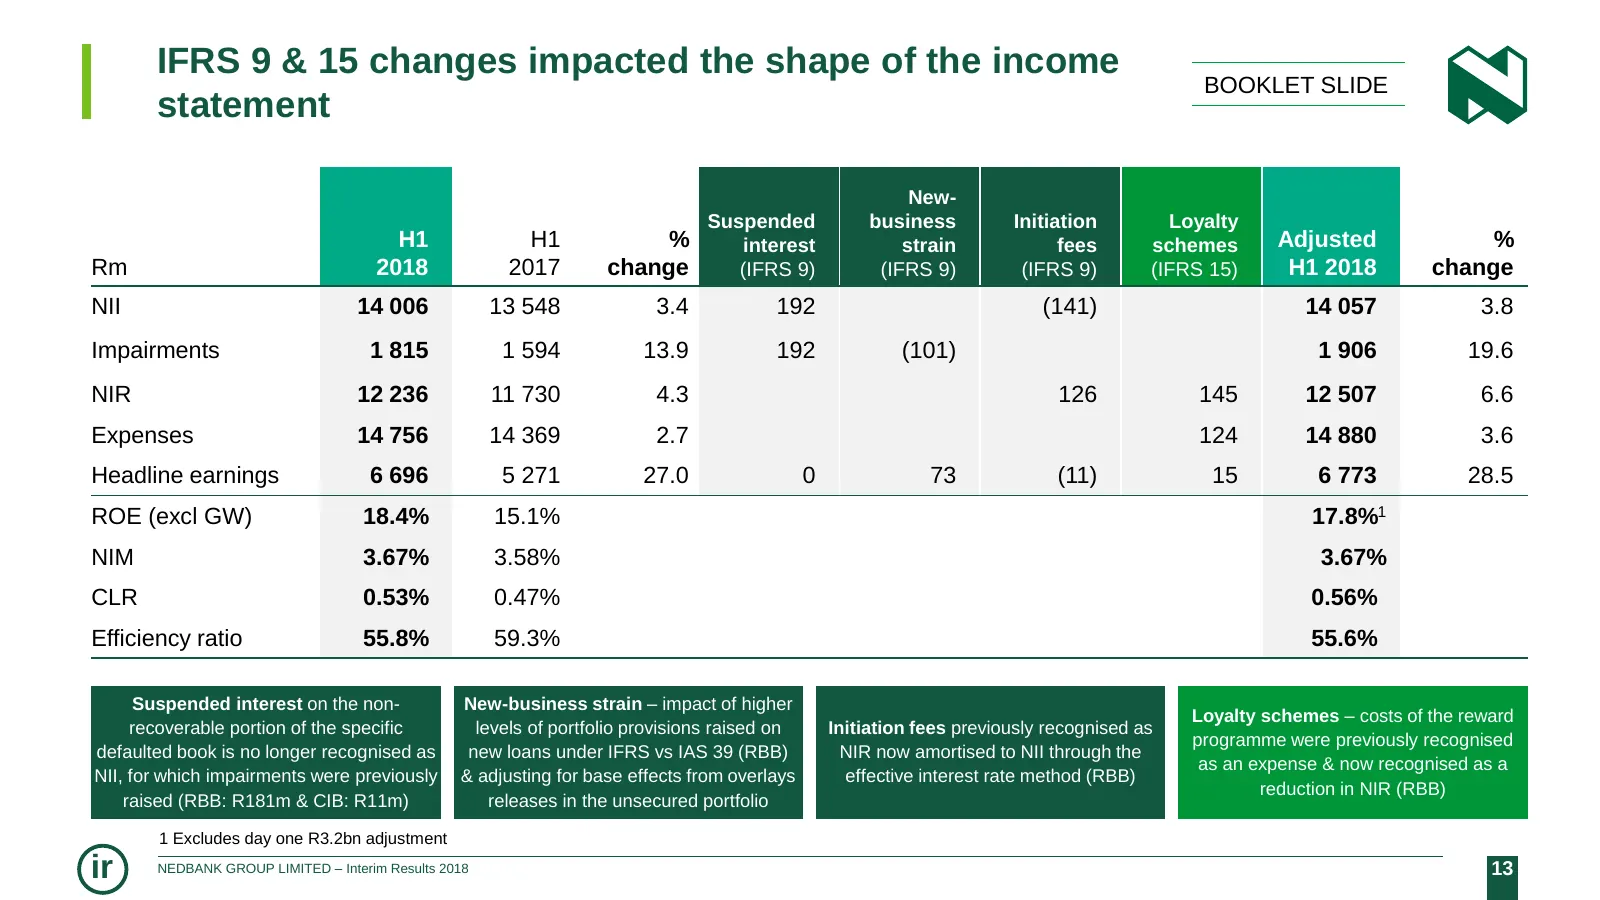
Slide 13: IFRS 9 & 15 changes impacted the shape of the income statement
IFRS 9 & 15 changes impacted the shape of the income BOOKLET SLIDE statement New- Suspended business Initiation Loyalty H1 H1 % interest strain fees schemes Adjusted % Rm 2018 2017 change (IFRS 9) (IFRS 9) (IFRS 9) (IFRS 15) H1 2018 change NII 14 006 13 548 3.4 192 (141) 14 057 3.8 Impairments 1 815
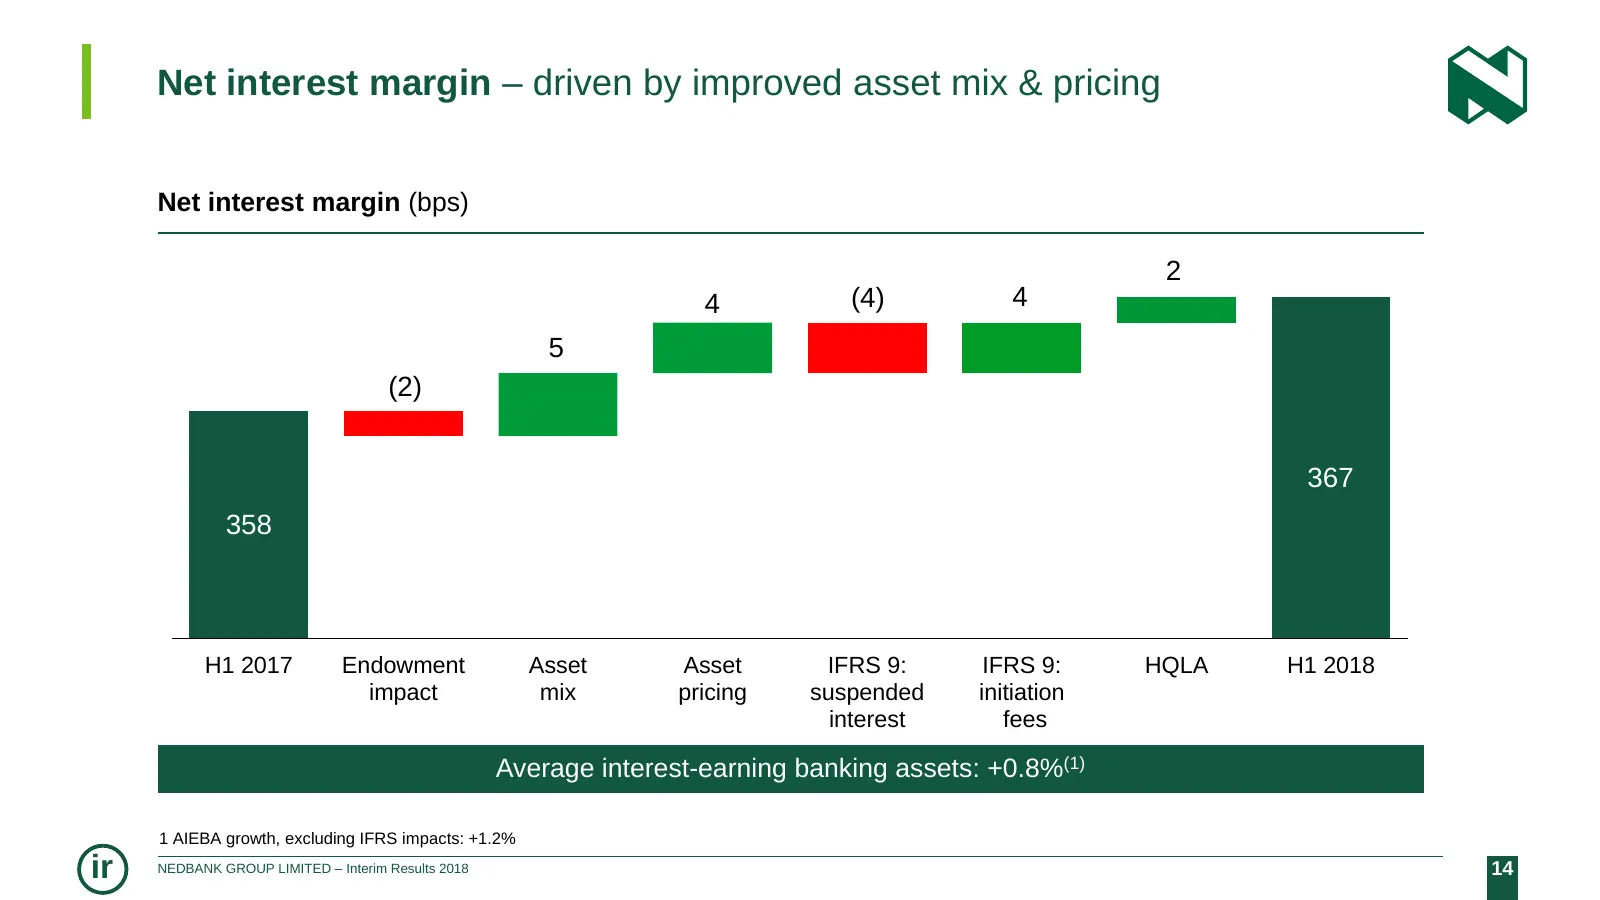
Slide 14: Net interest margin – driven by improved asset mix & pricing
Net interest margin – driven by improved asset mix & pricing Net interest margin (bps) 2 4 (4) 4 5 (2) 367 361 358 354 H1 2017 Endowment Asset Asset IFRS 9: IFRS 9: HQLA H1 2018 impact mix pricing suspended initiation interest fees Average Averageinterest-earning interest-earningbanking bankingasset
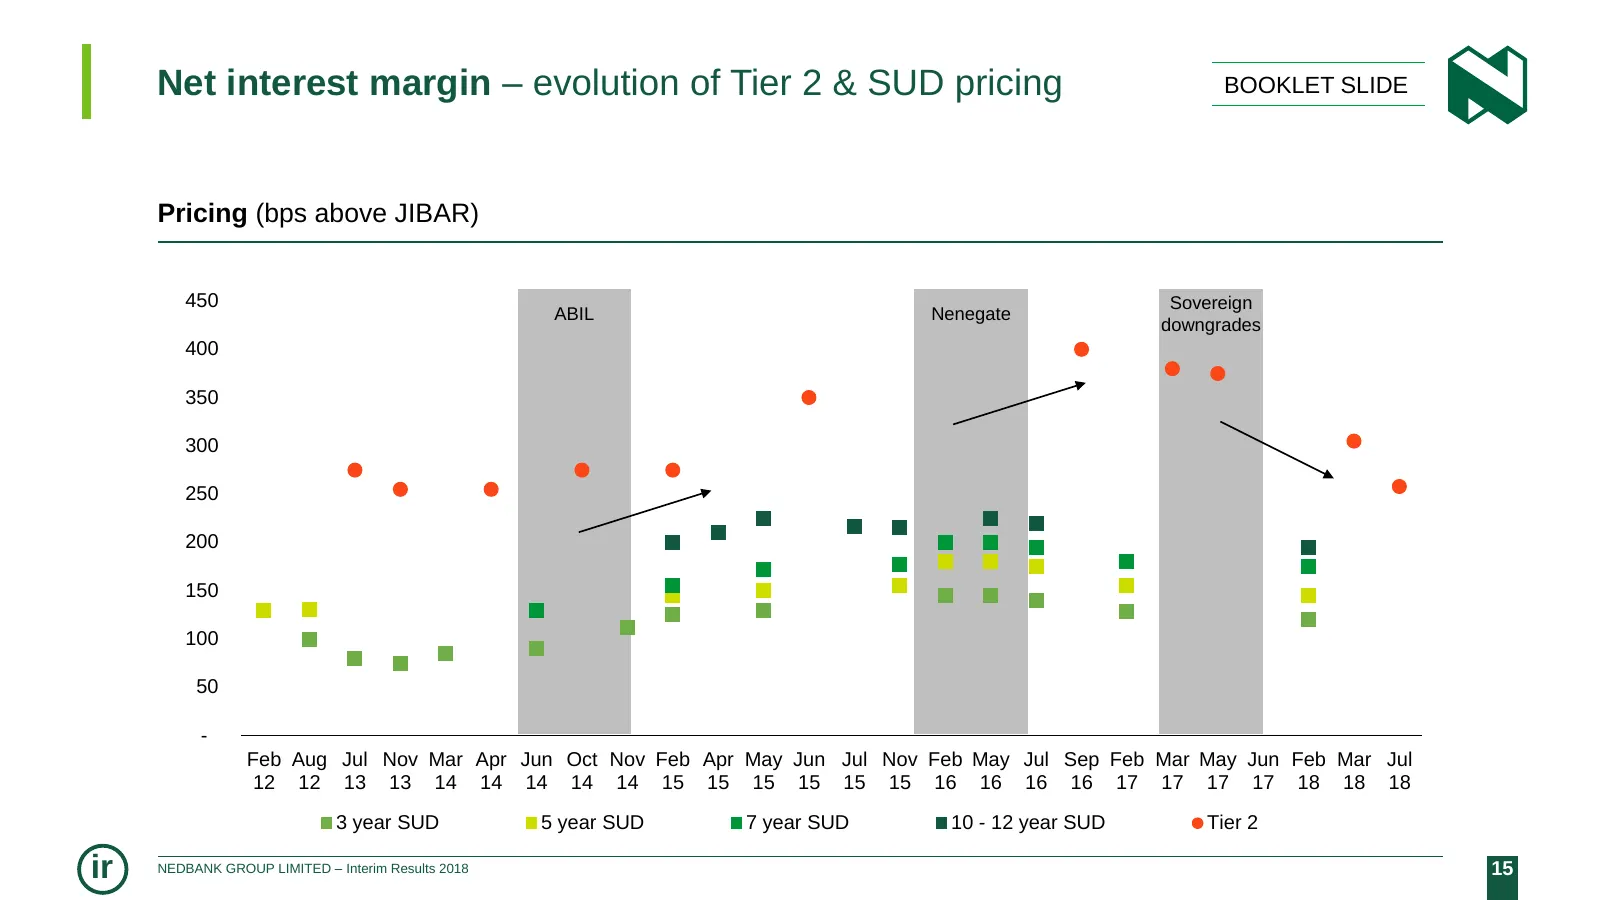
Slide 15: Net interest margin – evolution of Tier 2 & SUD pricing
Net interest margin – evolution of Tier 2 & SUD pricing BOOKLET SLIDE Pricing (bps above JIBAR) 450 Sovereign ABIL Nenegate downgrades 400 350 300 250 200 150 100 50 - Feb Aug Jul Nov Mar Apr Jun Oct Nov Feb Apr May Jun Jul Nov Feb May Jul Sep Feb Mar May Jun Feb Mar Jul 12 12 13 13 14 14 14 14 14 1
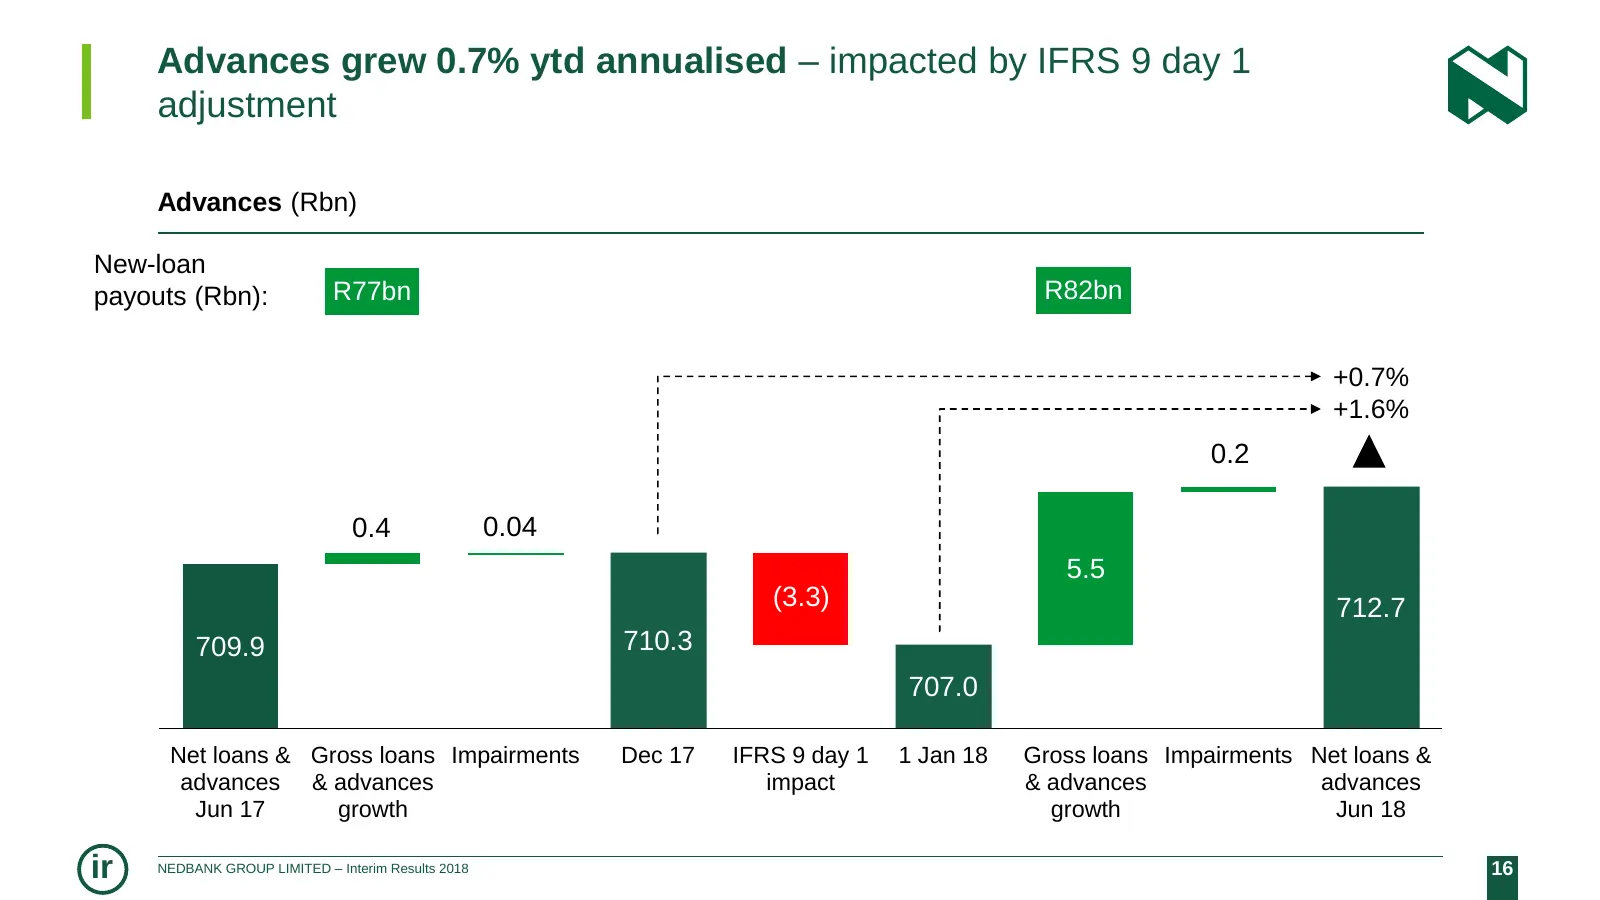
Slide 16: Advances grew 0.7% ytd annualised
Advances grew 0.7% ytd annualised – impacted by IFRS 9 day 1 adjustment Advances (Rbn) New-loan payouts (Rbn): R77bn R82bn +0.7% +1.6% 0.2 0.4 0.04 5.5 (3.3) 712.7 712.5 709.9 710.3 707.0 Net loans & Gross loans Impairments Dec 17 IFRS 9 day 1 1 Jan 18 Gross loans Impairments Net loans & advances &
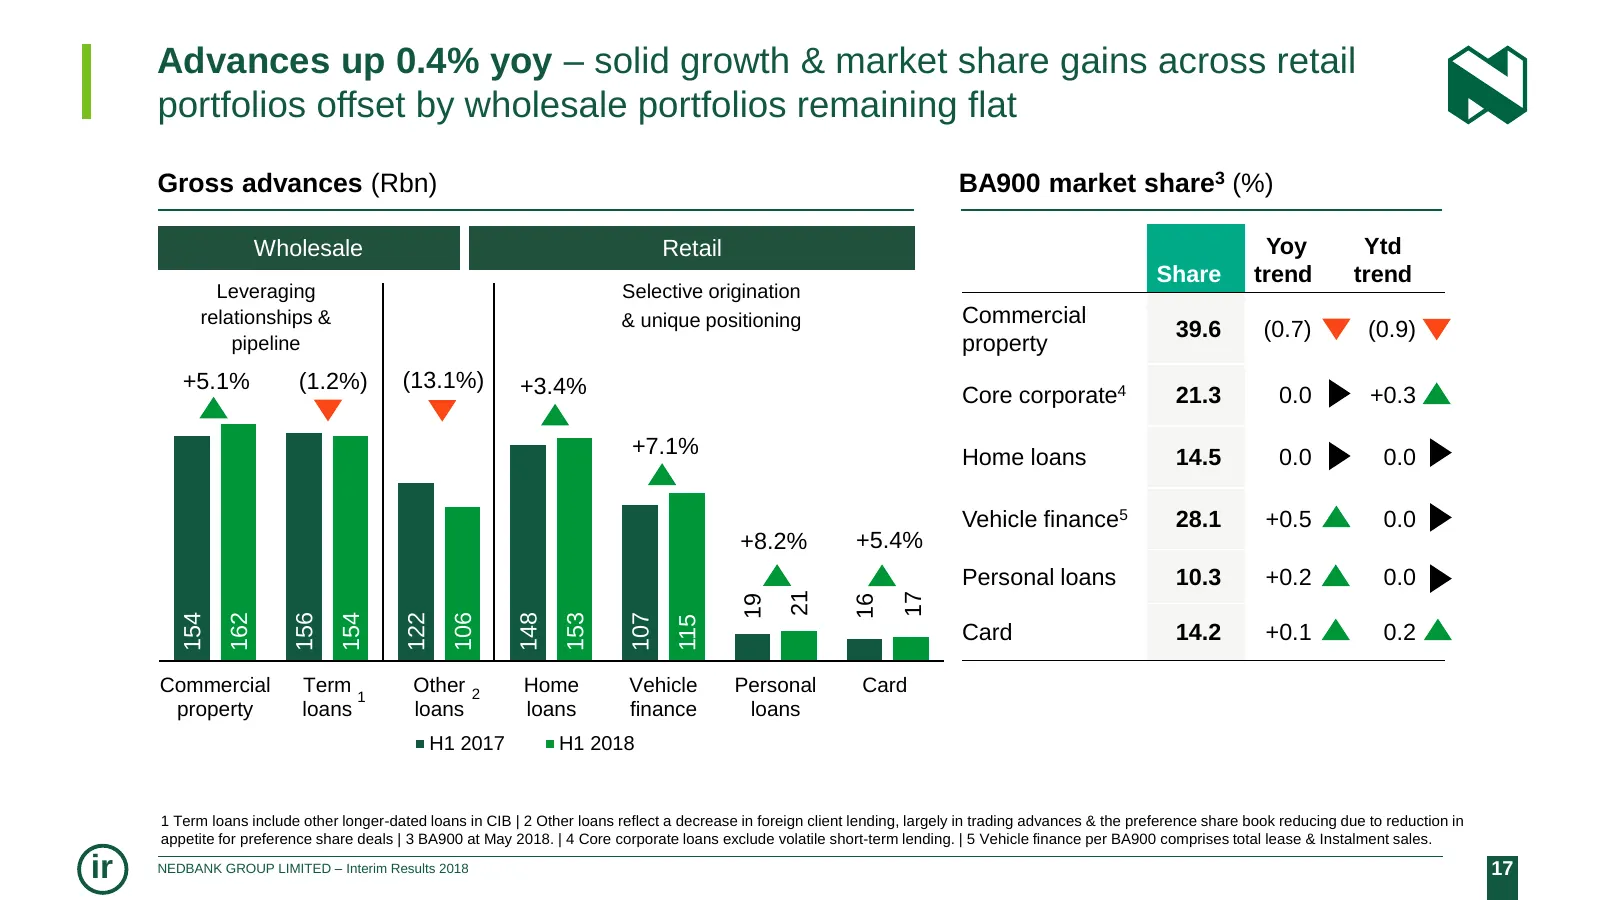
Slide 17: Advances up 0.4% yoy – market share gains across retail
Advances up 0.4% yoy – solid growth & market share gains across retail portfolios offset by wholesale portfolios remaining flat Gross advances (Rbn) BA900 market share3 (%) Wholesale Retail Yoy Ytd Share trend trend Leveraging Selective origination relationships & & unique positioning Commercial 39.
Slide 18: Deposits up 5.0% yoy – focus on Basel III-friendly deposits
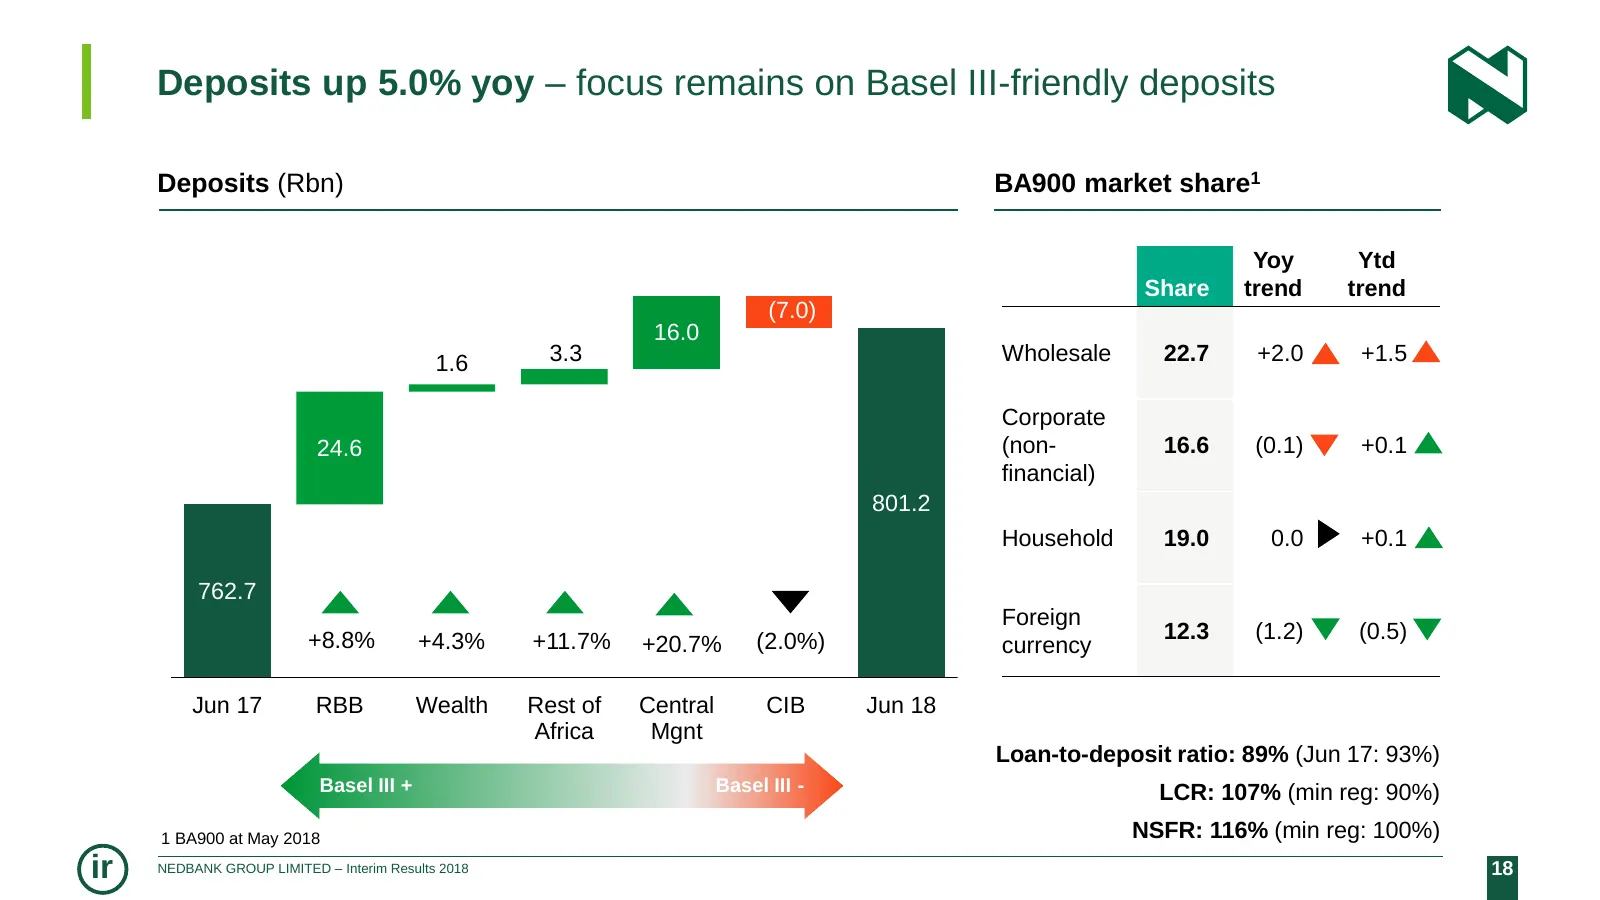
Deposits up 5.0% yoy – focus remains on Basel III-friendly deposits Deposits (Rbn) BA900 market share1 Yoy Ytd Share trend trend (7.0) 16.0 1.6 3.3 Wholesale 22.7 +2.0 +1.5 Corporate 24.6 (non- 16.6 (0.1) +0.1 financial) 801.2 Household 19.0 0.0 +0.1 762.7 Foreign +8.8% +4.3% +11.7% (2.0%) 12.3 (1.2
Slide 19: Non-interest revenue up 4.3%
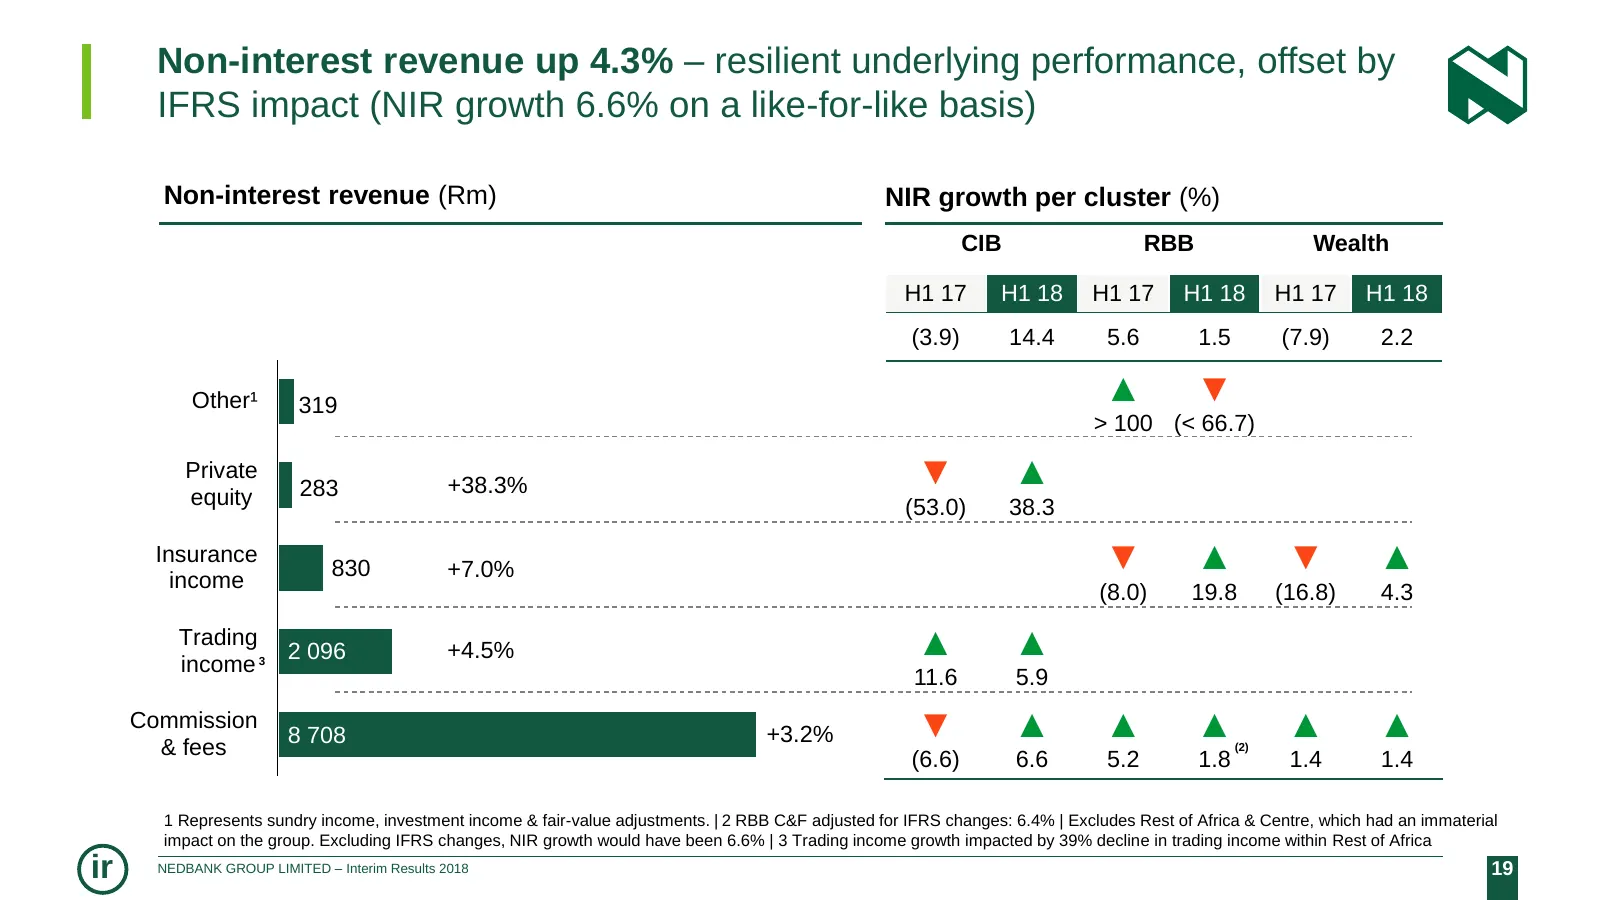
Non-interest revenue up 4.3% – resilient underlying performance, offset by IFRS impact (NIR growth 6.6% on a like-for-like basis) Non-interest revenue (Rm) NIR growth per cluster (%) CIB RBB Wealth H1 17 H1 18 H1 17 H1 18 H1 17 H1 18 (3.9) 14.4 5.6 1.5 (7.9) 2.2 Other¹ 319 ▲ ▼ > 100 (< 66.7) Private
Slide 20: Macro fair-value hedge accounting changes
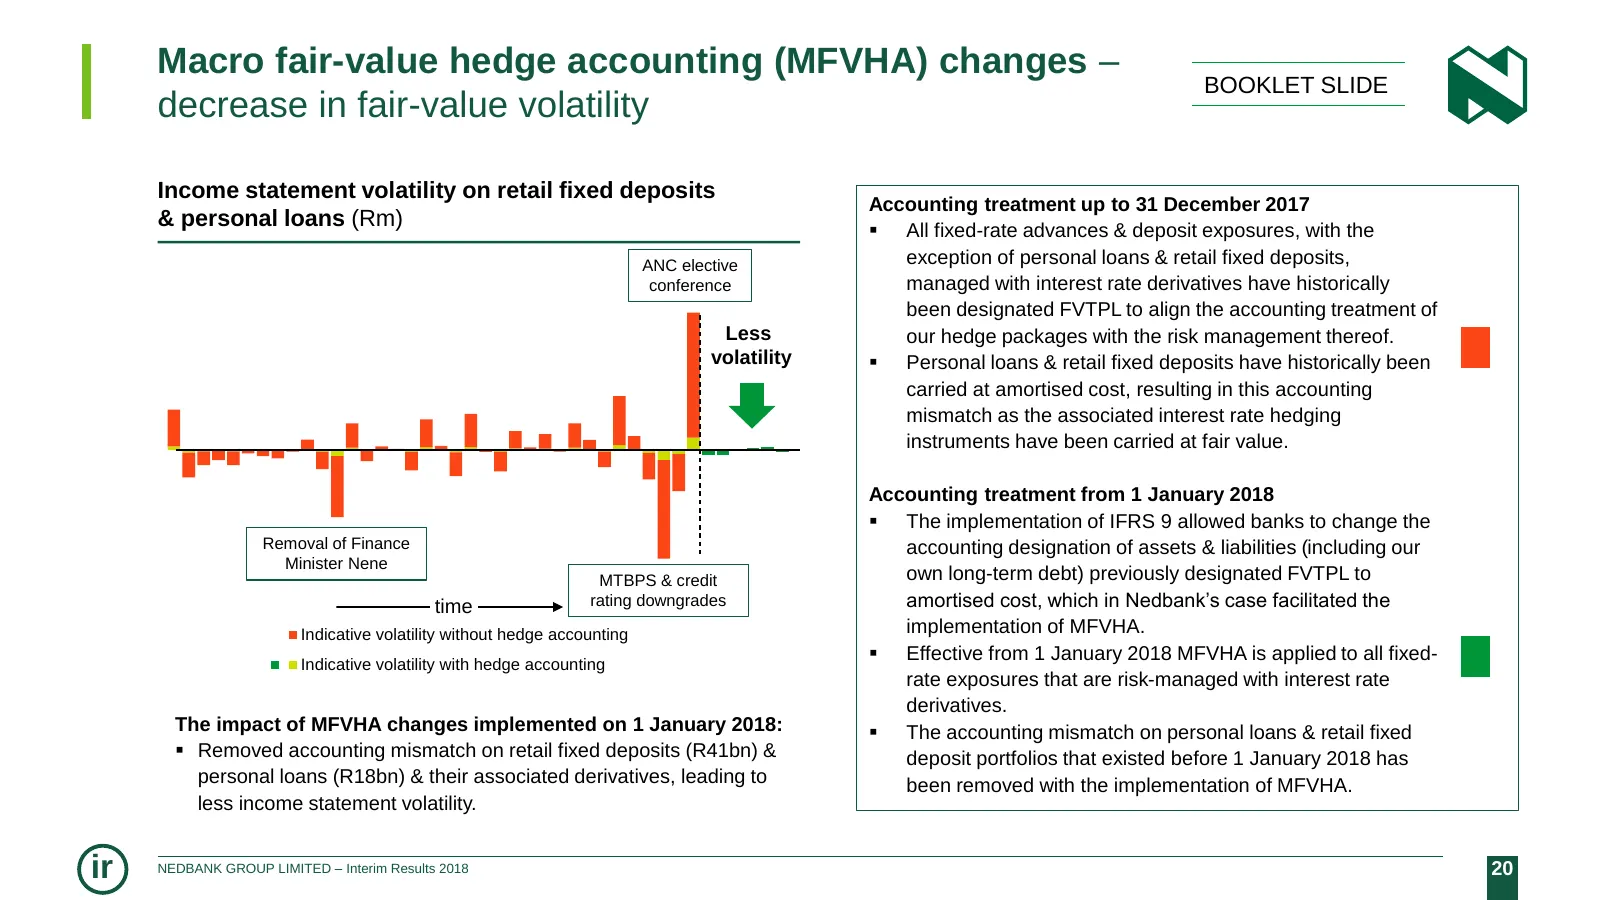
Macro fair-value hedge accounting (MFVHA) changes – BOOKLET SLIDE decrease in fair-value volatility Income statement volatility on retail fixed deposits Accounting treatment up to 31 December 2017 & personal loans (Rm) All fixed-rate advances & deposit exposures, with the ANC elective exception of
Slide 21: Credit loss ratio – improvement underpinned by quality portfolio
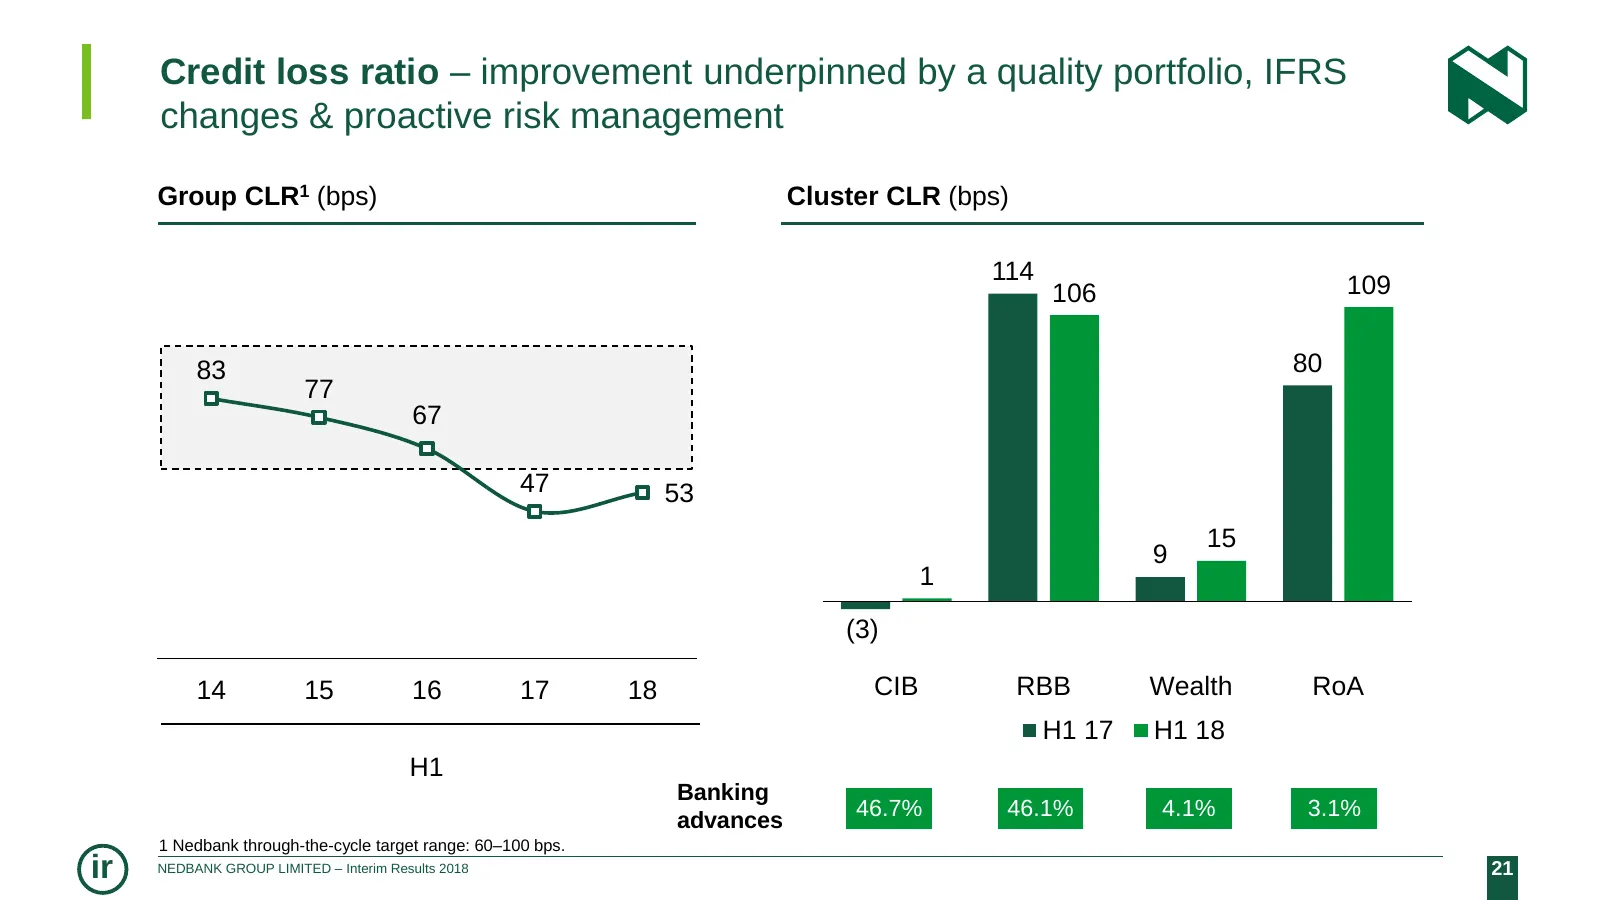
Credit loss ratio – improvement underpinned by a quality portfolio, IFRS changes & proactive risk management Group CLR1 (bps) Cluster CLR (bps) 114 106 109 83 80 77 67 47 53 15 9 1 (3) 14 15 16 17 18 CIB RBB Wealth RoA H1 17 H1 18 H1 Banking advances 46.7% 46.1% 4.1% 3.1% 1 Nedbank through-the-cycle
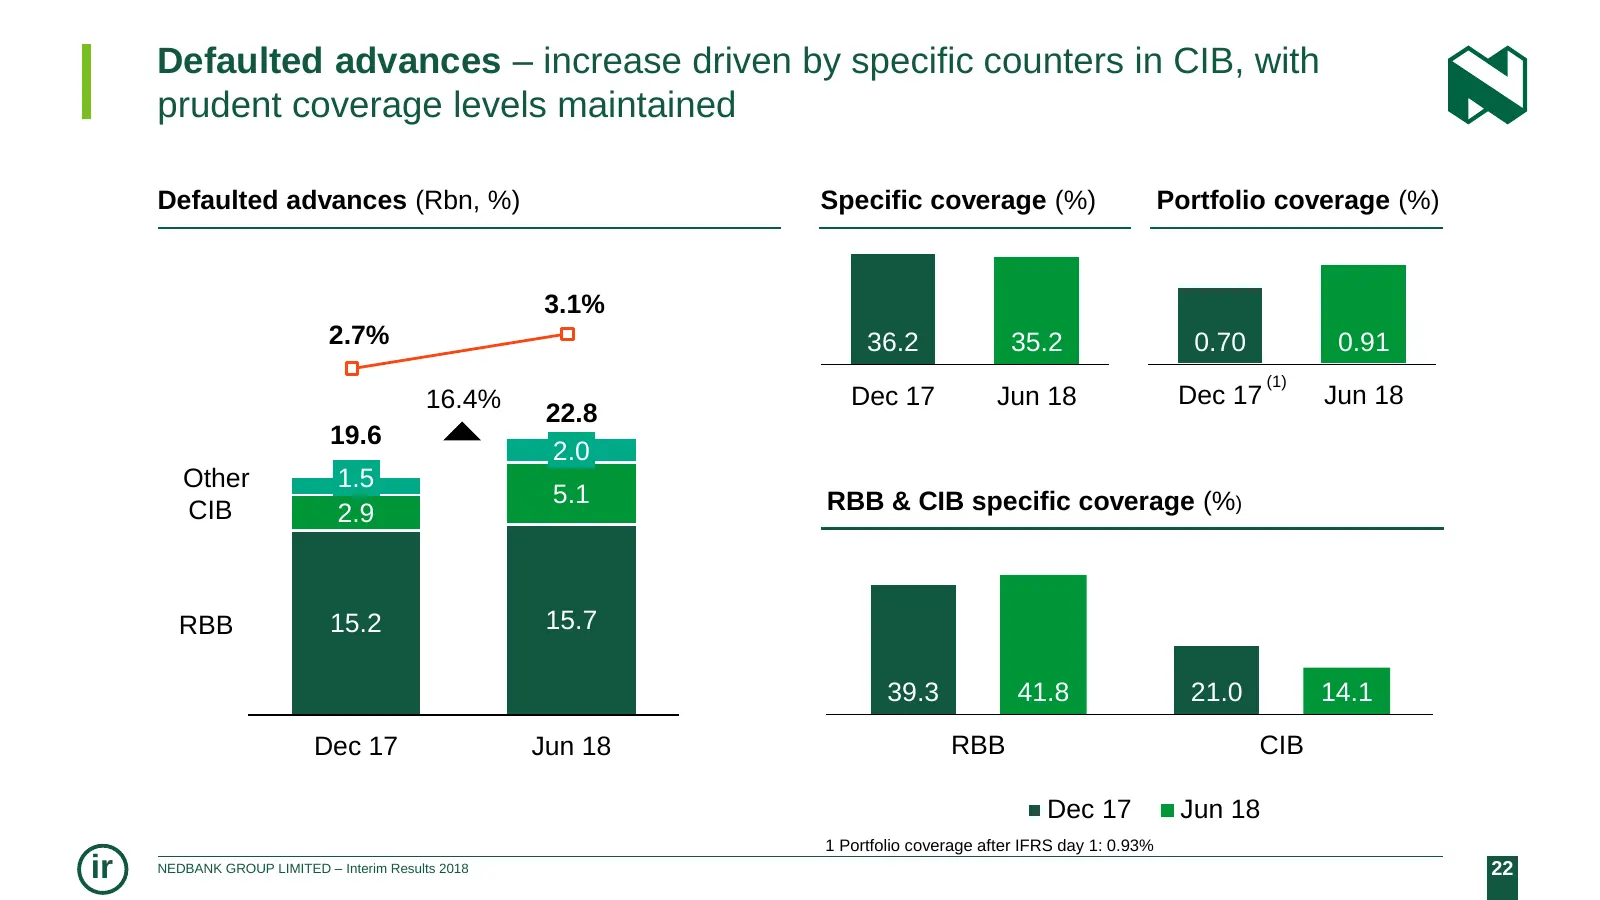
Slide 22: Defaulted advances – increase driven by specific counters in CIB
Defaulted advances – increase driven by specific counters in CIB, with prudent coverage levels maintained Defaulted advances (Rbn, %) Specific coverage (%) Portfolio coverage (%) 3.1% 2.7% 36.2 35.2 0.70 0.91 (1) 16.4% Dec 17 Jun 18 Dec 17 Jun 18 22.8 19.6 2.0 Other 1.5 5.1 RBB & CIB specific covera
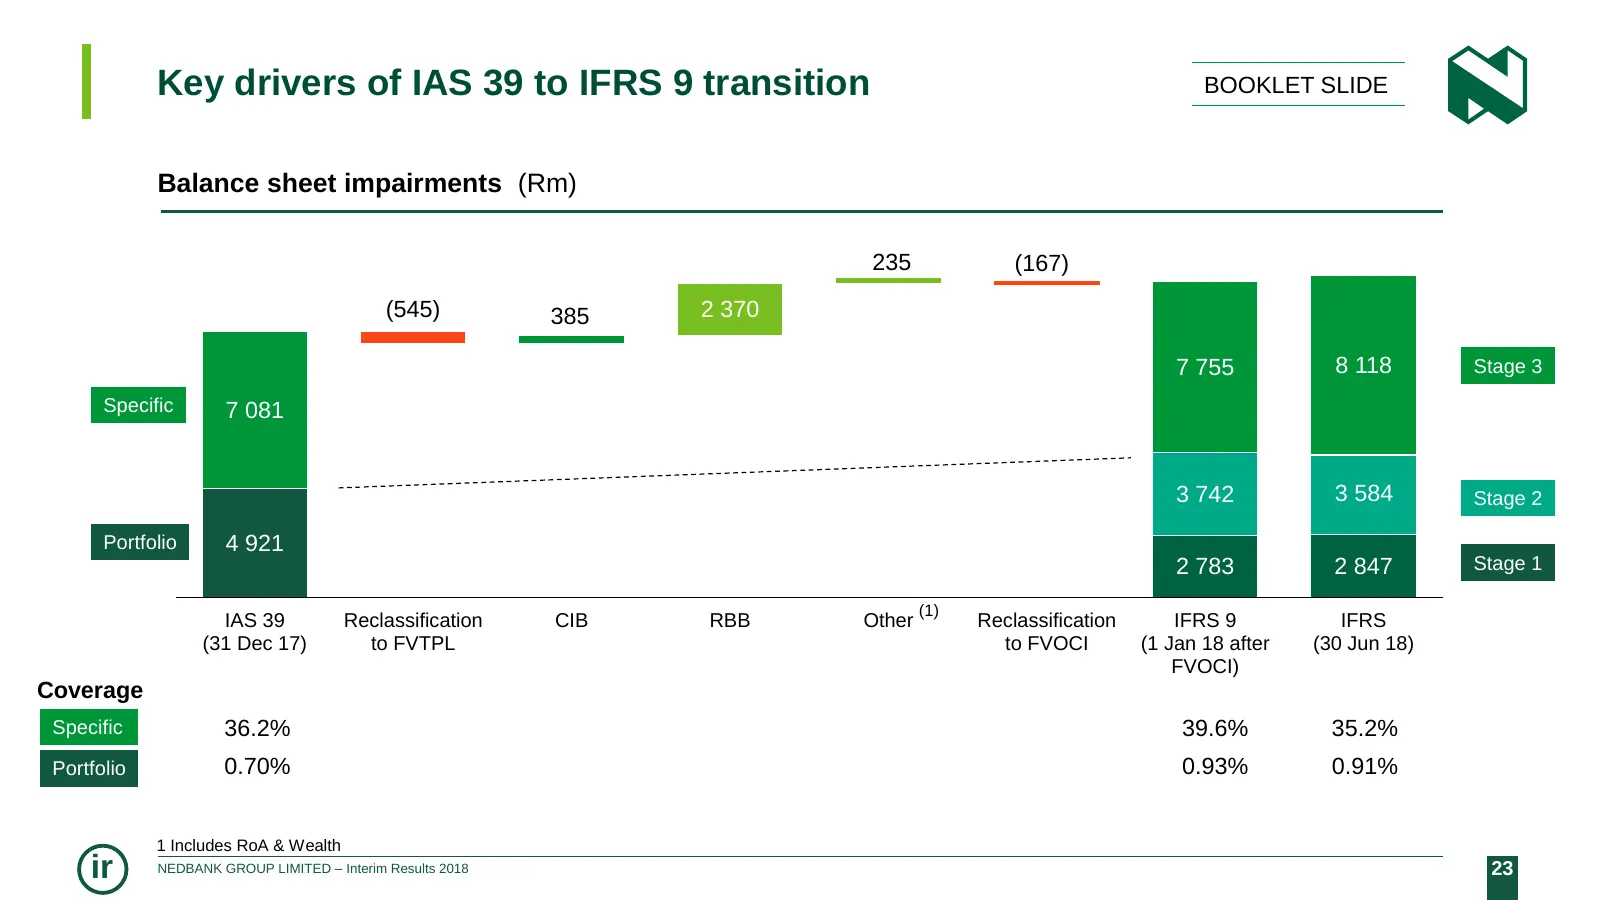
Slide 23: Key drivers of IAS 39 to IFRS 9 transition
Key drivers of IAS 39 to IFRS 9 transition BOOKLET SLIDE Balance sheet impairments (Rm) 235 (167) (545) 385 2 370 7 755 8 118 Stage 3 Specific 7 081 3 742 3 584 Stage 2 Portfolio 4 921 2 783 2 847 Stage 1 (1) IAS 39 Reclassification CIB RBB Other Reclassification IFRS 9 IFRS (31 Dec 17) to FVTPL to
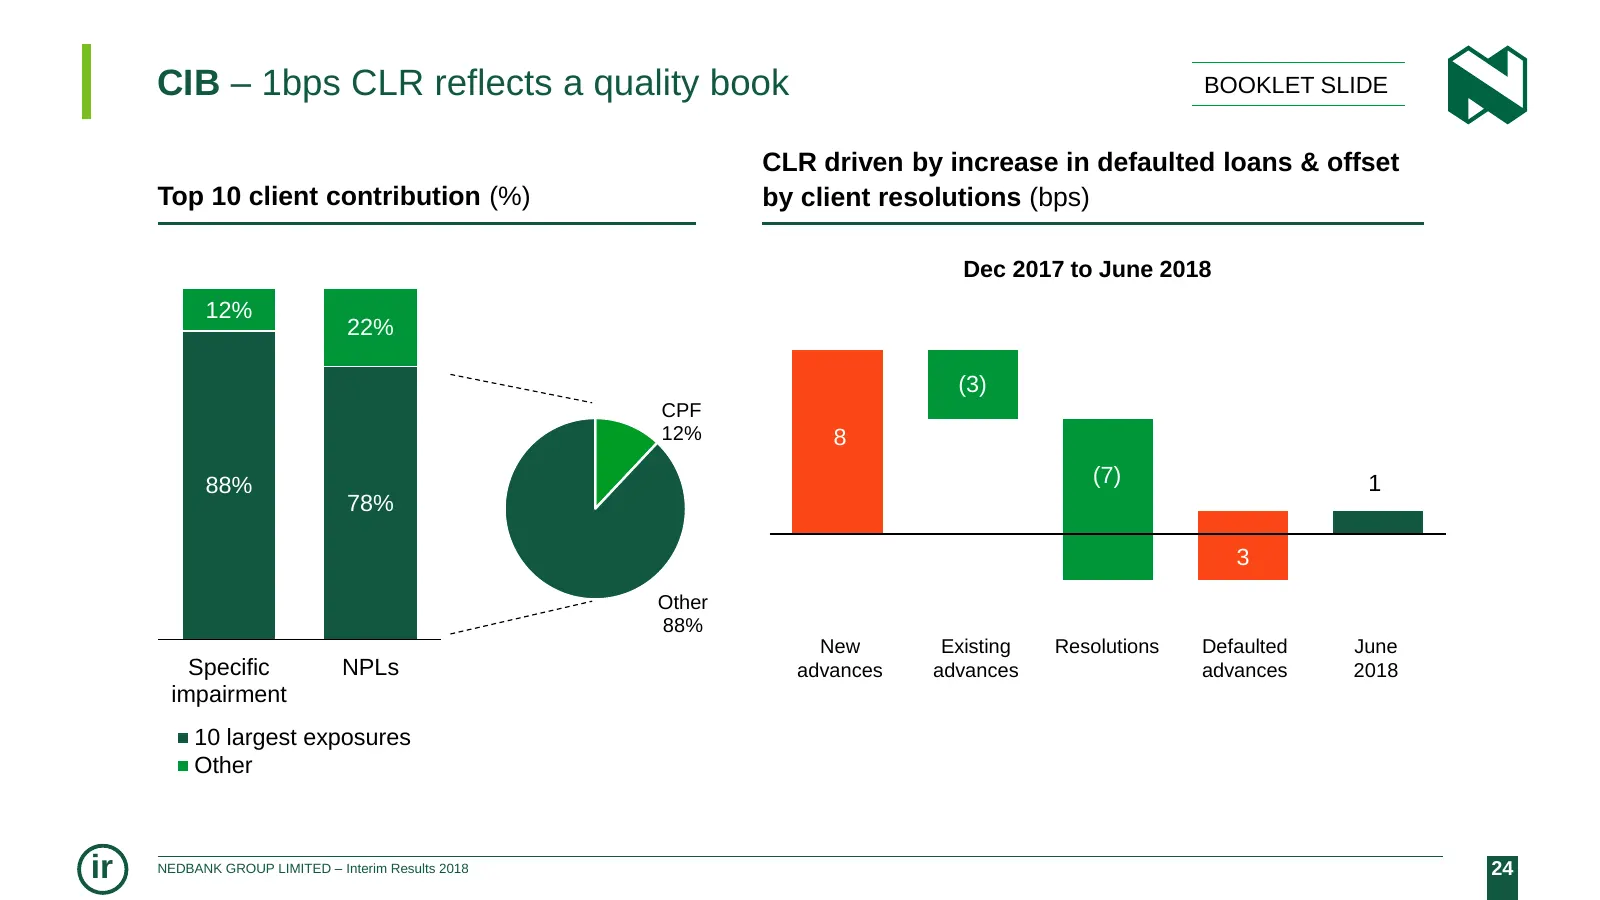
Slide 24: CIB – 1bps CLR reflects a quality book
CIB – 1bps CLR reflects a quality book BOOKLET SLIDE CLR driven by increase in defaulted loans & offset Top 10 client contribution (%) by client resolutions (bps) Dec 2017 to June 2018 12% 22% (3) CPF 12% 8 4 88% (7) 1 78% 3 Other 4 88% New Existing Resolutions Defaulted June Specific NPLs advances
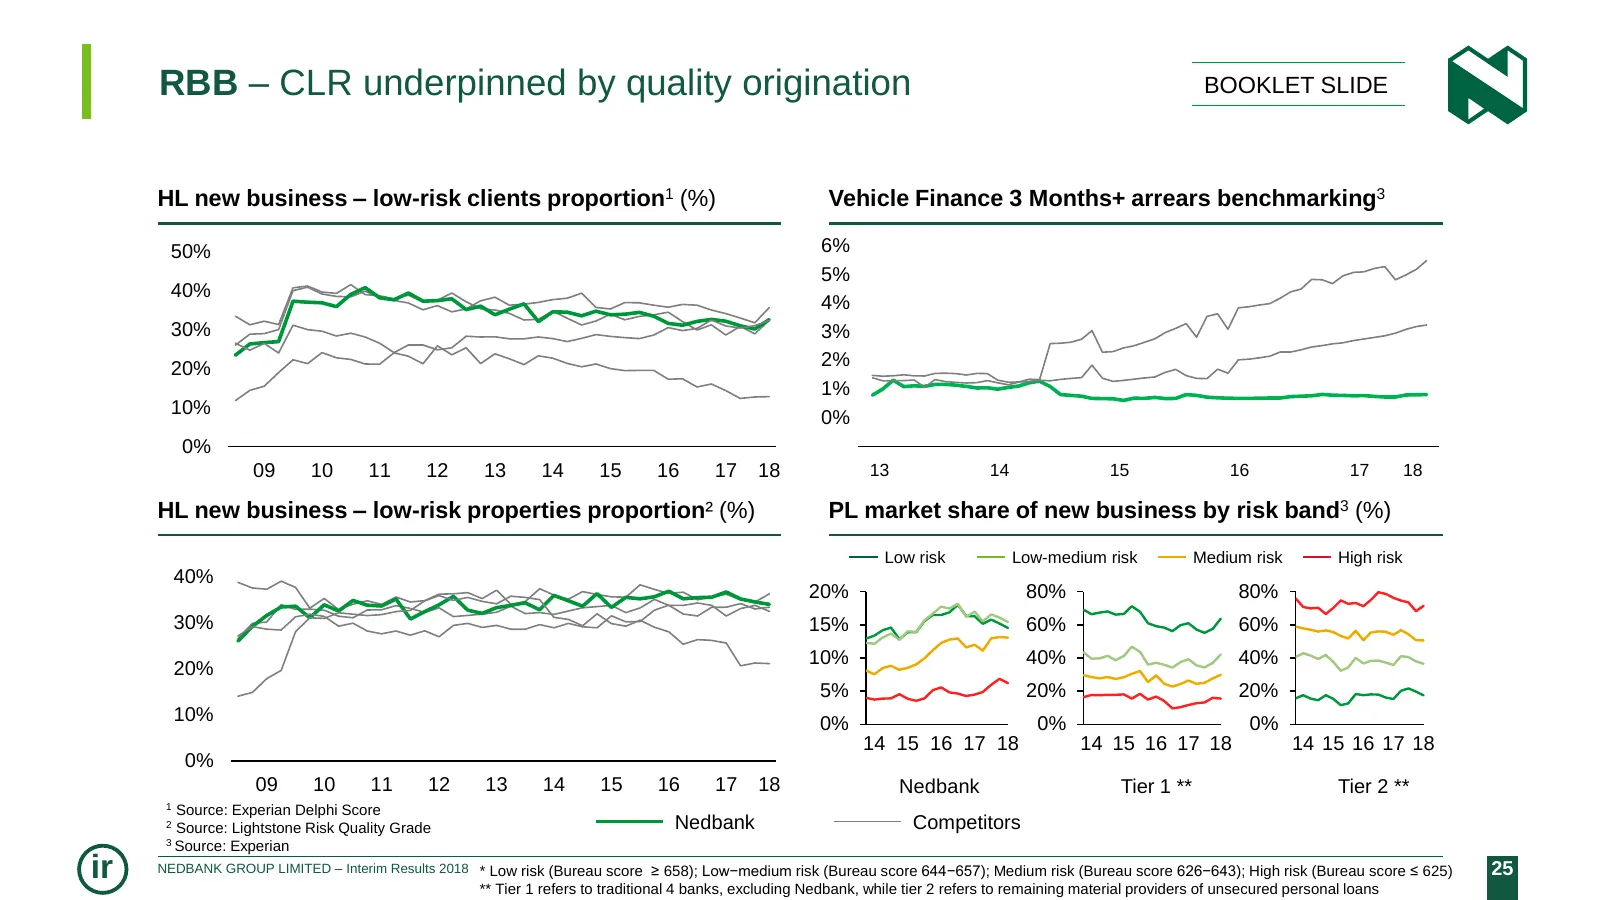
Slide 25: RBB – CLR underpinned by quality origination
RBB – CLR underpinned by quality origination BOOKLET SLIDE HL new business – low-risk clients proportion1 (%) Vehicle Finance 3 Months+ arrears benchmarking3 50% 6% 5% 40% 4% 30% 3% 20% 2% 1% 10% 0% 0% 09 10 11 12 13 14 15 16 17 18 13 14 15 16 17 18 HL new business – low-risk properties proportion²
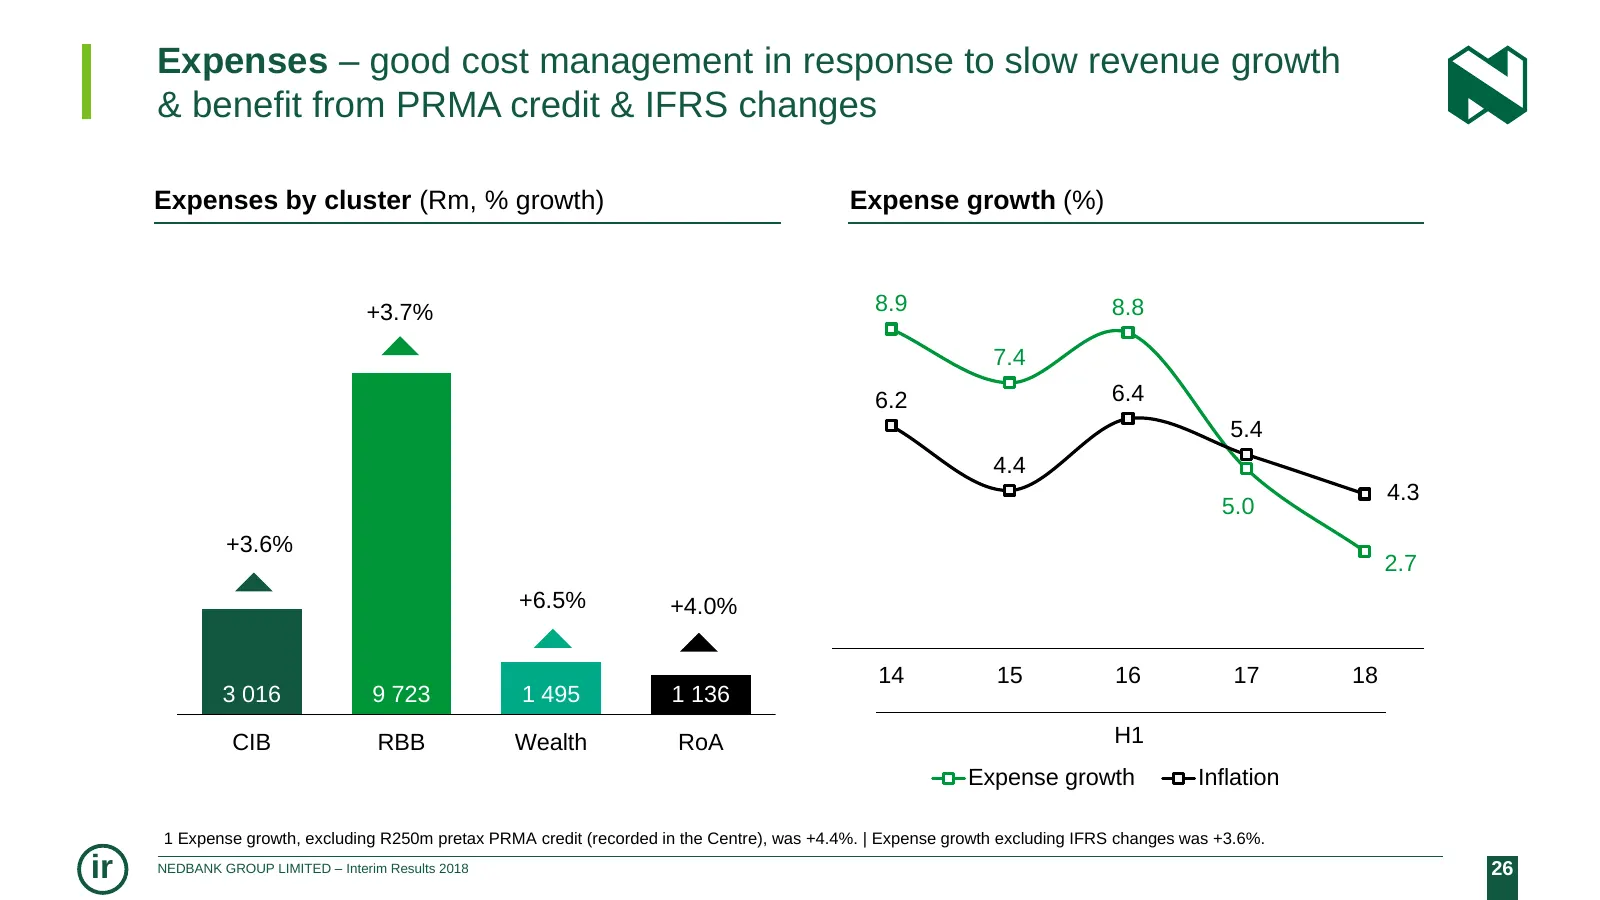
Slide 26: Expenses – good cost management in response to slow revenue growth
Expenses – good cost management in response to slow revenue growth & benefit from PRMA credit & IFRS changes Expenses by cluster (Rm, % growth) Expense growth (%) +3.7% 8.9 8.8 7.4 6.2 6.4 5.4 4.4 4.3 5.0 +3.6% 2.7 +6.5% +4.0% 14 15 16 17 18 3 016 9 723 1 495 1 136 CIB RBB Wealth RoA H1 Expense grow
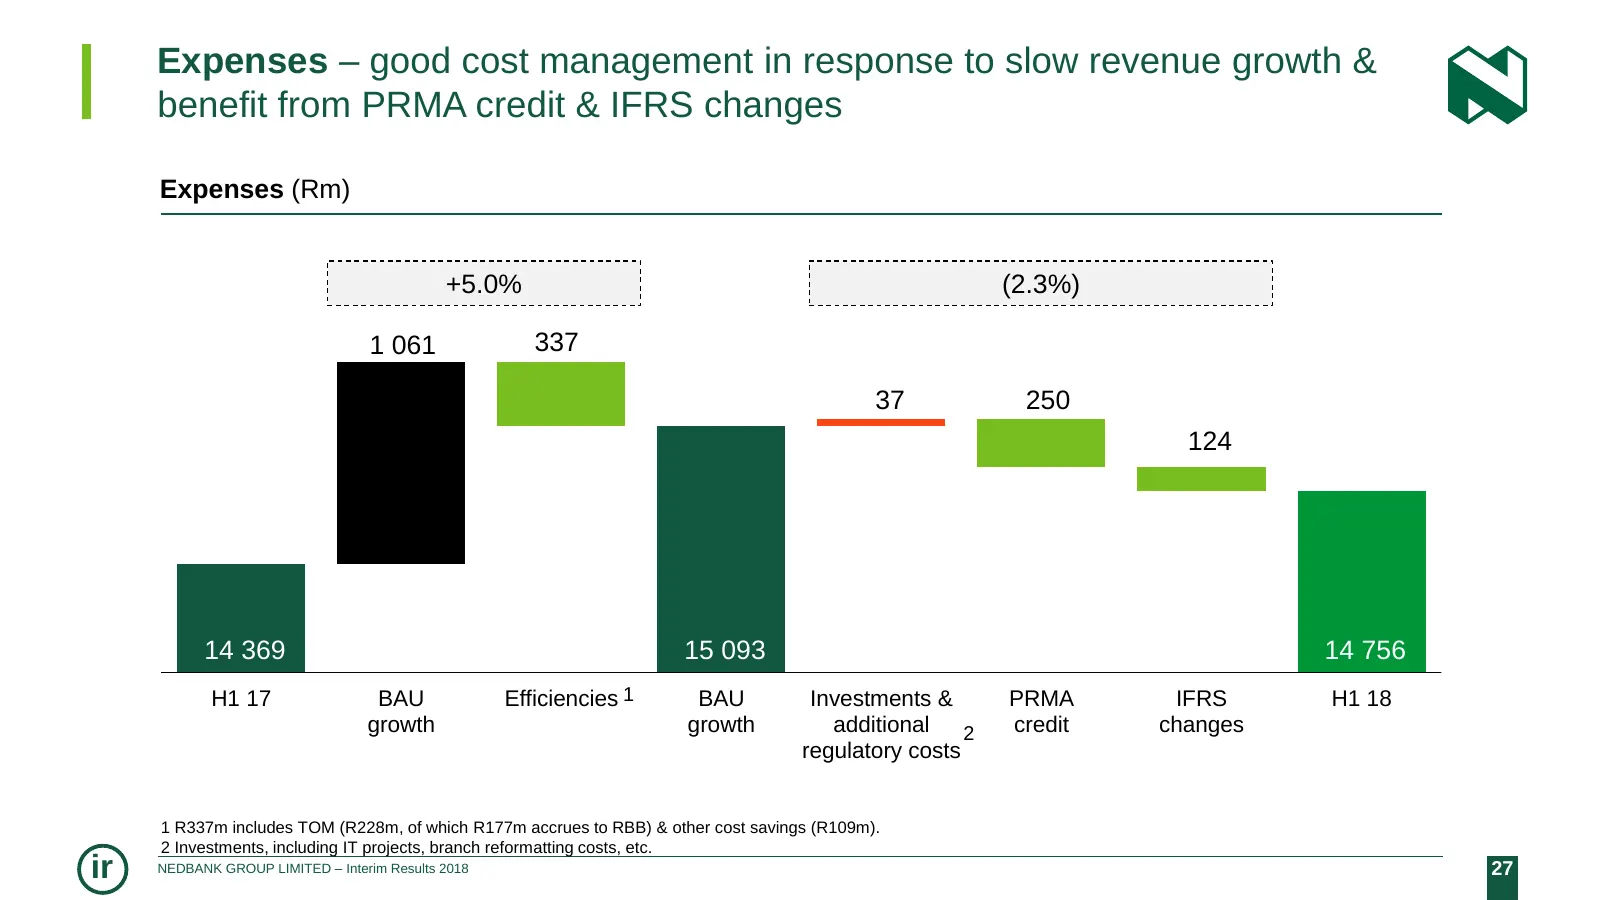
Slide 27: Expenses – good cost management, PRMA credit & IFRS changes
Expenses – good cost management in response to slow revenue growth & benefit from PRMA credit & IFRS changes Expenses (Rm) +5.0% (2.3%) 1 061 337 37 250 124 14 369 15 093 14 756 H1 17 BAU Efficiencies 1 BAU Investments & PRMA IFRS H1 18 growth growth additional 2 credit changes regulatory costs 1 R3
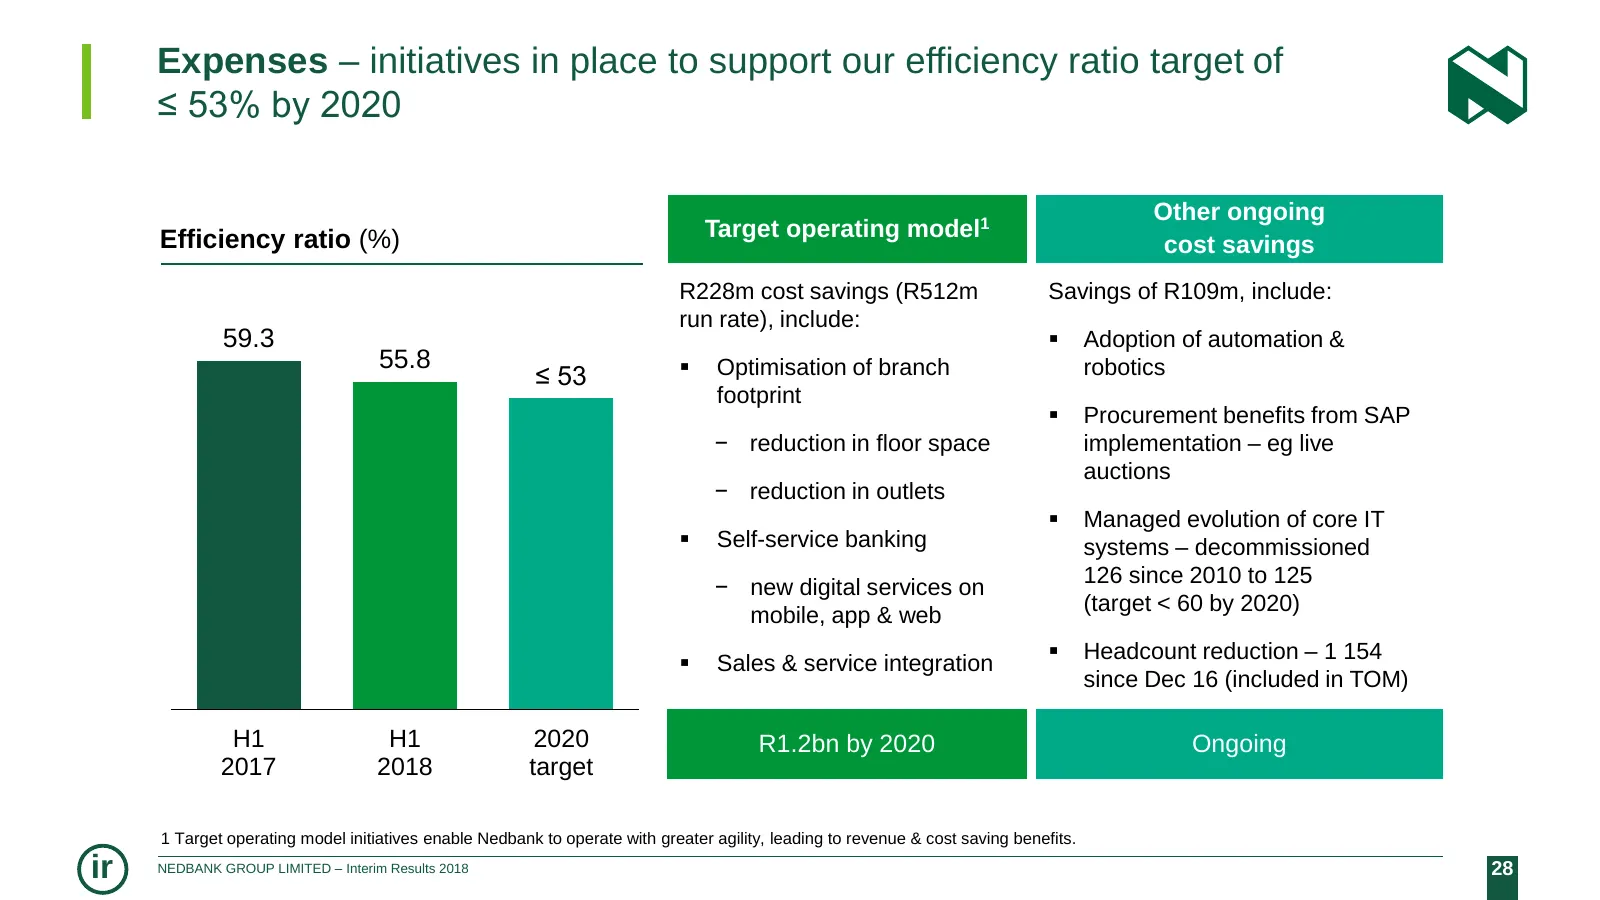
Slide 28: Expenses – initiatives to support efficiency ratio target ≤ 53%
Expenses – initiatives in place to support our efficiency ratio target of ≤ 53% by 2020 Other ongoing Efficiency ratio (%) Target operating model1 cost savings R228m cost savings (R512m Savings of R109m, include: run rate), include: 59.3 Adoption of automation & 55.8 Optimisation of branch robot
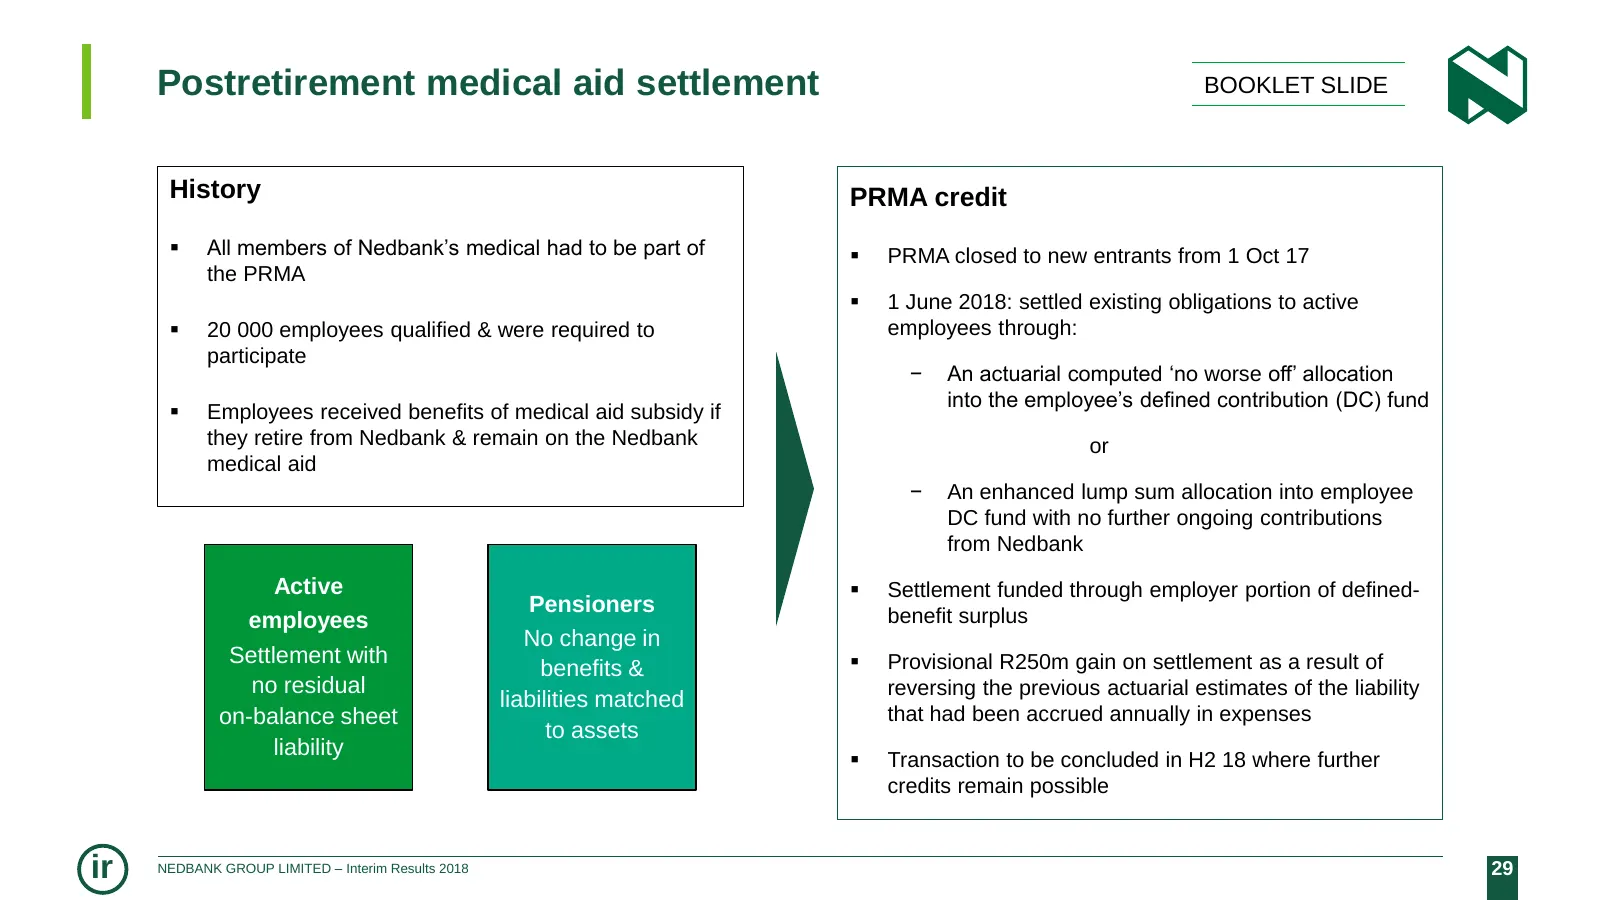
Slide 29: Postretirement medical aid settlement
Postretirement medical aid settlement BOOKLET SLIDE History PRMA credit All members of Nedbank’s medical had to be part of PRMA closed to new entrants from 1 Oct 17 the PRMA 1 June 2018: settled existing obligations to active 20 000 employees qualified & were required to employees through: p
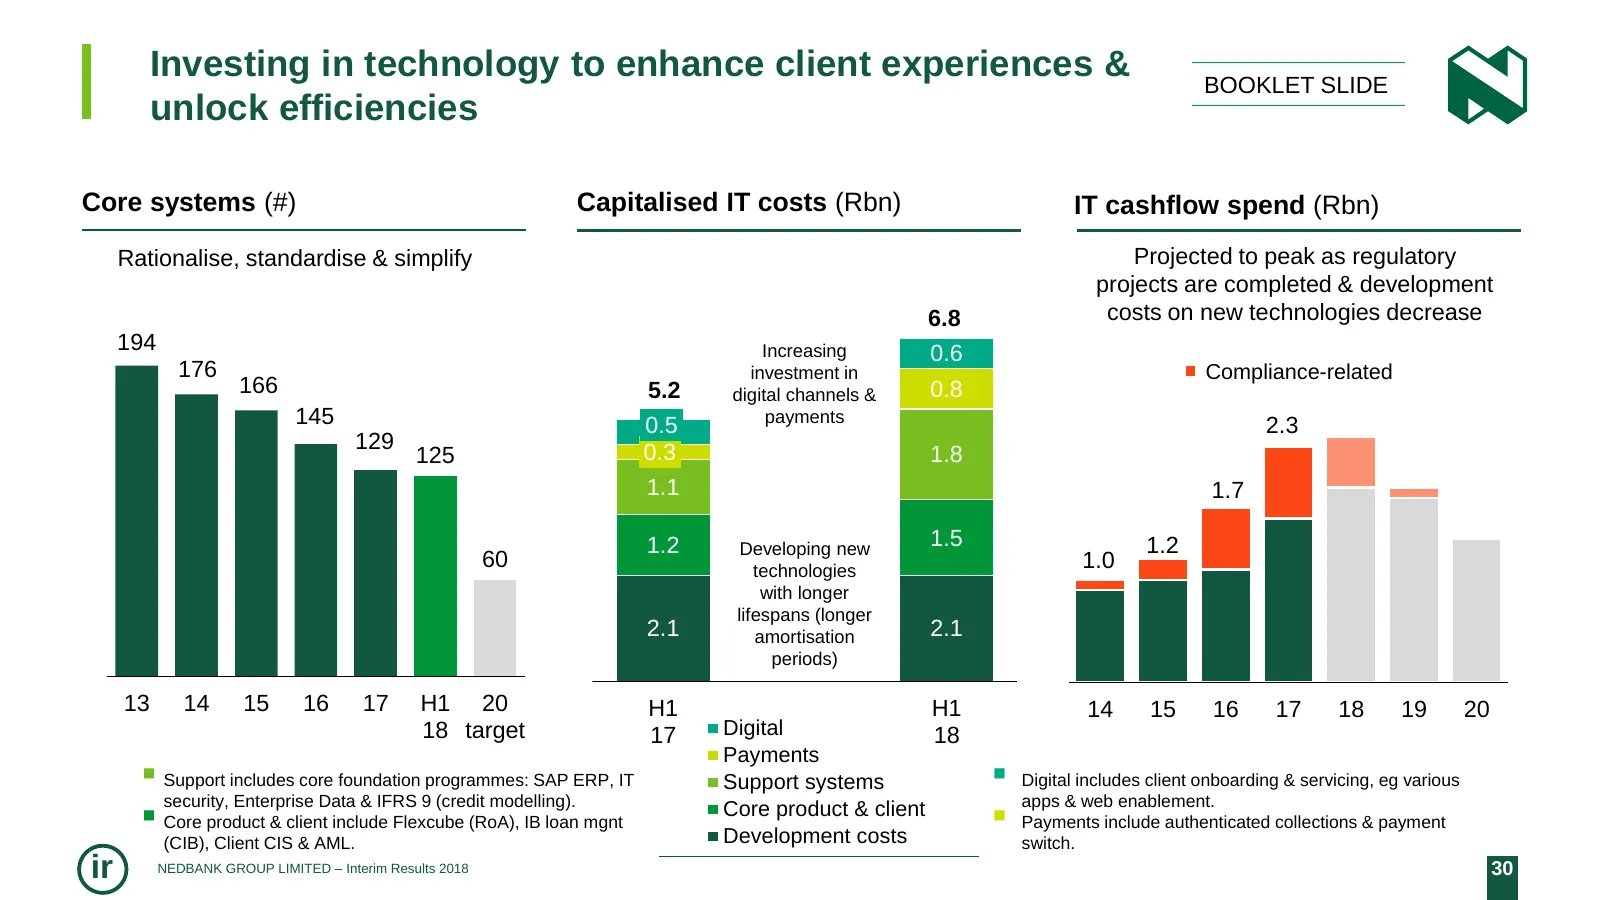
Slide 30: Investing in technology to enhance client experiences
Investing in technology to enhance client experiences & BOOKLET SLIDE unlock efficiencies Core systems (#) Capitalised IT costs (Rbn) IT cashflow spend (Rbn) Rationalise, standardise & simplify Projected to peak as regulatory projects are completed & development 6.8 costs on new technologies decreas
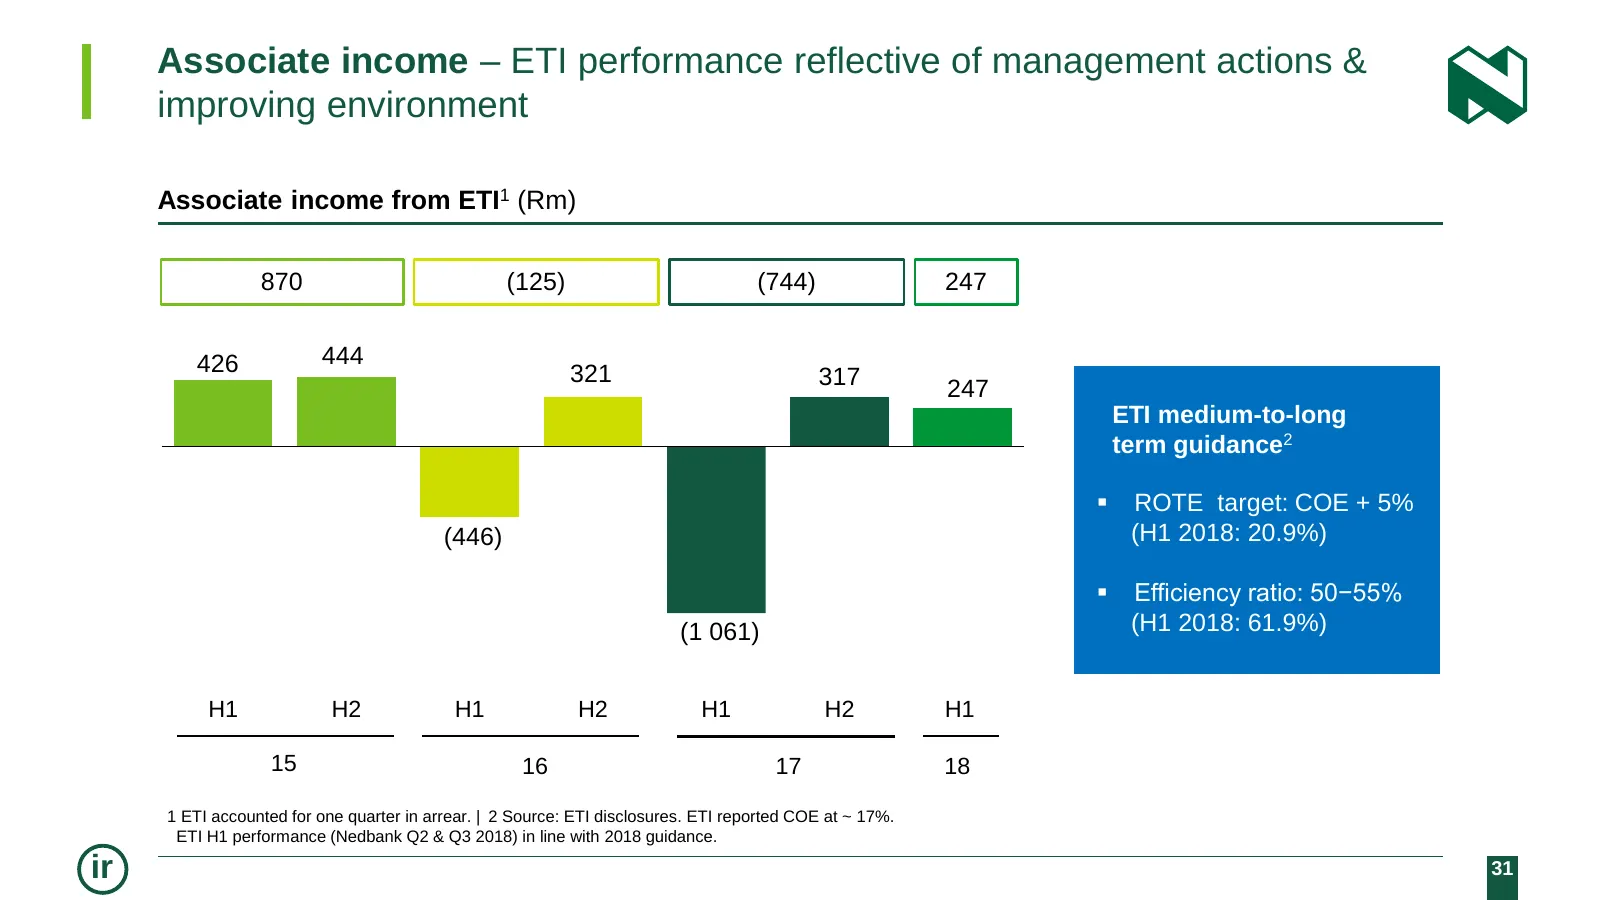
Slide 31: Associate income – ETI performance
Associate income – ETI performance reflective of management actions & improving environment Associate income from ETI1 (Rm) 870 (125) (744) 247 426 444 321 317 247 ETI medium-to-long term guidance2 ROTE target: COE + 5% (446) (H1 2018: 20.9%) Efficiency ratio: 50−55% (1 061) (H1 2018: 61.9%) H1
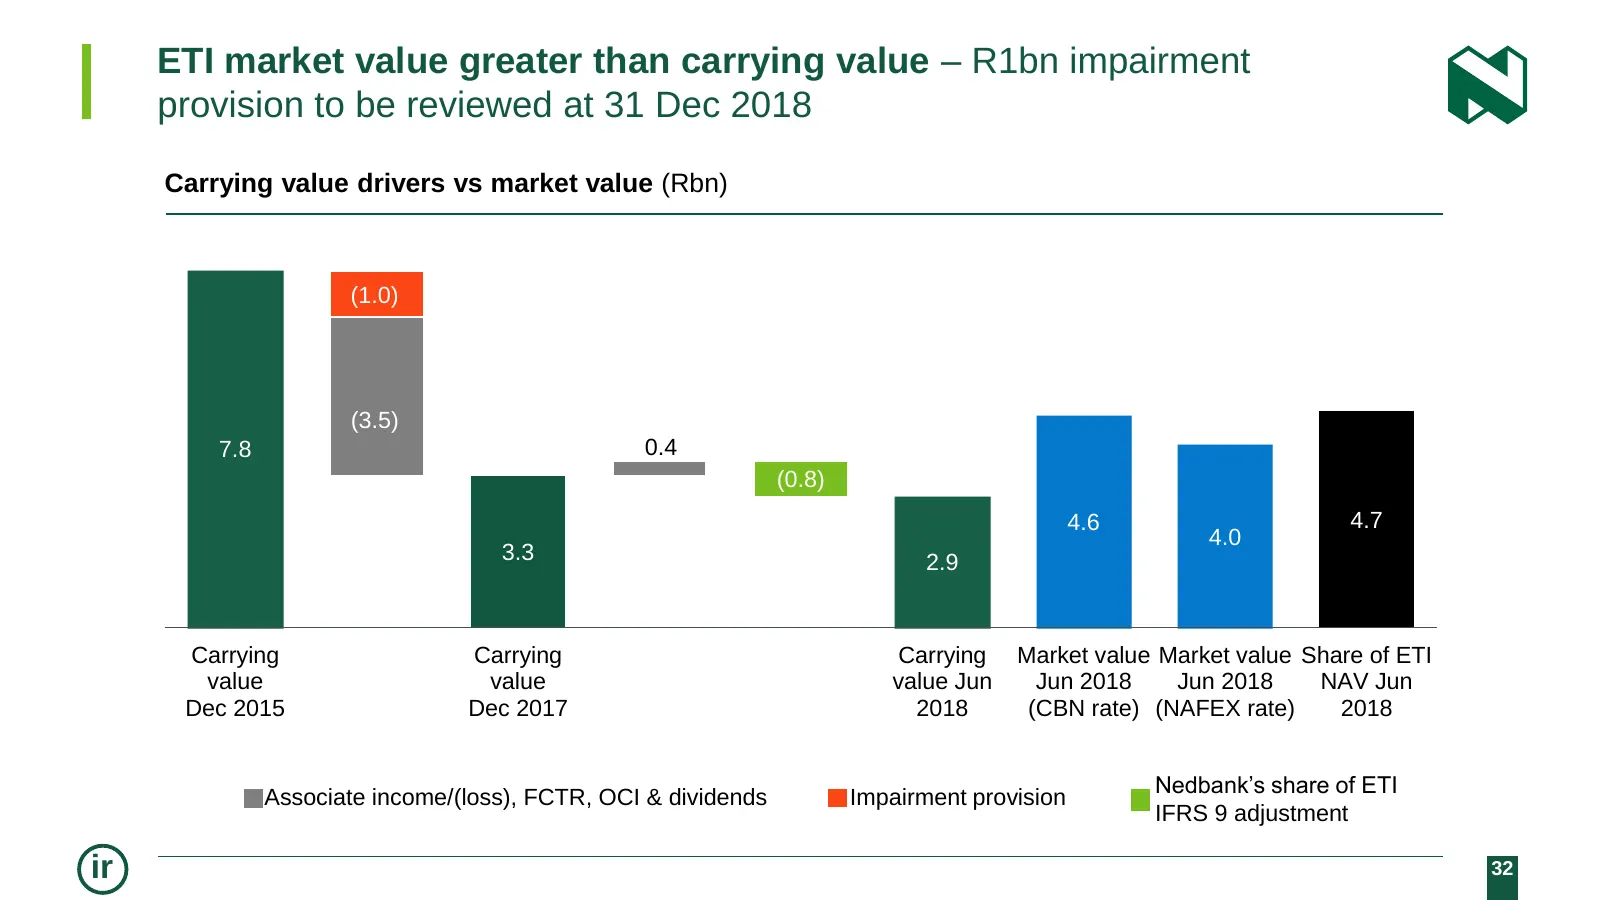
Slide 32: ETI market value greater than carrying value
ETI market value greater than carrying value – R1bn impairment provision to be reviewed at 31 Dec 2018 Carrying value drivers vs market value (Rbn) (1.0) (3.5) 7.8 0.4 (0.8) 4.6 4.7 4.0 3.3 2.9 Carrying Carrying Carrying Market value Market value Share of ETI value value value Jun Jun 2018 Jun 2018
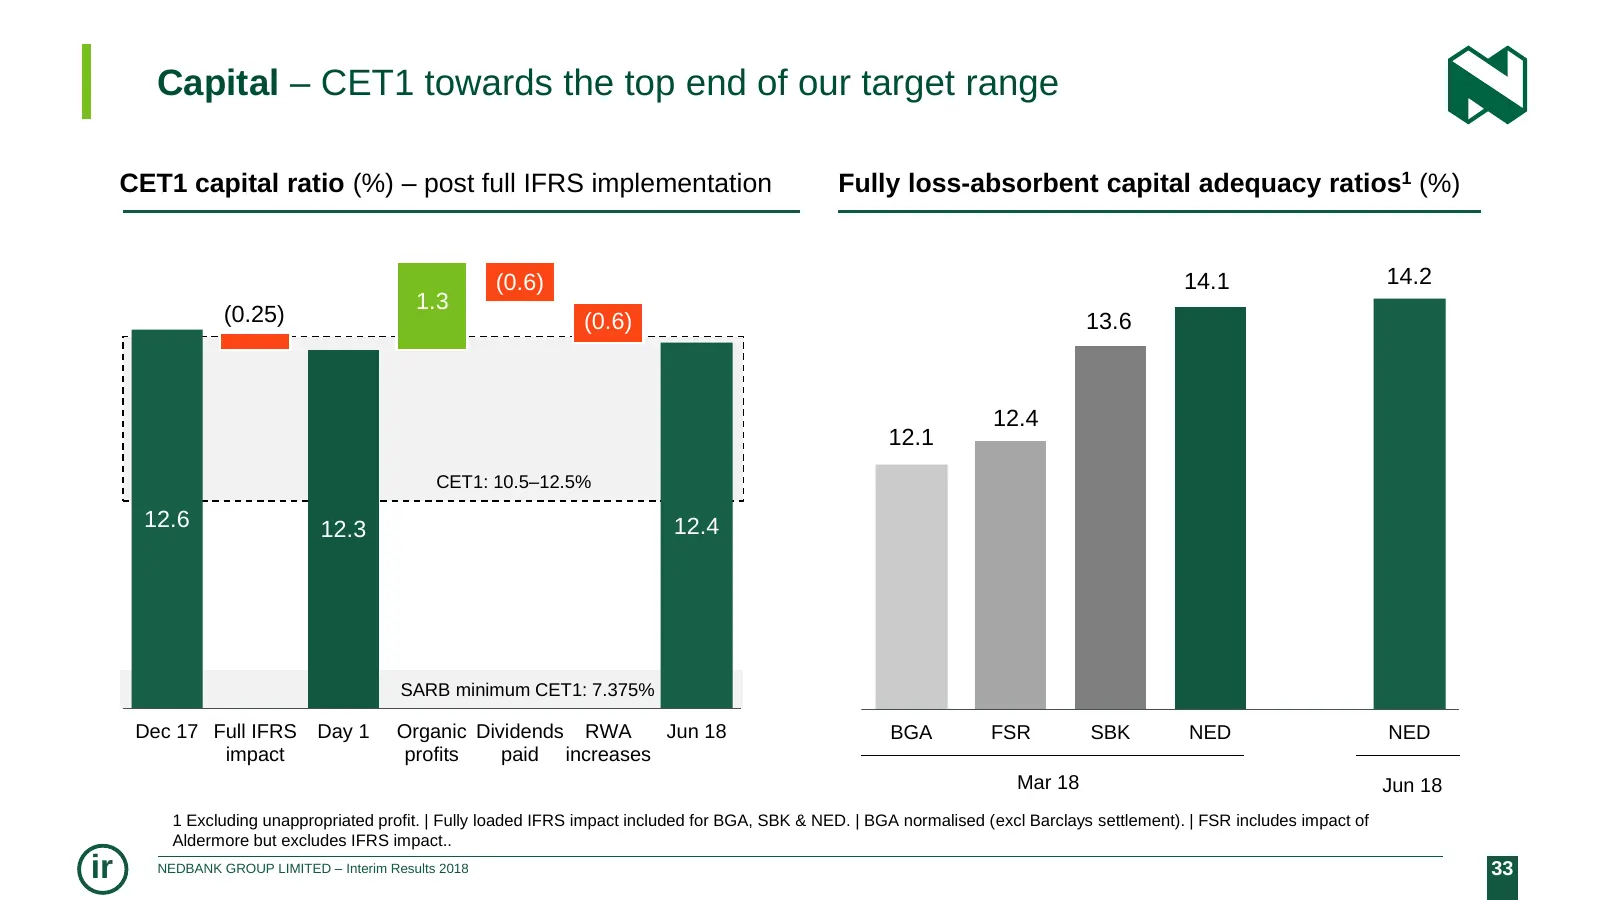
Slide 33: Capital – CET1 towards top end of target range
Capital – CET1 towards the top end of our target range CET1 capital ratio (%) – post full IFRS implementation Fully loss-absorbent capital adequacy ratios1 (%) (0.6) 14.1 14.2 1.3 (0.25) (0.6) 13.6 12.4 12.1 CET1: 10.5–12.5% 12.6 12.3 12.4 SARB minimum CET1: 7.375% Dec 17 Full IFRS Day 1 Organic Div
Slide 34: IFRS 9 & 15 impact on CET 1 ratio
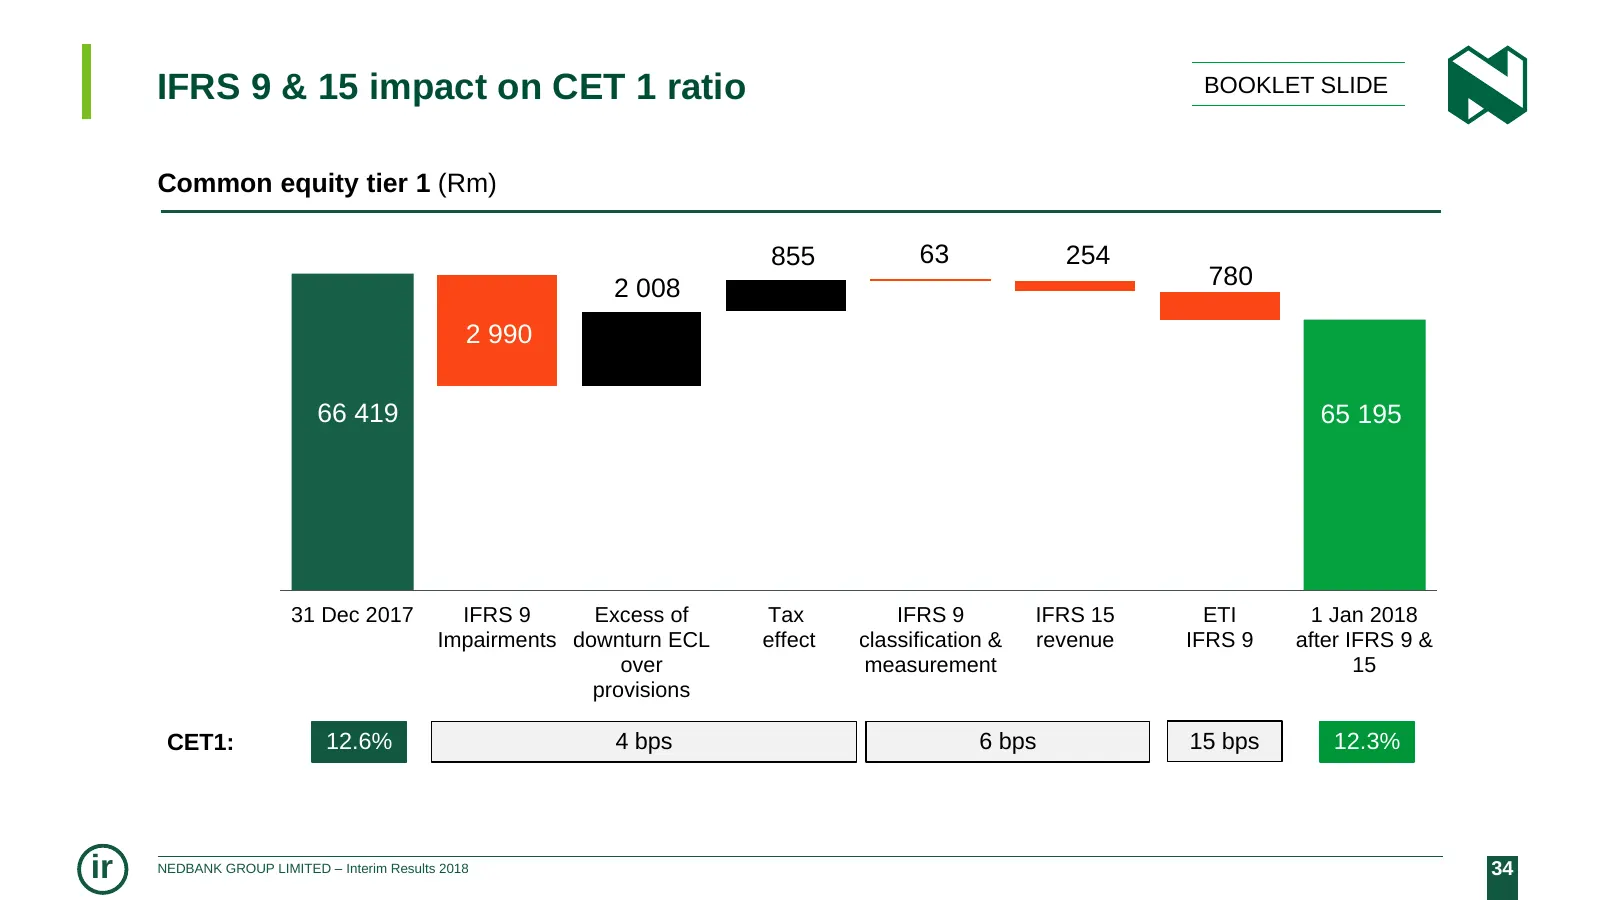
IFRS 9 & 15 impact on CET 1 ratio BOOKLET SLIDE Common equity tier 1 (Rm) 855 63 254 2 008 780 2 990 66 419 65 195 31 Dec 2017 IFRS 9 Excess of Tax IFRS 9 IFRS 15 ETI 1 Jan 2018 Impairments downturn ECL effect classification & revenue IFRS 9 after IFRS 9 & over measurement 15 provisions CET1: 12.6%
Slide 35: Dividend – dividend cover within target range
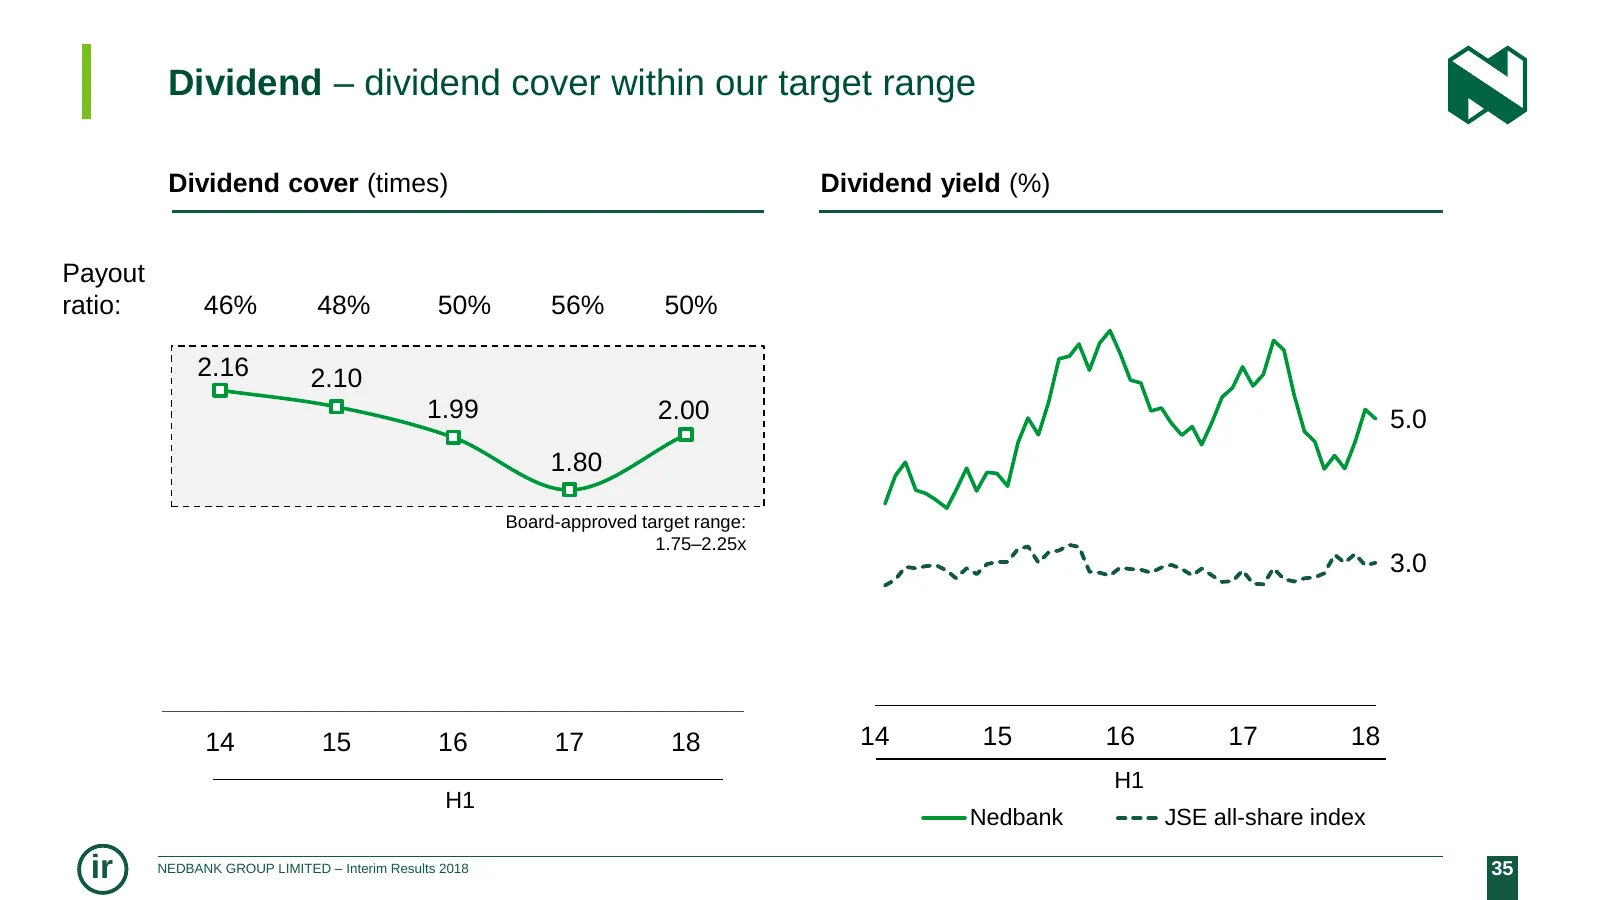
Dividend – dividend cover within our target range Dividend cover (times) Dividend yield (%) Payout ratio: 46% 48% 50% 56% 50% 2.16 2.10 1.99 2.00 5.0 1.80 Board-approved target range: 1.75–2.25x 3.0 14 15 16 17 18 14 15 16 17 18 H1 H1 Nedbank JSE all-share index ir NEDBANK GROUP LIMITED – Interim Re
Slide 36: Strong performance from Rest of Africa
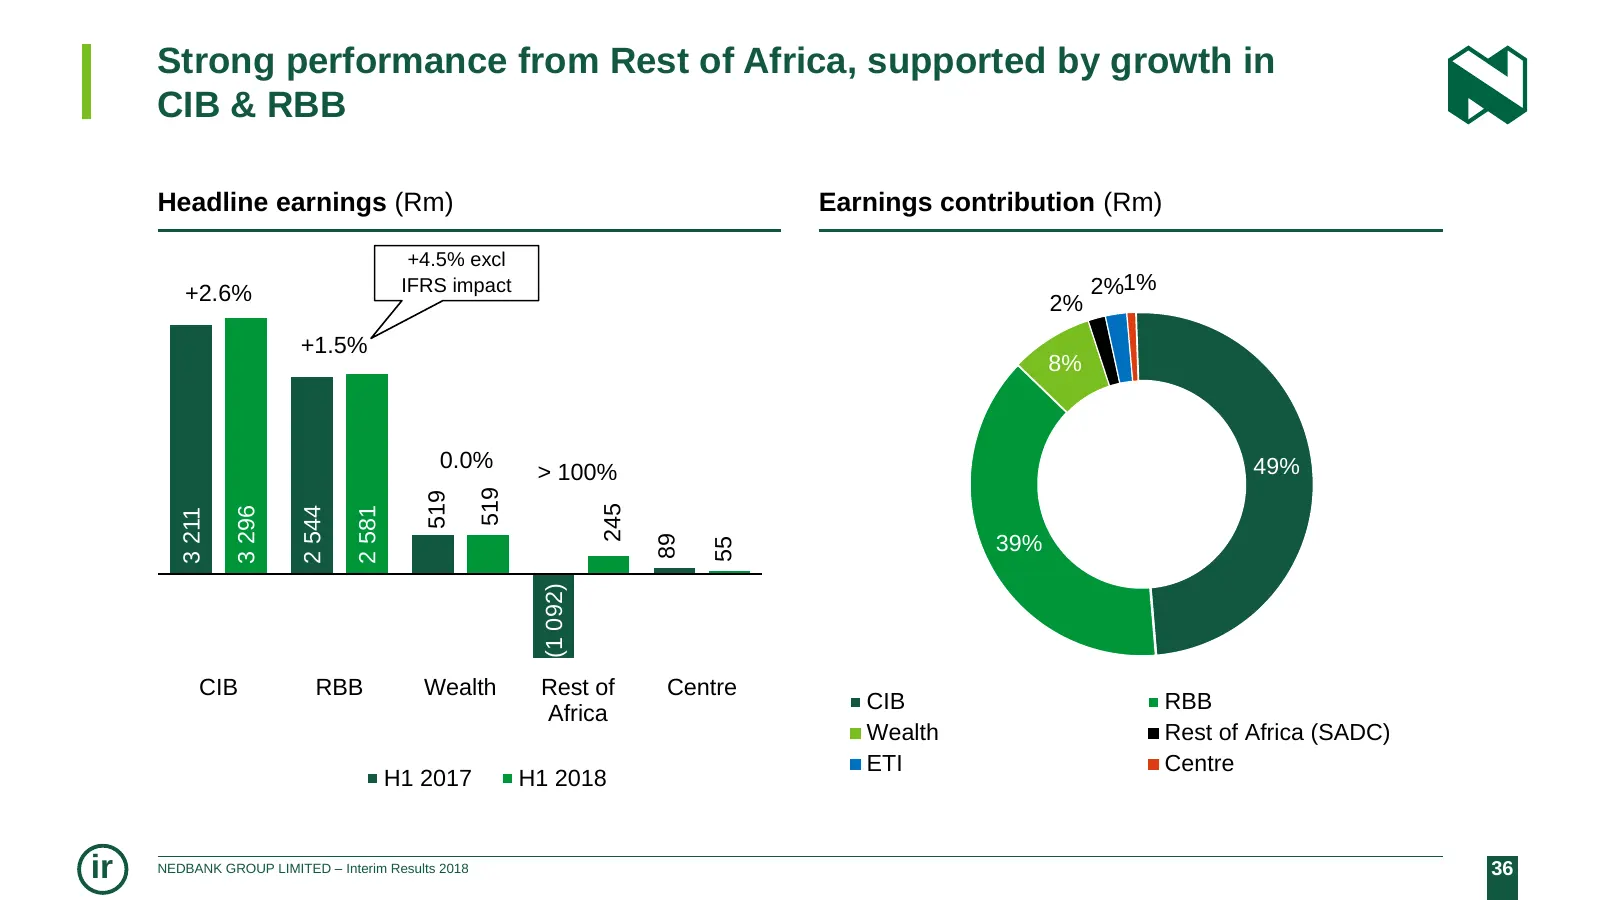
Strong performance from Rest of Africa, supported by growth in CIB & RBB Headline earnings (Rm) Earnings contribution (Rm) +4.5% excl +2.6% IFRS impact 2%1% 2% +1.5% 8% 0.0% 49% > 100% 519 519 245 2 544 3 296 2 581 3 211 89 39% 55 (1 092) CIB RBB Wealth Rest of Centre CIB RBB Africa Wealth Rest of A
Slide 37: Return on equity drivers
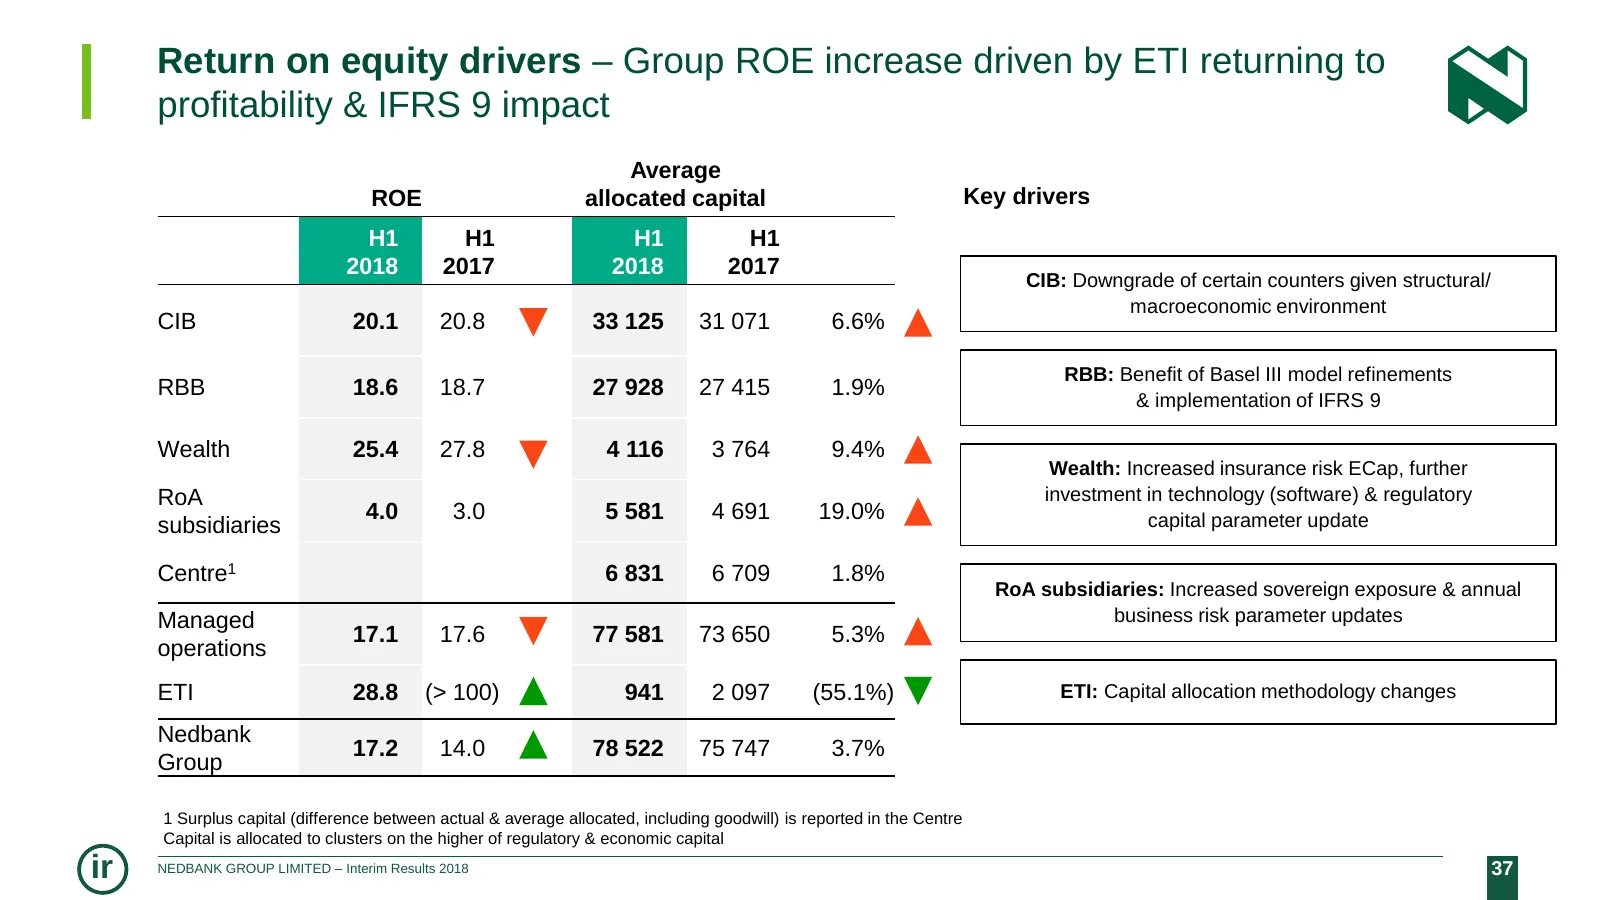
Return on equity drivers – Group ROE increase driven by ETI returning to profitability & IFRS 9 impact Average ROE allocated capital Key drivers H1 H1 H1 H1 2018 2017 2018 2017 CIB: Downgrade of certain counters given structural/ macroeconomic environment CIB 20.1 20.8 33 125 31 071 6.6% RBB: Benefi
Slide 38: Nedbank Corporate and Investment Banking
NEDBANK CORPORATE AND INVESTMENT BANKING Positive earnings growth in a slow environment BRIAN KENNEDY ir NEDBANK GROUP LIMITED – Interim Results 2018 38
Slide 39: CIB: Positive earnings growth in a slow environment
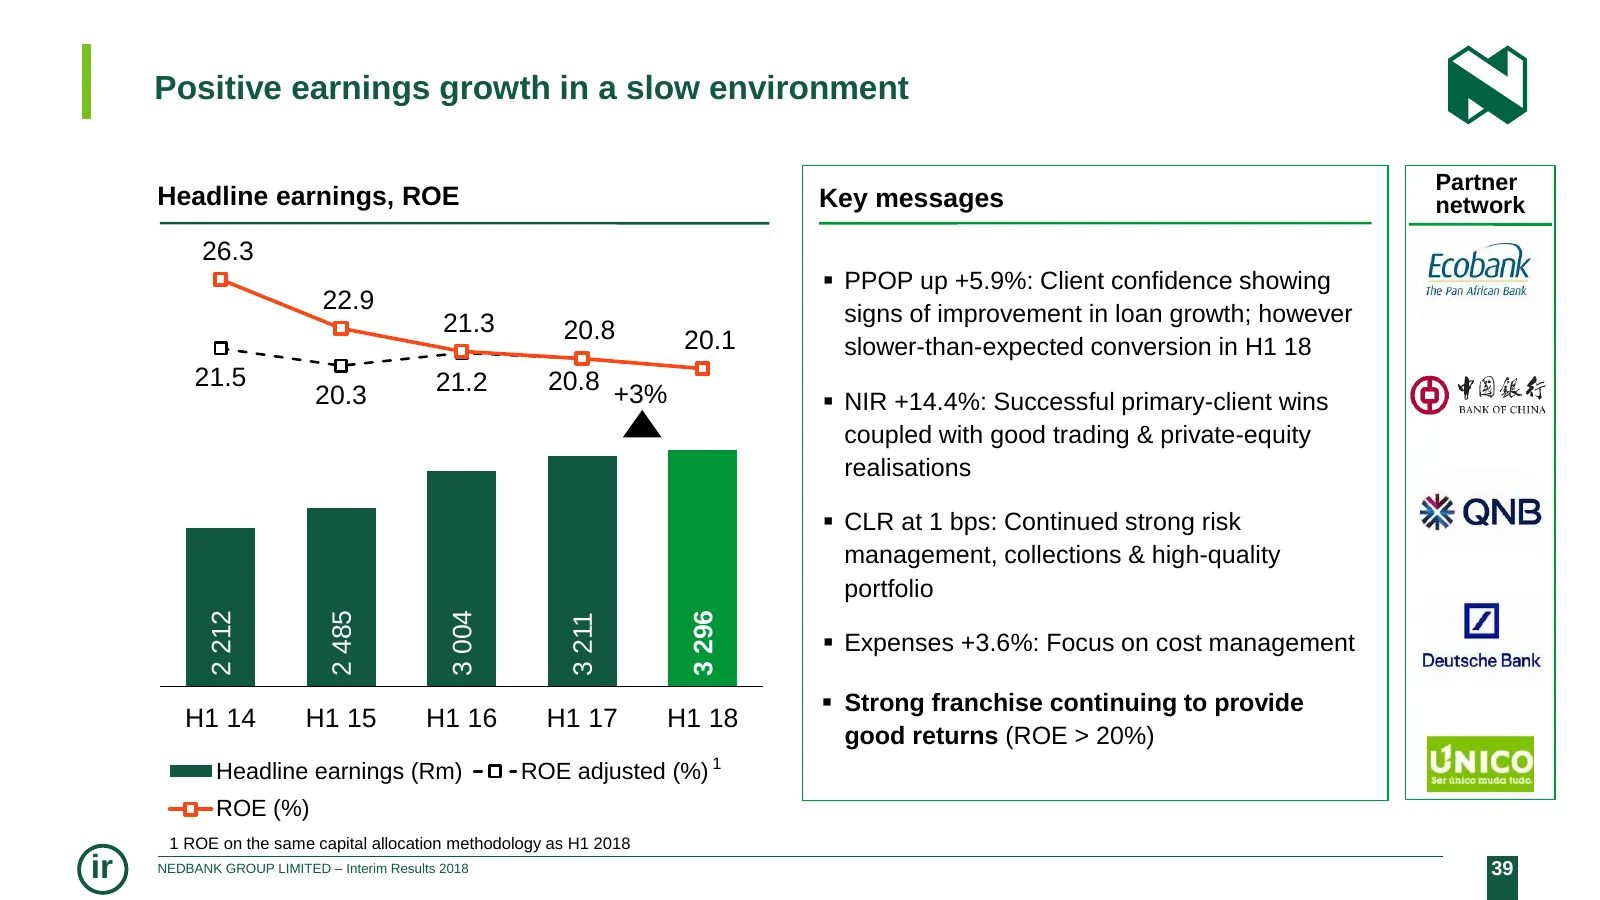
Positive earnings growth in a slow environment Partner Headline earnings, ROE Key messages network 6 000 26.3 28.0 PPOP up +5.9%: Client confidence showing 22.9 21.3 signs of improvement in loan growth; however 5 000 20.8 20.1 23.0 slower-than-expected conversion in H1 18 21.5 21.2 20.8 4 000 20.3
Slide 40: CIB – financial highlights
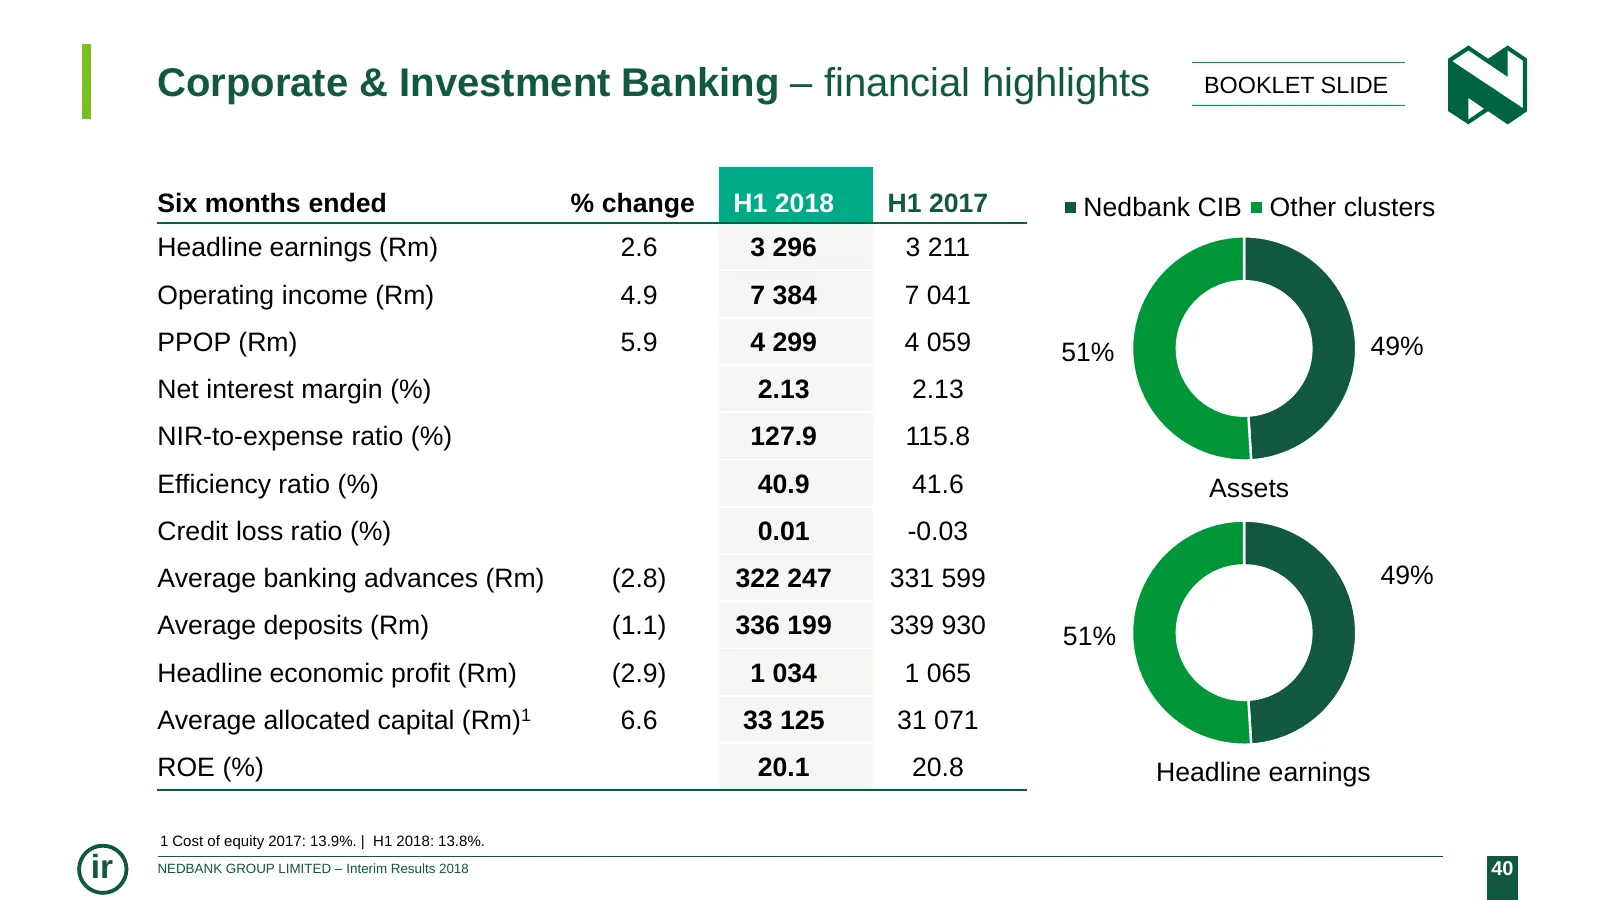
Corporate & Investment Banking – financial highlights BOOKLET SLIDE Six months ended % change H1 2018 H1 2017 Nedbank CIB Other clusters Headline earnings (Rm) 2.6 3 296 3 211 Operating income (Rm) 4.9 7 384 7 041 PPOP (Rm) 5.9 4 299 4 059 51% 49% Net interest margin (%) 2.13 2.13 NIR-to-expense rat
Slide 41: CIB business unit – financial highlights
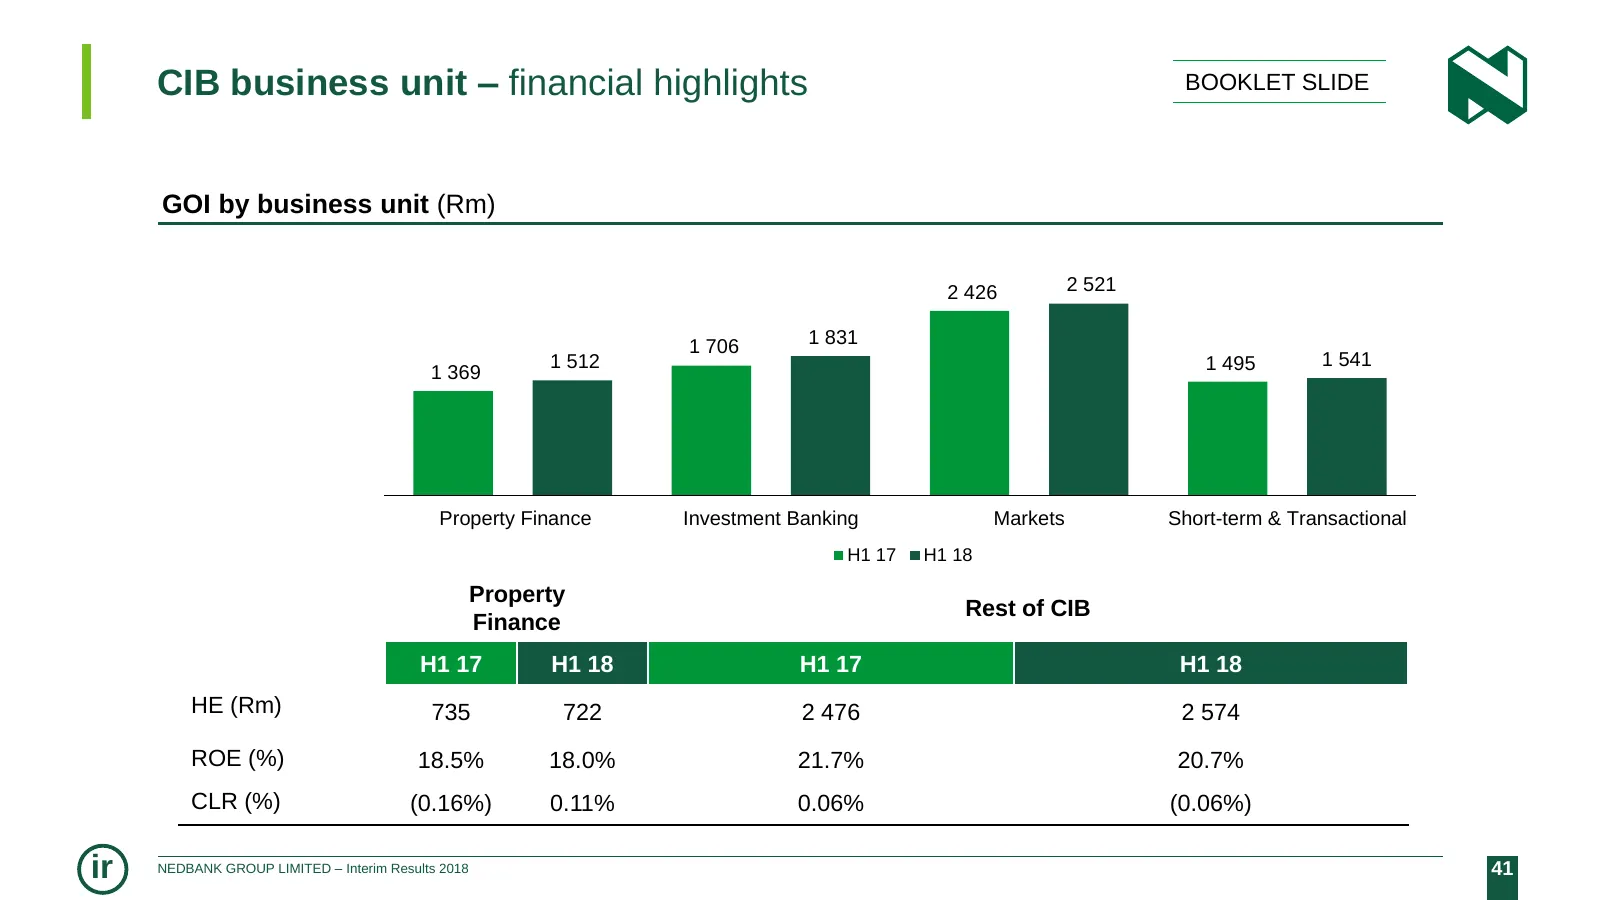
CIB business unit – financial highlights BOOKLET SLIDE GOI by business unit (Rm) 2 426 2 521 1 706 1 831 1 512 1 495 1 541 1 369 Property Finance Investment Banking Markets Short-term & Transactional H1 17 H1 18 Property Rest of CIB Finance H1 17 H1 18 H1 17 H1 18 HE (Rm) 735 722 2 476 2 574 ROE (%)
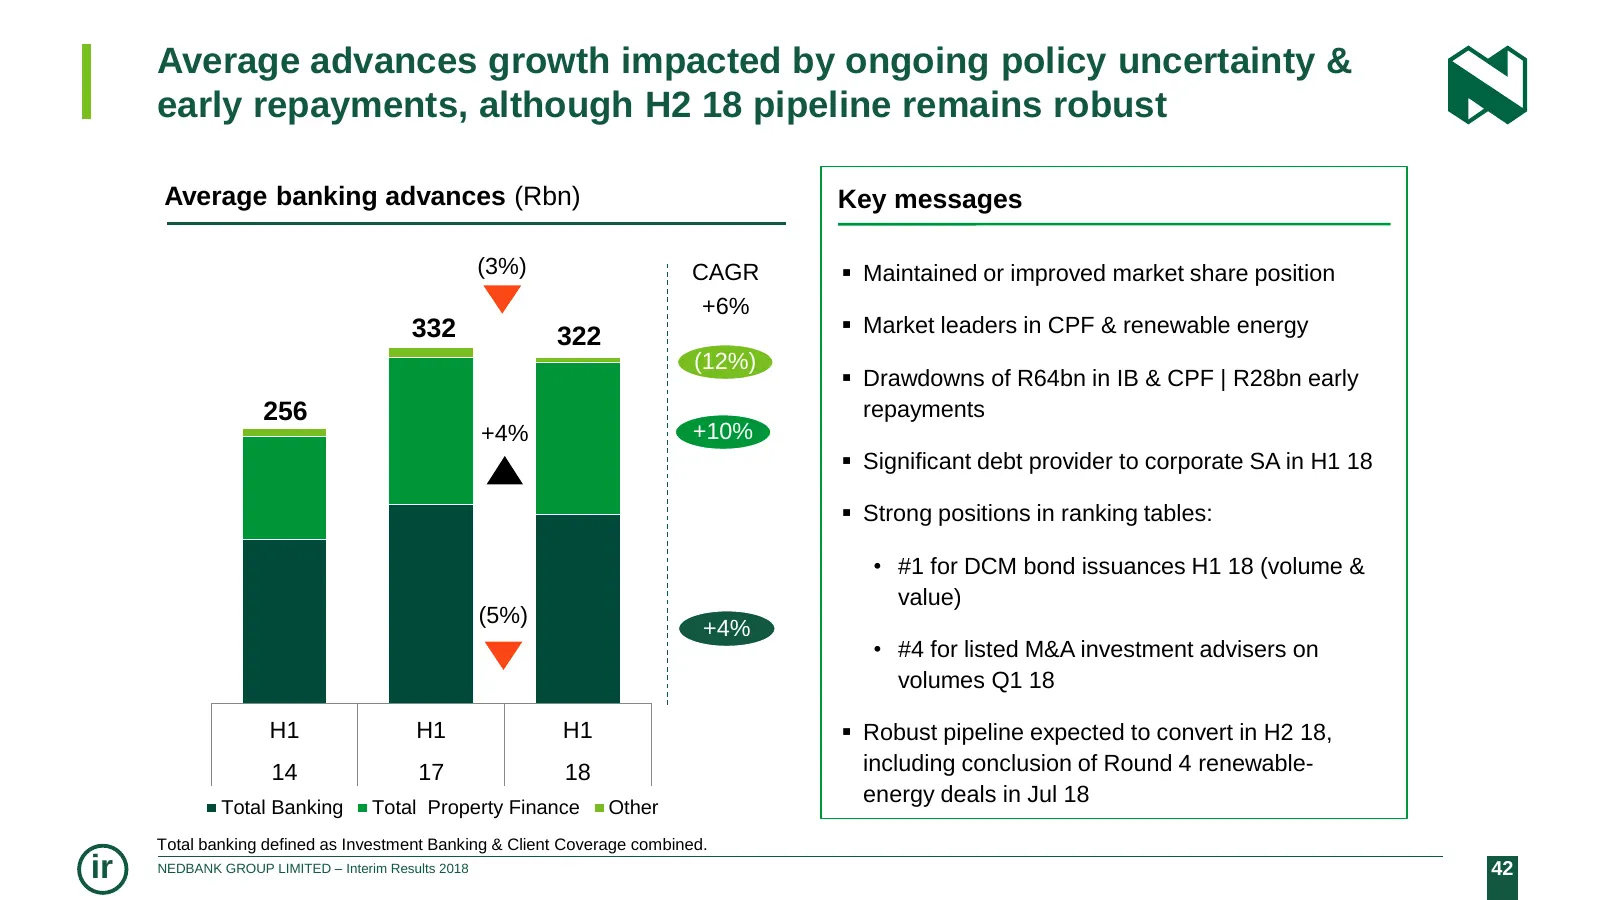
Slide 42: Average advances growth impacted by policy uncertainty
Average advances growth impacted by ongoing policy uncertainty & early repayments, although H2 18 pipeline remains robust Average banking advances (Rbn) Key messages (3%) CAGR Maintained or improved market share position +6% 332 322 Market leaders in CPF & renewable energy (12%) Drawdowns of R
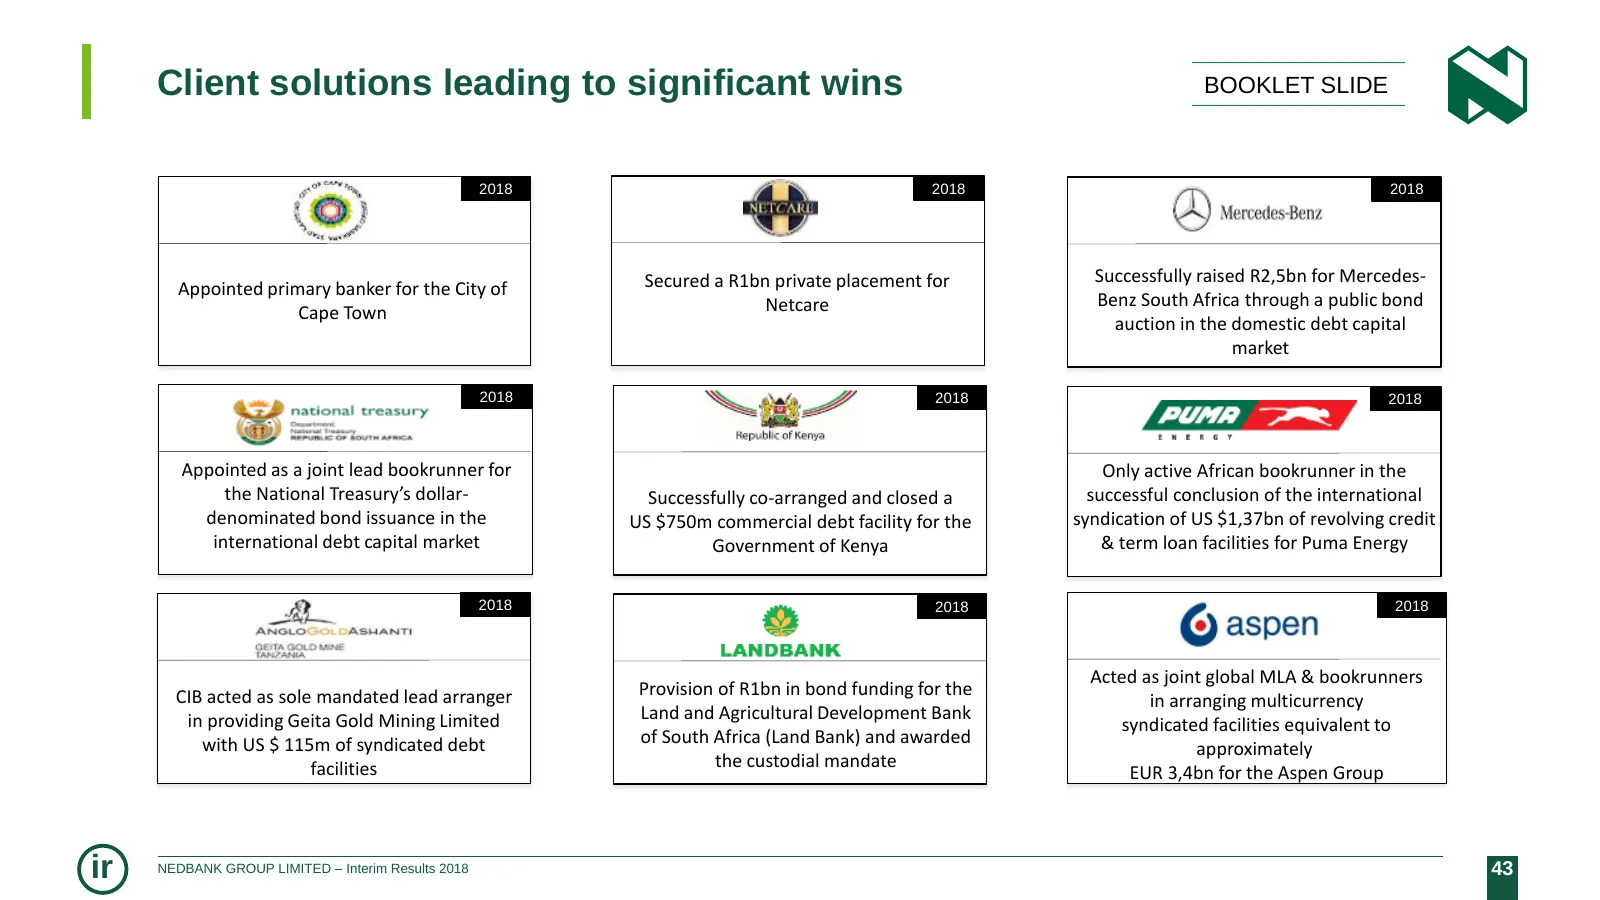
Slide 43: Client solutions leading to significant wins
Client solutions leading to significant wins BOOKLET SLIDE 2018 2018 2018 Secured a R1bn private placement for Successfully raised R2,5bn for Mercedes- Appointed primary banker for the City of Netcare Benz South Africa through a public bond Cape Town auction in the domestic debt capital market 2018
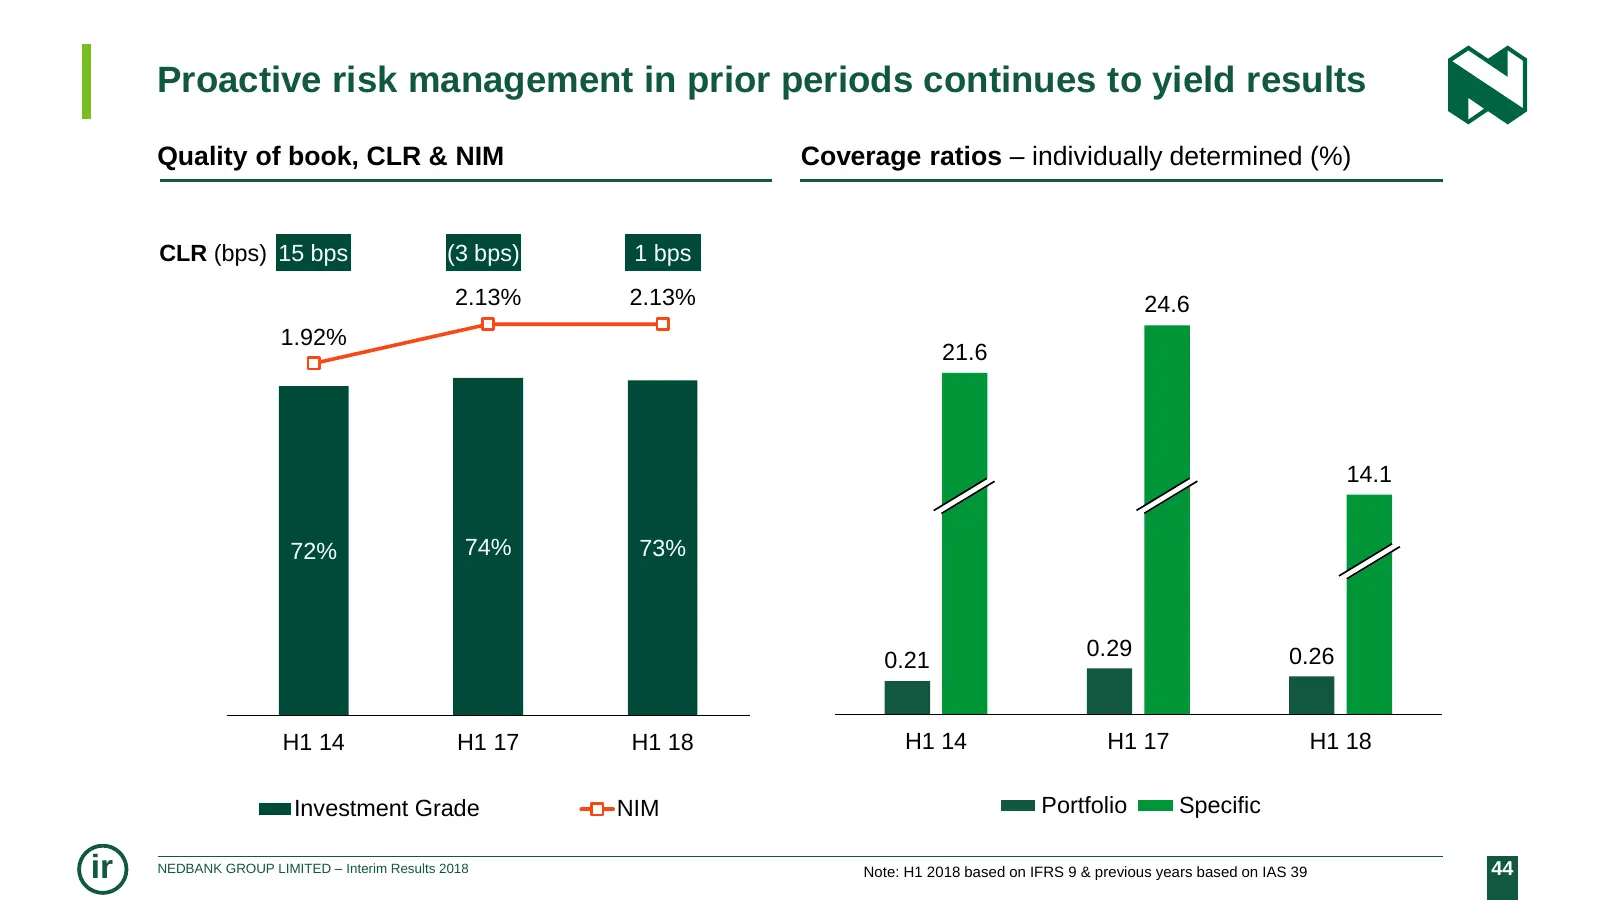
Slide 44: Proactive risk management continues to yield results
Proactive risk management in prior periods continues to yield results Quality of book, CLR & NIM Coverage ratios – individually determined (%) CLR 100% (bps) 15 bps (3 bps) 1 bps 2.50% 2.13% 2.13% 24.6 80% 1.92% 2.00% 21.6 60% 1.50% 14.1 40% 1.00% 72% 74% 73% 20% 0.50% 0.29 0.26 0.21 0% 0.00% H1 14
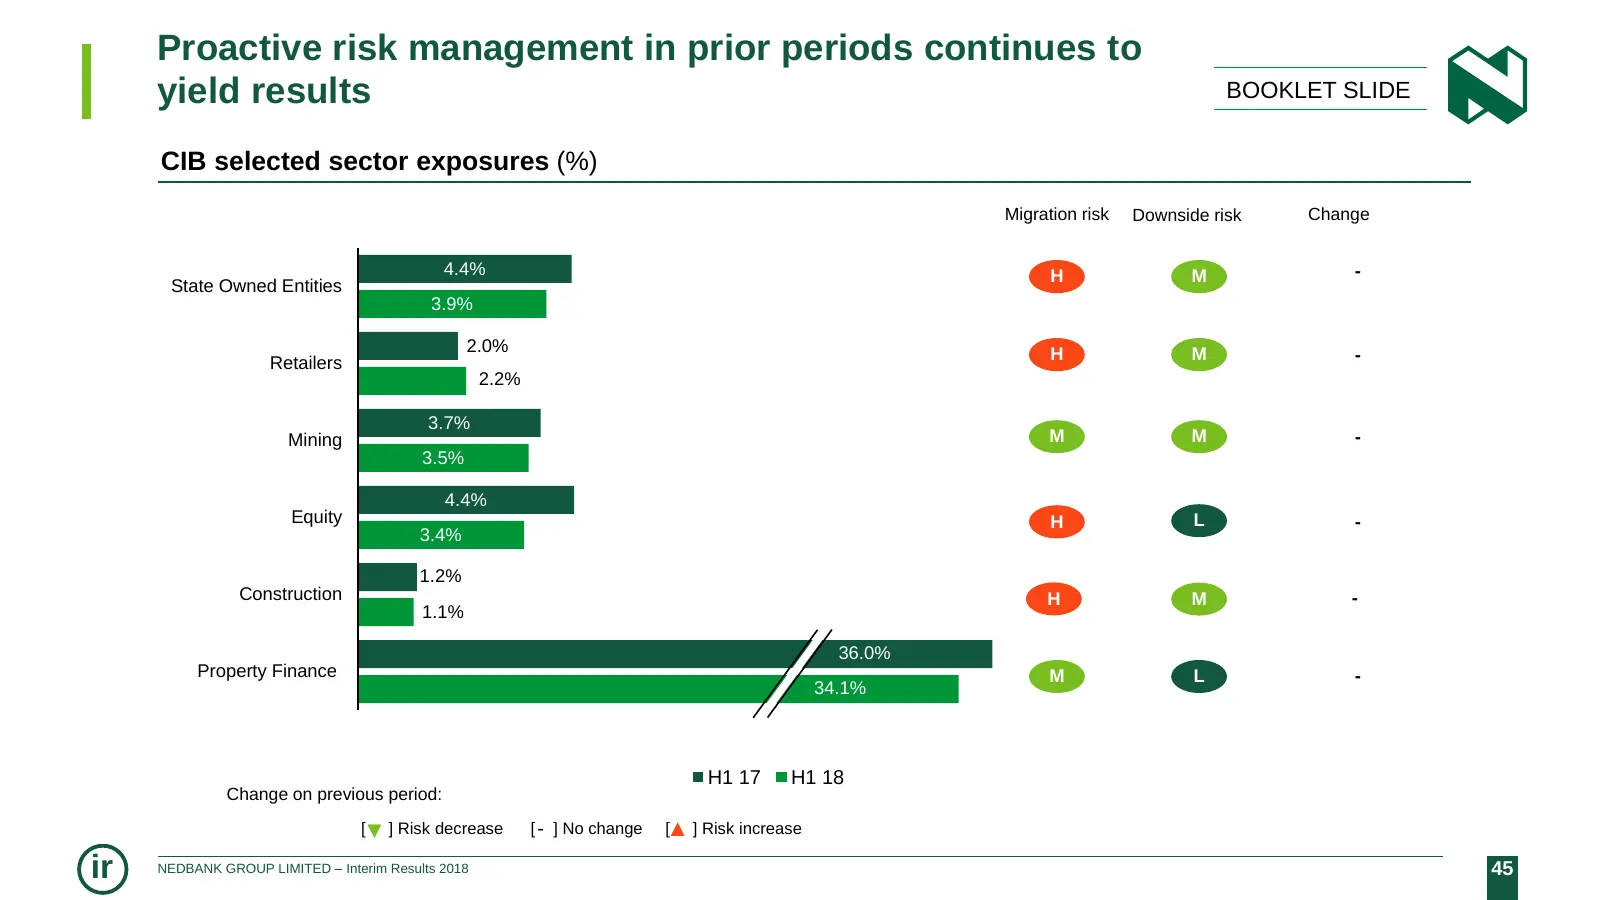
Slide 45: CIB selected sector exposures
Proactive risk management in prior periods continues to yield results BOOKLET SLIDE CIB selected sector exposures (%) Migration risk Downside risk Change 4.4% H M - State Owned Entities 3.9% 2.0% H M - Retailers 2.2% 3.7% Mining M M - 3.5% 4.4% Equity H L - 3.4% 1.2% Construction H M - 1.1% 36.0% Pr
Slide 46: Quality commercial property book
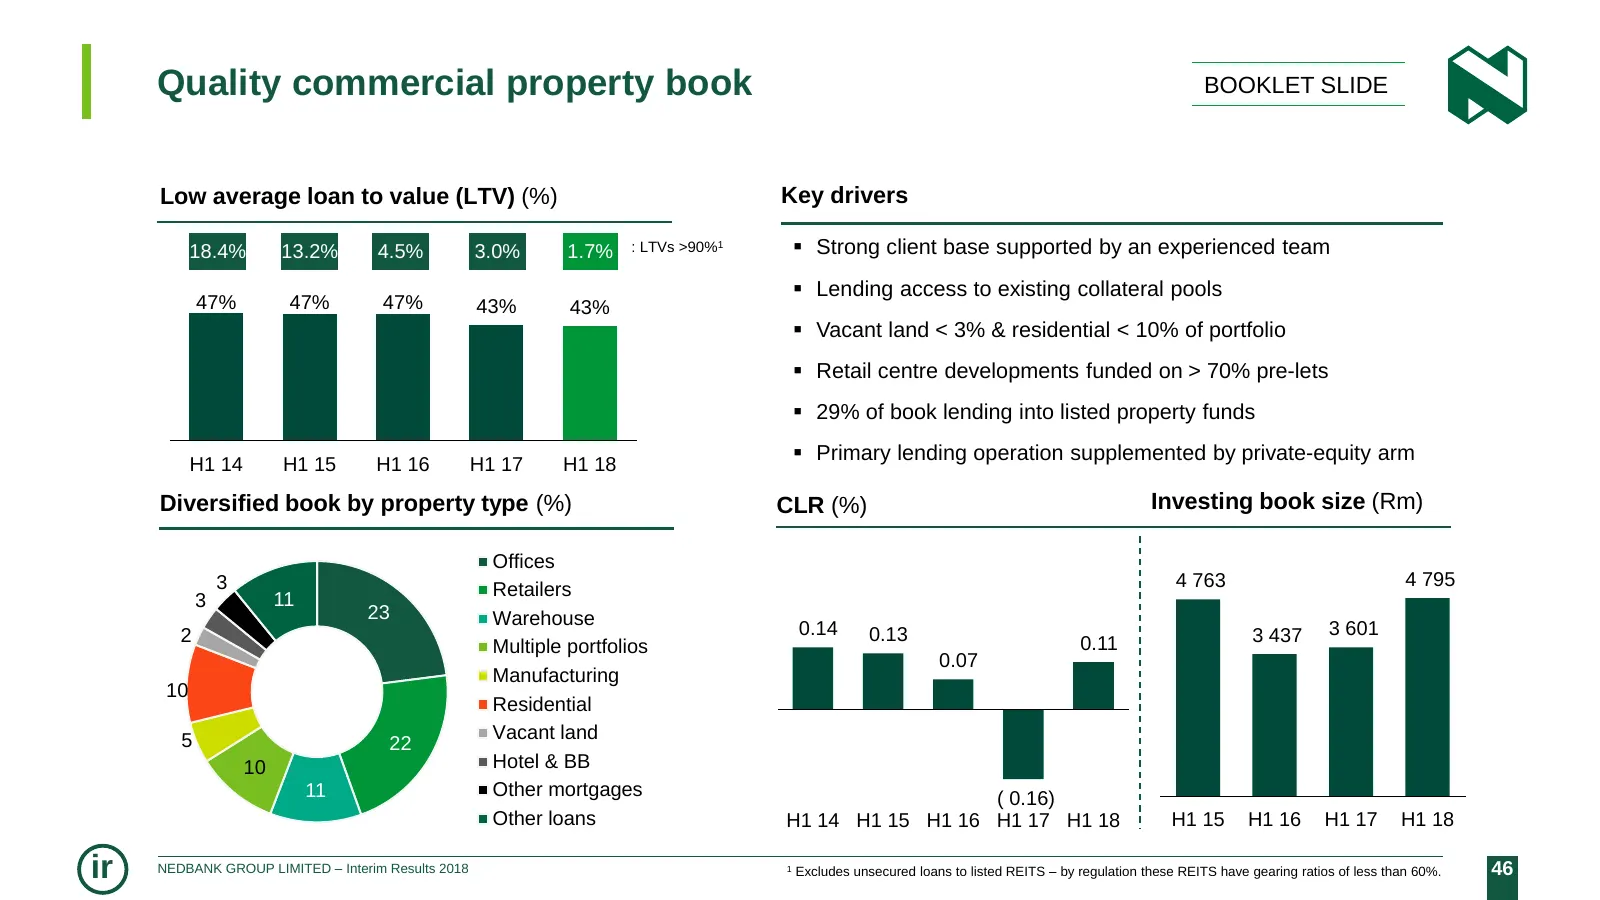
Quality commercial property book BOOKLET SLIDE Low average loan to value (LTV) (%) Key drivers 18.4% 13.2% 4.5% 3.0% 1.7% : LTVs >90%1 Strong client base supported by an experienced team Lending access to existing collateral pools 47% 47% 47% 43% 43% Vacant land < 3% & residential < 10% of por
Slide 47: Excellent NIR growth supported by trading & transactional gains
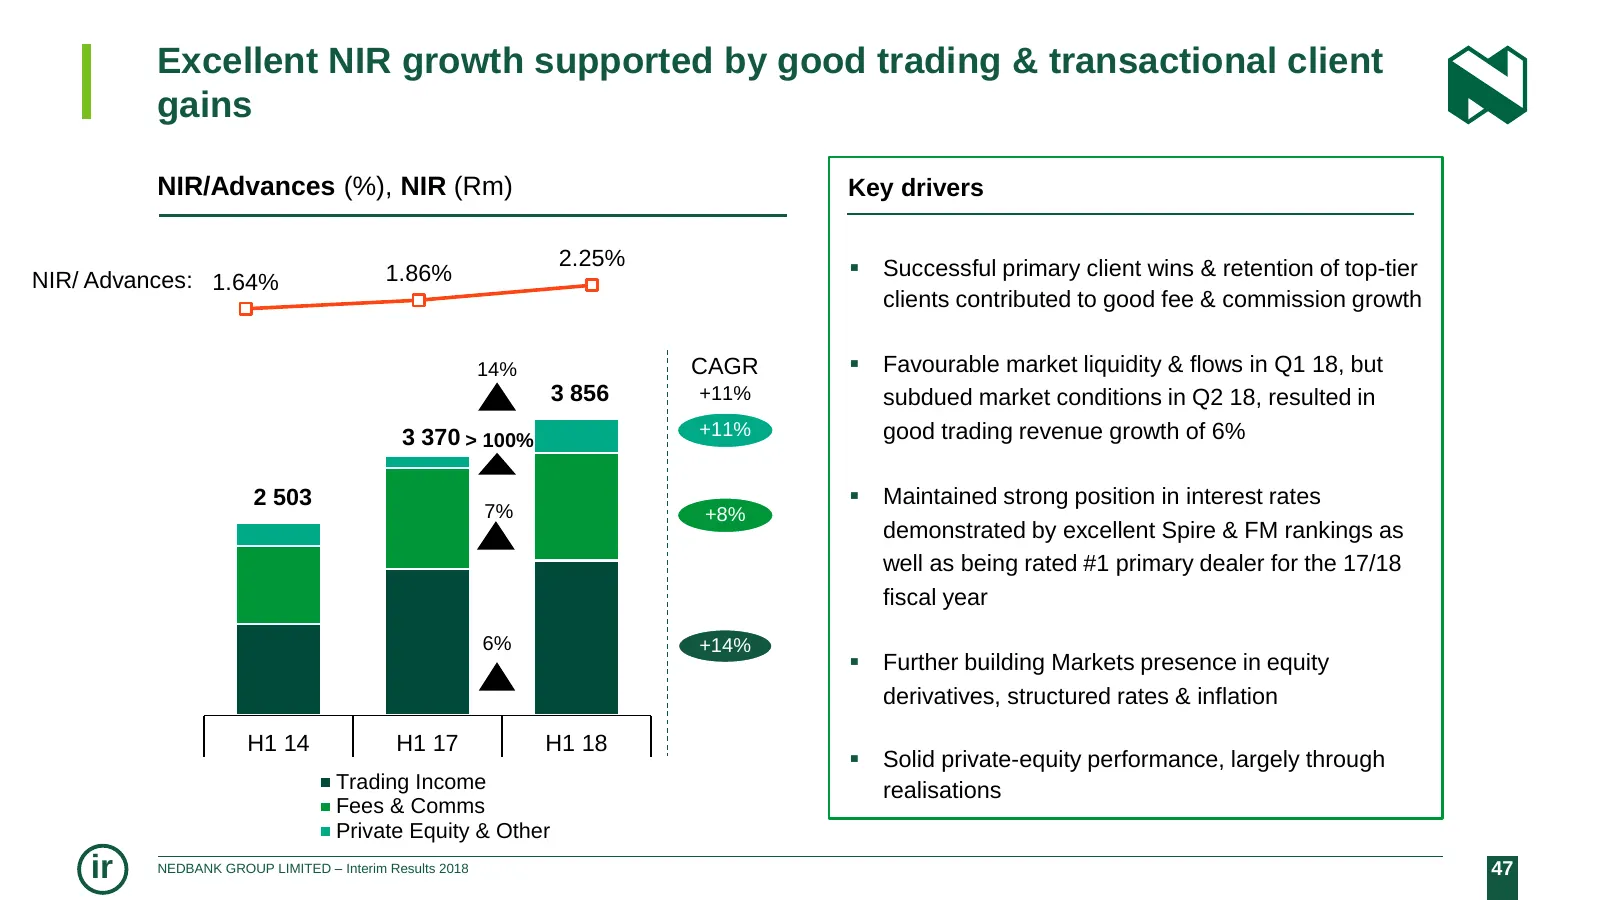
Excellent NIR growth supported by good trading & transactional client gains NIR/Advances (%), NIR (Rm) Key drivers 2.25% Successful primary client wins & retention of top-tier NIR/ Advances: 1.64% 1.86% clients contributed to good fee & commission growth 14% CAGR Favourable market liquidity & fl
Slide 48: Growing transactional banking franchise – new primary-client wins
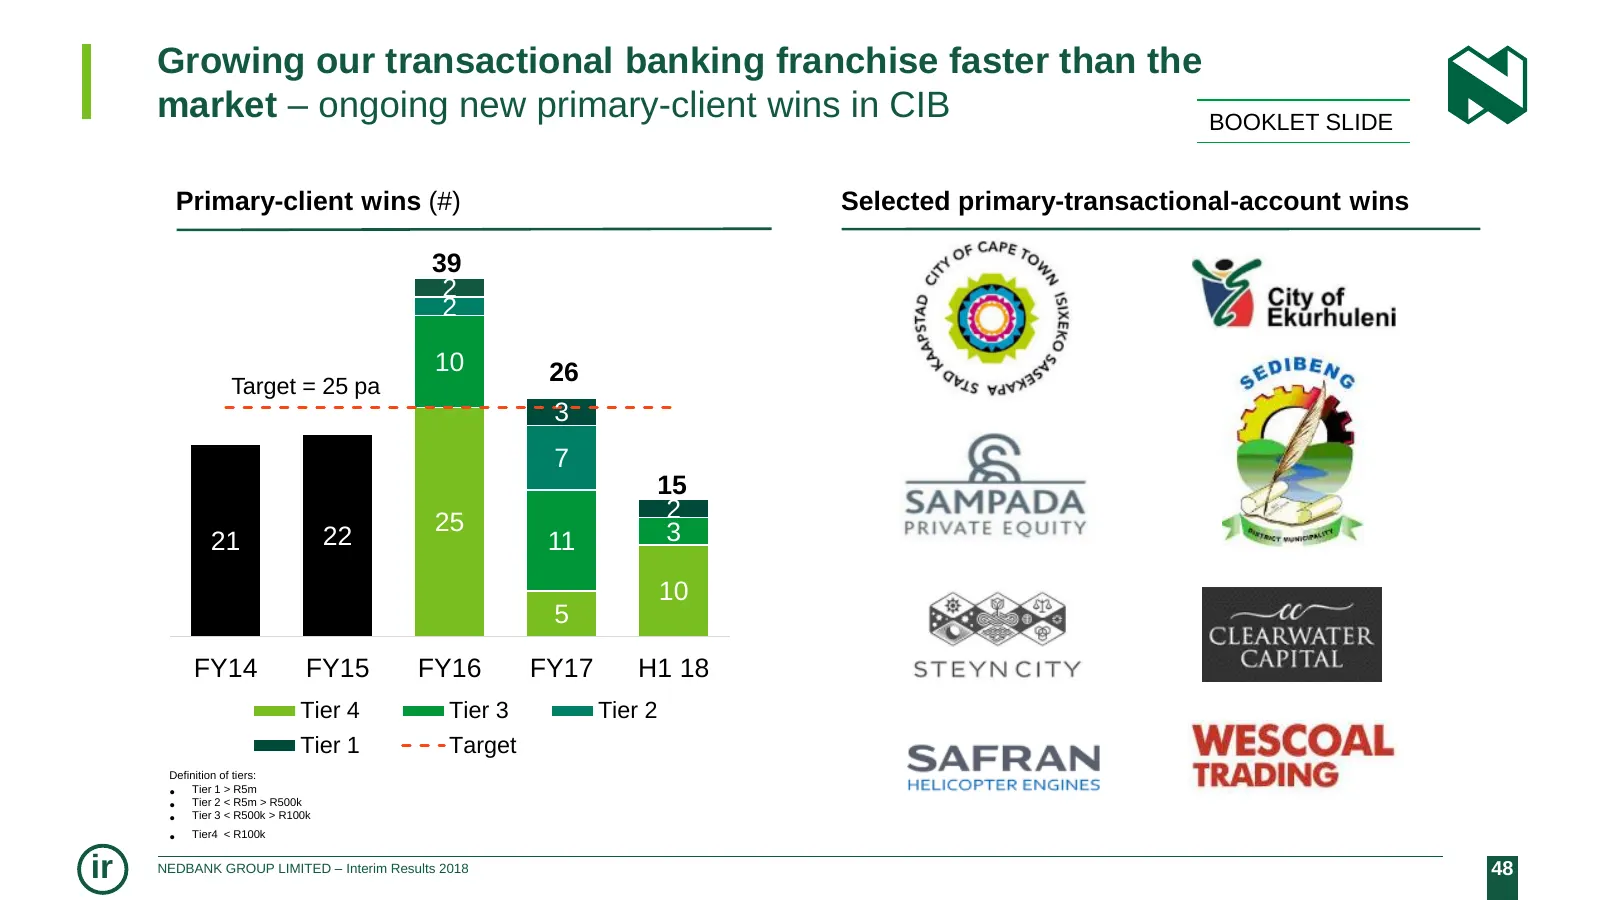
Growing our transactional banking franchise faster than the market – ongoing new primary-client wins in CIB BOOKLET SLIDE Primary-client wins (#) Selected primary-transactional-account wins 39 2 2 10 26 Target = 25 pa 3 7 15 2 25 3 21 22 11 10 5 FY14 FY15 FY16 FY17 H1 18 Tier 4 Tier 3 Tier 2 Tier 1
Slide 49: Prospects for Corporate & Investment Banking
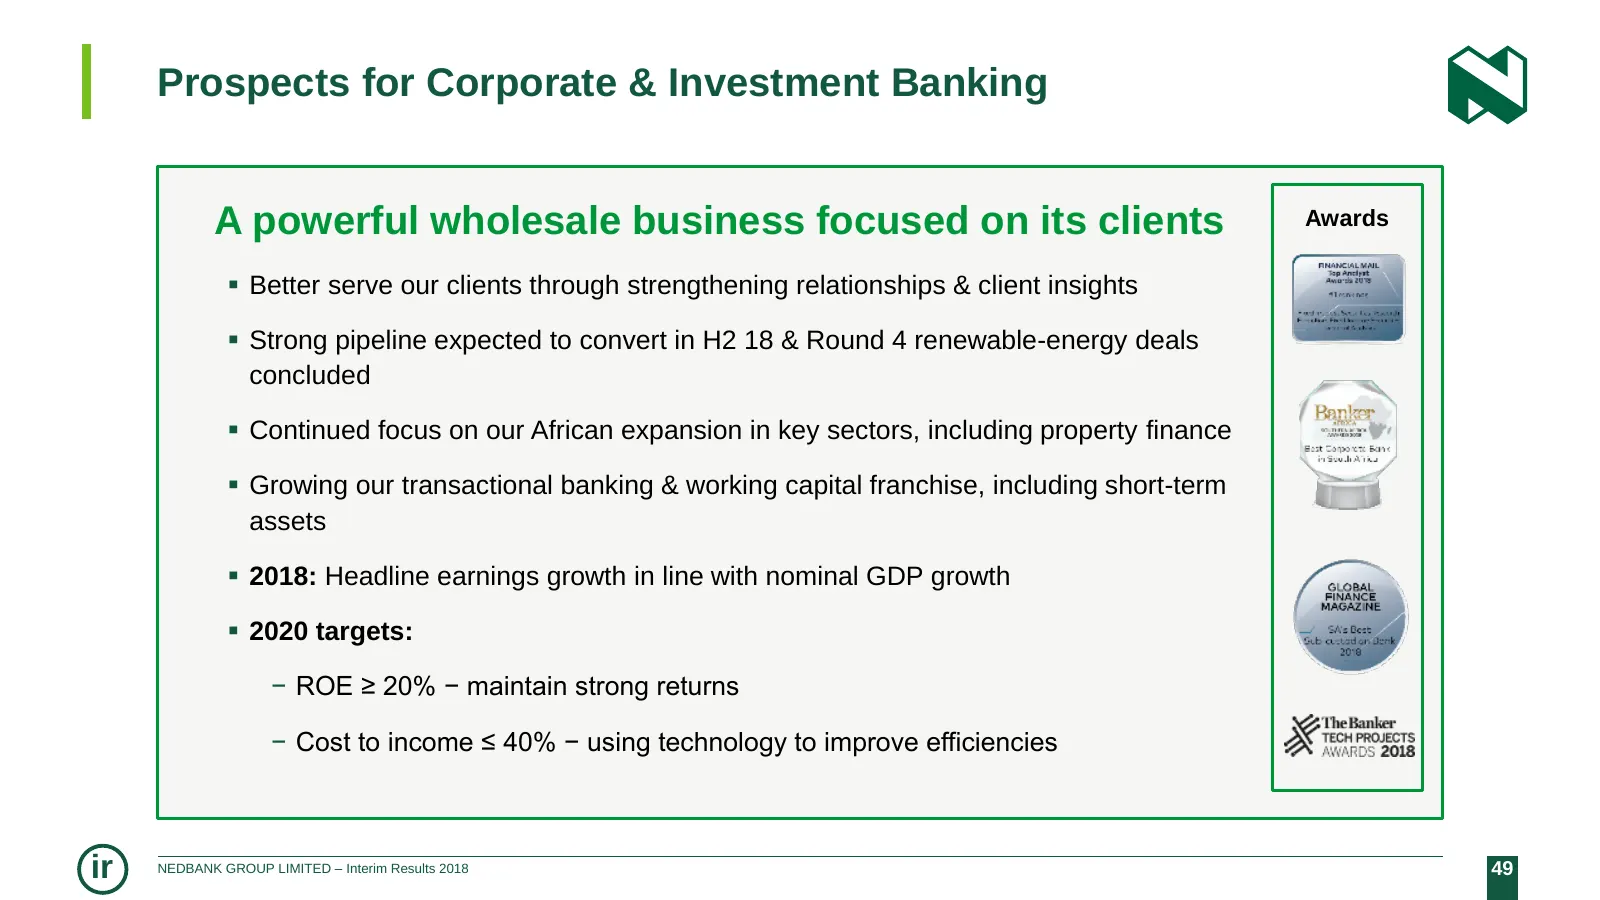
Prospects for Corporate & Investment Banking A powerful wholesale business focused on its clients Awards Better serve our clients through strengthening relationships & client insights Strong pipeline expected to convert in H2 18 & Round 4 renewable-energy deals concluded Continued focus on our
Slide 50: Nedbank Retail & Business Banking
NEDBANK RETAIL & BUSINESS BANKING Solid underlying earnings growth in line with expectations in a difficult environment CIKO THOMAS ir NEDBANK GROUP LIMITED – Interim Results 2018 50
Slide 51: RBB: Solid underlying earnings growth
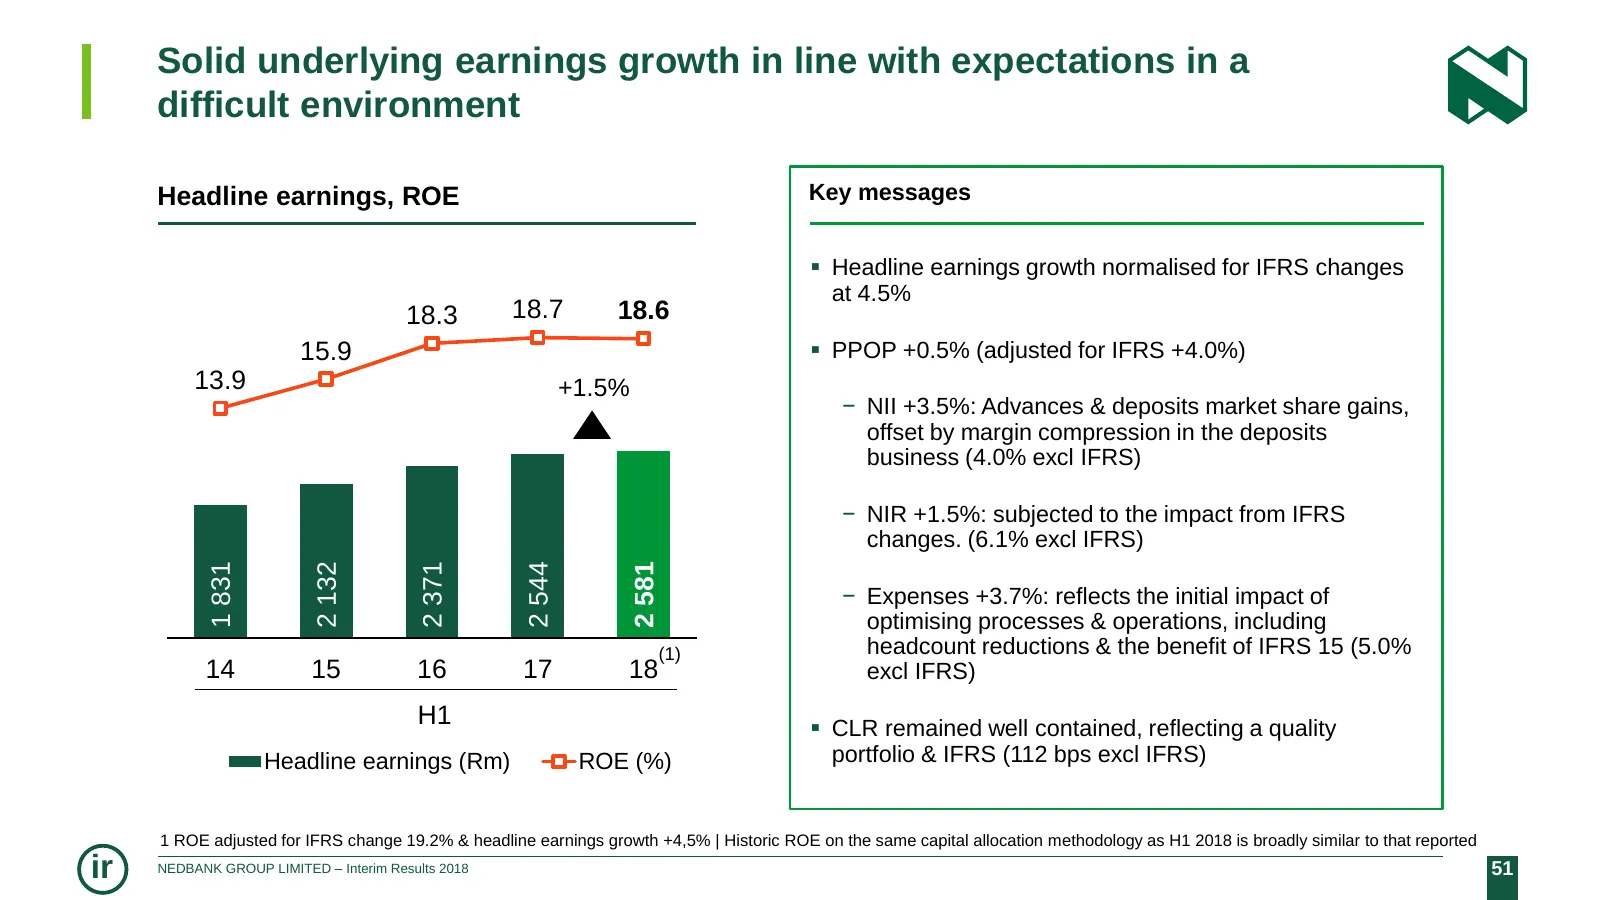
Solid underlying earnings growth in line with expectations in a difficult environment Headline earnings, ROE 6 000 28.0 Key messages 5 000 23.0 Headline earnings growth normalised for IFRS changes at 4.5% 18.3 18.7 18.6 4 000 15.9 18.0 PPOP +0.5% (adjusted for IFRS +4.0%) 13.9 +1.5% 3 000 13.0 −
Slide 52: RBB – financial highlights
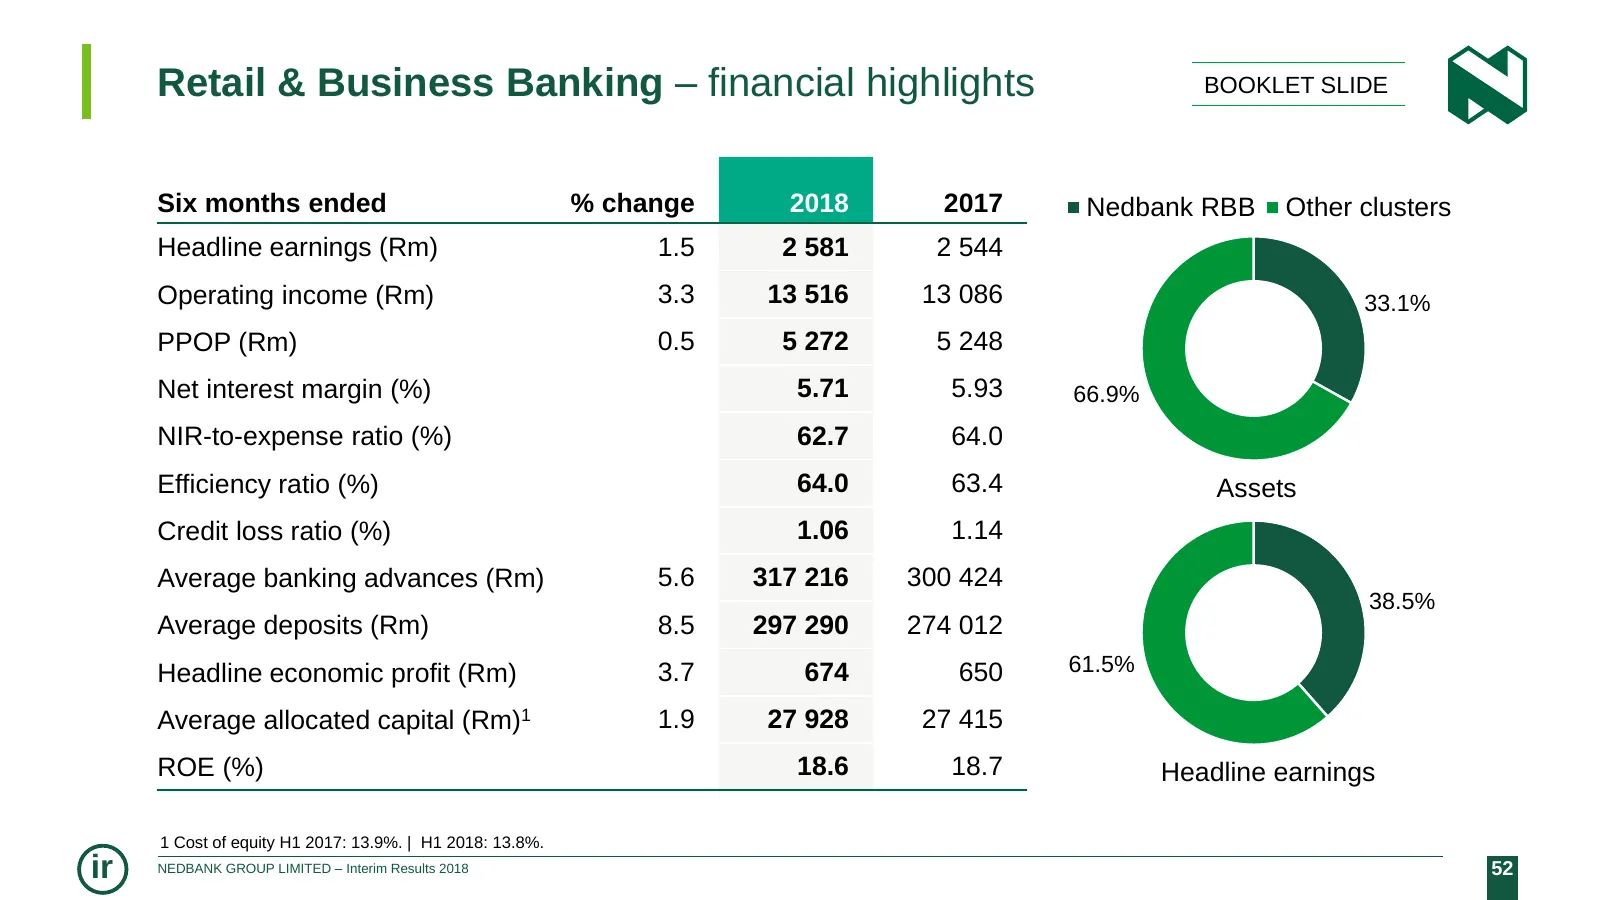
Retail & Business Banking – financial highlights BOOKLET SLIDE Six months ended % change 2018 2017 Nedbank RBB Other clusters Headline earnings (Rm) 1.5 2 581 2 544 Operating income (Rm) 3.3 13 516 13 086 33.1% PPOP (Rm) 0.5 5 272 5 248 Net interest margin (%) 5.71 5.93 66.9% NIR-to-expense ratio (%
Slide 53: Retail transactional NIR growth ahead of client growth
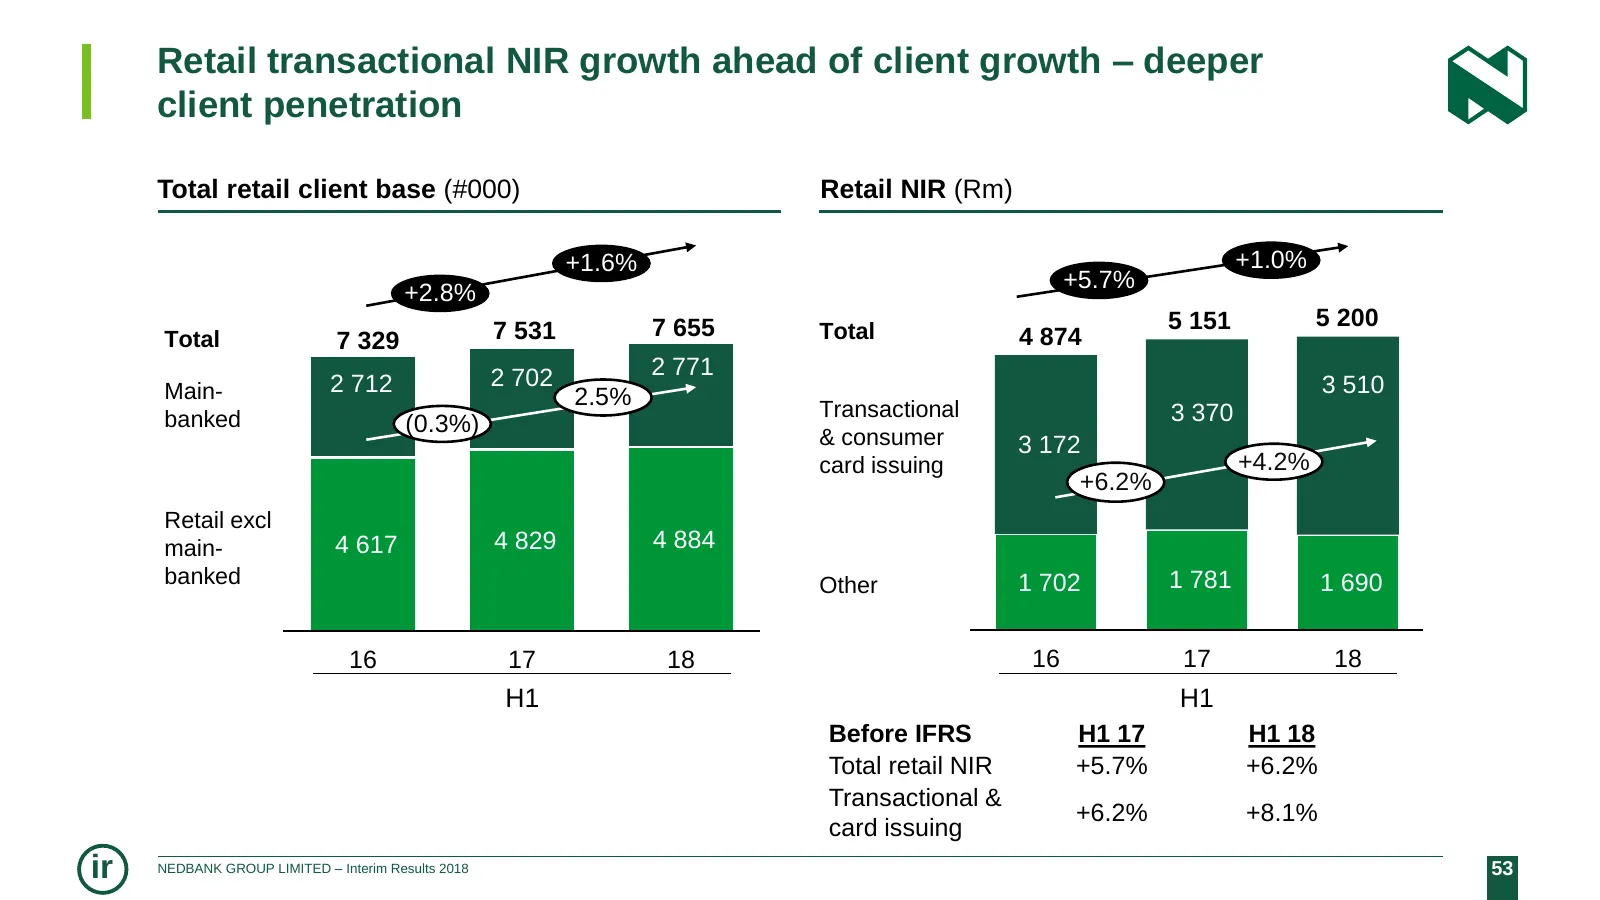
Retail transactional NIR growth ahead of client growth – deeper client penetration Total retail client base (#000) Retail NIR (Rm) +1.6% +1.0% +5.7% +2.8% 7 655 5 151 5 200 Total 7 329 7 531 Total 4 874 2 702 2 771 Main- 2 712 3 510 2.5% Transactional banked (0.3%) 3 370 & consumer 3 172 card issuin
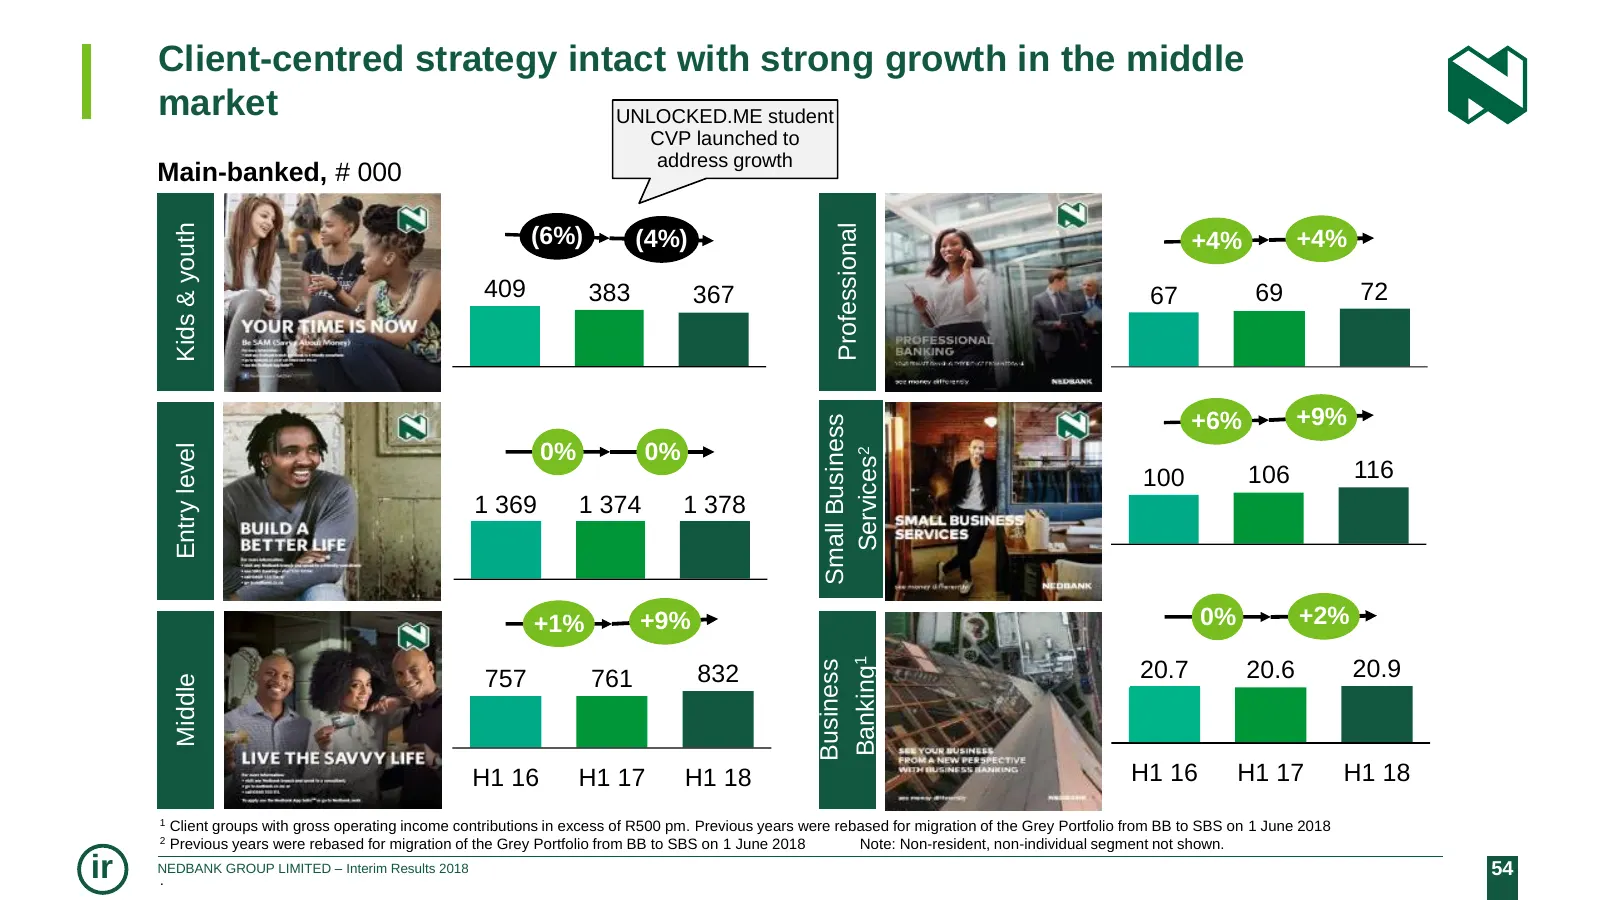
Slide 54: Client-centred strategy intact with strong growth in middle market
Client-centred strategy intact with strong growth in the middle market UNLOCKED.ME student CVP launched to address growth Main-banked, # 000 Kids & youth Professional (6%) (4%) +4% +4% 409 383 367 67 69 72 +6% +9% Small Business 0% 0% Entry level Services2 100 106 116 1 369 1 374 1 378 +1% +9% 0% +2
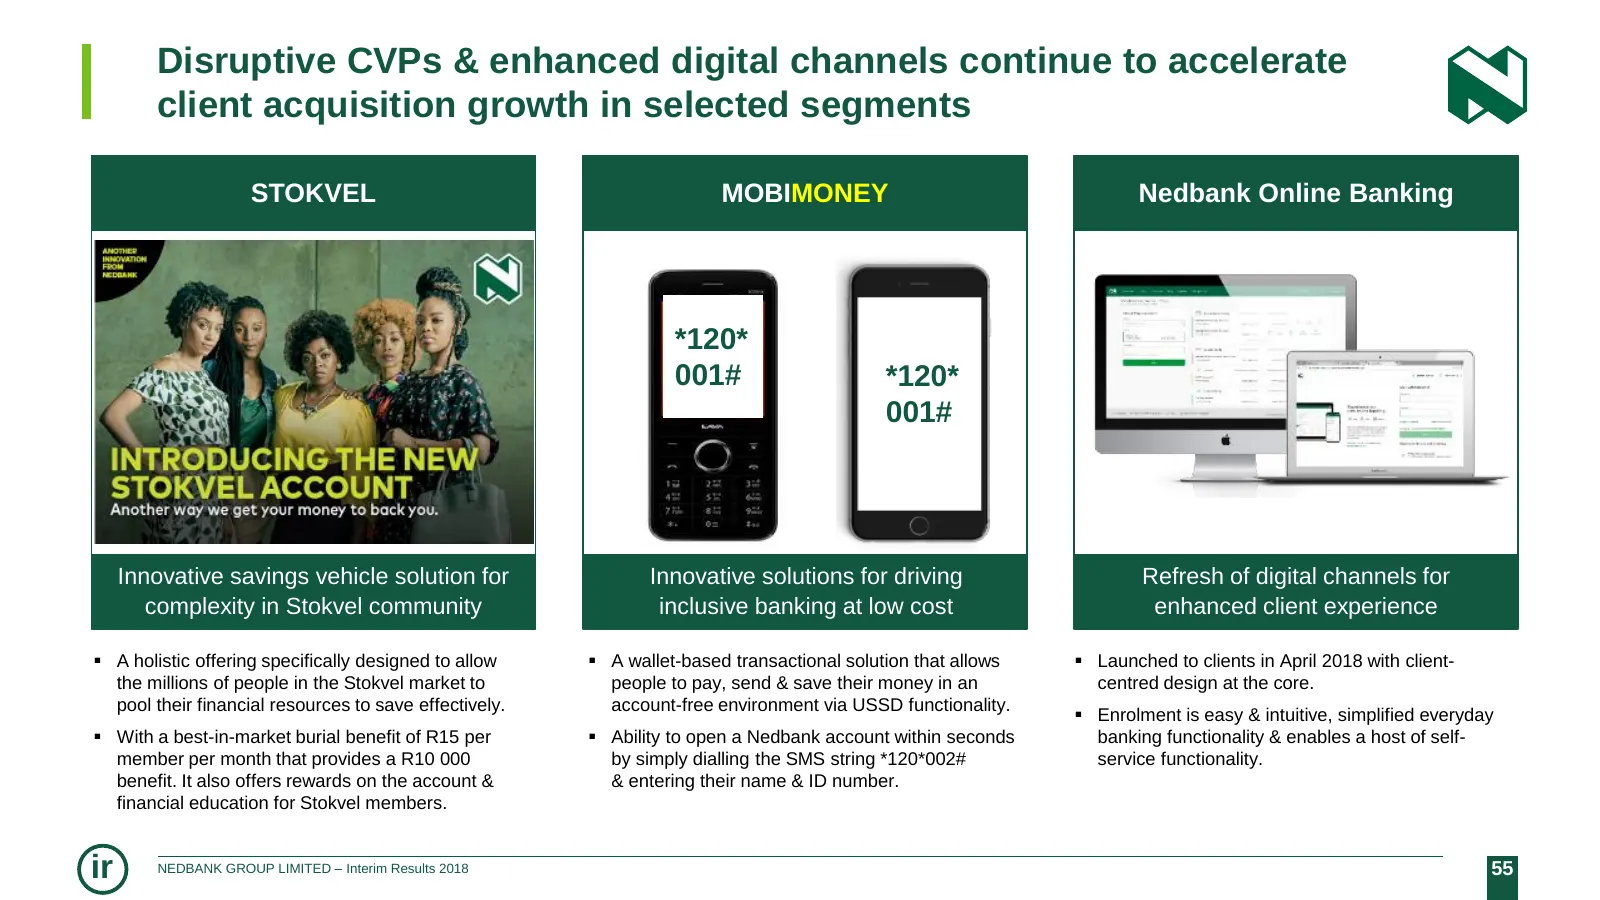
Slide 55: Disruptive CVPs & enhanced digital channels
Disruptive CVPs & enhanced digital channels continue to accelerate client acquisition growth in selected segments STOKVEL MOBIMONEY Nedbank Online Banking *120* 001# *120* 001# Innovative savings vehicle solution for Innovative solutions for driving Refresh of digital channels for complexity in Stok
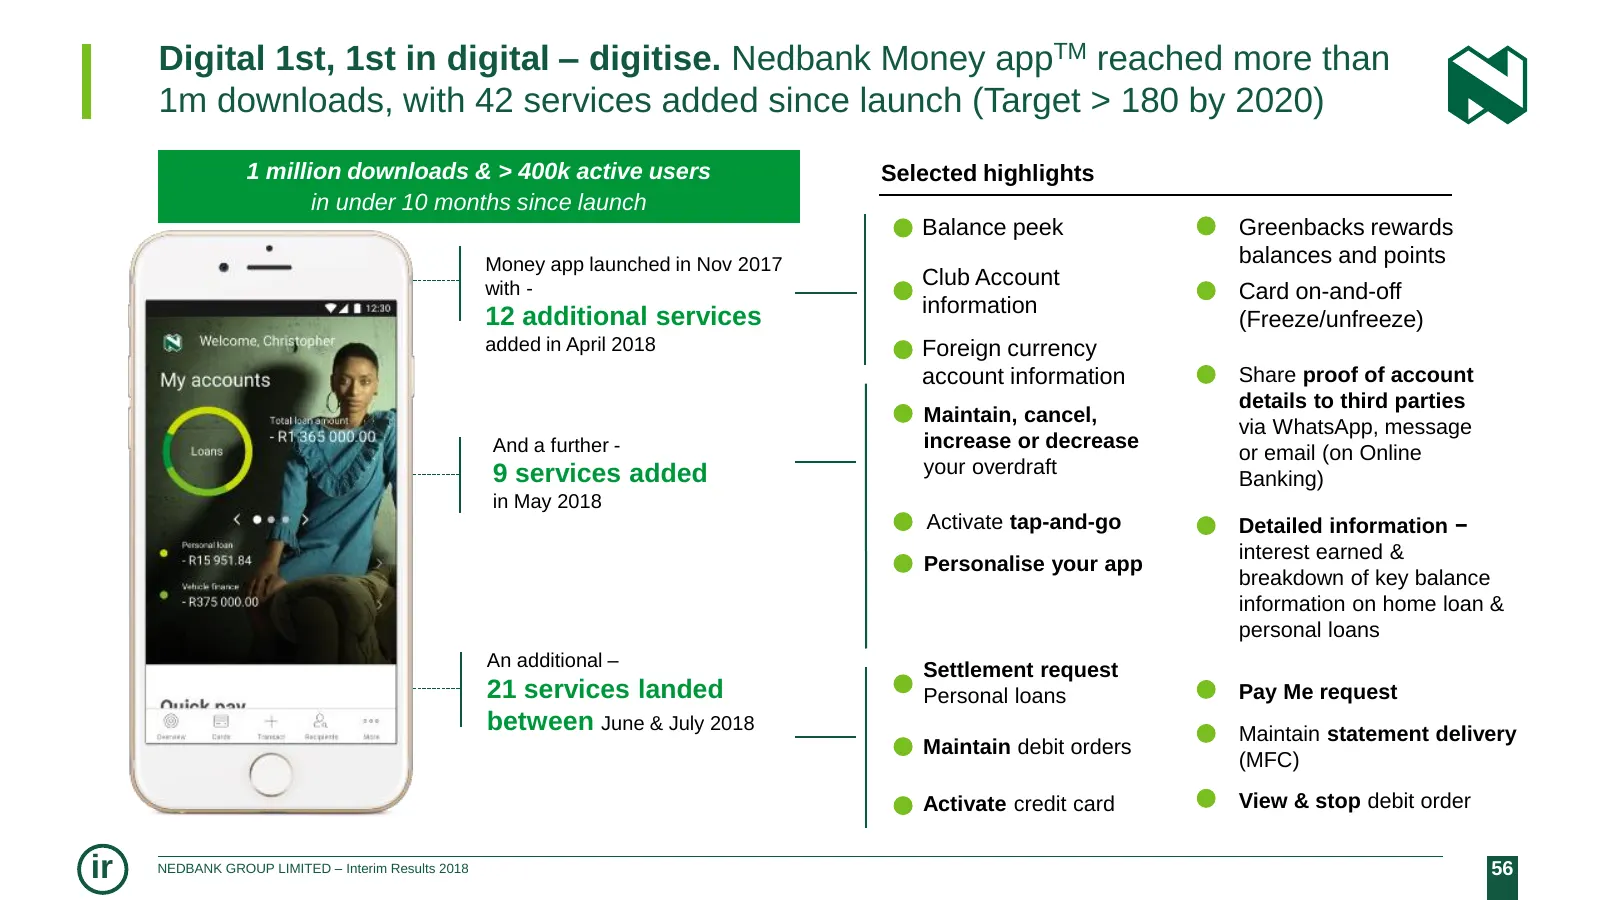
Slide 56: Digital 1st, 1st in digital – Nedbank Money app
Digital 1st, 1st in digital – digitise. Nedbank Money appTM reached more than 1m downloads, with 42 services added since launch (Target > 180 by 2020) 1 million downloads & > 400k active users Selected highlights in under 10 months since launch Balance peek Greenbacks rewards Money app launched in N
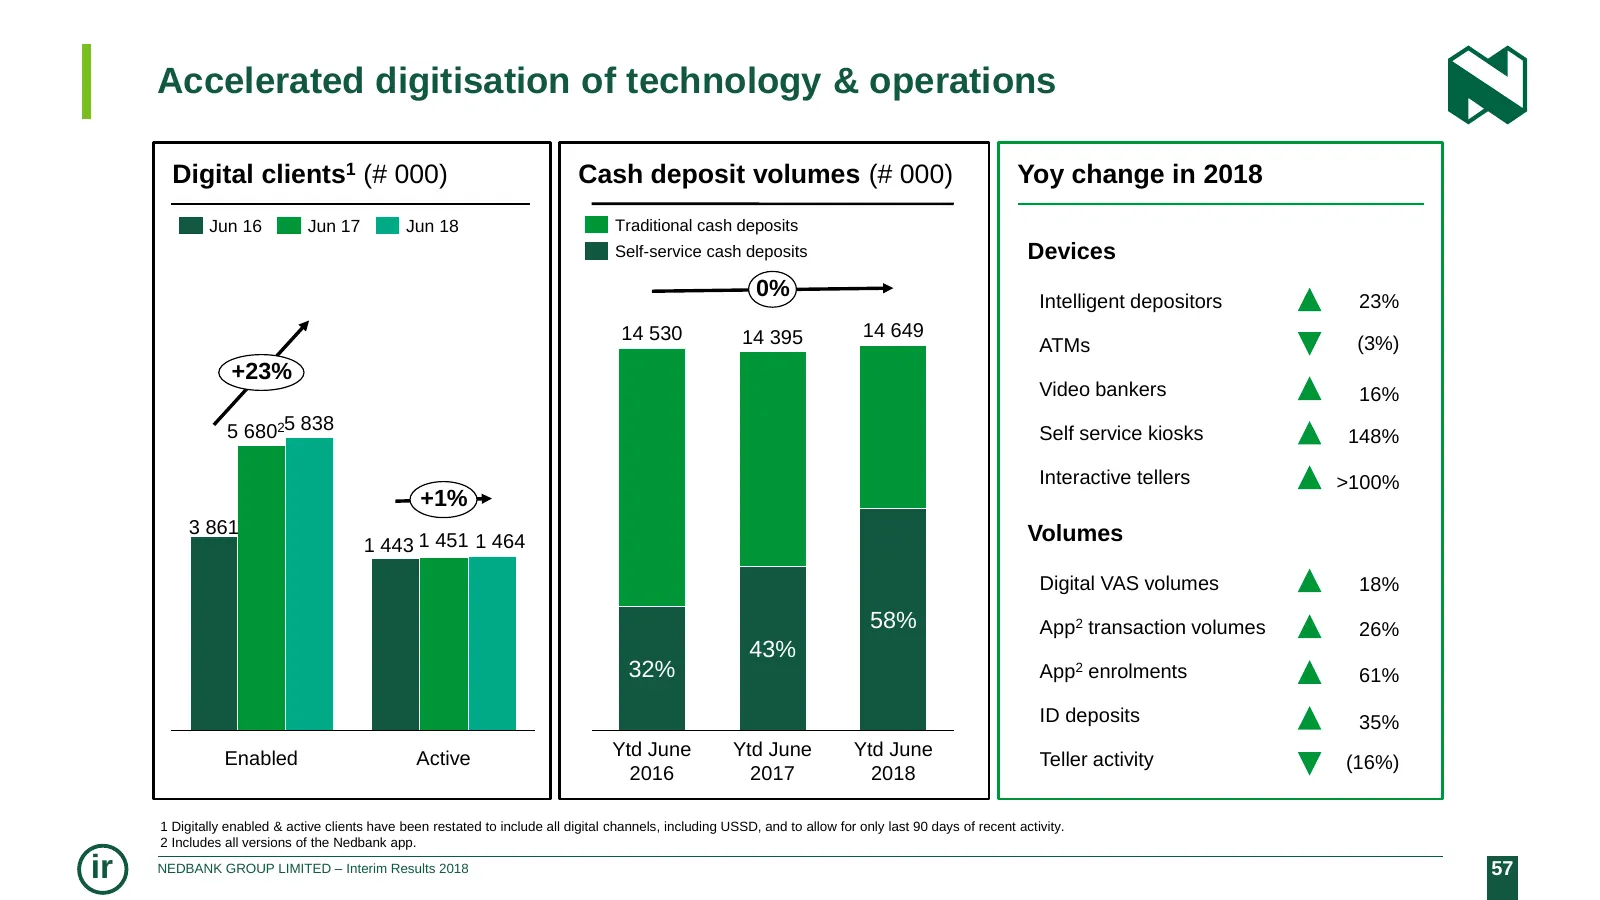
Slide 57: Accelerated digitisation of technology & operations
Accelerated digitisation of technology & operations Digital clients1 (# 000) Cash deposit volumes (# 000) Yoy change in 2018 Jun 16 Jun 17 Jun 18 Traditional cash deposits Self-service cash deposits Devices 0% Intelligent depositors 23% 14 530 14 395 14 649 ATMs (3%) +23% Video bankers 16% 5 68025 8
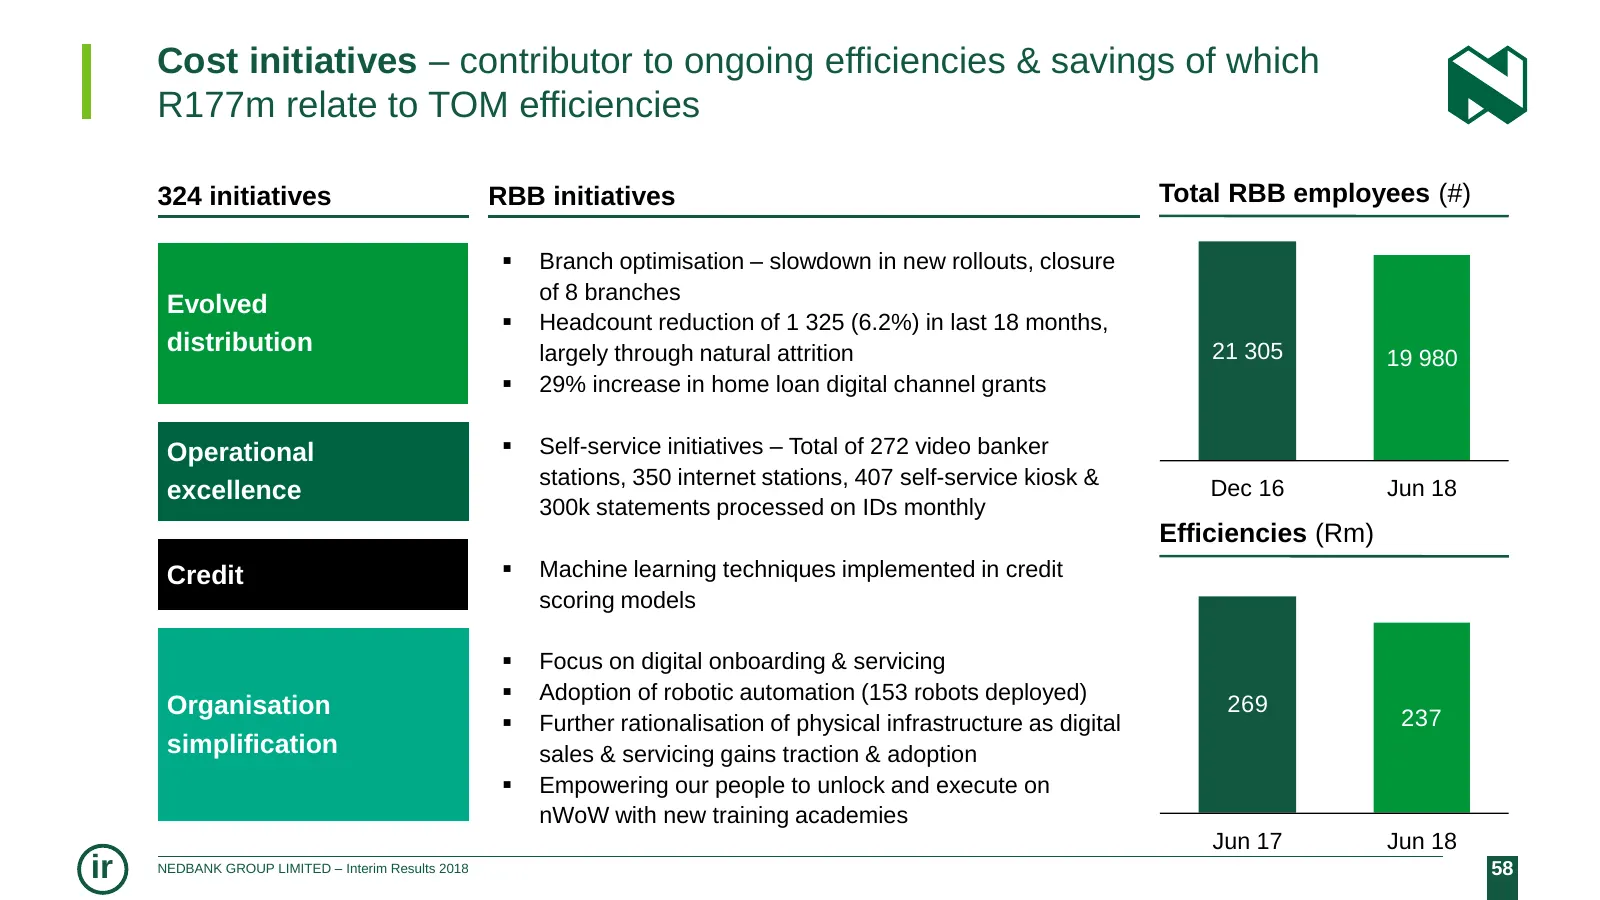
Slide 58: Cost initiatives – efficiencies & savings
Cost initiatives – contributor to ongoing efficiencies & savings of which R177m relate to TOM efficiencies 324 initiatives RBB initiatives Total RBB employees (#) Branch optimisation – slowdown in new rollouts, closure of 8 branches Evolved Headcount reduction of 1 325 (6.2%) in last 18 months,
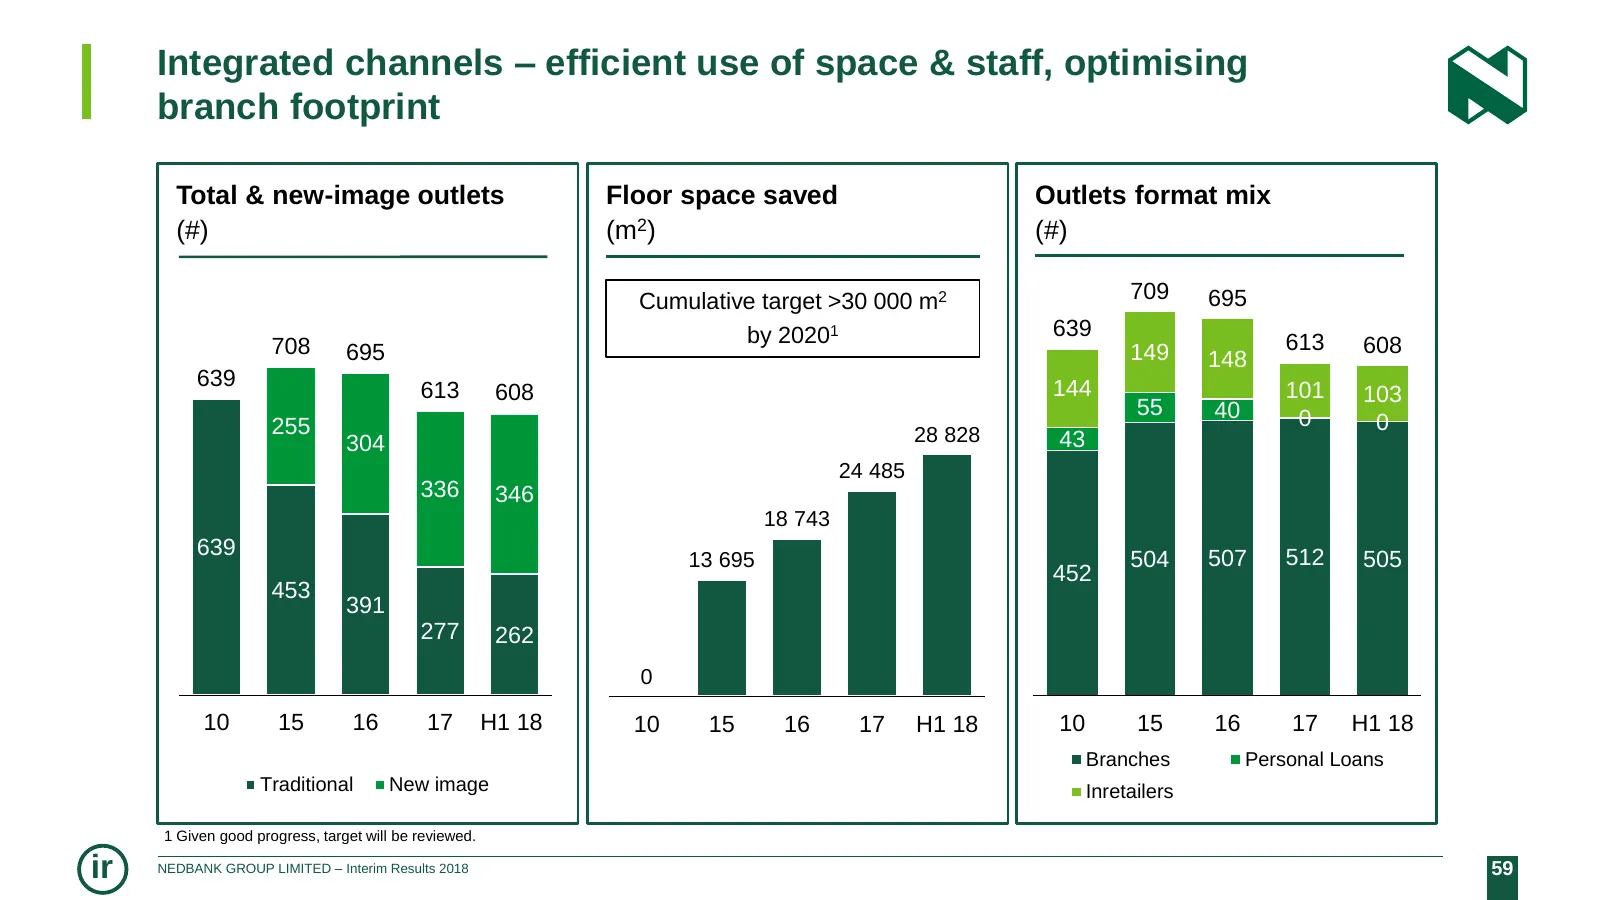
Slide 59: Integrated channels – optimising branch footprint
Integrated channels – efficient use of space & staff, optimising branch footprint Total & new-image outlets Floor space saved Outlets format mix (#) (m2) (#) Cumulative target >30 000 m2 709 695 by 20201 639 708 695 149 613 608 148 639 144 613 608 101 103 55 40 0 255 0 304 28 828 43 24 485 336 346 1
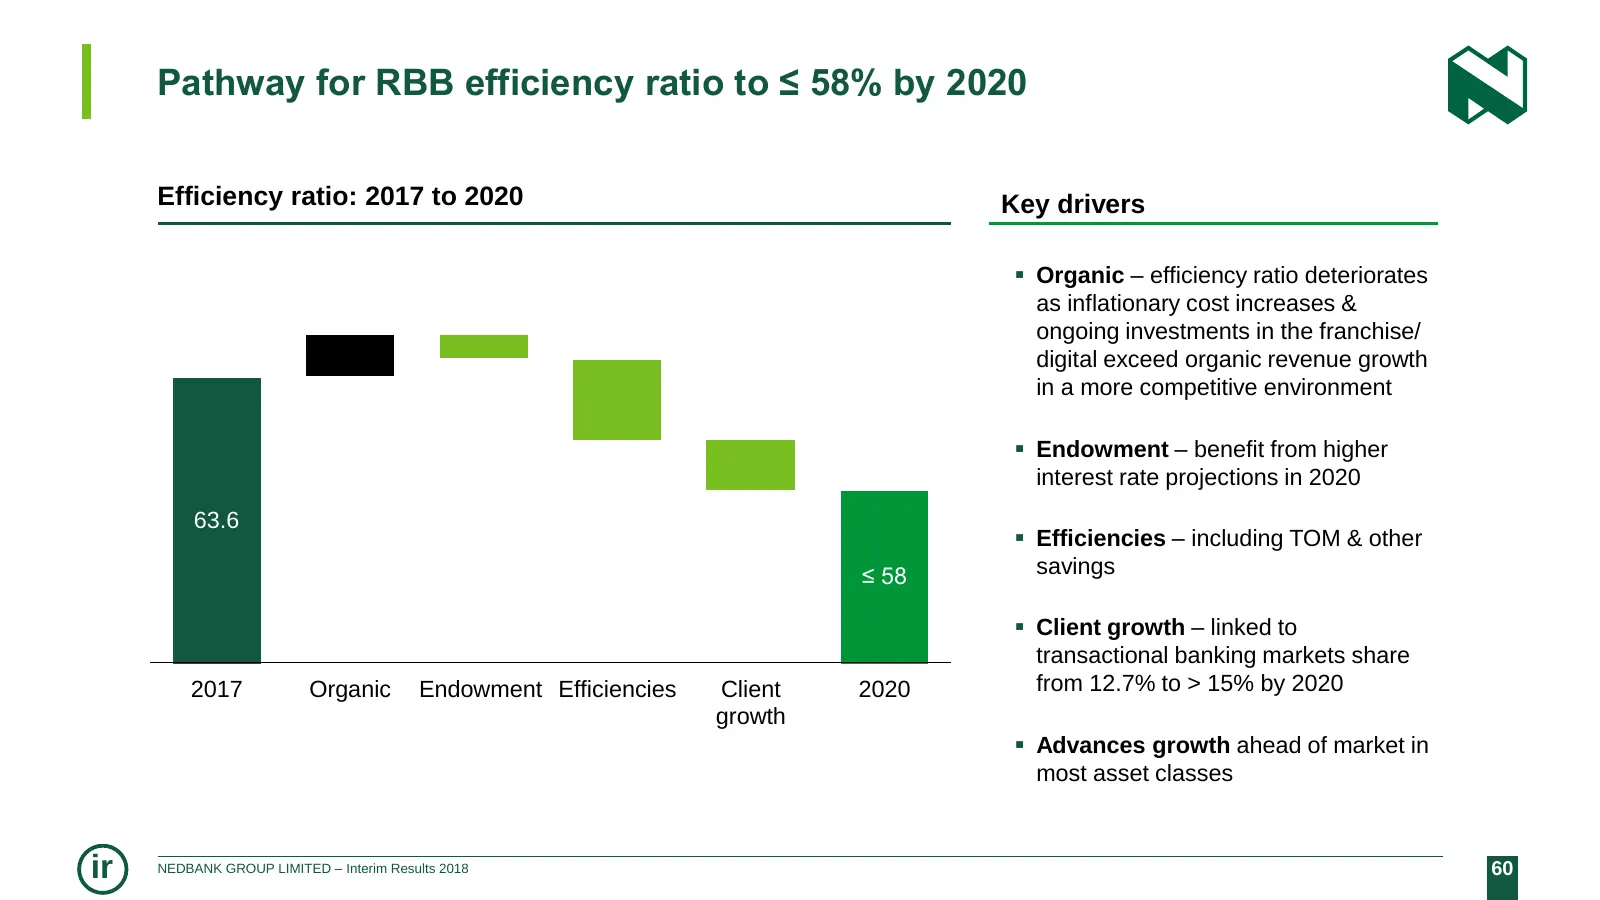
Slide 60: Pathway for RBB efficiency ratio to ≤ 58% by 2020
Pathway for RBB efficiency ratio to ≤ 58% by 2020 Efficiency ratio: 2017 to 2020 Key drivers Organic – efficiency ratio deteriorates as inflationary cost increases & ongoing investments in the franchise/ digital exceed organic revenue growth in a more competitive environment Endowment – benefit
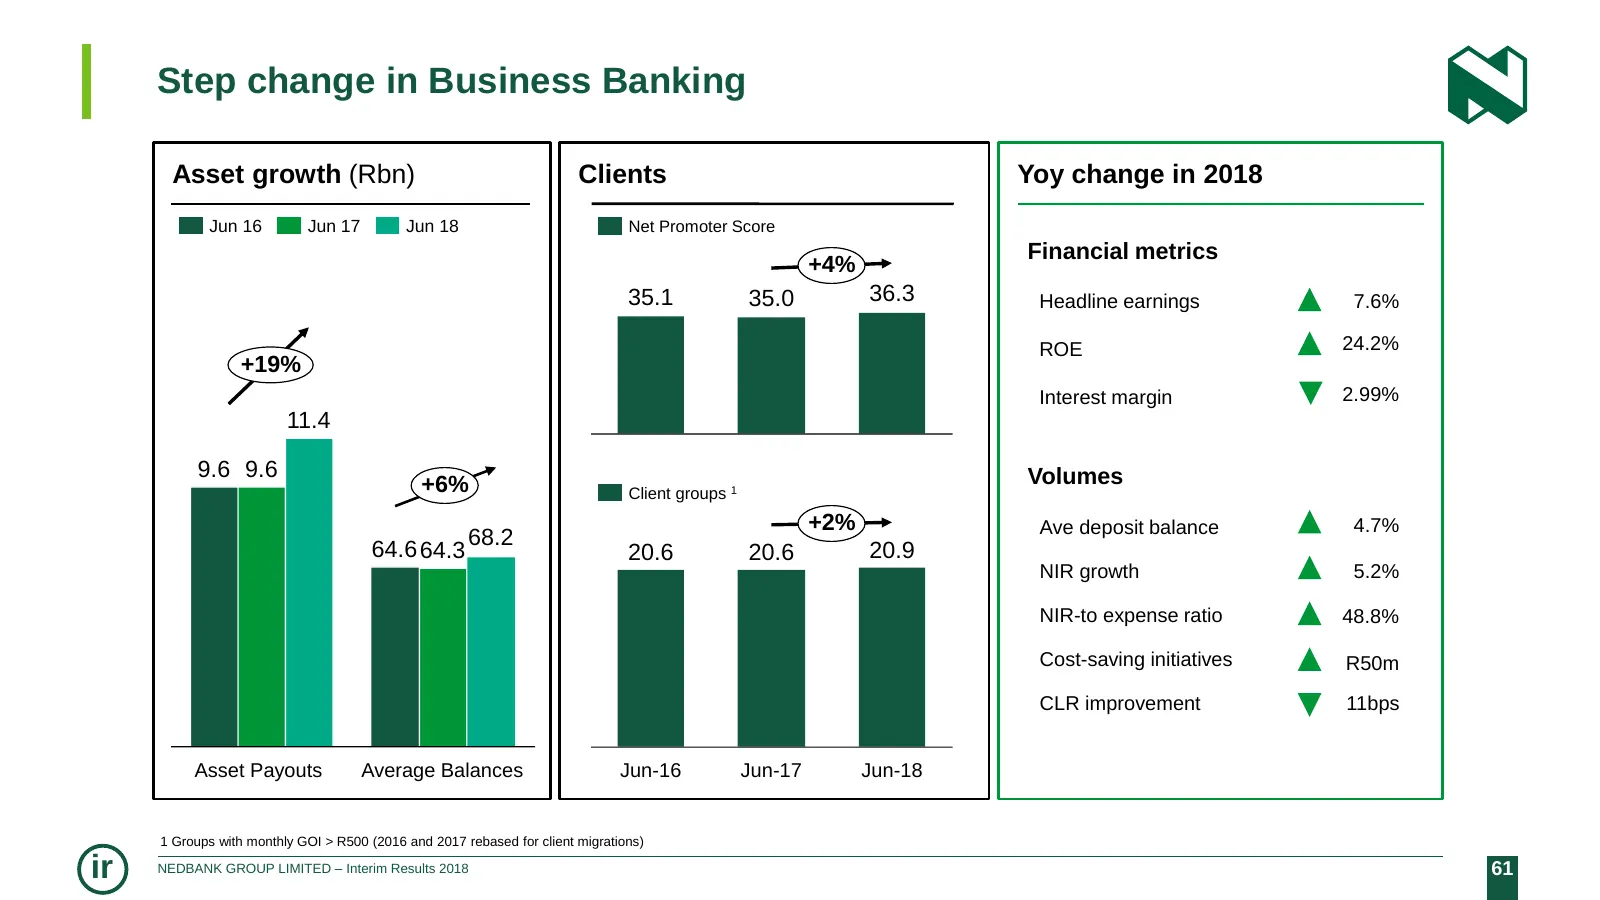
Slide 61: Step change in Business Banking
Step change in Business Banking Asset growth (Rbn) Clients Yoy change in 2018 Jun 16 Jun 17 Jun 18 Net Promoter Score Financial metrics +4% 35.1 35.0 36.3 Headline earnings 7.6% ROE 24.2% +19% Interest margin 2.99% 11.4 9.6 9.6 Volumes +6% Client groups 1 +2% Ave deposit balance 4.7% 68.2 64.6 64.3
Slide 62: Prospects for Retail & Business Banking
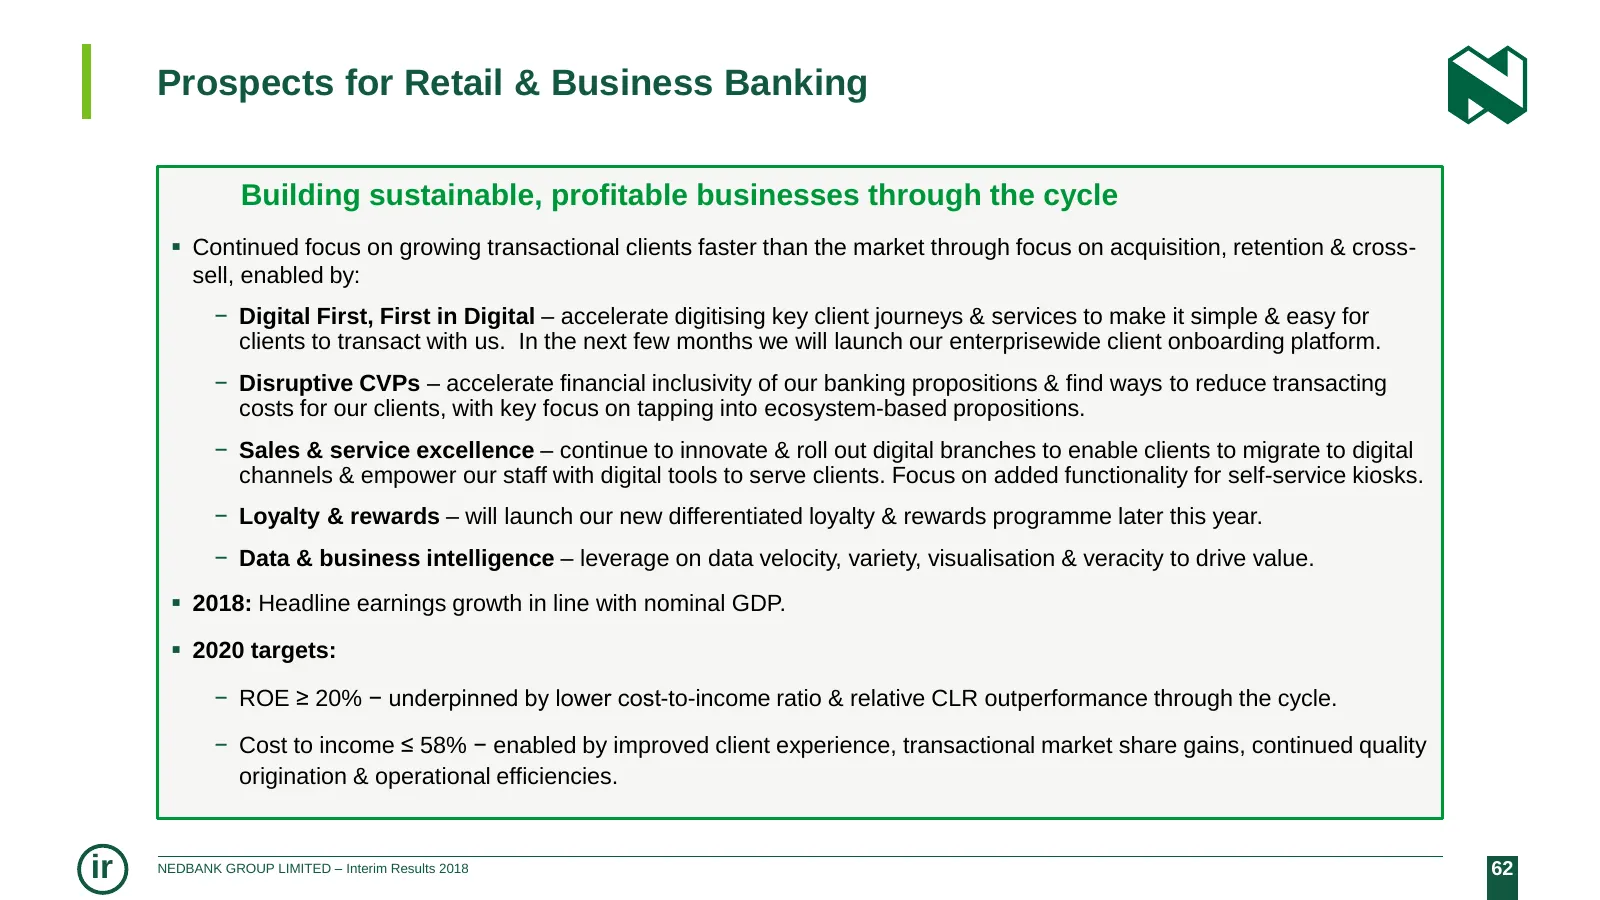
Prospects for Retail & Business Banking Building sustainable, profitable businesses through the cycle Continued focus on growing transactional clients faster than the market through focus on acquisition, retention & cross- sell, enabled by: − Digital First, First in Digital – accelerate digitising
Slide 63: Nedbank Wealth
NEDBANK WEALTH Subdued performance in a tough economic climate IOLANDA RUGGIERO ir NEDBANK GROUP LIMITED – Interim Results 2018 63
Slide 64: Subdued performance in a tough economic climate
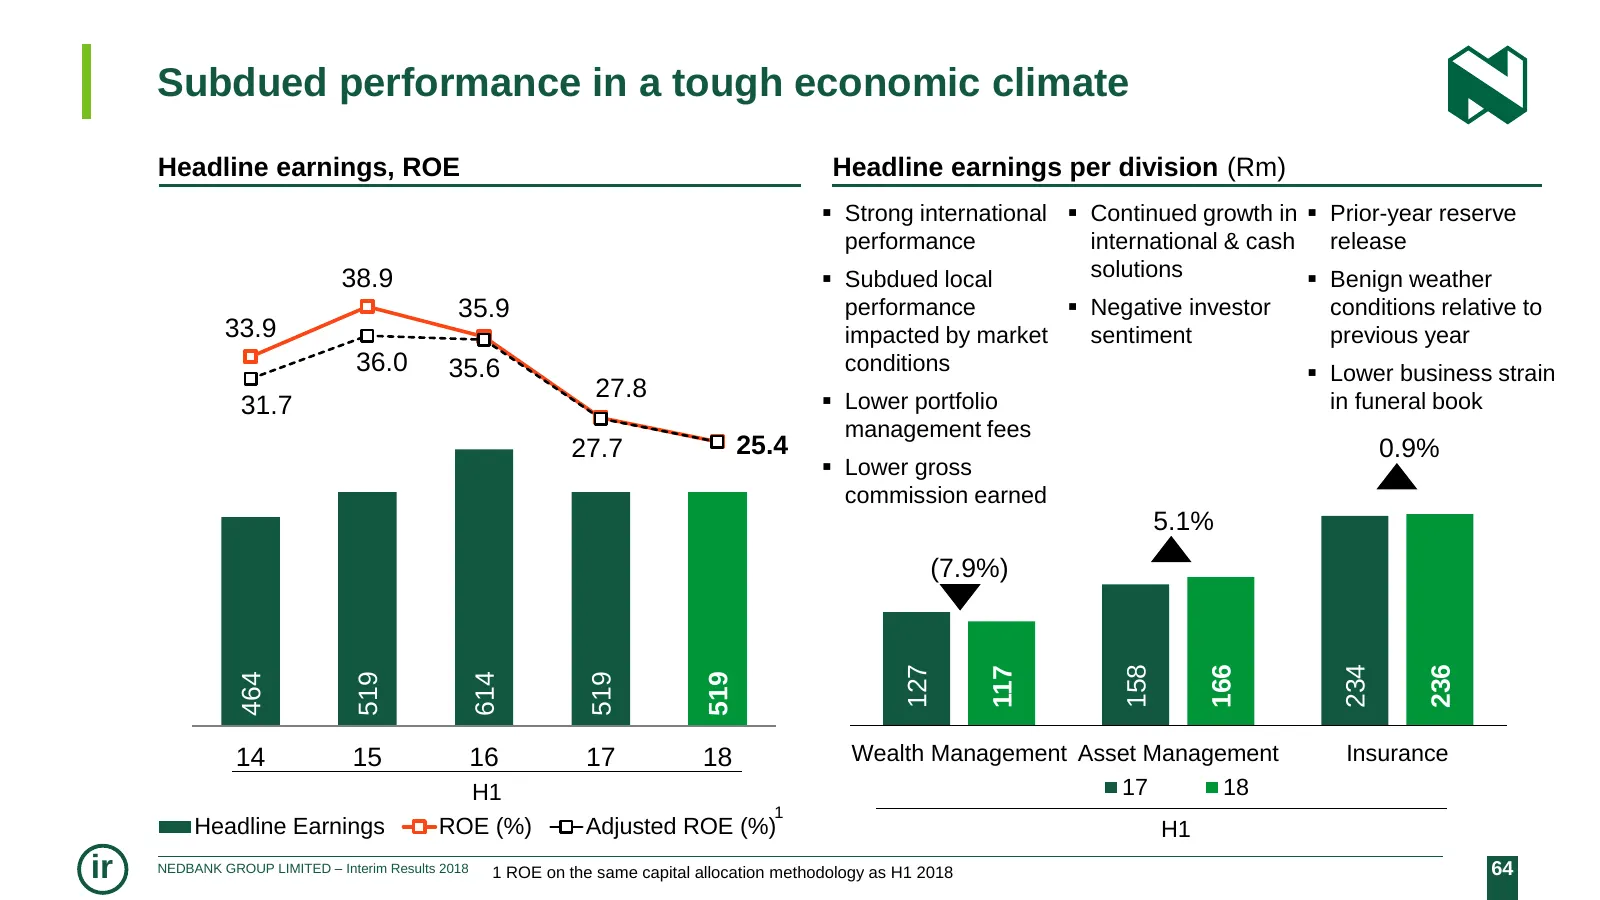
Subdued performance in a tough economic climate Headline earnings, ROE Headline earnings per division (Rm) Strong international Continued growth in Prior-year reserve performance international & cash release 1000 38.9 42.0 Subdued local solutions Benign weather 35.9 performance Negative
Slide 65: Wealth – financial highlights
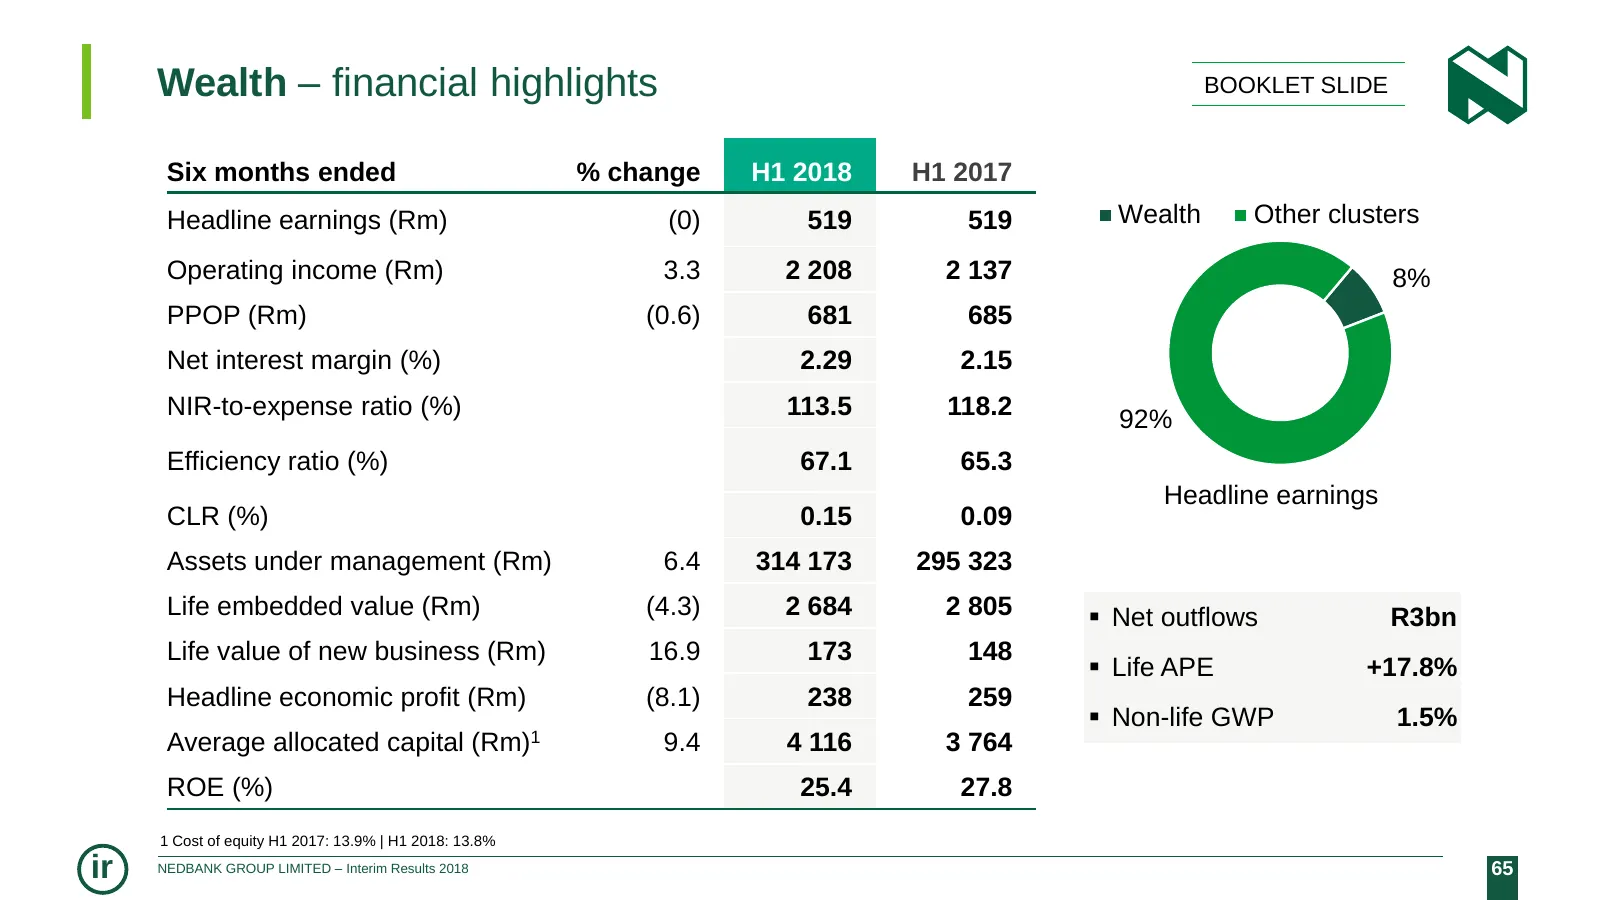
Wealth – financial highlights BOOKLET SLIDE Six months ended % change H1 2018 H1 2017 Headline earnings (Rm) (0) 519 519 Wealth Other clusters Operating income (Rm) 3.3 2 208 2 137 8% PPOP (Rm) (0.6) 681 685 Net interest margin (%) 2.29 2.15 NIR-to-expense ratio (%) 113.5 118.2 92% Efficiency ratio
Slide 66: Wealth Management – strong international performance
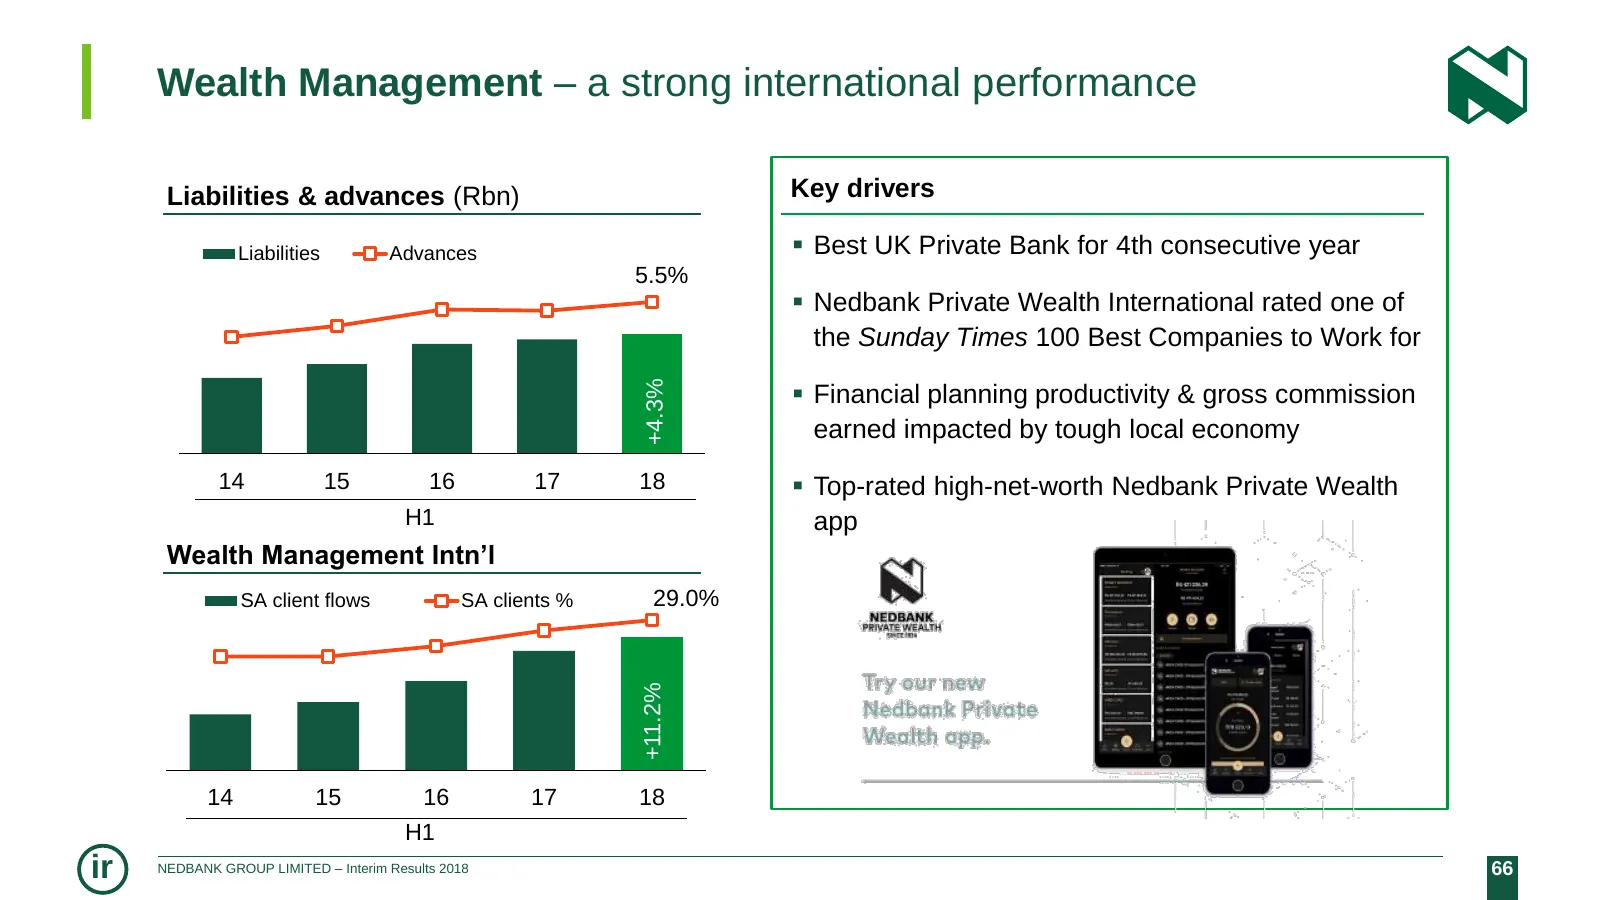
Wealth Management – a strong international performance Liabilities & advances (Rbn) Key drivers Liabilities Advances Best UK Private Bank for 4th consecutive year 5.5% Nedbank Private Wealth International rated one of the Sunday Times 100 Best Companies to Work for +4.3% Financial planning pro
Slide 67: Asset Management – solid AUM growth
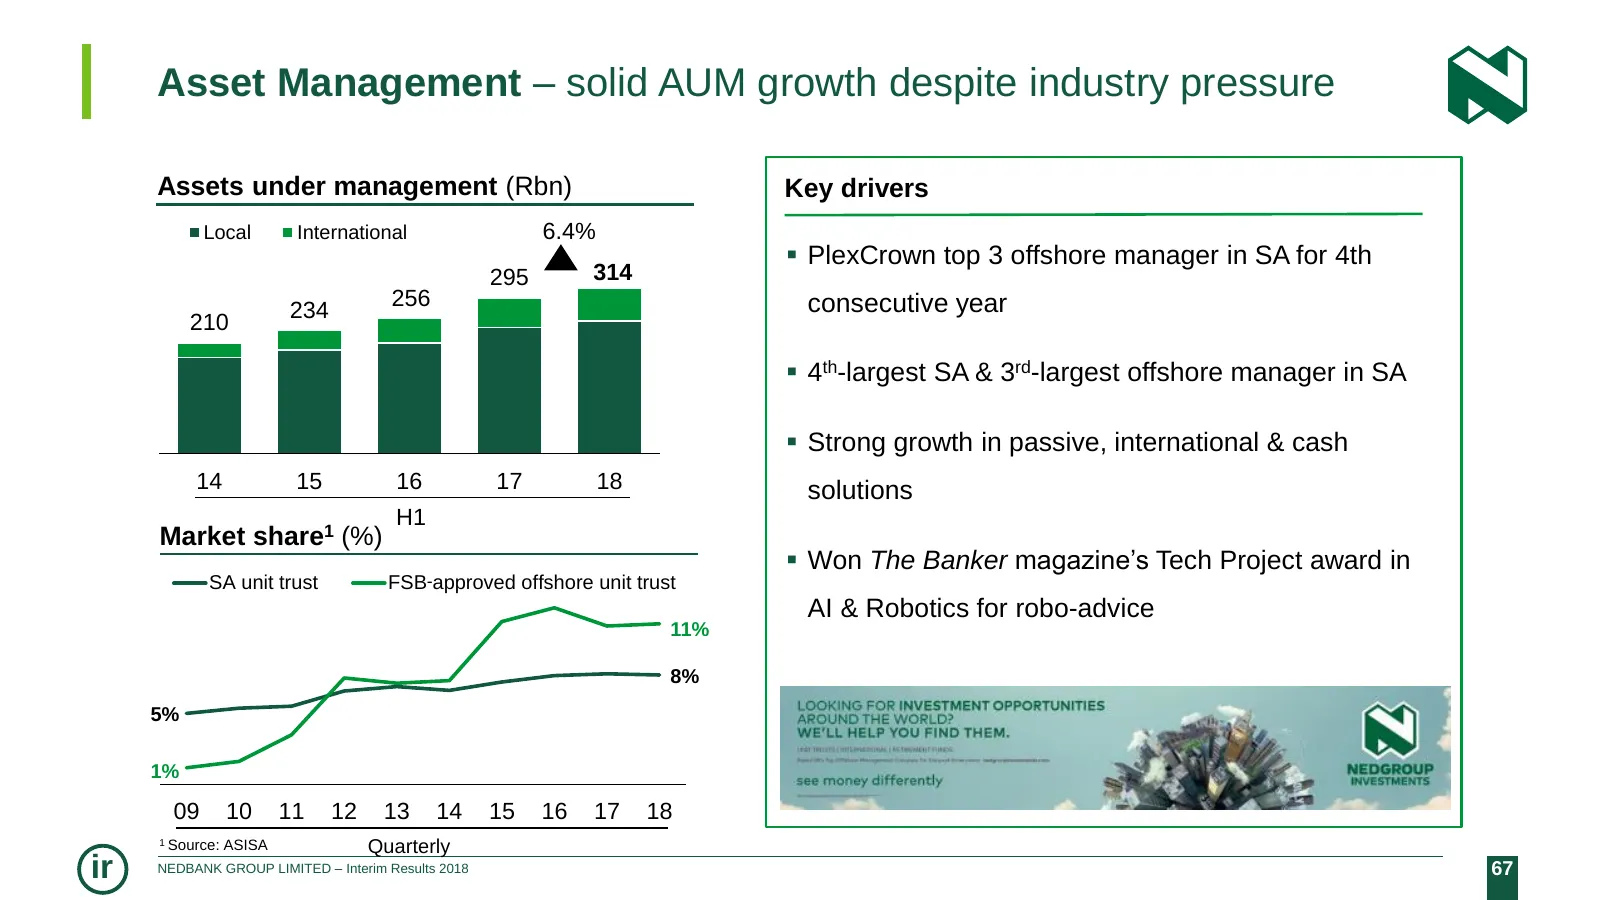
Asset Management – solid AUM growth despite industry pressure Assets under management (Rbn) Key drivers Local International 6.4% PlexCrown top 3 offshore manager in SA for 4th 295 314 256 consecutive year 234 210 4th-largest SA & 3rd-largest offshore manager in SA Strong growth in passive, int
Slide 68: Insurance – an improved performance
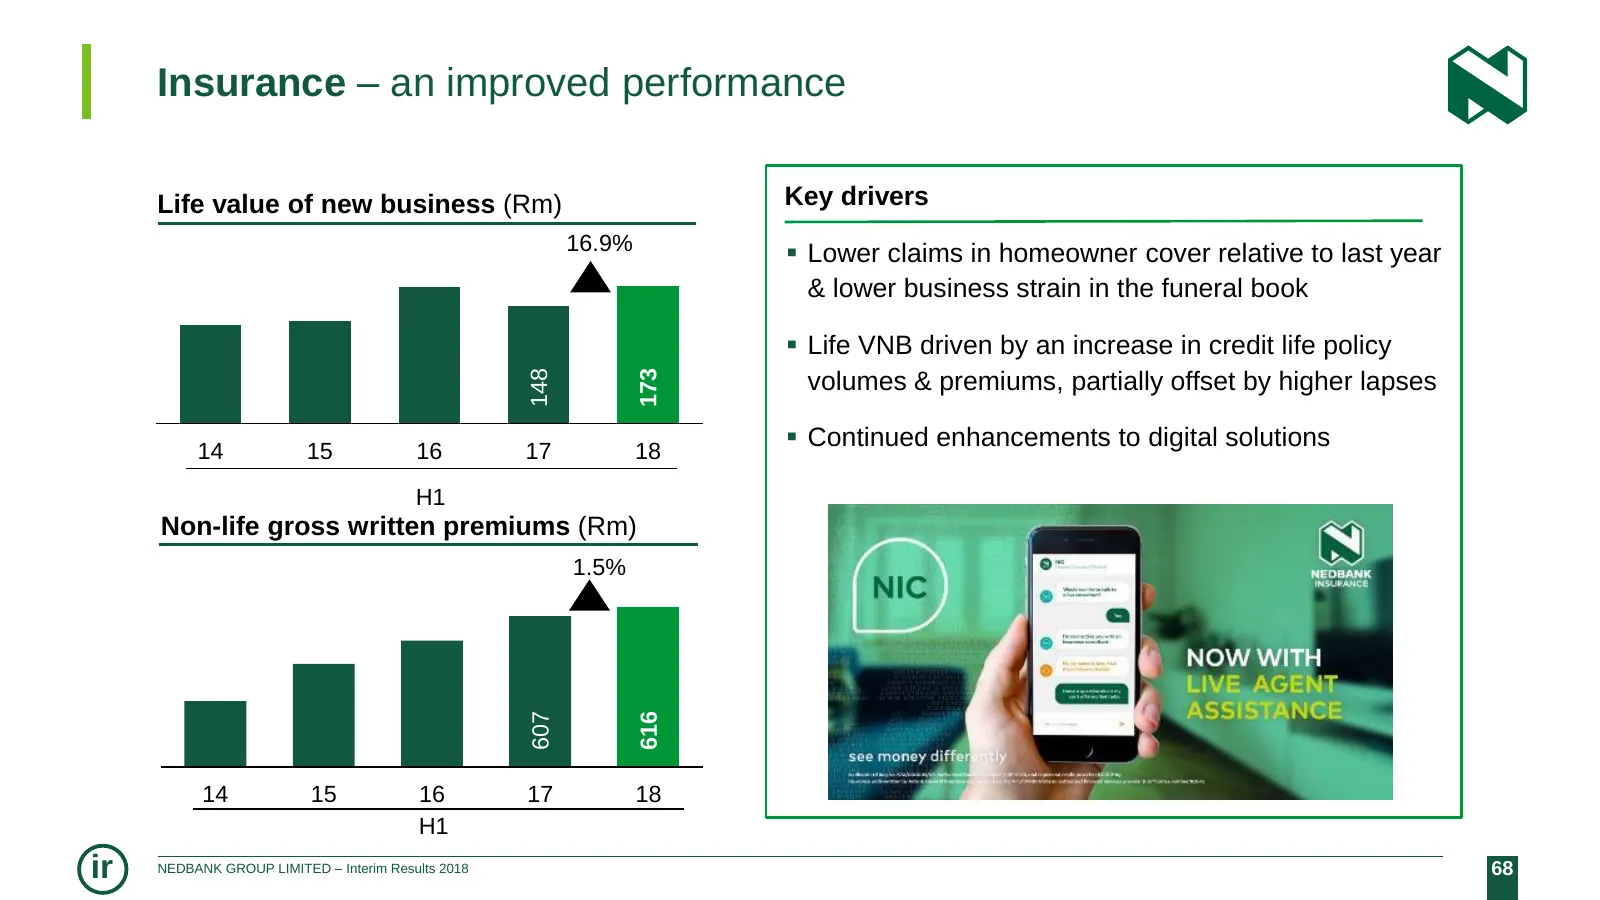
Insurance – an improved performance Life value of new business (Rm) Key drivers 16.9% Lower claims in homeowner cover relative to last year 200 & lower business strain in the funeral book 180 160 140 120 100 80 Life VNB driven by an increase in credit life policy 148 173 volumes & premiums, part
Slide 69: Enhancing client experience through digital innovation
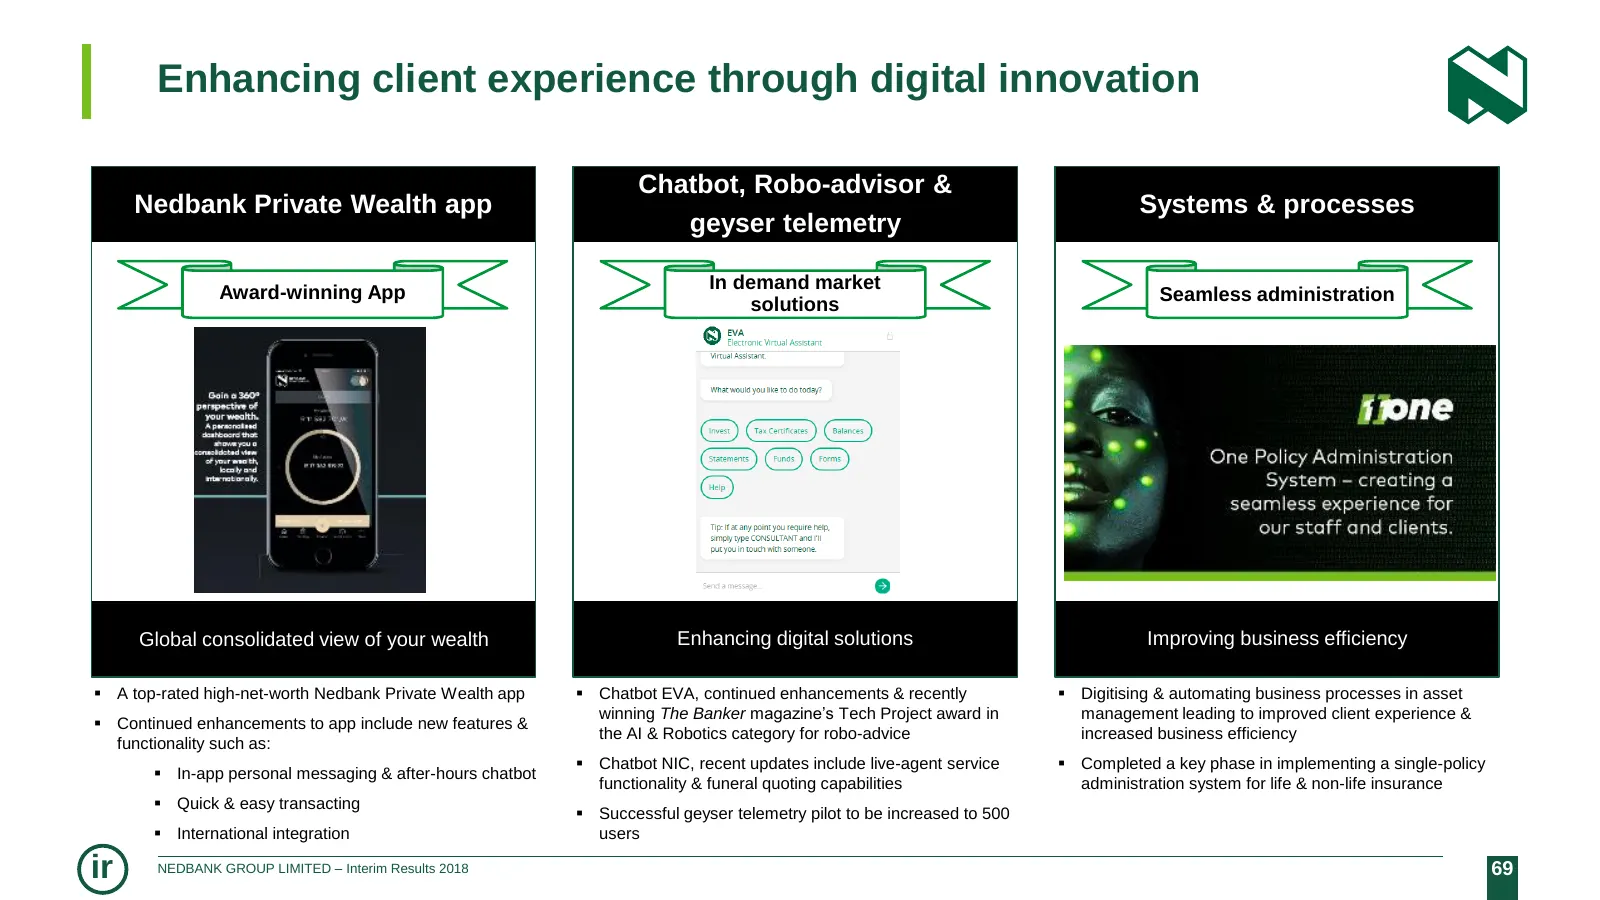
Enhancing client experience through digital innovation Chatbot, Robo-advisor & Nedbank Private Wealth app Systems & processes geyser telemetry Award-winning App In demand market solutions Seamless administration Global consolidated view of your wealth Enhancing digital solutions Improving business e
Slide 70: Prospects for Nedbank Wealth
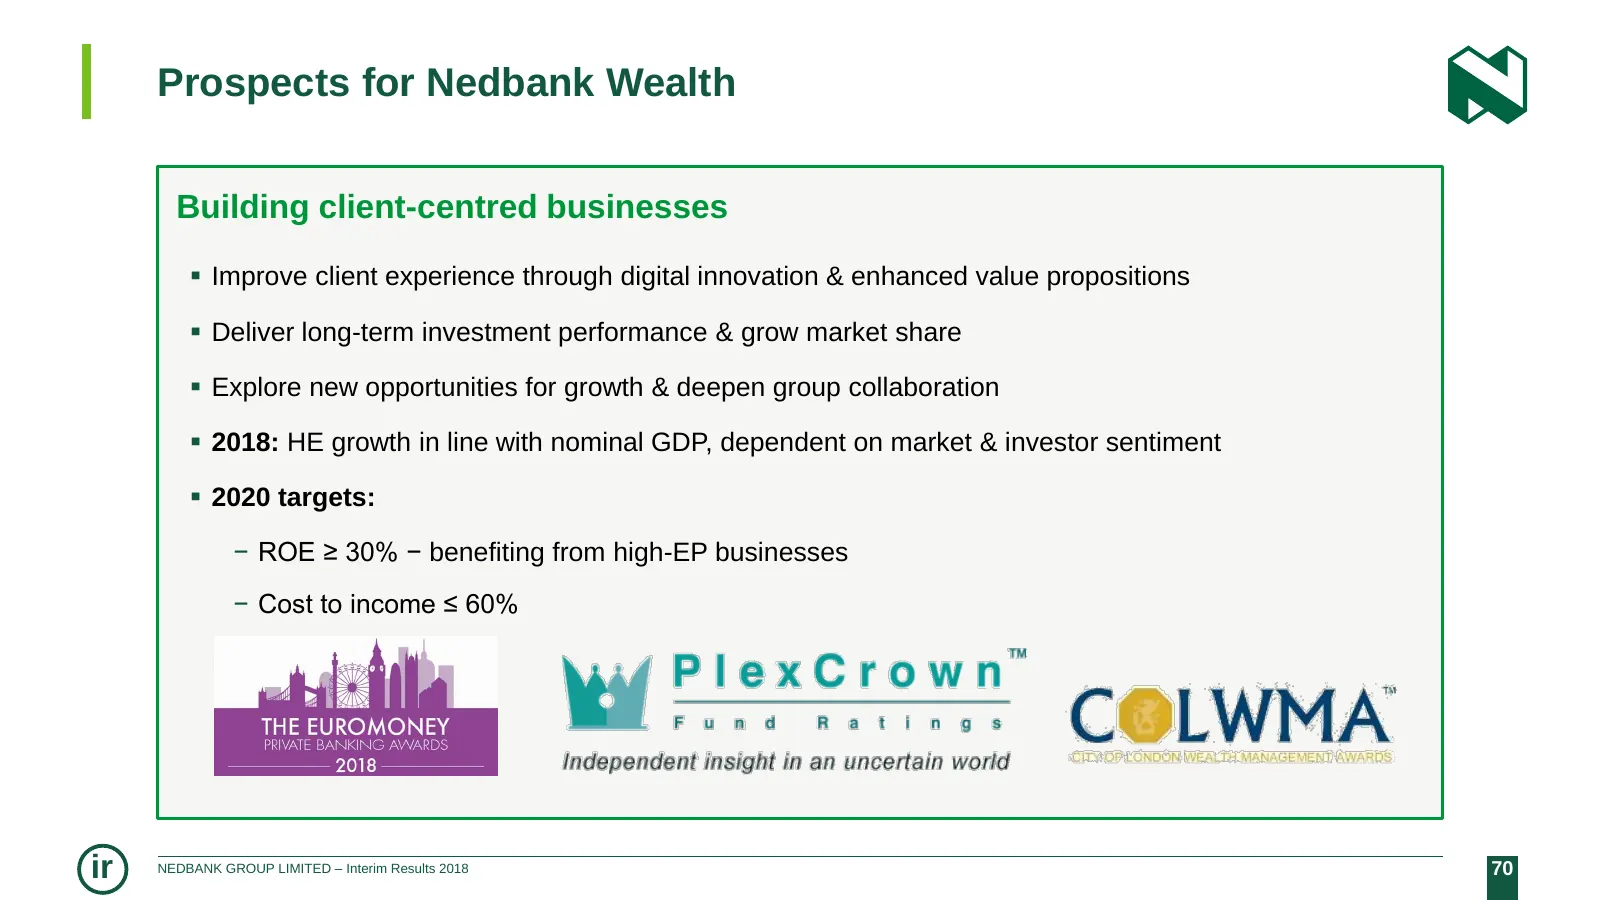
Prospects for Nedbank Wealth Building client-centred businesses Improve client experience through digital innovation & enhanced value propositions Deliver long-term investment performance & grow market share Explore new opportunities for growth & deepen group collaboration 2018: HE growth in

Slide 71: Rest of Africa
REST OF AFRICA SADC – good progress towards a scaled, economically profitable & client−focused business ETI – turnaround on track to recover value & increase returns MFUNDO NKUHLU ir NEDBANK GROUP LIMITED – Interim Results 2018 71
Slide 72: Rest of Africa – turnaround in ETI & improving SADC profitability
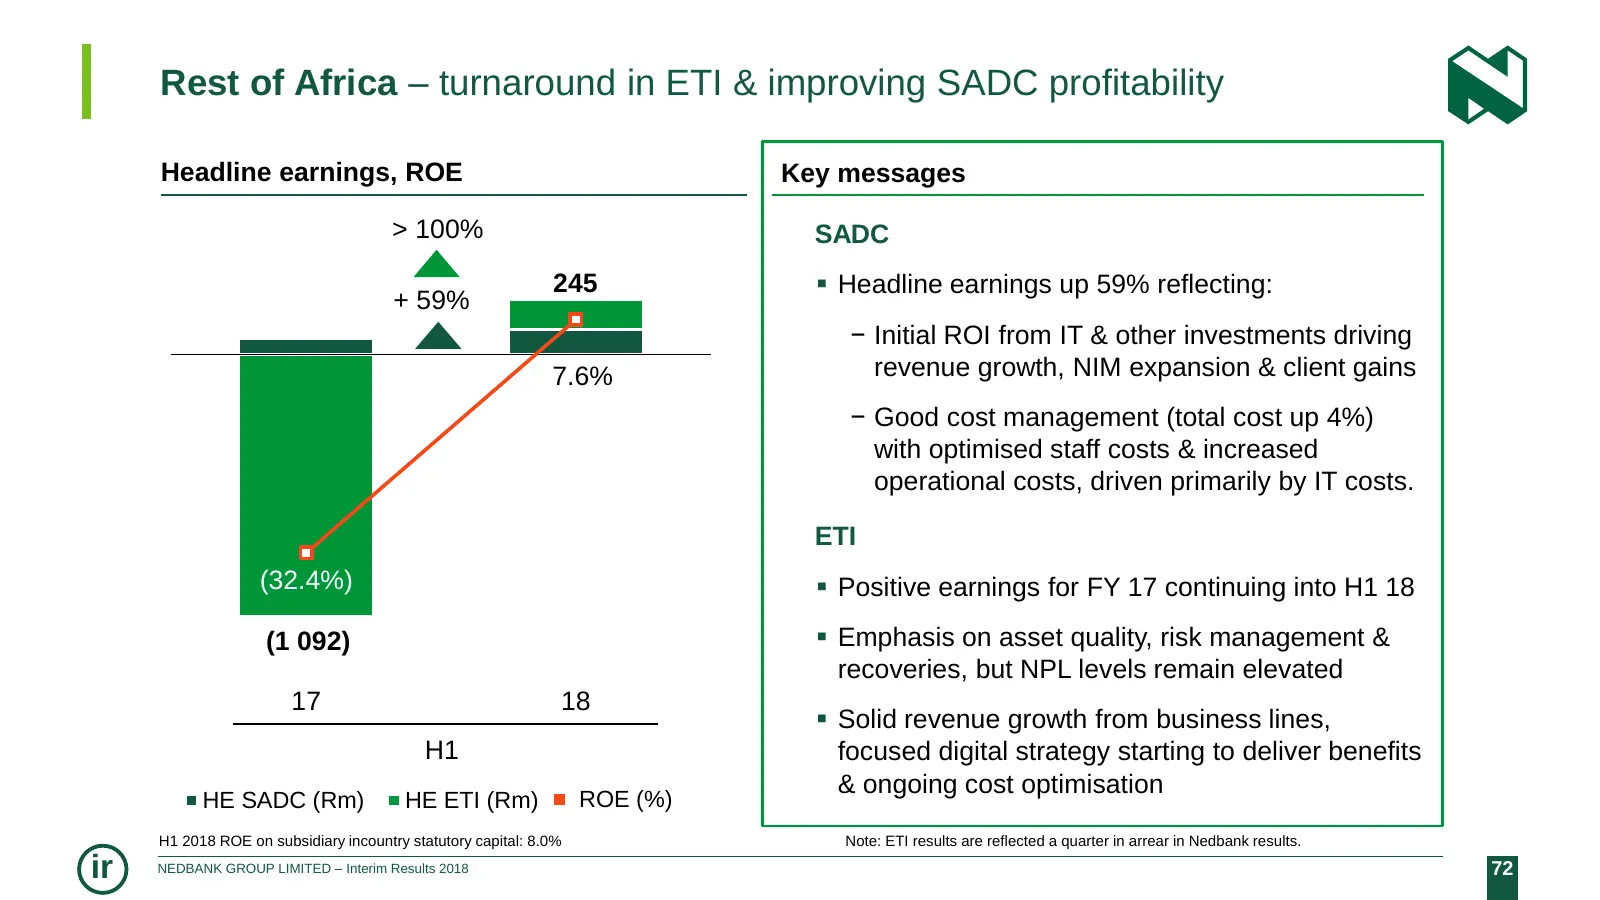
Rest of Africa – turnaround in ETI & improving SADC profitability Headline earnings, ROE Key messages 600.0 > 100% SADC 10 400.0 245 Headline earnings up 59% reflecting: 200.0 + 59% 0.0 5 − Initial ROI from IT & other investments driving 7.6% revenue growth, NIM expansion & client gains -200.0 0 −
Slide 73: Rest of Africa – financial highlights
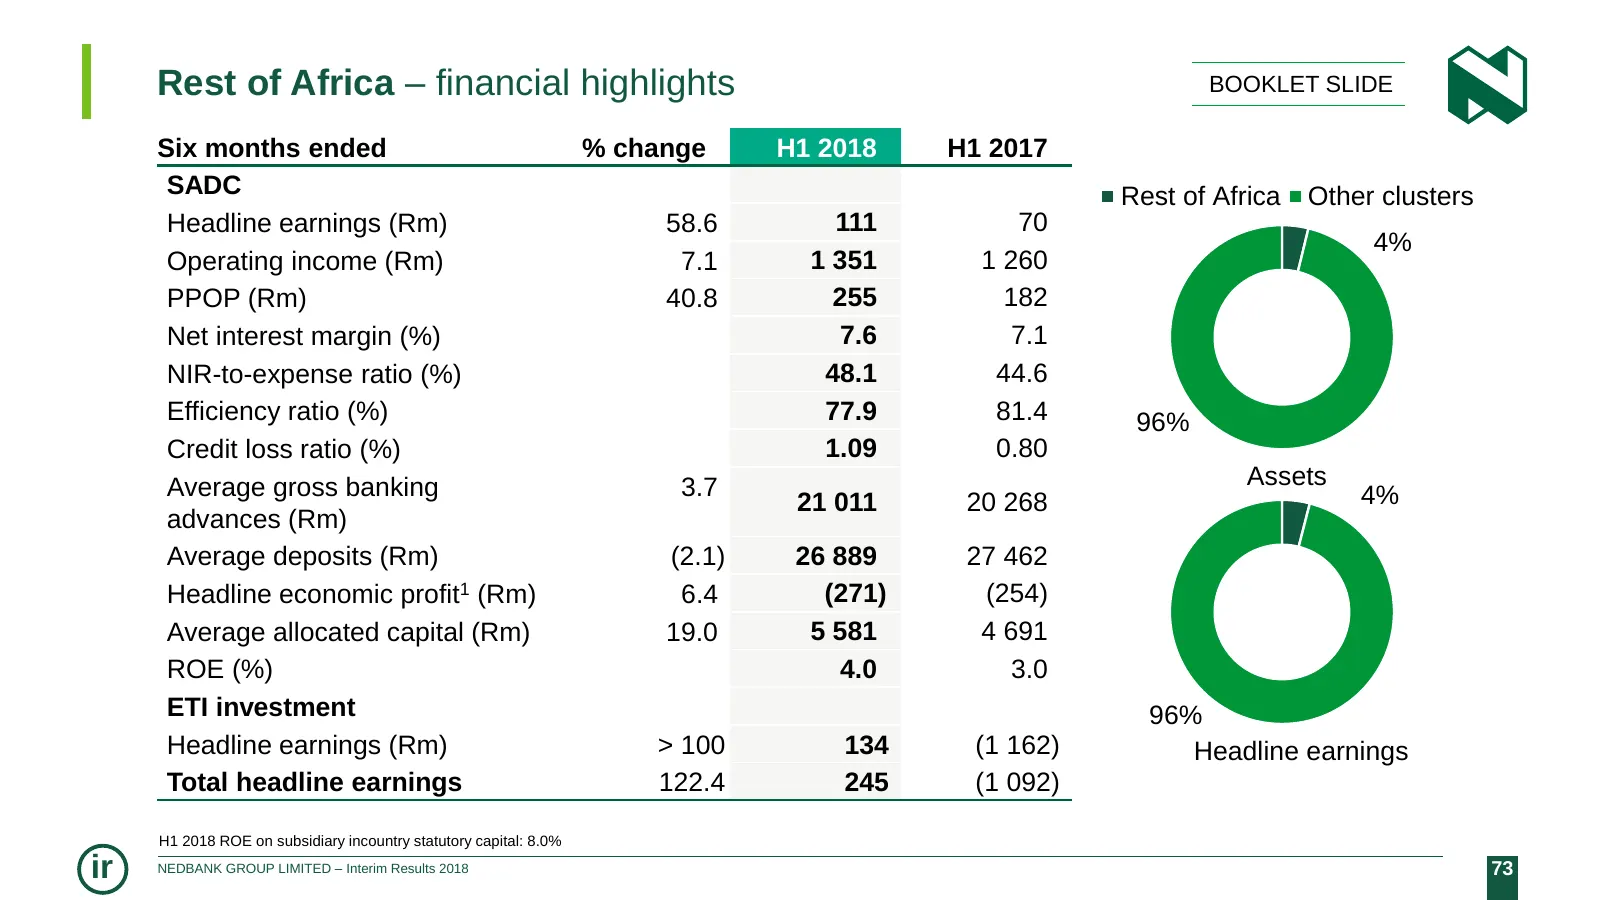
Rest of Africa – financial highlights BOOKLET SLIDE Six months ended % change H1 2018 H1 2017 SADC Rest of Africa Other clusters Headline earnings (Rm) 58.6 111 70 4% Operating income (Rm) 7.1 1 351 1 260 PPOP (Rm) 40.8 255 182 Net interest margin (%) 7.6 7.1 NIR-to-expense ratio (%) 48.1 44.6 Effic
Slide 74: SADC – steady growth across key financial drivers
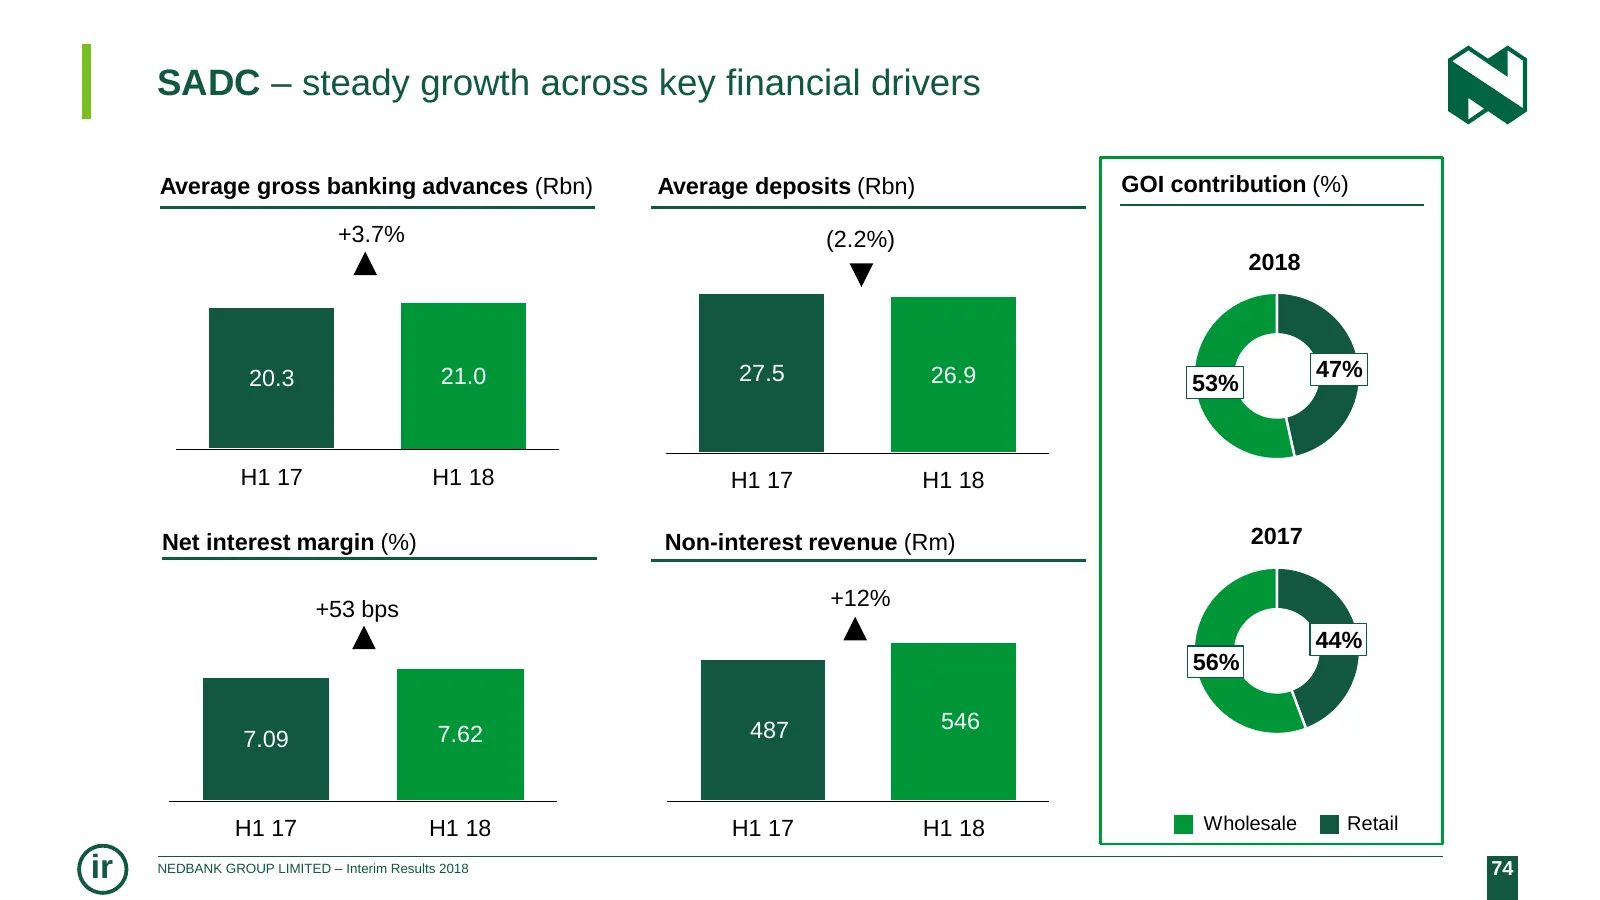
SADC – steady growth across key financial drivers Average gross banking advances (Rbn) Average deposits (Rbn) GOI contribution (%) +3.7% (2.2%) 2018 20.3 21.0 27.5 26.9 47% 53% H1 17 H1 18 H1 17 H1 18 Net interest margin (%) Non-interest revenue (Rm) 2017 +53 bps +12% 44% 56% 487 546 7.09 7.62 H1 17
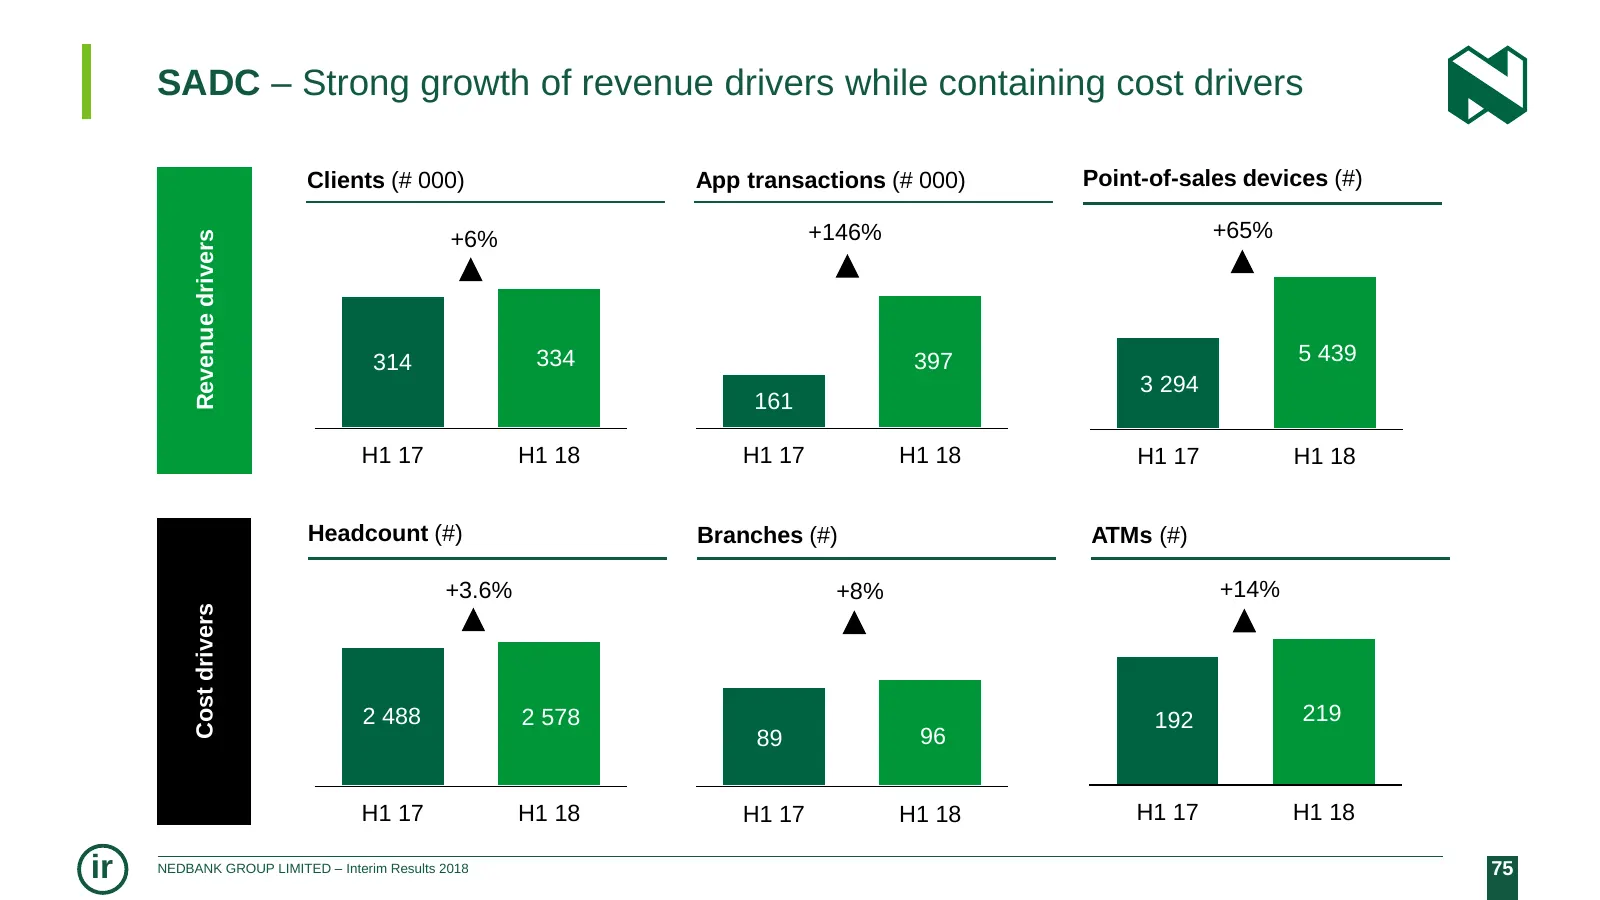
Slide 75: SADC – strong growth of revenue drivers
SADC – Strong growth of revenue drivers while containing cost drivers Clients (# 000) App transactions (# 000) Point-of-sales devices (#) +146% +65% Revenue drivers +6% 314 334 397 5 439 3 294 161 H1 17 H1 18 H1 17 H1 18 H1 17 H1 18 Headcount (#) Branches (#) ATMs (#) +3.6% +8% +14% Cost drivers 2 4
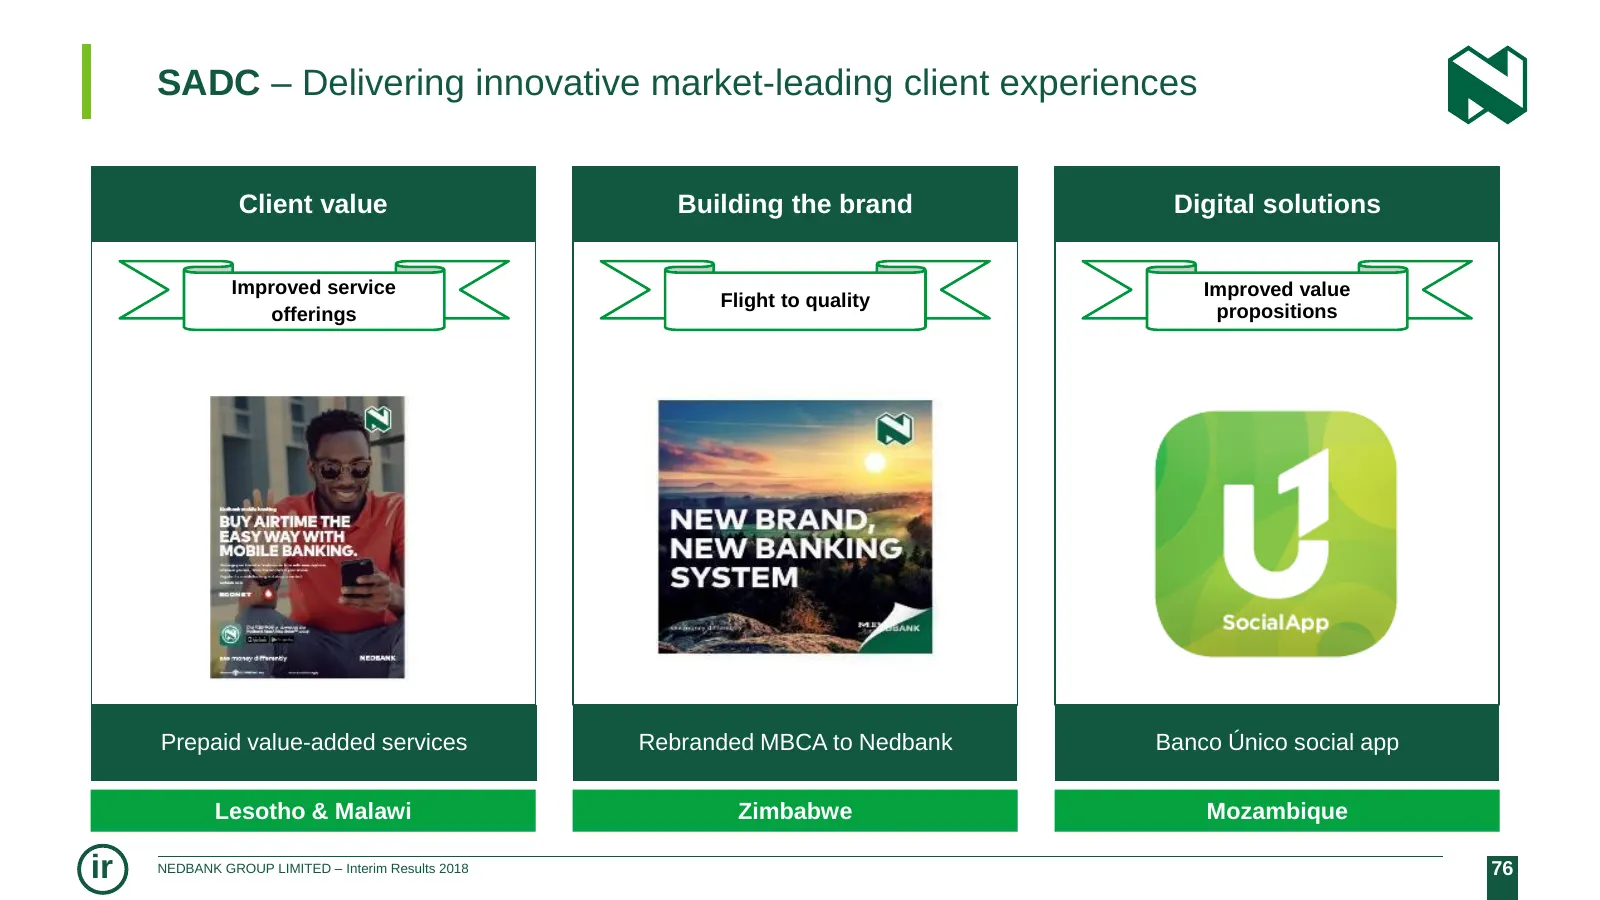
Slide 76: SADC – innovative market-leading client experiences
SADC – Delivering innovative market-leading client experiences Client value Building the brand Digital solutions Improved service Improved value Flight to quality offerings propositions Prepaid value-added services Rebranded MBCA to Nedbank Banco Único social app Lesotho & Malawi Zimbabwe Mozambique
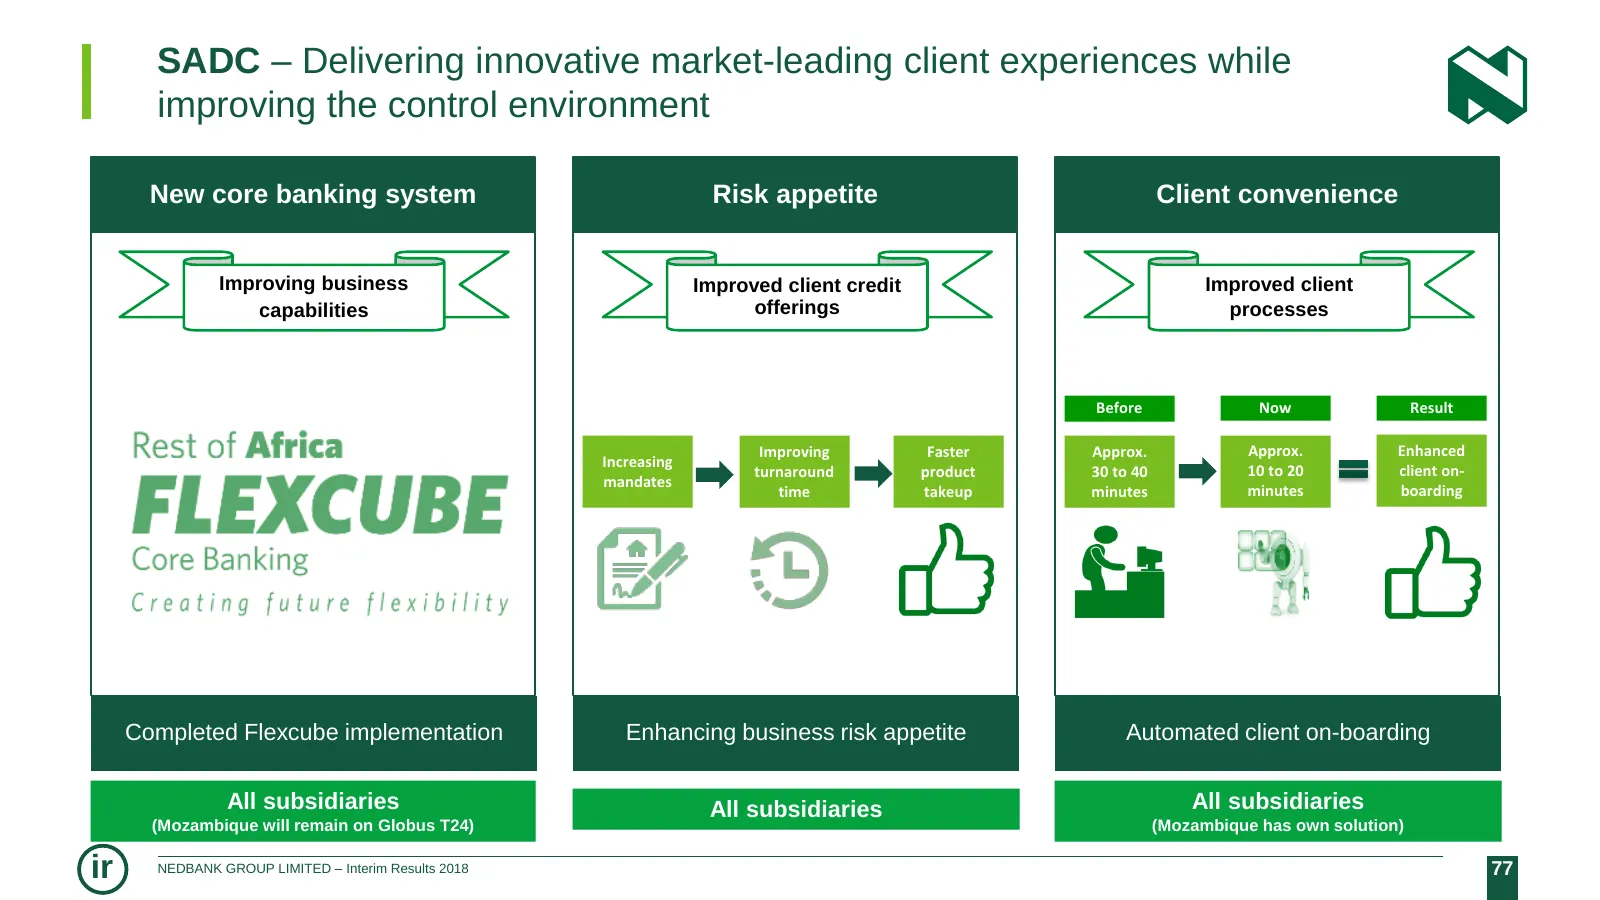
Slide 77: SADC – client experiences while improving control environment
SADC – Delivering innovative market-leading client experiences while improving the control environment New core banking system Risk appetite Client convenience Improving business Improved client credit Improved client capabilities offerings processes Before Now Result Improving Faster Approx. Approx
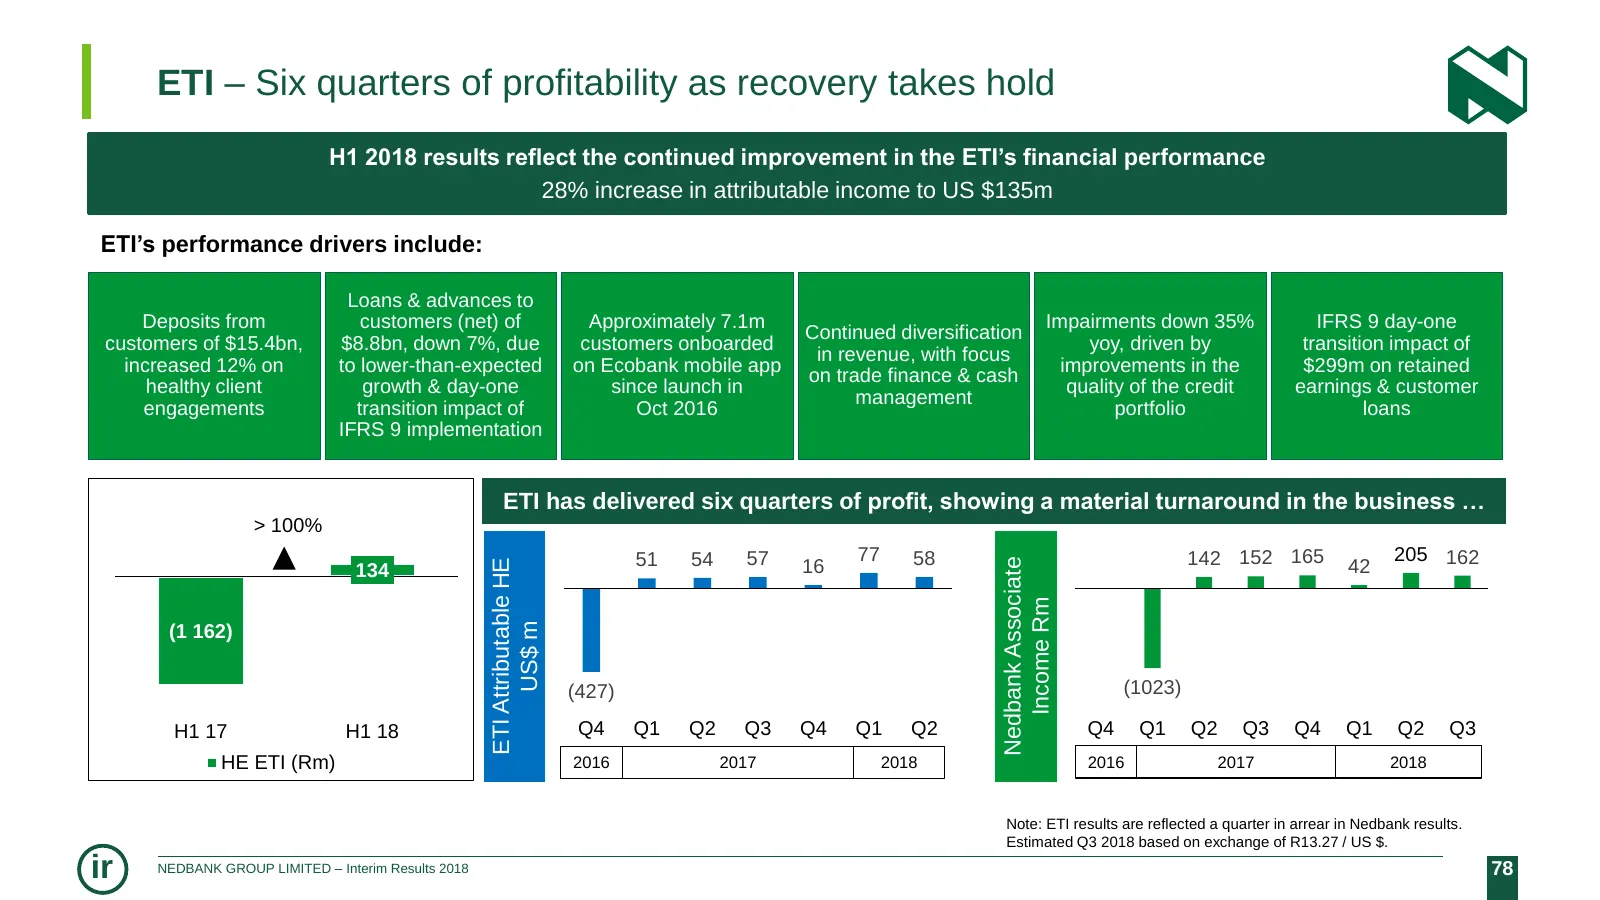
Slide 78: ETI – six quarters of profitability
ETI – Six quarters of profitability as recovery takes hold H1 2018 results reflect the continued improvement in the ETI’s financial performance 28% increase in attributable income to US $135m ETI’s performance drivers include: Loans & advances to Deposits from customers (net) of Approximately 7.1m I
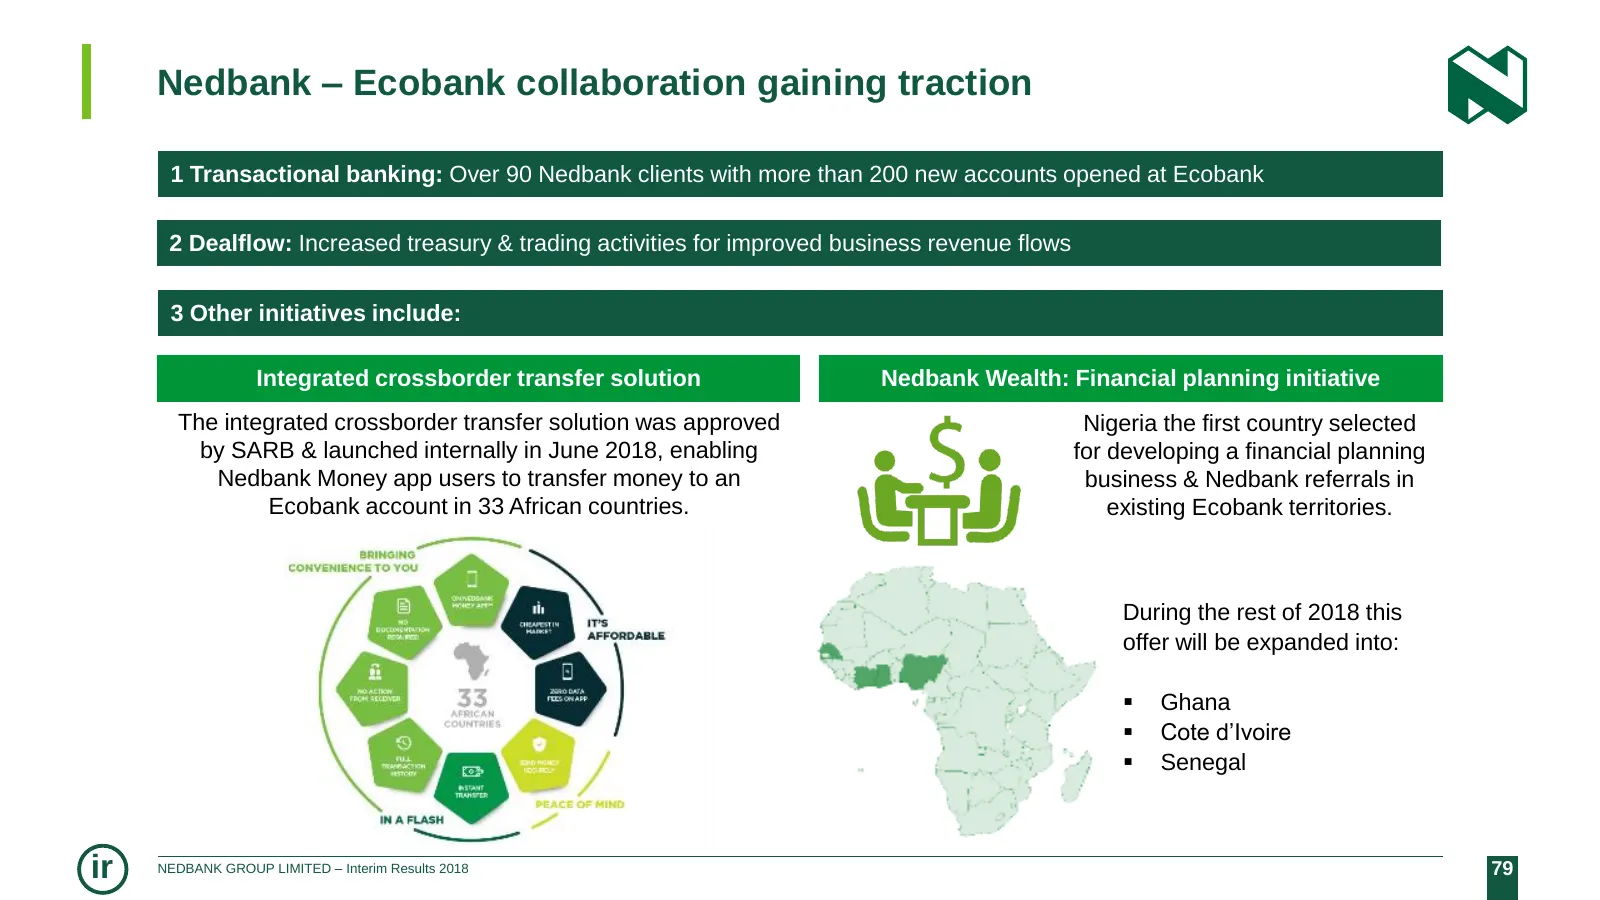
Slide 79: Nedbank – Ecobank collaboration gaining traction
Nedbank – Ecobank collaboration gaining traction 1 Transactional banking: Over 90 Nedbank clients with more than 200 new accounts opened at Ecobank 2 Dealflow: Increased treasury & trading activities for improved business revenue flows 3 Other initiatives include: Integrated crossborder transfer sol
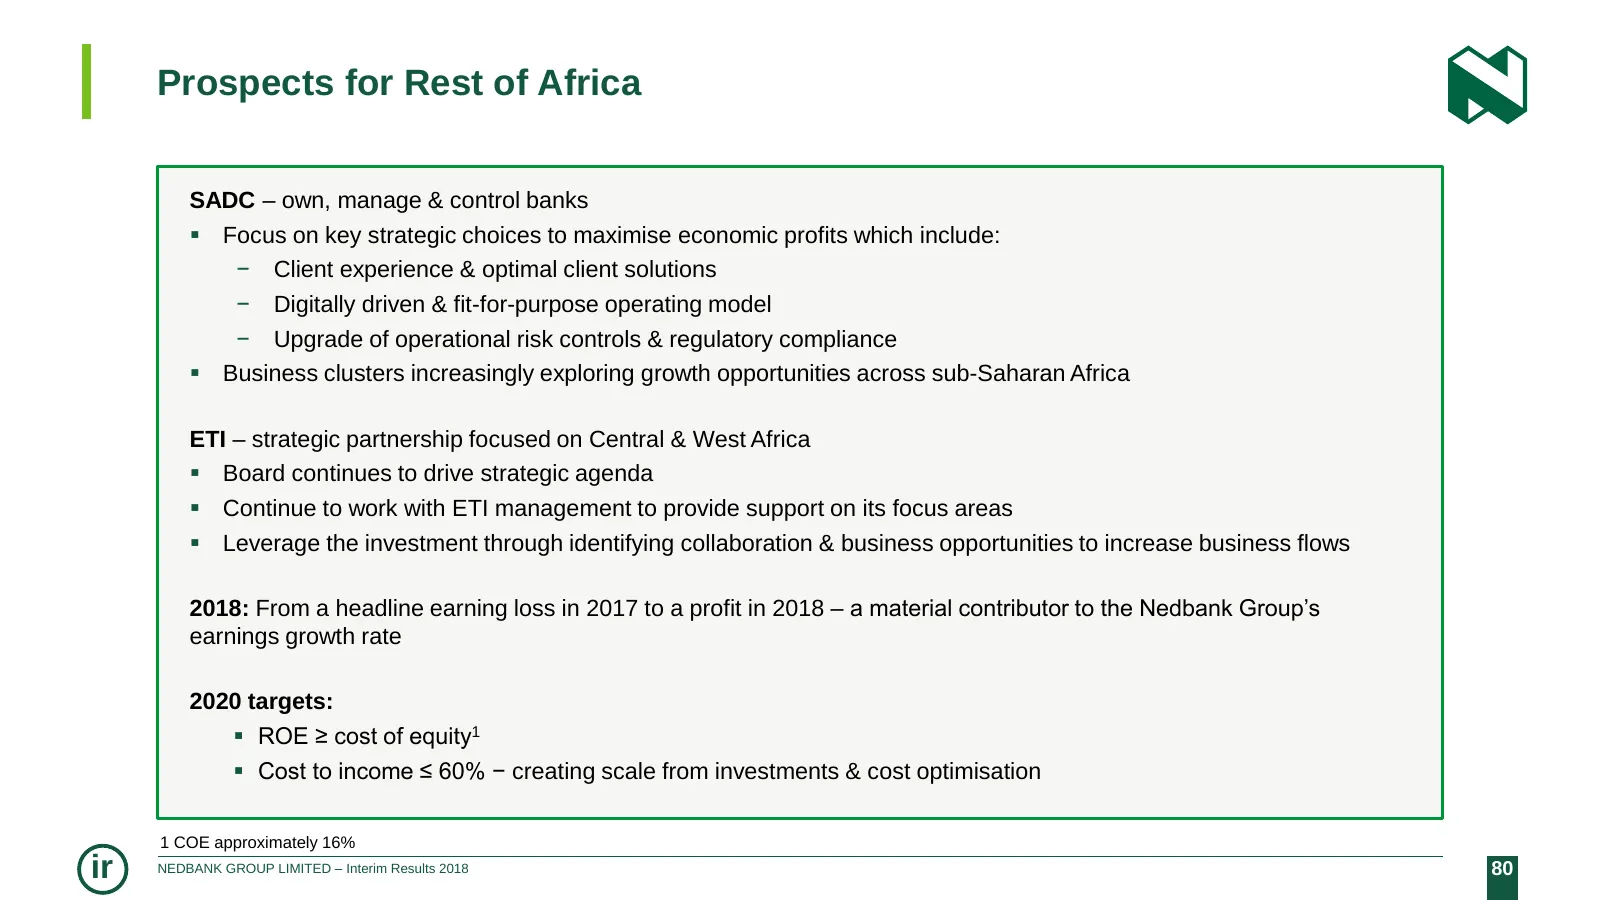
Slide 80: Prospects for Rest of Africa
Prospects for Rest of Africa SADC – own, manage & control banks Focus on key strategic choices to maximise economic profits which include: − Client experience & optimal client solutions − Digitally driven & fit-for-purpose operating model − Upgrade of operational risk controls & regulatory complia

Slide 81: Strategy & 2018 Guidance
STRATEGY & 2018 GUIDANCE Prospects for H2 2018 & beyond improving, driven by the environment & ongoing delivery on our strategy MIKE BROWN ir NEDBANK GROUP LIMITED – Interim Results 2018 81
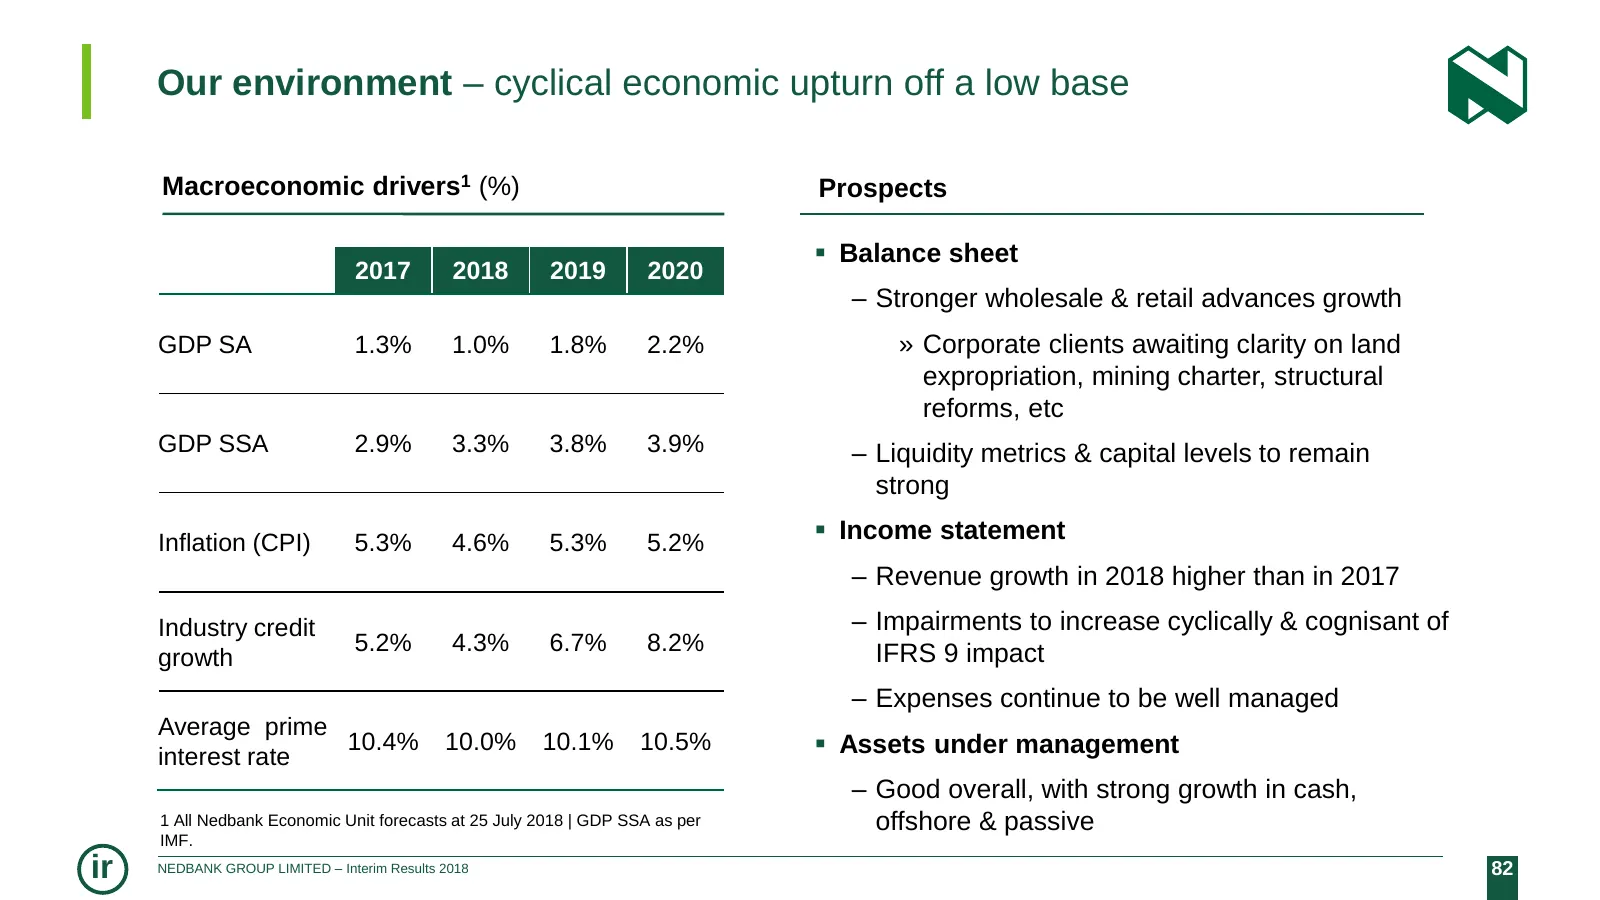
Slide 82: Our environment – cyclical economic upturn off a low base
Our environment – cyclical economic upturn off a low base Macroeconomic drivers1 (%) Prospects Balance sheet 2017 2018 2019 2020 – Stronger wholesale & retail advances growth GDP SA 1.3% 1.0% 1.8% 2.2% » Corporate clients awaiting clarity on land expropriation, mining charter, structural reforms,
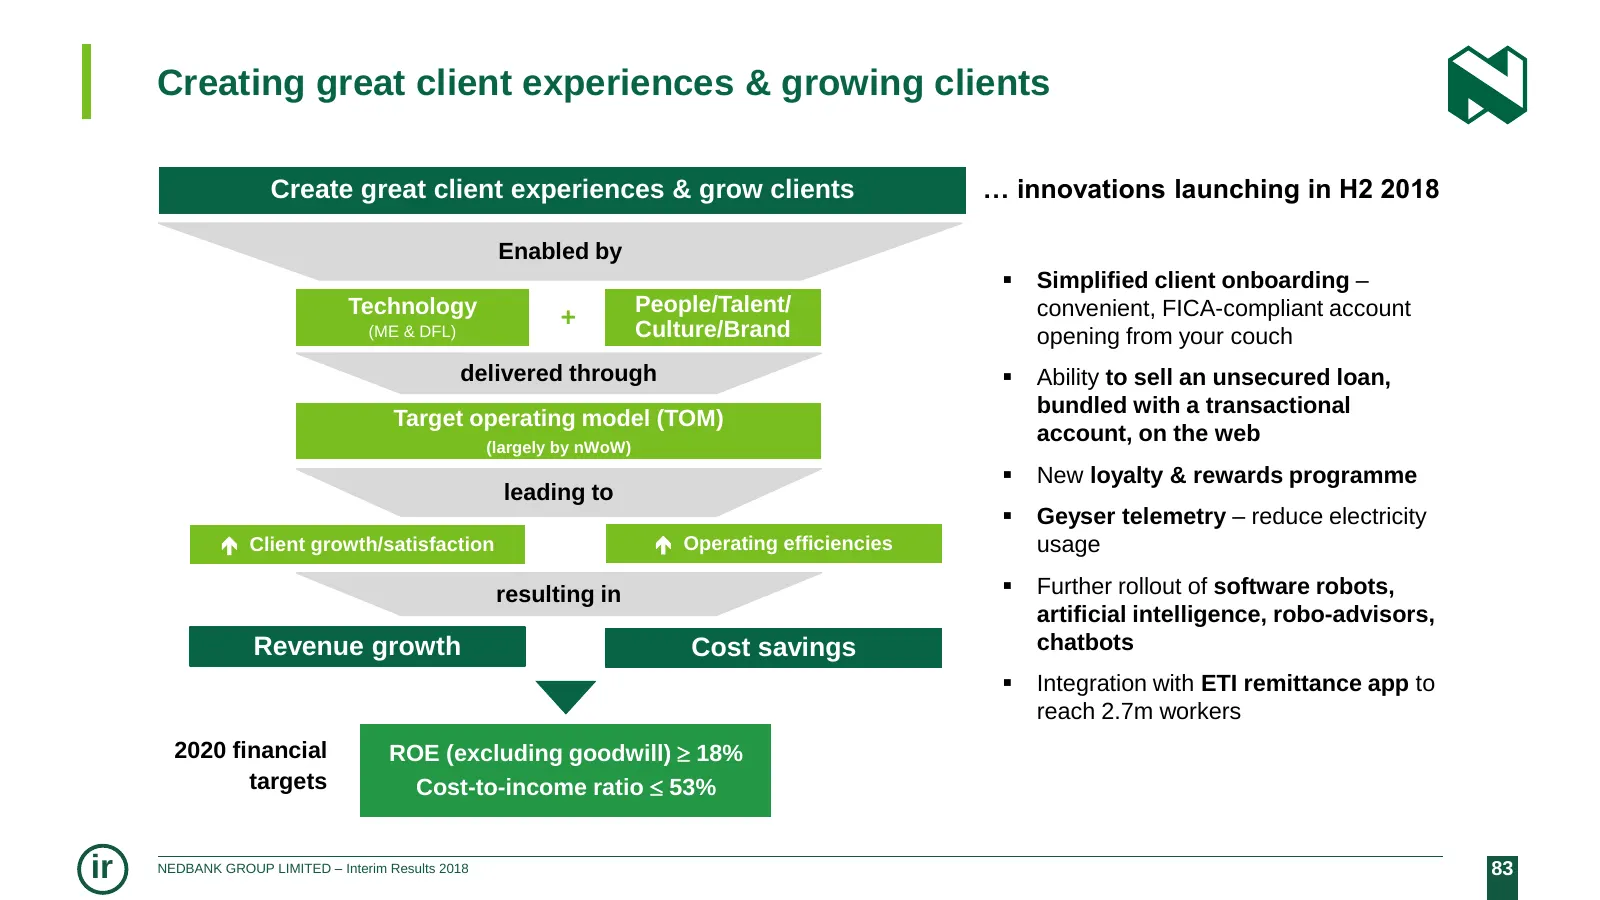
Slide 83: Creating great client experiences & growing clients
Creating great client experiences & growing clients Create great client experiences & grow clients … innovations launching in H2 2018 Enabled by Simplified client onboarding – Technology People/Talent/ convenient, FICA-compliant account (ME & DFL) + Culture/Brand opening from your couch delivered
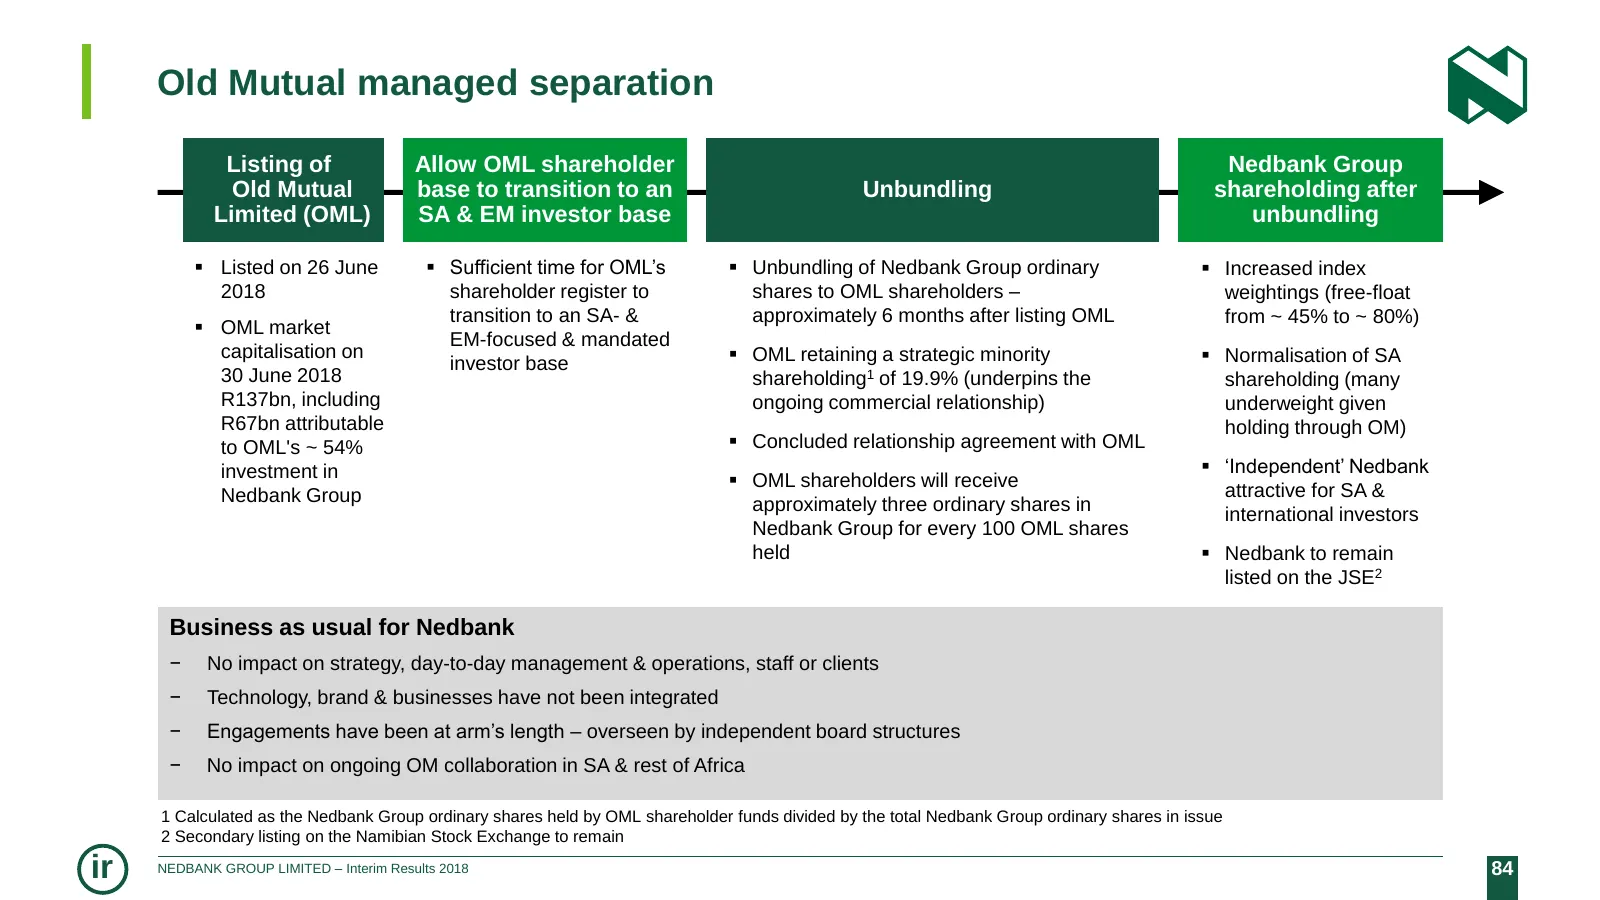
Slide 84: Old Mutual managed separation
Old Mutual managed separation Listing of Allow OML shareholder Nedbank Group Old Mutual base to transition to an Unbundling shareholding after Limited (OML) SA & EM investor base unbundling Listed on 26 June Sufficient time for OML’s Unbundling of Nedbank Group ordinary Increased index 2018
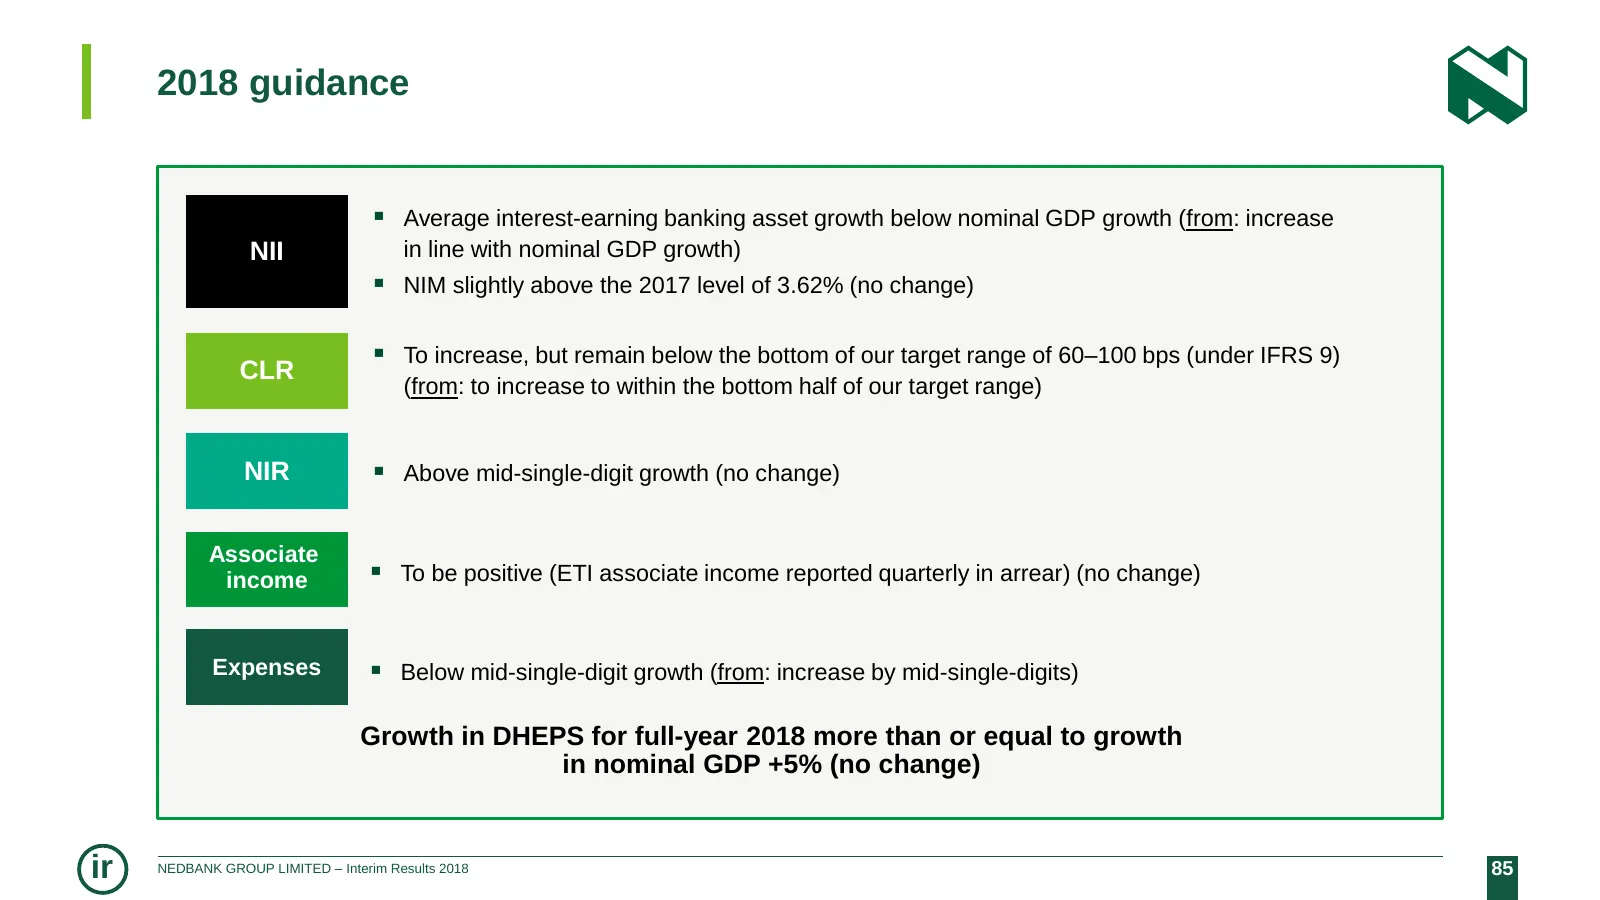
Slide 85: 2018 guidance
2018 guidance Average interest-earning banking asset growth below nominal GDP growth (from: increase NII in line with nominal GDP growth) NIM slightly above the 2017 level of 3.62% (no change) To increase, but remain below the bottom of our target range of 60–100 bps (under IFRS 9) CLR (from:
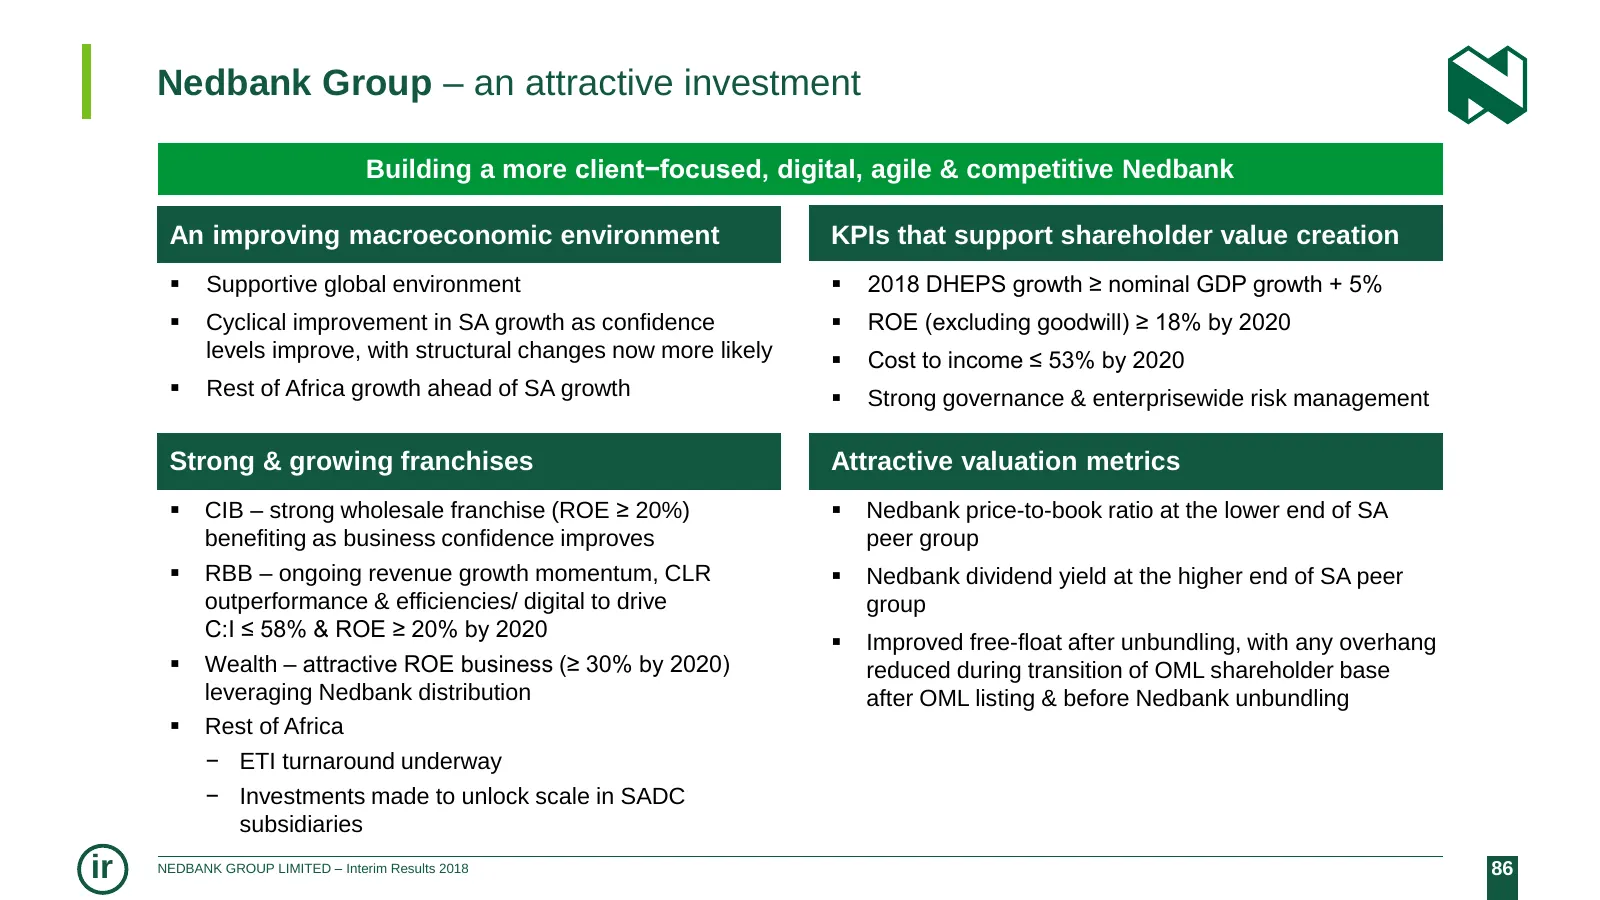
Slide 86: Nedbank Group – an attractive investment
Nedbank Group – an attractive investment Building a more client−focused, digital, agile & competitive Nedbank An improving macroeconomic environment KPIs that support shareholder value creation Supportive global environment 2018 DHEPS growth ≥ nominal GDP growth + 5% Cyclical improvement in SA

Slide 87: Thank you
NEDBANK ee p g o 2 oO ne = ao) ~ o = 3 E ® o w
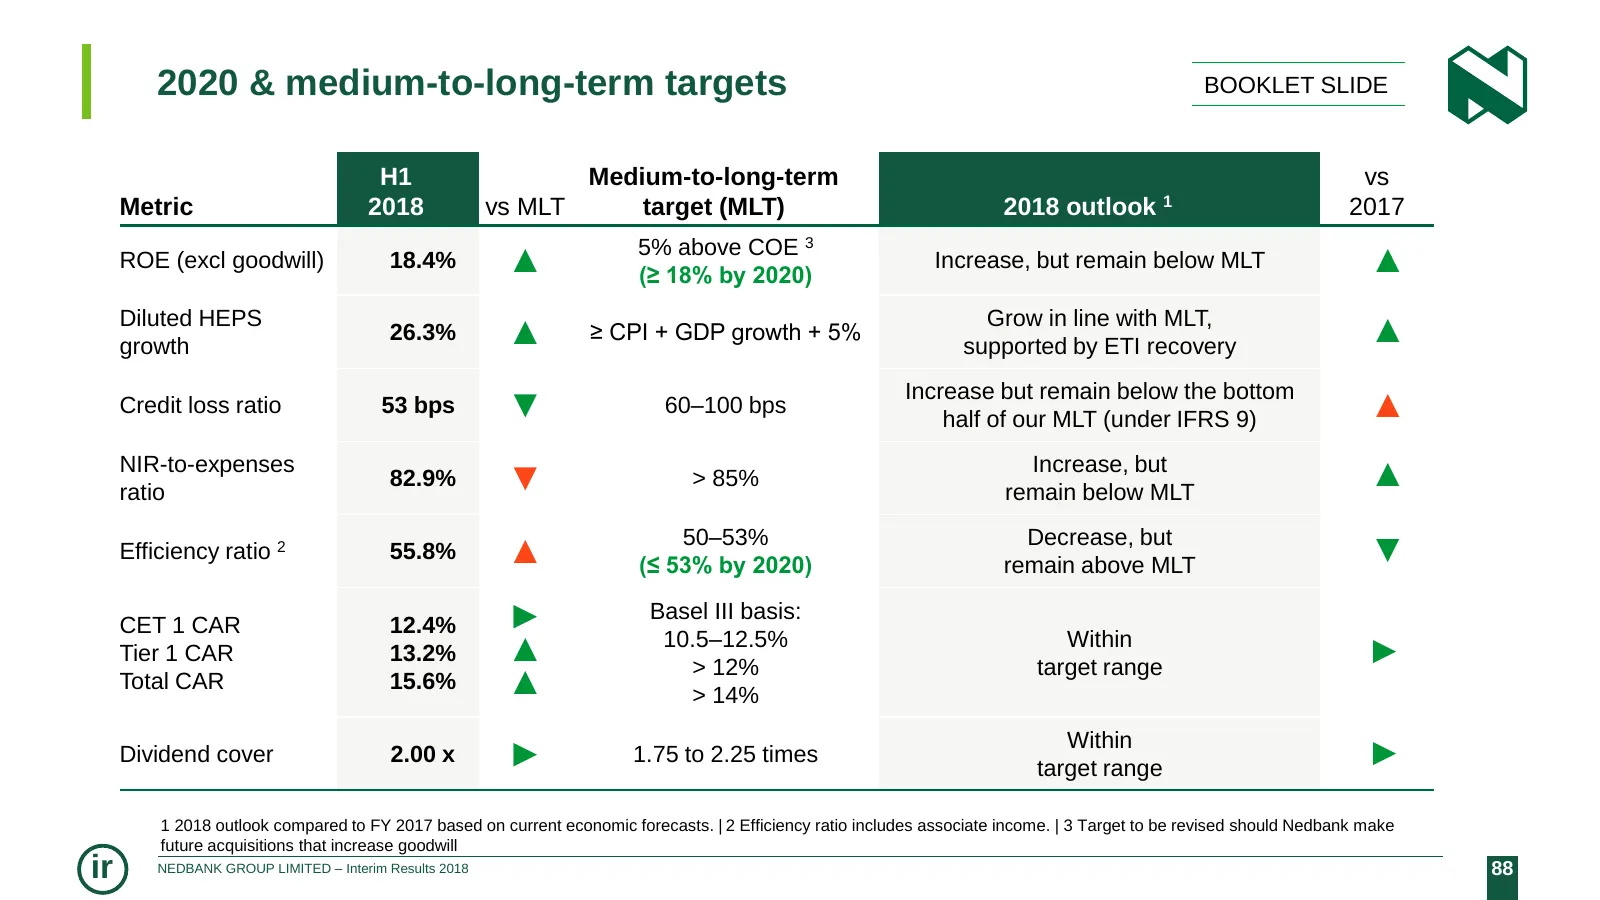
Slide 88: 2020 & medium-to-long-term targets
2020 & medium-to-long-term targets BOOKLET SLIDE H1 Medium-to-long-term vs Metric 2018 vs MLT target (MLT) 2018 outlook 1 2017 5% above COE 3 ROE (excl goodwill) 18.4% ▲ (≥ 18% by 2020) Increase, but remain below MLT ▲ Diluted HEPS Grow in line with MLT, growth 26.3% ▲ ≥ CPI + GDP growth + 5% suppor
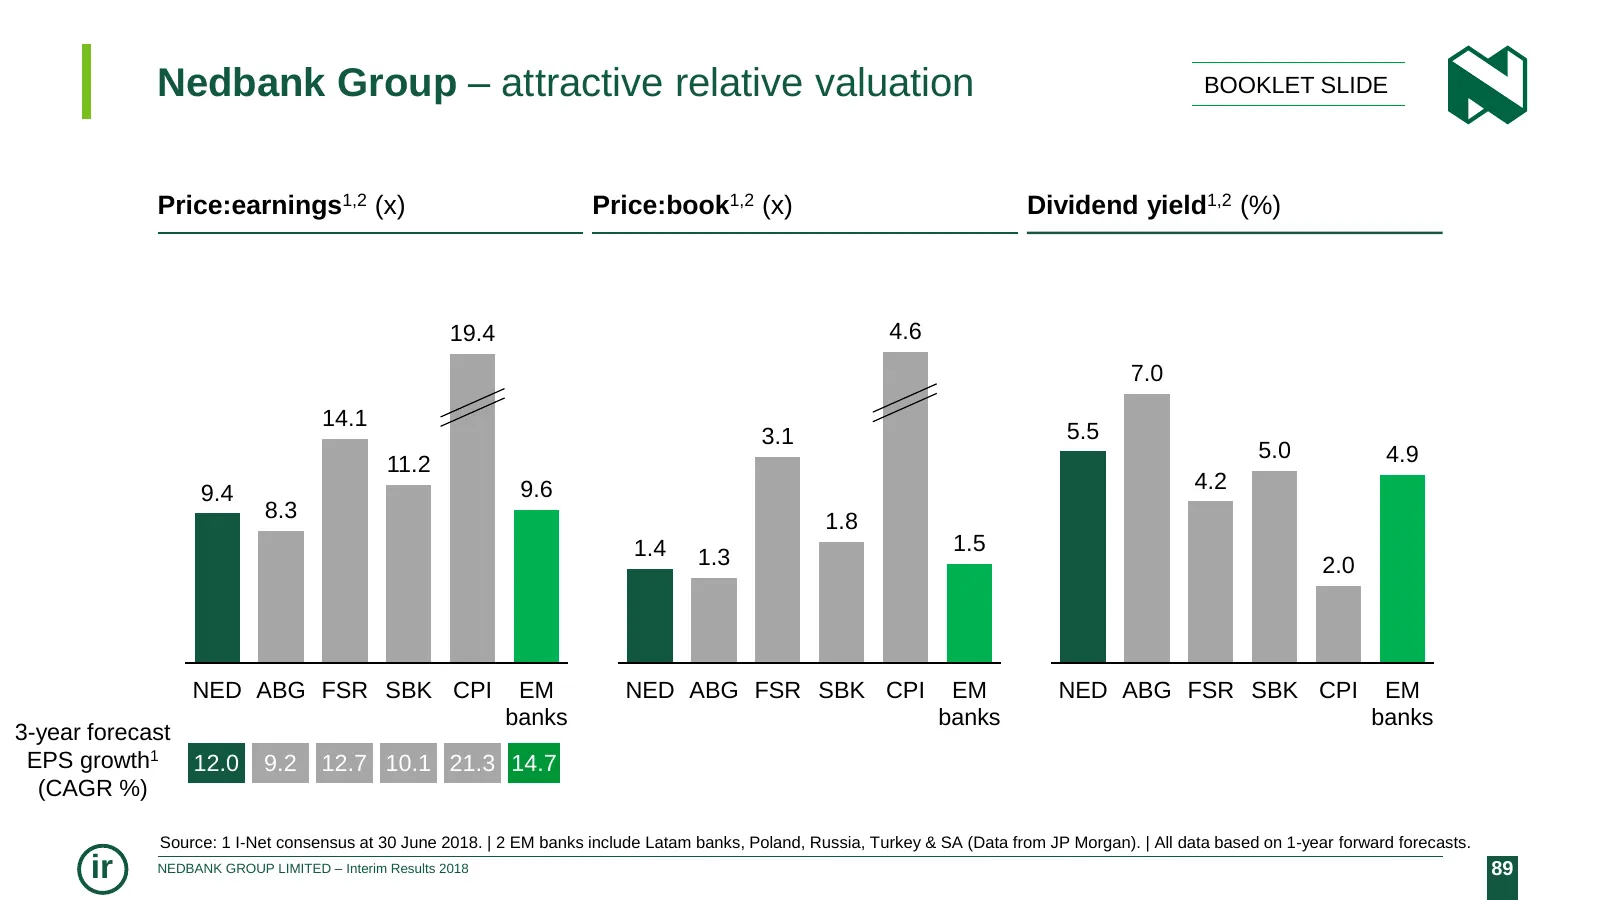
Slide 89: Nedbank Group – attractive relative valuation
Nedbank Group – attractive relative valuation BOOKLET SLIDE Price:earnings1,2 (x) Price:book1,2 (x) Dividend yield1,2 (%) 19.4 4.6 7.0 14.1 3.1 5.5 5.0 4.9 11.2 9.6 4.2 9.4 8.3 1.8 1.4 1.5 1.3 2.0 NED ABG FSR SBK CPI EM NED ABG FSR SBK CPI EM NED ABG FSR SBK CPI EM banks banks banks 3-year forecast
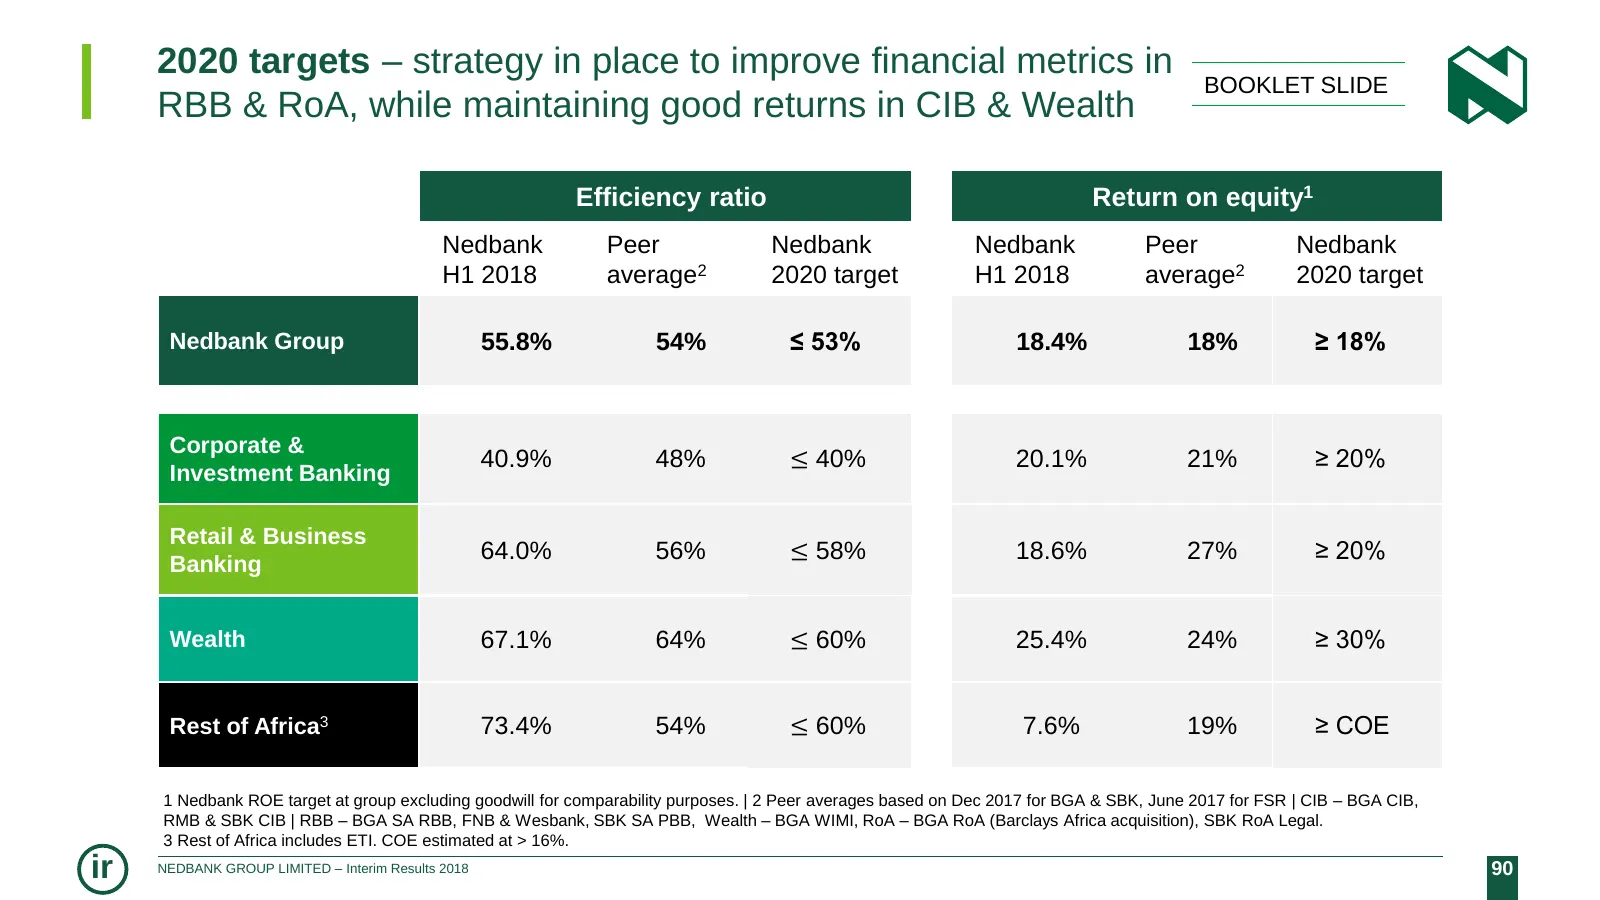
Slide 90: 2020 targets – strategy to improve financial metrics
2020 targets – strategy in place to improve financial metrics in BOOKLET SLIDE RBB & RoA, while maintaining good returns in CIB & Wealth Efficiency ratio Return on equity1 Nedbank Peer Nedbank Nedbank Peer Nedbank H1 2018 average2 2020 target H1 2018 average2 2020 target Nedbank Group 55.8% 54% ≤ 53
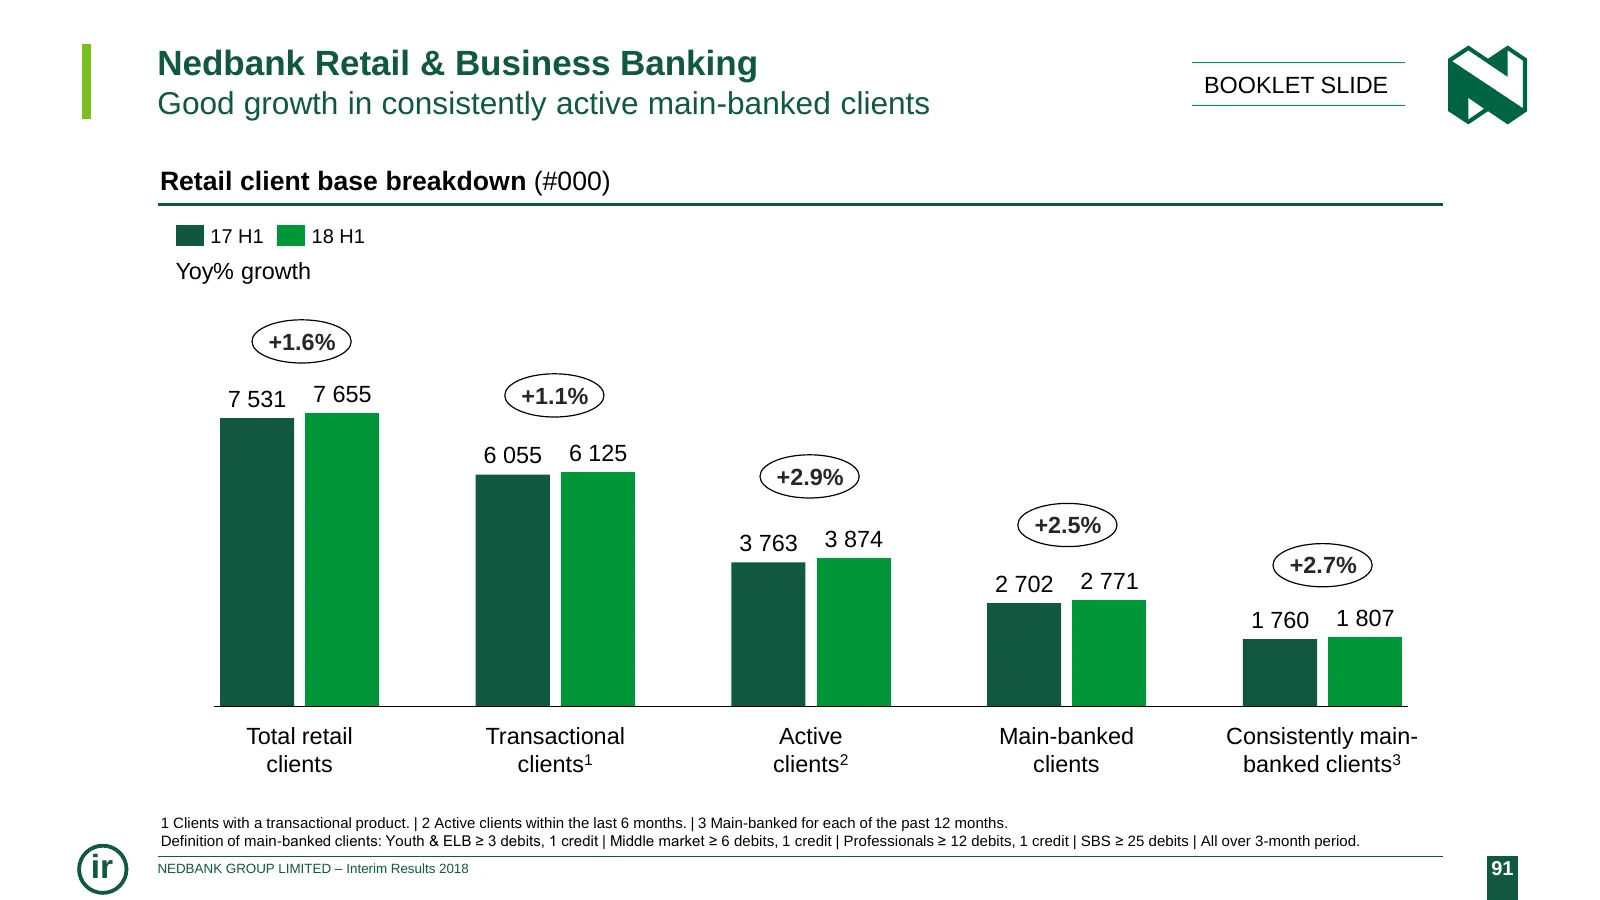
Slide 91: RBB: Good growth in consistently active main-banked clients
Nedbank Retail & Business Banking BOOKLET SLIDE Good growth in consistently active main-banked clients Retail client base breakdown (#000) 17 H1 18 H1 Yoy% growth +1.6% 7 531 7 655 +1.1% 6 055 6 125 +2.9% +2.5% 3 763 3 874 +2.7% 2 702 2 771 1 760 1 807 Total retail Transactional Active Main-banked C
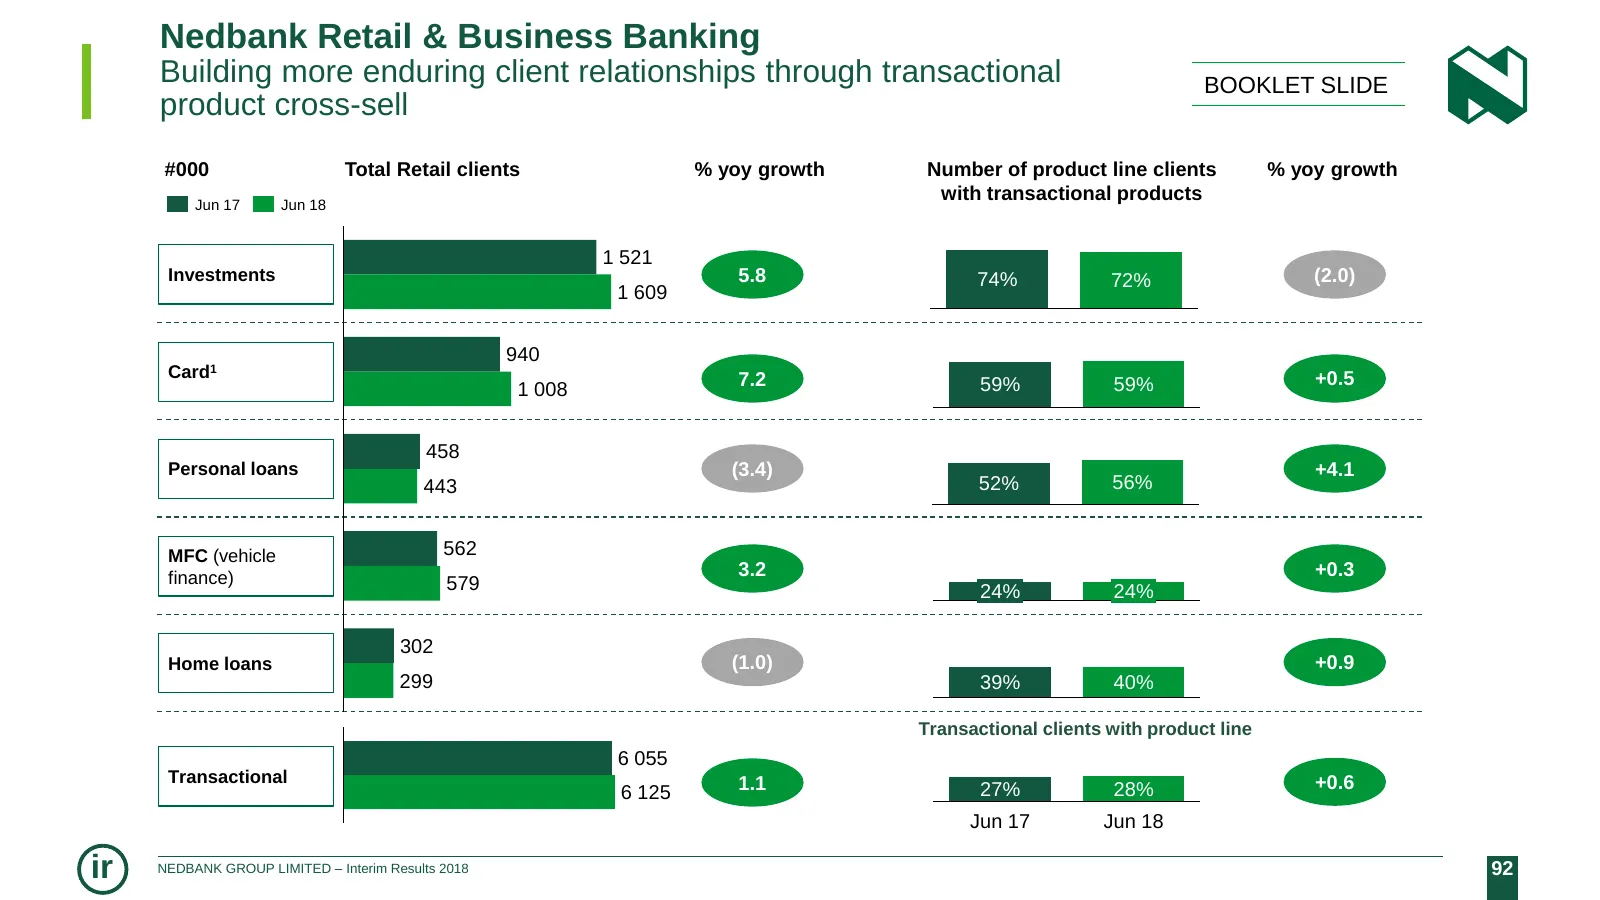
Slide 92: RBB: Building enduring client relationships through cross-sell
Nedbank Retail & Business Banking Building more enduring client relationships through transactional BOOKLET SLIDE product cross-sell #000 Total Retail clients % yoy growth Number of product line clients % yoy growth Jun 17 Jun 18 with transactional products 1 521 Investments 5.8 74% 72% (2.0) 1 609
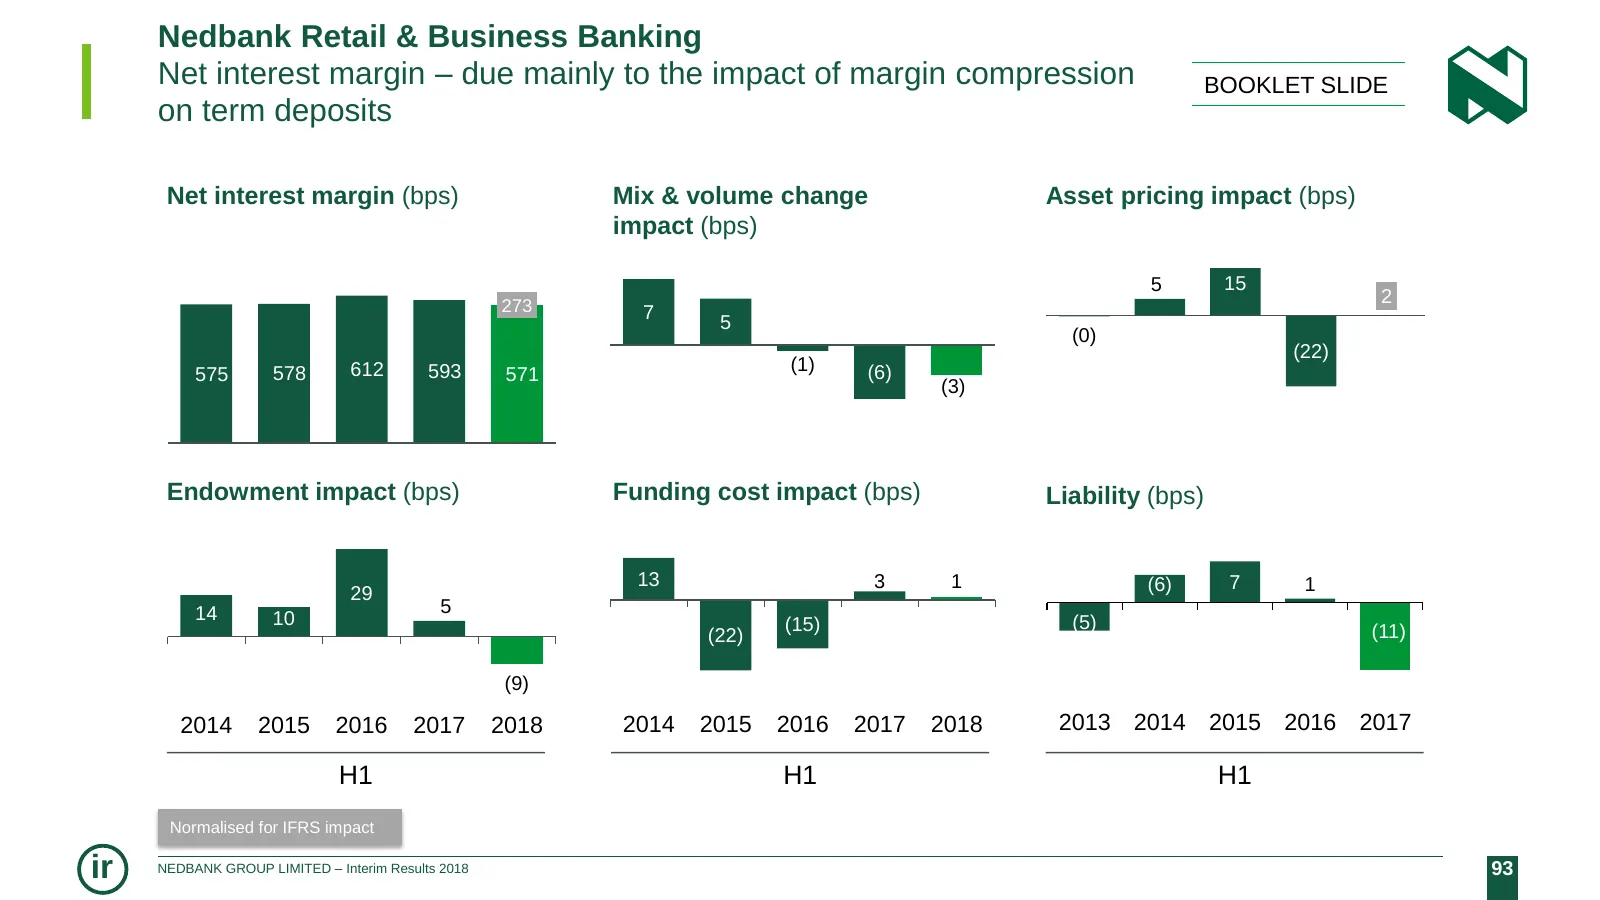
Slide 93: RBB: Net interest margin – margin compression on term deposits
Nedbank Retail & Business Banking Net interest margin – due mainly to the impact of margin compression BOOKLET SLIDE on term deposits Net interest margin (bps) Mix & volume change Asset pricing impact (bps) impact (bps) 5 15 273 2 7 5 (0) (22) 575 578 612 593 (1) (6) 571 (3) Endowment impact (bps) F
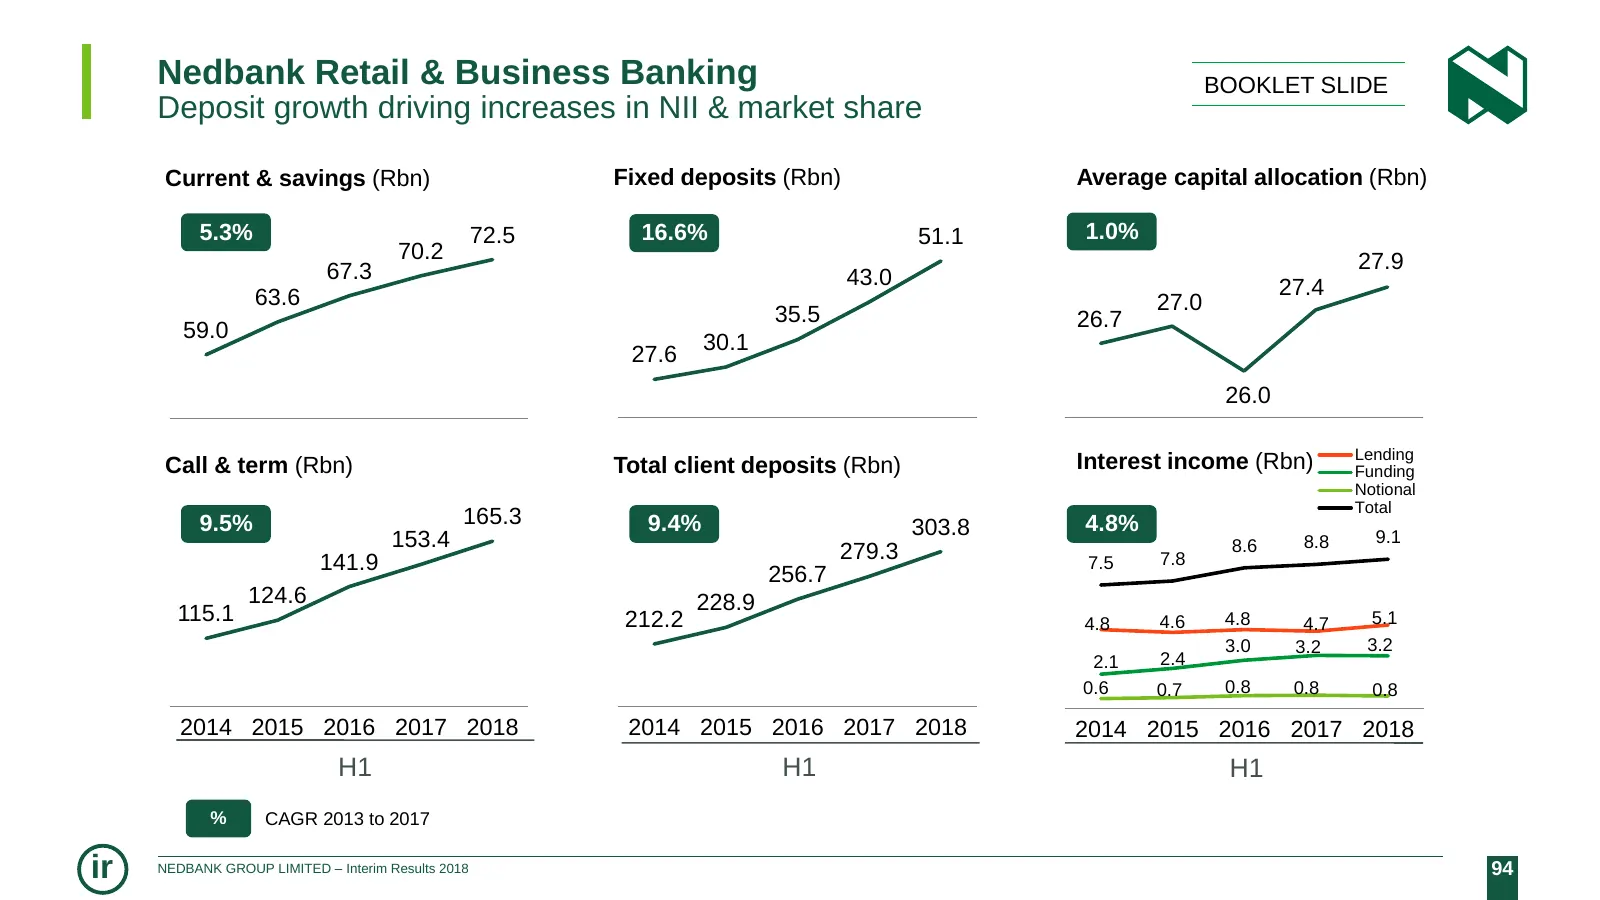
Slide 94: RBB: Deposit growth driving NII & market share
Nedbank Retail & Business Banking BOOKLET SLIDE Deposit growth driving increases in NII & market share Current & savings (Rbn) Fixed deposits (Rbn) Average capital allocation (Rbn) 5.3% 72.5 16.6% 51.1 1.0% 70.2 27.9 67.3 43.0 63.6 27.4 27.0 35.5 26.7 59.0 30.1 27.6 26.0 Lending Call & term (Rbn) To
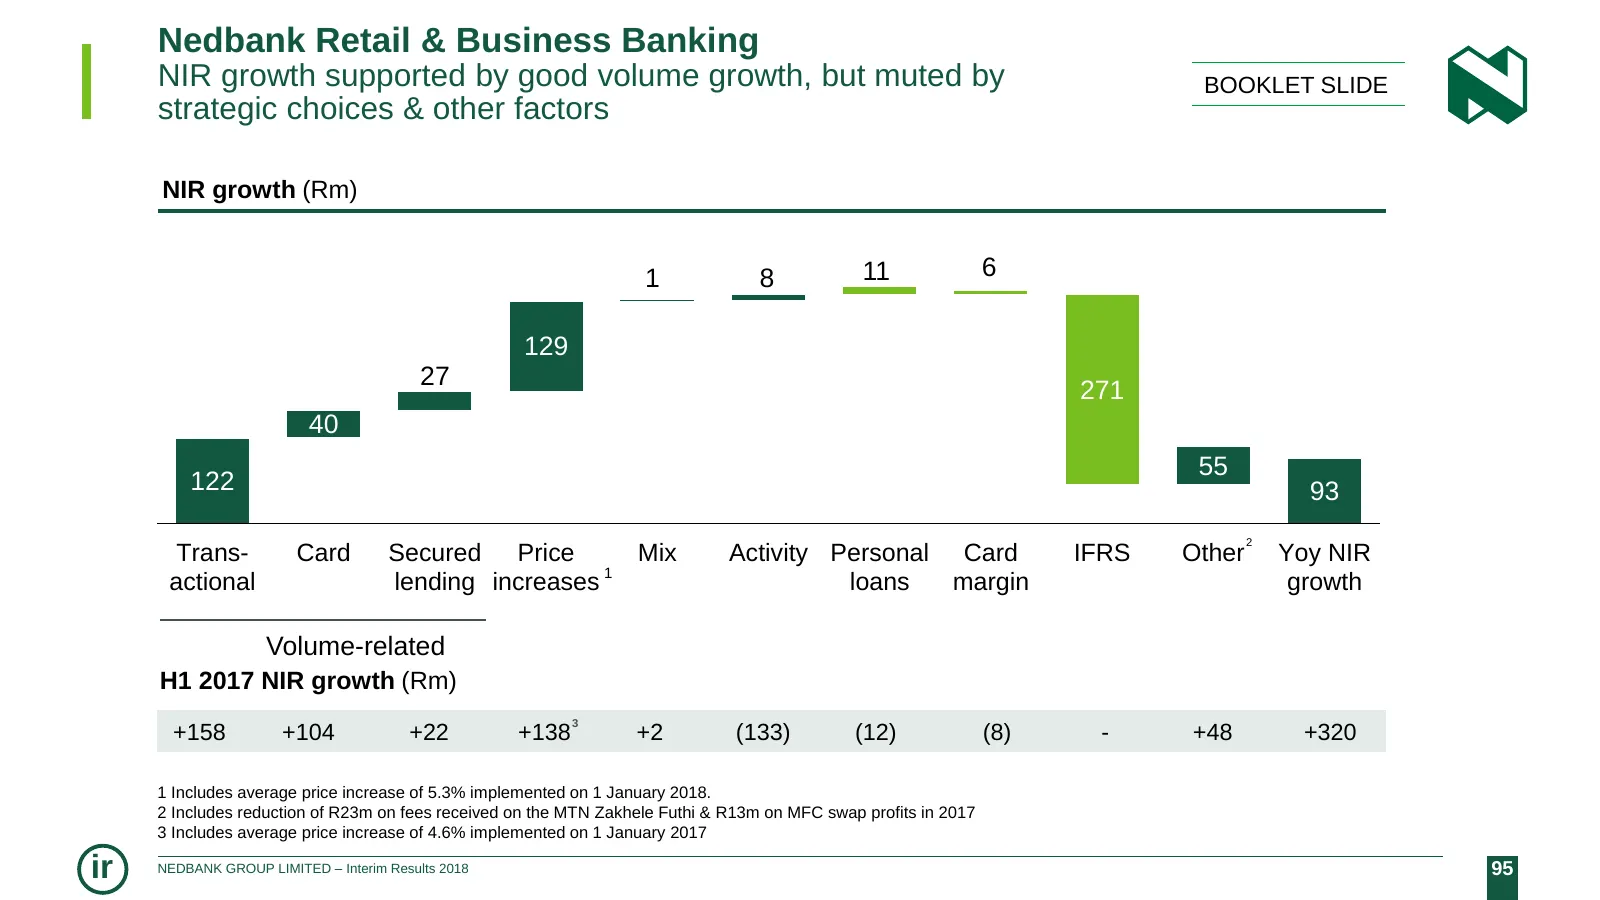
Slide 95: RBB: NIR growth supported by good volume growth
Nedbank Retail & Business Banking NIR growth supported by good volume growth, but muted by BOOKLET SLIDE strategic choices & other factors NIR growth (Rm) 1 8 11 6 129 27 271 40 55 122 93 2 Trans- Card Secured Price Mix Activity Personal Card IFRS Other Yoy NIR actional lending increases 1 loans mar
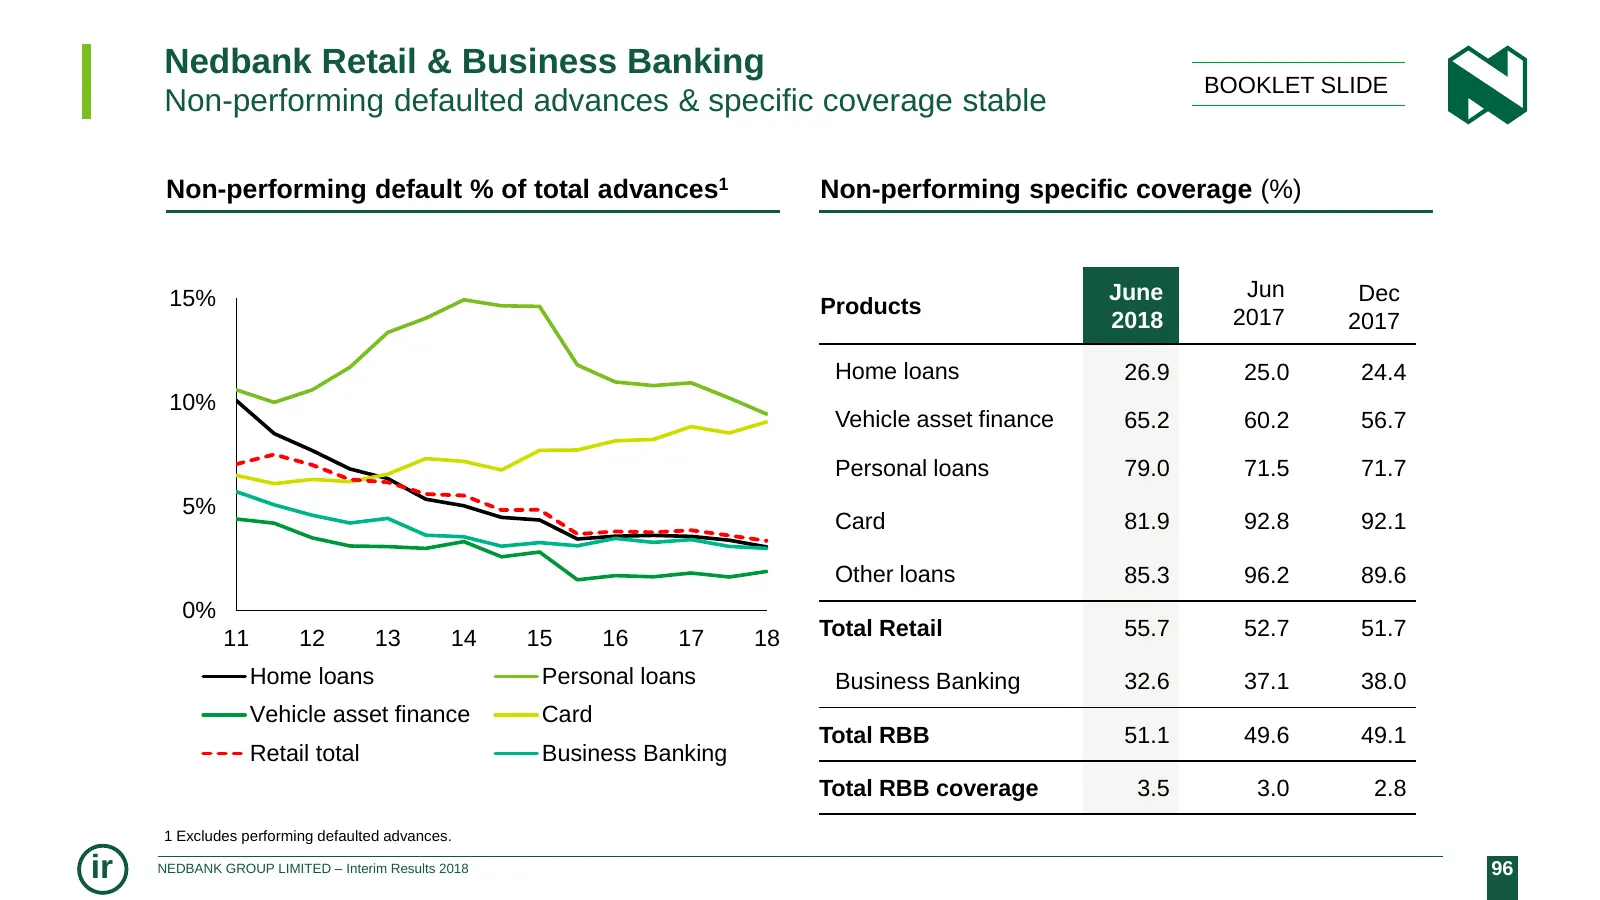
Slide 96: RBB: Non-performing defaulted advances & specific coverage stable
Nedbank Retail & Business Banking BOOKLET SLIDE Non-performing defaulted advances & specific coverage stable Non-performing default % of total advances1 Non-performing specific coverage (%) 15% June Jun Dec Products 2017 2018 2017 Home loans 26.9 25.0 24.4 10% Vehicle asset finance 65.2 60.2 56.7 Pe
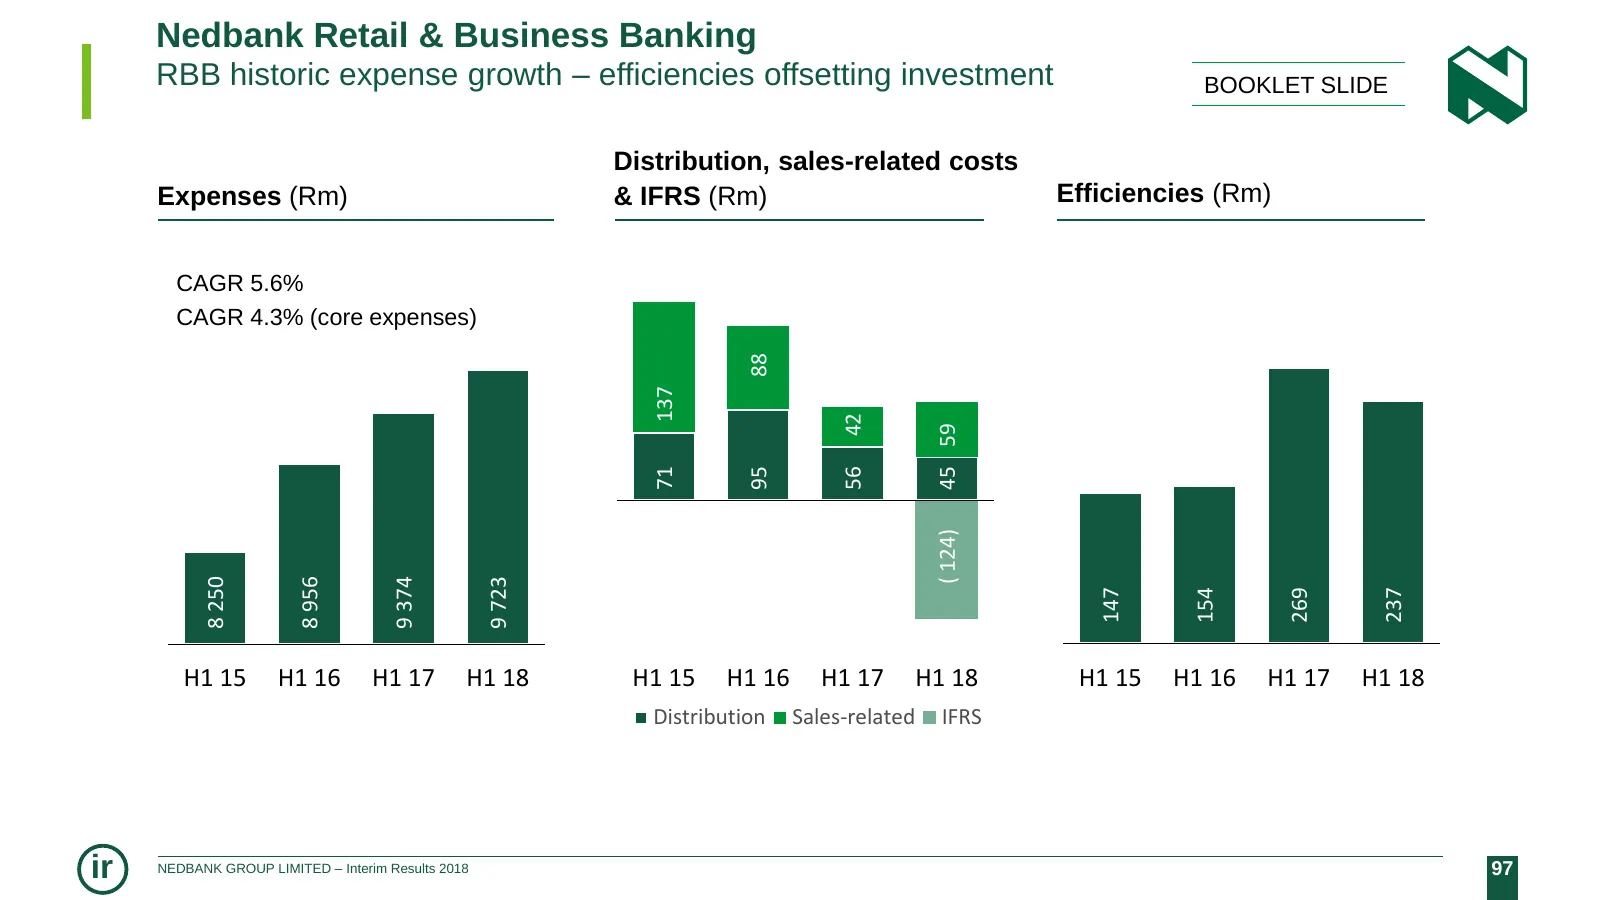
Slide 97: RBB: historic expense growth – efficiencies offsetting investment
Nedbank Retail & Business Banking RBB historic expense growth – efficiencies offsetting investment BOOKLET SLIDE Distribution, sales-related costs Expenses (Rm) & IFRS (Rm) Efficiencies (Rm) CAGR 5.6% CAGR 4.3% (core expenses) 88 137 42 45 59 95 71 56 ( 124) 8 250 8 956 9 374 9 723 147 154 269 237 H
Slide 98: Disclaimer
Disclaimer Nedbank Group has acted in good faith and has made every reasonable effort to ensure the accuracy and completeness of the information contained in this document, including all information that may be defined as 'forward-looking statements' within the meaning of United States securities le
Source: Internet Archive copy of nedbank.co.za
More decks from Nedbank Group
 FY2025 Earnings Presentation50 slides · February 2026
 FY2024 Earnings Presentation63 slides · March 2025
 27th UBS SA Financial Services Conference 202424 slides · October 2024
 Investor Presentation (October 2024)20 slides · October 2024
 Emerge — Nedbank Investment Conference (2024)22 slides · Sep 10, 2024
 H1 2024 Earnings Presentation85 slides · Aug 6, 2024