SK Telecom Co., Ltd. · KRX:017670
SK Telecom — Q4 2016 Earnings Presentation
15 slides from SK Telecom's earnings presentation, February 2017

Slide 1: SK telecom Investor Presentation
9 CONSECUTIVE MEMBER OF SK telecom Investor Presentation February 2017 April 2016
Slide 2: Disclaimer
Disclaimer This presentation contains forward-looking statements with respect to the financial condition, results of operations and business of SK Telecom and its subsidiaries (the “Company”) and plans and objectives of the management of the Company. The aforementioned forward-looking statements are
Slide 3: Table of Contents
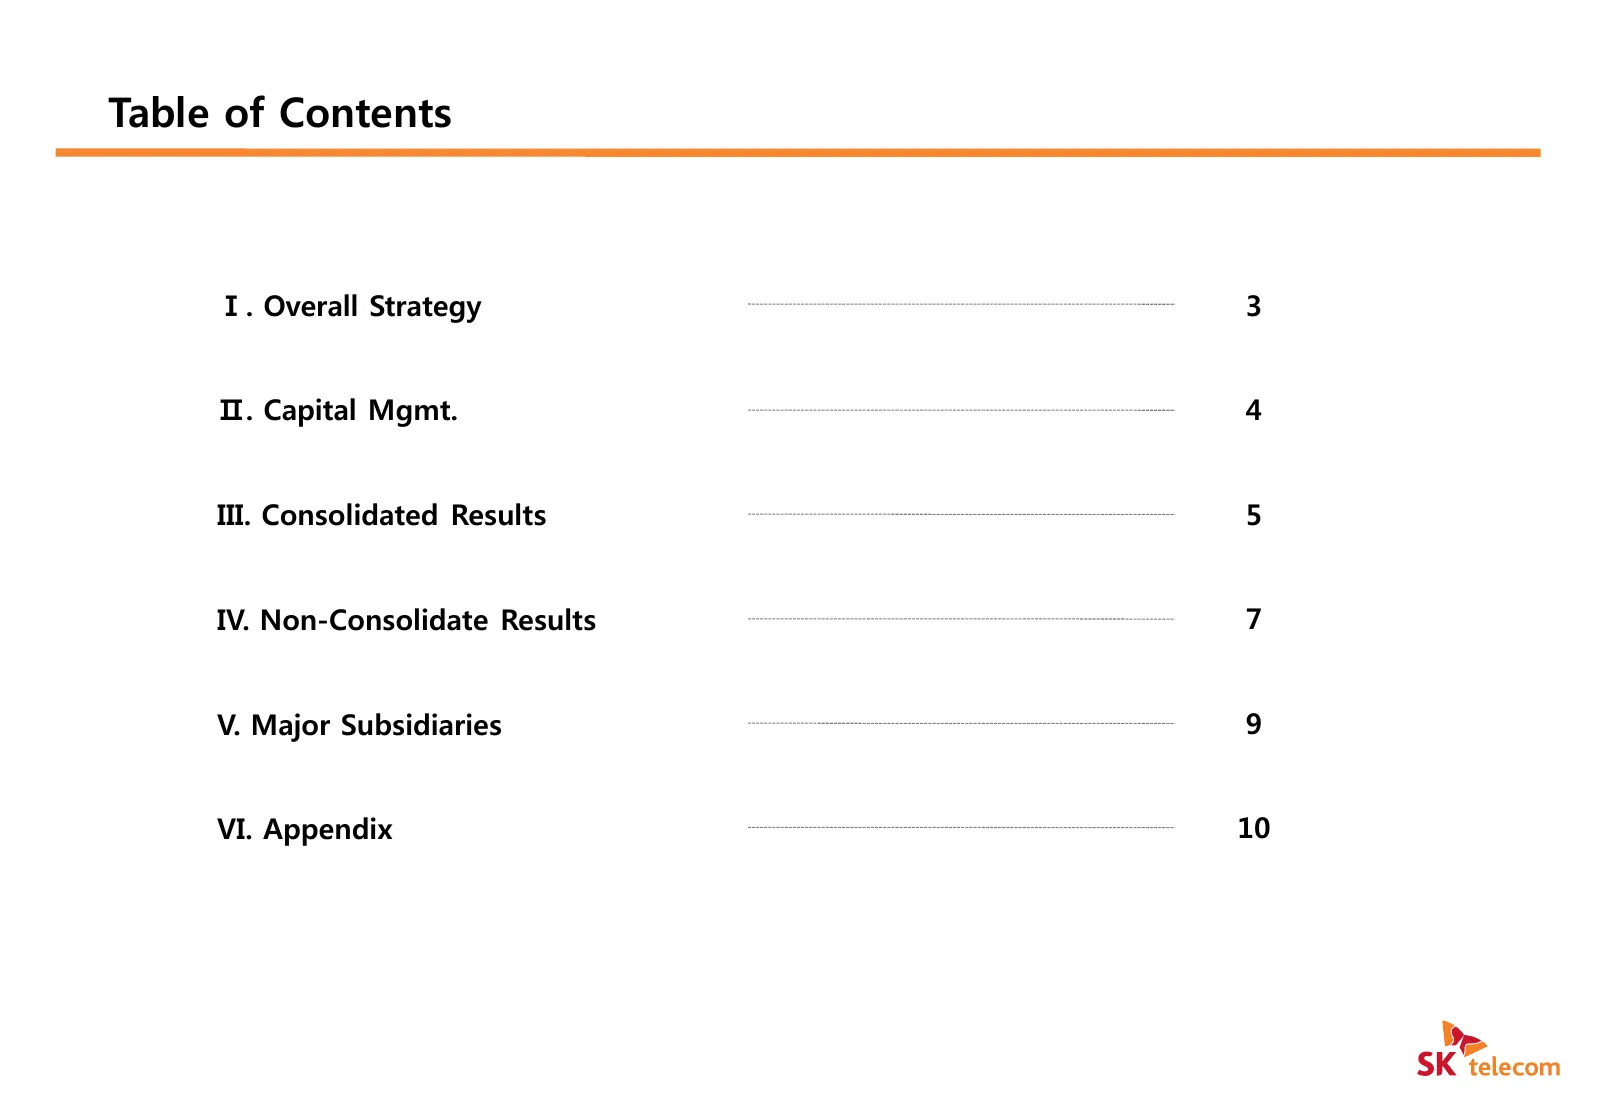
Table of Contents Ⅰ. Overall Strategy 3 Ⅱ. Capital Mgmt. 4 III. Consolidated Results 5 IV. Non-Consolidate Results 7 V. Major Subsidiaries 9 VI. Appendix 10
Slide 4: Overall Strategy
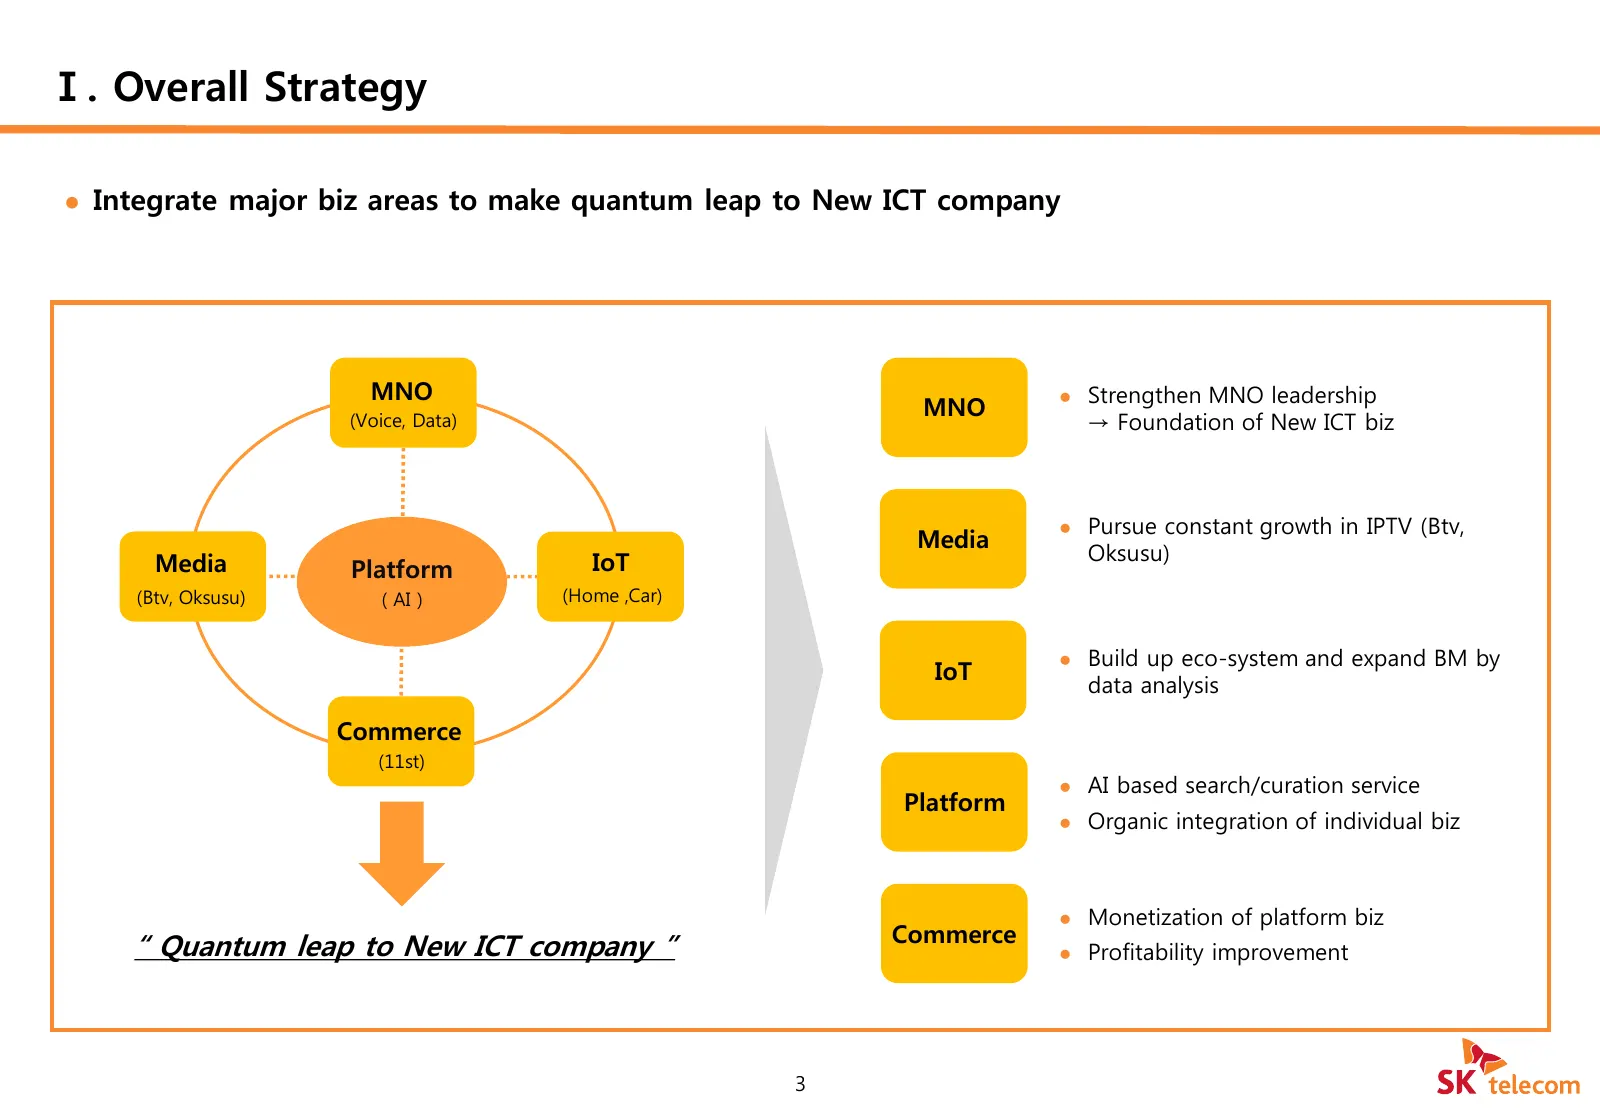
Ⅰ. Overall Strategy Integrate major biz areas to make quantum leap to New ICT company MNO Strengthen MNO leadership MNO (Voice, Data) → Foundation of New ICT biz Pursue constant growth in IPTV (Btv, Media Media IoT Oksusu) Platform (Btv, Oksusu) ( AI ) (Home ,Car) Build up eco-system and exp
Slide 5: Capital Mgmt.
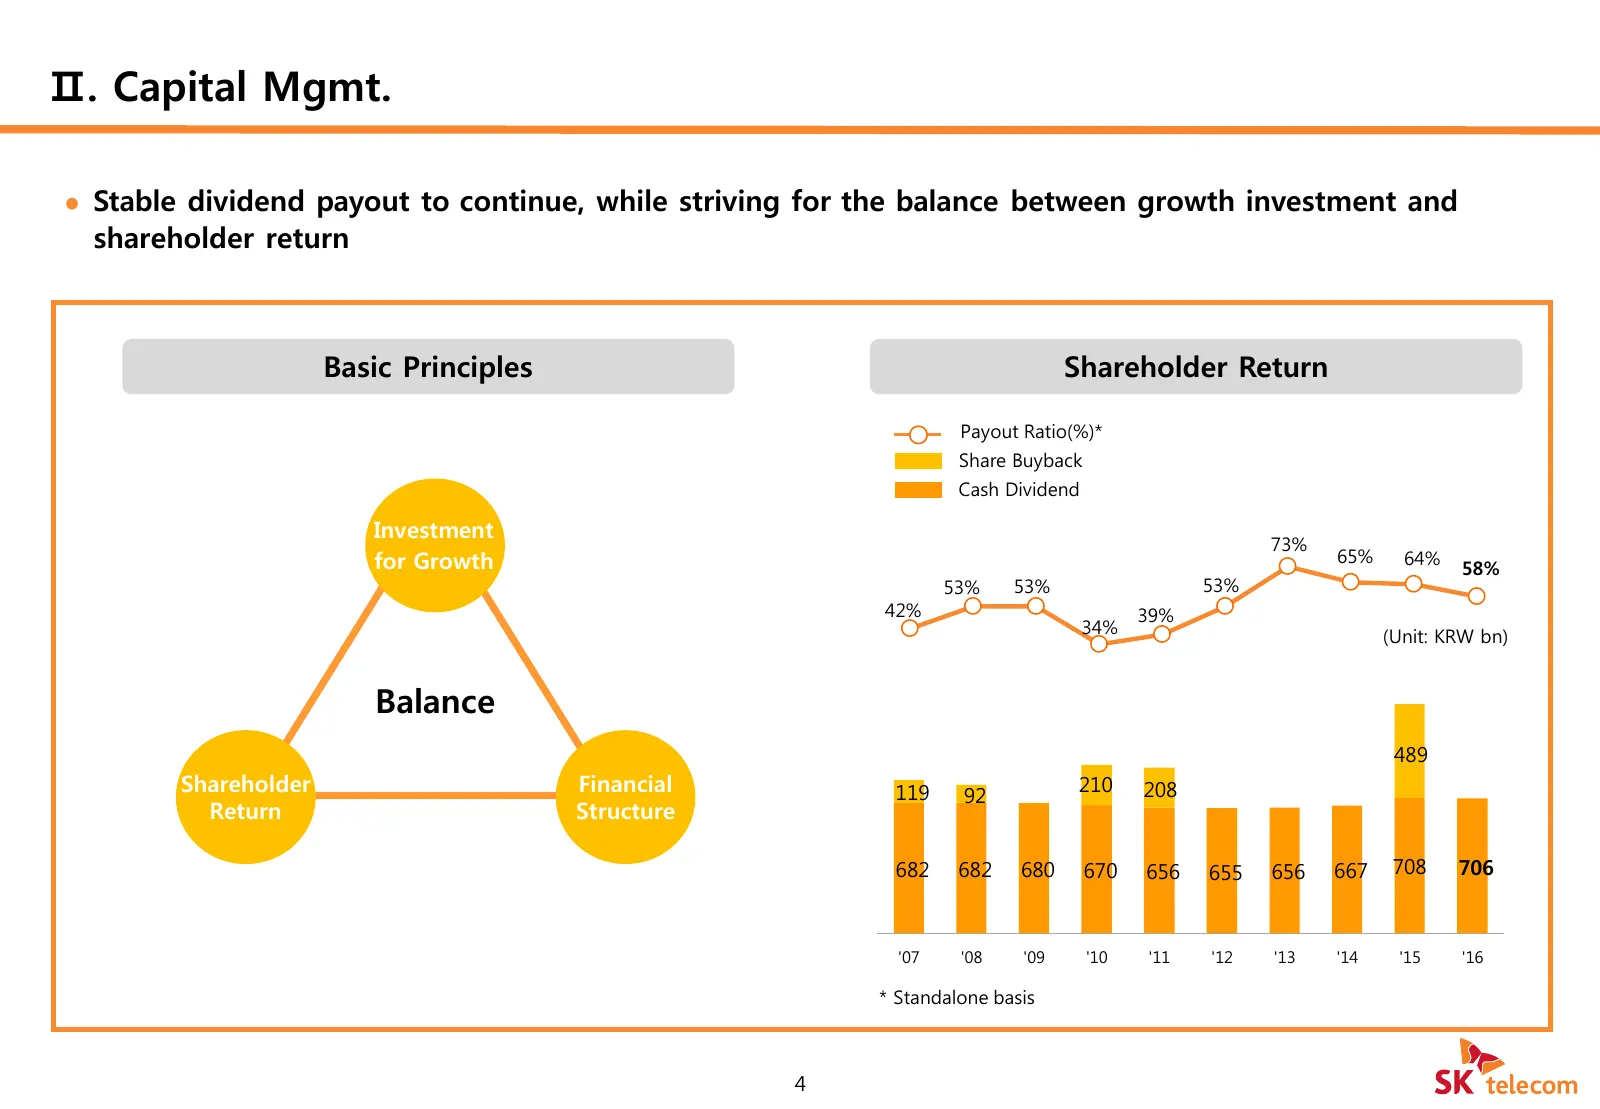
Ⅱ. Capital Mgmt. Stable dividend payout to continue, while striving for the balance between growth investment and shareholder return Basic Principles Shareholder Return Payout Ratio(%)* Share Buyback Cash Dividend Investment 73% for Growth 65% 64% 58% 53% 53% 53% 42% 39% 34% (Unit: KRW bn) Balance
Slide 6: Consolidated Results
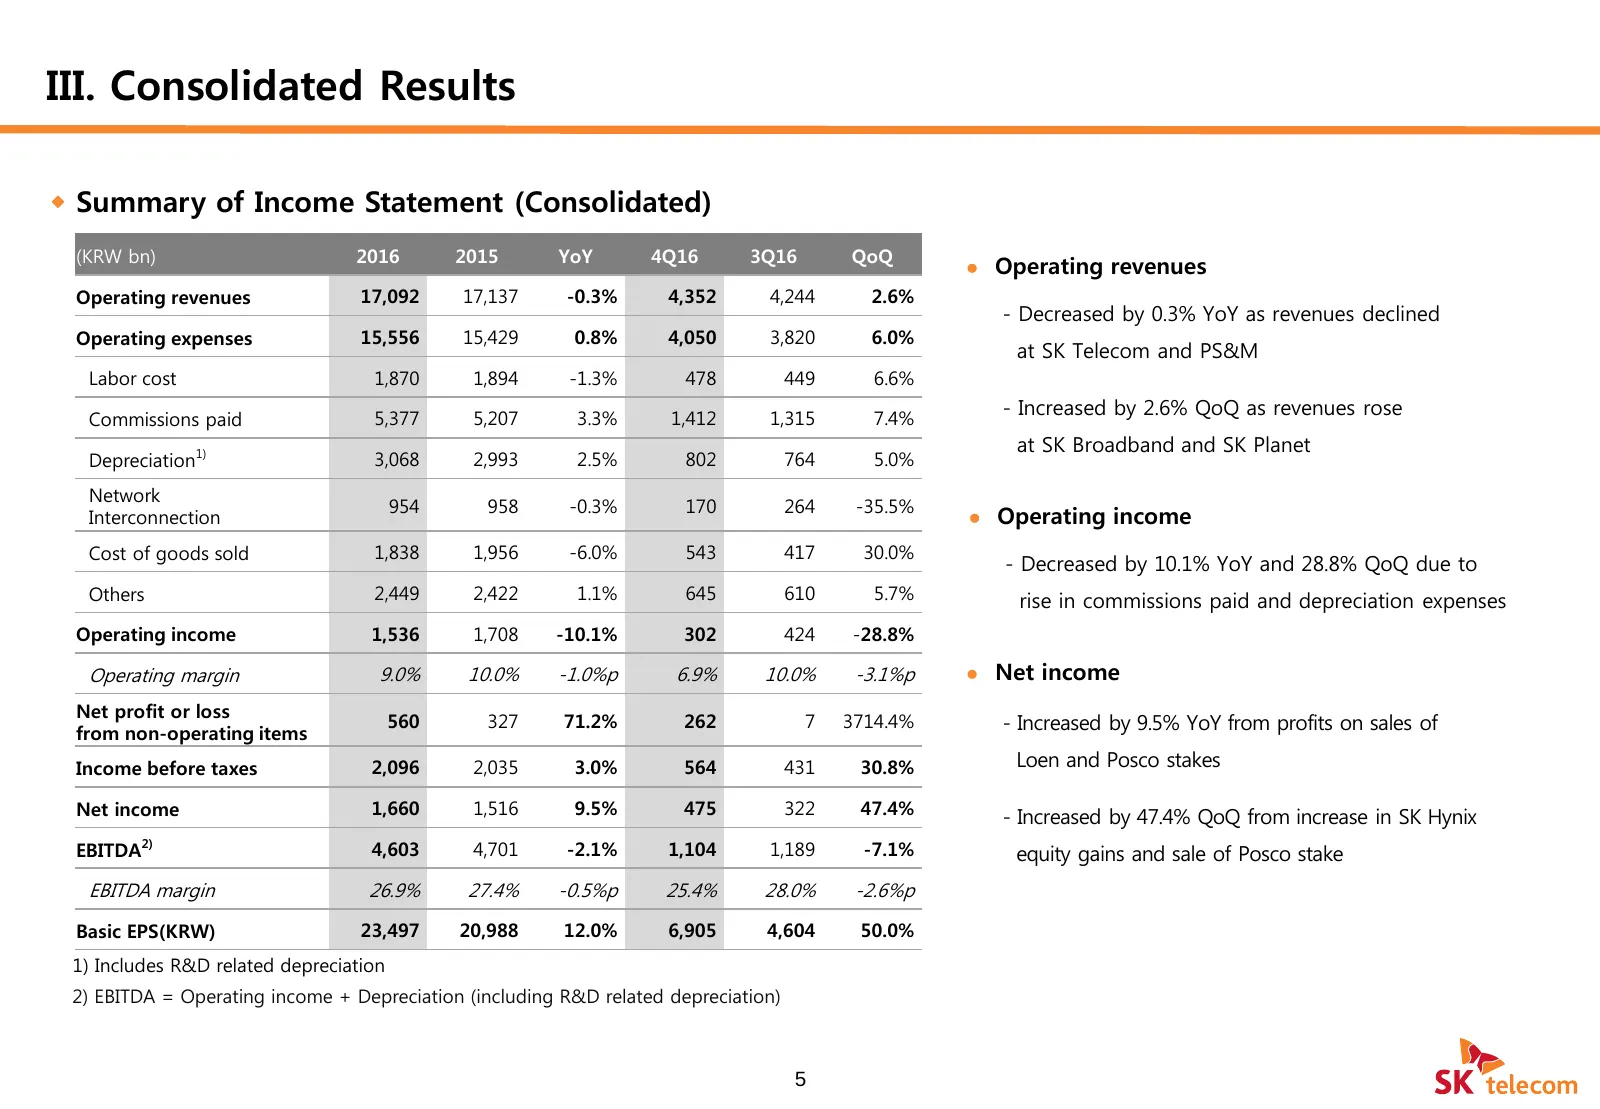
III. Consolidated Results Summary of Income Statement (Consolidated) (KRW bn) 2016 2015 YoY 4Q16 3Q16 QoQ Operating revenues Operating revenues 17,092 17,137 -0.3% 4,352 4,244 2.6% - Decreased by 0.3% YoY as revenues declined Operating expenses 15,556 15,429 0.8% 4,050 3,820 6.0% at SK Telecom a
Slide 7: Consolidated Results: Summary of Balance Sheet
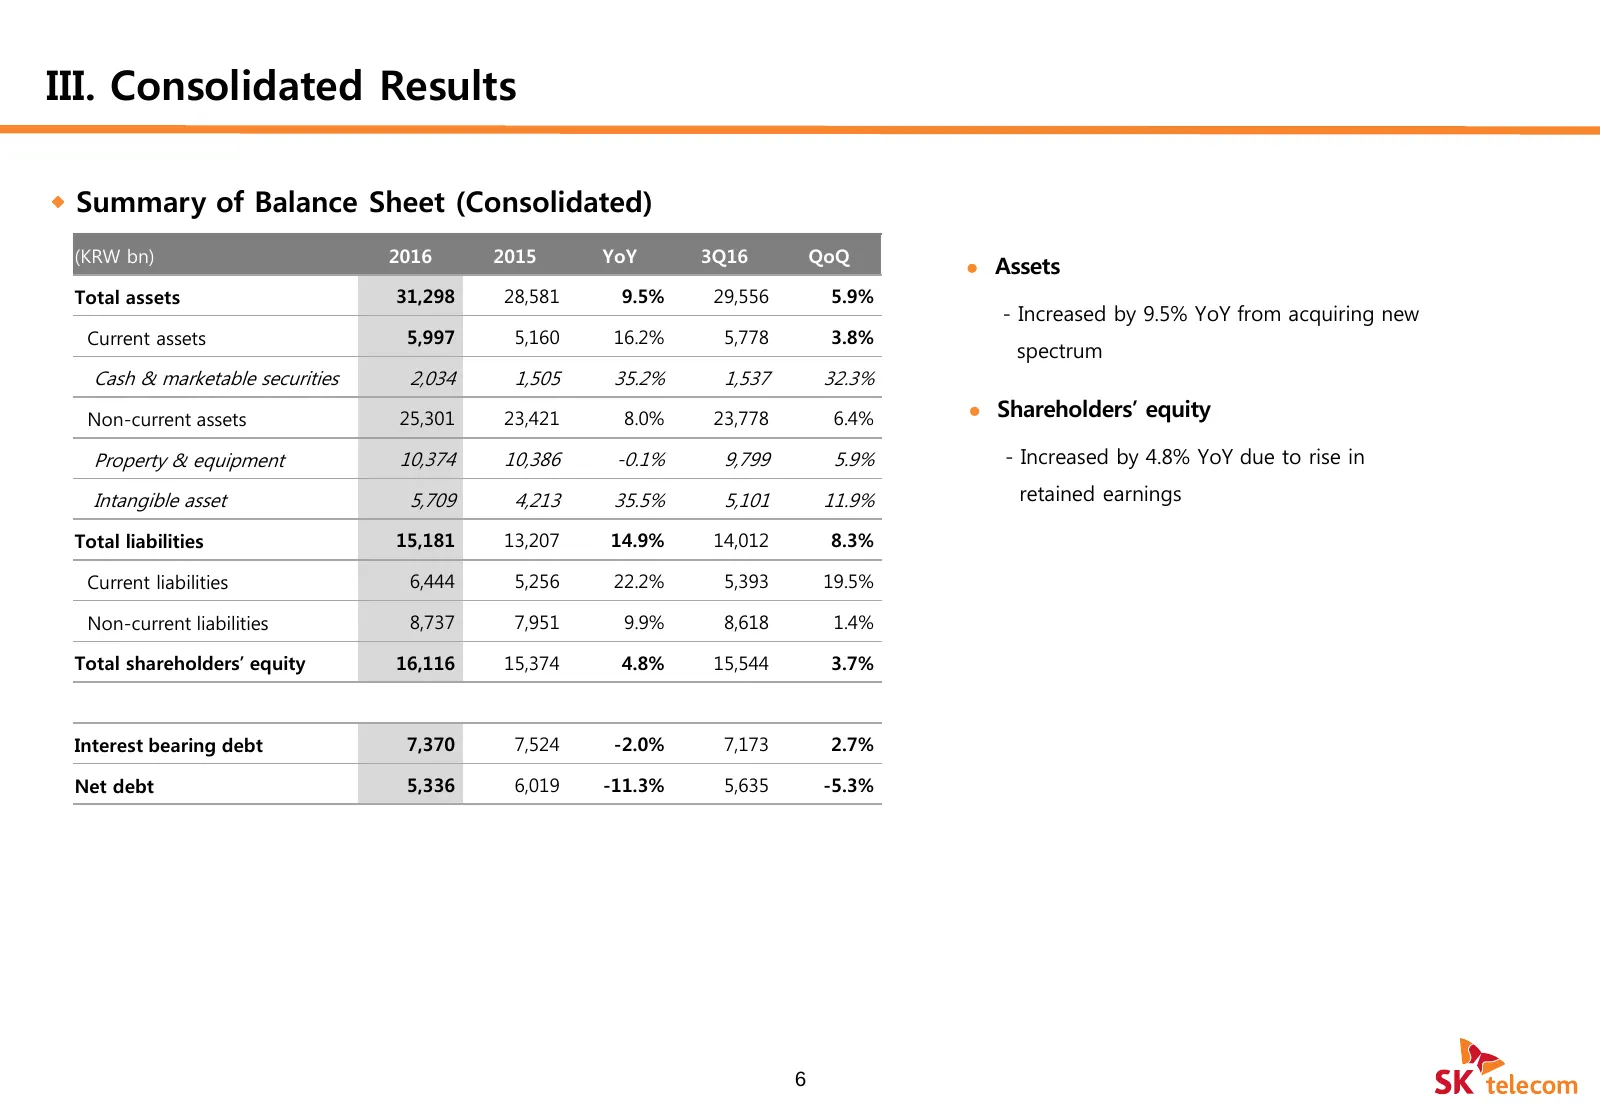
III. Consolidated Results Summary of Balance Sheet (Consolidated) (KRW bn) 2016 2015 YoY 3Q16 QoQ Assets Total assets 31,298 28,581 9.5% 29,556 5.9% - Increased by 9.5% YoY from acquiring new Current assets 5,997 5,160 16.2% 5,778 3.8% spectrum Cash & marketable securities 2,034 1,505 35.2% 1,53
Slide 8: Non-consolidated Results: Operating Revenues
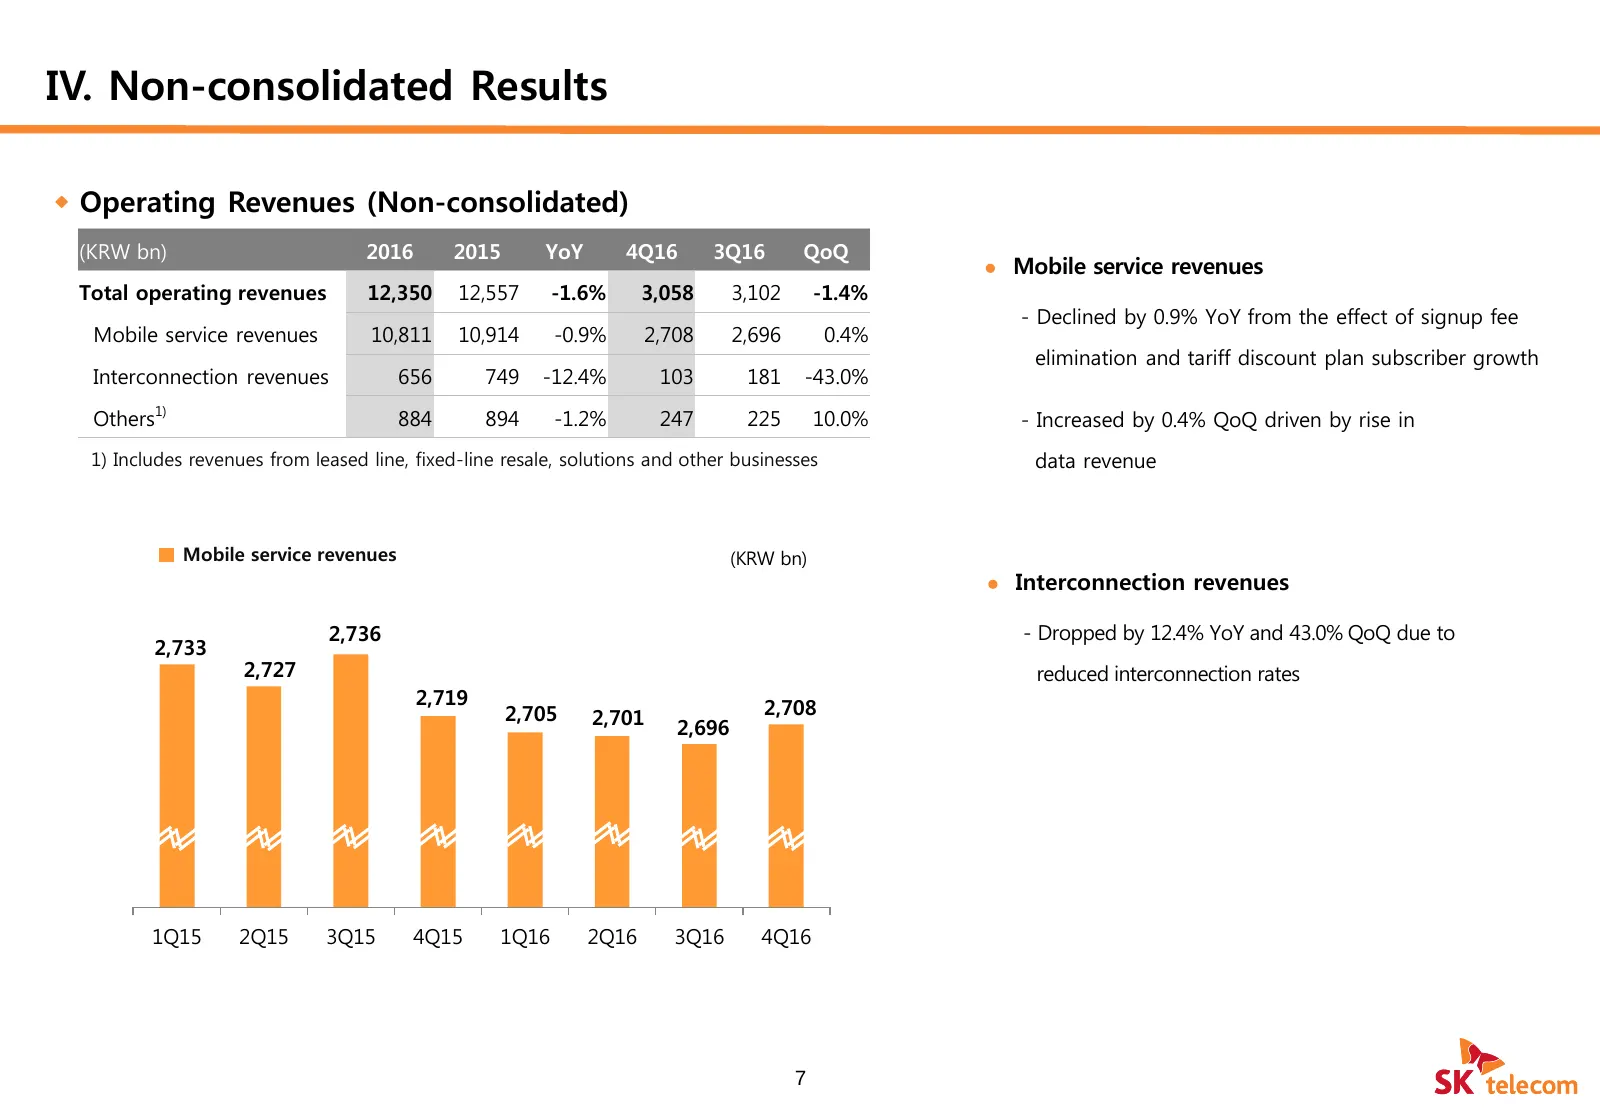
IV. Non-consolidated Results Operating Revenues (Non-consolidated) (KRW bn) 2016 2015 YoY 4Q16 3Q16 QoQ Mobile service revenues Total operating revenues 12,350 12,557 -1.6% 3,058 3,102 -1.4% - Declined by 0.9% YoY from the effect of signup fee Mobile service revenues 10,811 10,914 -0.9% 2,708 2,
Slide 9: Non-consolidated Results: Marketing expense & CAPEX
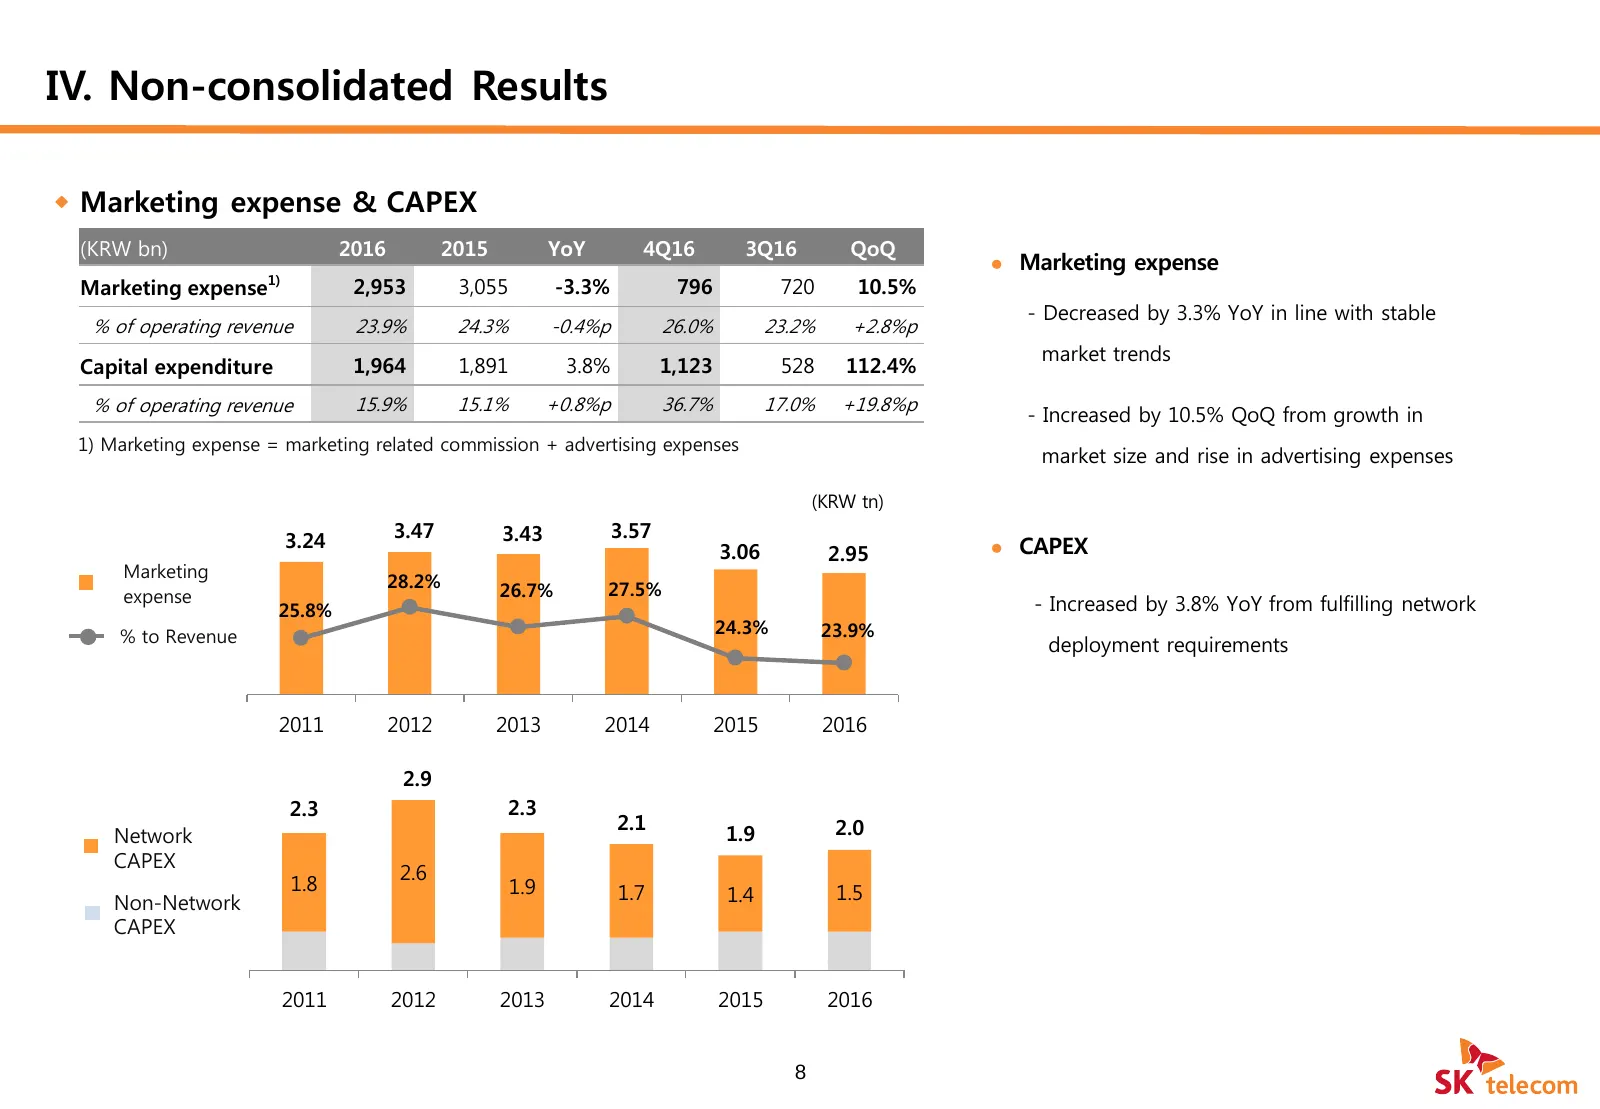
IV. Non-consolidated Results Marketing expense & CAPEX (KRW bn) 2016 2015 YoY 4Q16 3Q16 QoQ Marketing expense 1) Marketing expense 2,953 3,055 -3.3% 796 720 10.5% - Decreased by 3.3% YoY in line with stable % of operating revenue 23.9% 24.3% -0.4%p 26.0% 23.2% +2.8%p market trends Capital expend
Slide 10: Major Subsidiaries
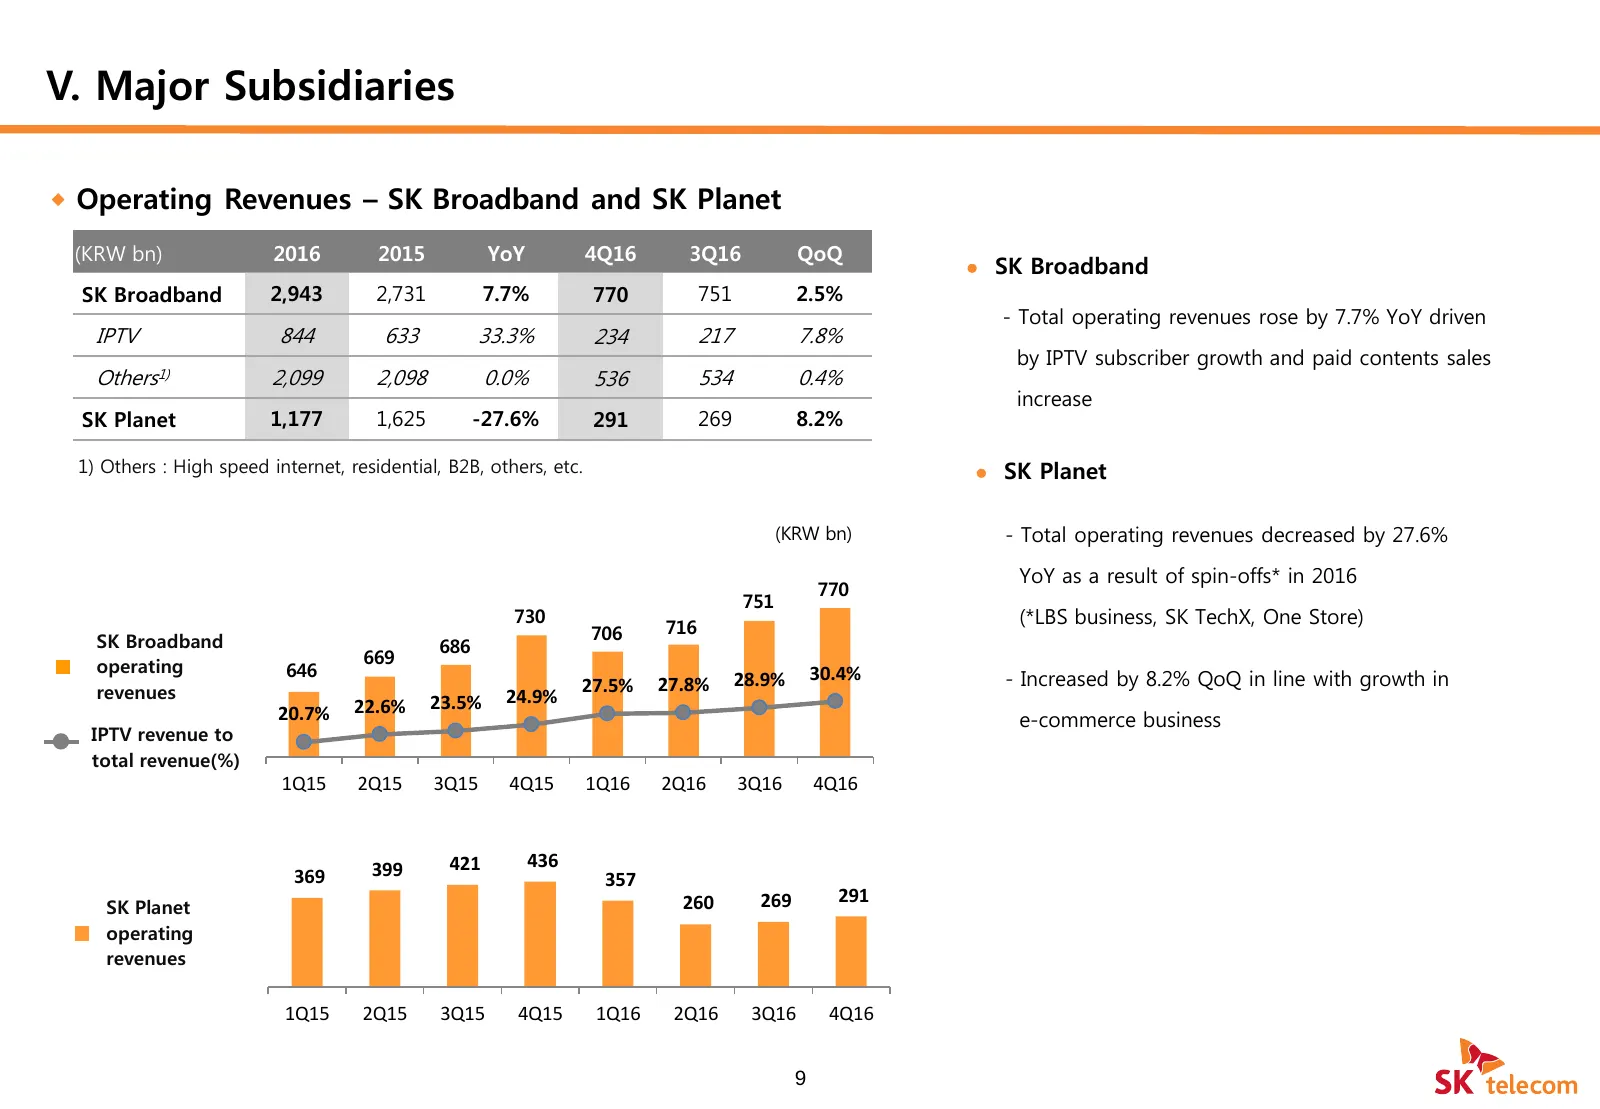
V. Major Subsidiaries Operating Revenues – SK Broadband and SK Planet (KRW bn) 2016 2015 YoY 4Q16 3Q16 QoQ SK Broadband SK Broadband 2,943 2,731 7.7% 770 751 2.5% - Total operating revenues rose by 7.7% YoY driven IPTV 844 633 33.3% 234 217 7.8% by IPTV subscriber growth and paid contents sales
Slide 11: Appendix - Subscribers
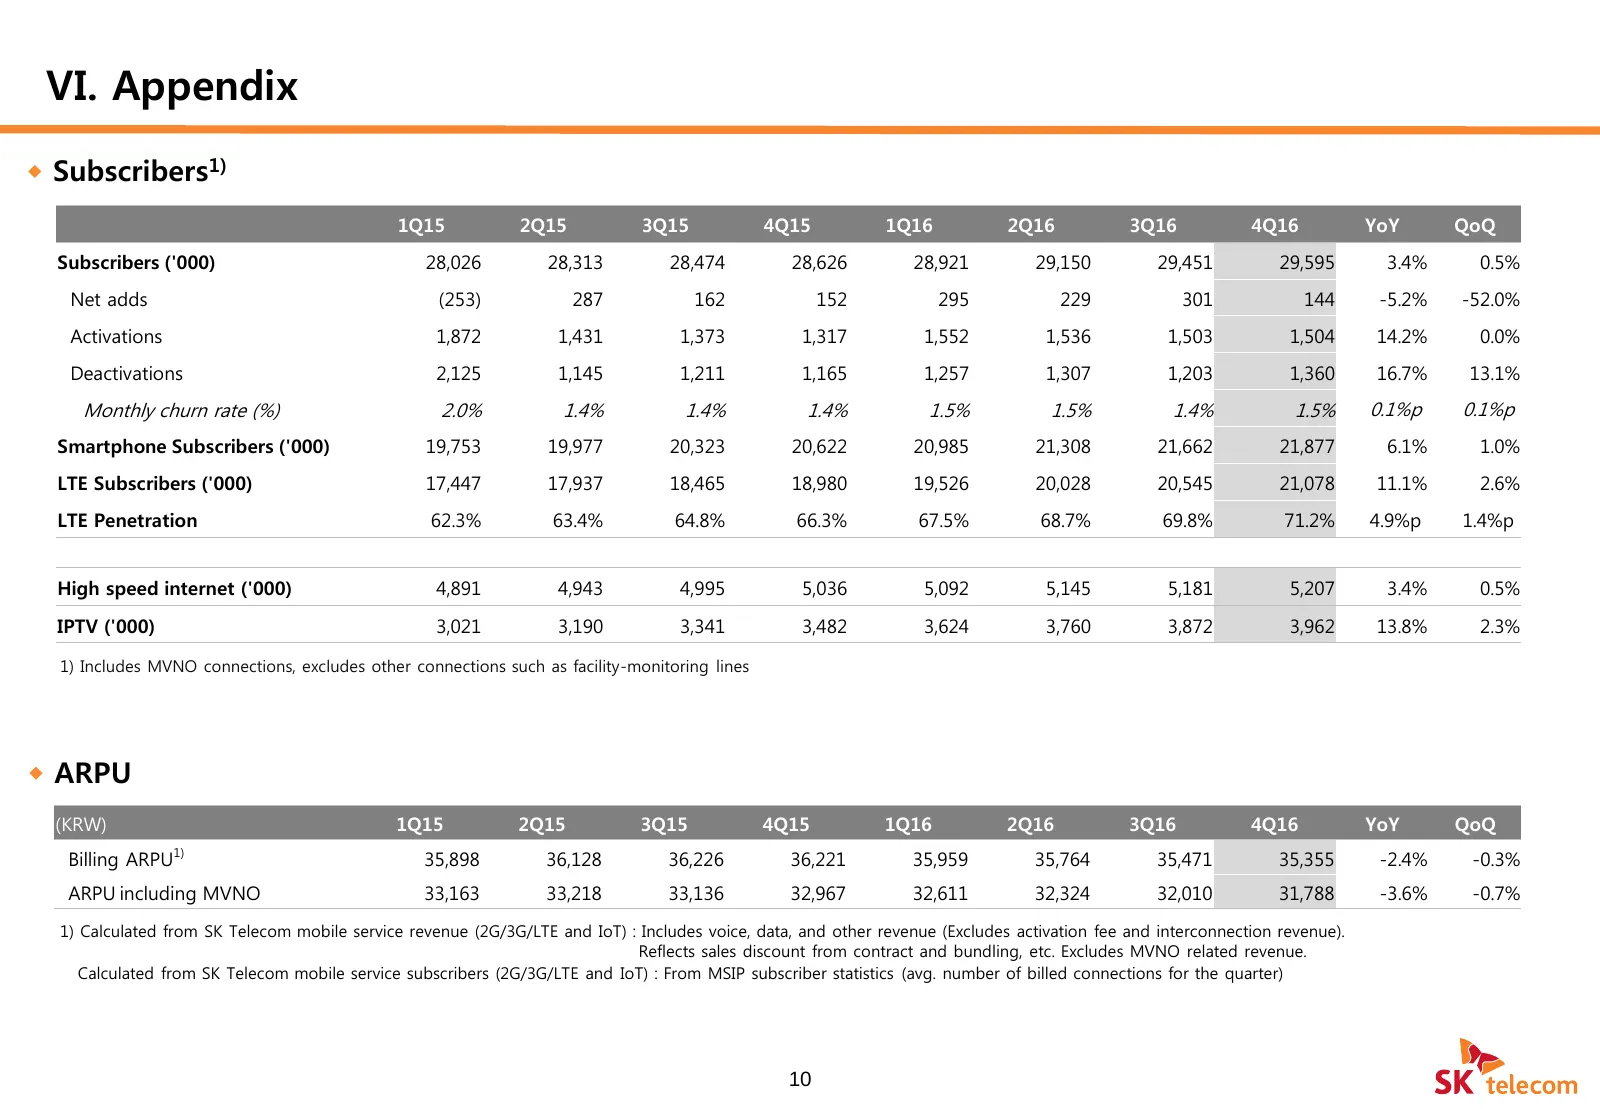
VI. Appendix Subscribers1) 1Q15 2Q15 3Q15 4Q15 1Q16 2Q16 3Q16 4Q16 YoY QoQ Subscribers ('000) 28,026 28,313 28,474 28,626 28,921 29,150 29,451 29,595 3.4% 0.5% Net adds (253) 287 162 152 295 229 301 144 -5.2% -52.0% Activations 1,872 1,431 1,373 1,317 1,552 1,536 1,503 1,504 14.2% 0.0% Deactivatio
Slide 12: Appendix - Consolidated Income Statement
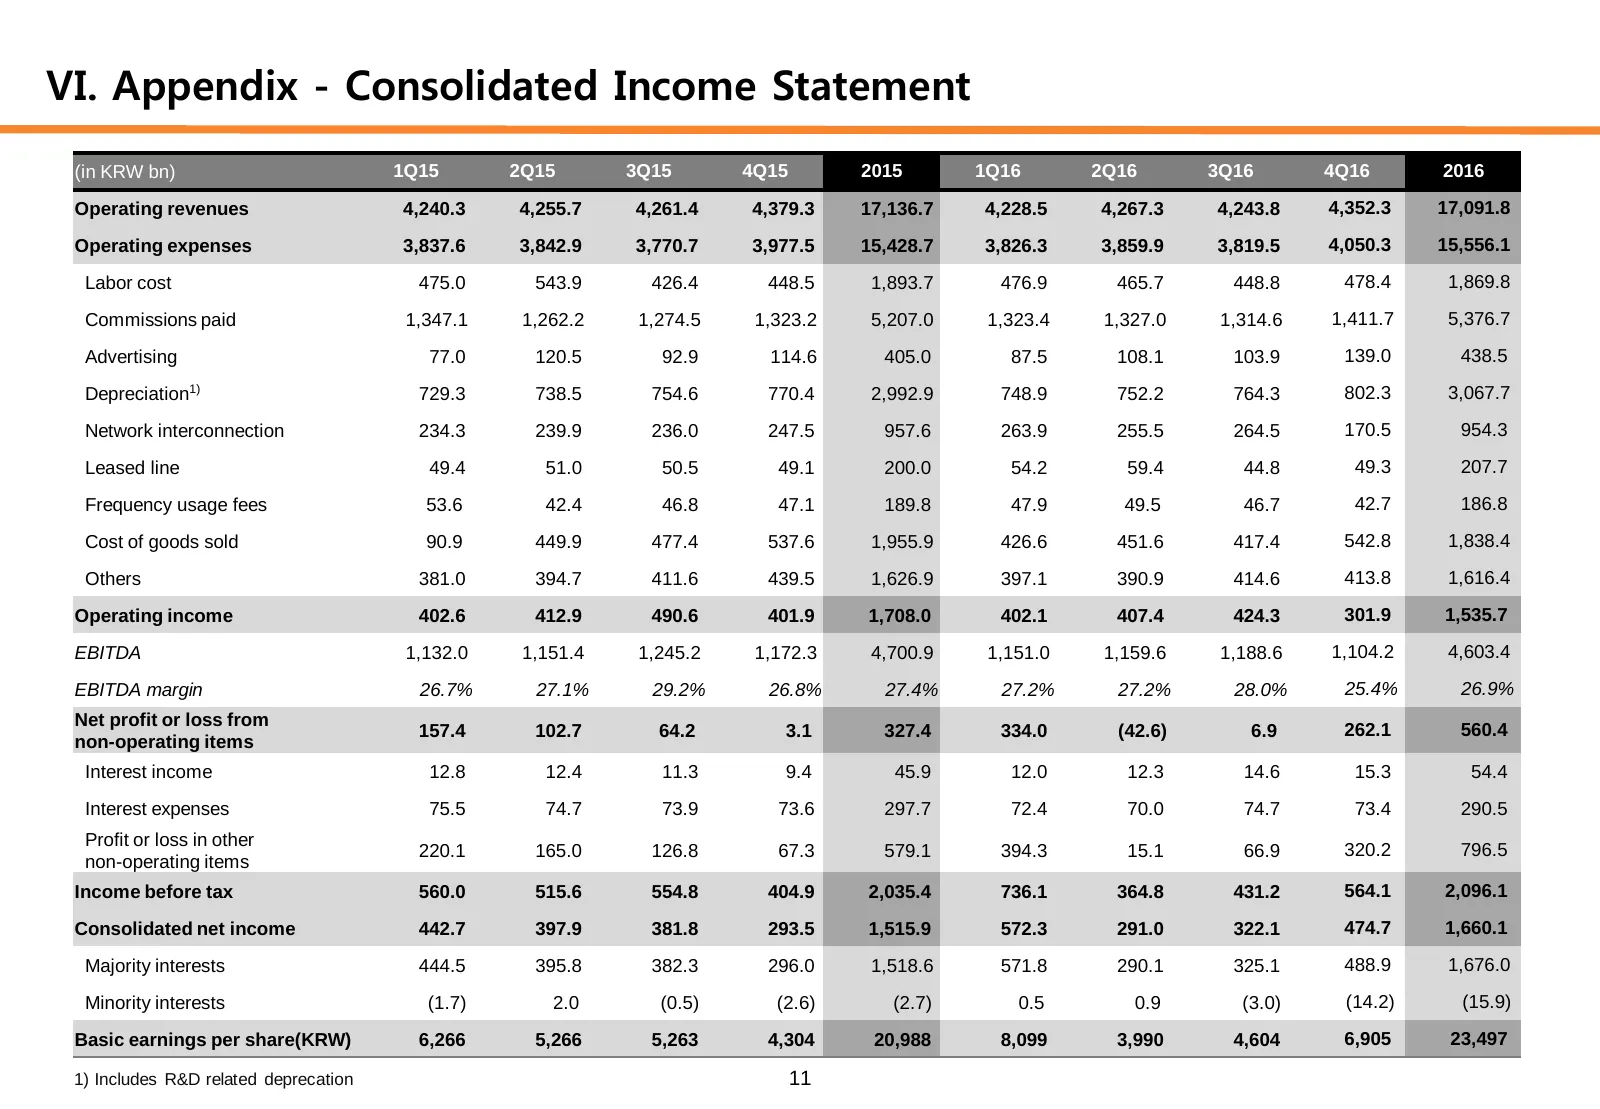
VI. Appendix - Consolidated Income Statement (in KRW bn) 1Q15 2Q15 3Q15 4Q15 2015 1Q16 2Q16 3Q16 4Q16 2016 Operating revenues 4,240.3 4,255.7 4,261.4 4,379.3 17,136.7 4,228.5 4,267.3 4,243.8 4,352.3 17,091.8 Operating expenses 3,837.6 3,842.9 3,770.7 3,977.5 15,428.7 3,826.3 3,859.9 3,819.5 4,050.3
Slide 13: Appendix - SK Telecom Non-consolidated Income Statement
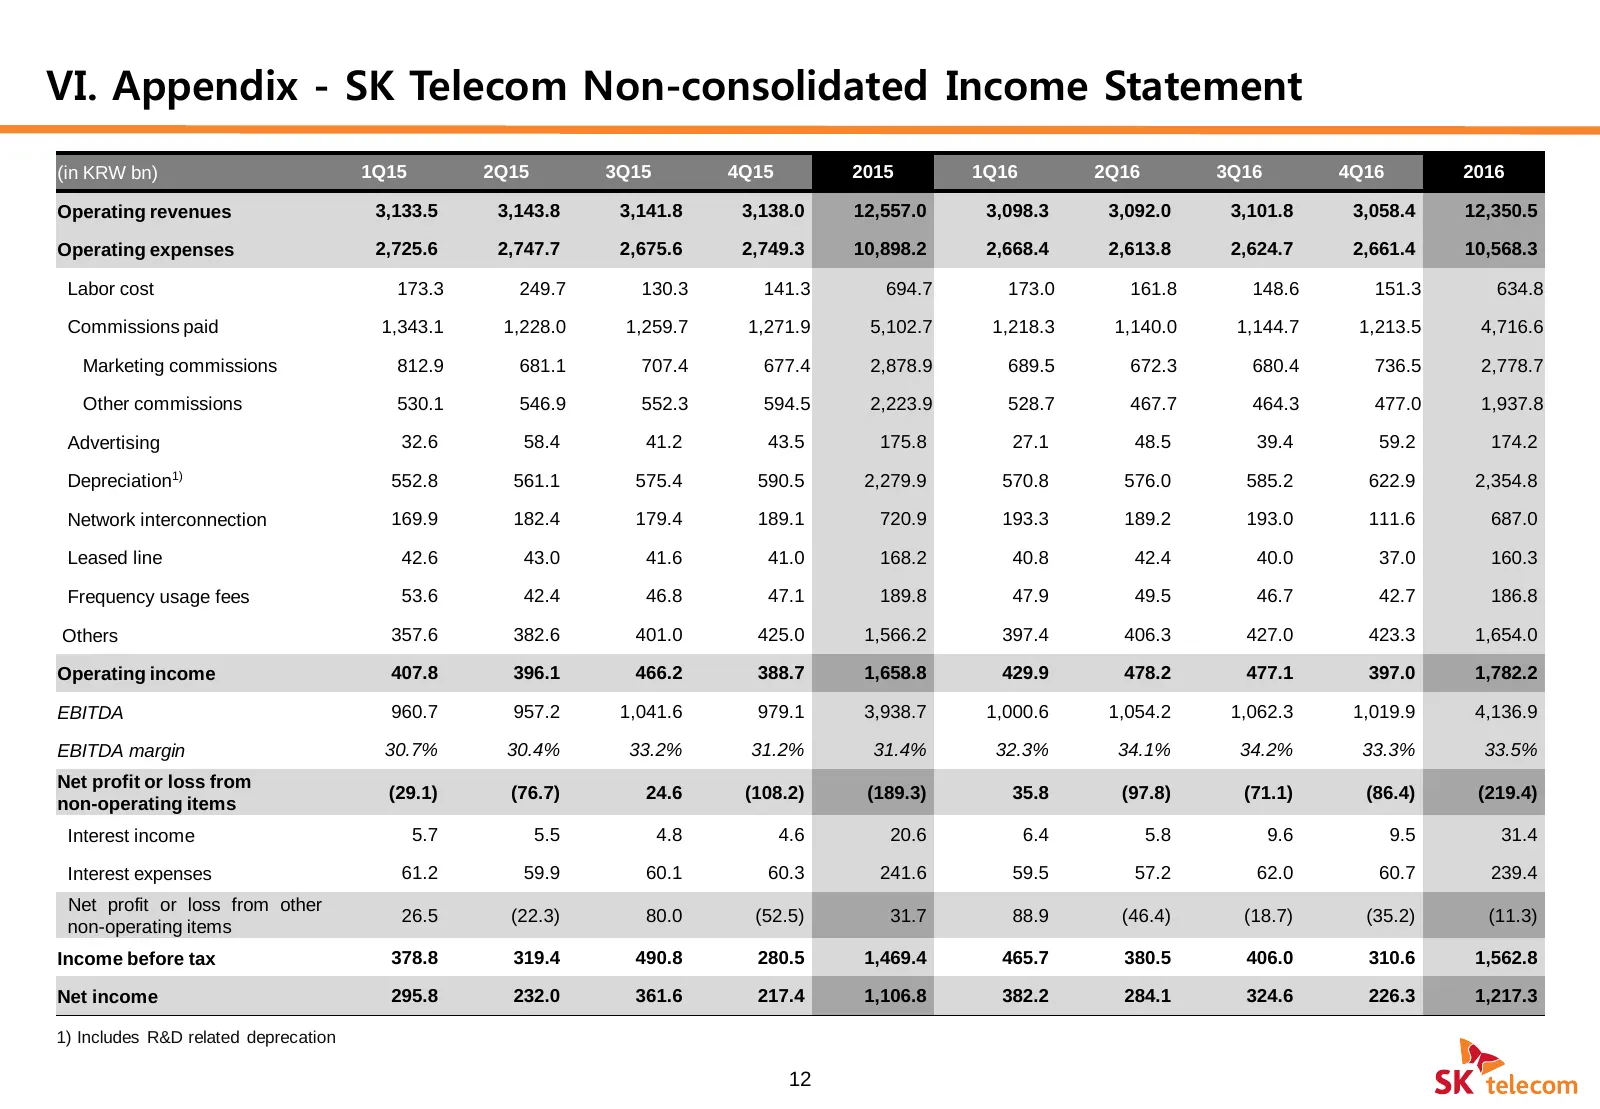
VI. Appendix - SK Telecom Non-consolidated Income Statement (in KRW bn) 1Q15 2Q15 3Q15 4Q15 2015 1Q16 2Q16 3Q16 4Q16 2016 Operating revenues 3,133.5 3,143.8 3,141.8 3,138.0 12,557.0 3,098.3 3,092.0 3,101.8 3,058.4 12,350.5 Operating expenses 2,725.6 2,747.7 2,675.6 2,749.3 10,898.2 2,668.4 2,613.8 2
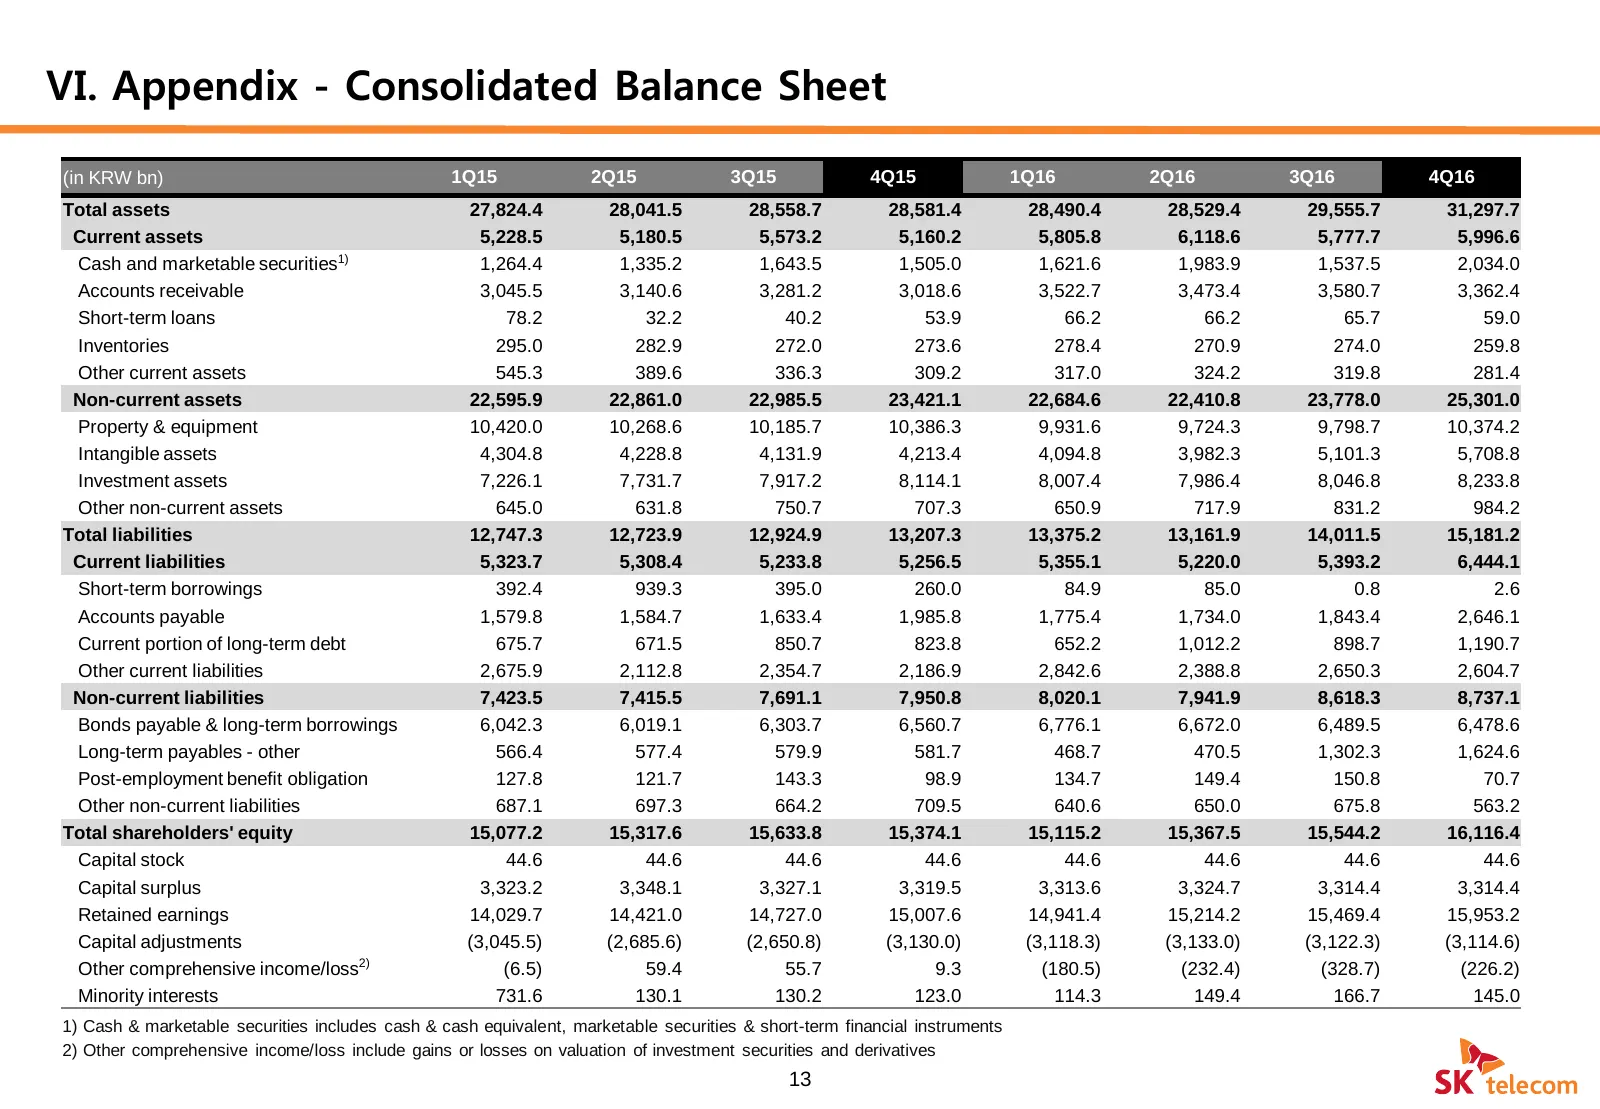
Slide 14: Appendix - Consolidated Balance Sheet
VI. Appendix - Consolidated Balance Sheet (in KRW bn) 1Q15 2Q15 3Q15 4Q15 1Q16 2Q16 3Q16 4Q16 Total assets 27,824.4 28,041.5 28,558.7 28,581.4 28,490.4 28,529.4 29,555.7 31,297.7 Current assets 5,228.5 5,180.5 5,573.2 5,160.2 5,805.8 6,118.6 5,777.7 5,996.6 Cash and marketable securities1) 1,264.4 1
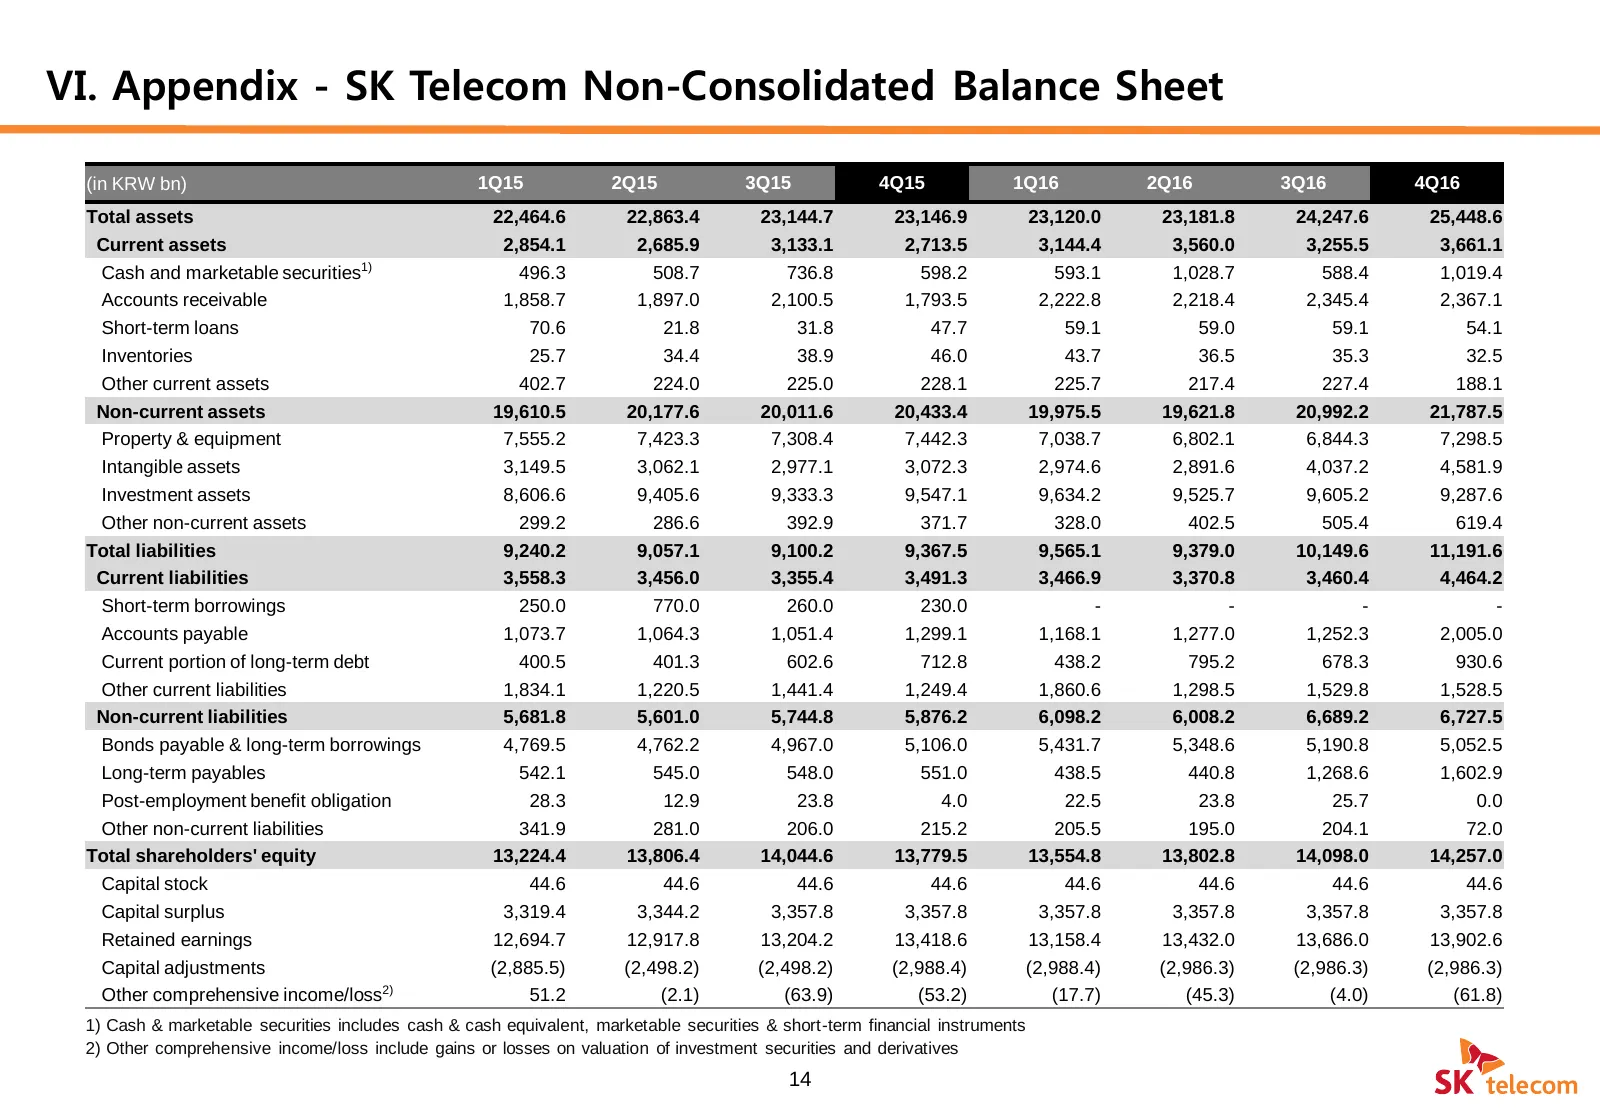
Slide 15: Appendix - SK Telecom Non-Consolidated Balance Sheet
VI. Appendix - SK Telecom Non-Consolidated Balance Sheet (in KRW bn) 1Q15 2Q15 3Q15 4Q15 1Q16 2Q16 3Q16 4Q16 Total assets 22,464.6 22,863.4 23,144.7 23,146.9 23,120.0 23,181.8 24,247.6 25,448.6 Current assets 2,854.1 2,685.9 3,133.1 2,713.5 3,144.4 3,560.0 3,255.5 3,661.1 Cash and marketable securit
Source: Internet Archive copy of sktelecom.com
More decks from SK Telecom Co., Ltd.
 Q3 2026 Earnings Presentation12 slides · Nov 4, 2026
 Q1 2026 Earnings Presentation12 slides · May 7, 2026
 FY2025 Earnings Presentation15 slides · Feb 5, 2026
 Q3 2025 Earnings Presentation18 slides · Oct 31, 2025
 Q2 2025 Earnings Presentation19 slides · Aug 12, 2025
 Q1 2025 Earnings Presentation16 slides · May 12, 2025