Pacific Mercantile Bancorp — Investor Presentation (November 2019)
23 slides from Pacific Mercantile Bancorp's investor presentation, Nov 4, 2019
Slide 1: November 2019 Investor Presentation
November 2019 INVESTOR PRESENTATION
Slide 2: Forward Looking Statements
FORWARD LOOKING STATEMENTS This presentation contains statements regarding our expectations, beliefs and views about our future financial performance and our business, trends and expectations regarding the markets in which we operate, and our future plans. Those statements constitute “forward-lookin
Slide 3: Corporate Overview
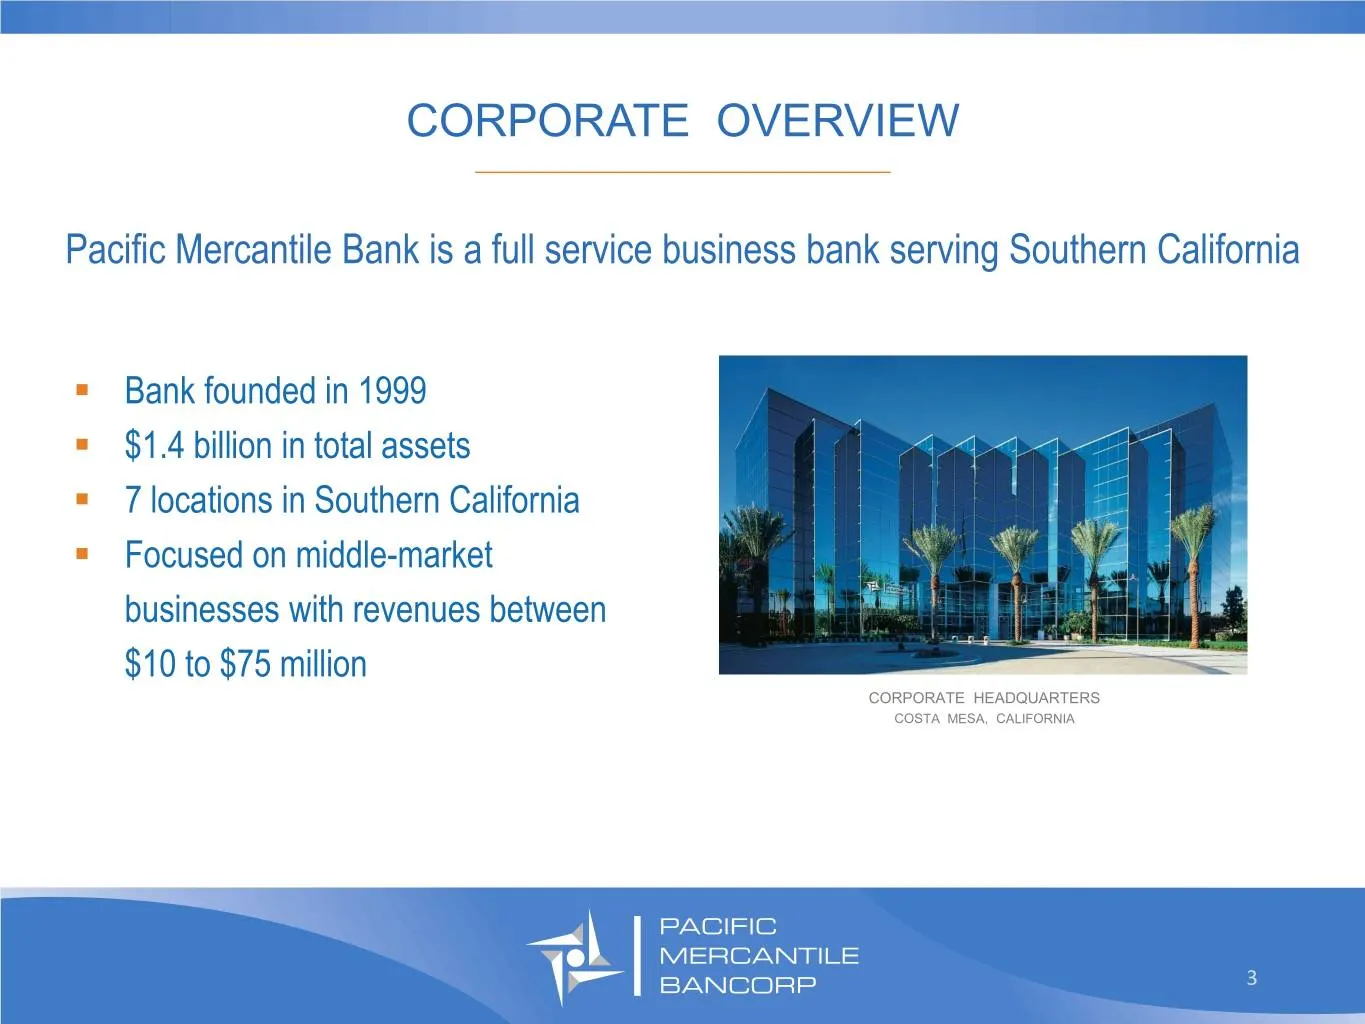
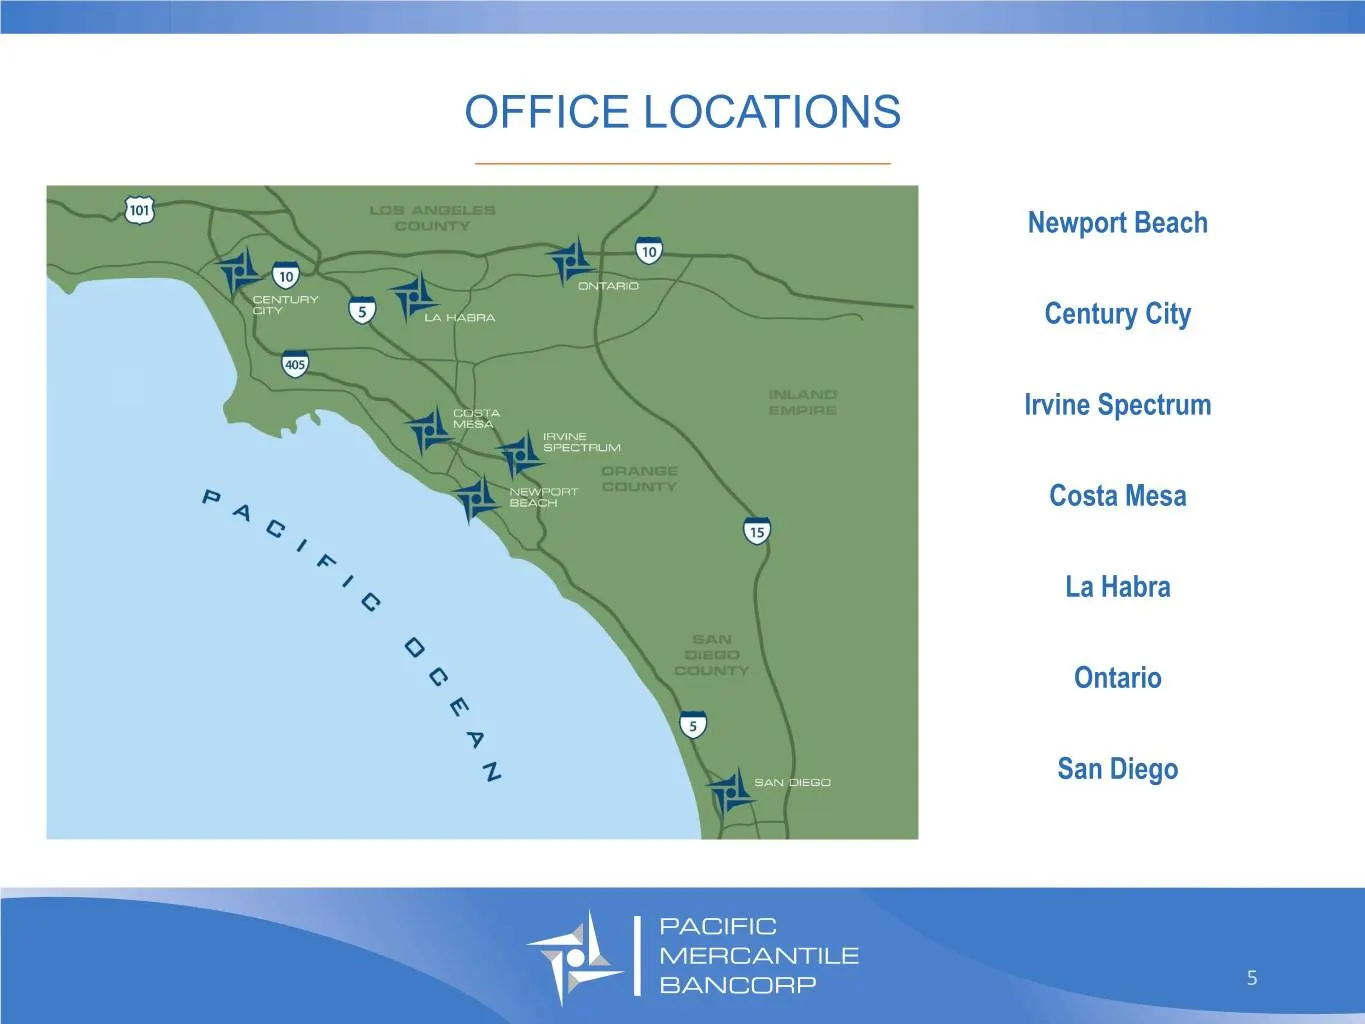
CORPORATE OVERVIEW _________________________________ Pacific Mercantile Bank is a full service business bank serving Southern California . Bank founded in 1999 . $1.4 billion in total assets . 7 locations in Southern California . Focused on middle-market businesses with revenues between $10 to $75 m
Slide 4: Investment Highlights
INVESTMENT HIGHLIGHTS _________________________________ . Growing commercial bank operating in attractive Southern California markets . New CEO hired in September 2019 to accelerate growth and profitability . Well defined value proposition drives new client acquisition without compromising on pricin
Slide 5: Office Locations
OFFICE LOCATIONS _________________________________ Newport Beach Century City Irvine Spectrum Costa Mesa La Habra Ontario San Diego 5
Slide 6: Executive Management Team
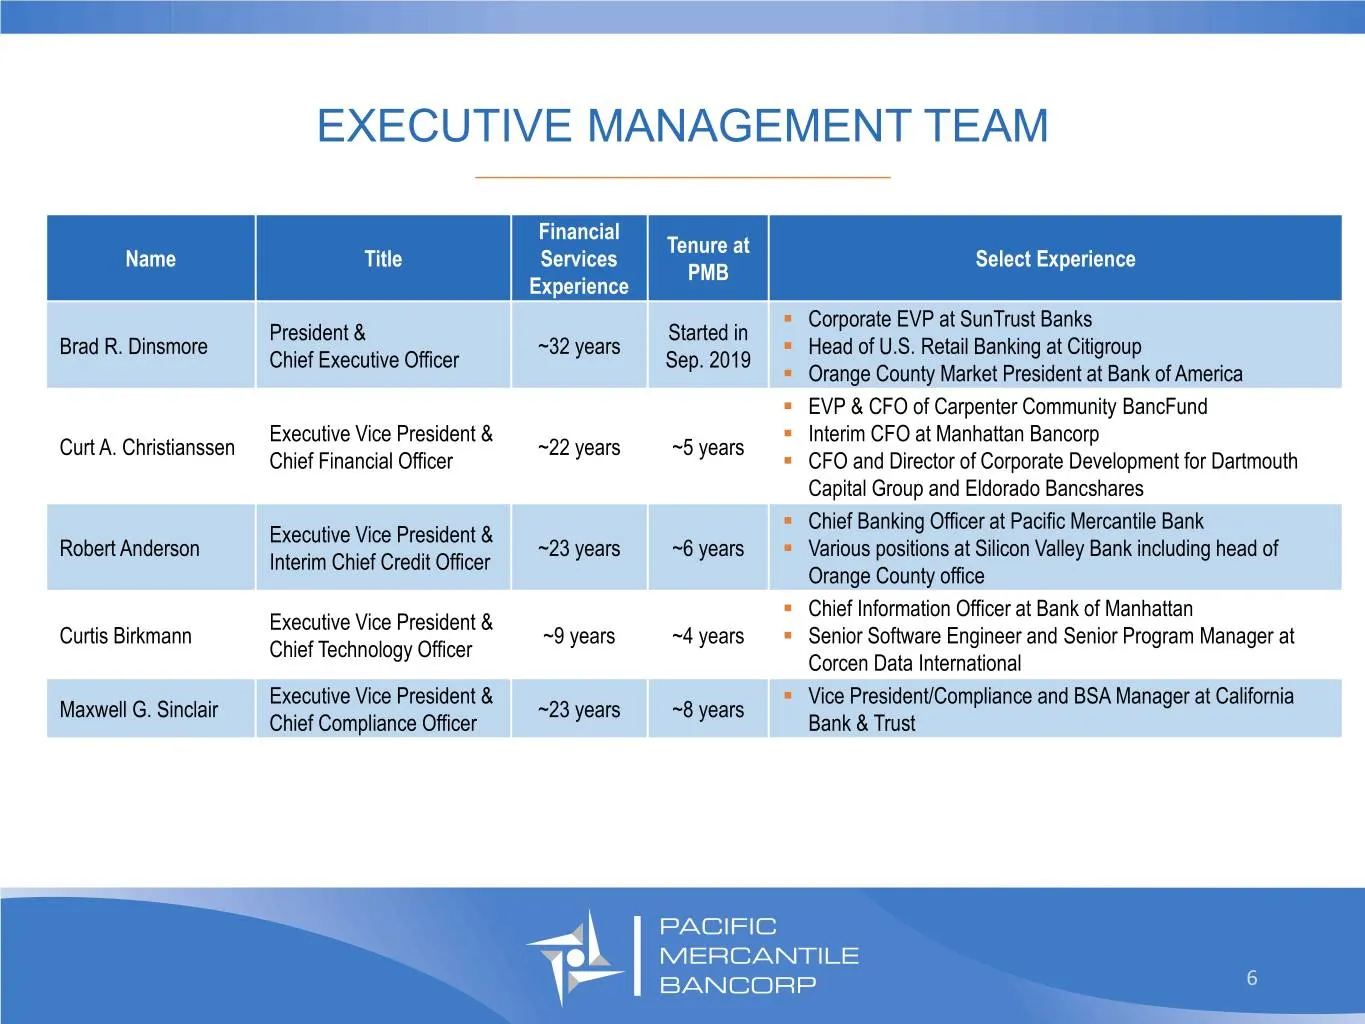
EXECUTIVE MANAGEMENT TEAM _________________________________ Financial Tenure at Name Title Services Select Experience PMB Experience . Corporate EVP at SunTrust Banks President & Started in Brad R. Dinsmore ~32 years . Head of U.S. Retail Banking at Citigroup Chief Executive Officer Sep. 2019 . Oran
Slide 7: Board of Directors
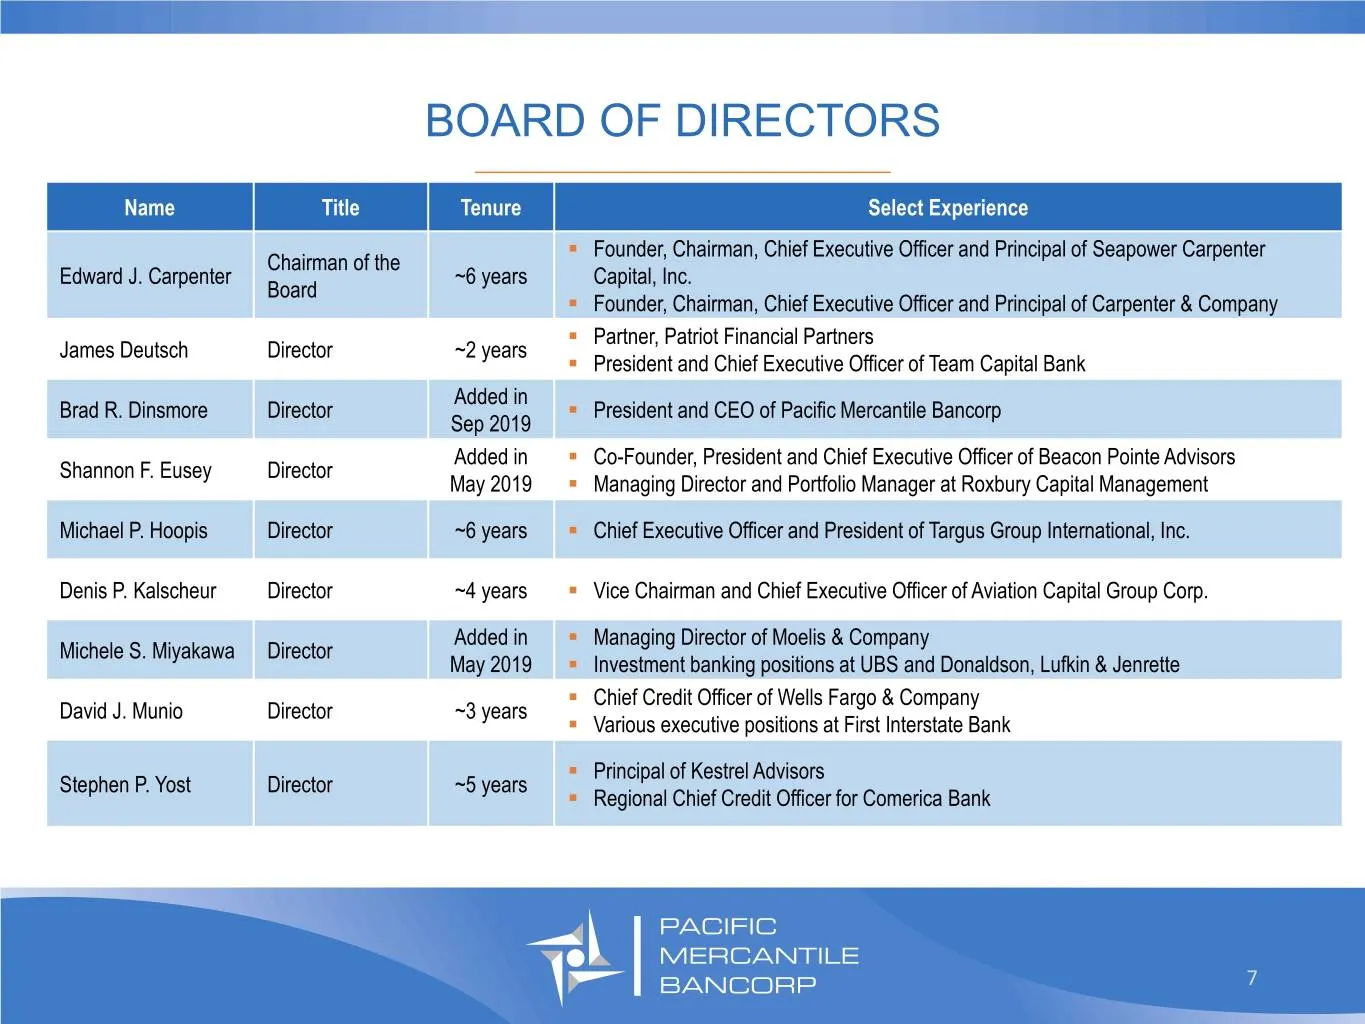
BOARD OF DIRECTORS _________________________________ Name Title Tenure Select Experience . Founder, Chairman, Chief Executive Officer and Principal of Seapower Carpenter Chairman of the Edward J. Carpenter ~6 years Capital, Inc. Board . Founder, Chairman, Chief Executive Officer and Principal of Car
Slide 8: Market Positioning
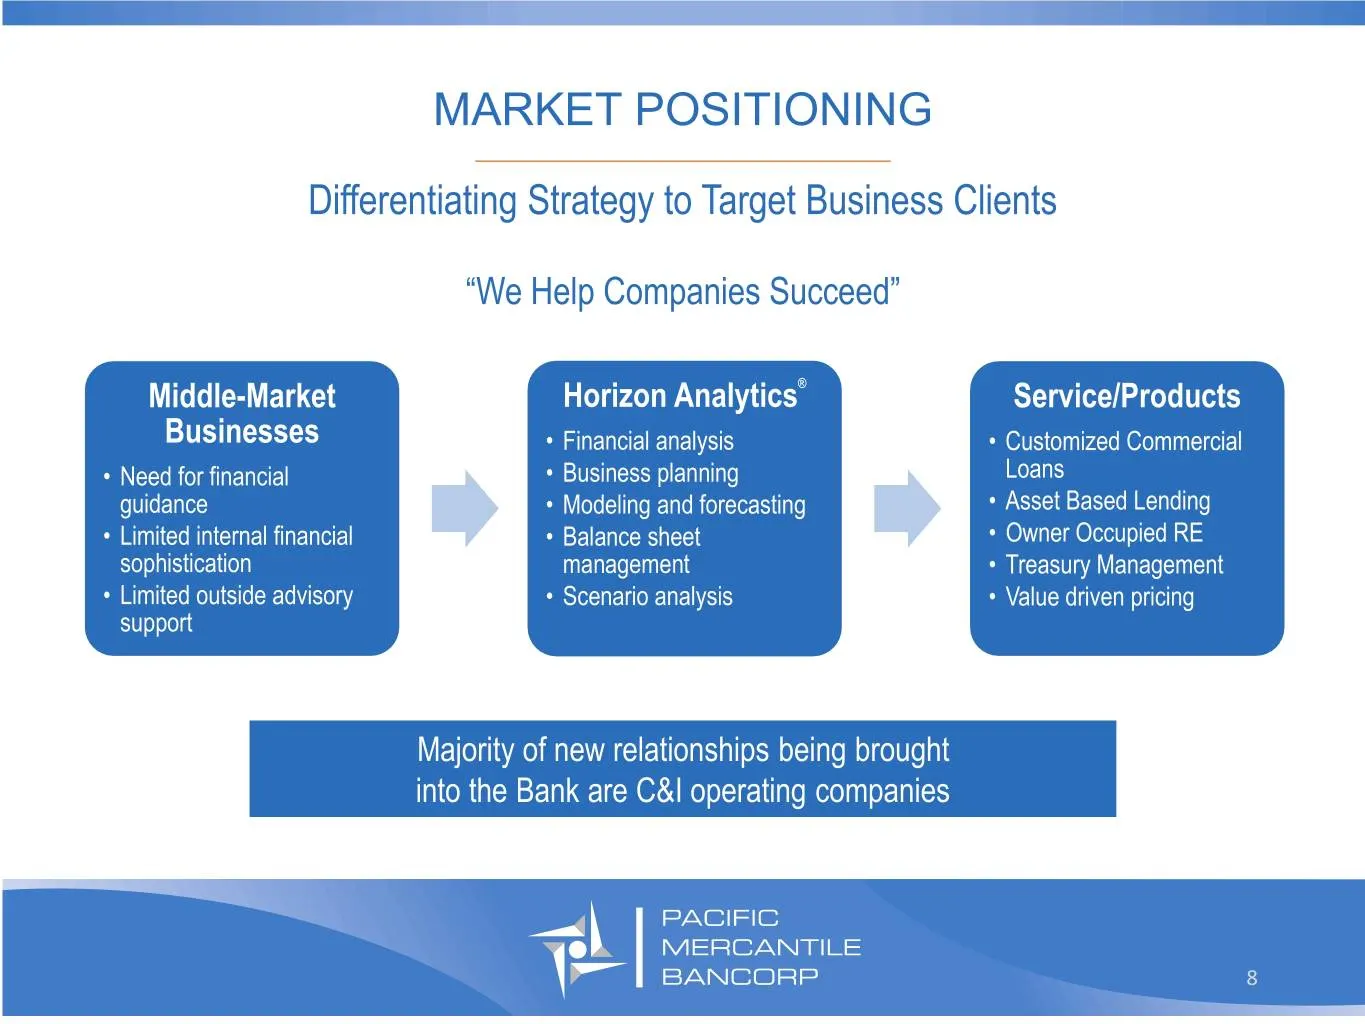
MARKET POSITIONING _________________________________ Differentiating Strategy to Target Business Clients “We Help Companies Succeed” Middle-Market Horizon Analytics® Service/Products Businesses • Financial analysis • Customized Commercial • Need for financial • Business planning Loans guidance • Mod
Slide 9: Horizon Analytics
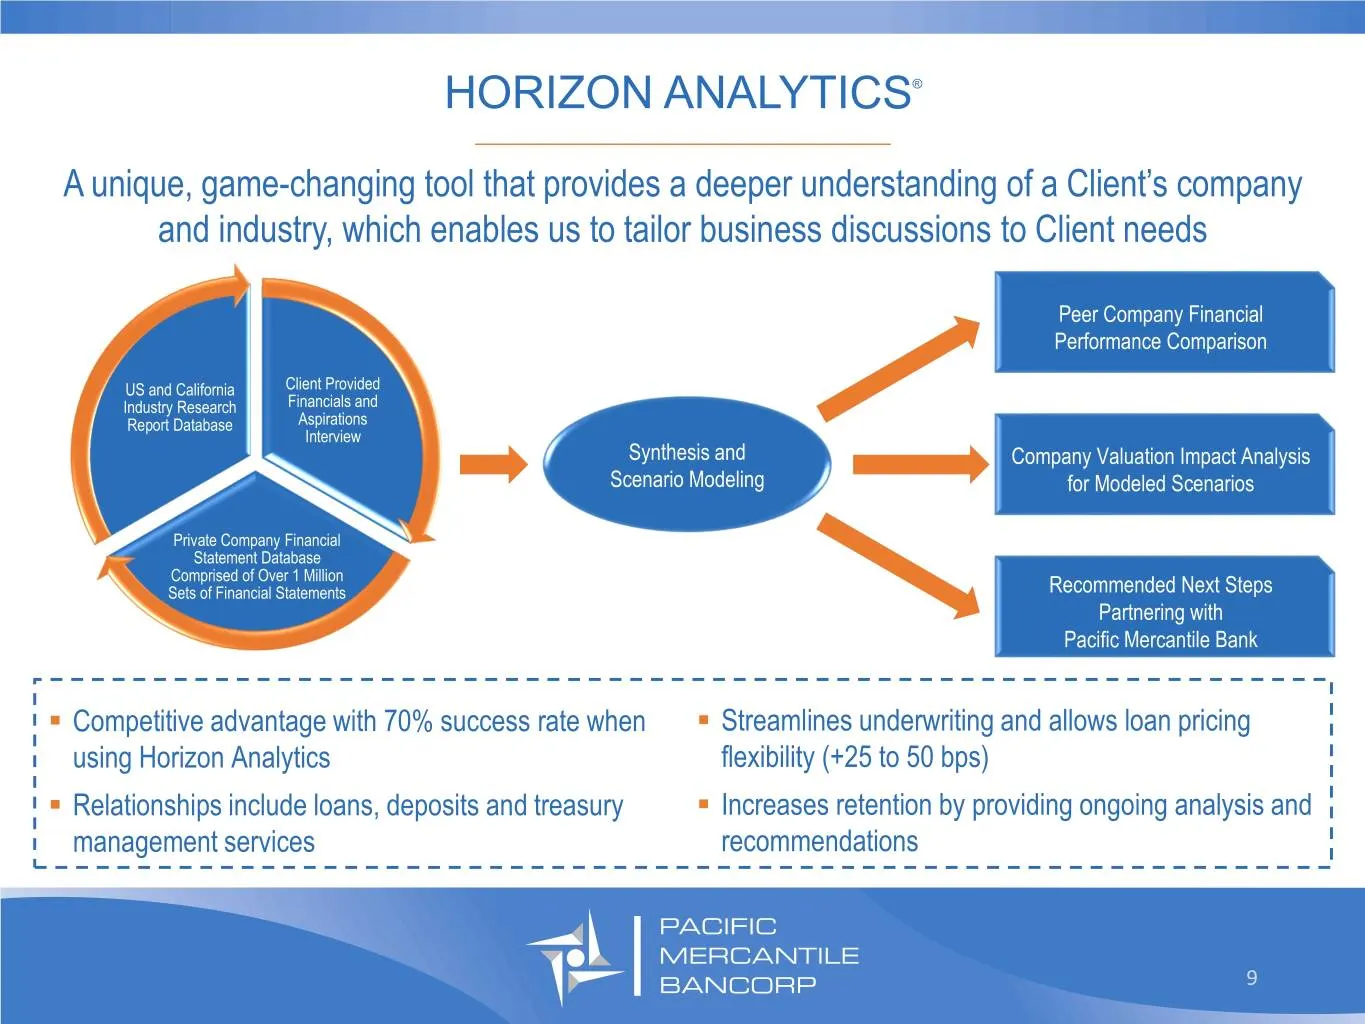
HORIZON ANALYTICS® _________________________________ A unique, game-changing tool that provides a deeper understanding of a Client’s company and industry, which enables us to tailor business discussions to Client needs Peer Company Financial Performance Comparison US and California Client Provided I
Slide 10: Operating Company Highlights
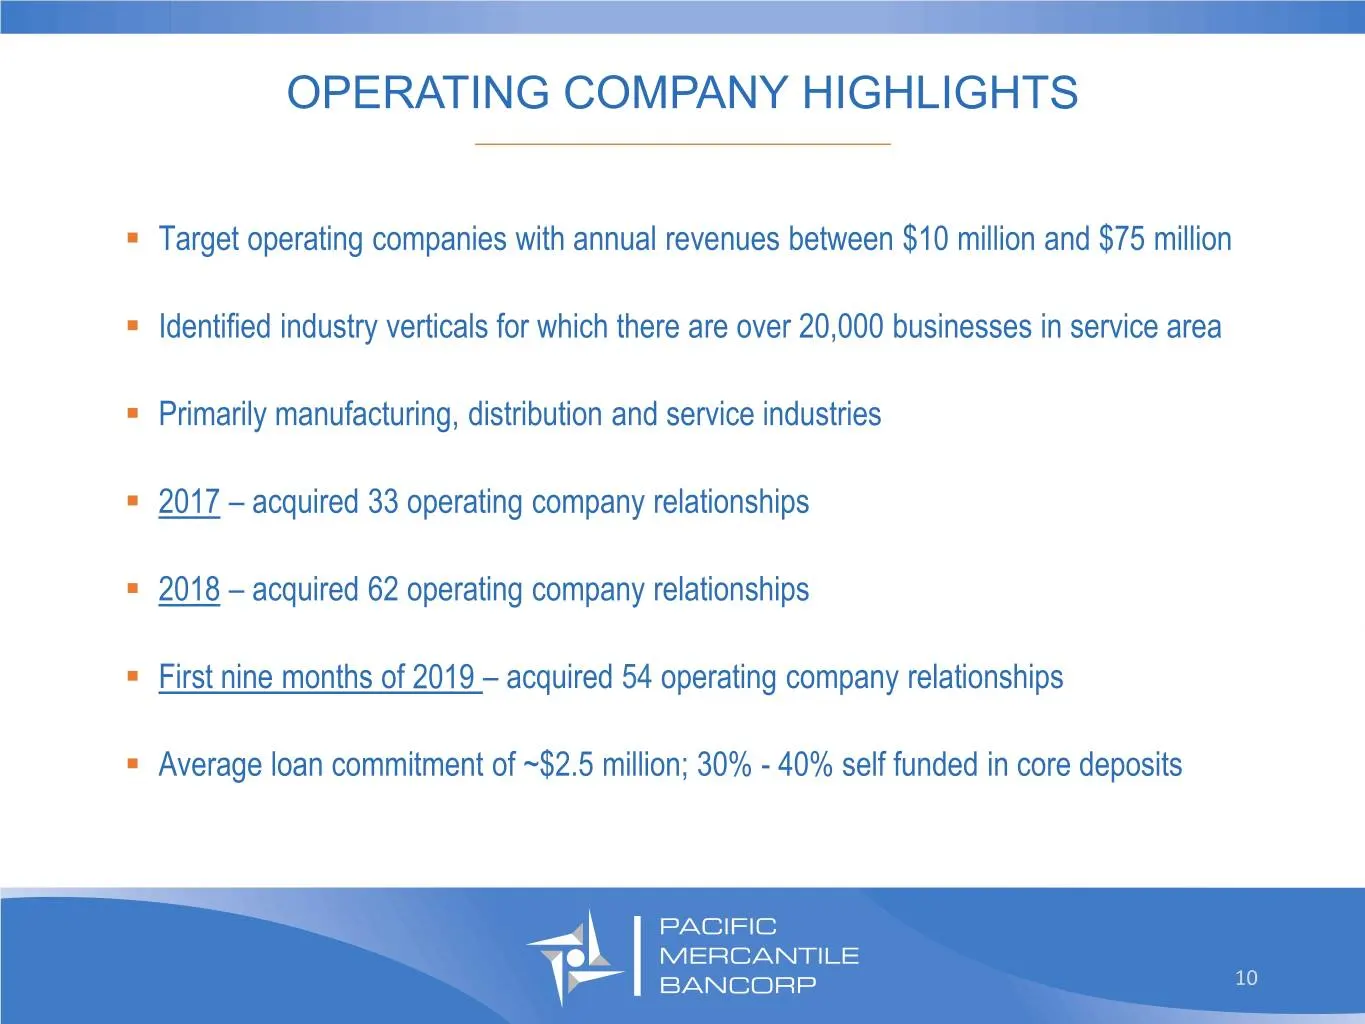
OPERATING COMPANY HIGHLIGHTS _________________________________ . Target operating companies with annual revenues between $10 million and $75 million . Identified industry verticals for which there are over 20,000 businesses in service area . Primarily manufacturing, distribution and service industri
Slide 11: Enhancing Banker Productivity
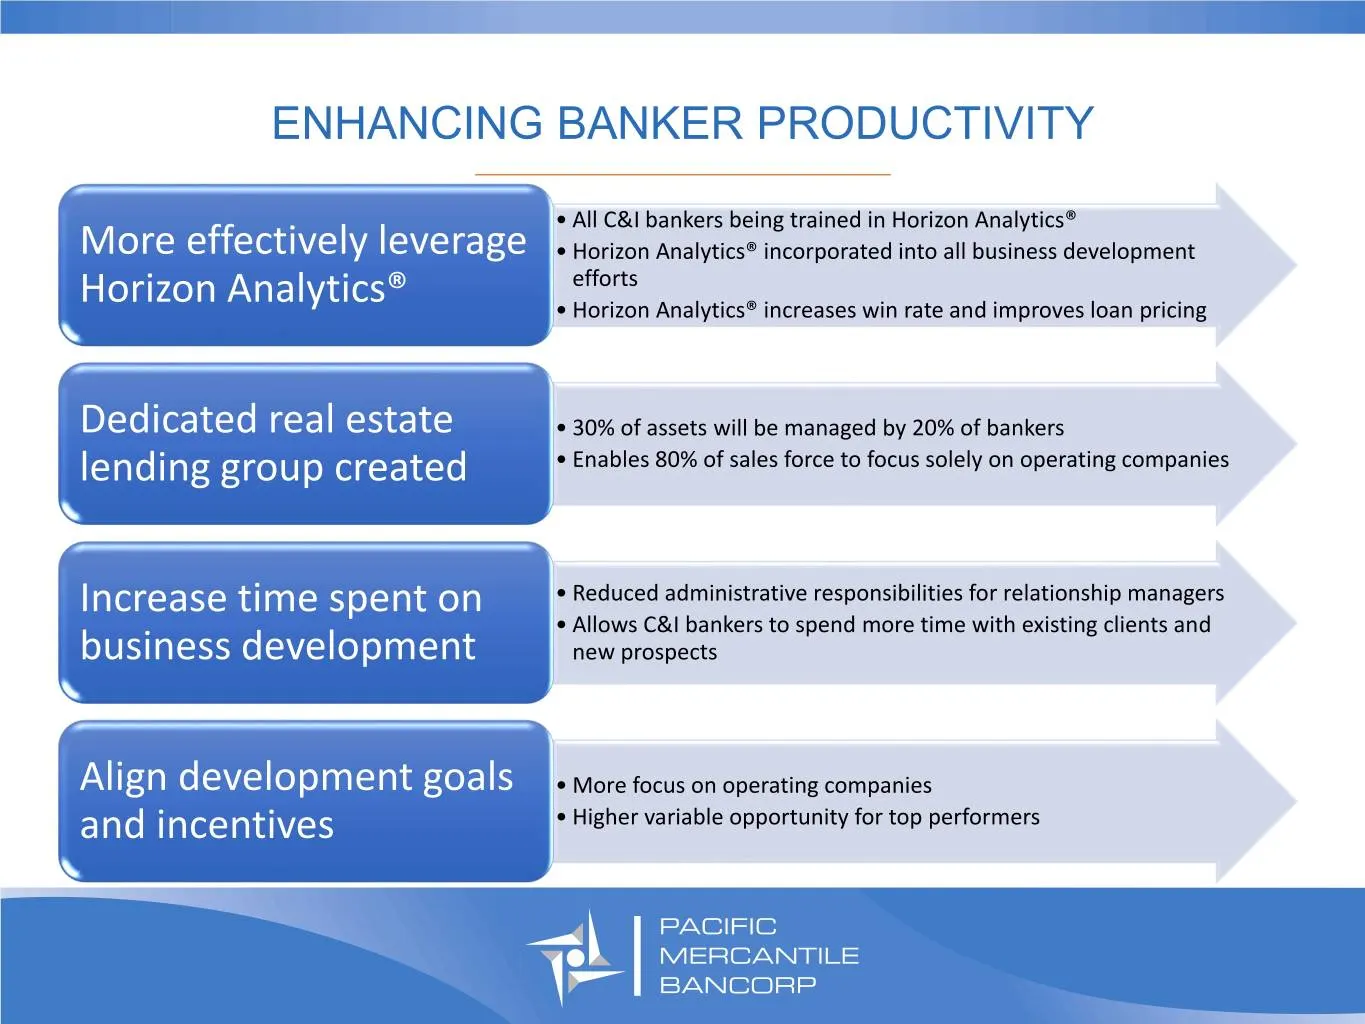
ENHANCING BANKER PRODUCTIVITY _________________________________ • All C&I bankers being trained in Horizon Analytics® More effectively leverage • Horizon Analytics® incorporated into all business development efforts Horizon Analytics® • Horizon Analytics® increases win rate and improves loan pricing
Slide 12: Financial Performance Overview
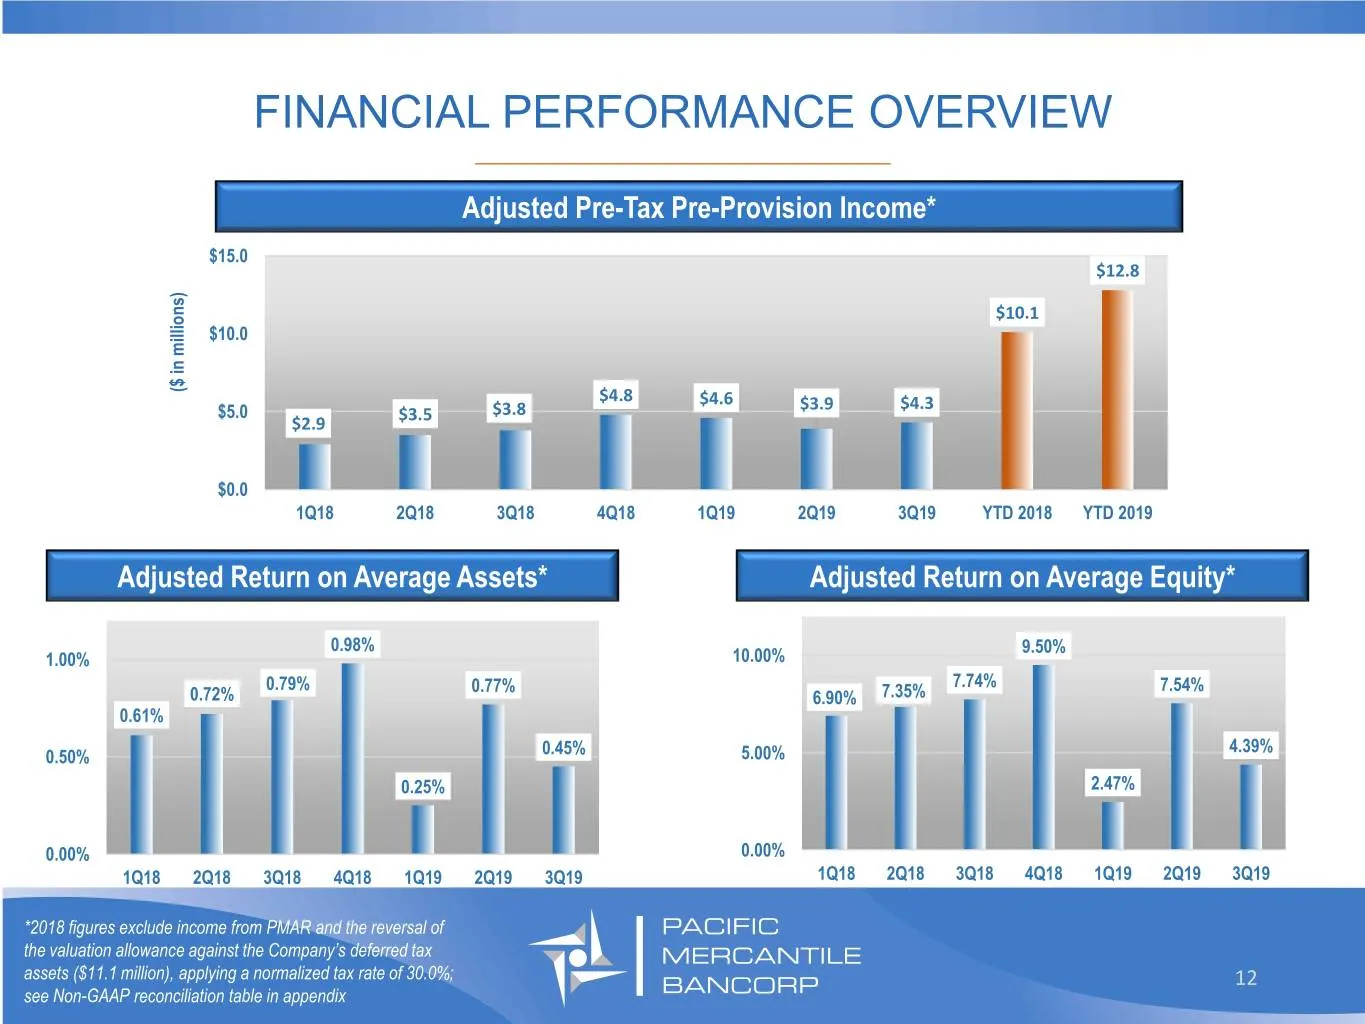
FINANCIAL PERFORMANCE OVERVIEW _________________________________ Adjusted Pre-Tax Pre-Provision Income* $15.0 $12.8 $10.1 $10.0 ($ in millions)in ($ $4.8 $4.6 $5.0 $3.8 $3.9 $4.3 $2.9 $3.5 $0.0 1Q18 2Q18 3Q18 4Q18 1Q19 2Q19 3Q19 YTD 2018 YTD 2019 Adjusted Return on Average Assets* Adjusted Return on
Slide 13: Improving Operating Leverage
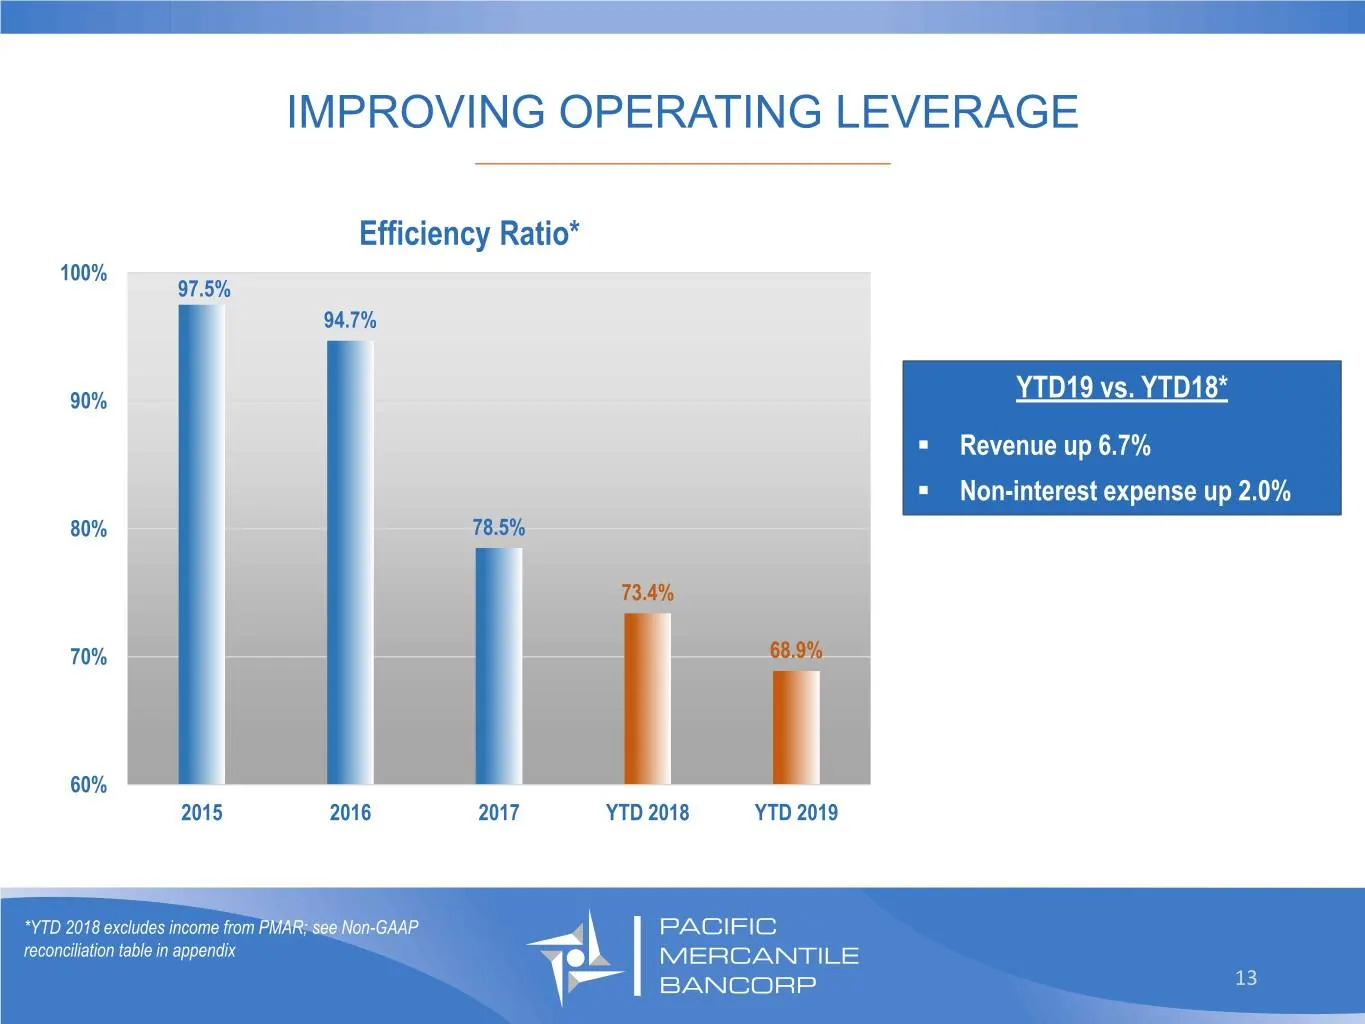
IMPROVING OPERATING LEVERAGE _________________________________ Efficiency Ratio* 100% 97.5% 94.7% 90% YTD19 vs. YTD18* . Revenue up 6.7% . Non-interest expense up 2.0% 80% 78.5% 73.4% 70% 68.9% 60% 2015 2016 2017 YTD 2018 YTD 2019 *YTD 2018 excludes income from PMAR; see Non-GAAP reconciliation tabl
Slide 14: Loan Portfolio Focus on Relationship Lending
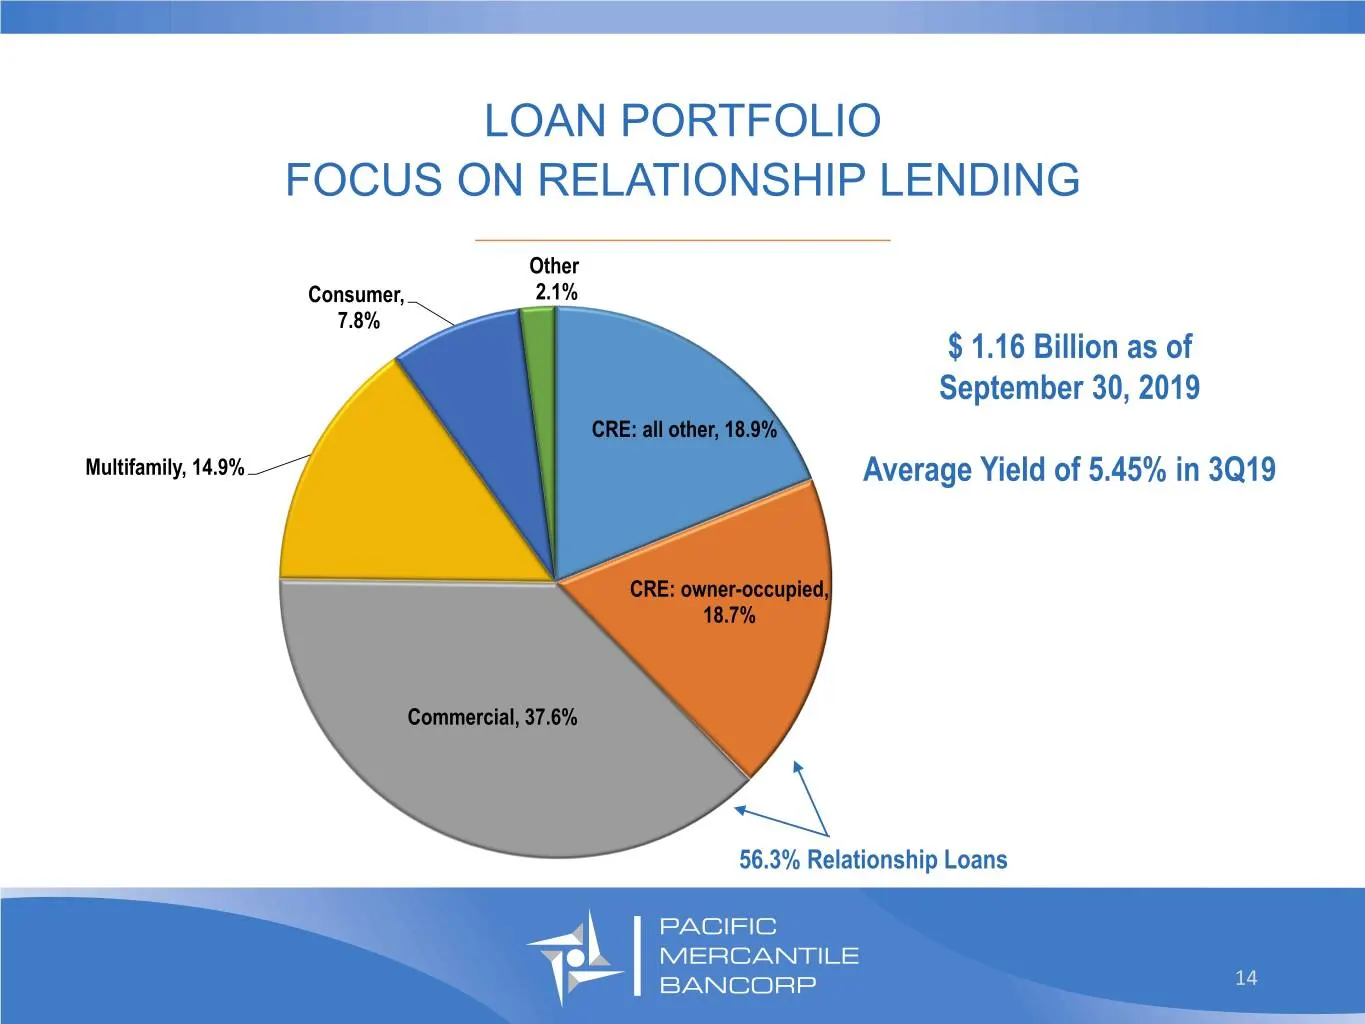
LOAN PORTFOLIO FOCUS ON RELATIONSHIP LENDING _________________________________ Other Consumer, 2.1% 7.8% $ 1.16 Billion as of September 30, 2019 CRE: all other, 18.9% Multifamily, 14.9% Average Yield of 5.45% in 3Q19 CRE: owner-occupied, 18.7% Commercial, 37.6% 56.3% Relationship Loans 14
Slide 15: Loan Production Trends
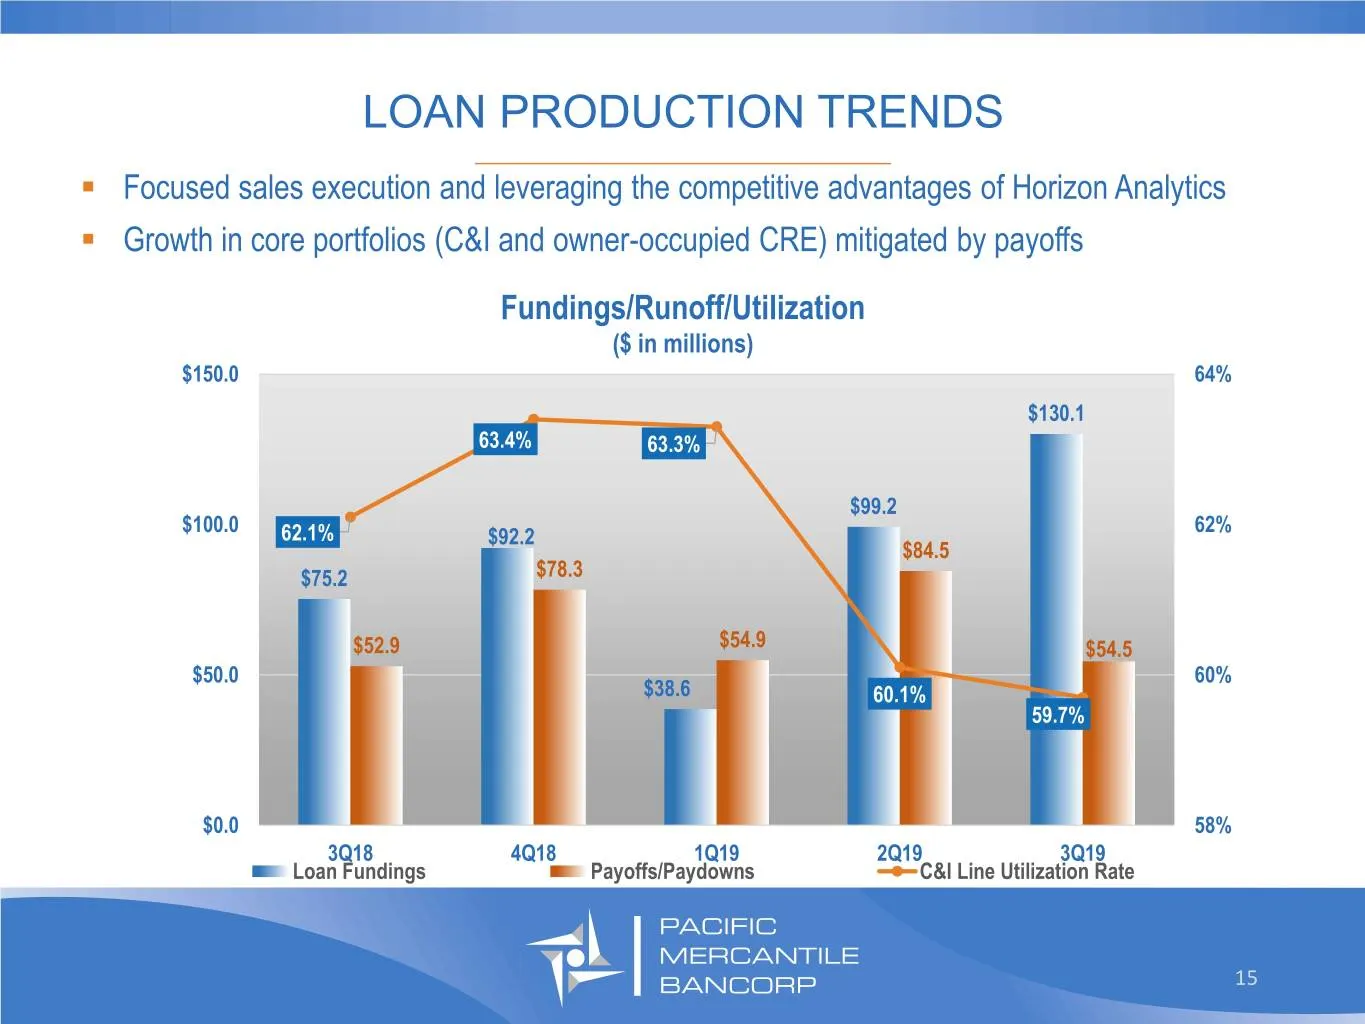
LOAN PRODUCTION TRENDS _________________________________ . Focused sales execution and leveraging the competitive advantages of Horizon Analytics . Growth in core portfolios (C&I and owner-occupied CRE) mitigated by payoffs Fundings/Runoff/Utilization ($ in millions) $150.0 64% $130.1 63.4% 63.3% $9
Slide 16: Drivers of Loan Growth
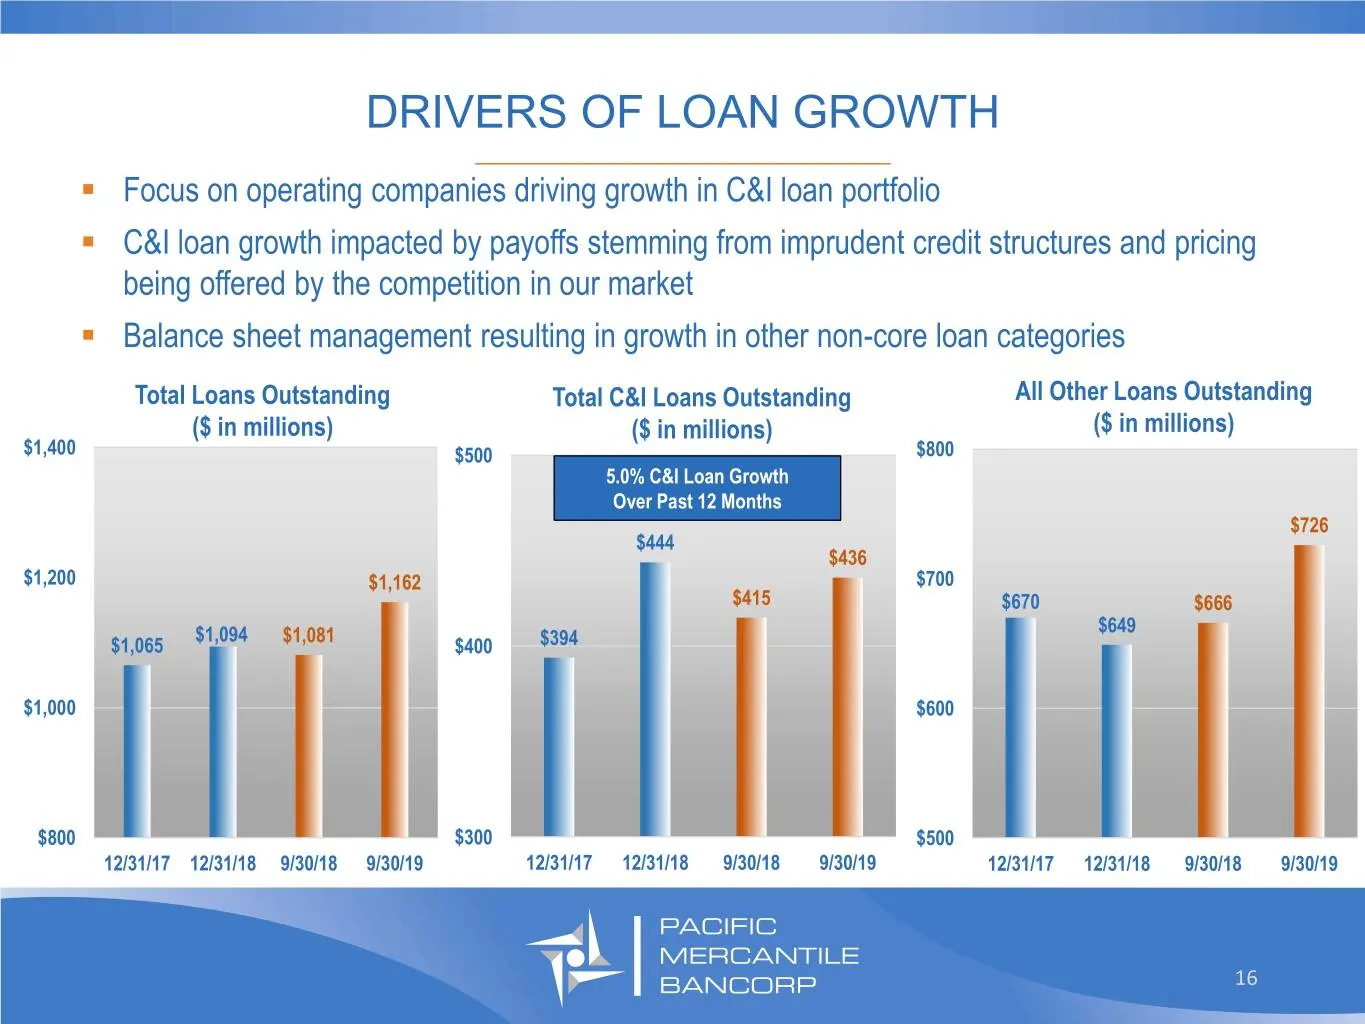
DRIVERS OF LOAN GROWTH _________________________________ . Focus on operating companies driving growth in C&I loan portfolio . C&I loan growth impacted by payoffs stemming from imprudent credit structures and pricing being offered by the competition in our market . Balance sheet management resulting
Slide 17: Asset Quality
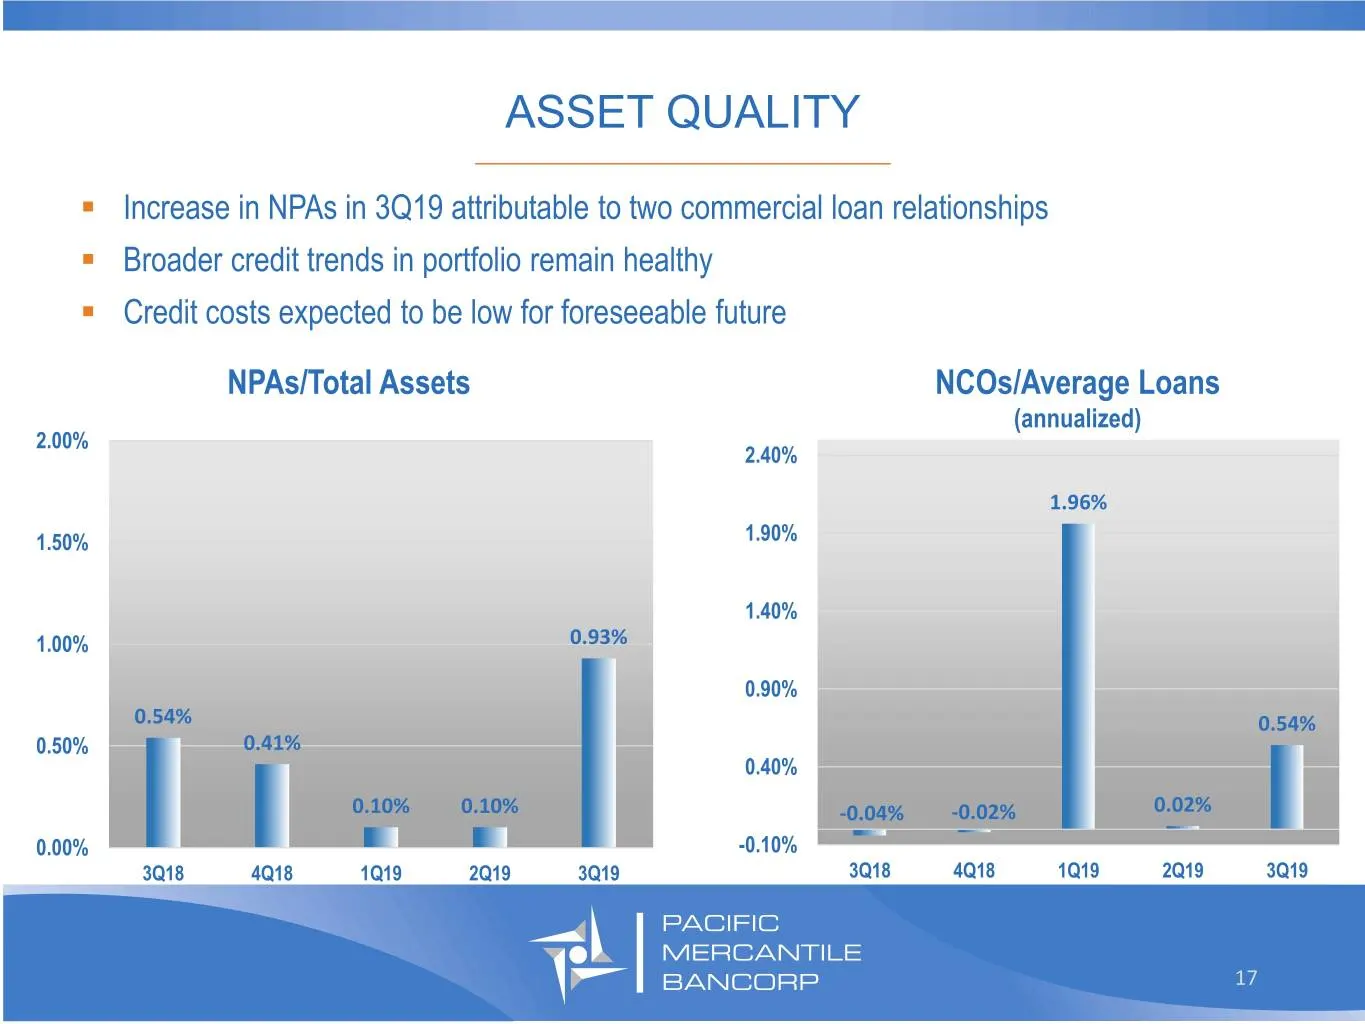
ASSET QUALITY _________________________________ . Increase in NPAs in 3Q19 attributable to two commercial loan relationships . Broader credit trends in portfolio remain healthy . Credit costs expected to be low for foreseeable future NPAs/Total Assets NCOs/Average Loans (annualized) 2.00% 2.40% 1.96
Slide 18: Deposit Composition Focused on Core Deposits
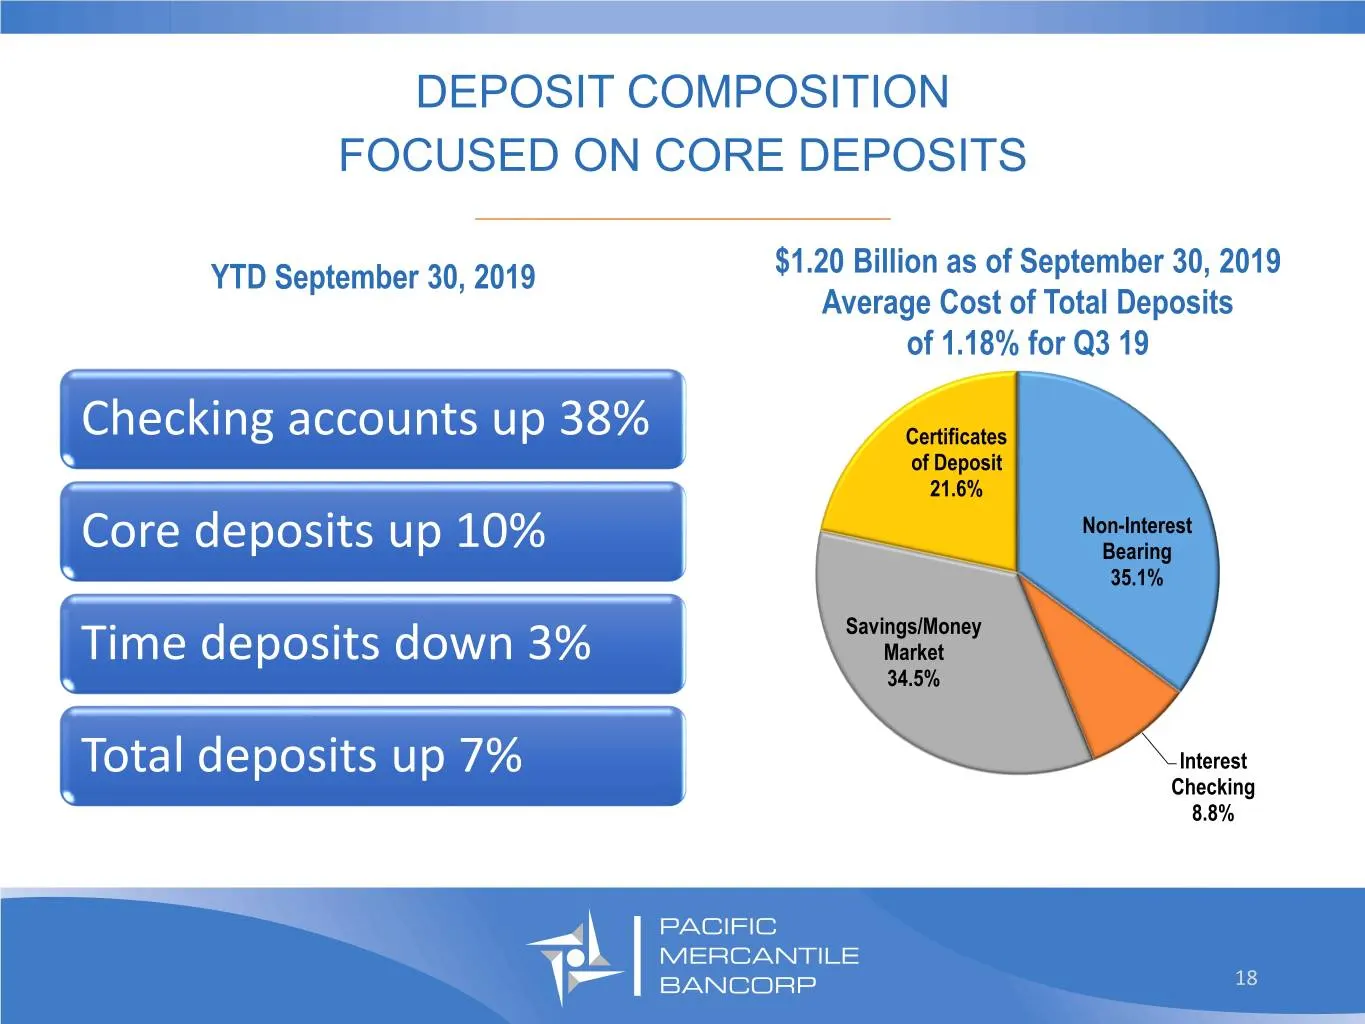
DEPOSIT COMPOSITION FOCUSED ON CORE DEPOSITS _________________________________ YTD September 30, 2019 $1.20 Billion as of September 30, 2019 Average Cost of Total Deposits of 1.18% for Q3 19 Checking accounts up 38% Certificates of Deposit 21.6% Non-Interest Core deposits up 10% Bearing 35.1% Saving
Slide 19: Net Interest Margin
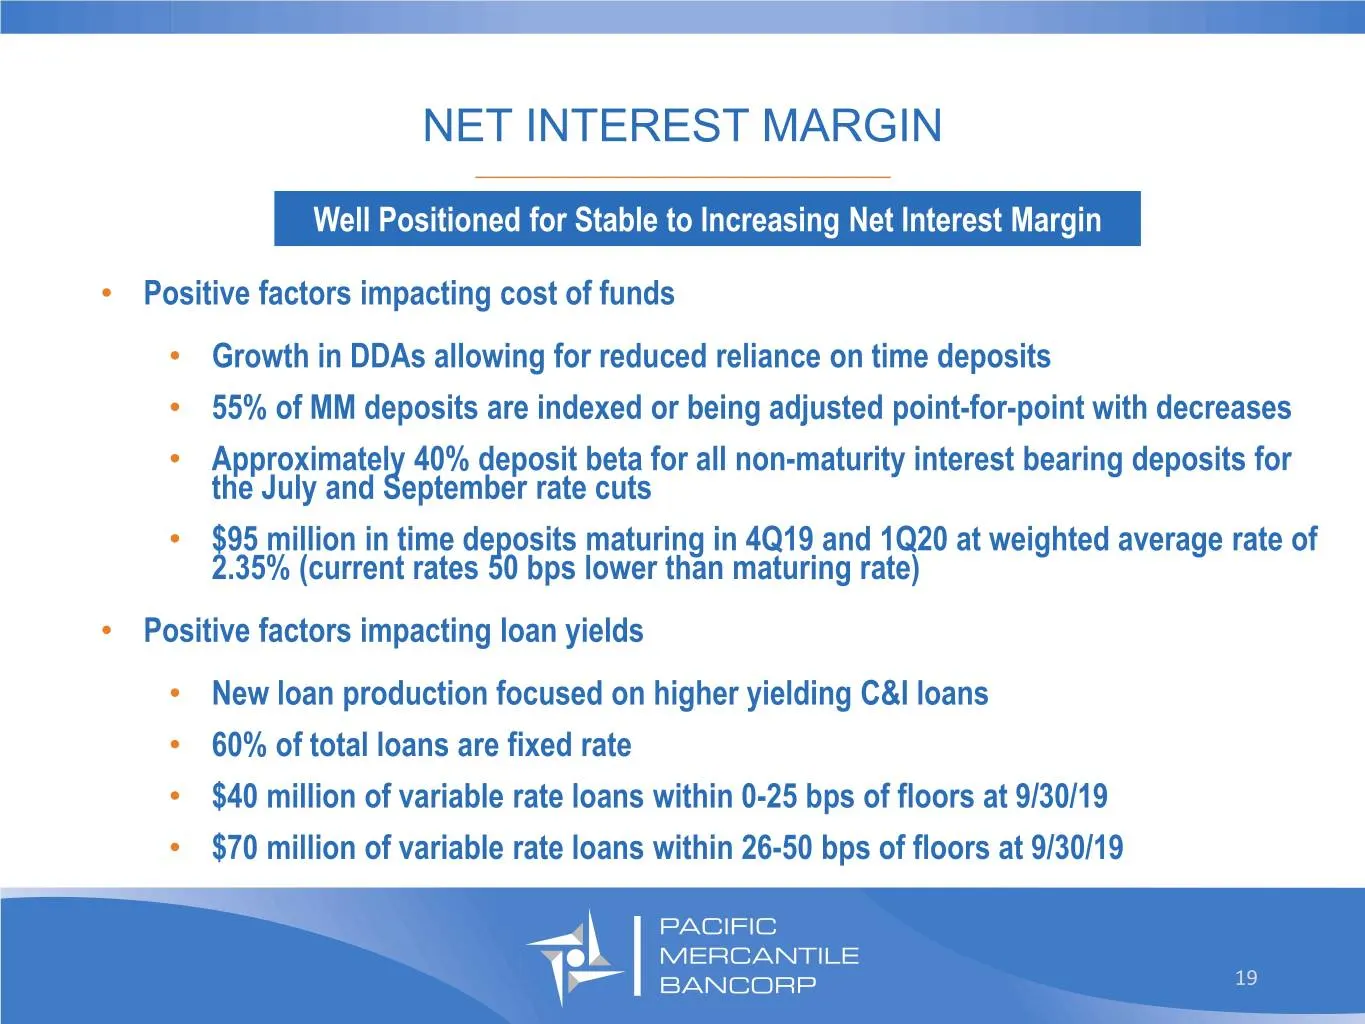
NET INTEREST MARGIN _________________________________ Well Positioned for Stable to Increasing Net Interest Margin • Positive factors impacting cost of funds • Growth in DDAs allowing for reduced reliance on time deposits • 55% of MM deposits are indexed or being adjusted point-for-point with decrea
Slide 20: Strong Capital Position
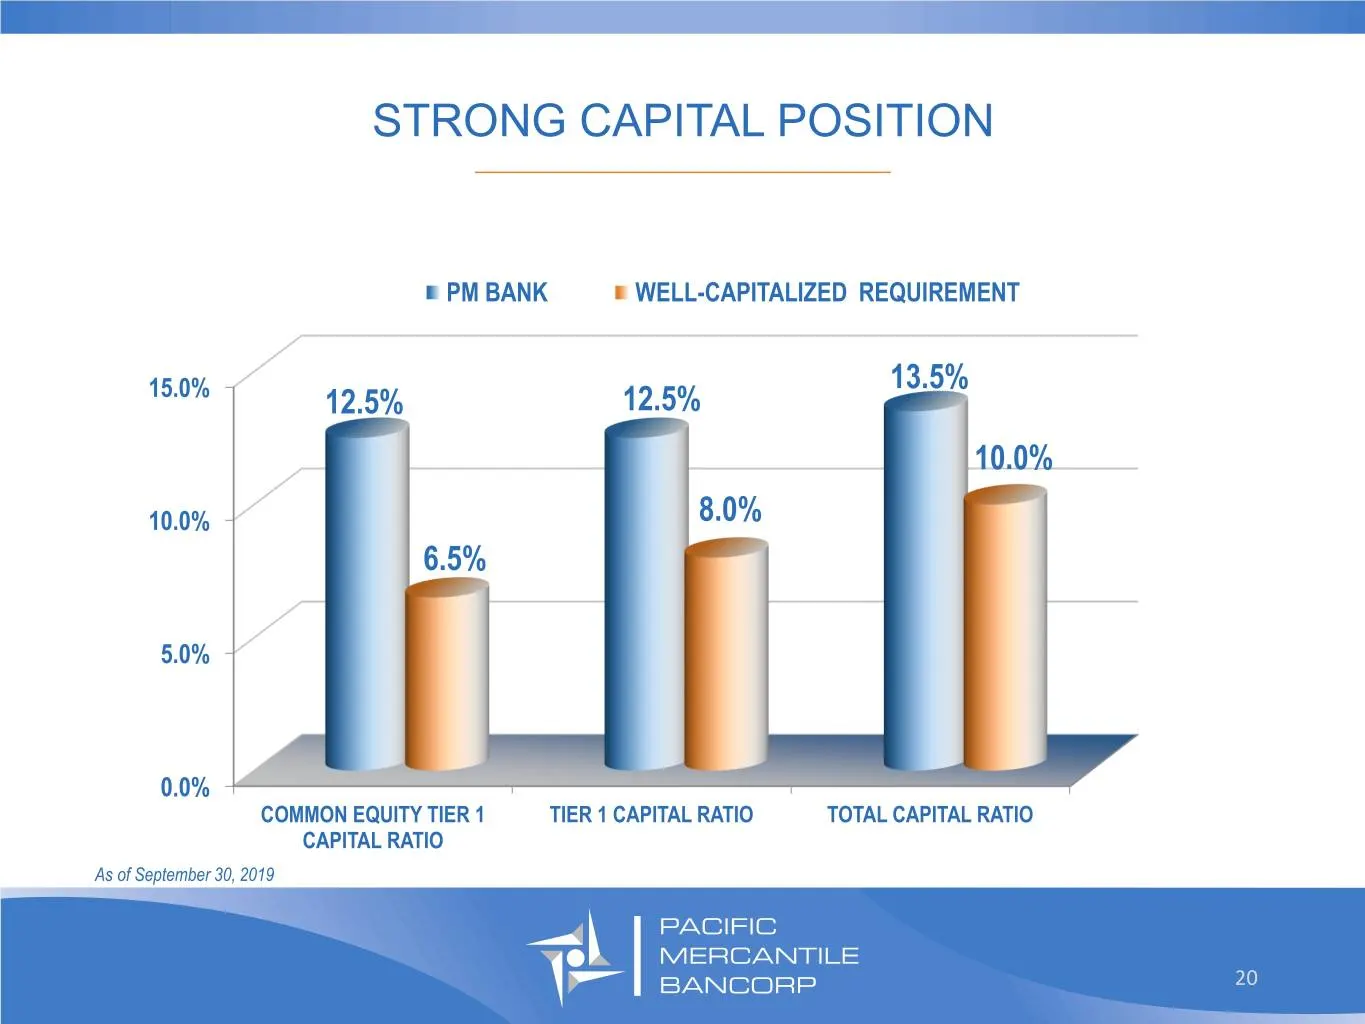
STRONG CAPITAL POSITION _________________________________ PM BANK WELL-CAPITALIZED REQUIREMENT 13.5% 15.0% 12.5% 12.5% 10.0% 10.0% 8.0% 6.5% 5.0% 0.0% COMMON EQUITY TIER 1 TIER 1 CAPITAL RATIO TOTAL CAPITAL RATIO CAPITAL RATIO As of September 30, 2019 20
Slide 21: Strategic Priorities
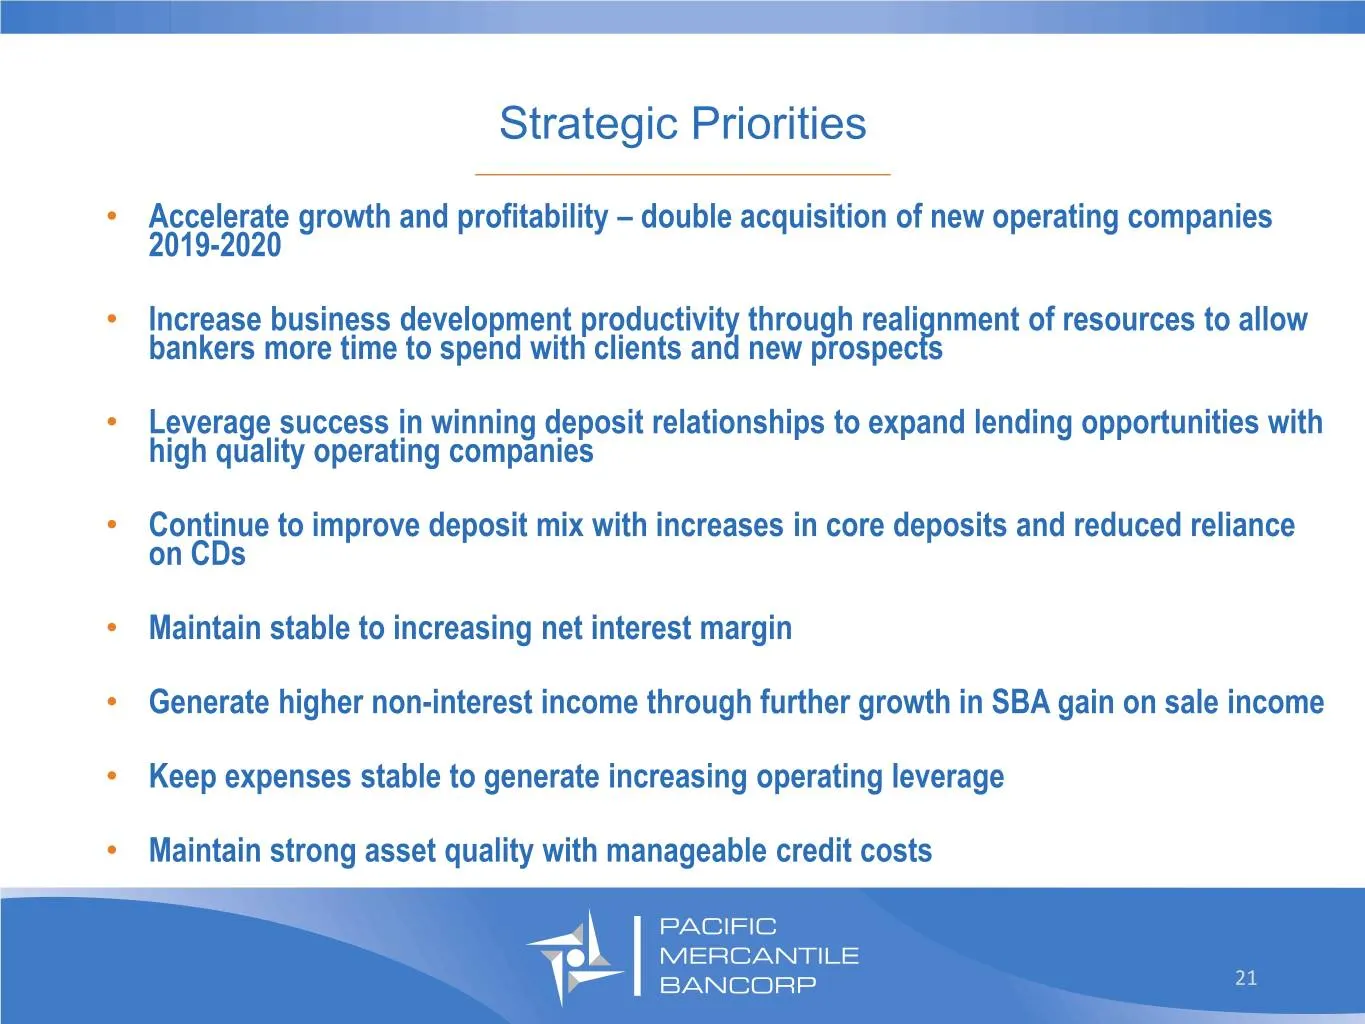
Strategic Priorities _________________________________ • Accelerate growth and profitability – double acquisition of new operating companies 2019-2020 • Increase business development productivity through realignment of resources to allow bankers more time to spend with clients and new prospects • Le
Slide 22: Investor Relations
Investor Relations: Curt Christianssen ( 7 1 4 ) 4 3 8 - 2 5 3 1 Curt.christianssen@pmbank.com 22
Slide 23: Non-GAAP Reconciliation
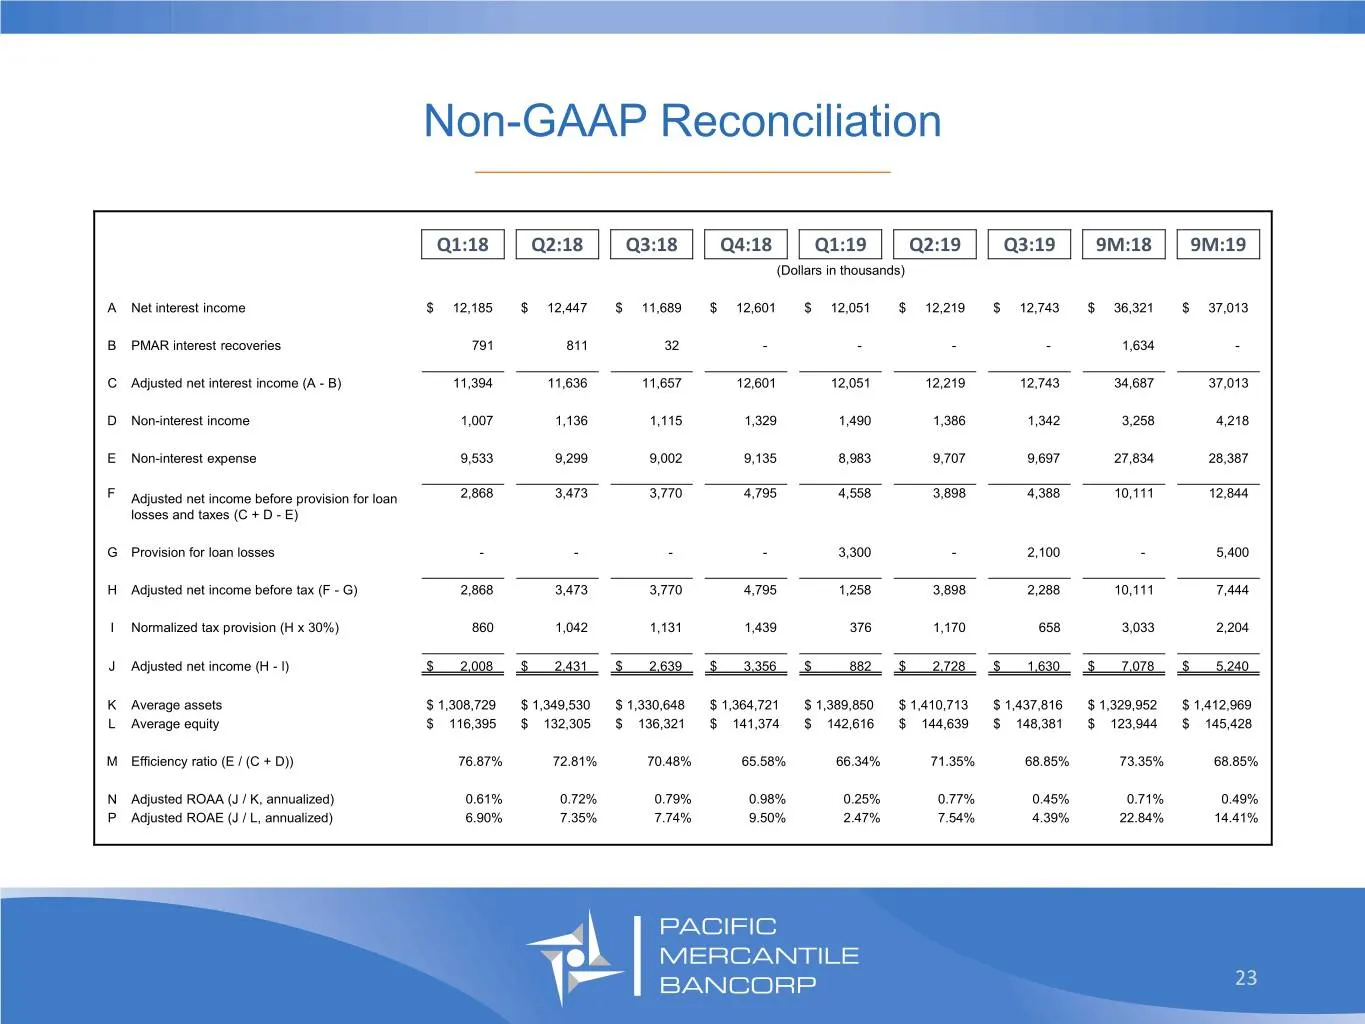
Non-GAAP Reconciliation _________________________________ Q1:18 Q2:18 Q3:18 Q4:18 Q1:19 Q2:19 Q3:19 9M:18 9M:19 (Dollars in thousands) A Net interest income $ 12,185 $ 12,447 $ 11,689 $ 12,601 $ 12,051 $ 12,219 $ 12,743 $ 36,321 $ 37,013 B PMAR interest recoveries 791 811 32 - - - - 1,634 - C Adjust
Source: SEC EDGAR · 8-K filed Nov 4, 2019
More decks from Pacific Mercantile Bancorp
 Q1 2021 Earnings Presentation18 slides · Apr 26, 2021
 Merger or Acquisition (March 2021)9 slides · Mar 23, 2021
 Q4 2020 Earnings Presentation22 slides · Jan 25, 2021
 Q3 2020 Earnings Presentation23 slides · Nov 2, 2020
 Corporate Update (September 2020)25 slides · Sep 8, 2020
 Corporate Update (August 2020)25 slides · Aug 5, 2020