AZZ Inc. · NYSE:AZZ
AZZ — Investor Presentation (February 2024)
29 slides from AZZ's investor presentation, February 2024
Slide 1: Investor Presentation
INVESTOR PRESENTATION INVESTOR PRESENTATION February 2024 (NYSE: AZZ)
Slide 2: Disclaimers
Disclaimers Cautionary Statements Regarding Forward Looking Statements — Certain statements herein about our expectations of future events or results constitute forward- looking statements for purposes of the safe harbor provisions of The Private Securities Litigation Reform Act of 1995, including t
Slide 3: Key Messages
Key Messages: Differentiated, high value-add metal coatings provider with scale, expertise and customer centric technology uniquely positioned to serve the growing North American steel and aluminum markets Strong business foundation capable of growing sales and margins at or above market levels, sup
Slide 4: AZZ Snapshot (NYSE: AZZ)
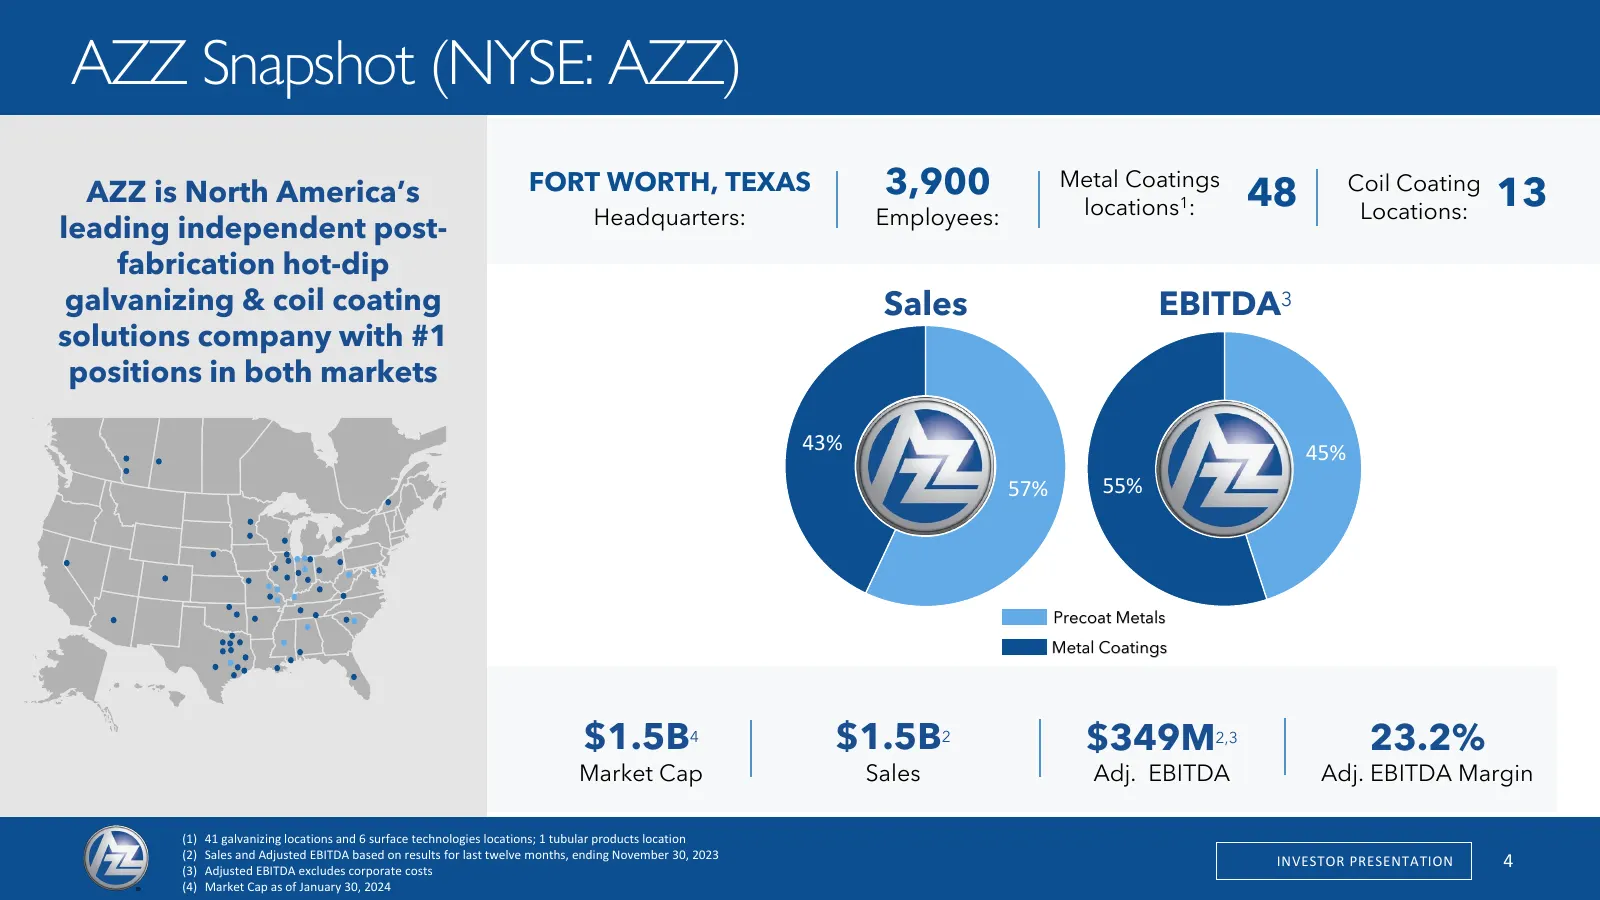
AZZ Snapshot (NYSE: AZZ) AZZ is North America’s FORT WORTH, TEXAS 3,900 Metal Coatings 48 Coil Coating 13 Headquarters: Employees: locations1: Locations: leading independent post- fabrication hot-dip galvanizing & coil coating Sales EBITDA3 solutions company with #1 positions in both markets 43% 45%
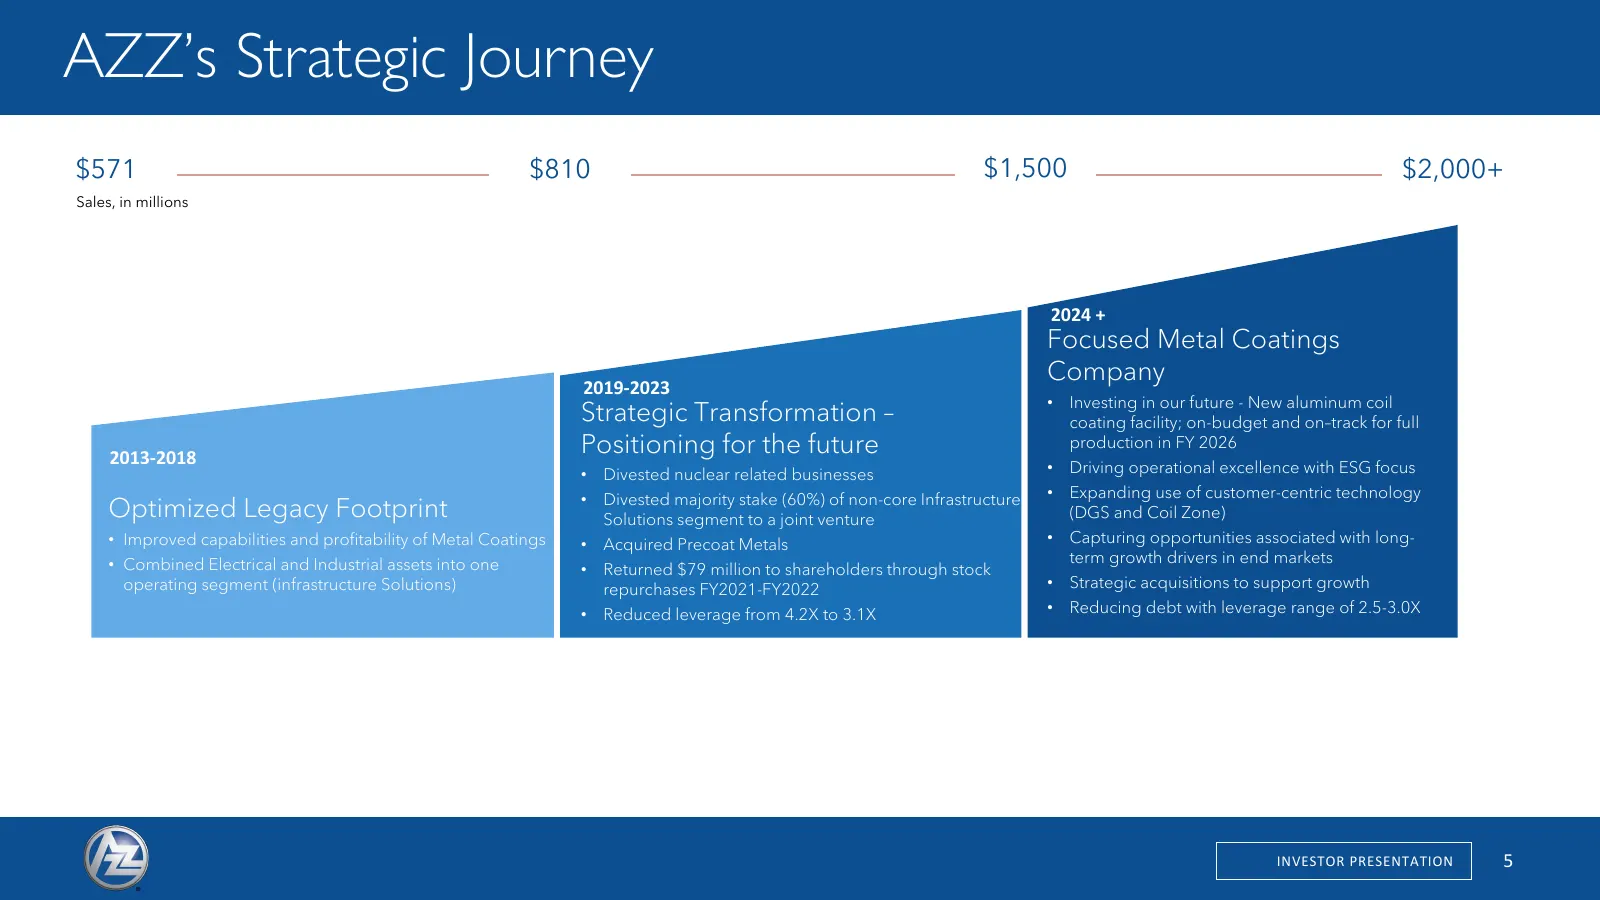
Slide 5: AZZ's Strategic Journey
AZZ’s Strategic Journey $571 $810 $1,500 $2,000+ Sales, in millions 2024 + Focused Metal Coatings Company 2019-2023 • Investing in our future - New aluminum coil Strategic Transformation – coating facility; on-budget and on–track for full 2013-2018 Positioning for the future production in FY 2026 •
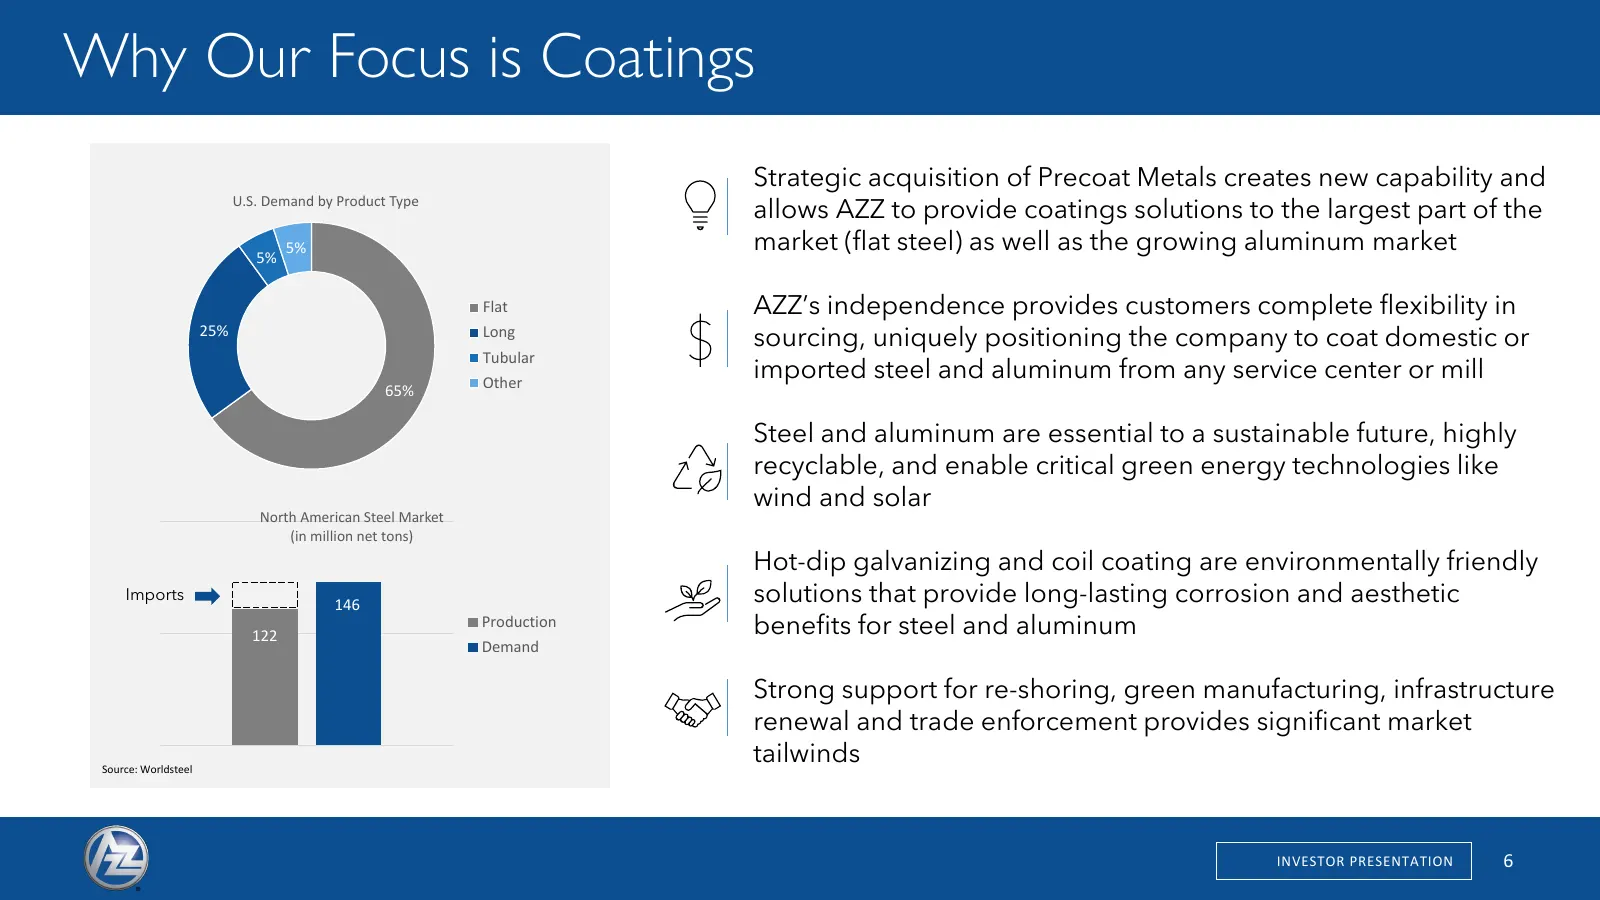
Slide 6: Why Our Focus is Coatings
Why Our Focus is Coatings Strategic acquisition of Precoat Metals creates new capability and U.S. Demand by Product Type allows AZZ to provide coatings solutions to the largest part of the 5% 5% market (flat steel) as well as the growing aluminum market Flat AZZ’s independence provides customers com
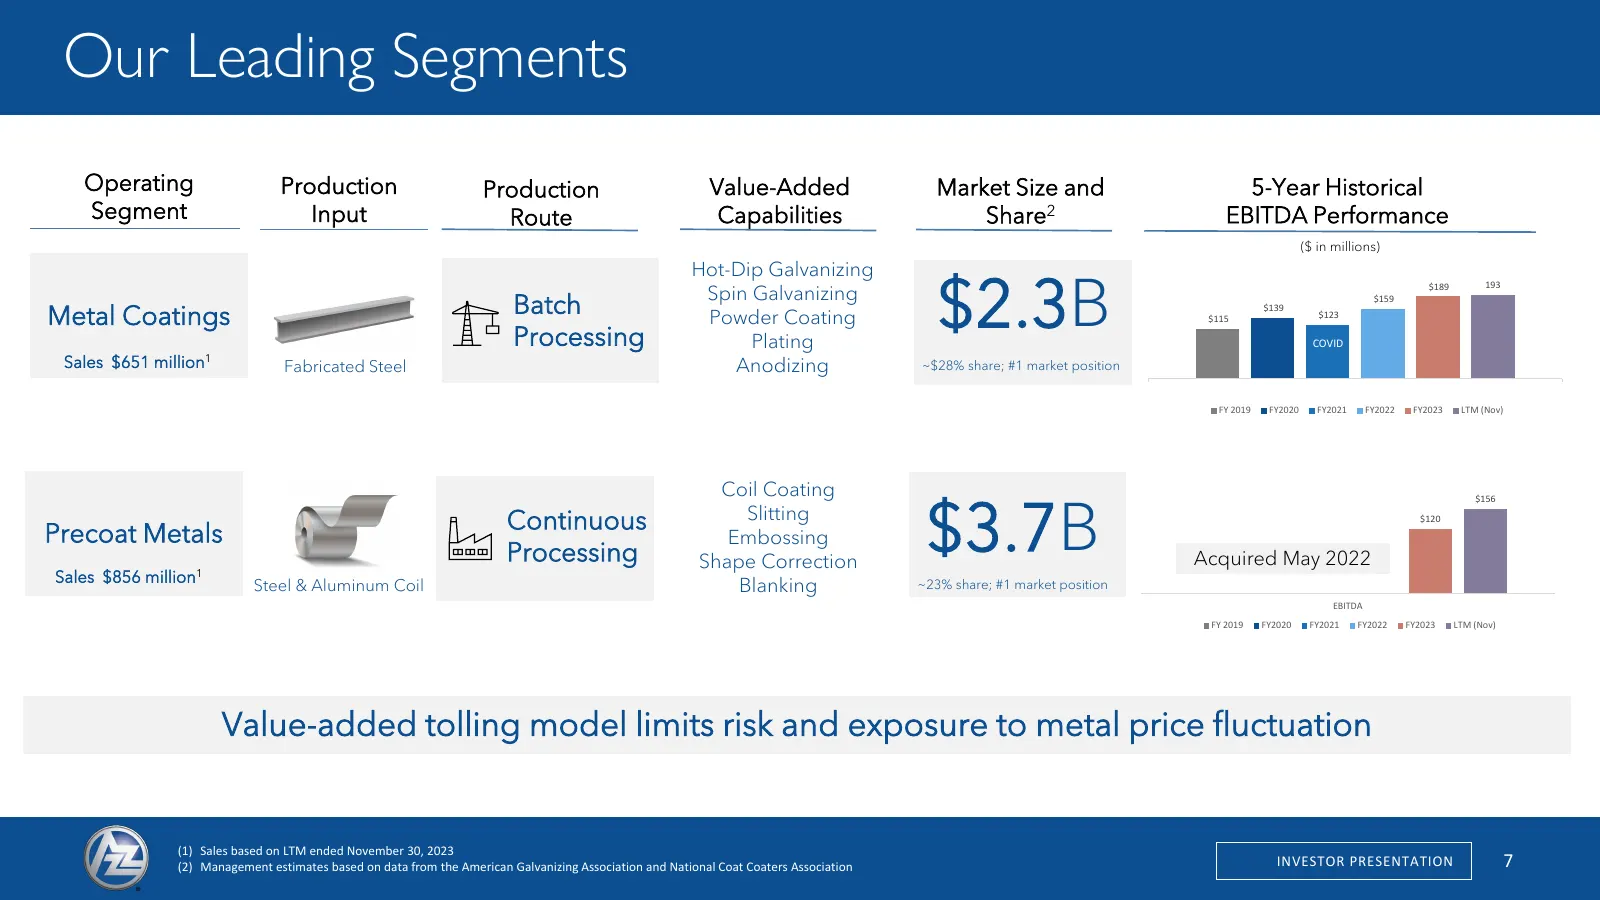
Slide 7: Our Leading Segments
Our Leading Segments Operating Production Production Value-Added Market Size and 5-Year Historical Segment Input Route Capabilities Share2 EBITDA Performance ($ in millions) Hot-Dip Galvanizing $2.3B $189 193 Spin Galvanizing Metal Coatings Batch Powder Coating $115 $139 $123 $159 Processing Plating
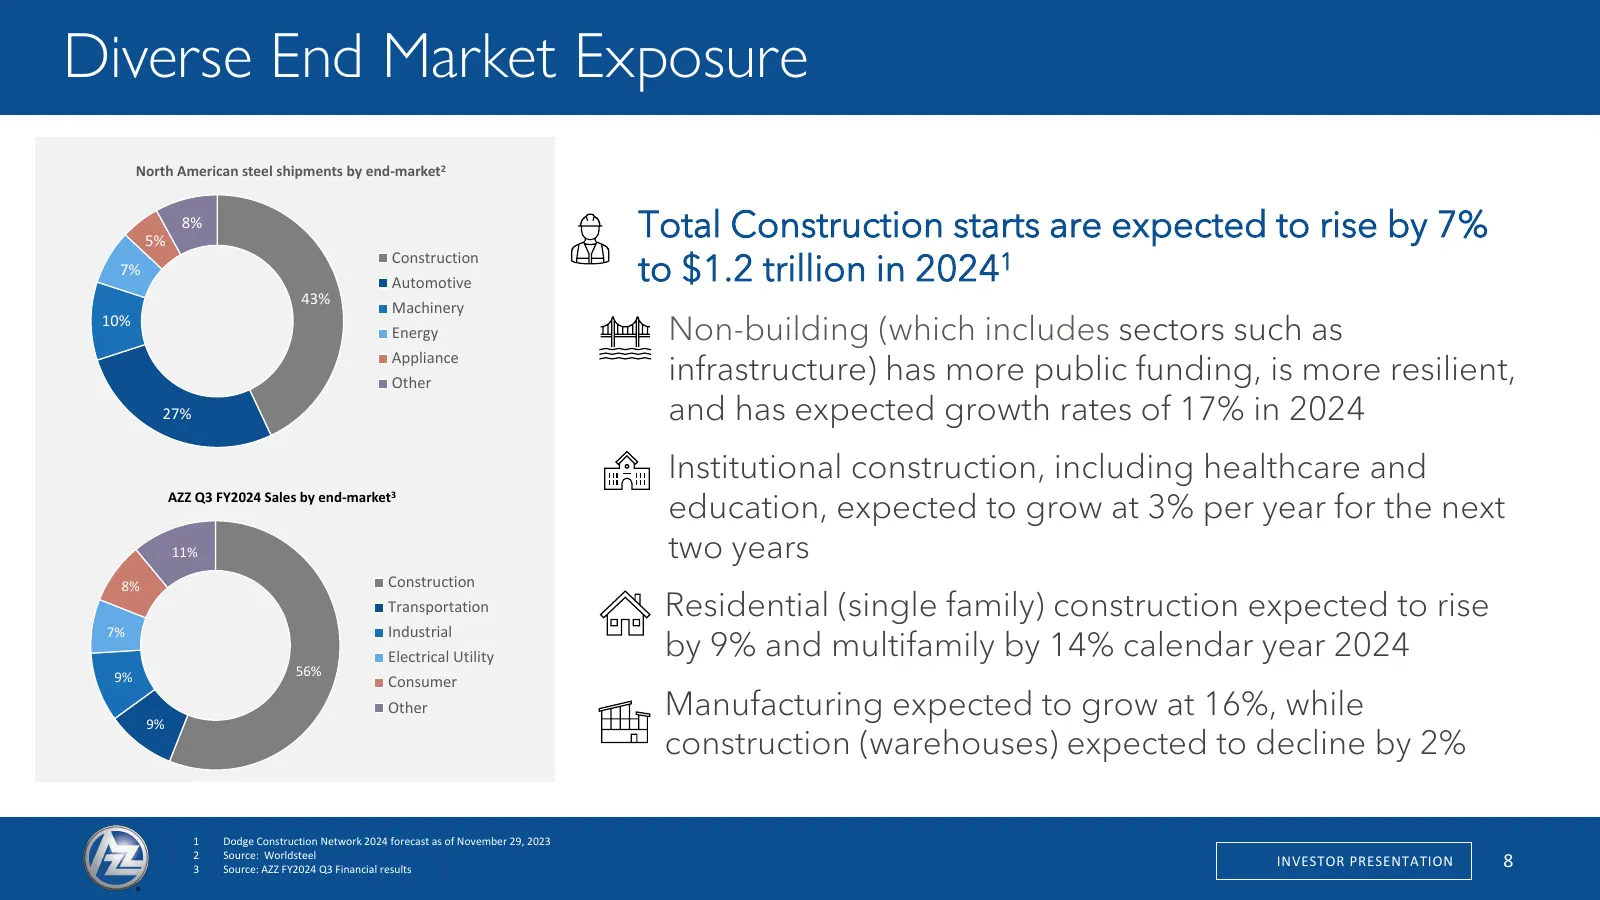
Slide 8: Diverse End Market Exposure
Diverse End Market Exposure North American steel shipments by end-market2 5% 8% Total Construction starts are expected to rise by 7% Construction 7% Automotive to $1.2 trillion in 20241 43% Machinery 10% Energy Non-building (which includes sectors such as Appliance Other infrastructure) has more pub
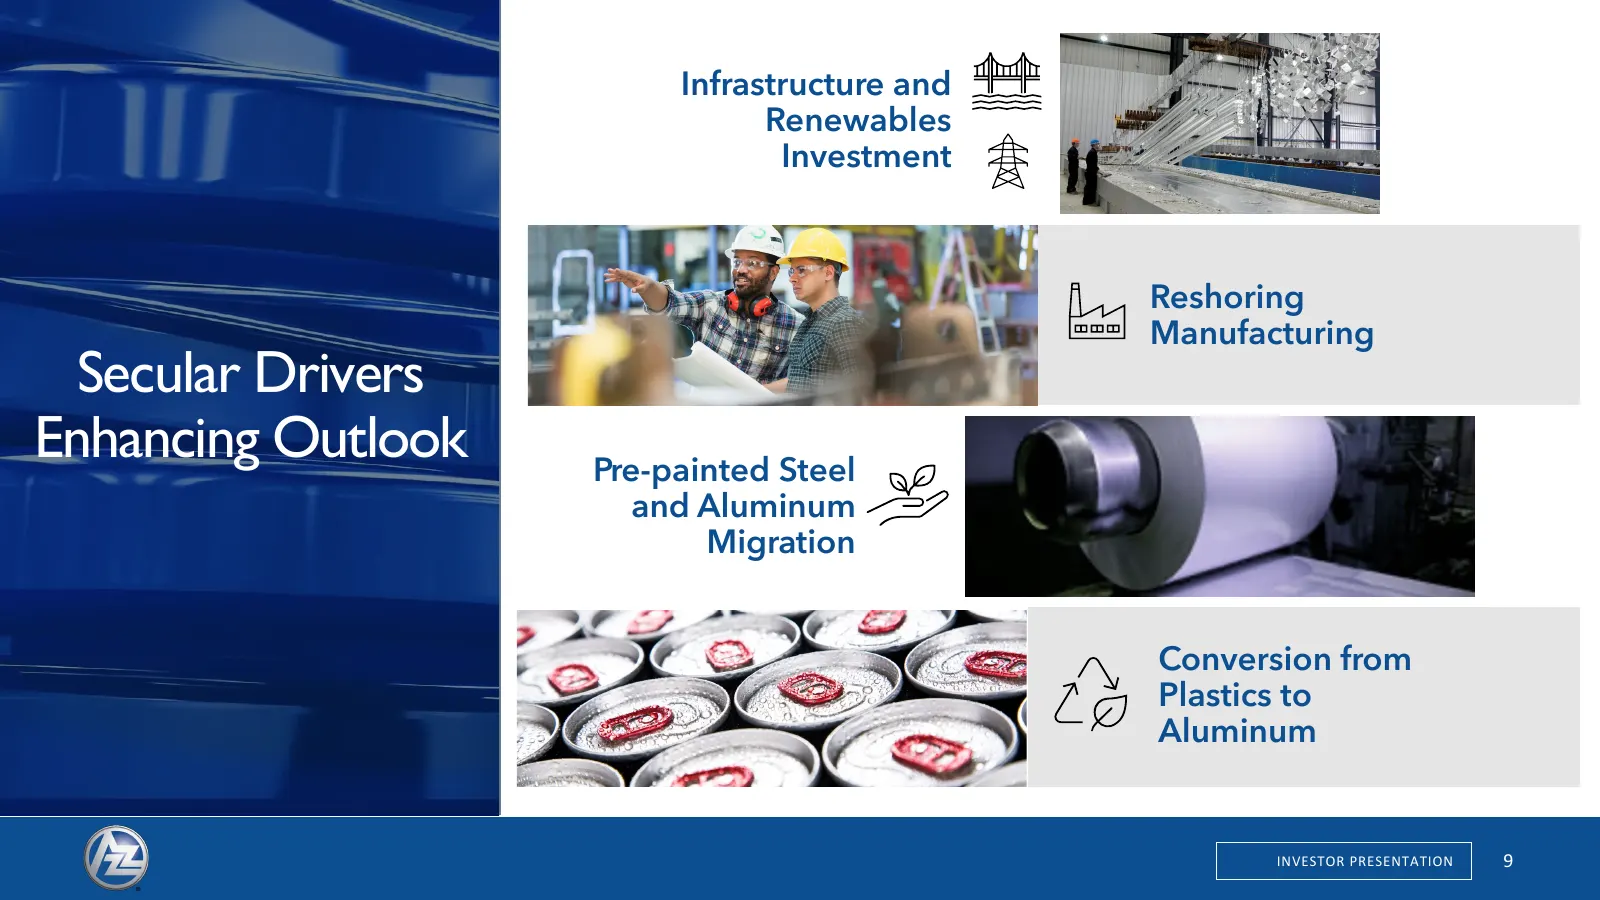
Slide 9: Secular Drivers Enhancing Outlook
Infrastructure and Renewables Investment Reshoring Manufacturing Secular Drivers Enhancing Outlook Pre-painted Steel and Aluminum Migration Conversion from Plastics to Aluminum INVESTOR PRESENTATION 9 9
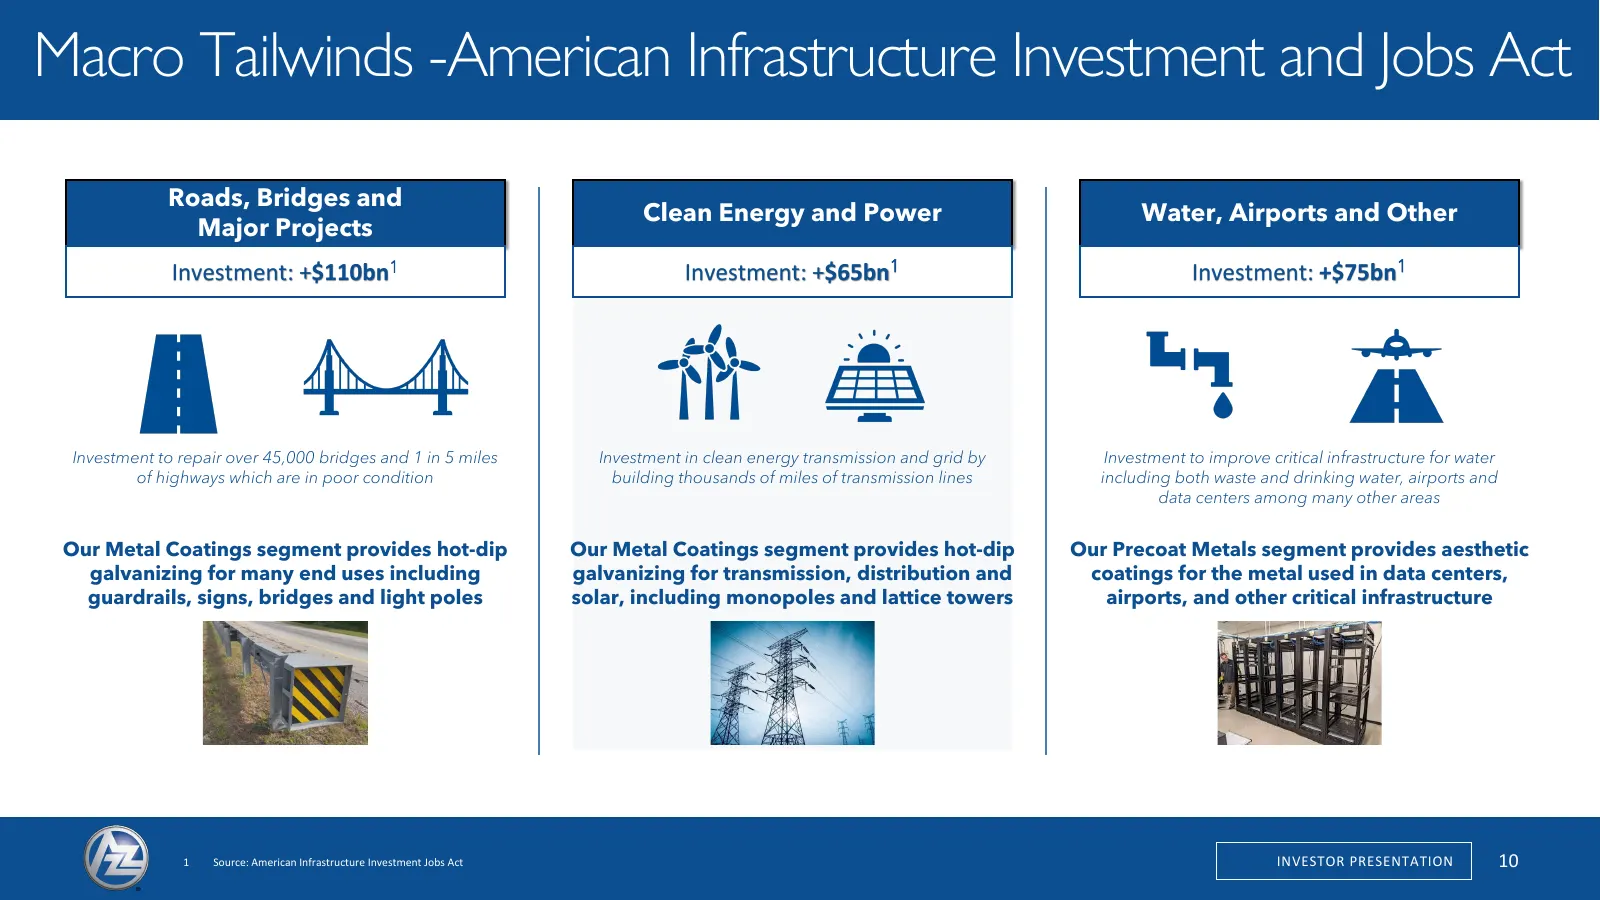
Slide 10: Macro Tailwinds - American Infrastructure Investment and Jobs Act
Macro Tailwinds -American Infrastructure Investment and Jobs Act Roads, Bridges and Clean Energy and Power Water, Airports and Other Major Projects Investment: +$110bn1 Investment: +$65bn1 Investment: +$75bn1 Investment to repair over 45,000 bridges and 1 in 5 miles Investment in clean energy transm
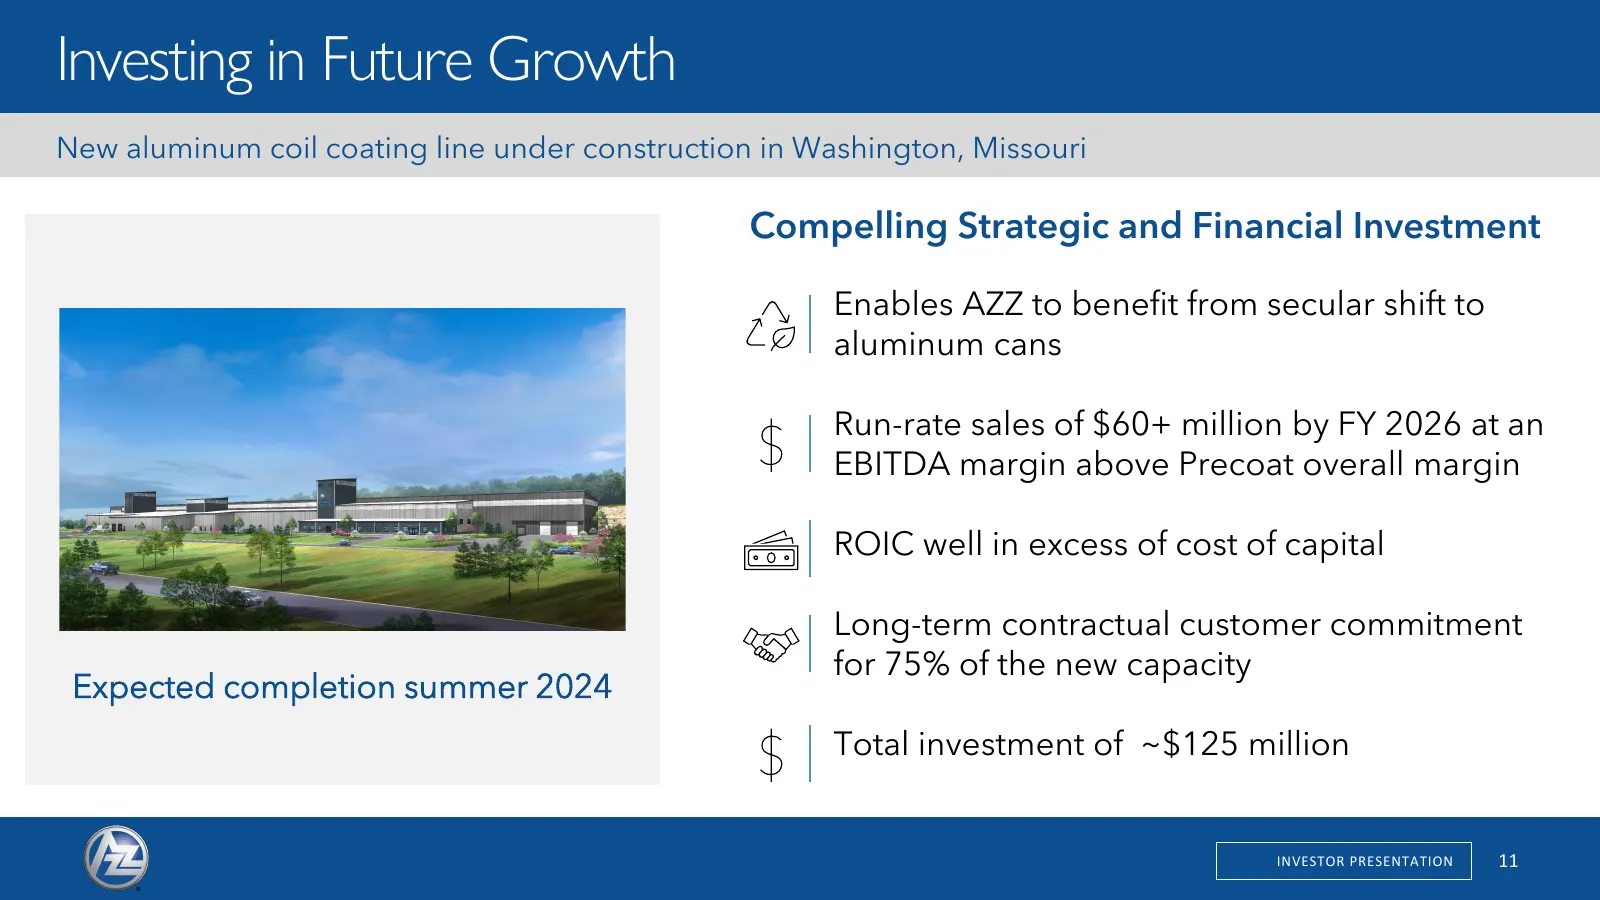
Slide 11: Investing in Future Growth
Investing in Future Growth New aluminum coil coating line under construction in Washington, Missouri Compelling Strategic and Financial Investment Enables AZZ to benefit from secular shift to aluminum cans Run-rate sales of $60+ million by FY 2026 at an EBITDA margin above Precoat overall margin ROI
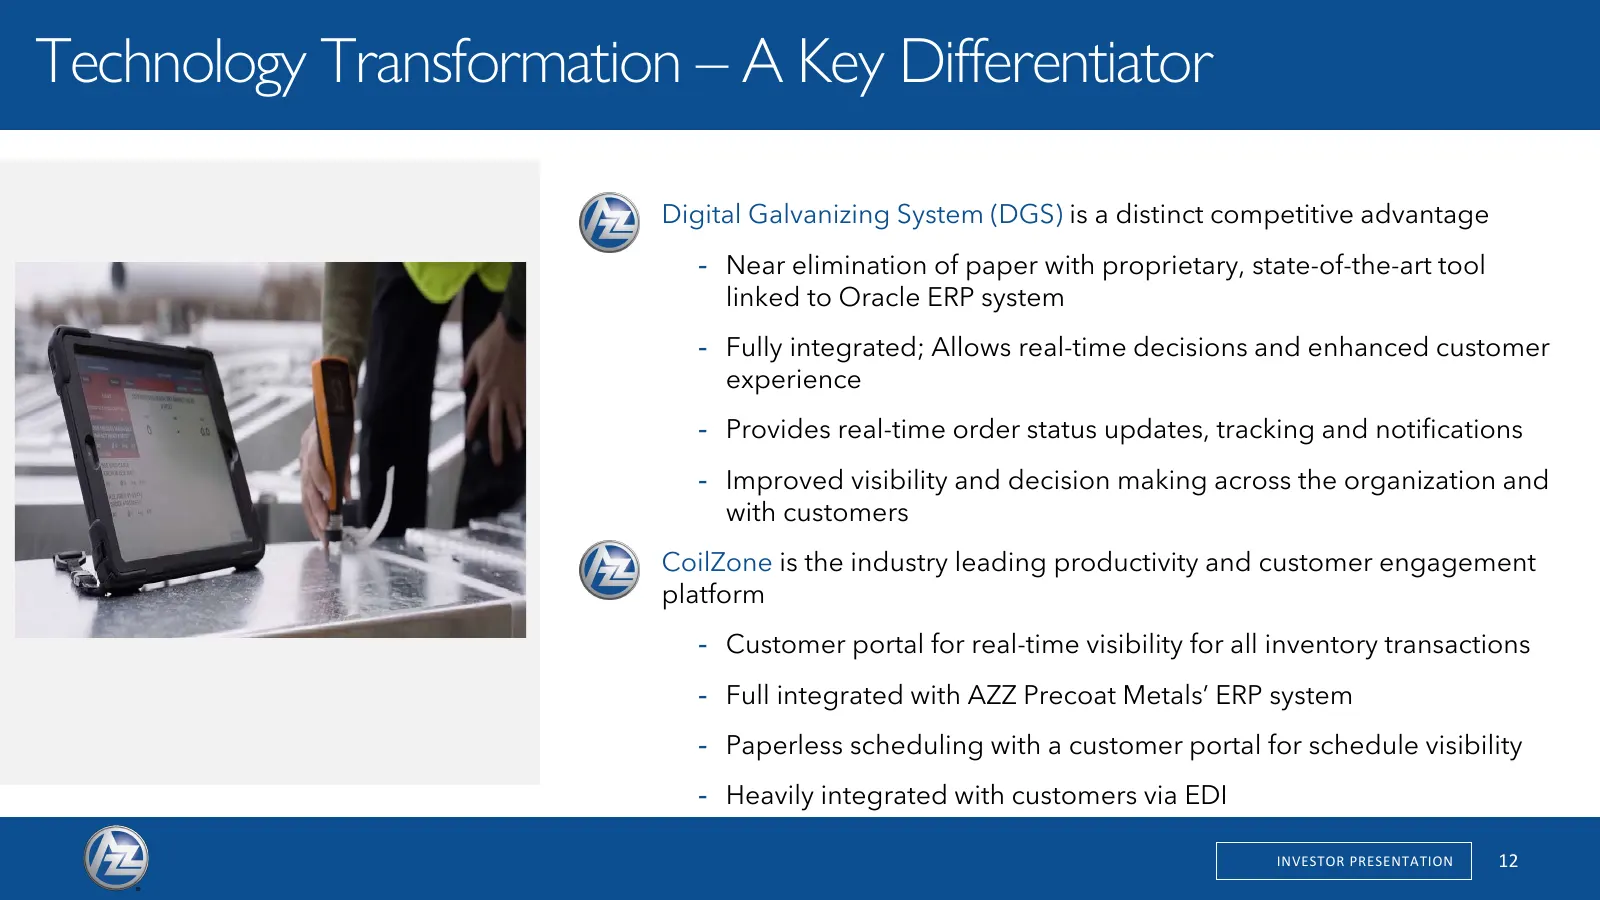
Slide 12: Technology Transformation – A Key Differentiator
Technology Transformation – A Key Differentiator Digital Galvanizing System (DGS) is a distinct competitive advantage - Near elimination of paper with proprietary, state-of-the-art tool linked to Oracle ERP system - Fully integrated; Allows real-time decisions and enhanced customer experience - Prov
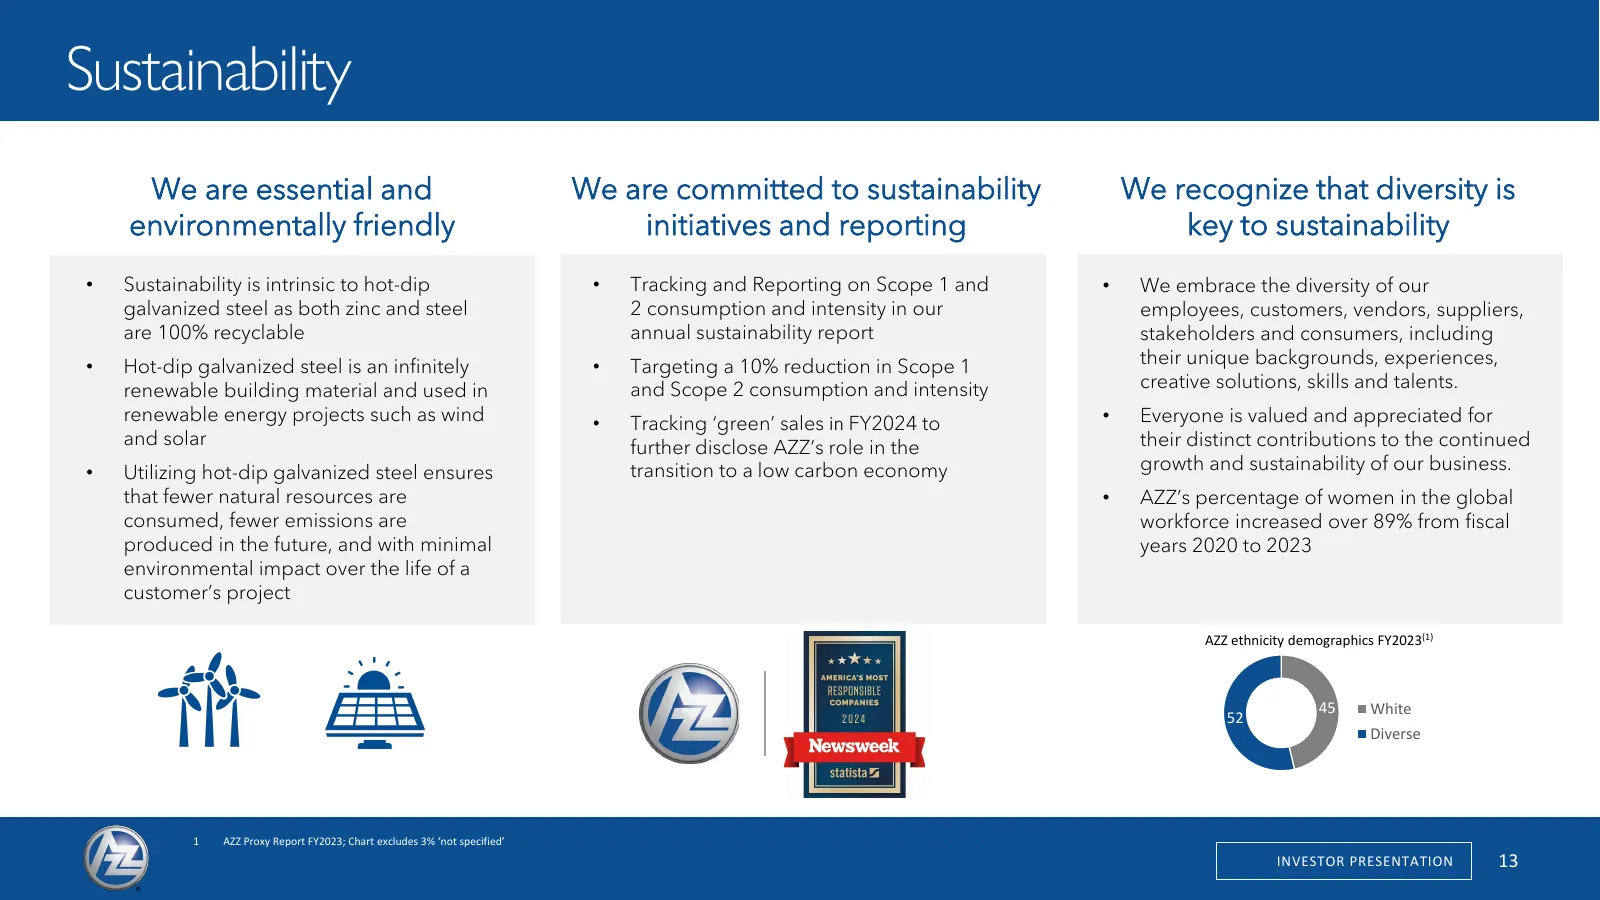
Slide 13: Investing in Future Growth: Sustainability
Investing in Future Growth Sustainability We are essential and We are committed to sustainability We recognize that diversity is environmentally friendly initiatives and reporting key to sustainability • Sustainability is intrinsic to hot-dip • Tracking and Reporting on Scope 1 and • We embrace the
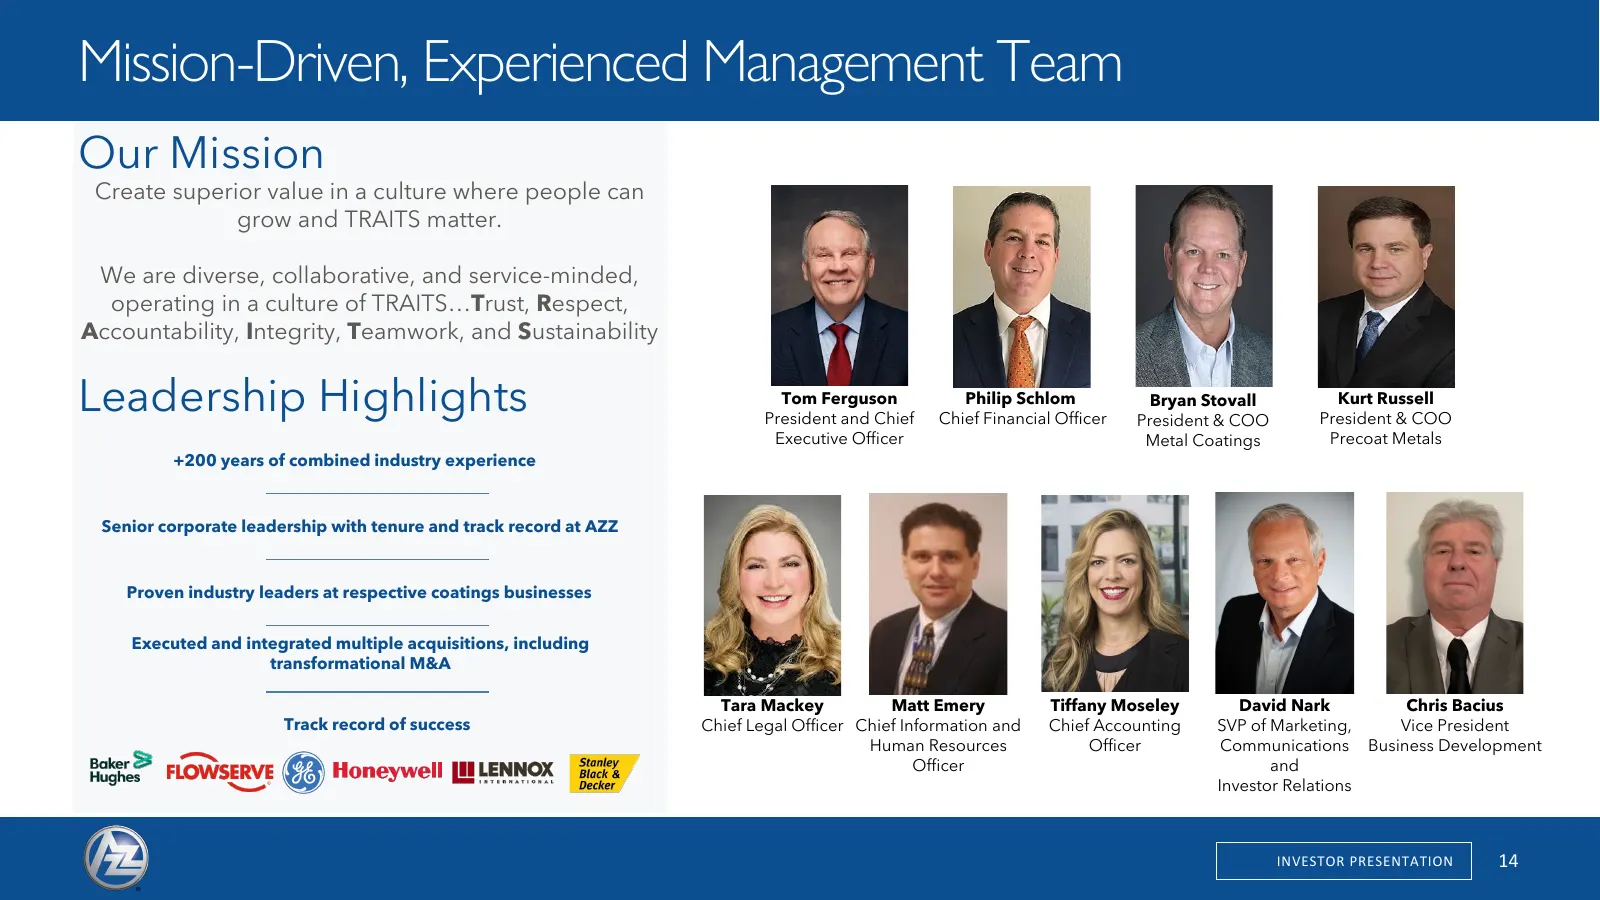
Slide 14: Mission-Driven, Experienced Management Team
Mission-Driven, Experienced Management Team Our Mission Create superior value in a culture where people can grow and TRAITS matter. We are diverse, collaborative, and service-minded, operating in a culture of TRAITS…Trust, Respect, Accountability, Integrity, Teamwork, and Sustainability Leadership H
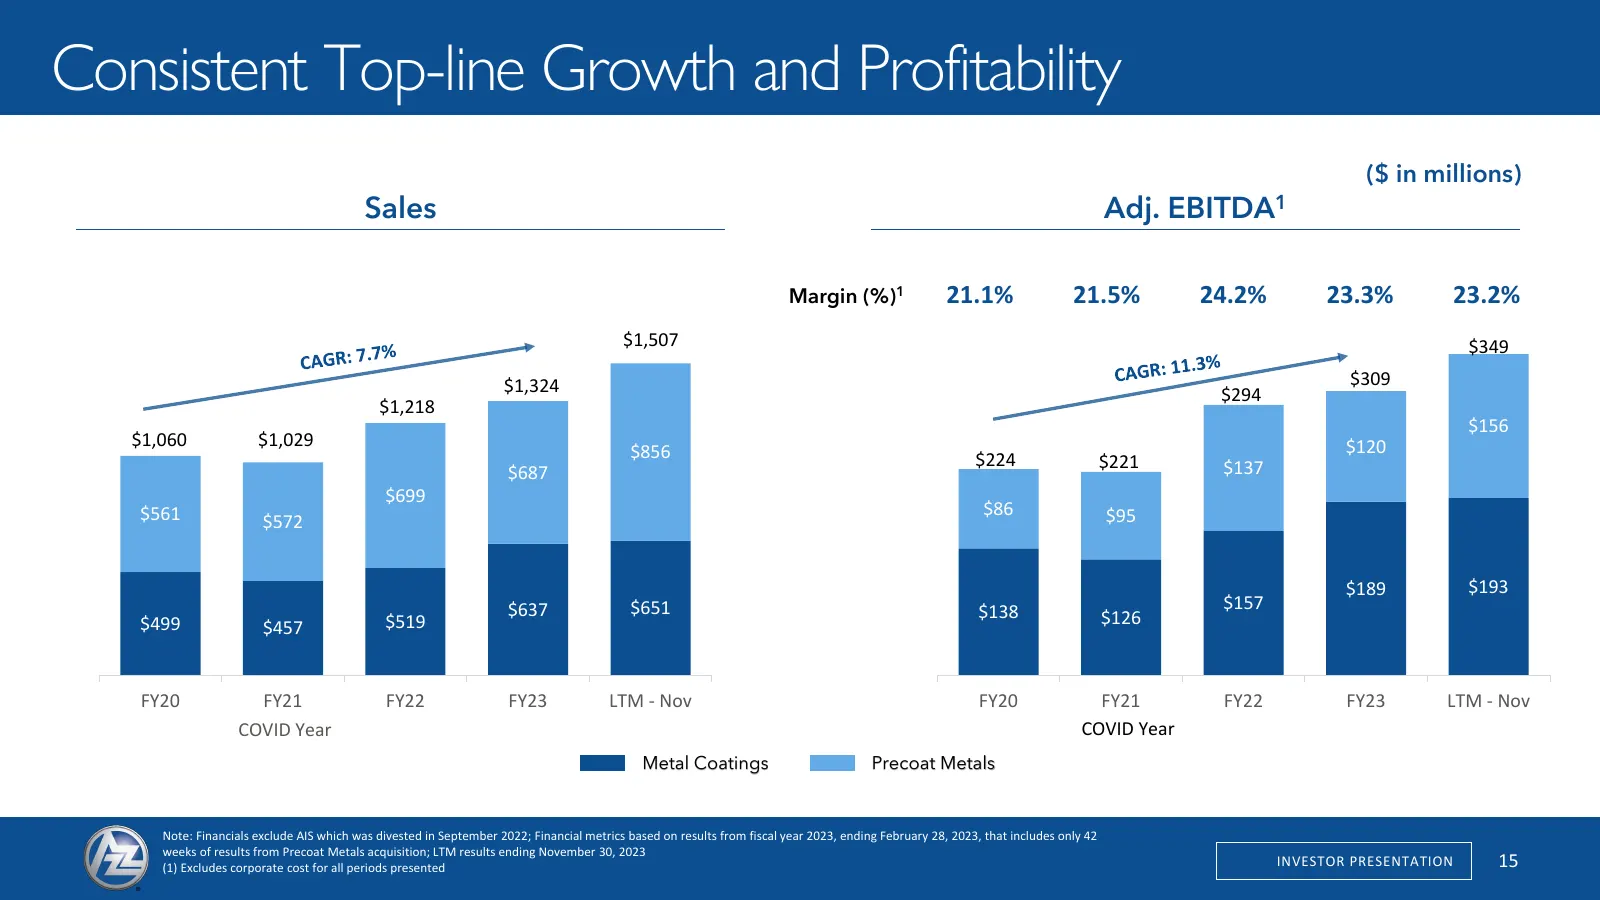
Slide 15: Consistent Top-line Growth and Profitability
Consistent Top-line Growth and Profitability ($ in millions) Sales Adj. EBITDA1 Margin (%)1 21.1% 21.5% 24.2% 23.3% 23.2% $1,507 $349 $1,324 $309 $294 $1,218 $156 $1,060 $1,029 $120 $856 $224 $221 $687 $137 $699 $561 $86 $95 $572 $189 $193 $637 $651 $138 $157 $499 $519 $126 $457 FY20 FY21 FY22 FY23
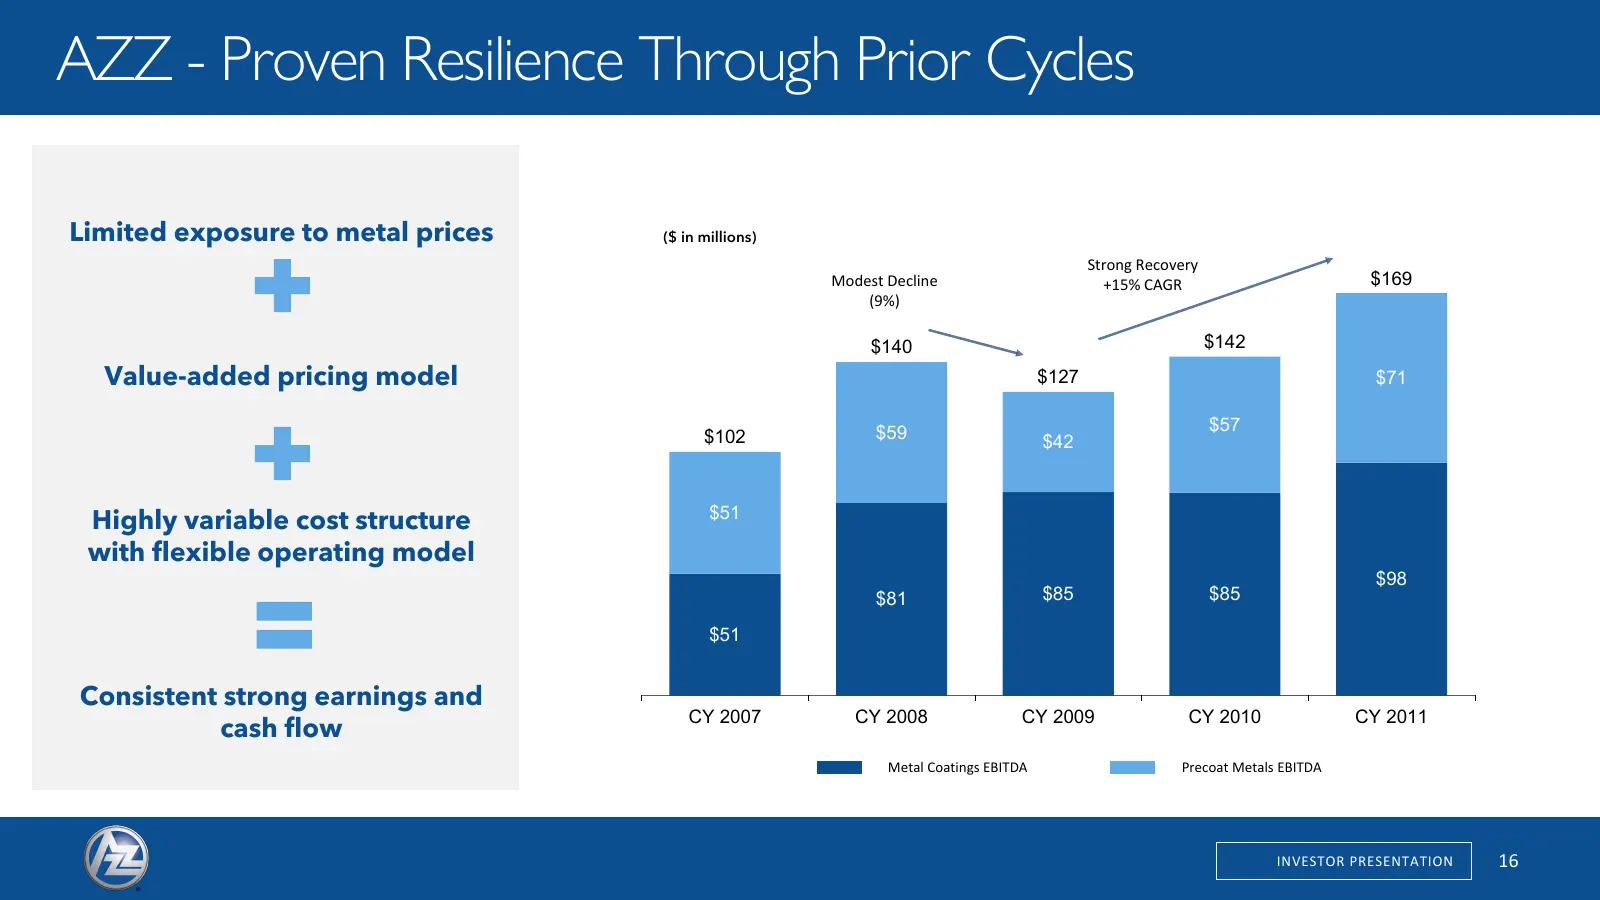
Slide 16: AZZ - Proven Resilience Through Prior Cycles
AZZ - Proven Resilience Through Prior Cycles Limited exposure to metal prices ($ in millions) Strong Recovery Modest Decline +15% CAGR $169 (9%) $140 $142 Value-added pricing model $127 $71 $59 $57 $102 $42 $51 Highly variable cost structure with flexible operating model $98 $81 $85 $85 $51 Consiste
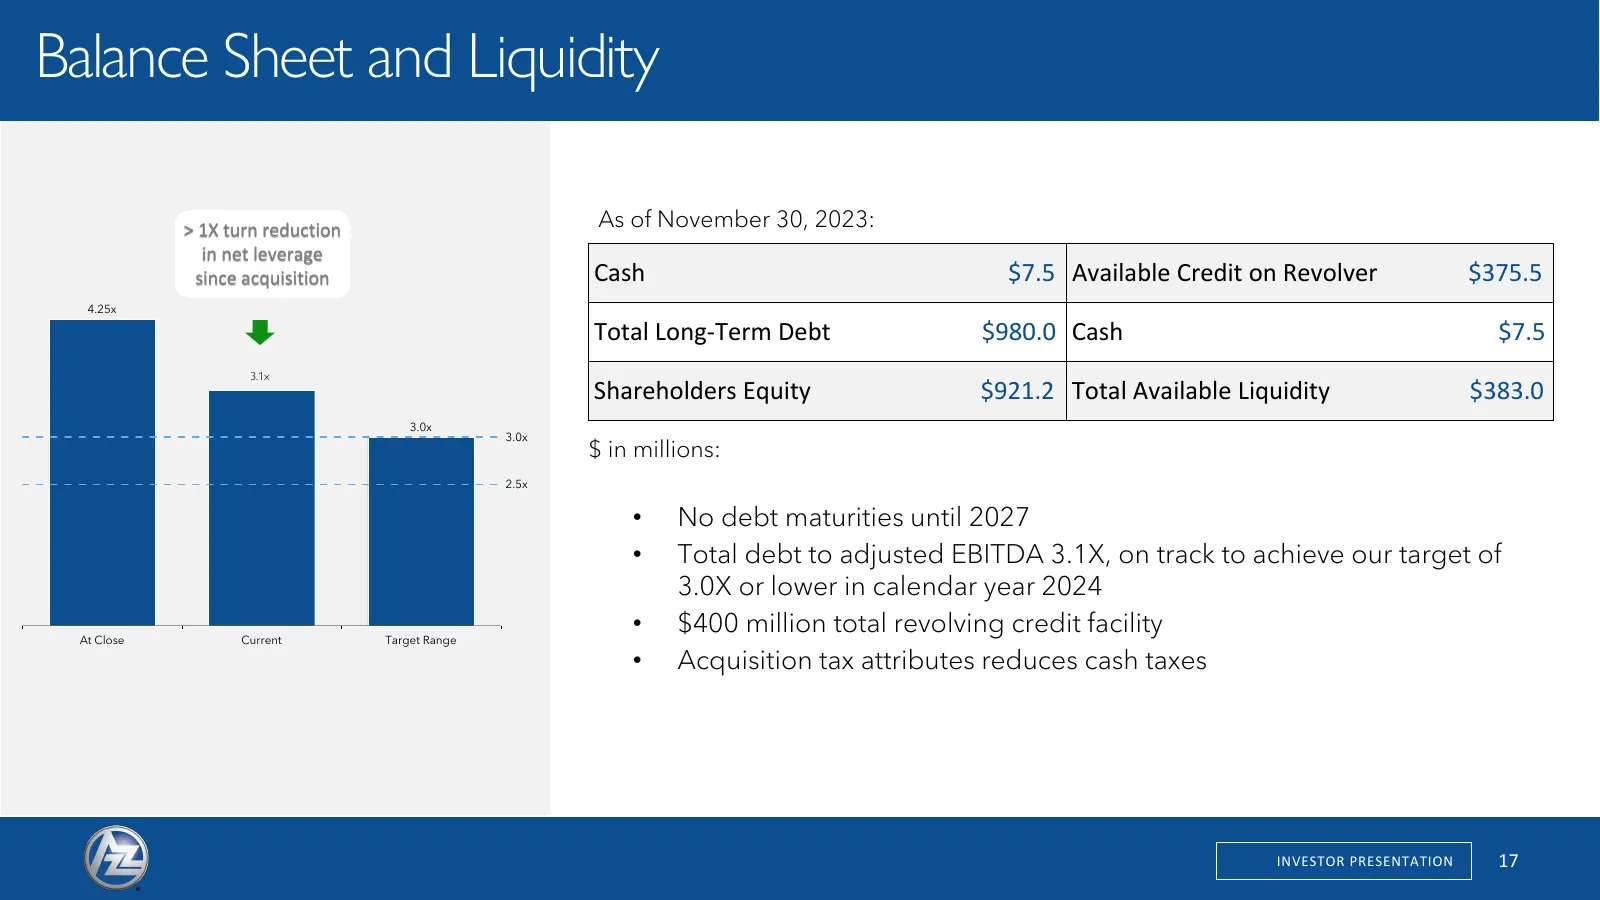
Slide 17: Balance Sheet and Liquidity
Balance Sheet and Liquidity > 1X turn reduction As of November 30, 2023: in net leverage since acquisition Cash $7.5 Available Credit on Revolver $375.5 4.25x Total Long-Term Debt $980.0 Cash $7.5 3.1x Shareholders Equity $921.2 Total Available Liquidity $383.0 3.5x 3.0x 3.0x $ in millions: 2.5x • N
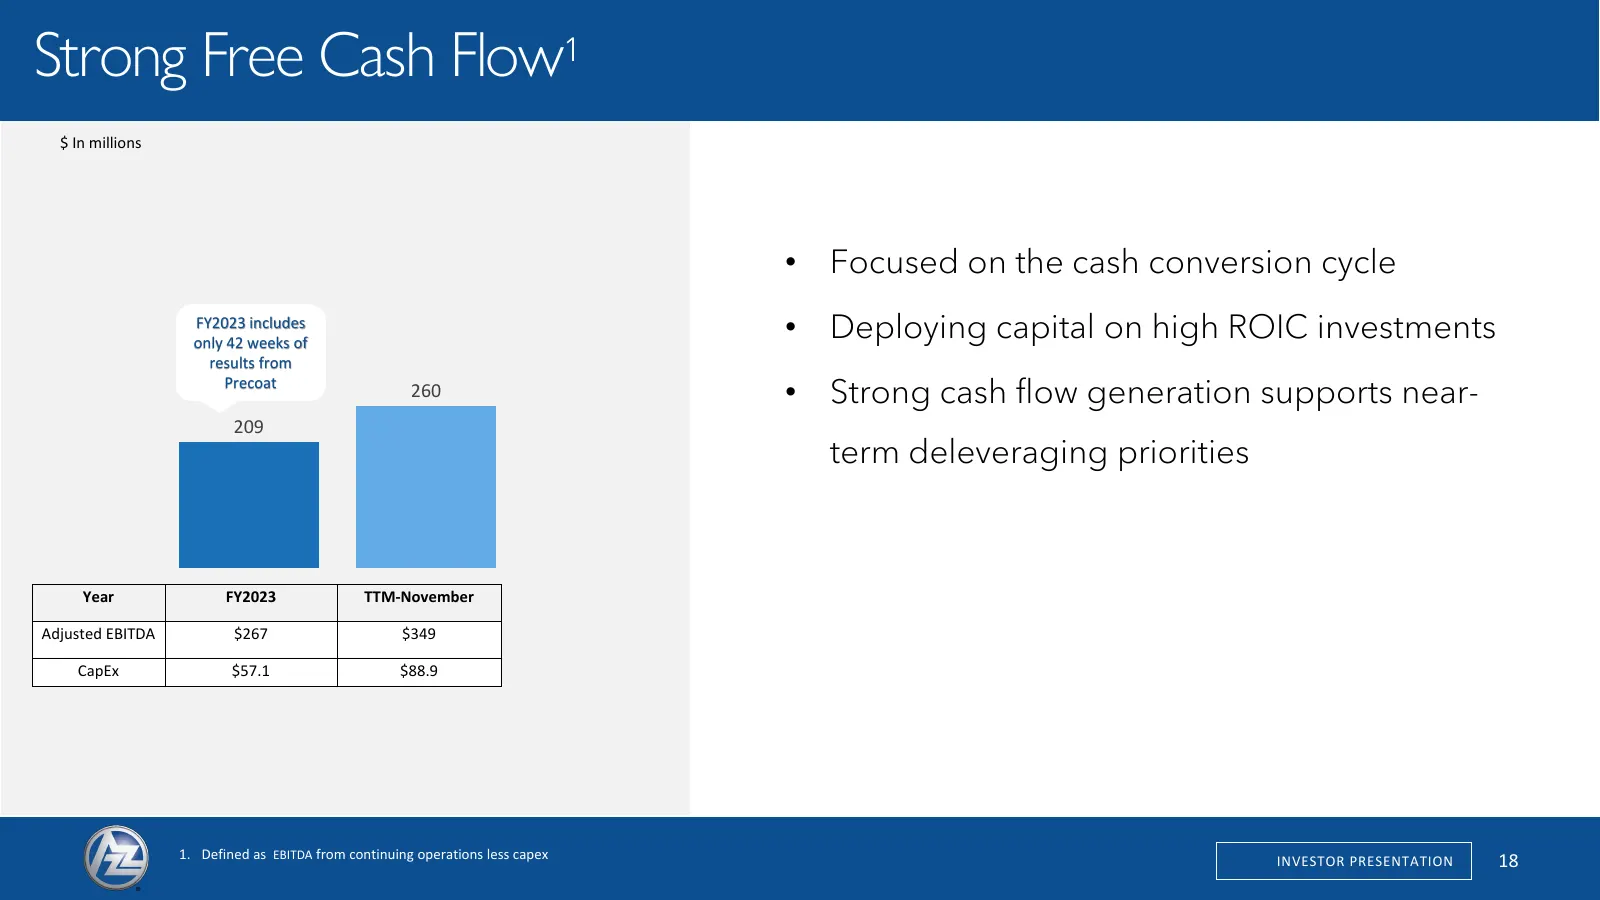
Slide 18: Strong Free Cash Flow
Strong Free Cash Flow 1 $ In millions • Focused on the cash conversion cycle FY2023 includes only 42 weeks of • Deploying capital on high ROIC investments results from Precoat 260 • Strong cash flow generation supports near- 209 term deleveraging priorities Year FY2023 TTM-November Adjusted EBITDA $
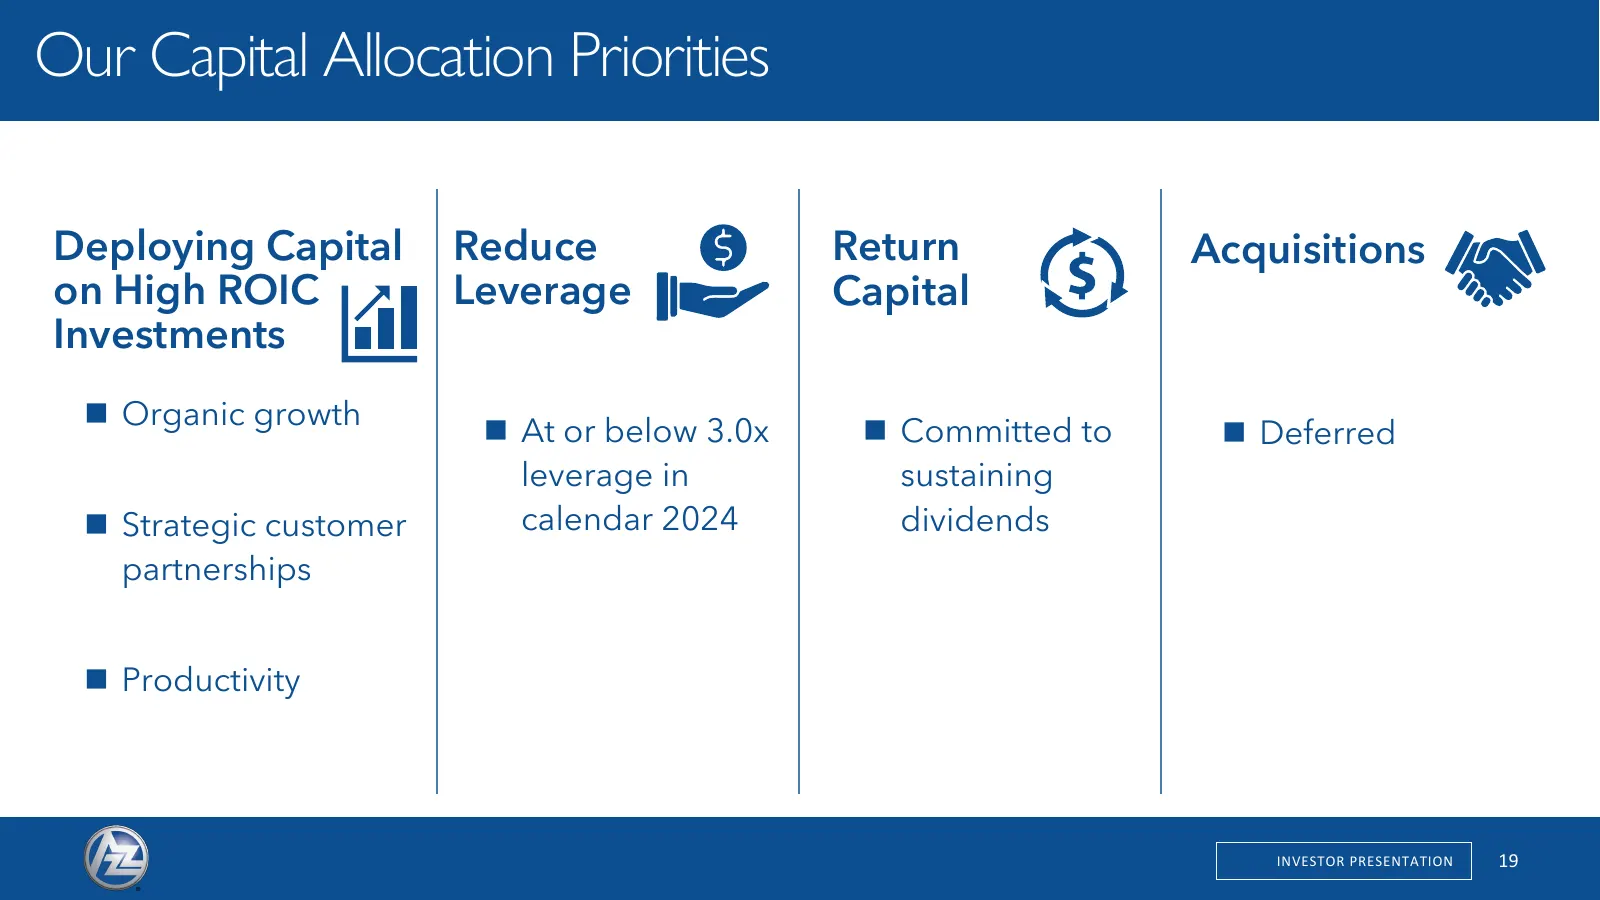
Slide 19: Our Capital Allocation Priorities
Our Capital Allocation Priorities Deploying Capital Reduce Return Acquisitions on High ROIC Leverage Capital Investments Organic growth At or below 3.0x Committed to Deferred leverage in sustaining Strategic customer calendar 2024 dividends partnerships Productivity INVESTOR PRESENTATION
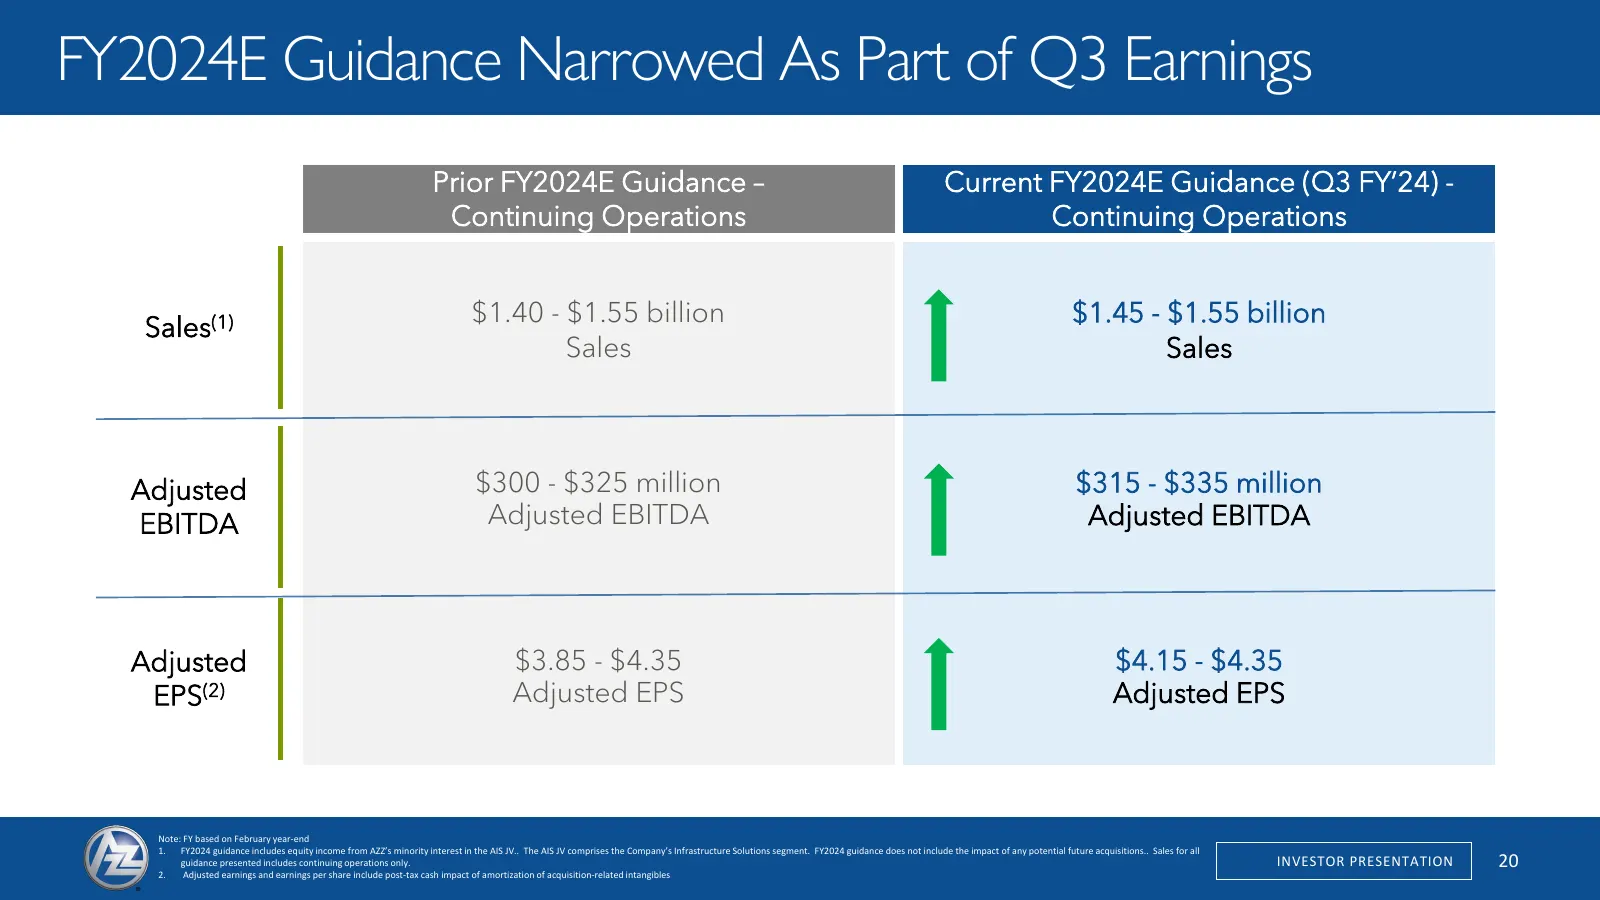
Slide 20: FY2024E Guidance Narrowed As Part of Q3 Earnings
FY2024E Guidance Narrowed As Part of Q3 Earnings Prior FY2024E Guidance – Current FY2024E Guidance (Q3 FY’24) - Continuing Operations Continuing Operations $1.40 - $1.55 billion $1.45 - $1.55 billion Sales(1) Sales Sales Adjusted $300 - $325 million $315 - $335 million EBITDA Adjusted EBITDA Adjuste
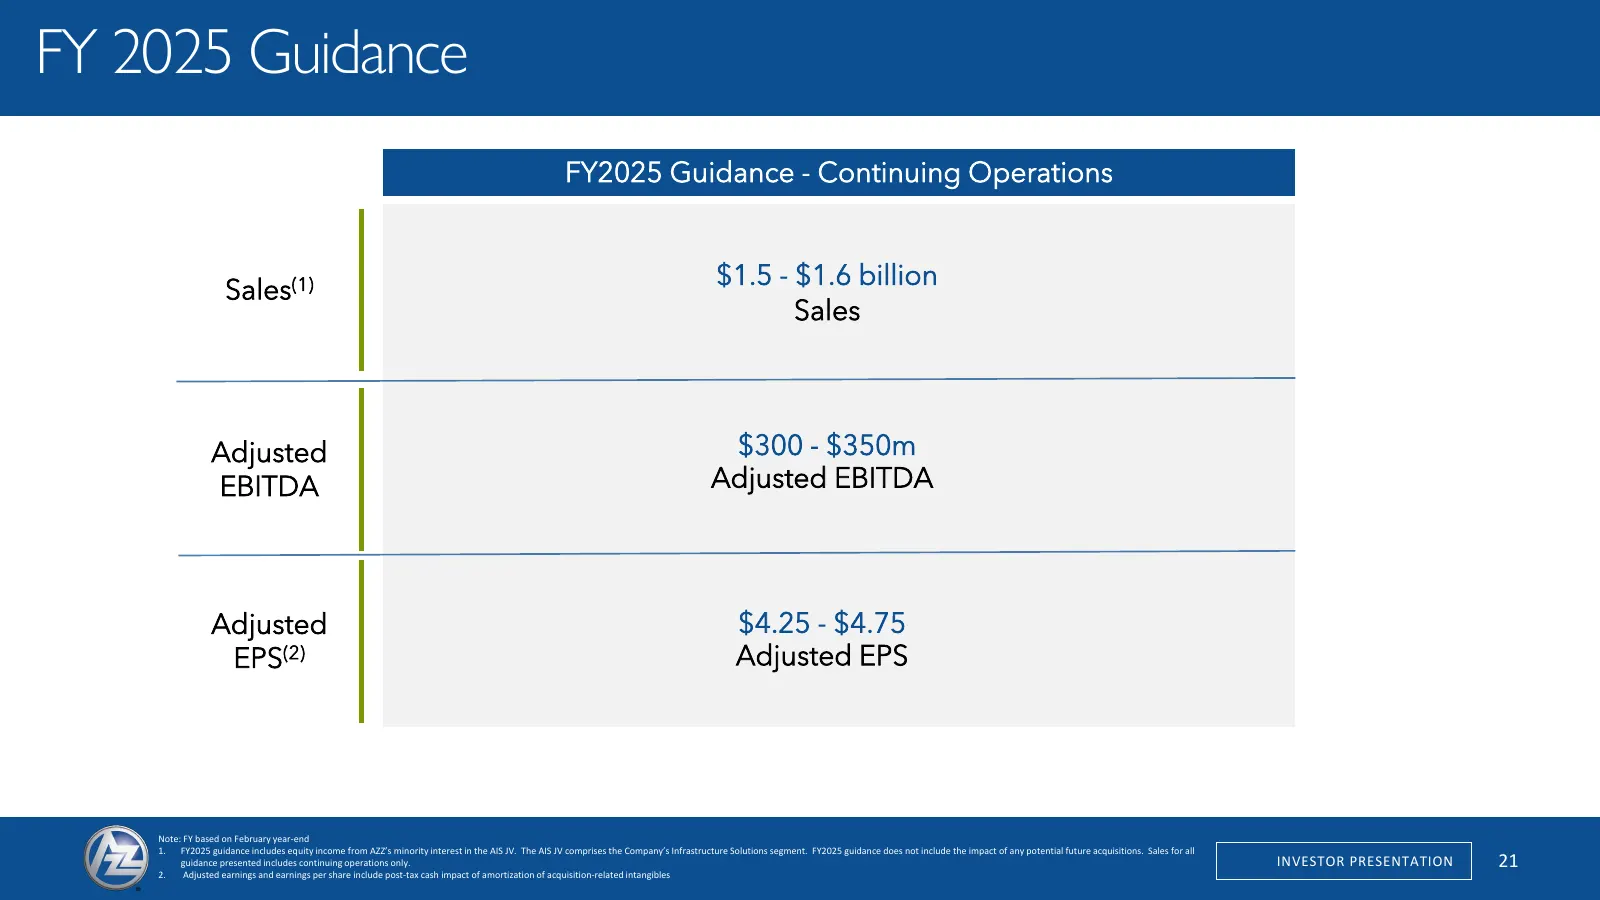
Slide 21: FY 2025 Guidance
FY 2025 Guidance FY2025 Guidance - Continuing Operations $1.5 - $1.6 billion Sales(1) Sales Adjusted $300 - $350m EBITDA Adjusted EBITDA Adjusted $4.25 - $4.75 EPS(2) Adjusted EPS Note: FY based on February year-end 1. FY2025 guidance includes equity income from AZZ’s minority interest in the AIS JV
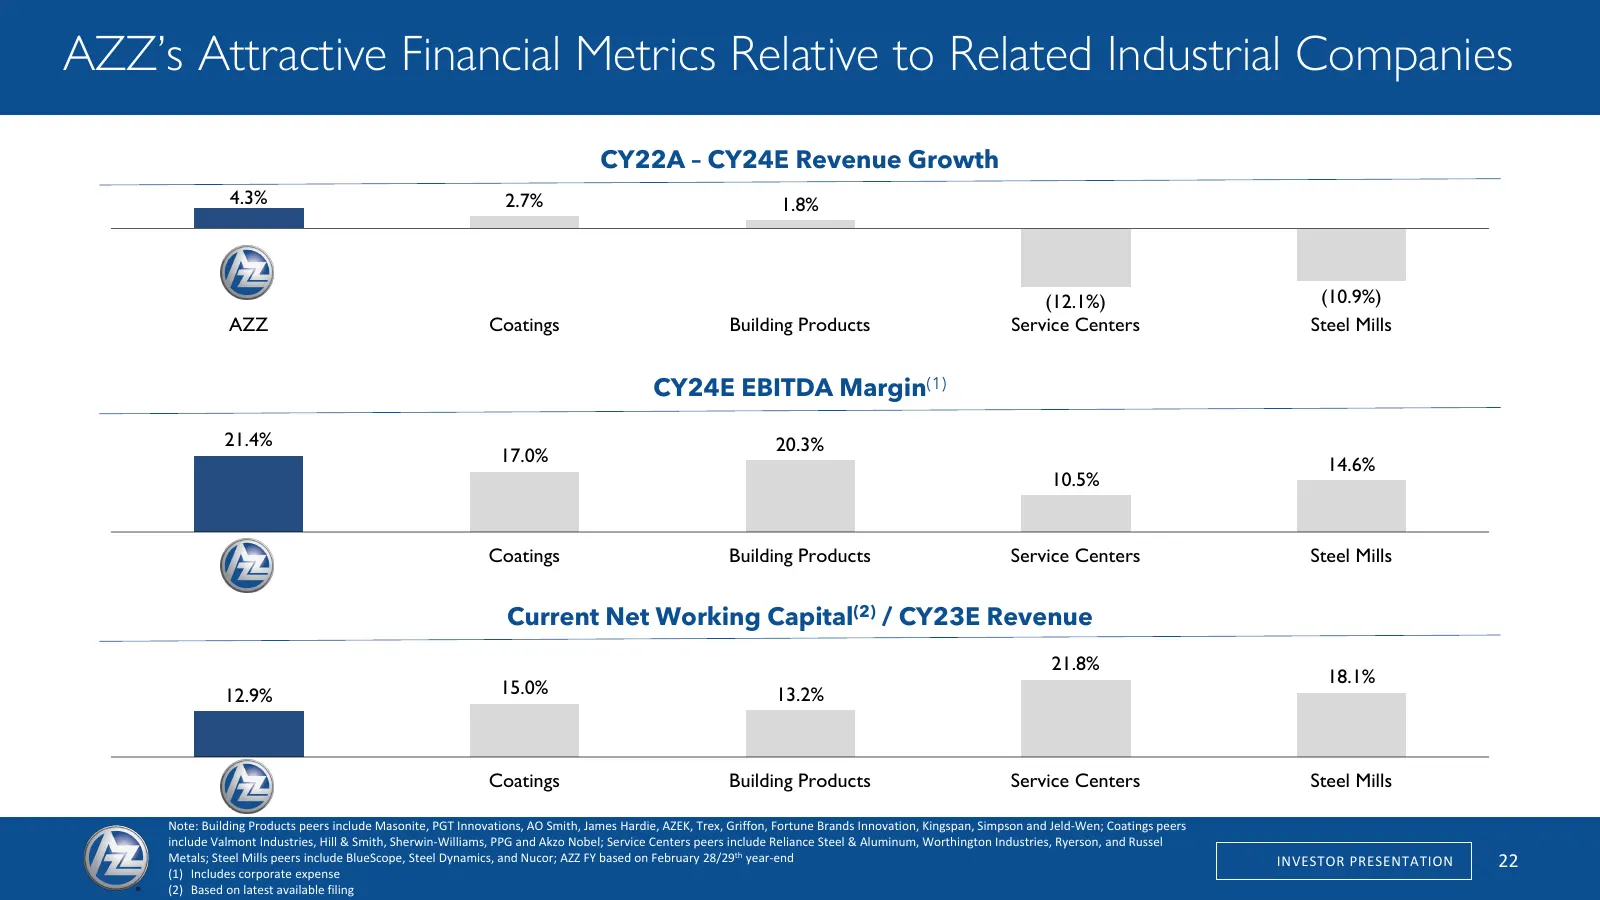
Slide 22: AZZ's Attractive Financial Metrics Relative to Related Industrial Companies
AZZ’s Attractive Financial Metrics Relative to Related Industrial Companies CY22A – CY24E Revenue Growth 4.3% 2.7% 1.8% (12.1%) (10.9%) AZZ Coatings Building Products Service Centers Steel Mills CY24E EBITDA Margin(1) 21.4% 20.3% 17.0% 14.6% 10.5% AZZ Coatings Building Products Service Centers Steel
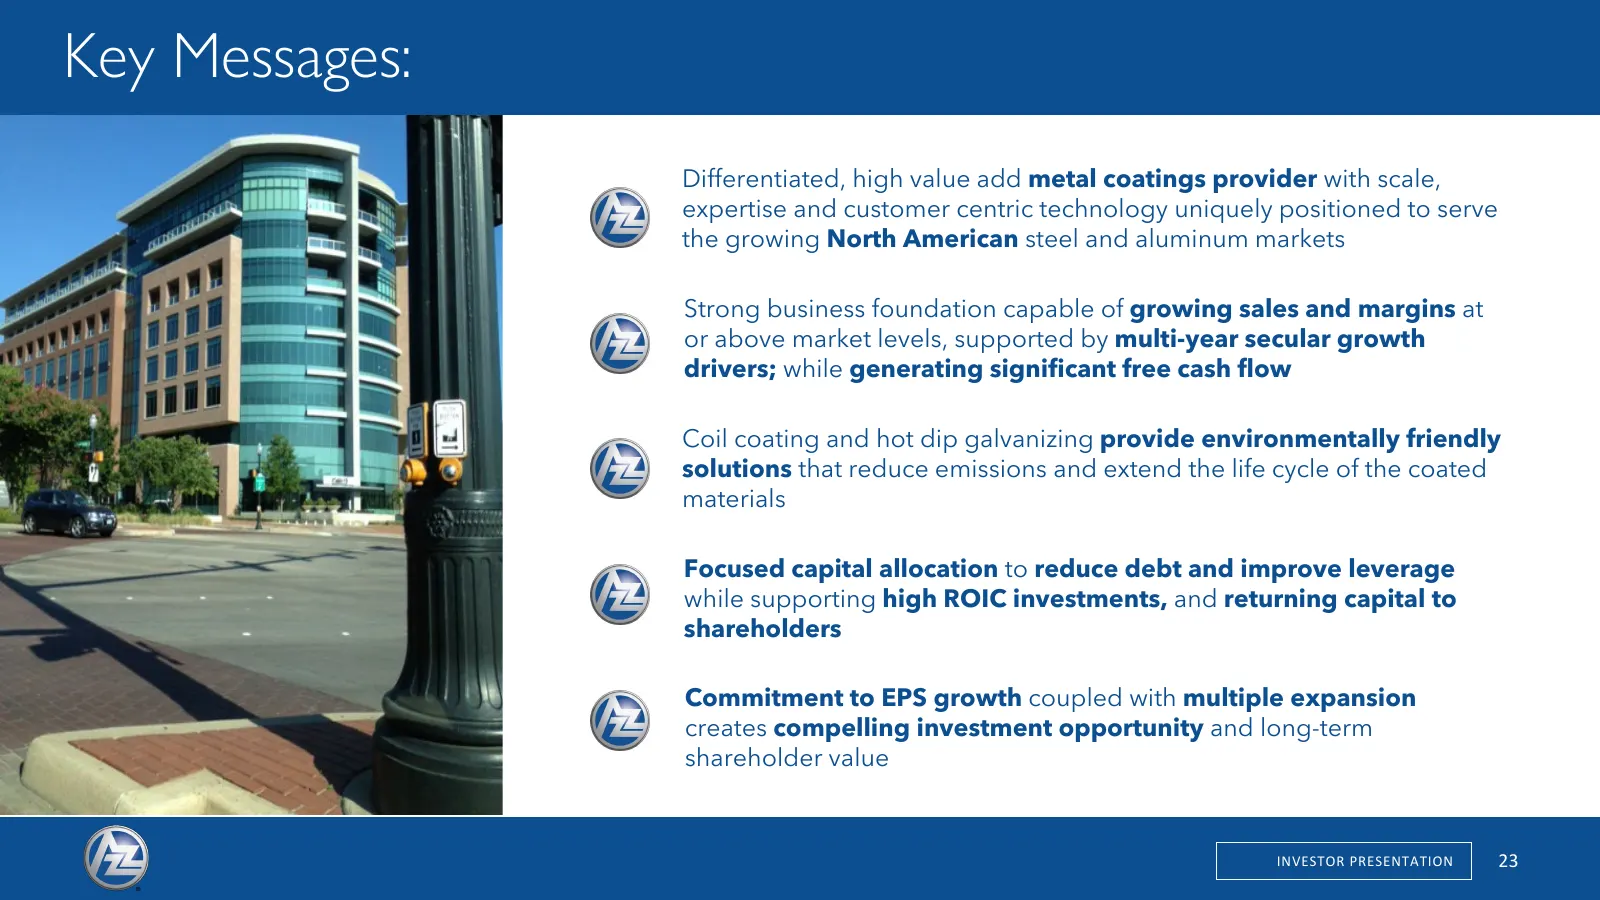
Slide 23: Key Messages
Key Messages: Differentiated, high value add metal coatings provider with scale, expertise and customer centric technology uniquely positioned to serve the growing North American steel and aluminum markets Strong business foundation capable of growing sales and margins at or above market levels, sup
Slide 24: Appendix
INVESTOR PRESENTATION Appendix 23
Slide 25: Reg “G” Tables
Reg “G” Tables 25
Slide 26: Non-GAAP Disclosure of Continuing Operations Adjusted EBITDA
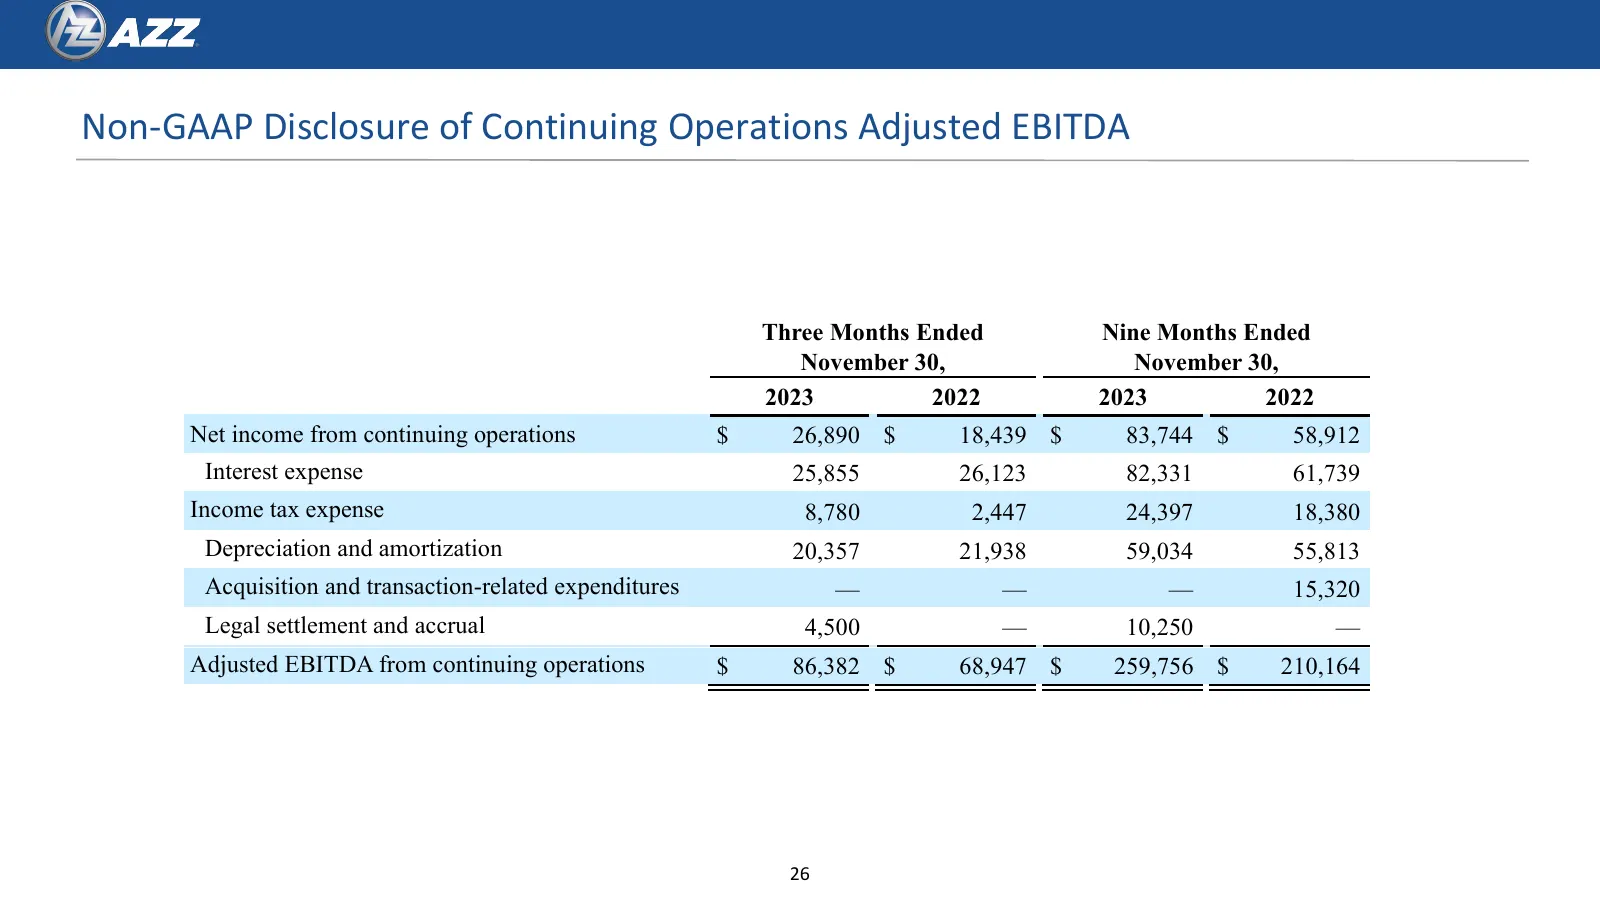
Non-GAAP Disclosure of Continuing Operations Adjusted EBITDA Three Months Ended Nine Months Ended November 30, November 30, 2023 2022 2023 2022 Net income from continuing operations $ 26,890 $ 18,439 $ 83,744 $ 58,912 Interest expense 25,855 26,123 82,331 61,739 Income tax expense 8,780 2,447 24,397
Slide 27: Continuing Operations Non-GAAP Disclosure
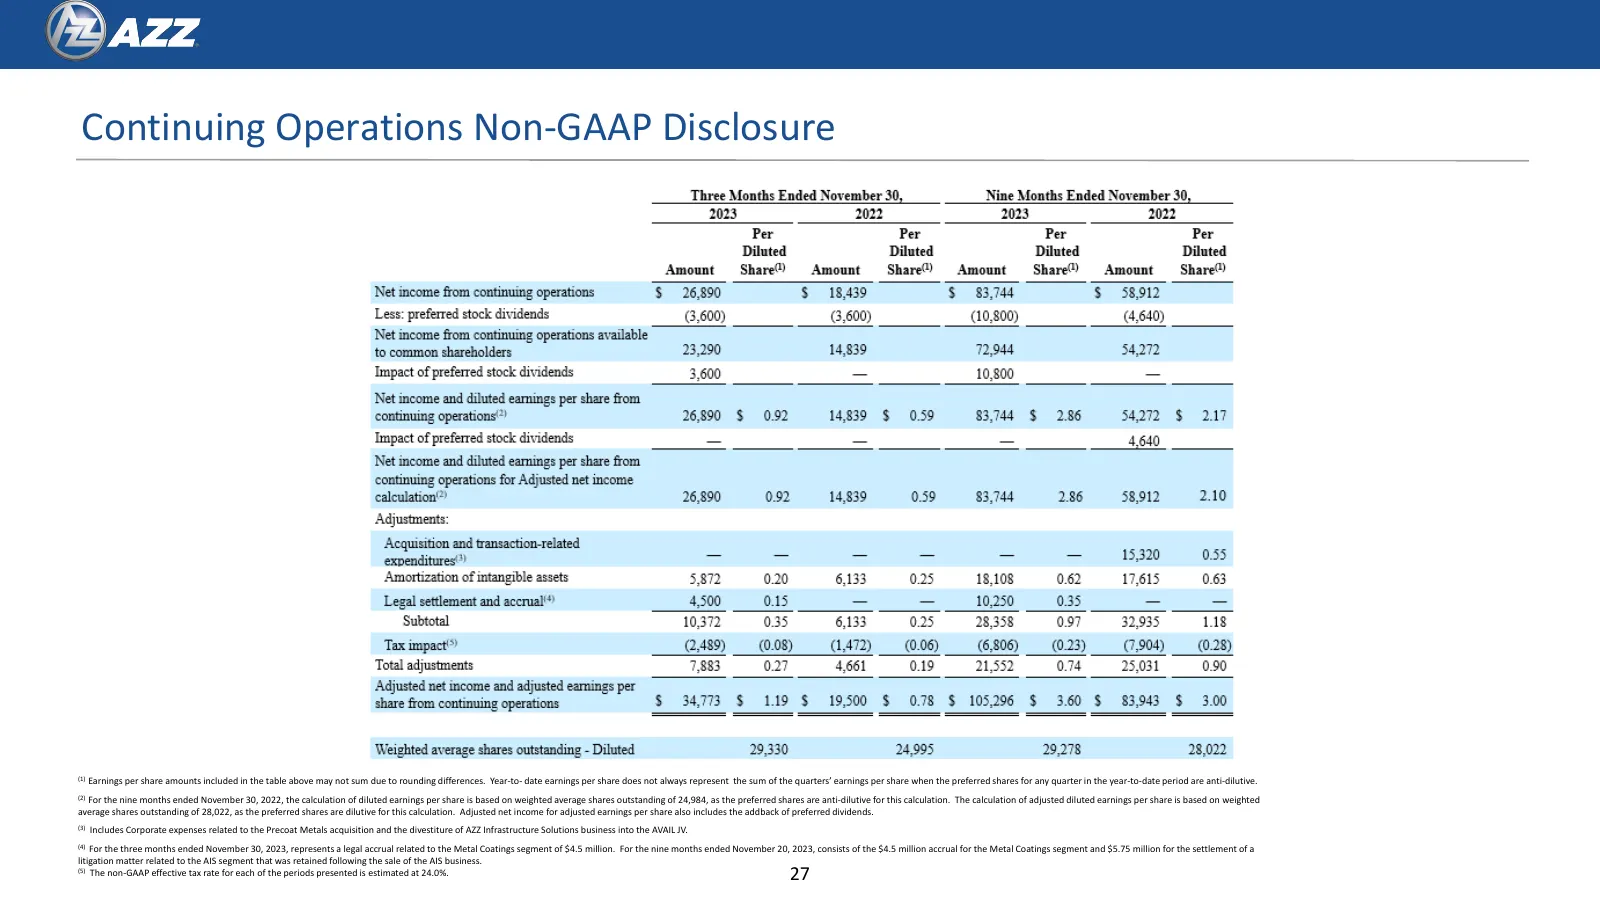
Continuing Operations Non-GAAP Disclosure (1) Earnings per share amounts included in the table above may not sum due to rounding differences. Year-to- date earnings per share does not always represent the sum of the quarters’ earnings per share when the preferred shares for any quarter in the year-t
Slide 28: Non-GAAP Segment Disclosure from Continuing Operations (Metal Coatings and Precoat Metals)
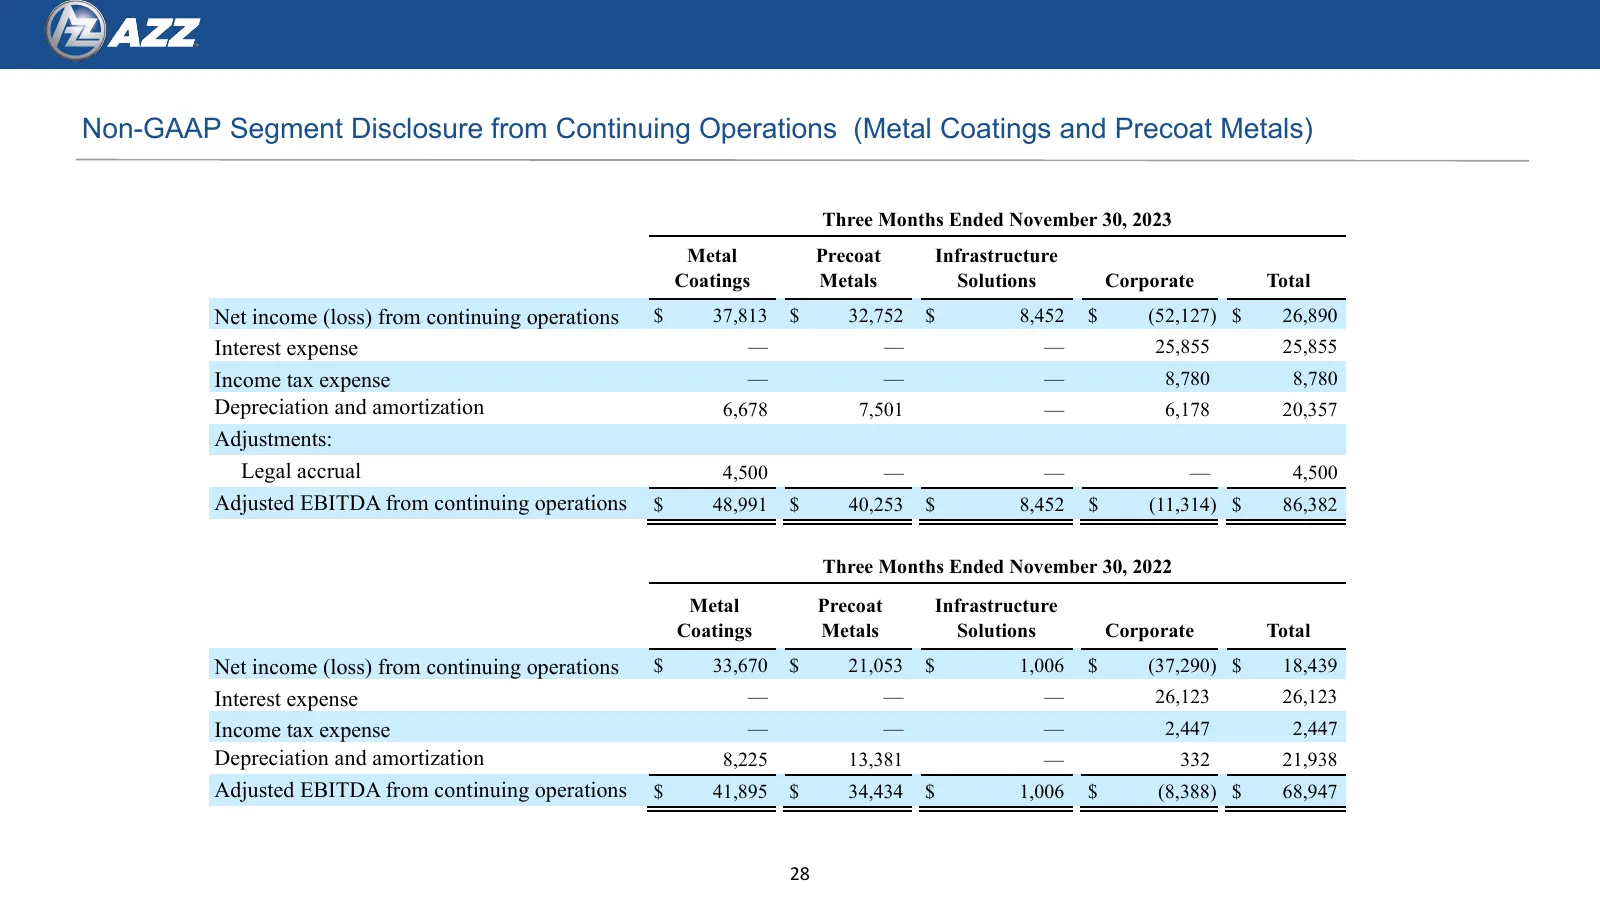
Non-GAAP Segment Disclosure from Continuing Operations (Metal Coatings and Precoat Metals) Three Months Ended November 30, 2023 Metal Precoat Infrastructure Coatings Metals Solutions Corporate Total Net income (loss) from continuing operations $ 37,813 $ 32,752 $ 8,452 $ (52,127) $ 26,890 Interest e
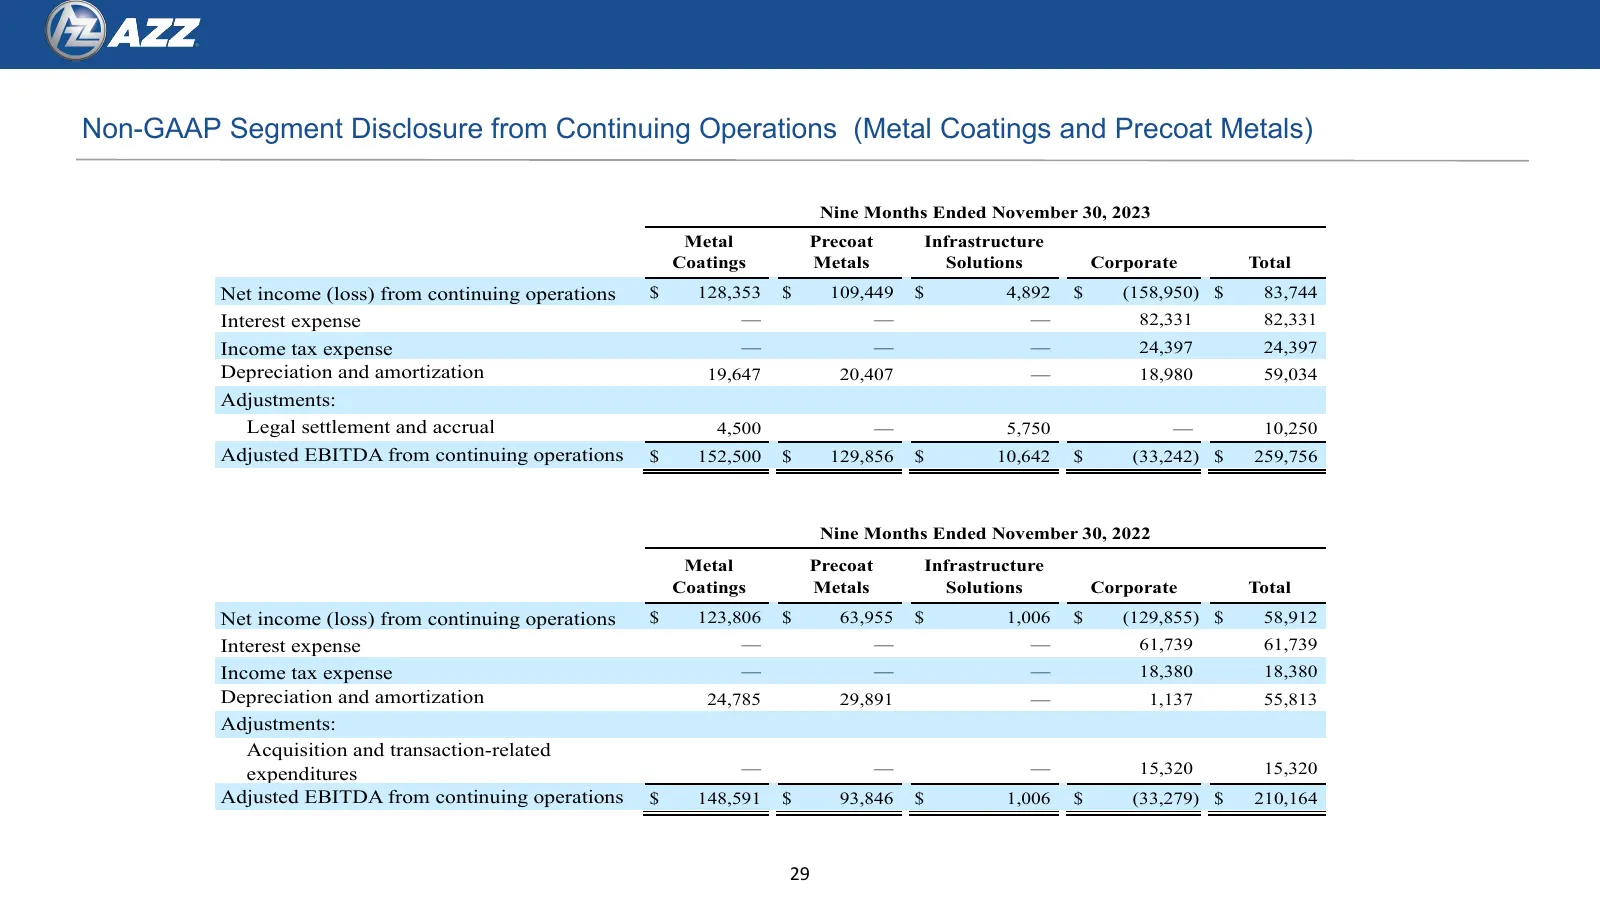
Slide 29: Non-GAAP Segment Disclosure from Continuing Operations (Metal Coatings and Precoat Metals)
Non-GAAP Segment Disclosure from Continuing Operations (Metal Coatings and Precoat Metals) Nine Months Ended November 30, 2023 Metal Precoat Infrastructure Coatings Metals Solutions Corporate Total Net income (loss) from continuing operations $ 128,353 $ 109,449 $ 4,892 $ (158,950) $ 83,744 Interest
Source: Internet Archive copy of azz.com
More decks from AZZ Inc.
 Investor Presentation (October 2026)25 slides · Oct 26, 2026
 Investor Presentation (July 2026)24 slides · July 2026
 Investor Presentation (May 2026)44 slides · May 28, 2026
 Investor Presentation (February 2026)20 slides · Feb 28, 2026
 Investor Presentation (February 2026)44 slides · Feb 12, 2026
 Investor Presentation (October 2025)44 slides · Oct 17, 2025