Innolux Corp. · TWSE:3481
Innolux — Chimei Innolux — Q3 2010 Earnings Presentation
13 slides from Innolux's earnings presentation, October 2010

Slide 1: 3Q 2010 Earning Results
3Q 2010 Earning Results October 2010
Slide 2: Disclaimer
Disclaimer Chimei Innolux Corporation’s statements of its current expectations and estimates are forward-looking statements subject to significant known and unknown risks and uncertainties and actual results may differ materially from those contained or implied in the forward looking statements. The
Slide 3: Agenda
Agenda 3Q 2010 Financial Results Recent Development 3
Slide 4: CMI with TFT Subsidiaries 3Q10 Income Statement – QoQ
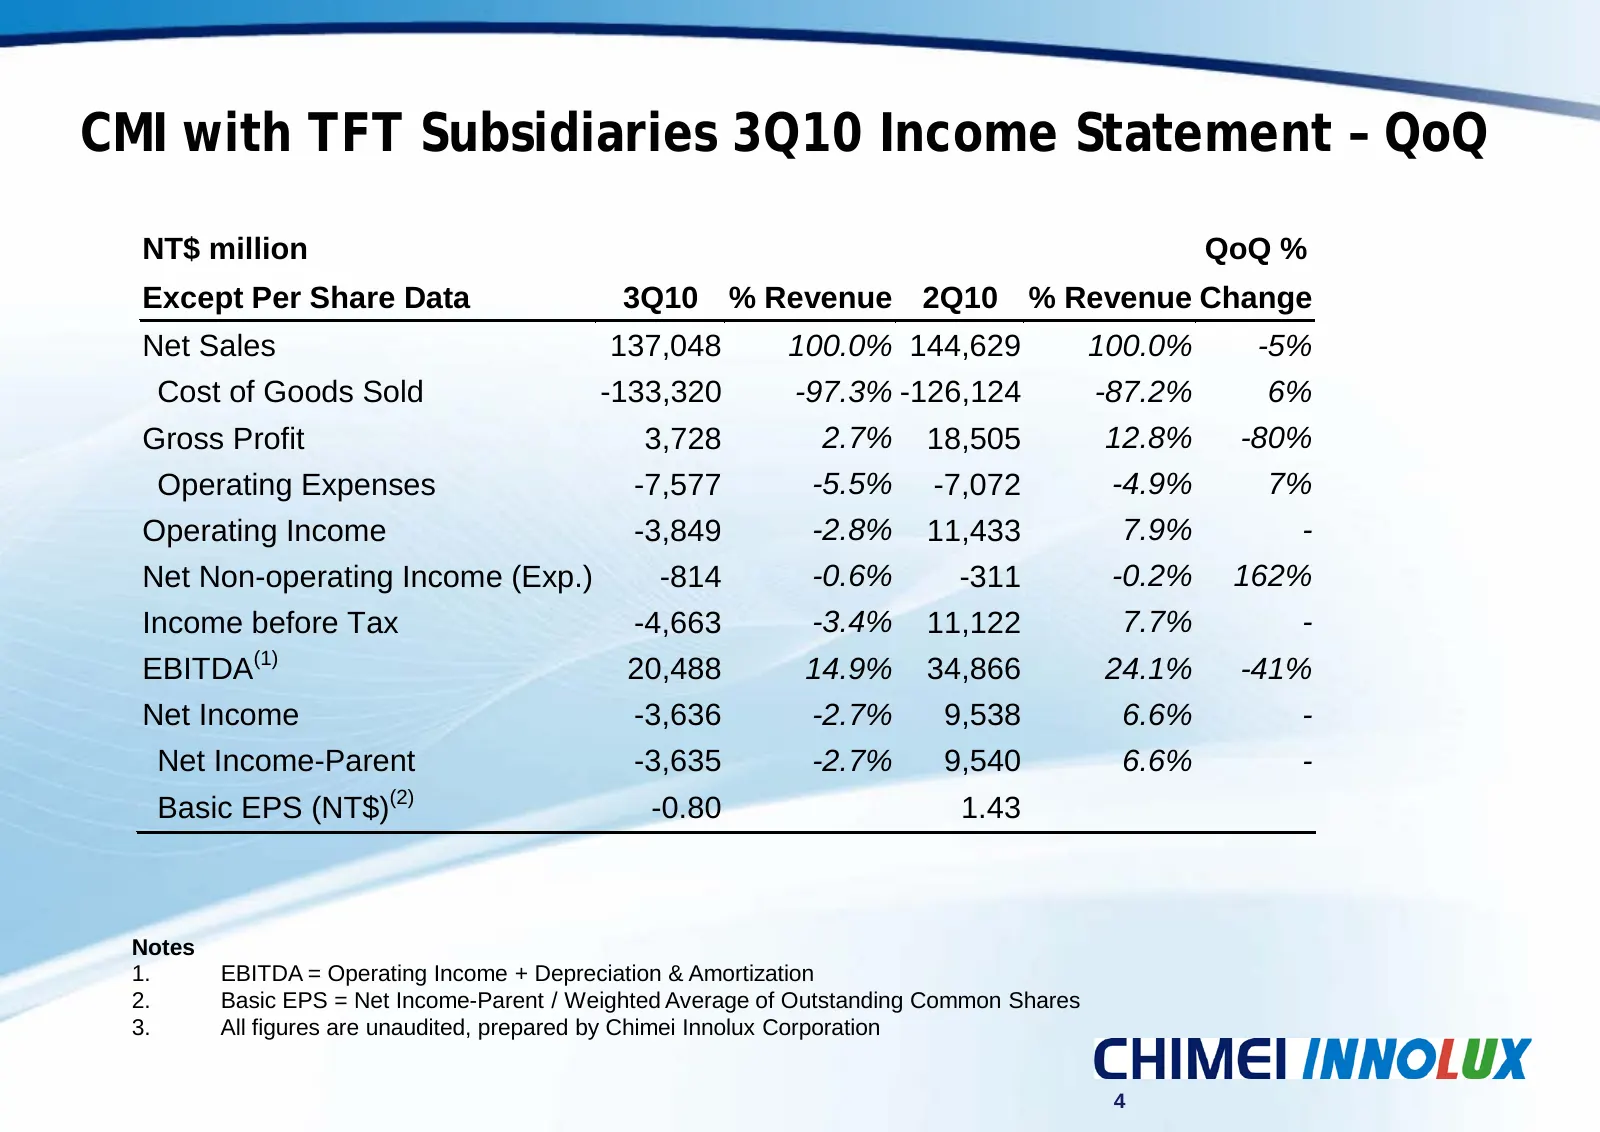
CMI with TFT Subsidiaries 3Q10 Income Statement – QoQ NT$ million QoQ % Except Per Share Data 3Q10 % Revenue 2Q10 % Revenue Change Net Sales 137,048 100.0% 144,629 100.0% -5% Cost of Goods Sold -133,320 -97.3% -126,124 -87.2% 6% Gross Profit 3,728 2.7% 18,505 12.8% -80% Operating Expenses -7,577 -5.
Slide 5: CMI with TFT Subsidiaries 3Q10 Balance Sheet
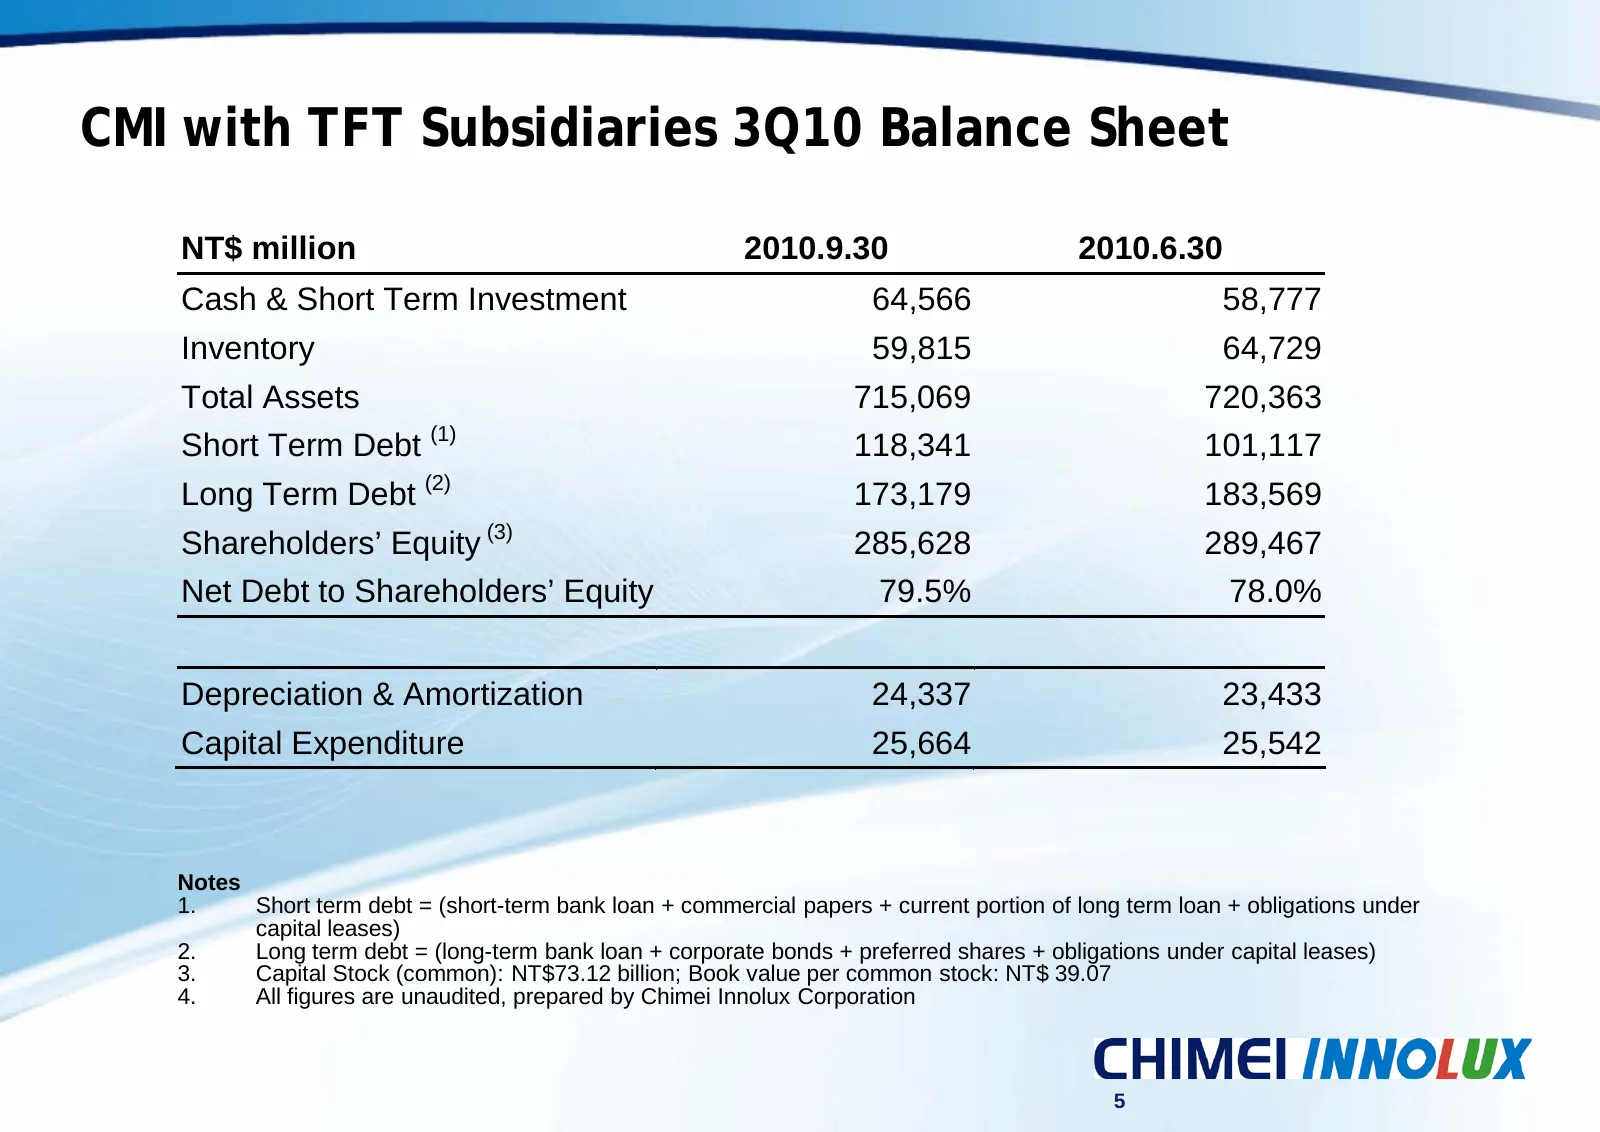
CMI with TFT Subsidiaries 3Q10 Balance Sheet NT$ million 2010.9.30 2010.6.30 Cash & Short Term Investment 64,566 58,777 Inventory 59,815 64,729 Total Assets 715,069 720,363 Short Term Debt (1) 118,341 101,117 Long Term Debt (2) 173,179 183,569 Shareholders’ Equity (3) 285,628 289,467 Net Debt to Sha
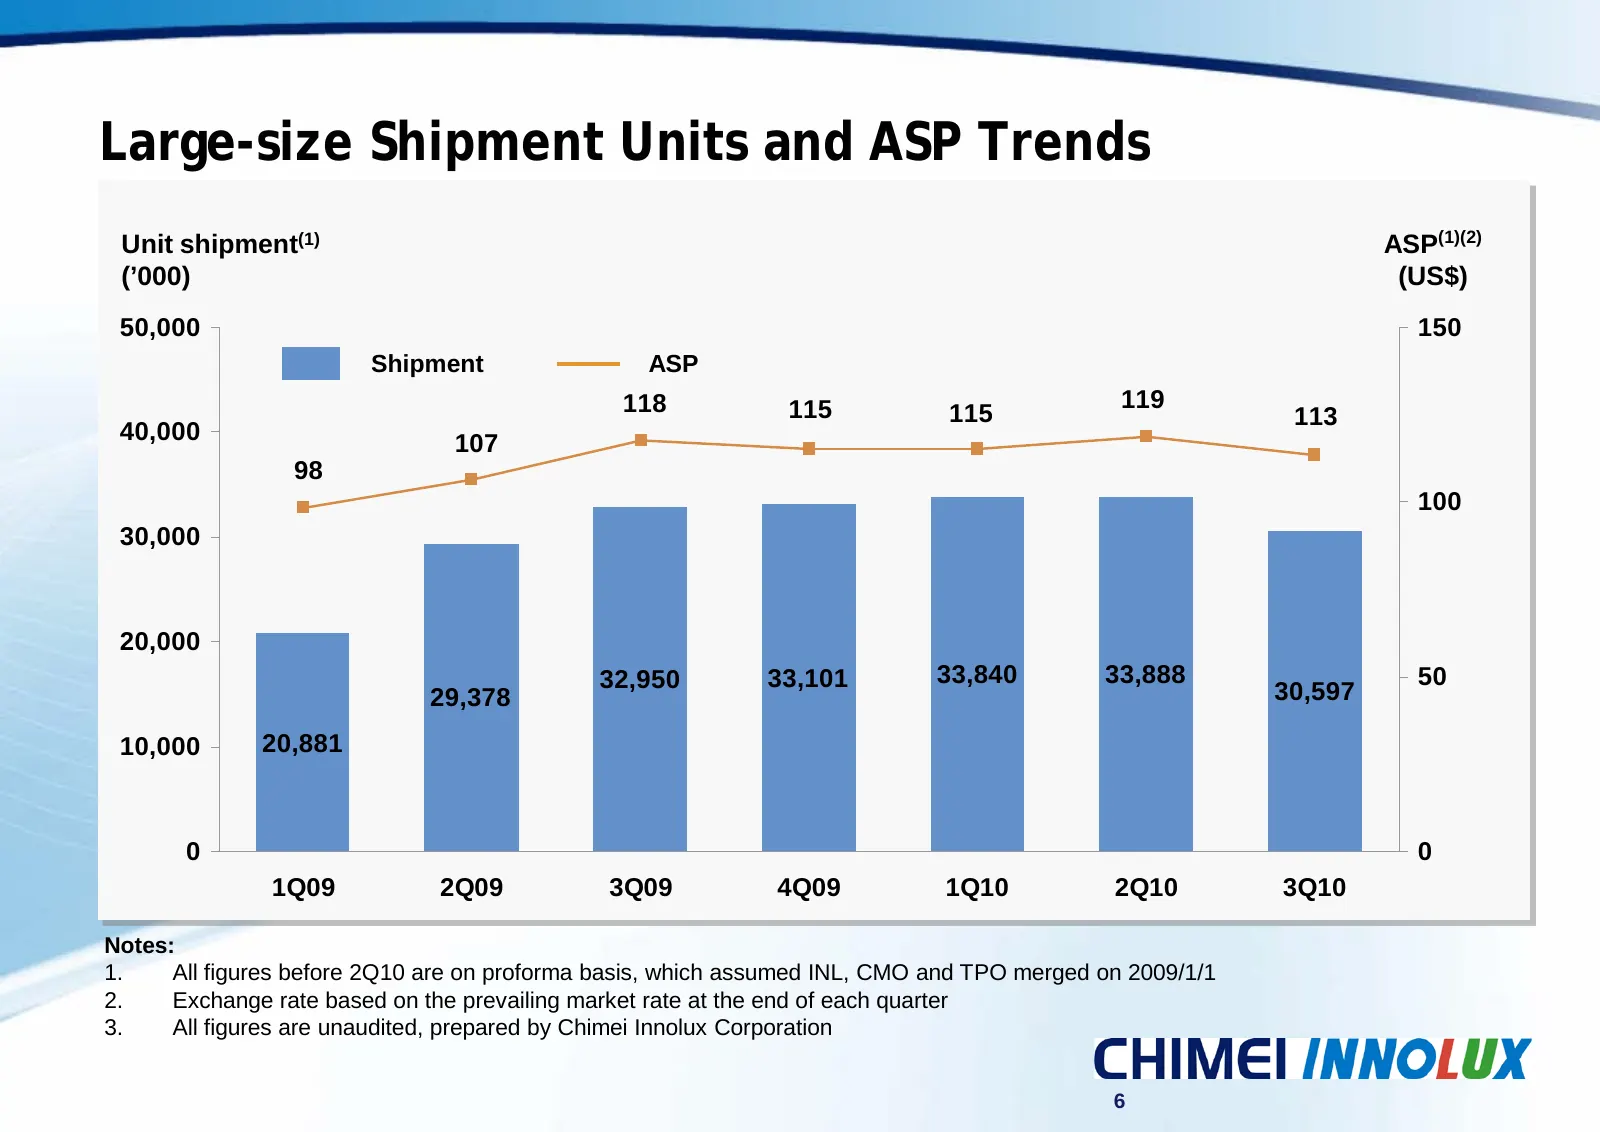
Slide 6: Large-size Shipment Units and ASP Trends
Large-size Shipment Units and ASP Trends Unit shipment(1) ASP(1)(2) (’000) (US$) 50,000 150 Shipment ASP 118 115 119 115 113 40,000 107 98 100 30,000 20,000 32,950 33,101 33,840 33,888 50 29,378 30,597 10,000 20,881 0 0 1Q09 2Q09 3Q09 4Q09 1Q10 2Q10 3Q10 Notes: 1. All figures before 2Q10 are on prof
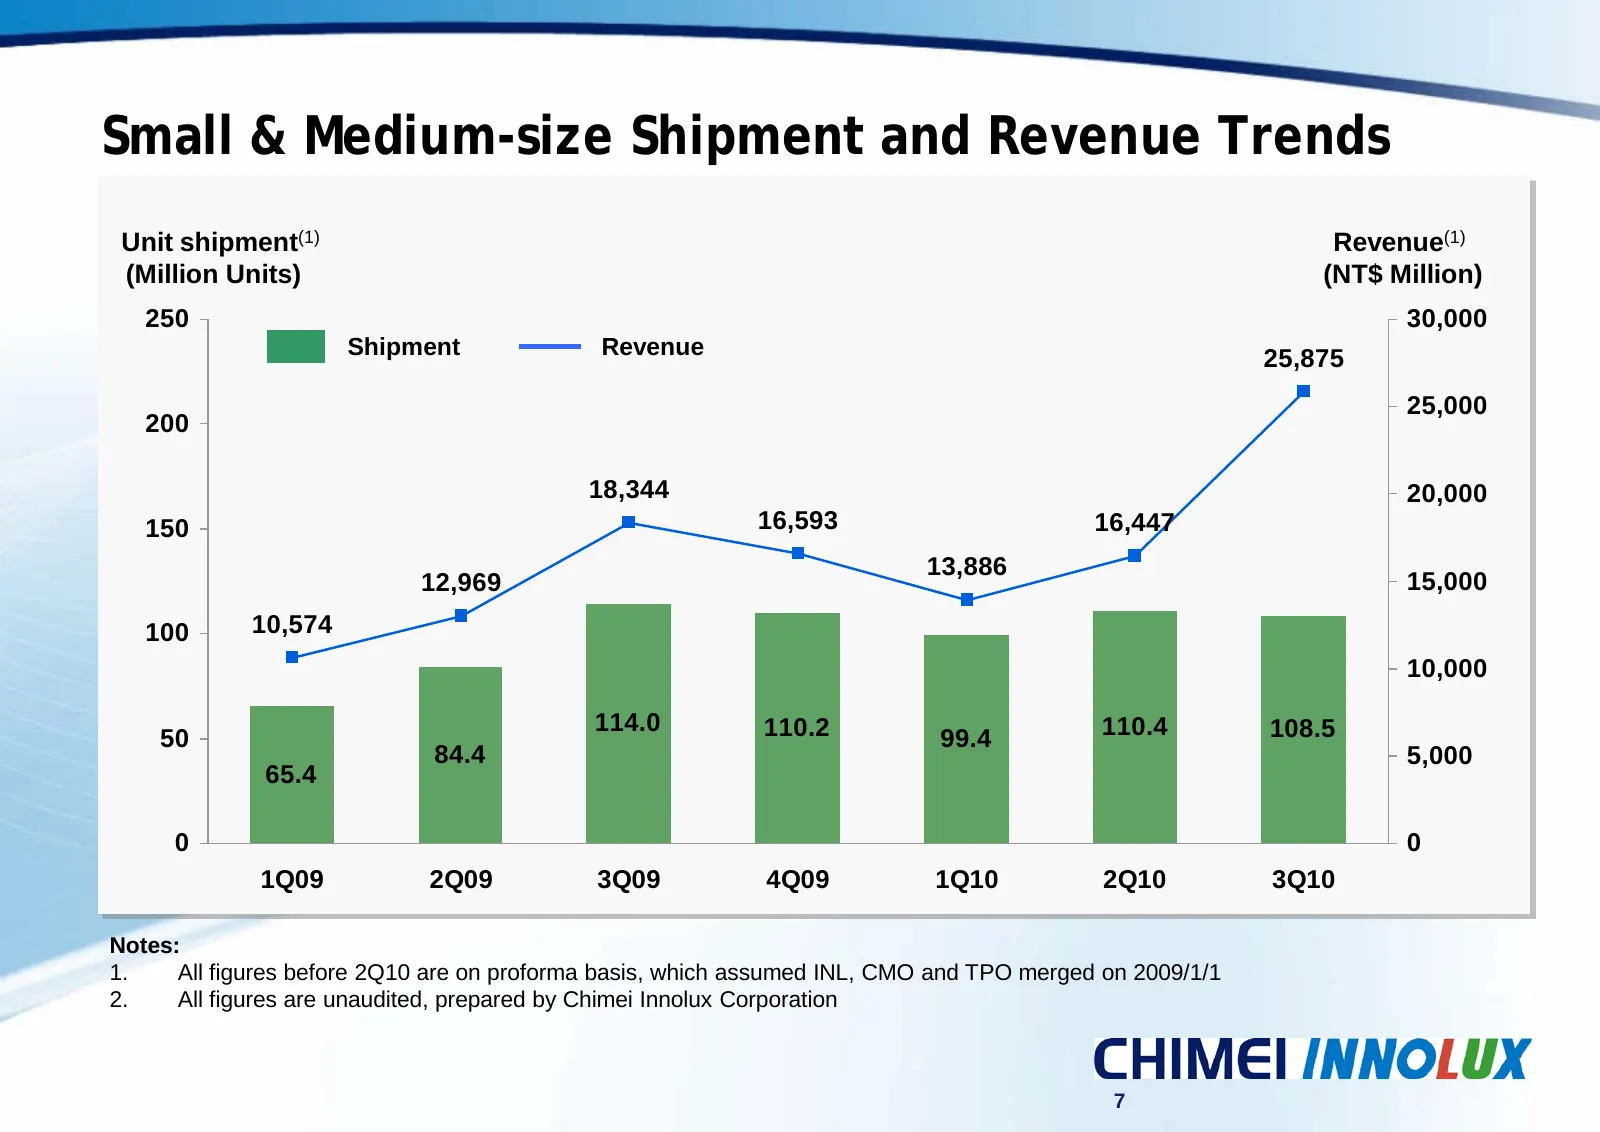
Slide 7: Small & Medium-size Shipment and Revenue Trends
Small & Medium-size Shipment and Revenue Trends Unit shipment(1) Revenue(1) (Million Units) (NT$ Million) 250 30,000 Shipment Revenue 25,875 25,000 200 18,344 20,000 150 16,593 16,447 13,886 12,969 15,000 100 10,574 10,000 114.0 110.2 110.4 108.5 50 99.4 84.4 5,000 65.4 0 0 1Q09 2Q09 3Q09 4Q09 1Q10
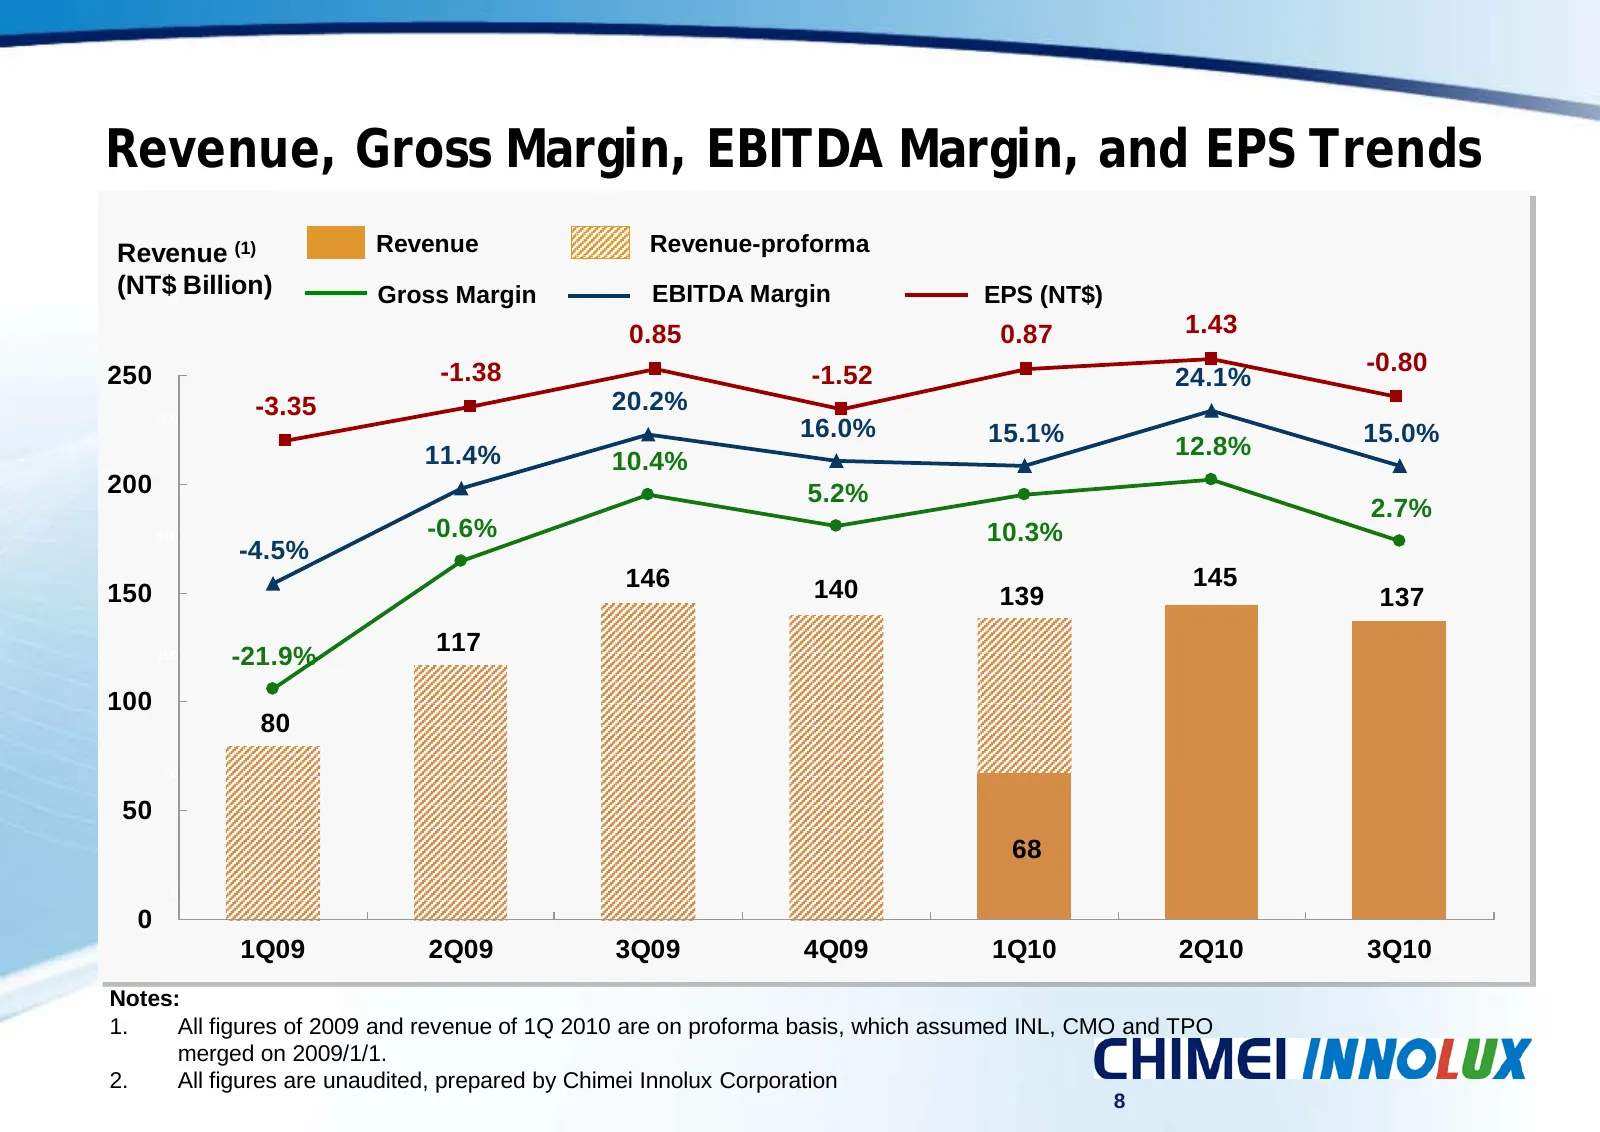
Slide 8: Revenue, Gross Margin, EBITDA Margin, and EPS Trends
Revenue, Gross Margin, EBITDA Margin, and EPS Trends Revenue (1) Revenue Revenue-proforma (NT$ 250 Billion) Gross Margin EBITDA Margin EPS (NT$) 0.85 0.87 1.43 250 -1.38 -1.52 -0.80 24.1% 200 -3.35 20.2% 16.0% 15.1% 15.0% 11.4% 12.8% 10.4% 200 5.2% 2.7% 150 -0.6% 10.3% -4.5% 146 140 145 150 139 137
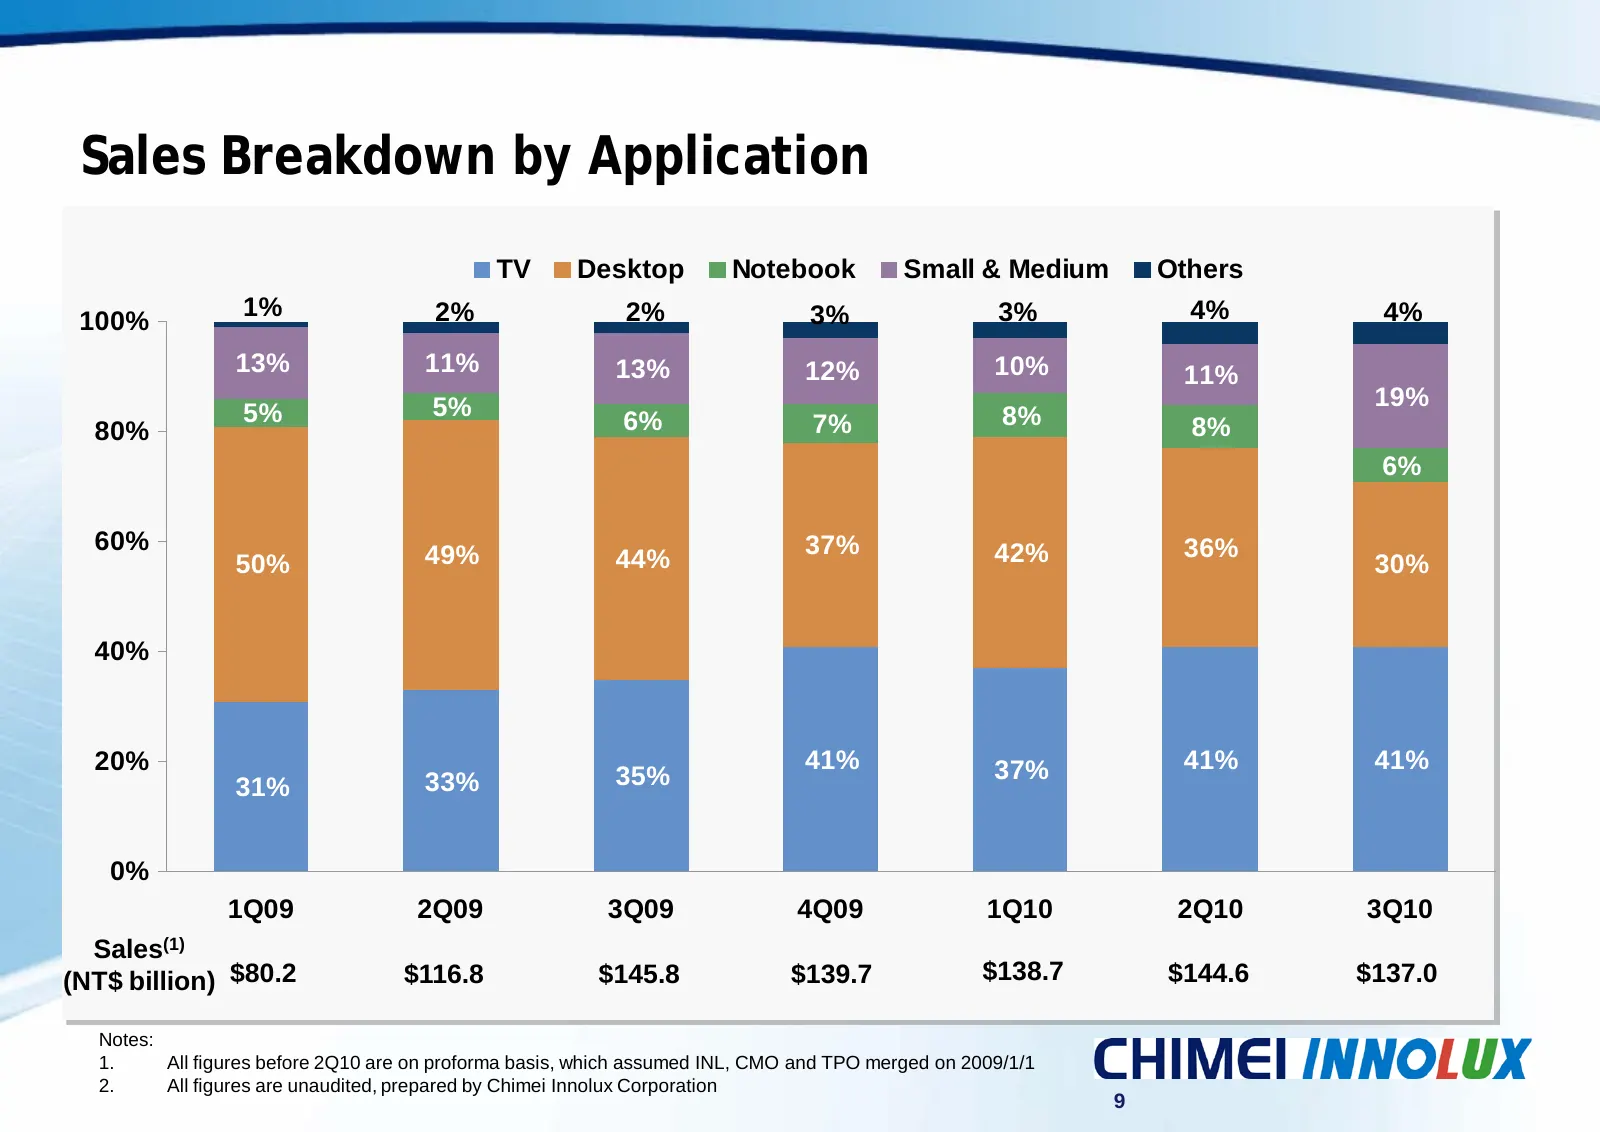
Slide 9: Sales Breakdown by Application
Sales Breakdown by Application TV Desktop Notebook Small & Medium Others 1% 2% 2% 3% 3% 4% 4% 100% 13% 11% 13% 12% 10% 11% 5% 19% 5% 6% 7% 8% 80% 8% 6% 60% 37% 42% 36% 50% 49% 44% 30% 40% 20% 41% 37% 41% 41% 31% 33% 35% 0% 1Q09 2Q09 3Q09 4Q09 1Q10 2Q10 3Q10 Sales(1) (NT$ billion) $80.2 $116.8 $145.8
Slide 10: Sales Breakdown by Size
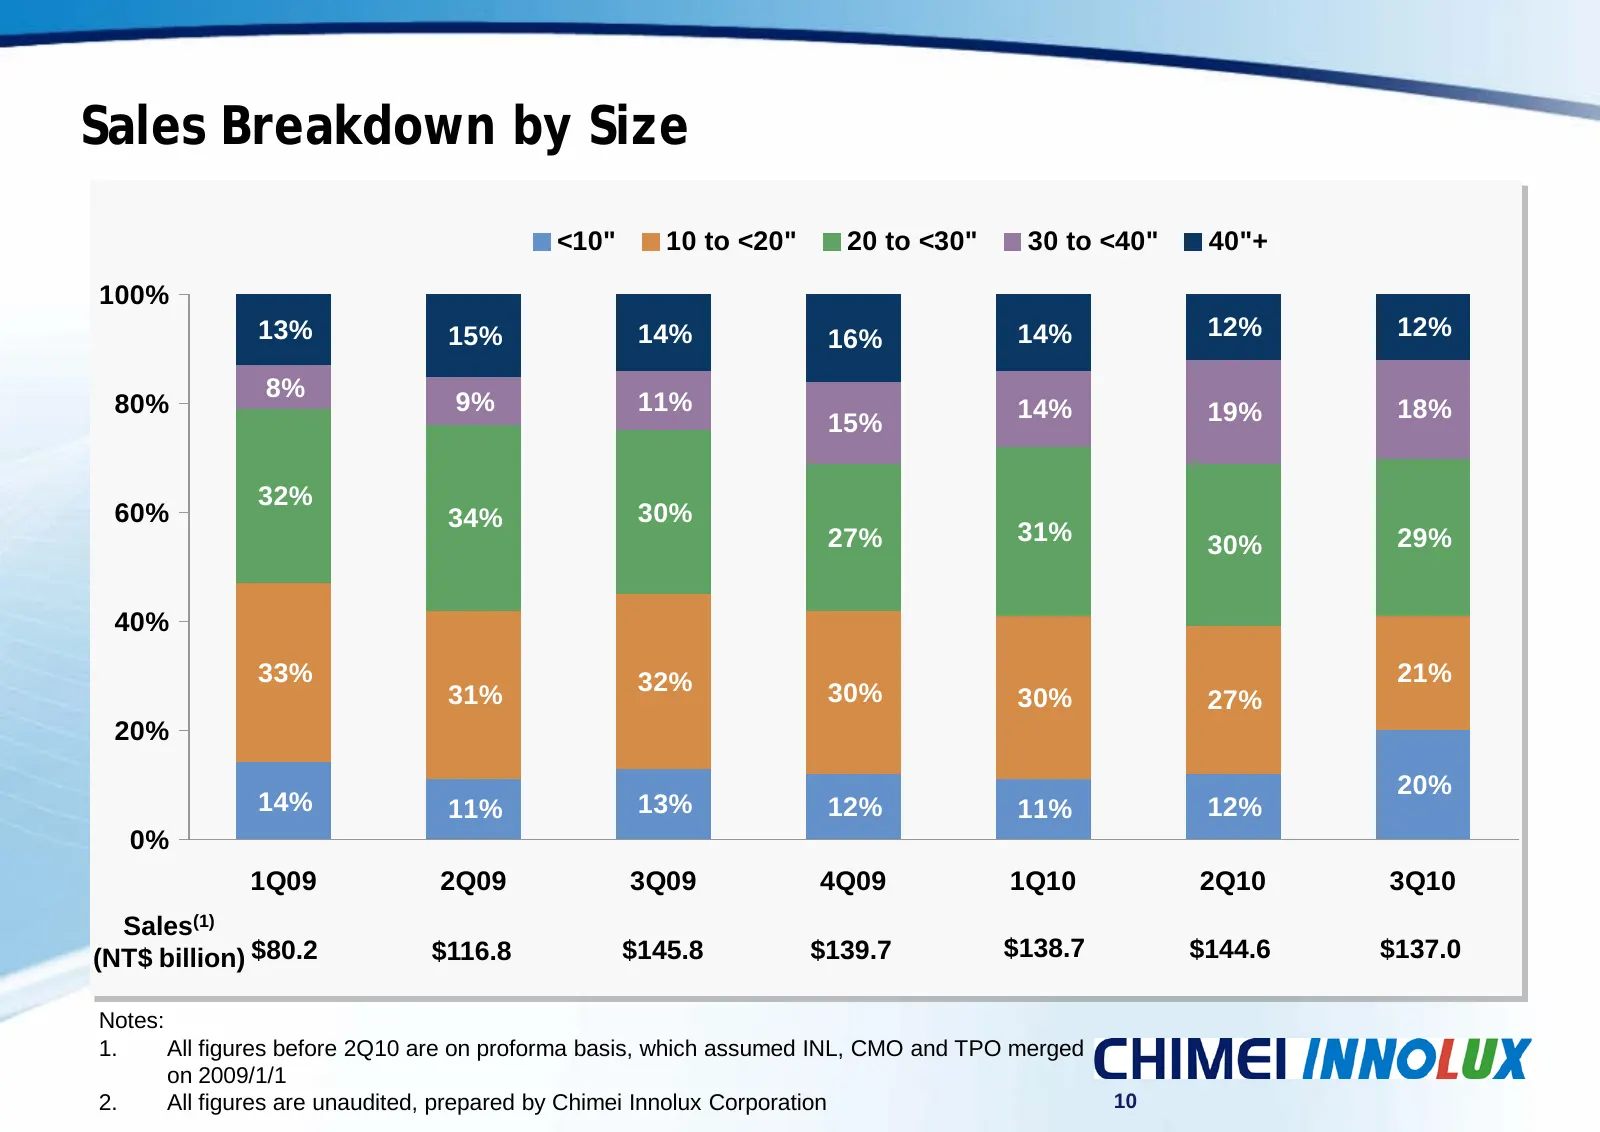
Sales Breakdown by Size <10" 10 to <20" 20 to <30" 30 to <40" 40"+ 100% 13% 15% 14% 16% 14% 12% 12% 8% 80% 9% 11% 14% 19% 18% 15% 32% 60% 34% 30% 27% 31% 30% 29% 40% 33% 32% 21% 31% 30% 30% 27% 20% 20% 14% 11% 13% 12% 11% 12% 0% 1Q09 2Q09 3Q09 4Q09 1Q10 2Q10 3Q10 Sales(1) (NT$ billion) $80.2 $116.8

Slide 11: Agenda
Agenda 3Q 2010 Financial Results Recent Development 11
Slide 12: Fab Update
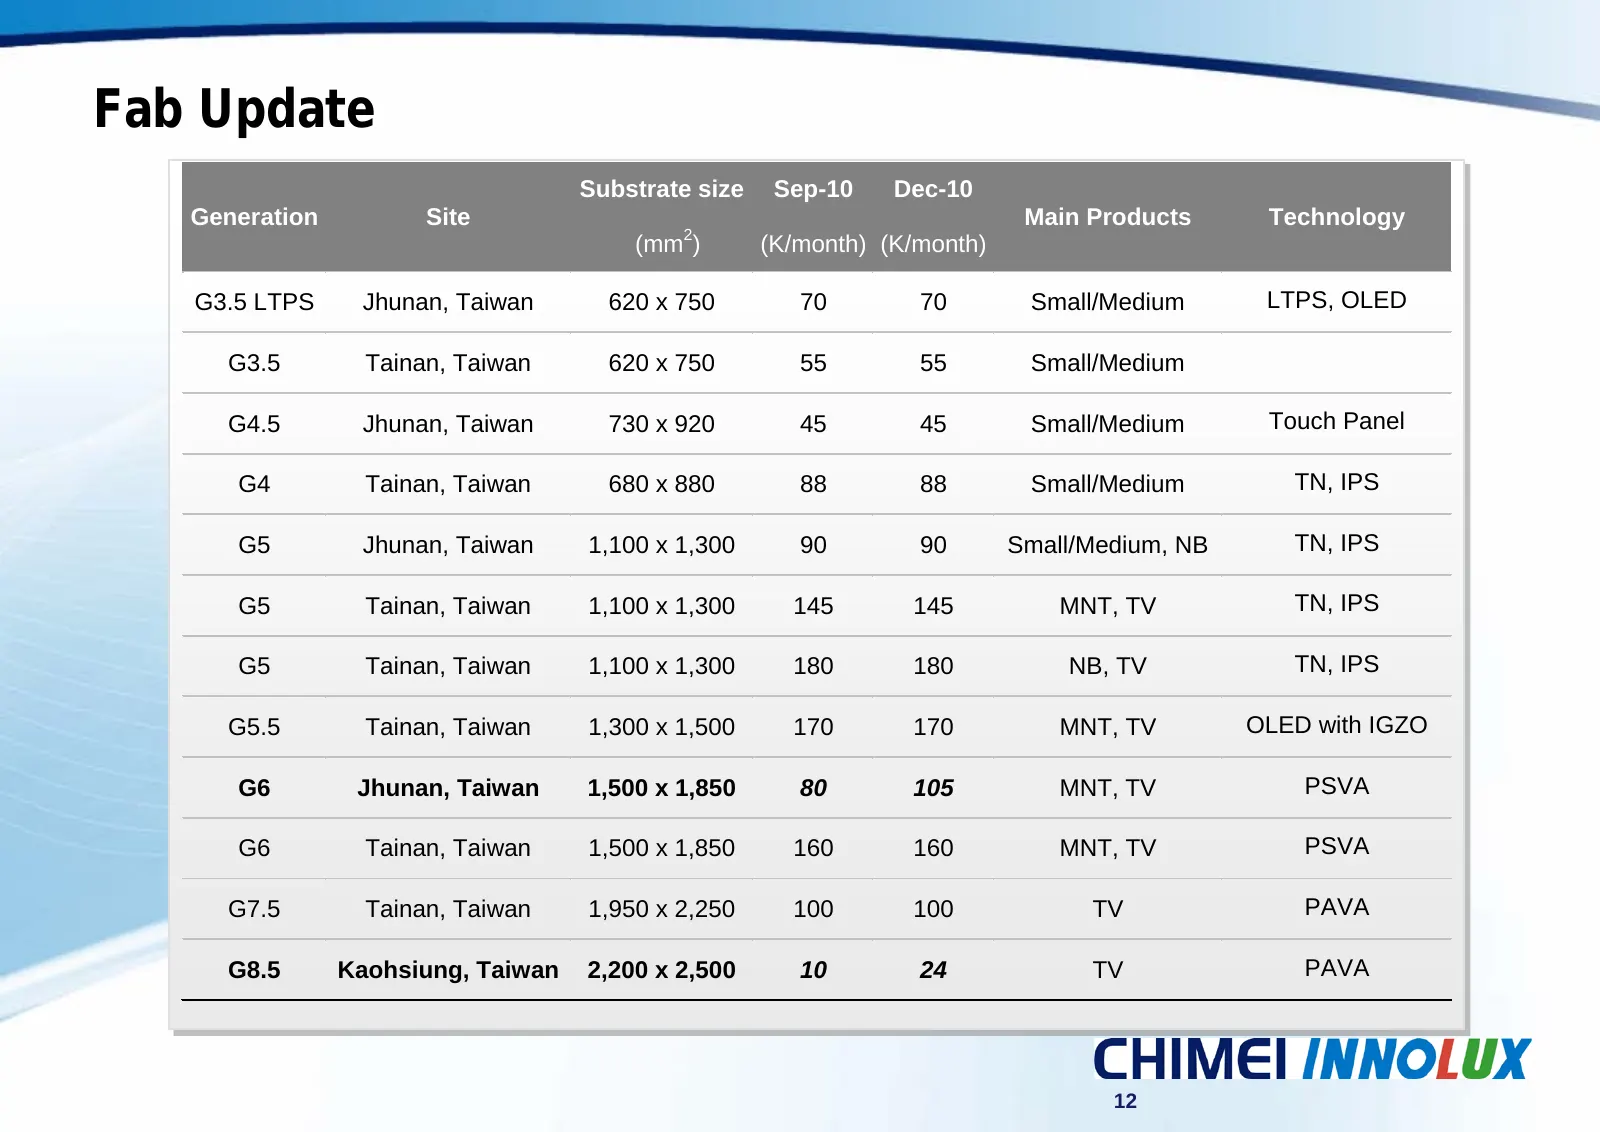
Fab Update Substrate size Sep-10 Dec-10 Generation Site Main Products Technology 2 (mm ) (K/month) (K/month) G3.5 LTPS Jhunan, Taiwan 620 x 750 70 70 Small/Medium LTPS, OLED G3.5 Tainan, Taiwan 620 x 750 55 55 Small/Medium G4.5 Jhunan, Taiwan 730 x 920 45 45 Small/Medium Touch Panel G4 Tainan, Taiwa

Slide 13: For further information, please visit our website
For further information, please visit our website at: www.chimei-innolux.com Contact Investor Relations at: phone: +886 (0)6 505-3760 email:ir@chimei-innolux.com 13
Source: Internet Archive copy of innolux.com
More decks from Innolux Corp.
 Investor Presentation (August 2026)18 slides · Aug 18, 2026
 Q4 2024 Earnings Presentation26 slides · Mar 14, 2025
 Q2 2023 Earnings Presentation12 slides · Aug 2, 2023
 FY2021 Earnings Presentation9 slides · Mar 2, 2022
 H2 2021 Earnings Presentation9 slides · Aug 6, 2021
 Q2 2013 Earnings Presentation19 slides · August 2013