Limestone Bancorp — Porter Bancorp — INVESTKentucky Conference 2011
21 slides from Limestone Bancorp's conference presentation, Jun 8, 2011
Slide 1: Porter Bancorp, Inc. INVESTKentucky Conference
Porter Bancorp, Inc. INVESTKentucky Conference June 9, 2011 1
Slide 2: Disclaimer
Disclaimer This presentation contains forward-looking statements that involve risks and uncertainties. These forward-looking statements are based on management’s current expectations. Porter Bancorp’s actual results in future periods may differ materially from those currently expected due to various
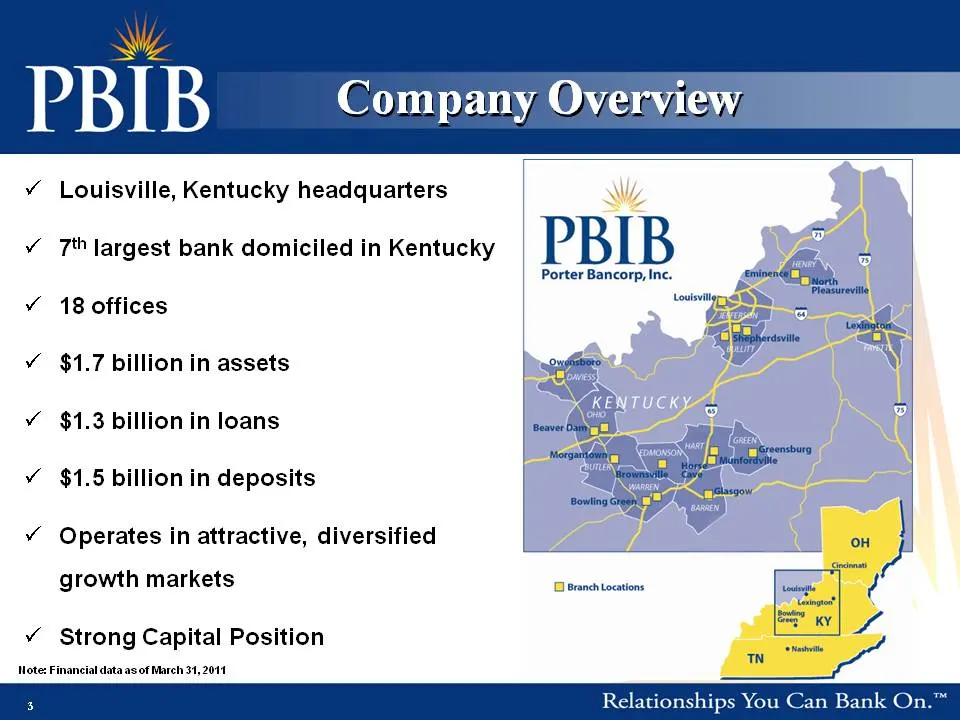
Slide 3: Company Overview
Company Overview Louisville, Kentucky headquarters 7th largest bank domiciled in Kentucky 18 offices $1.7 billion in assets $ 1.3 billion in loans $1.5 billion in deposits Operates in attractive, diversified growth markets 3 Strong Capital Position Note: Financial data as of March 31, 2011 3
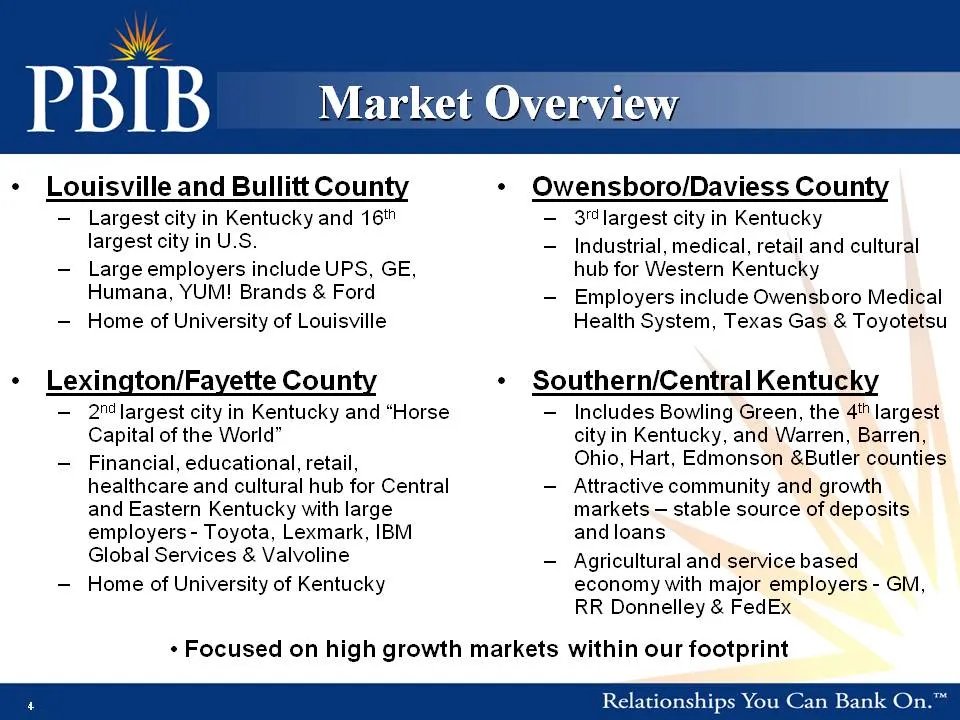
Slide 4: Market Overview
Market Overview • Louisville and Bullitt County • Owensboro/Daviess County – Largest city in Kentucky and 16th largest city in U.S. – Large employers include UPS, GE, Humana, YUM! Brands & Ford – 3rd largest city in Kentucky – Industrial, medical, retail and cultural hub for Western Kentucky – Emplo
Slide 5: Company Overview
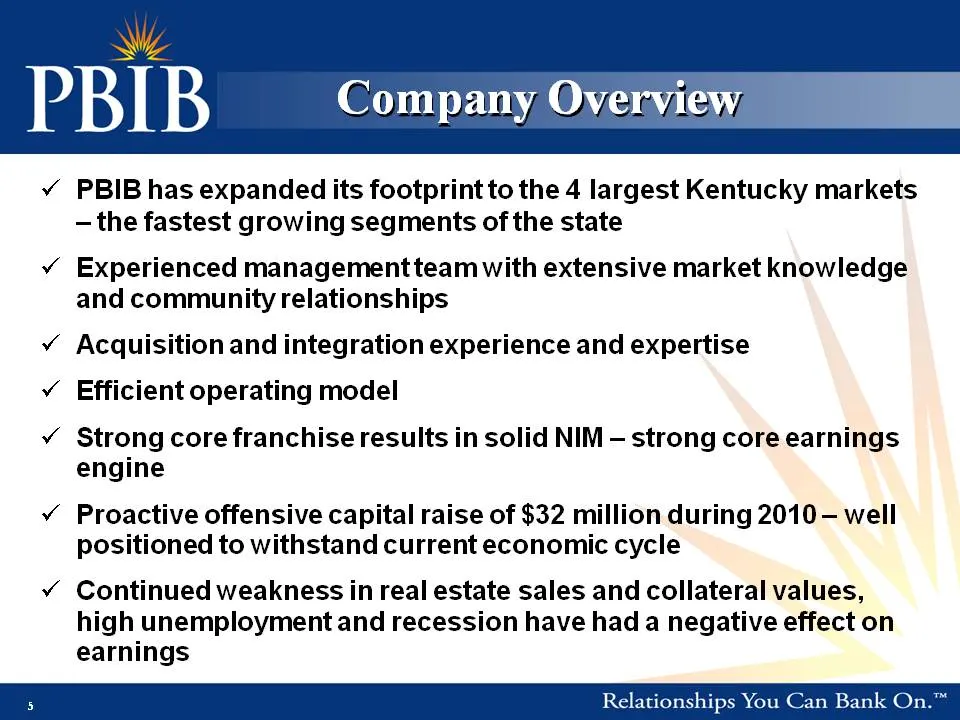
Company Overview PBIB has expanded its footprint to the 4 largest Kentucky markets – the fastest growing segments of the state Experienced management team with extensive market knowledge and community relationships Acquisition and integration experience and expertise Efficient operating model Strong
Slide 6: Financial Highlights
PBIB | Financial Highlights Relationships You Can Bank On.™
Slide 7: Operating Performance
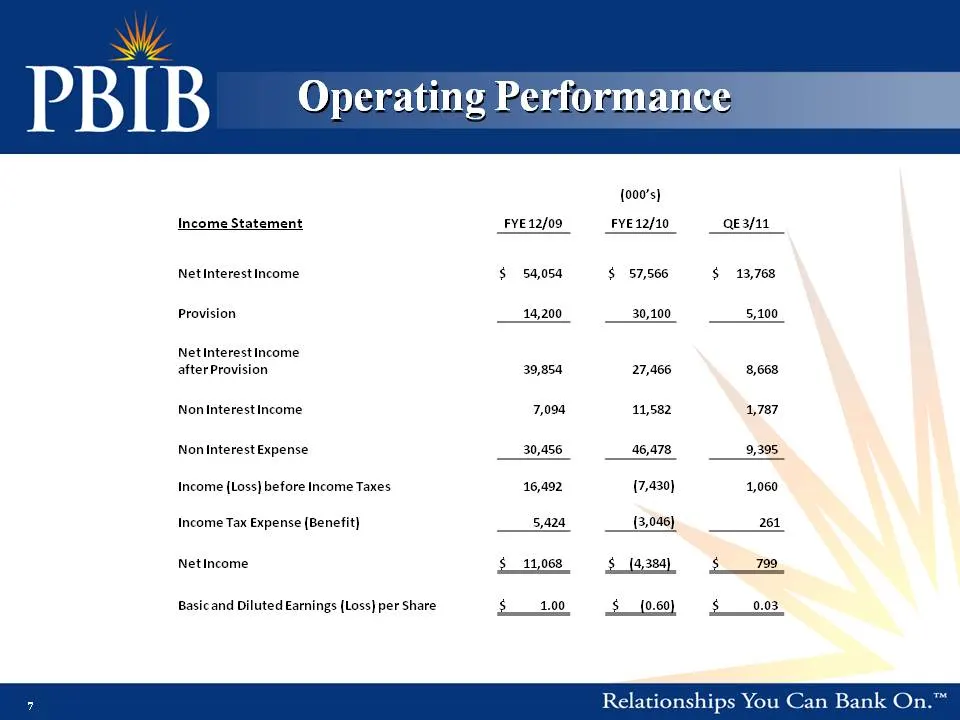
Operating Performance (000’s) Income Statement FYE 12/09 FYE 12/10 QE 3/11 Net Interest Income $ 54,054 $ 57,566 $ 13,768 Provision 14,200 30,100 5,100 Net Interest Income after Provision 39,854 27,466 8,668 Non 7 094 11 582 1 787 Interest Income 7,094 11,582 1,787 Non Interest Expense 30,456 46,478
Slide 8: Q1 2011 Operating Results
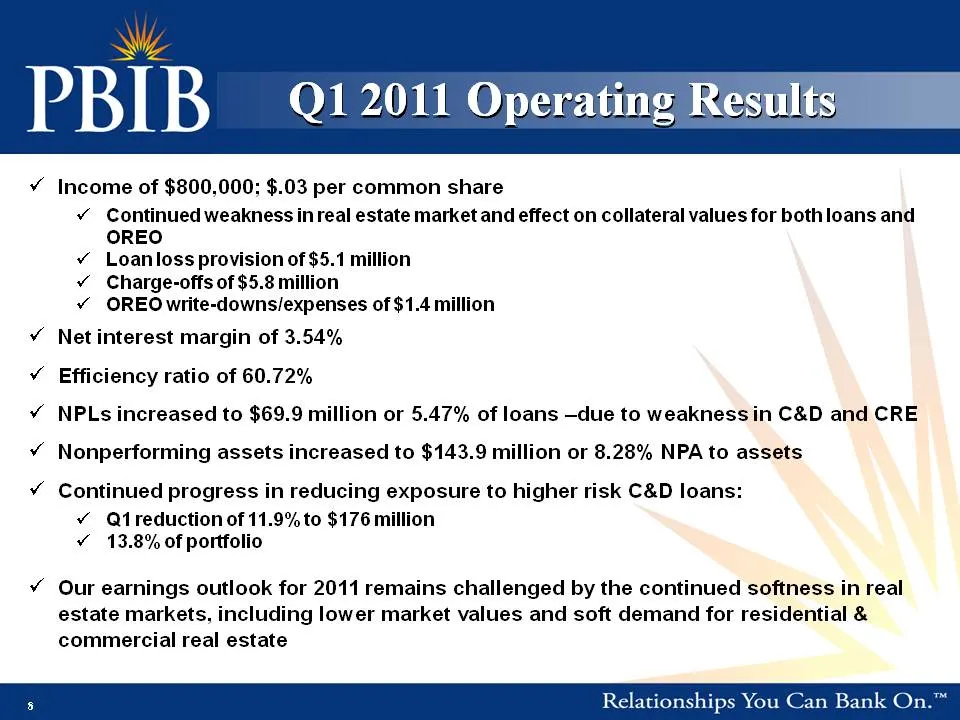
Q1 2011 Operating Results Income of $800,000; $.03 per common share Continued weakness in real estate market and effect on collateral values for both loans and OREO Loan loss provision of $5.1 million Charge-offs of $5.8 million OREO write-downs/expenses of $1.4 write million Net interest margin of
Slide 9: Balance Sheet
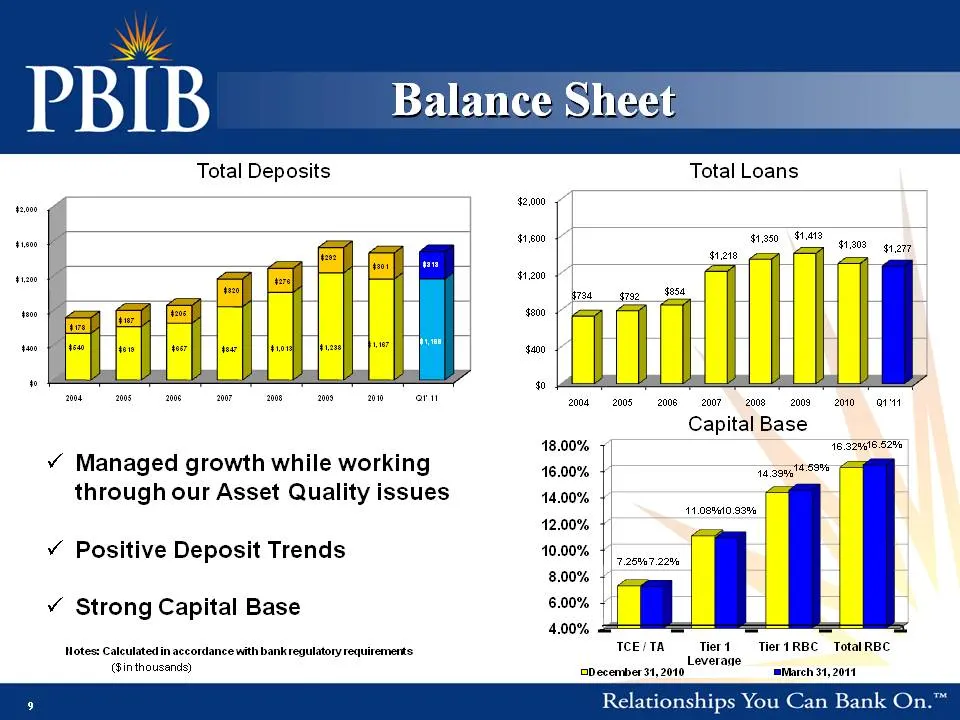
Balance Sheet Total Deposits $2,000 Total Loans $1,200 $1,600 $2,000 $320 $276 $292 $301 $313 $1,200 $1,600 $734 $792 $854 $1,218 $1,350 $1,413 $1,303 $1,277 $0 $400 $800 2004 2005 2006 2007 2008 2009 2010 Q1' 11 $540 $619 $657 $847 $1,013 $1,238 $1,167 $1,169 $178 $187 $205 $0 $400 $800 2004 2005 2
Slide 10: Operating Performance
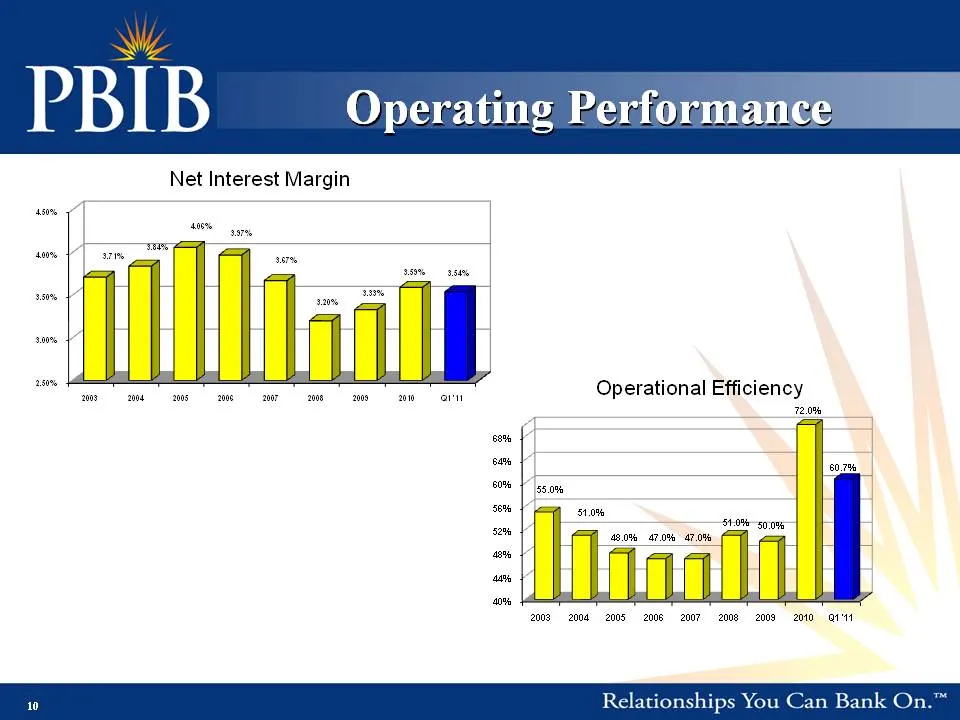
Operating Performance Net Interest Margin 3.50% 4.00% 4.50% 3.71% 3.84% 4.06% 3.97% 3.67% 3.20% 3.33% 3.59% 3.54% Operational Efficiency 72 0% 2.50% 3.00% 2003 2004 2005 2006 2007 2008 2009 2010 Q1 '11 56% 60% 64% 68% 55.0% 51 0% 72.0% 60.7% 40% 44% 48% 52% 2003 2004 2005 2006 2007 2008 2009 2010 Q1
Slide 11: Loan Stratification
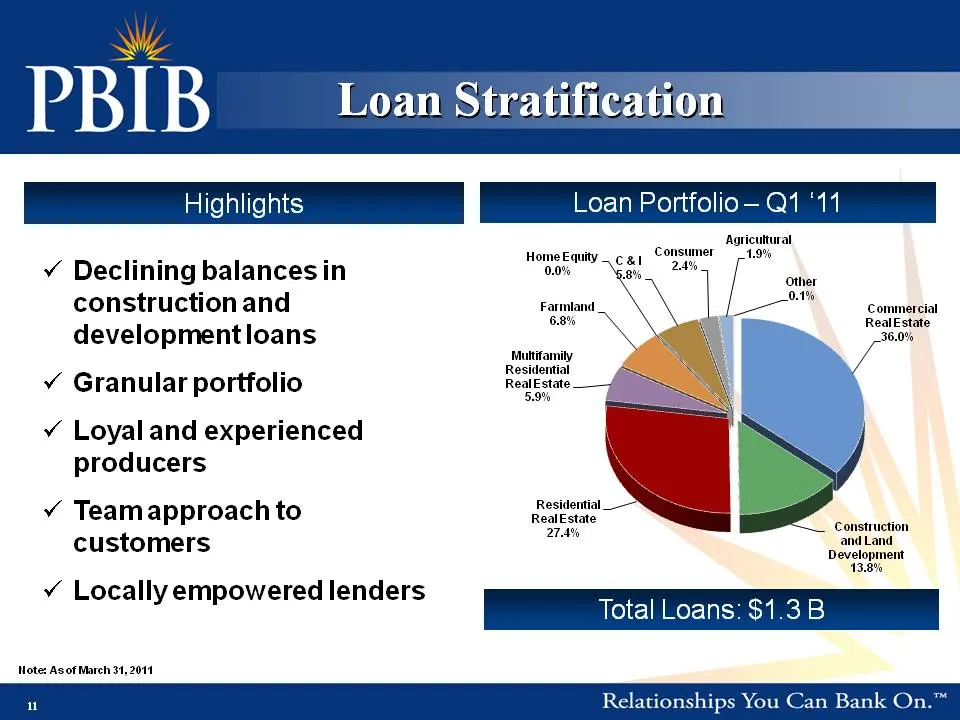
Loan ‘Stratification Declining balances in Loan Portfolio – Q1 11 Highlights Commercial Farmland Home Equity 0.0% C & I 5.8% Consumer 2.4% Agricultural 1.9% Other 0.1% construction and development loans Granular portfolio Real Estate 36.0% Multifamily Residential Real Estate 5.9% 6.8% Loyal and expe
Slide 12: Asset Quality Summary
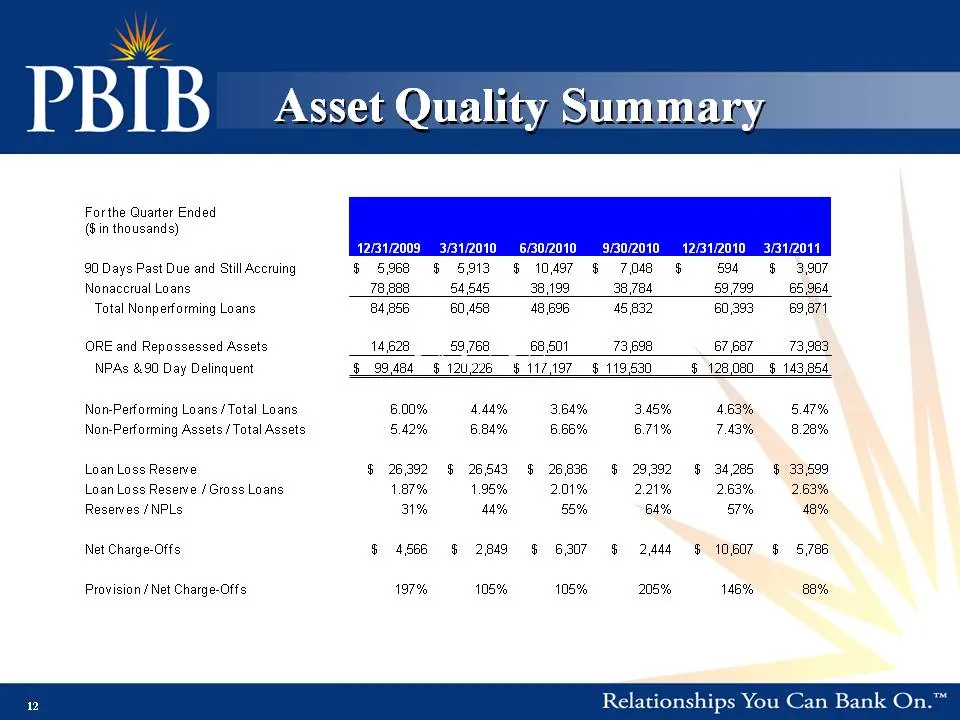
Asset Quality Summary For the Quarter Ended ($ in thousands) 12/31/2009 3/31/2010 6/30/2010 9/30/2010 12/31/2010 3/31/2011 90 Days Past Due and Still Accruing $ 5,968 $ 5,913 $ 10,497 $ 7,048 $ 594 $ 3,907 Nonaccrual Loans 78,888 54,545 38,199 38,784 59,799 65,964 Total Nonperforming Loans 84 856 60
Slide 13: Non-performing Detail
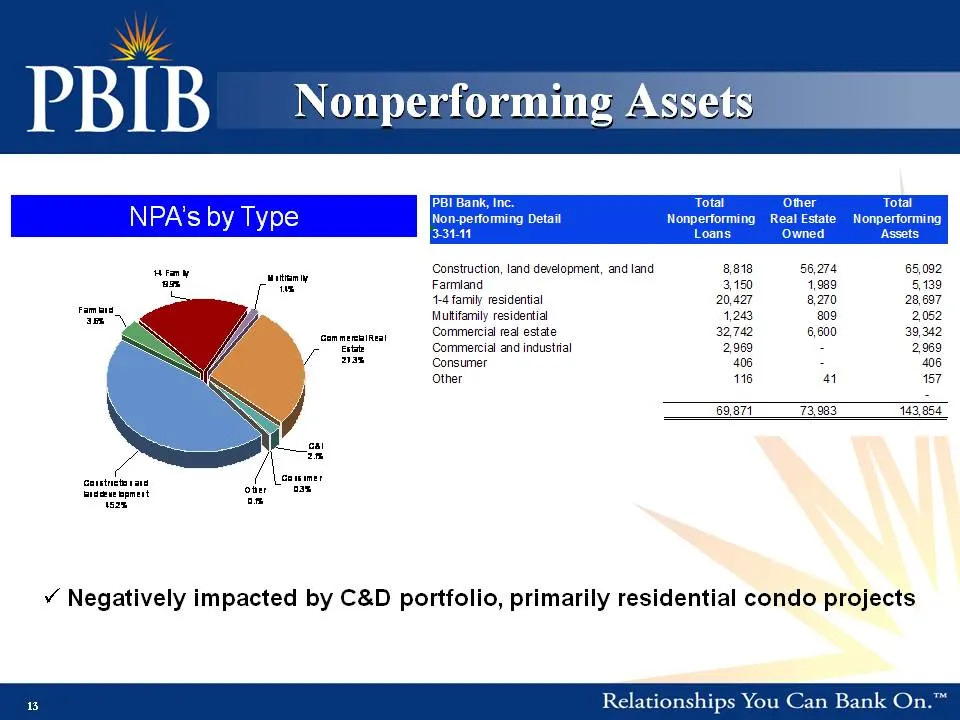
Nonperforming Total Other Total NPA’s by Type Multifamily 1.4% 1-4 Family 19.9% Farmland PBI Bank, Inc. Non-performing Detail Nonperforming Real Estate Nonperforming 3-31-11 Loans Owned Assets Construction, land development, and land 8,818 56,274 65,092 Farmland 3,150 1,989 5,139 1-4 family resident
Slide 14: Focus on Asset Quality
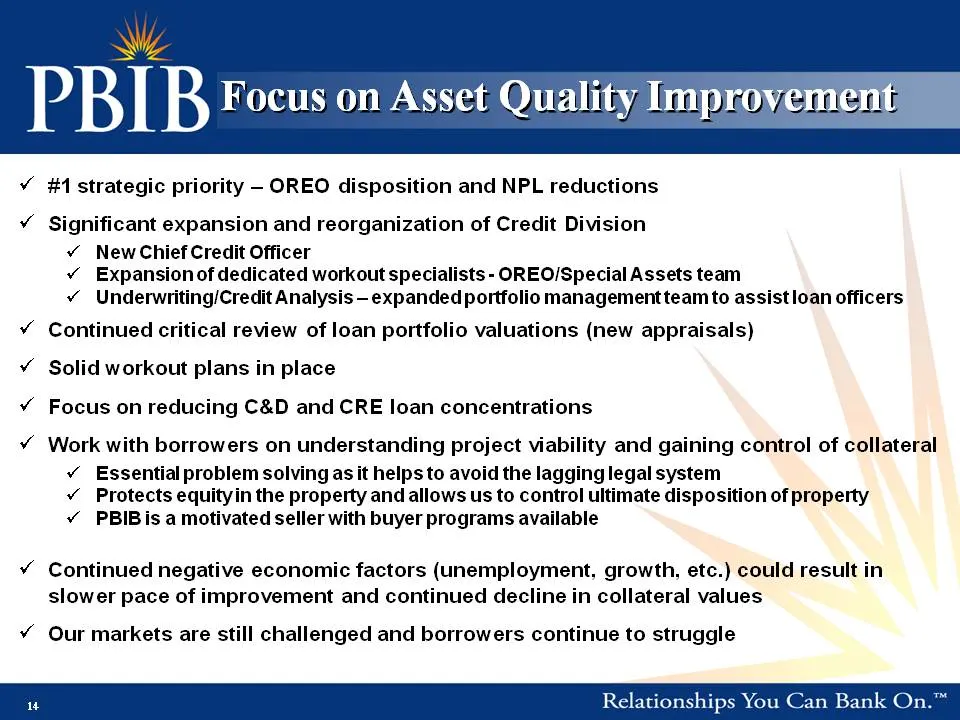
Focus on Asset Quality #1 strategic priority – OREO disposition and NPL reductions Significant expansion and reorganization of Credit Division New Chief Credit Officer Expansion of dedicated workout specialists - OREO/Special Assets team Underwriting/Credit Analysis – expanded portfolio management t
Slide 15: Deposit Stratification
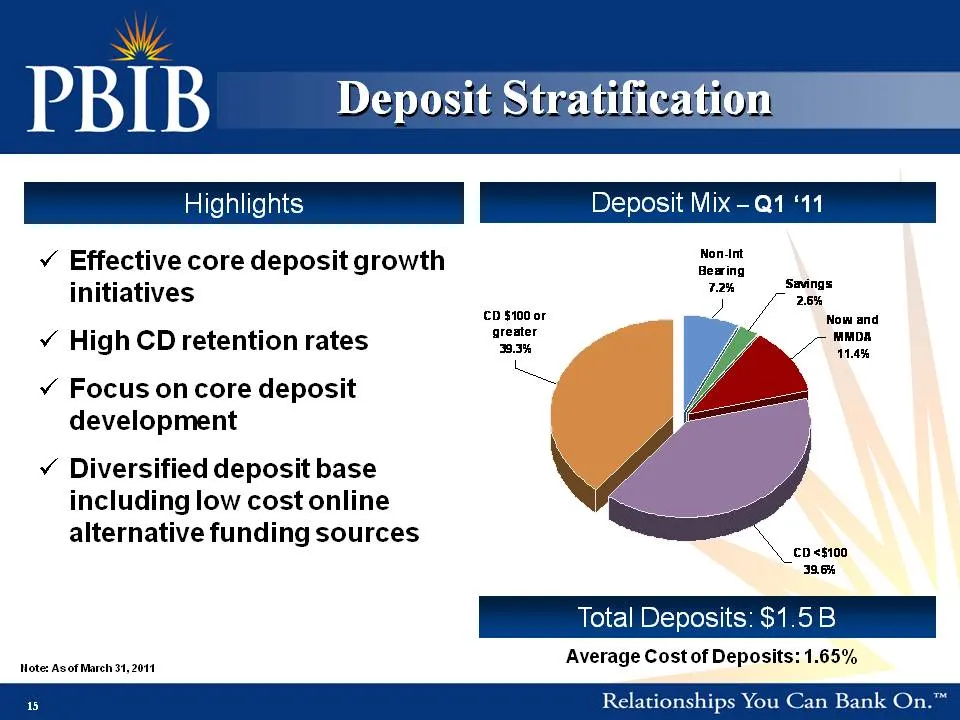
Deposit Stratification Q1 ‘11 Highlights Deposit Mix – Effective core deposit growth initiatives Non-Int Bearing 7.2% Savings 2.6% High CD retention rates Focus on core deposit CD $100 or greater 39.3% Now and MMDA 11.4% development Diversified deposit base including low cost online Total $1 5 B alt
Slide 16: 2011 Key Initiatives
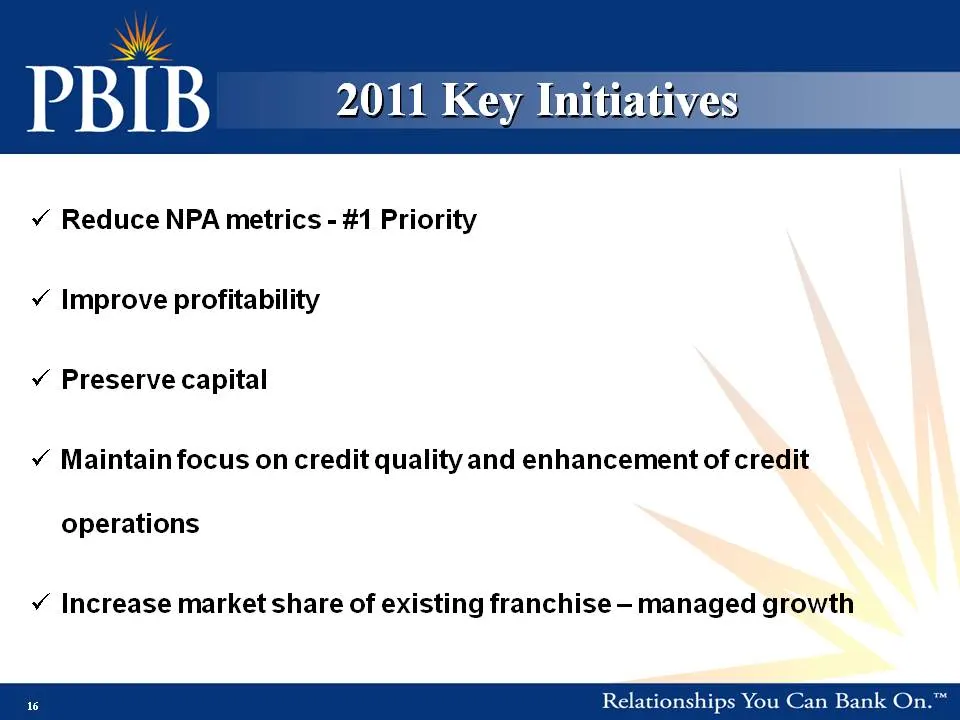
2011 Key Initiatives Reduce NPA metrics - #1 Priority Improve profitability Preserve capital Maintain focus on credit quality and enhancement of credit operations Increase market share of existing franchise – managed growth 16
Slide 17: Addendum
WY PBIB Addendum Relationships You Can Bank On.™
Slide 18: Franchise History
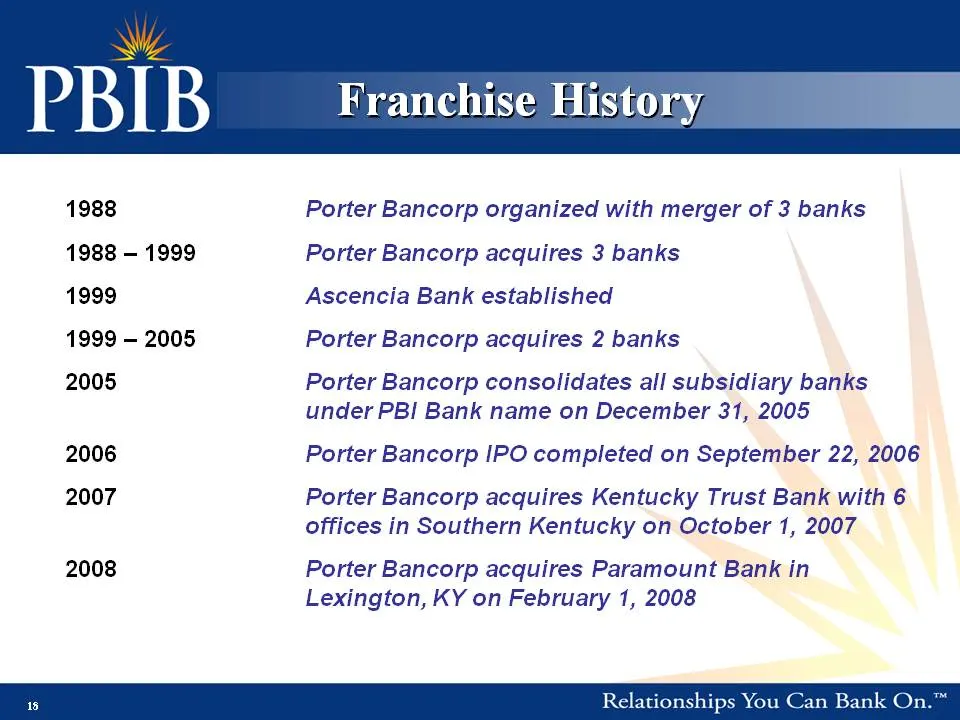
Franchise 1988 with merger 3 banks Porter Bancorp organized of 1988 – 1999 Porter Bancorp acquires 3 banks 1999 Ascencia Bank established 1999 – 2005 Porter Bancorp acquires 2 banks 2005 Porter Bancorp consolidates all subsidiary banks under PBI Bank on 31 name December 31, 2005 2006 Porter Bancorp
Slide 19: Peer Comparable Group
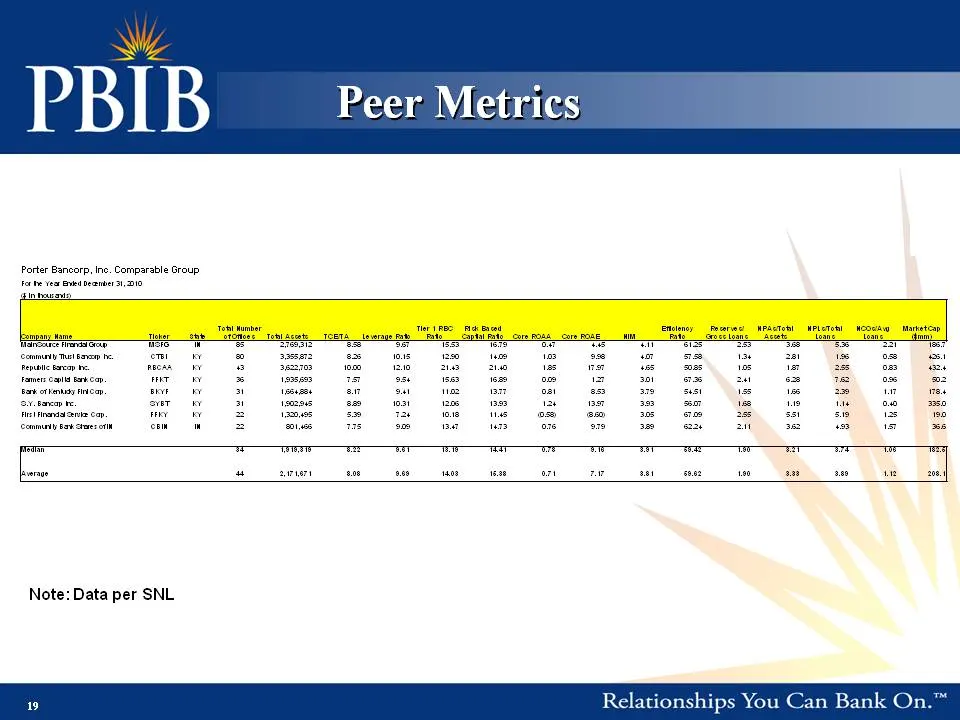
Peer Porter Bancorp, Inc. Comparable Group For the Year Ended December 31, 2010 ($ in thousands) Company Name Ticker State Total Number of Offices Total Assets TCE/TA Leverage Ratio Tier 1 RBC Ratio Risk Based Captial Ratio Core ROAA Core ROAE NIM Efficiency Ratio Reserves/ Gross Loans NPAs/Total As
Slide 20: Loan Mix
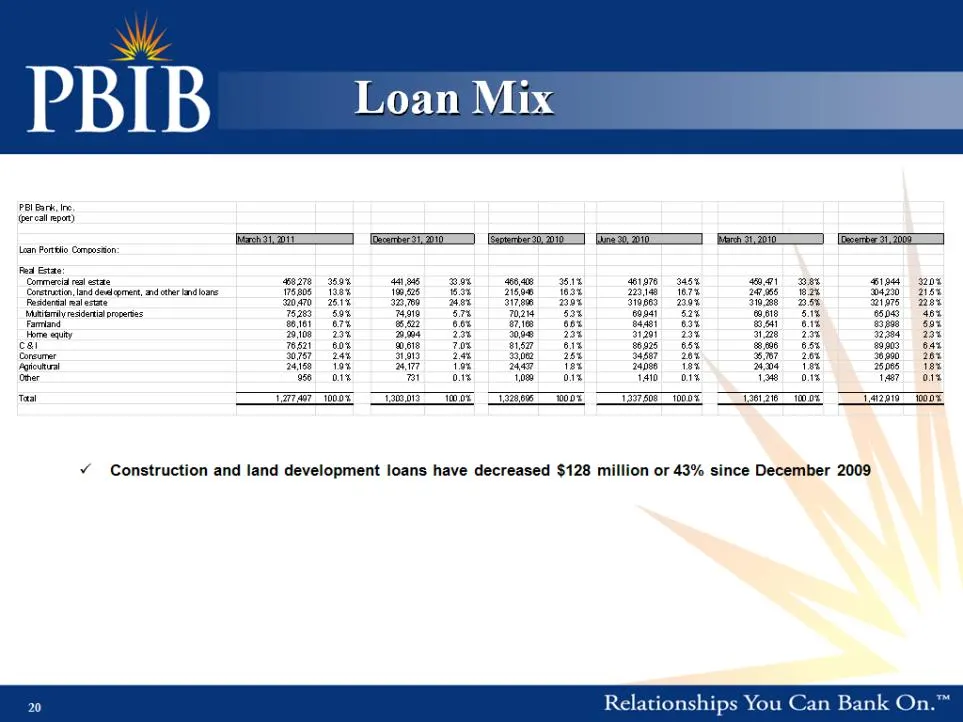
Loan Mix PBI Bank Inc Bank, Inc. (per call report) March 31, 2011 December 31, 2010 September 30, 2010 June 30, 2010 March 31, 2010 December 31, 2009 Loan Portfolio Composition: Real Estate: Commercial real estate 458,278 35.9% 441,845 33.9% 466,408 35.1% 461,976 34.5% 459,471 33.8% 451,944 32.0% Co
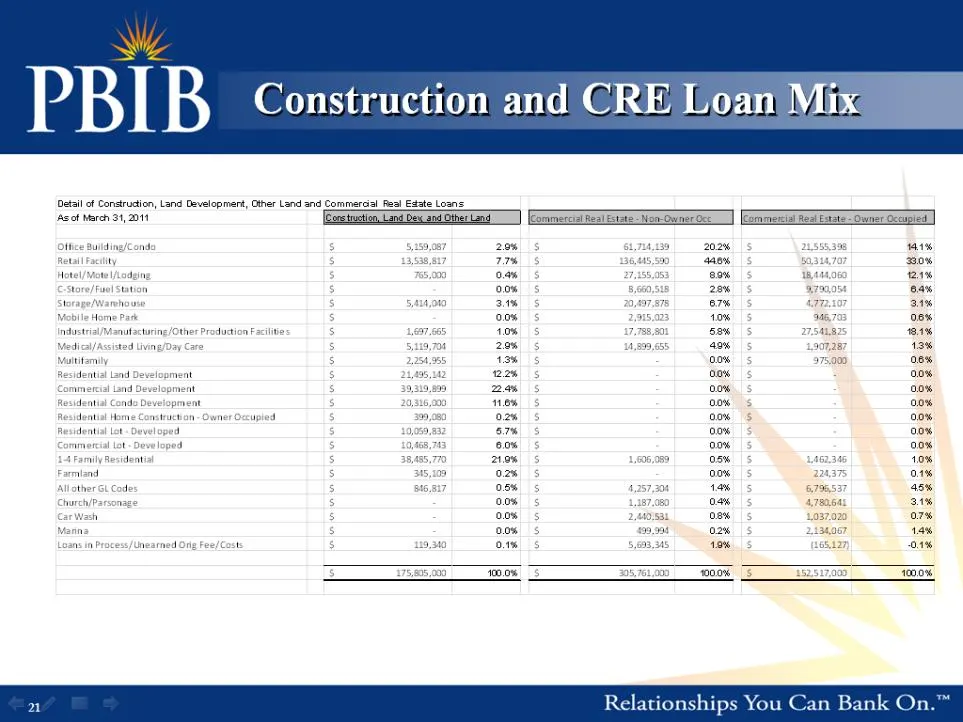
Slide 21: Construction and CRE Loan Mix
Construction and CRE Loan Mix Detail of Construction, Land Development, Other Land and Commercial Real Estate Loans etaAs of March 31, 2011 Construction, Land Dev, and Other Land Commercial Real Estate ‐ Non‐Owner Occ Commercial Real Estate ‐ Owner Occupied Office Building/Condo 5,159,087 $ 2.9% 61,
Source: SEC EDGAR · 8-K filed Jun 8, 2011
More decks from Limestone Bancorp Inc
 Q4 2022 Earnings Presentation44 slides · Feb 10, 2023
 Q3 2022 Earnings Presentation44 slides · Nov 1, 2022
 Merger or Acquisition (October 2022)15 slides · Oct 25, 2022
 Q2 2022 Earnings Presentation20 slides · Jul 29, 2022
 Q1 2022 Earnings Presentation20 slides · Apr 29, 2022
 Q2 2021 Earnings Presentation20 slides · Jul 21, 2021