Flutter Entertainment plc · NYSE:FLUT
Flutter Entertainment — Betfair Group — H1 FY2013 Earnings Presentation
34 slides from Flutter Entertainment's earnings presentation, Dec 13, 2012
Slide 1: FY13 Interim Results
FY13 INTERIM RESULTS 13 December 2012

Slide 2: Business Review
BUSINESS REVIEW a* betfair
Slide 3: Betfair Strengths
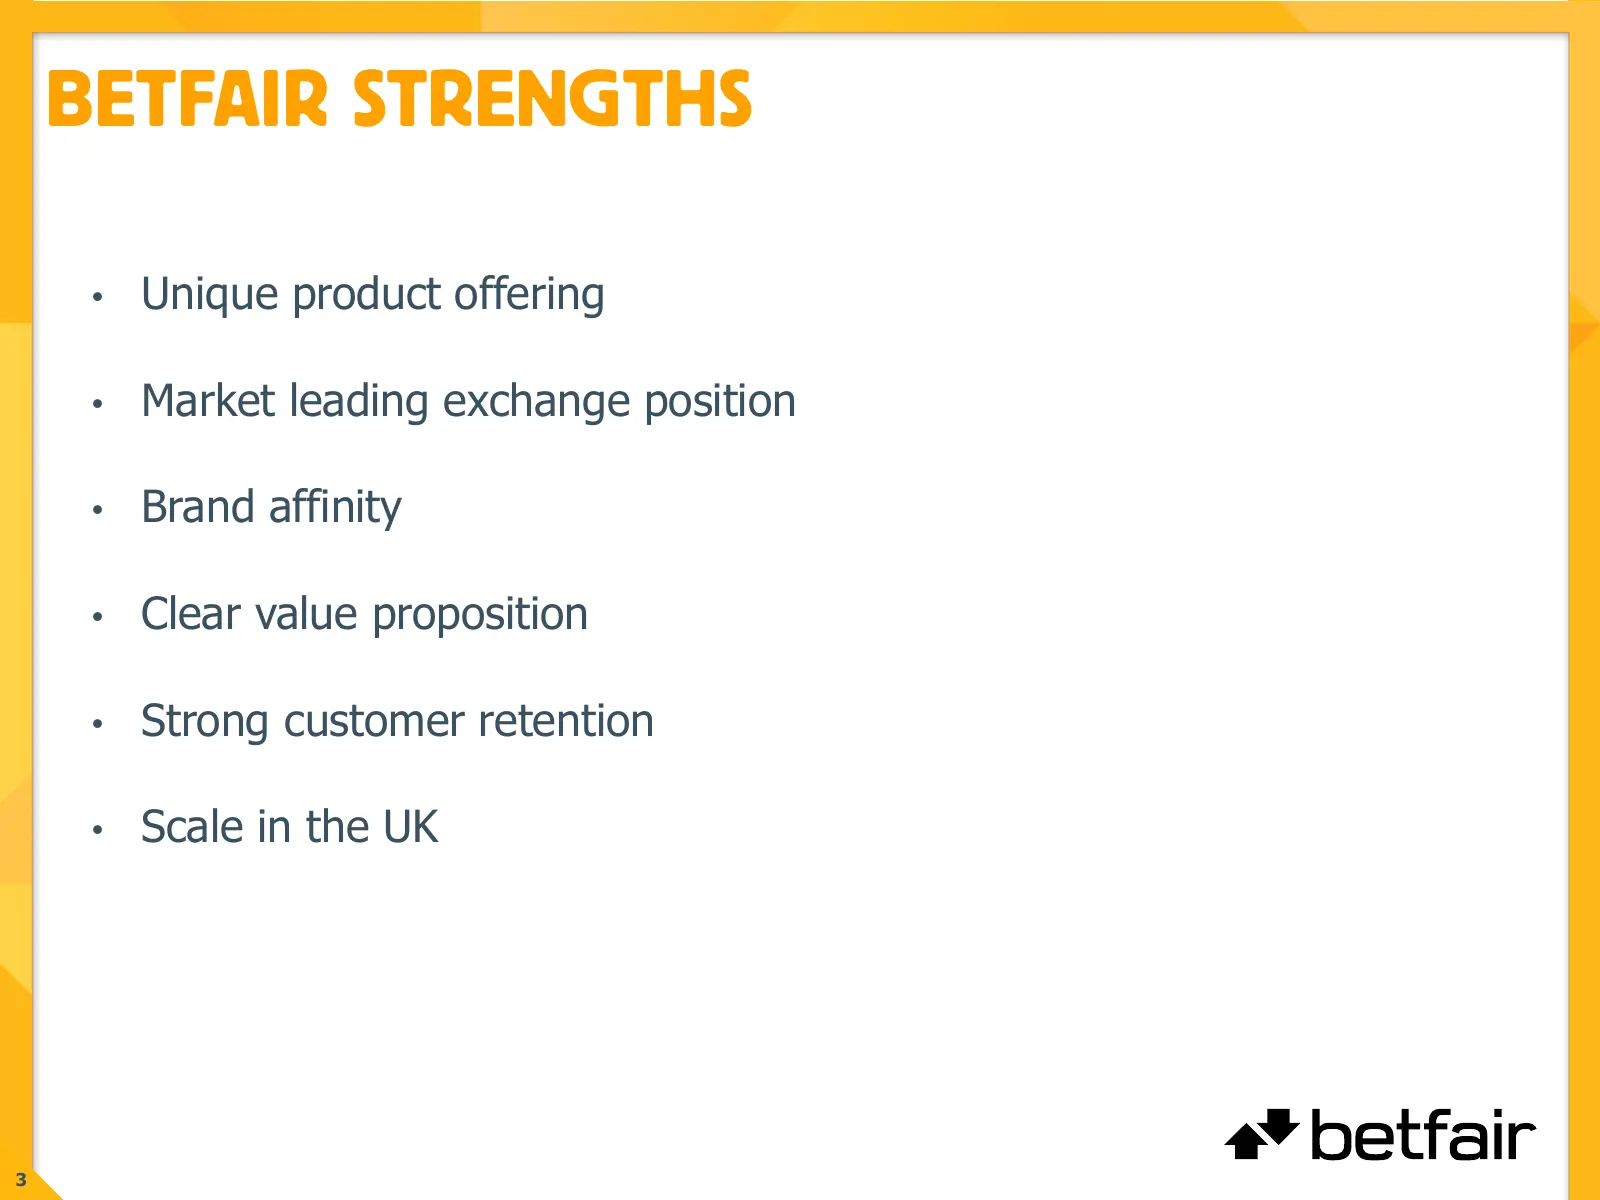
BETFAIR STRENGTHS • Unique product offering • Market leading exchange position • Brand affinity • Clear value proposition • Strong customer retention • Scale in the UK 3
Slide 4: Losing market share
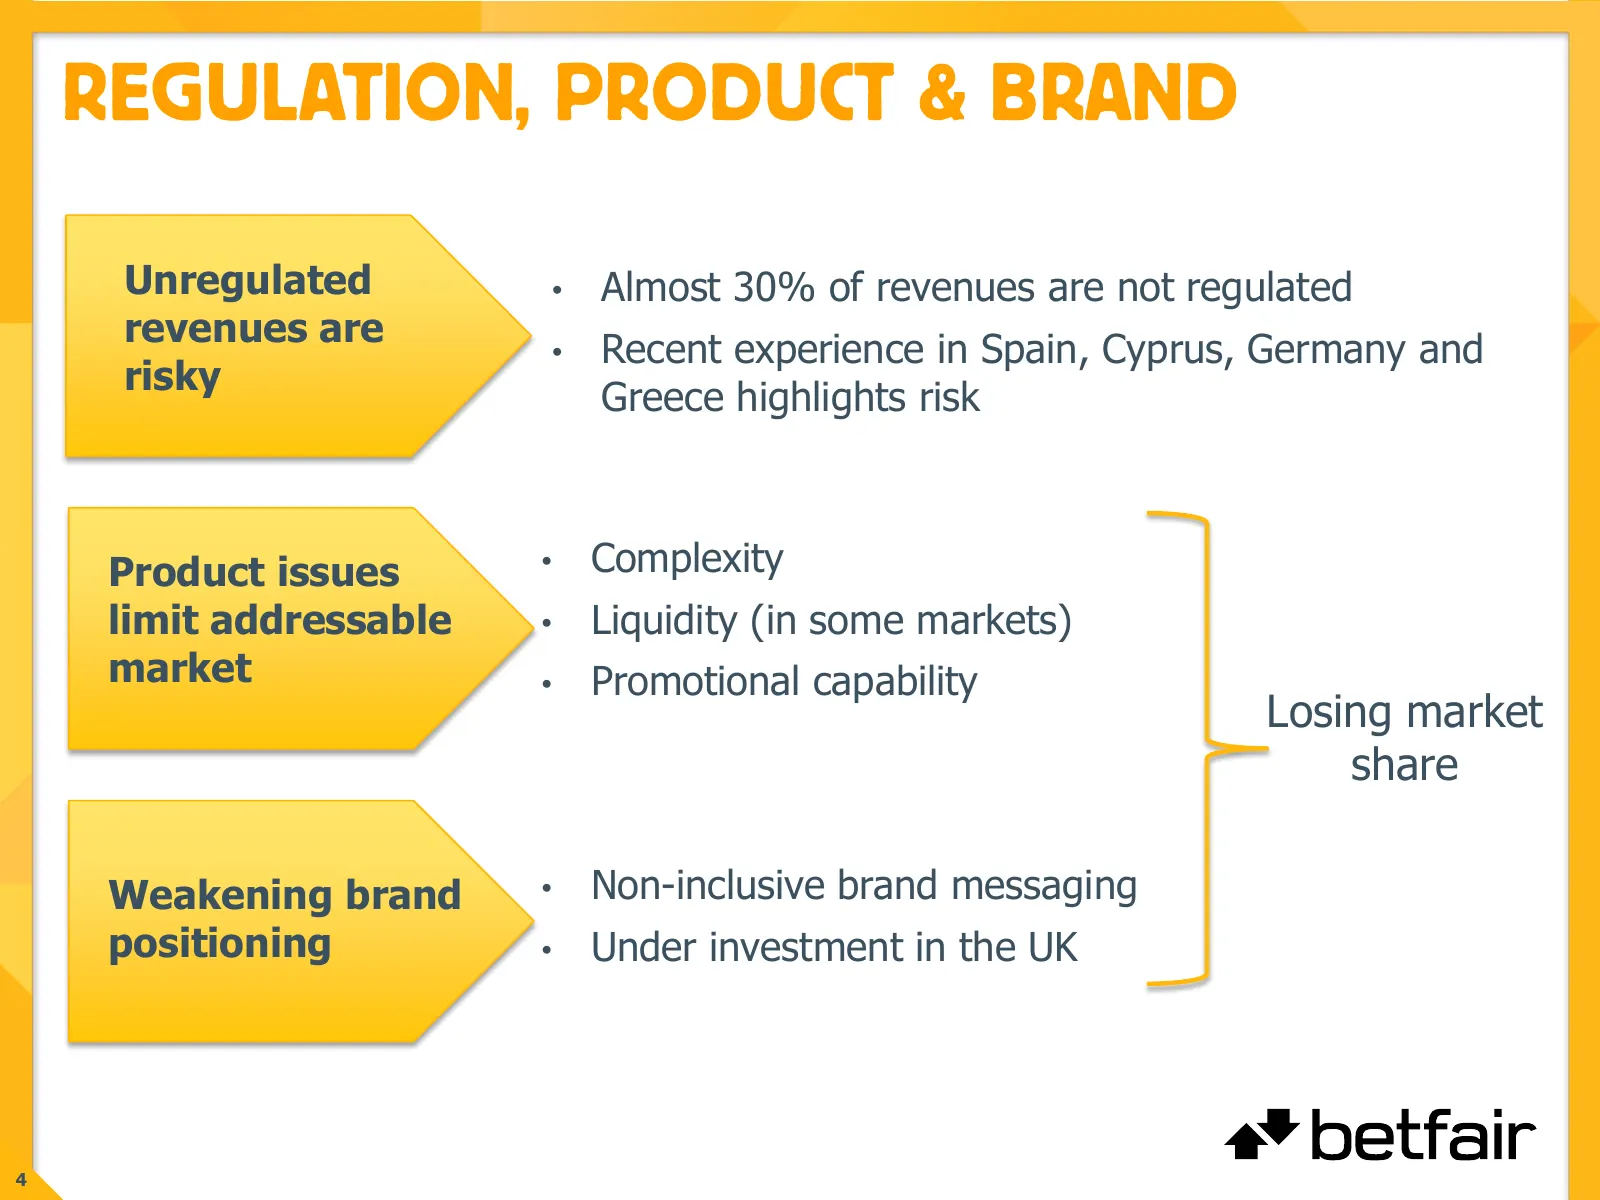
Unregulated • Almost 30% of revenues are not regulated revenues are • Recent experience in Spain, Cyprus, Germany and risky Greece highlights risk Product issues • Complexity limit addressable • Liquidity (in some markets) market • Promotional capability Losing market share Weakening brand • Non-inc
Slide 5: People, culture & structure; high cost base
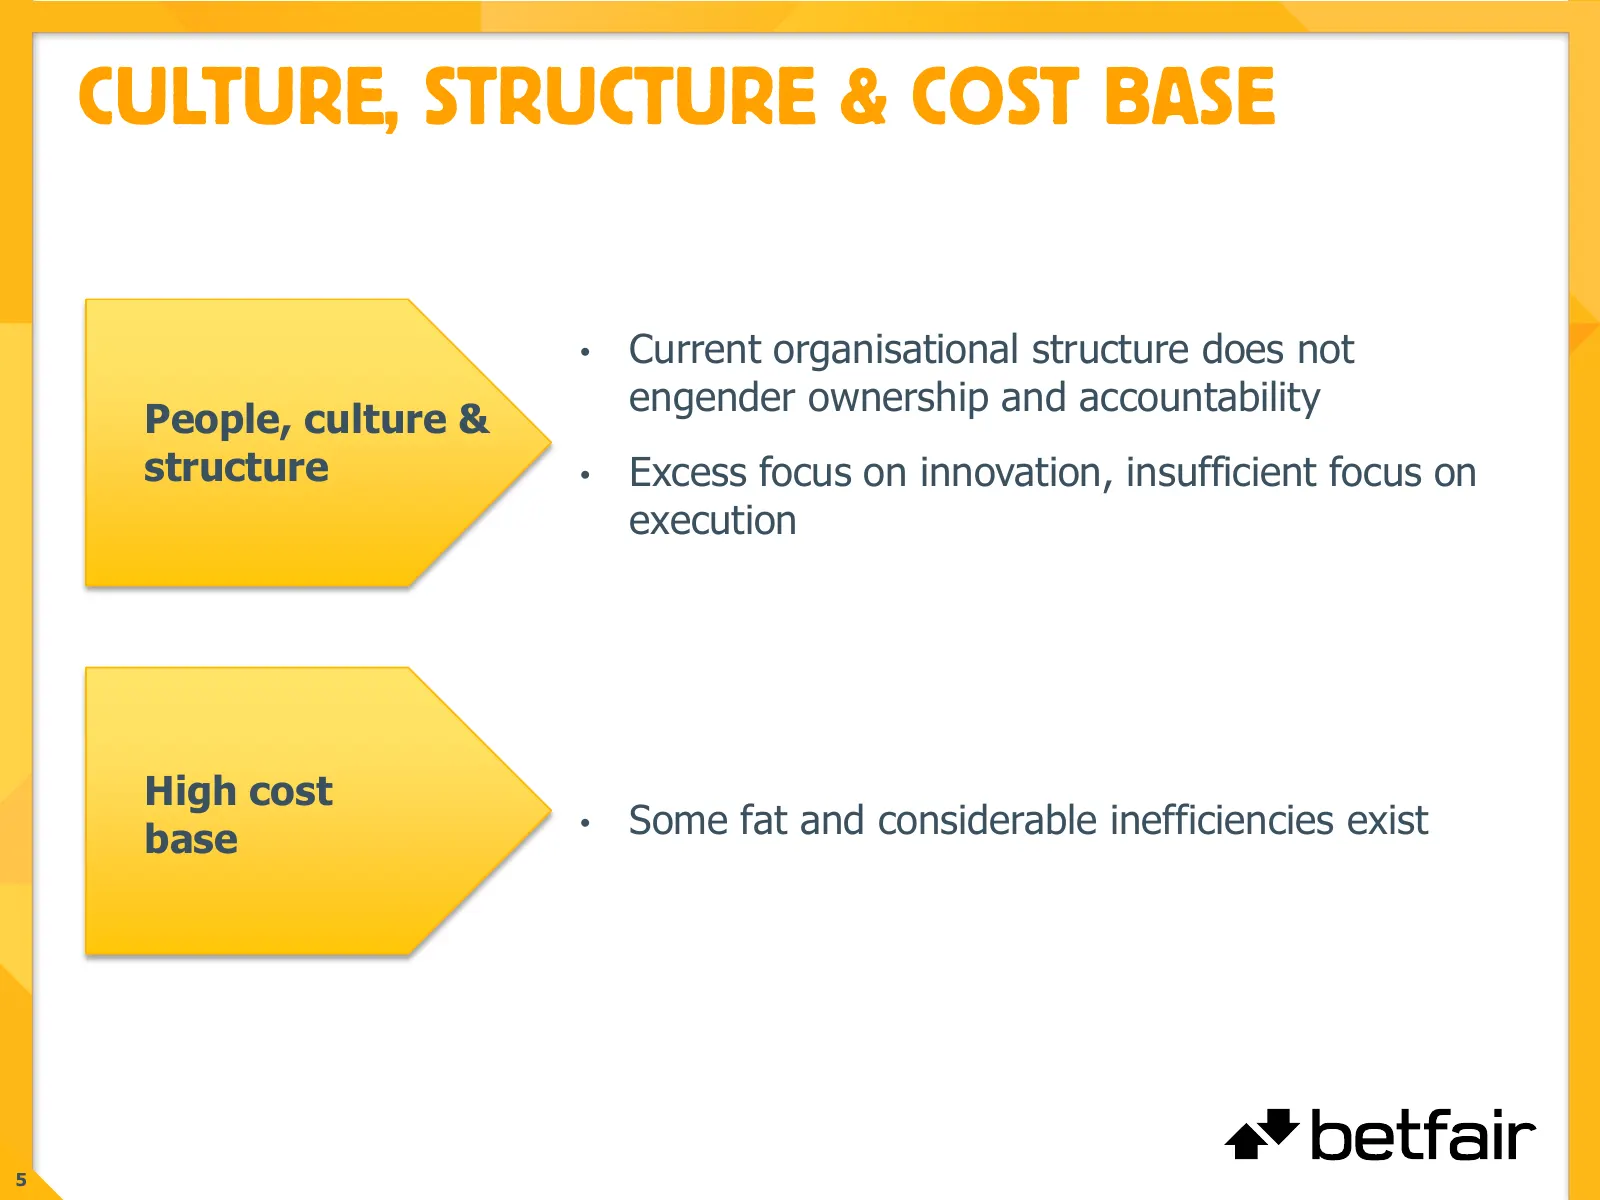
• Current organisational structure does not engender ownership and accountability People, culture & structure • Excess focus on innovation, insufficient focus on execution High cost base • Some fat and considerable inefficiencies exist 5

Slide 6: How to Win
HOW TO WIN a* betfair
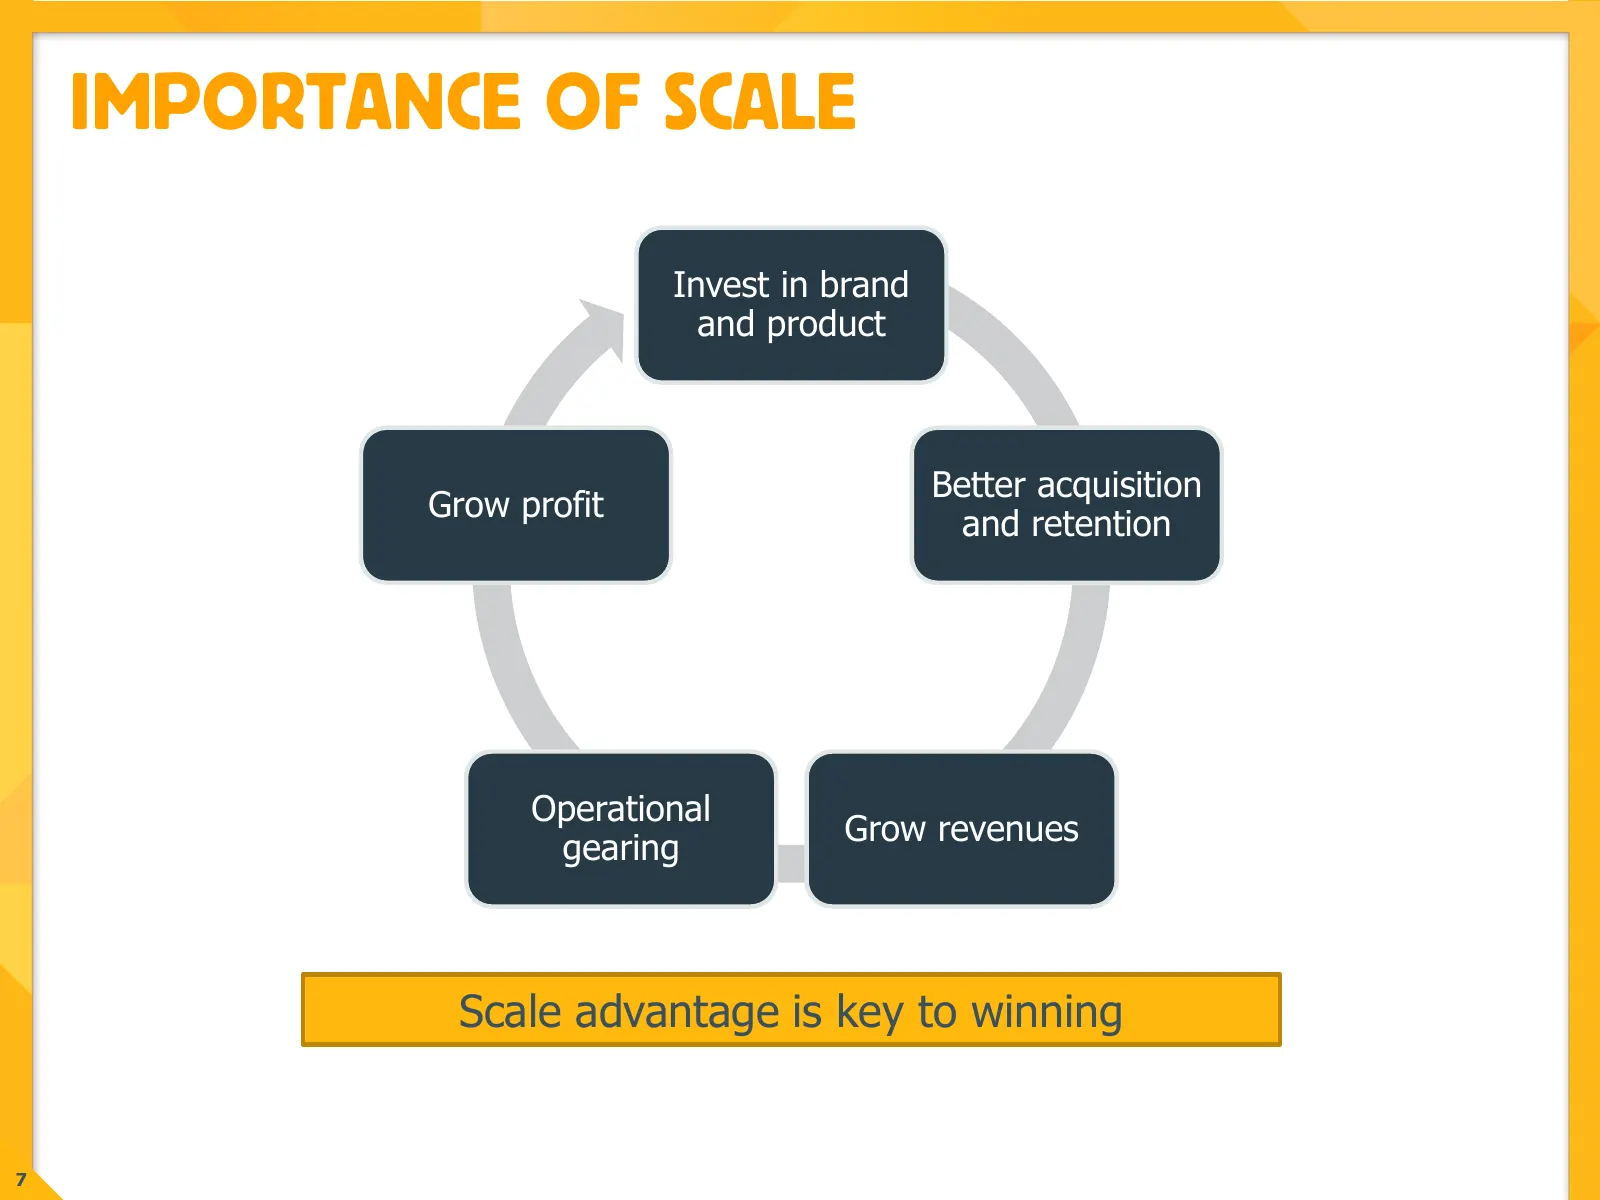
Slide 7: Importance of Scale
IMPORTANCE OF SCALE Invest in brand and product Better acquisition Grow profit and retention Operational Grow revenues gearing Scale advantage is key to winning 7
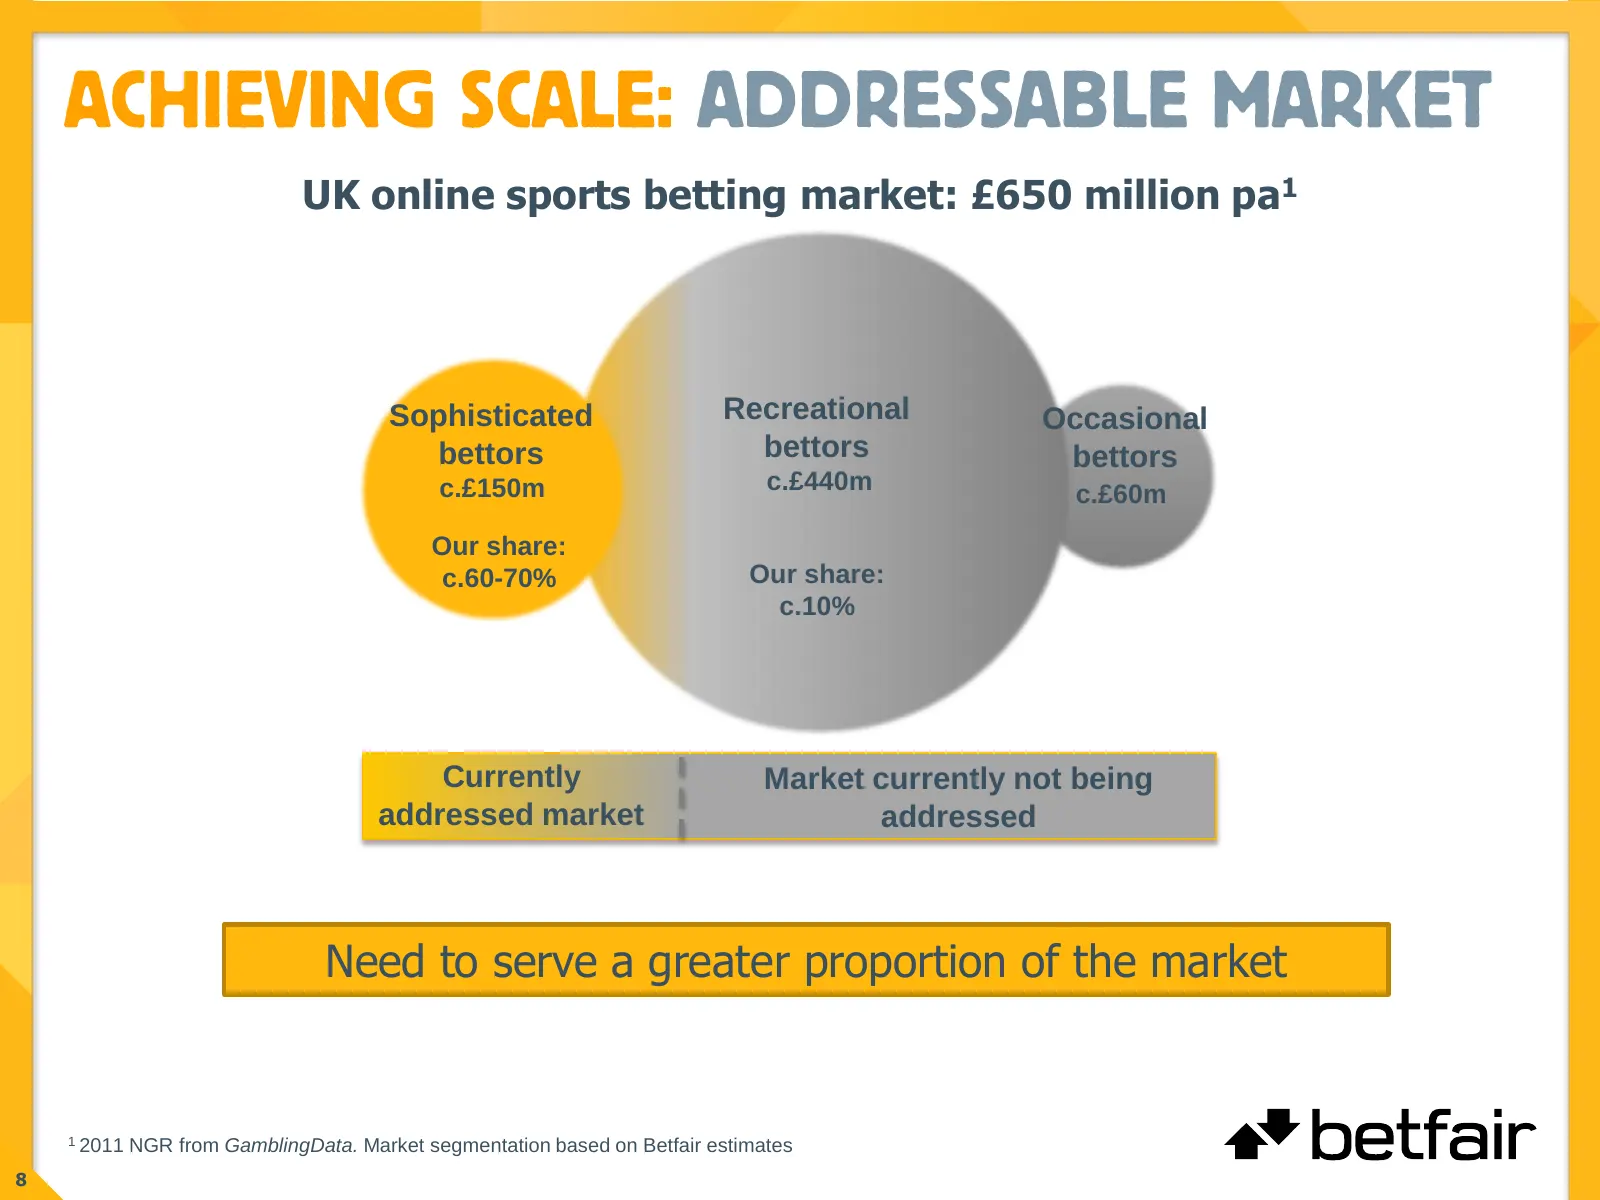
Slide 8: Need to serve a greater proportion of the market
UK online sports betting market: £650 million pa1 Sophisticated Recreational Occasional bettors bettors bettors c.£150m c.£440m c.£60m Our share: c.60-70% Our share: c.10% Currently Market currently not being addressed market addressed Need to serve a greater proportion of the market 1 2011 NGR from

Slide 9: Our Plan
OUR PLAN a* betfair
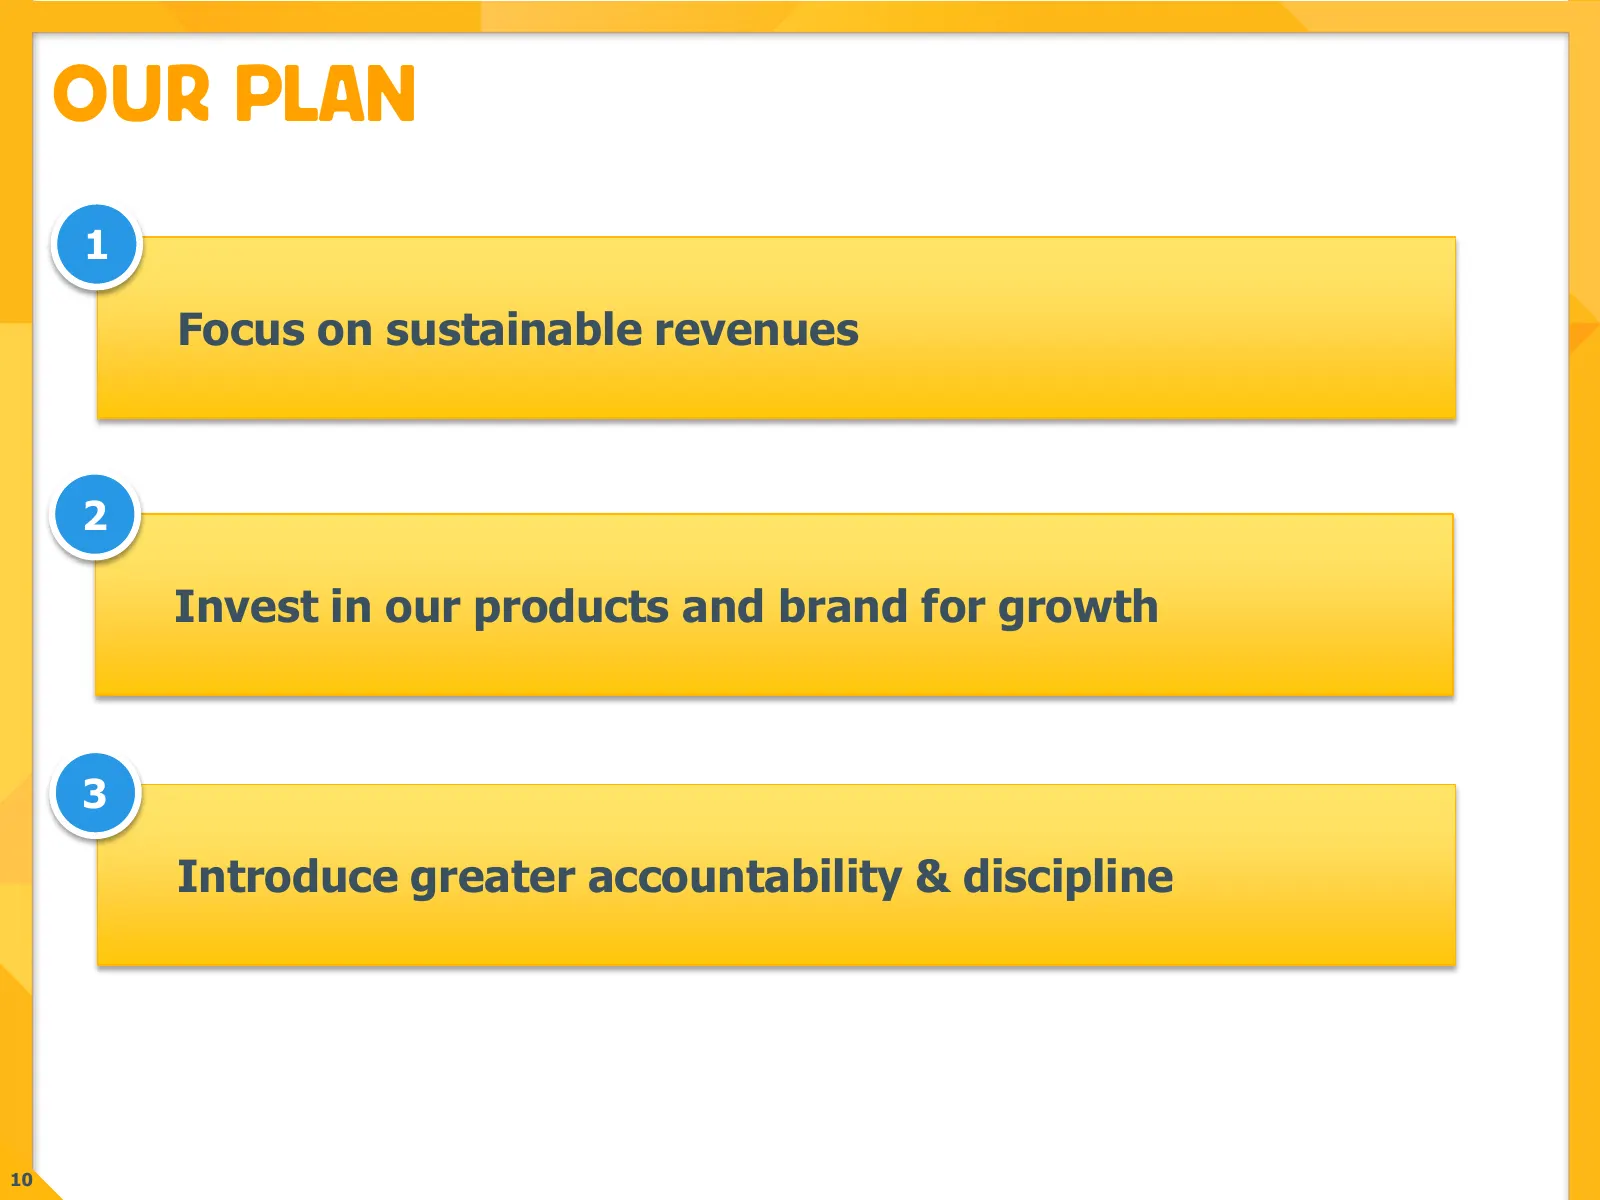
Slide 10: Our Plan
OUR PLAN 1 Focus on sustainable revenues 2 Invest in our products and brand for growth 3 Introduce greater accountability & discipline 10
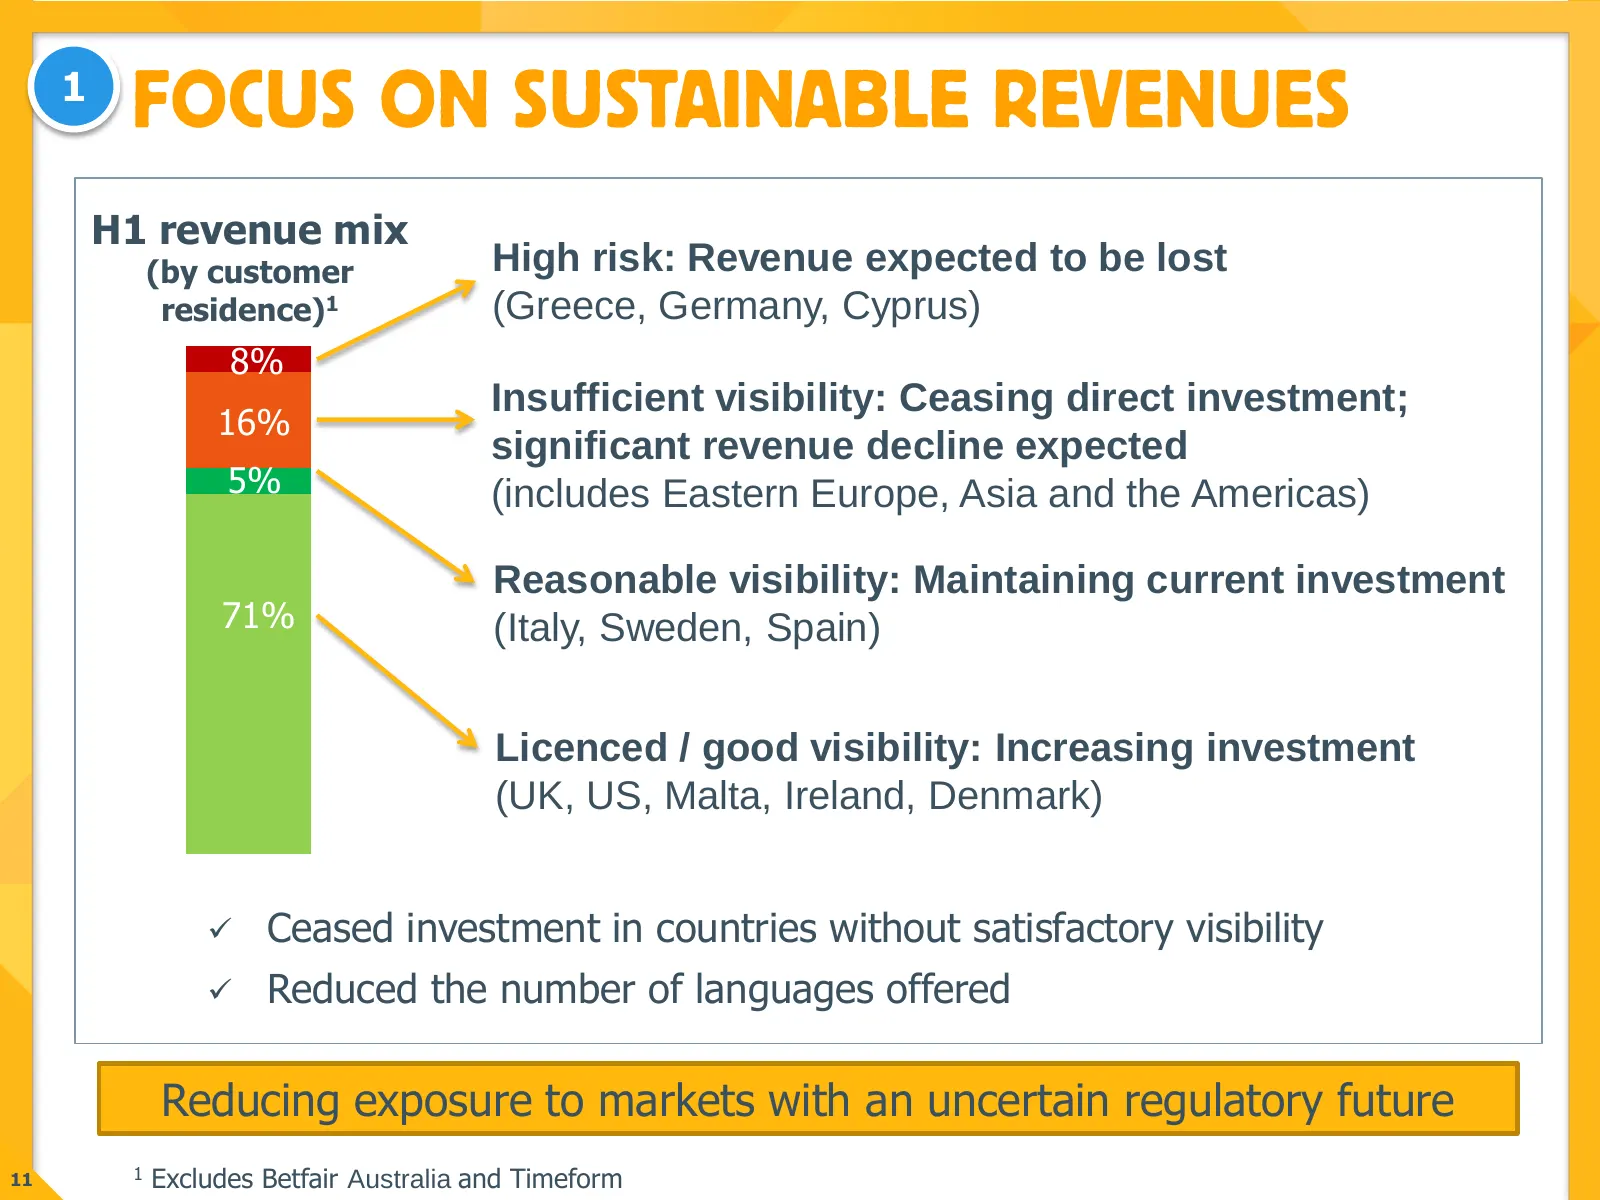
Slide 11: Reducing exposure to markets with an uncertain regulatory future
1 H1 revenue mix (by customer High risk: Revenue expected to be lost residence)1 (Greece, Germany, Cyprus) 8% Insufficient visibility: Ceasing direct investment; 16% significant revenue decline expected 5% (includes Eastern Europe, Asia and the Americas) Reasonable visibility: Maintaining current in
Slide 12: Products: Focus on customer needs
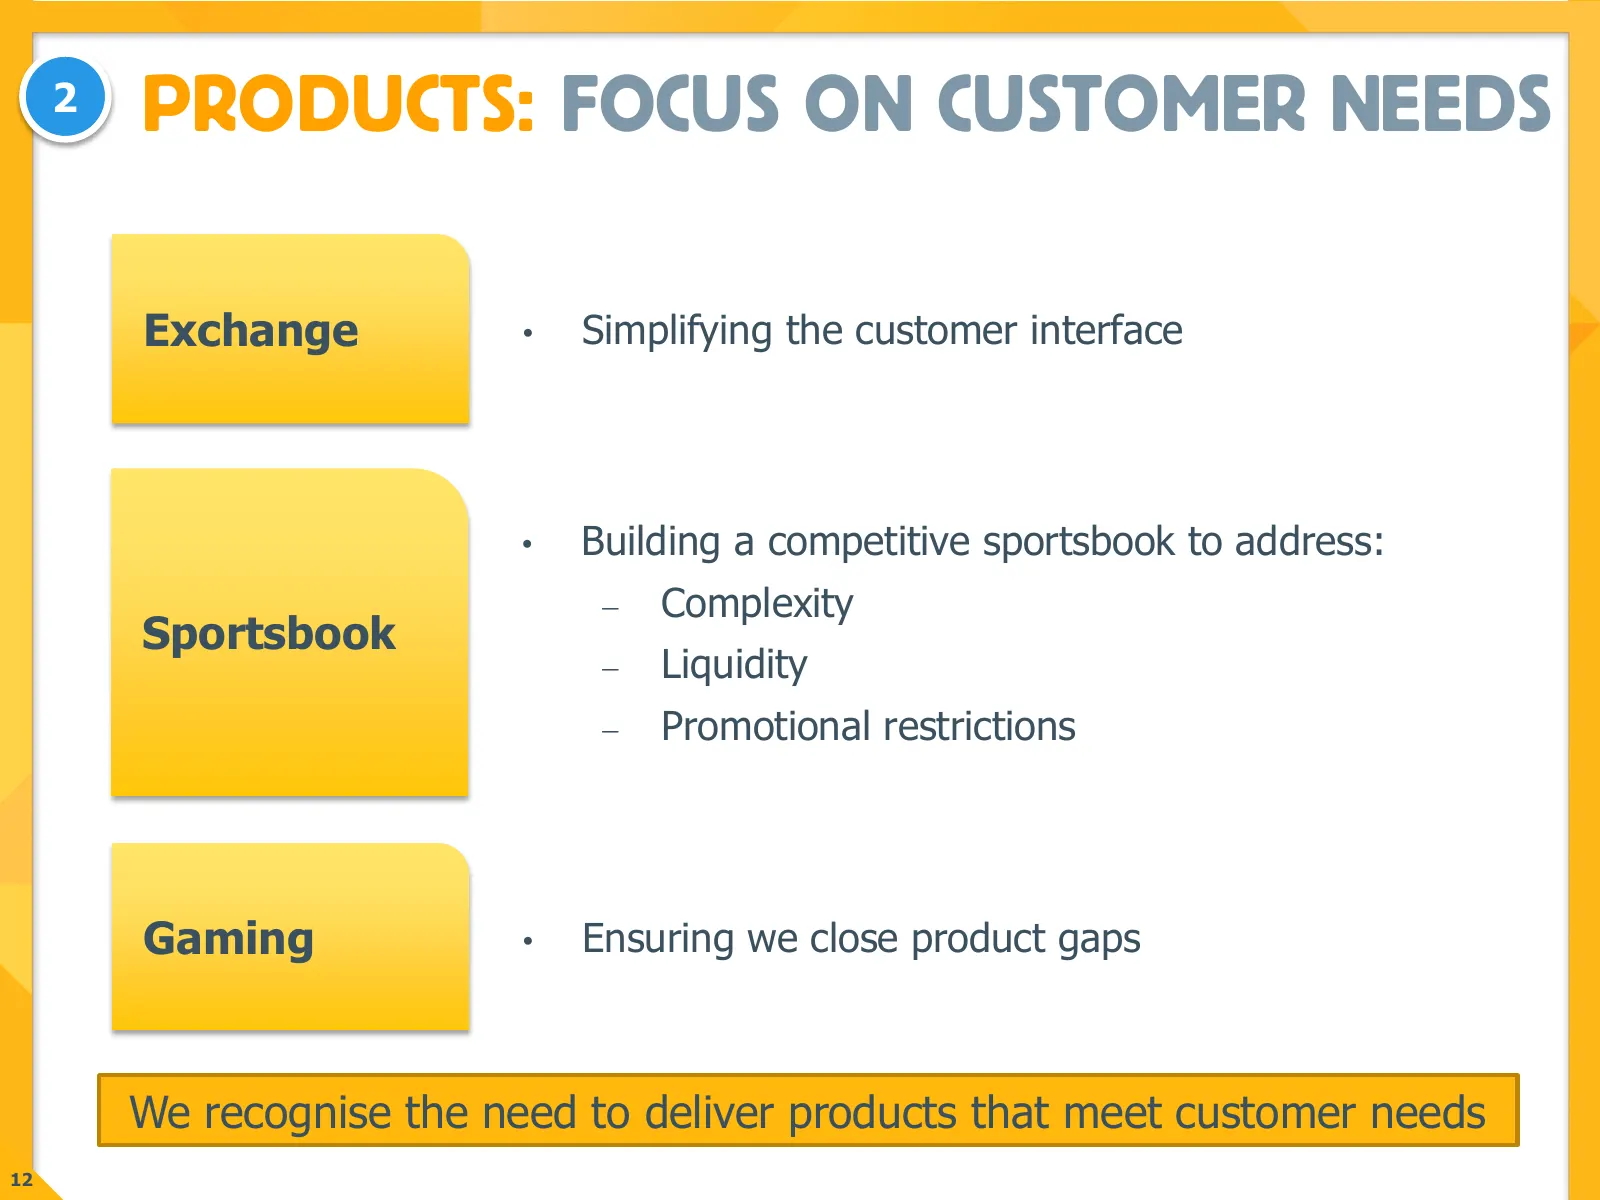
2 PRODUCTS: FOCUS ON CUSTOMER NEEDS Exchange • Simplifying the customer interface • Building a competitive sportsbook to address: Complexity Sportsbook Liquidity Promotional restrictions Gaming • Ensuring we close product gaps We recognise the need to deliver products that meet customer needs
Slide 13: Brand: Reposition and invest
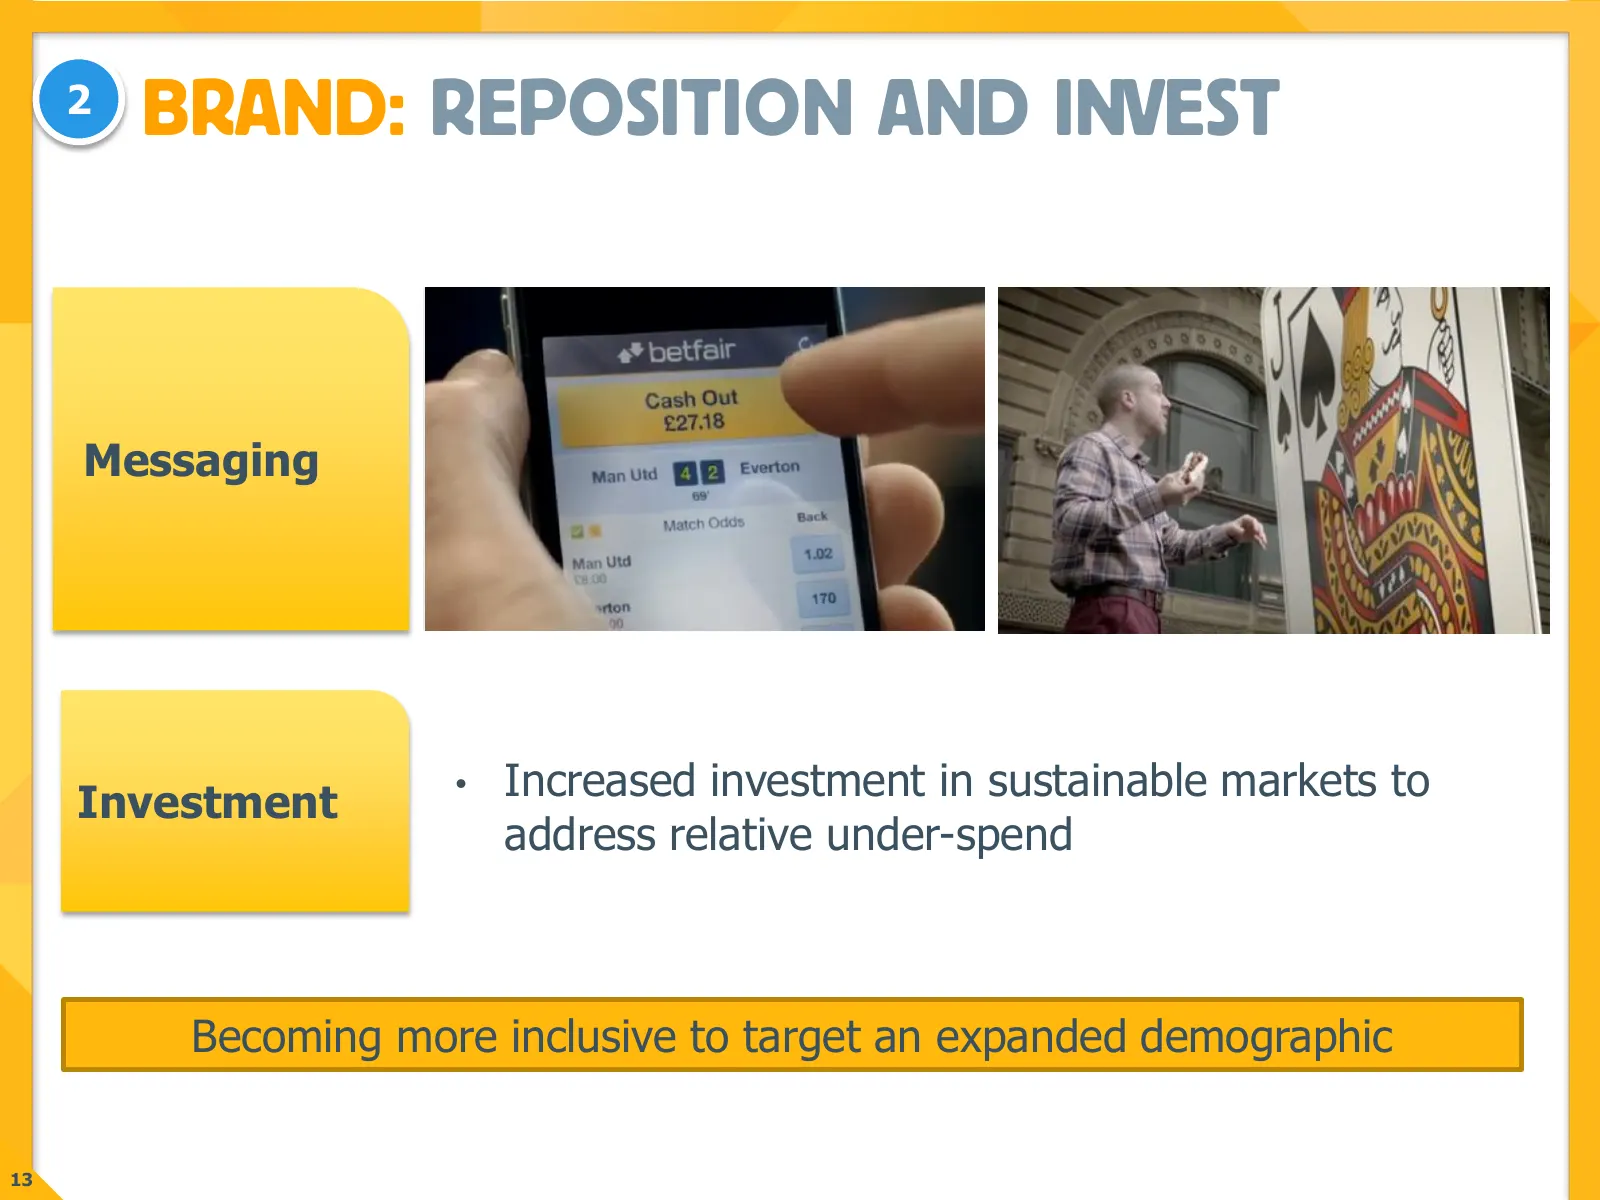
2 BRAND: REPOSITION AND INVEST Messaging Investment • Increased investment in sustainable markets to address relative under-spend Becoming more inclusive to target an expanded demographic 13
Slide 14: Accountability & Discipline: New organisational structure
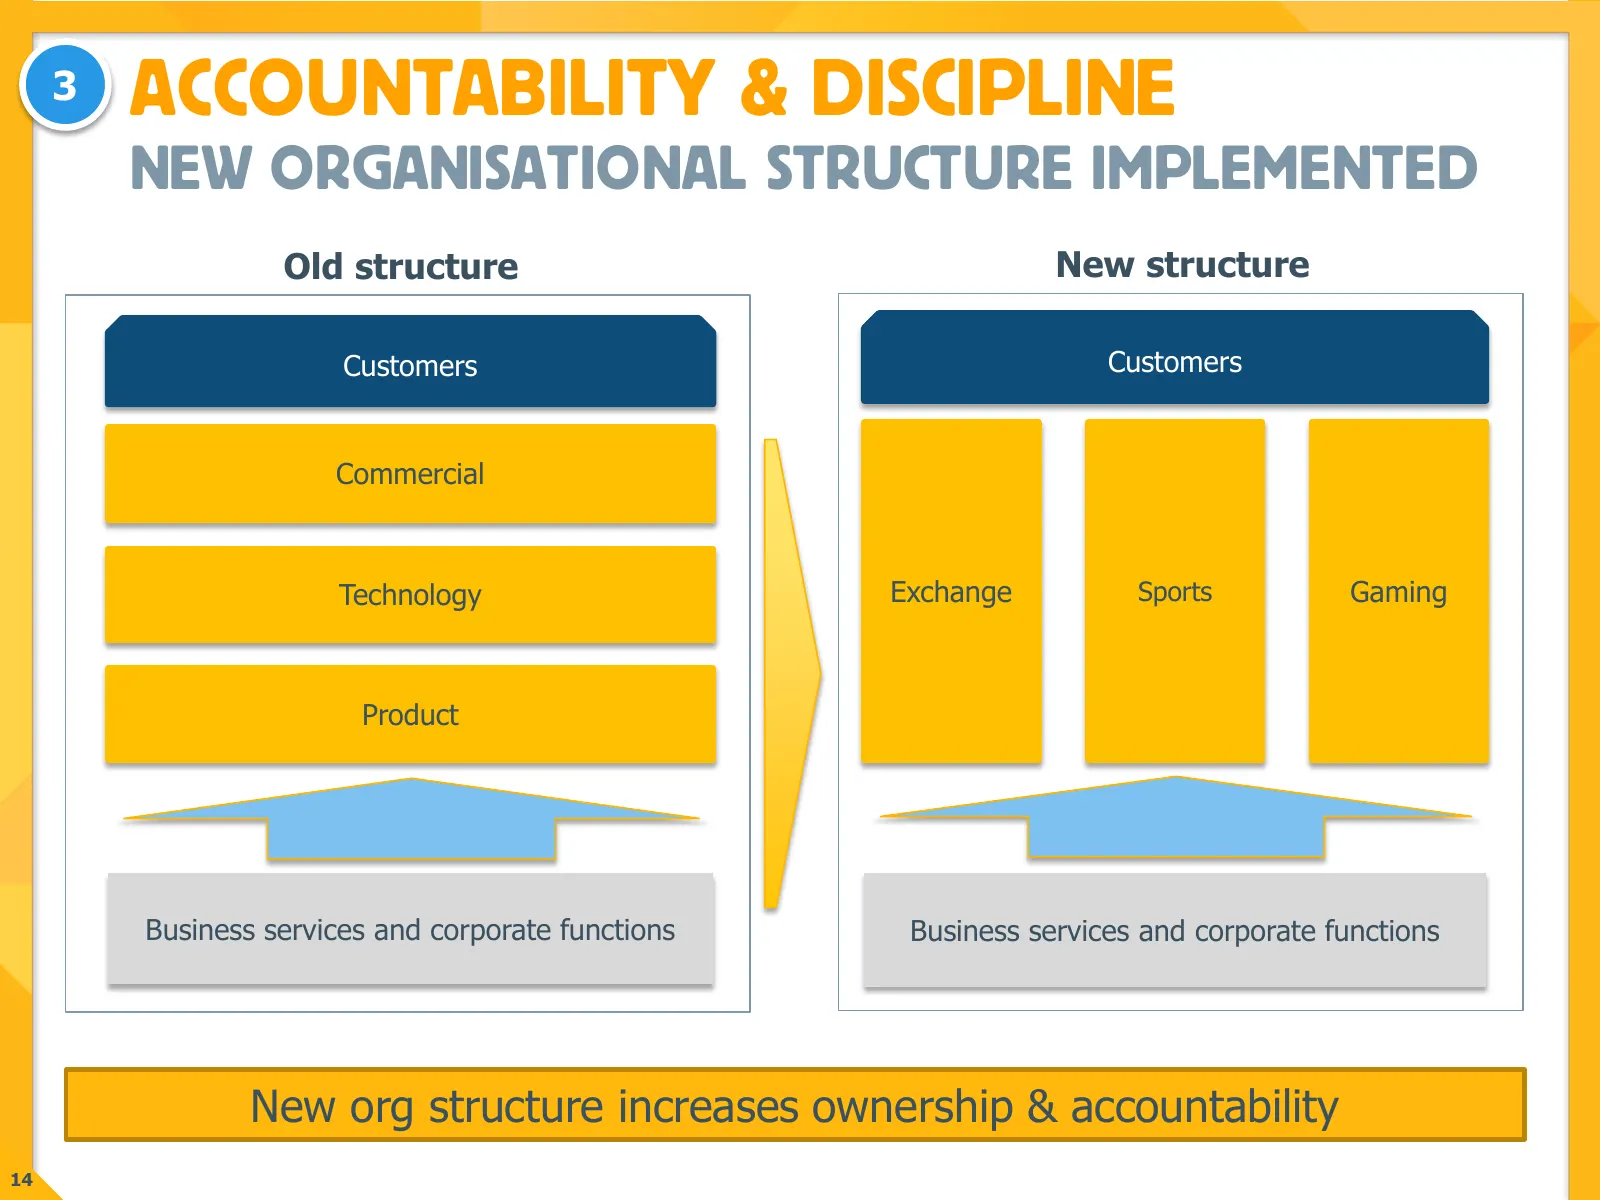
3 ACCOUNTABILITY & DISCIPLINE NEW ORGANISATIONAL STRUCTURE IMPLEMENTED Old structure New structure Customers Customers Commercial Technology Exchange Sports Gaming Product Business services and corporate functions Business services and corporate functions New org structure increases ownership & acco
Slide 15: Accountability & Discipline: New appointments / roles
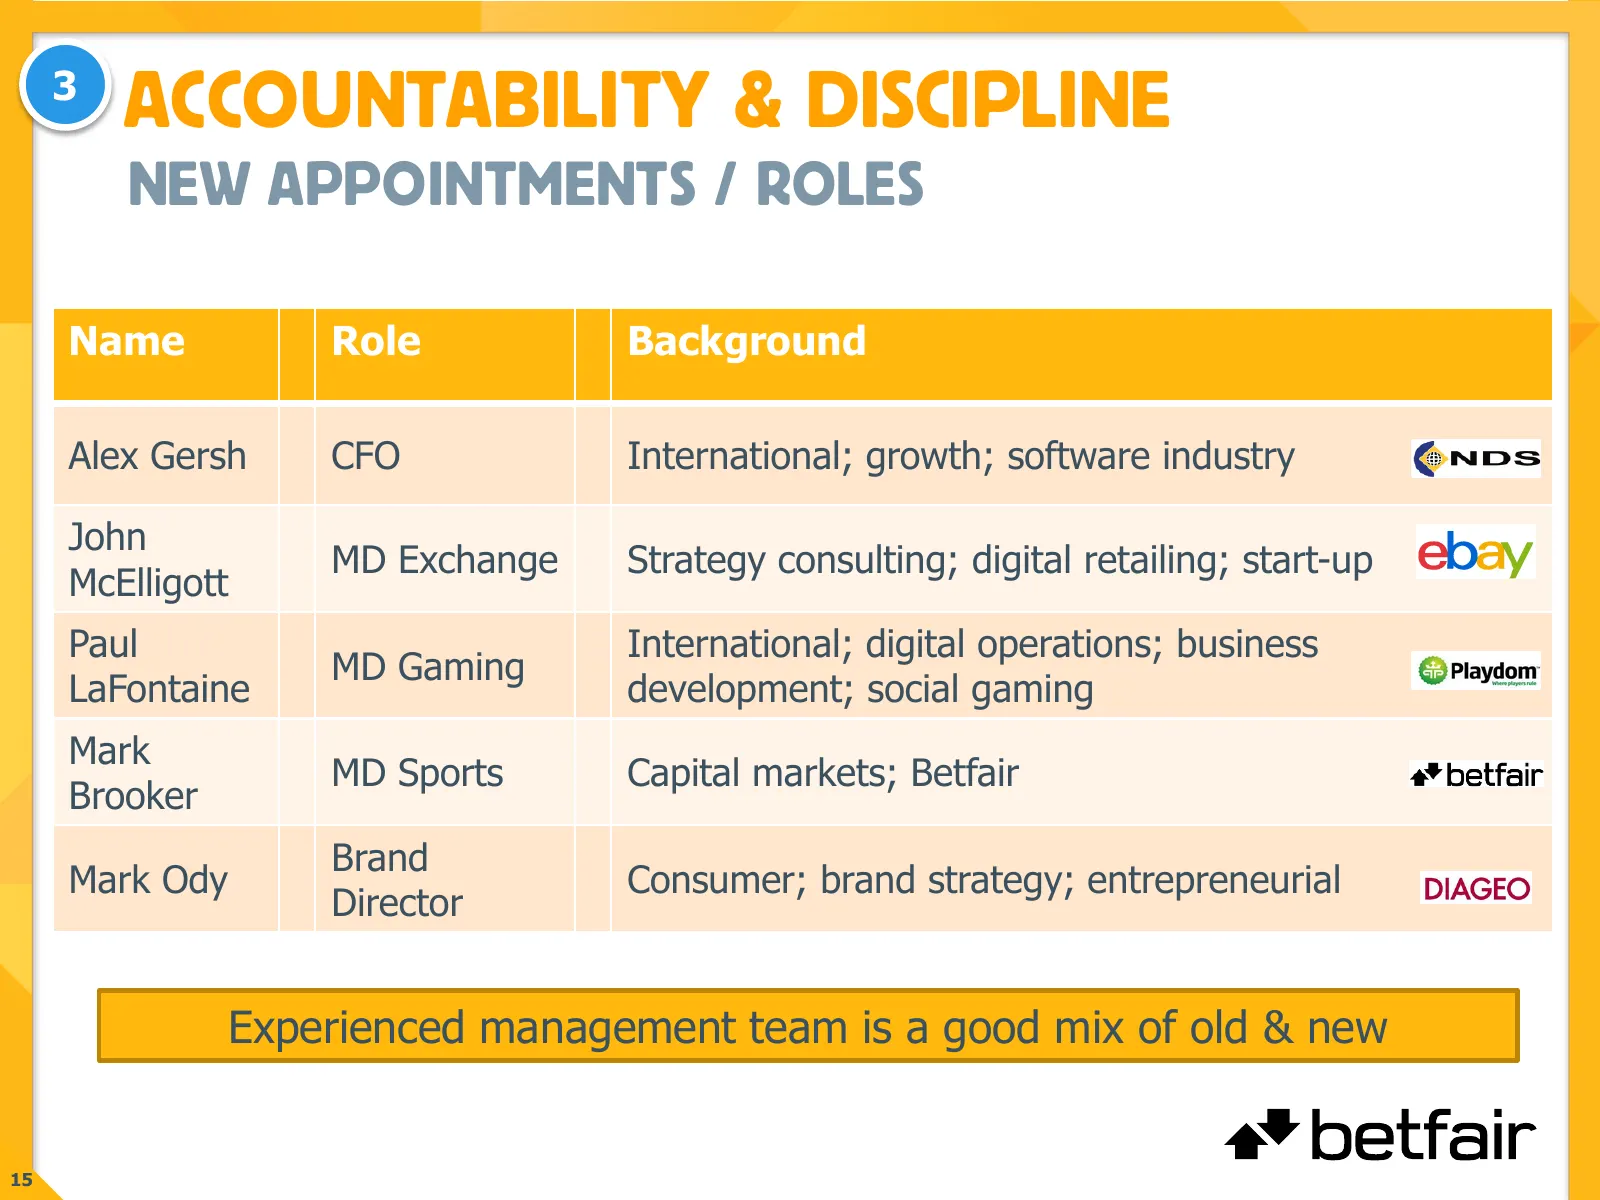
3 ACCOUNTABILITY & DISCIPLINE NEW APPOINTMENTS / ROLES Name Role Background Alex Gersh CFO International; growth; software industry John MD Exchange Strategy consulting; digital retailing; start-up McElligott Paul International; digital operations; business MD Gaming LaFontaine development; social g
Slide 16: Accountability & Discipline: Cost discipline
3 ACCOUNTABILITY & DISCIPLINE COST DISCIPLINE • Detailed review of the cost base undertaken • Identified c.£20 million of cost savings so far Delivery expected within 2 years Cost estimated at <1 times expected savings Savings will fund strategic plans and increased process efficiency will speed
Slide 17: Accountability & Discipline: Investment discipline
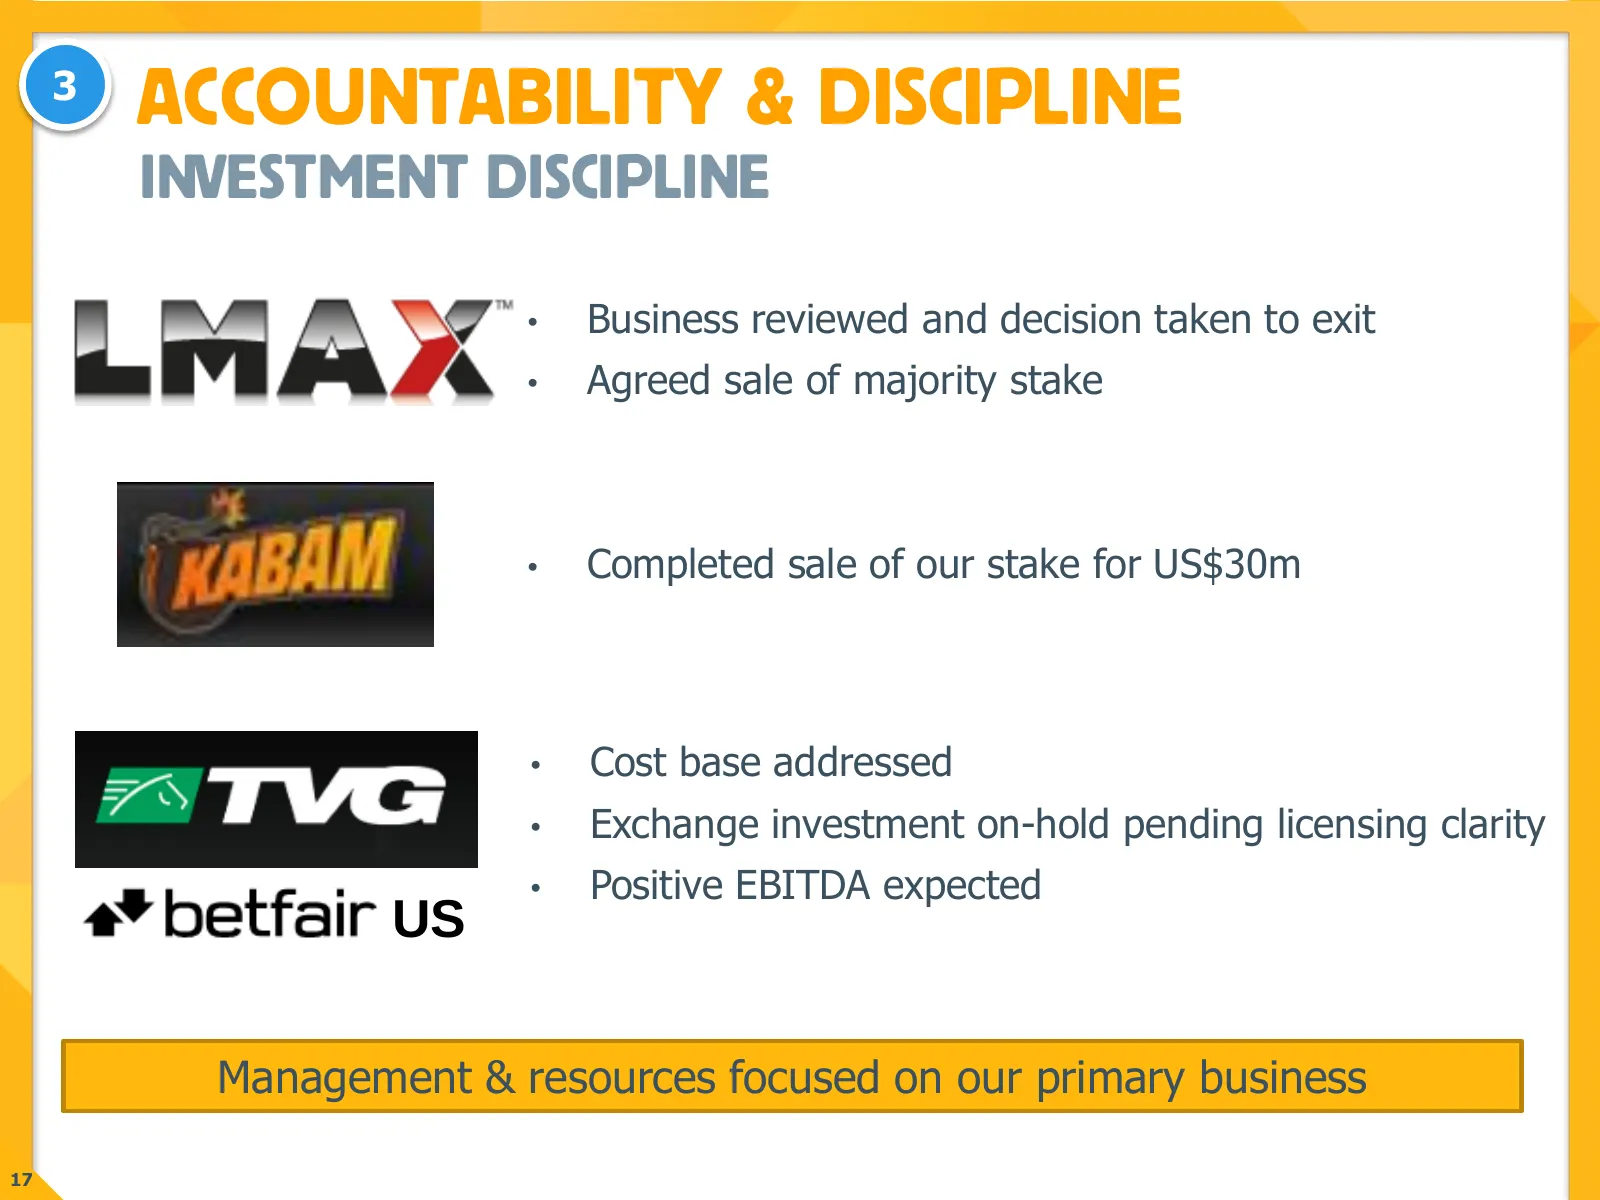
3 ACCOUNTABILITY & DISCIPLINE INVESTMENT DISCIPLINE • Business reviewed and decision taken to exit • Agreed sale of majority stake • Completed sale of our stake for US$30m • Cost base addressed • Exchange investment on-hold pending licensing clarity • Positive EBITDA expected US Management & resourc
Slide 18: Progress
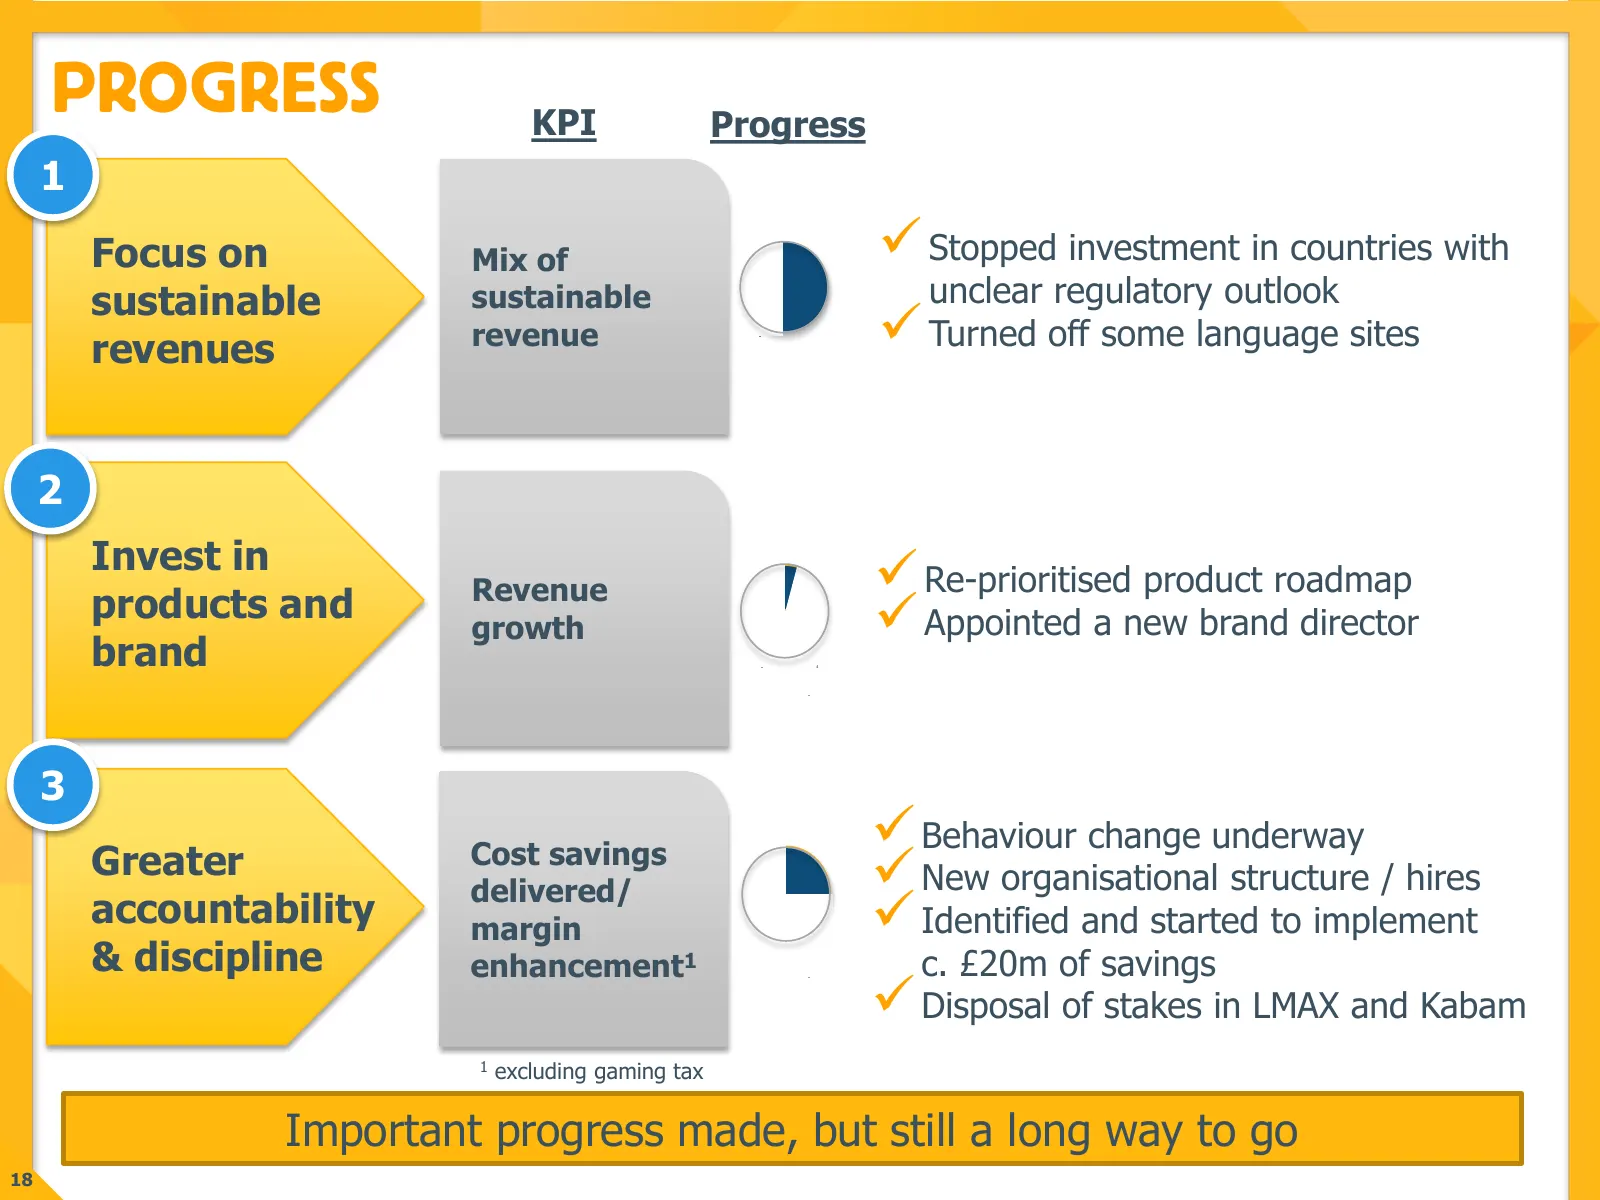
PROGRESS KPI Progress 1 Focus on Mix of Stopped investment in countries with sustainable sustainable unclear regulatory outlook revenues revenue Turned off some language sites 2 Invest in products and Revenue Re-prioritised product roadmap growth Appointed a new brand director brand 3 Greate

Slide 19: Financial Results
FINANCIAL RESULTS a* betfair
Slide 20: Financial Reporting Update
FINANCIAL REPORTING UPDATE • Improving quality of reported earnings – Reporting focus will be Group performance, not Core – Share based payments will be included in EBITDA – Applying a more conservative approach to capitalisation of development expenditure • Balance sheet review – Goodwill & other i
Slide 21: H1 Summary
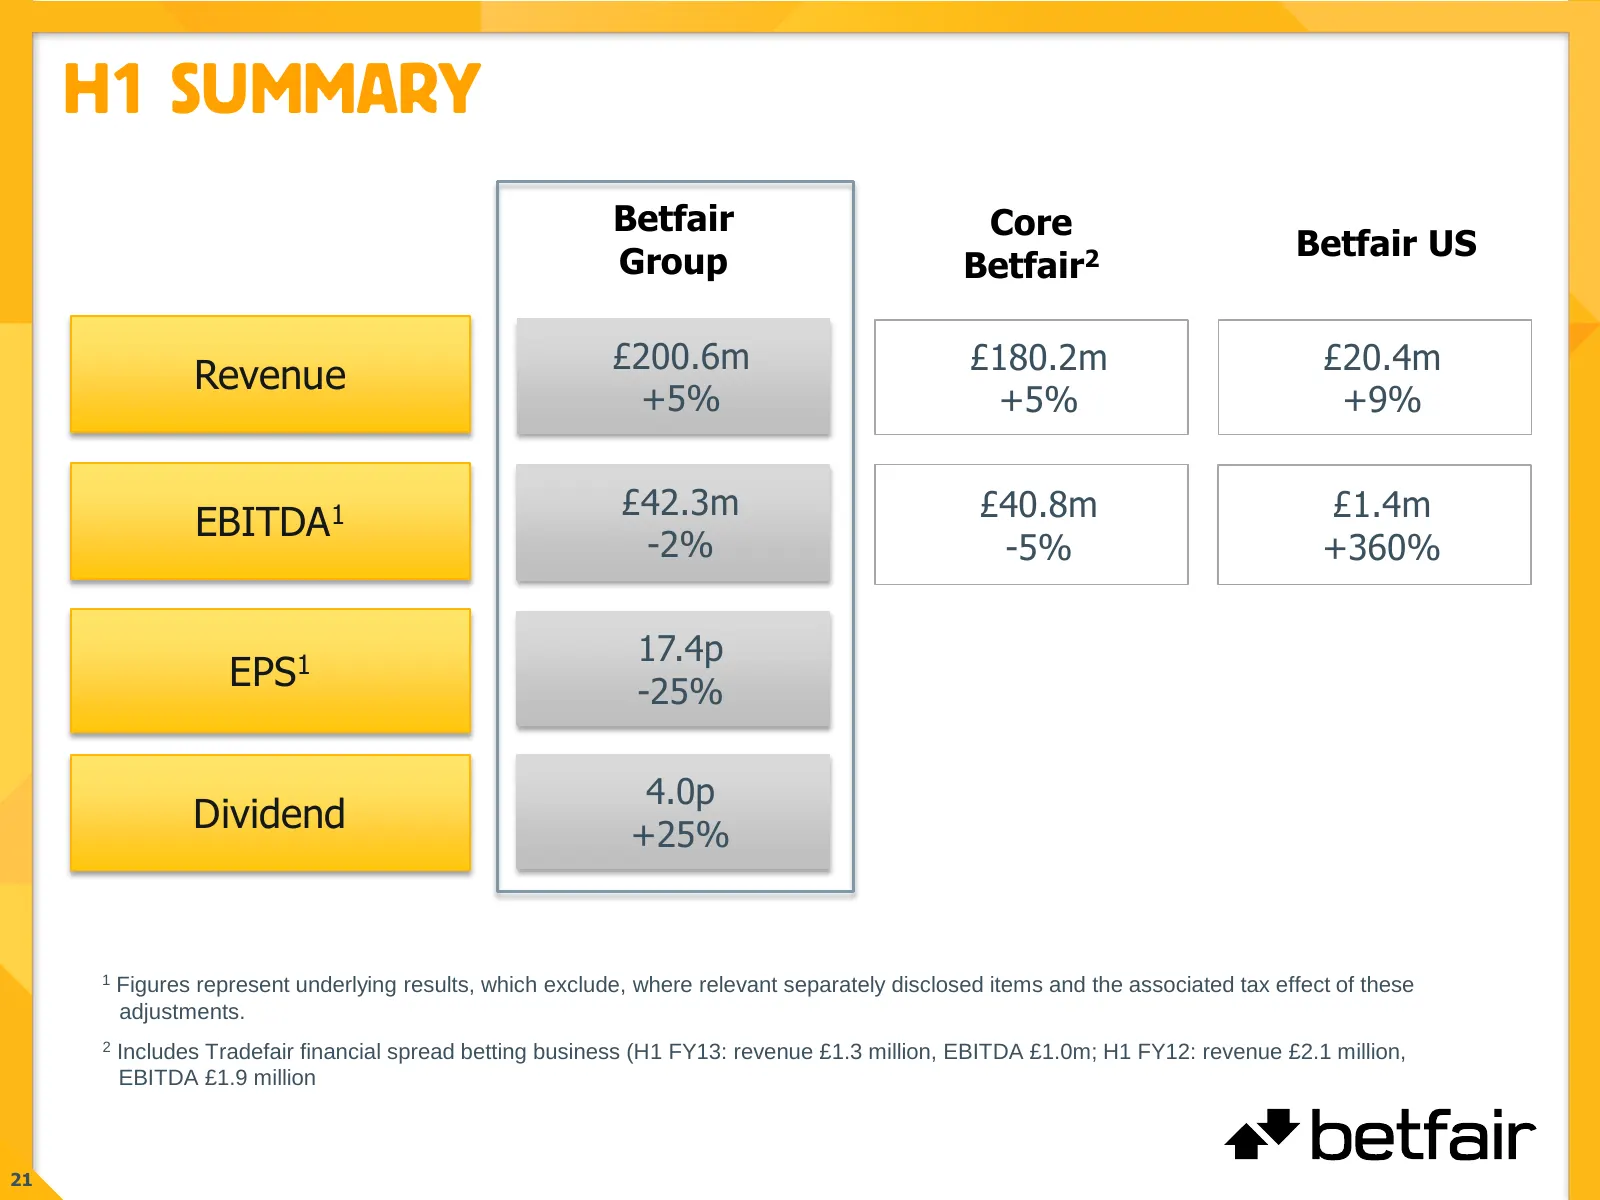
H1 SUMMARY Betfair Core Group Betfair US Betfair2 £200.6m £180.2m £20.4m Revenue +5% +5% +9% £42.3m £40.8m £1.4m EBITDA1 -2% -5% +360% 17.4p EPS1 -25% 4.0p Dividend +25% 1 Figures represent underlying results, which exclude, where relevant separately disclosed items and the associated tax effect of
Slide 22: Revenue Growth YoY%
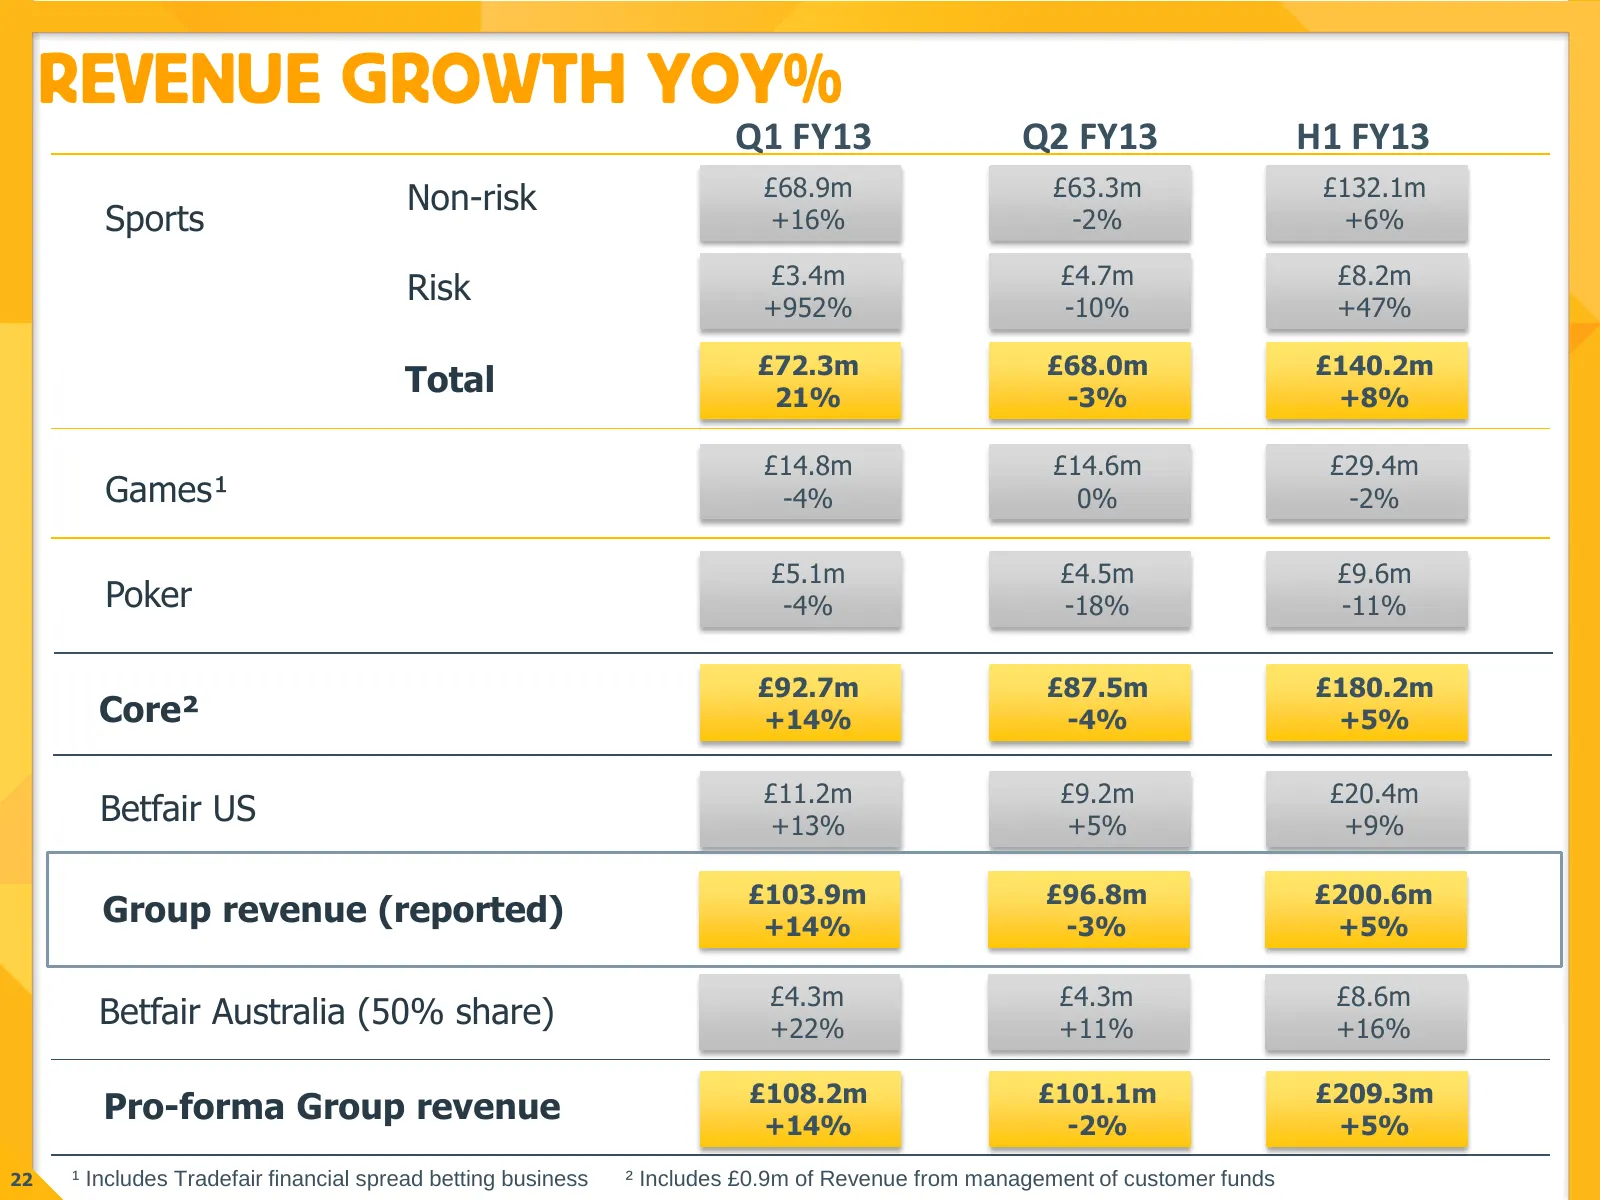
REVENUE GROWTH YOY% Q1 FY13 Q2 FY13 H1 FY13 Non-risk £68.9m £63.3m £132.1m Sports +16% -2% +6% £3.4m £4.7m £8.2m Risk +952% -10% +47% £72.3m £68.0m £140.2m Total 21% -3% +8% £14.8m £14.6m £29.4m Games¹ -4% 0% -2% £5.1m £4.5m £9.6m Poker -4% -18% -11% £92.7m £87.5m £180.2m Core² +14% -4% +5% £11.2m £
Slide 23: Underlying Group P&L
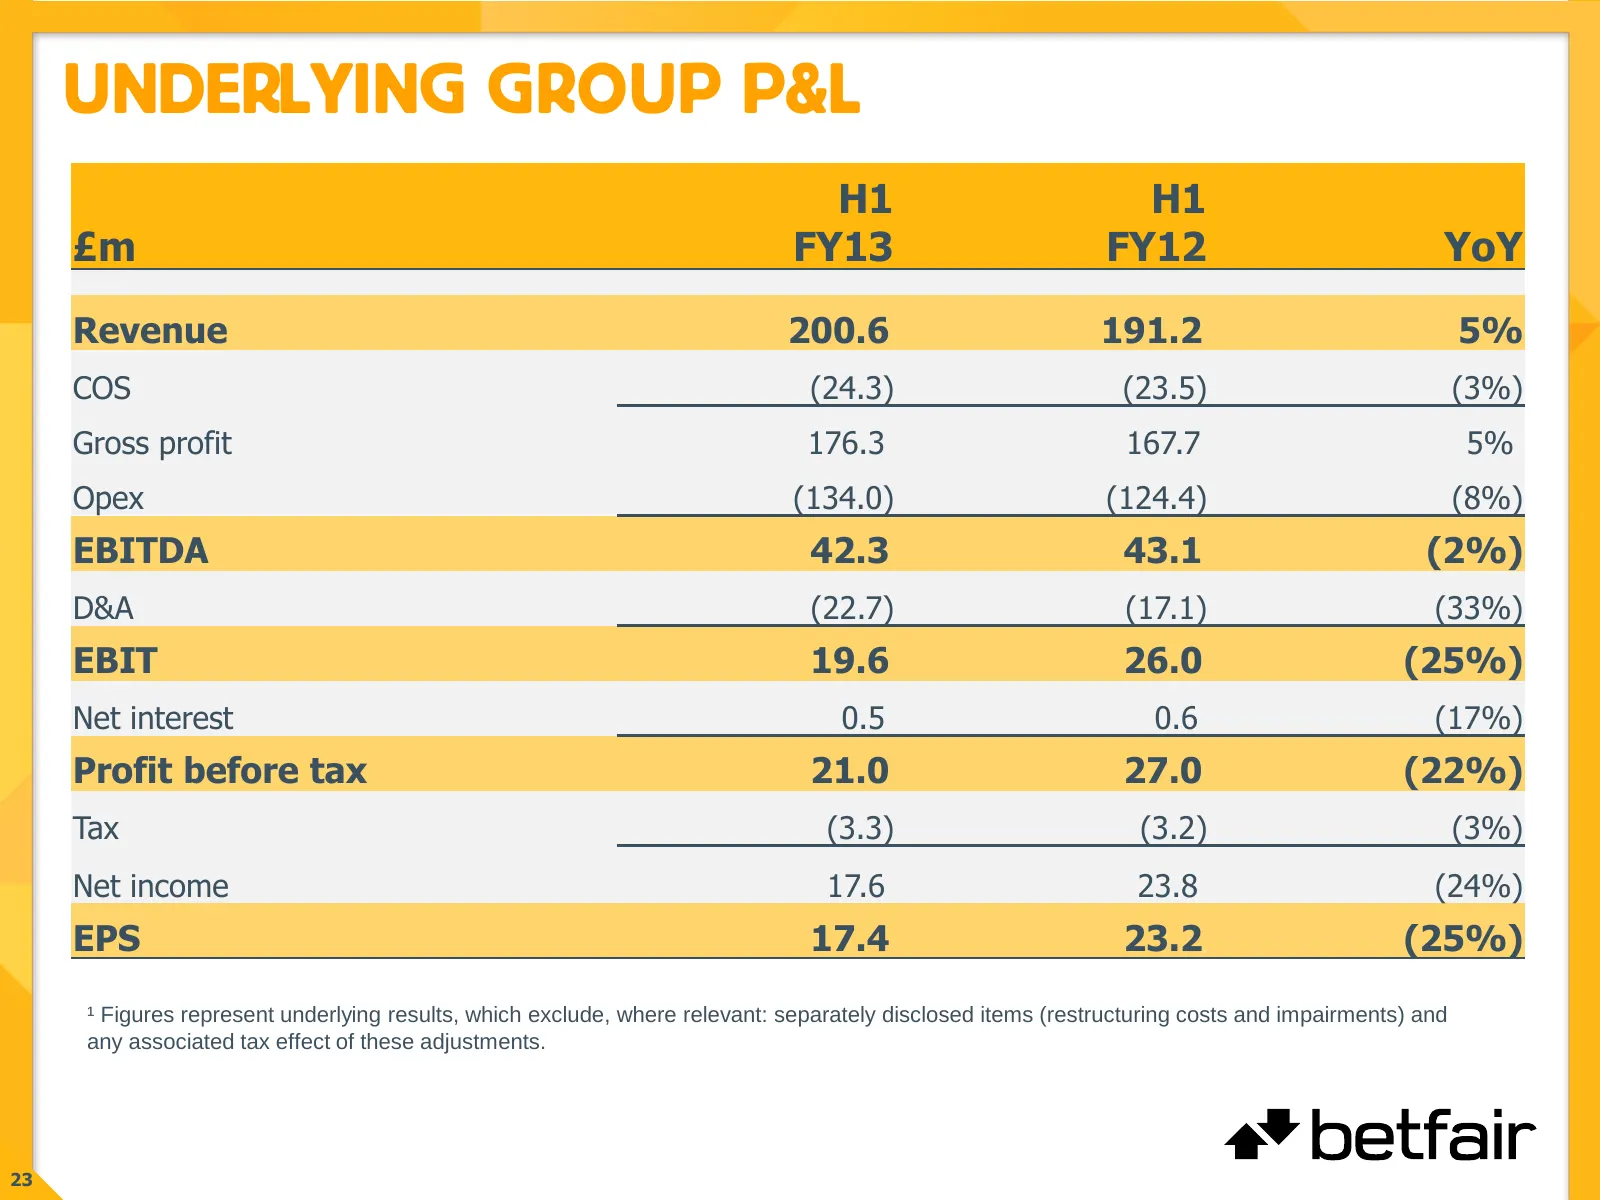
UNDERLYING GROUP P&L H1 H1 £m FY13 FY12 YoY Revenue 200.6. 191.2. 5% COS (24.3) (23.5) (3%) Gross profit 176.3. 167.7. 5%. Opex (134.0) (124.4) (8%) EBITDA 42.3. 43.1. (2%) D&A (22.7) (17.1) (33%) EBIT 19.6. 26.0. (25%) Net interest 0.5. 0.6. (17%) Profit before tax 21.0. 27.0. (22%) Tax (3.3) (3.2)
Slide 24: Separately Disclosed Items
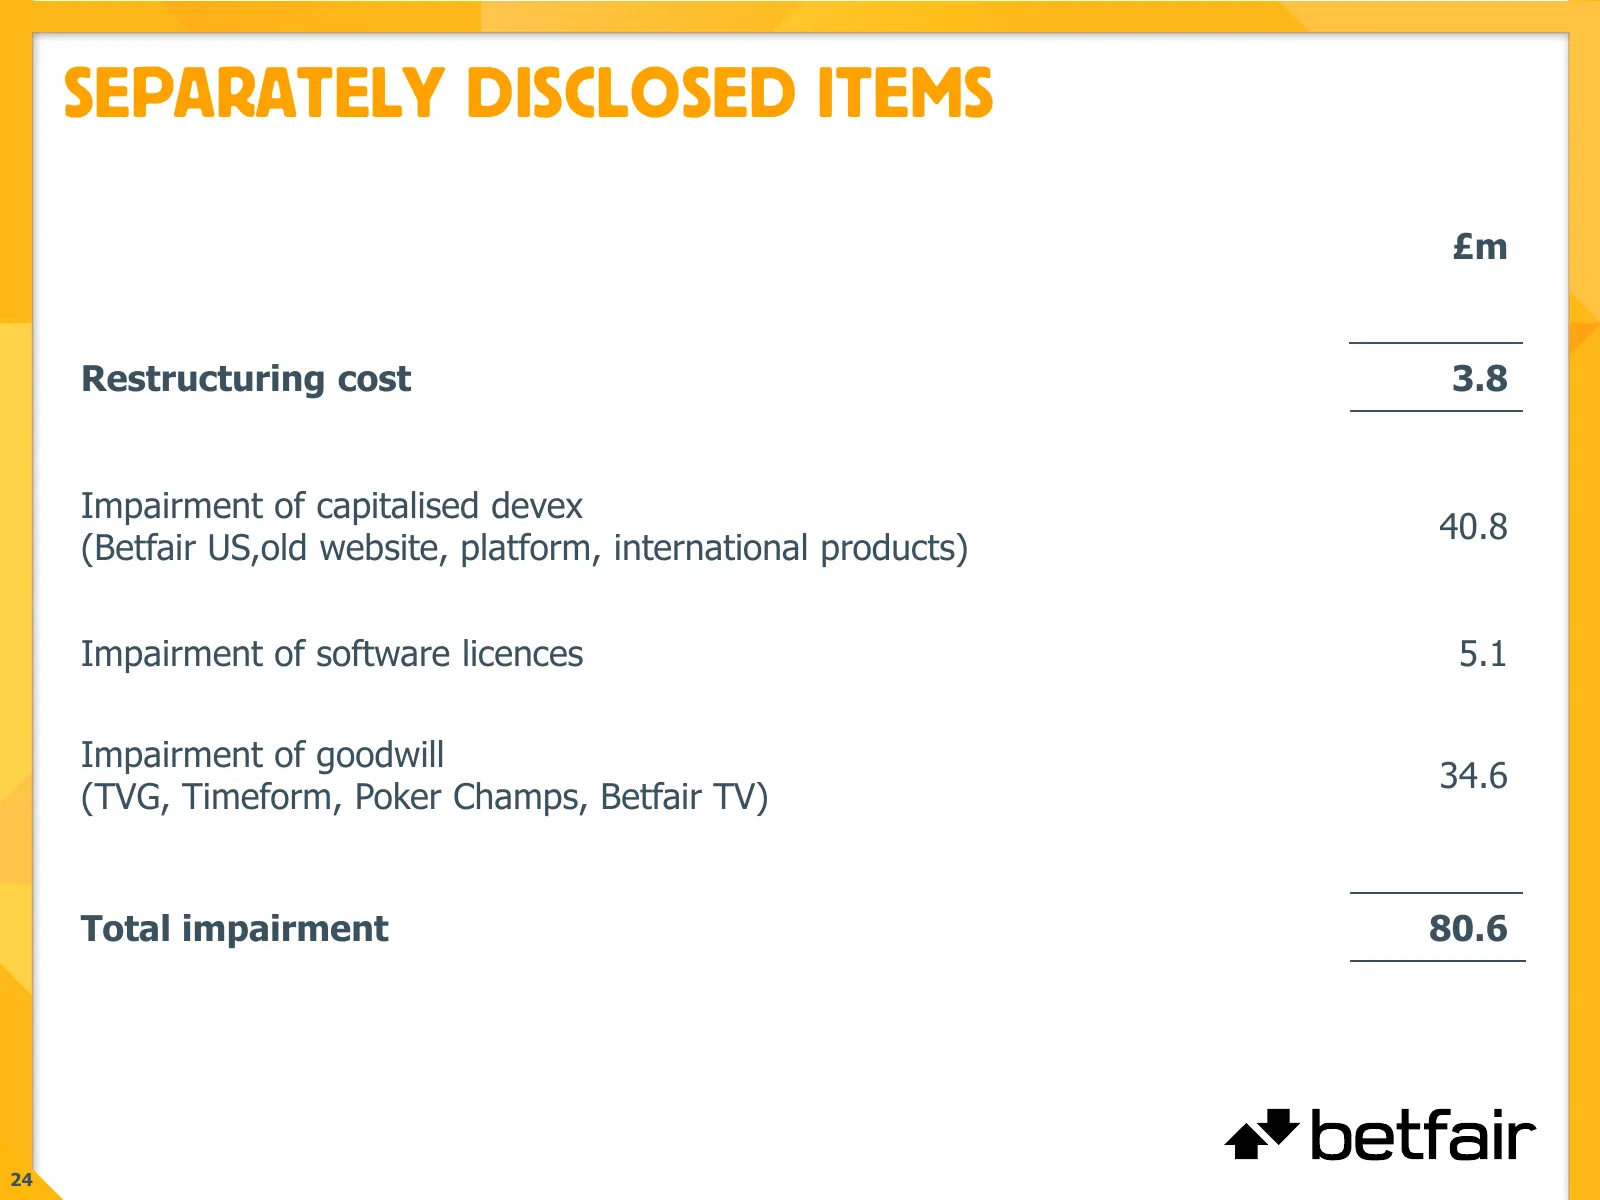
SEPARATELY DISCLOSED ITEMS £m Restructuring cost 3.8 Impairment of capitalised devex 40.8 (Betfair US,old website, platform, international products) Impairment of software licences 5.1 Impairment of goodwill 34.6 (TVG, Timeform, Poker Champs, Betfair TV) Total impairment 80.6 24
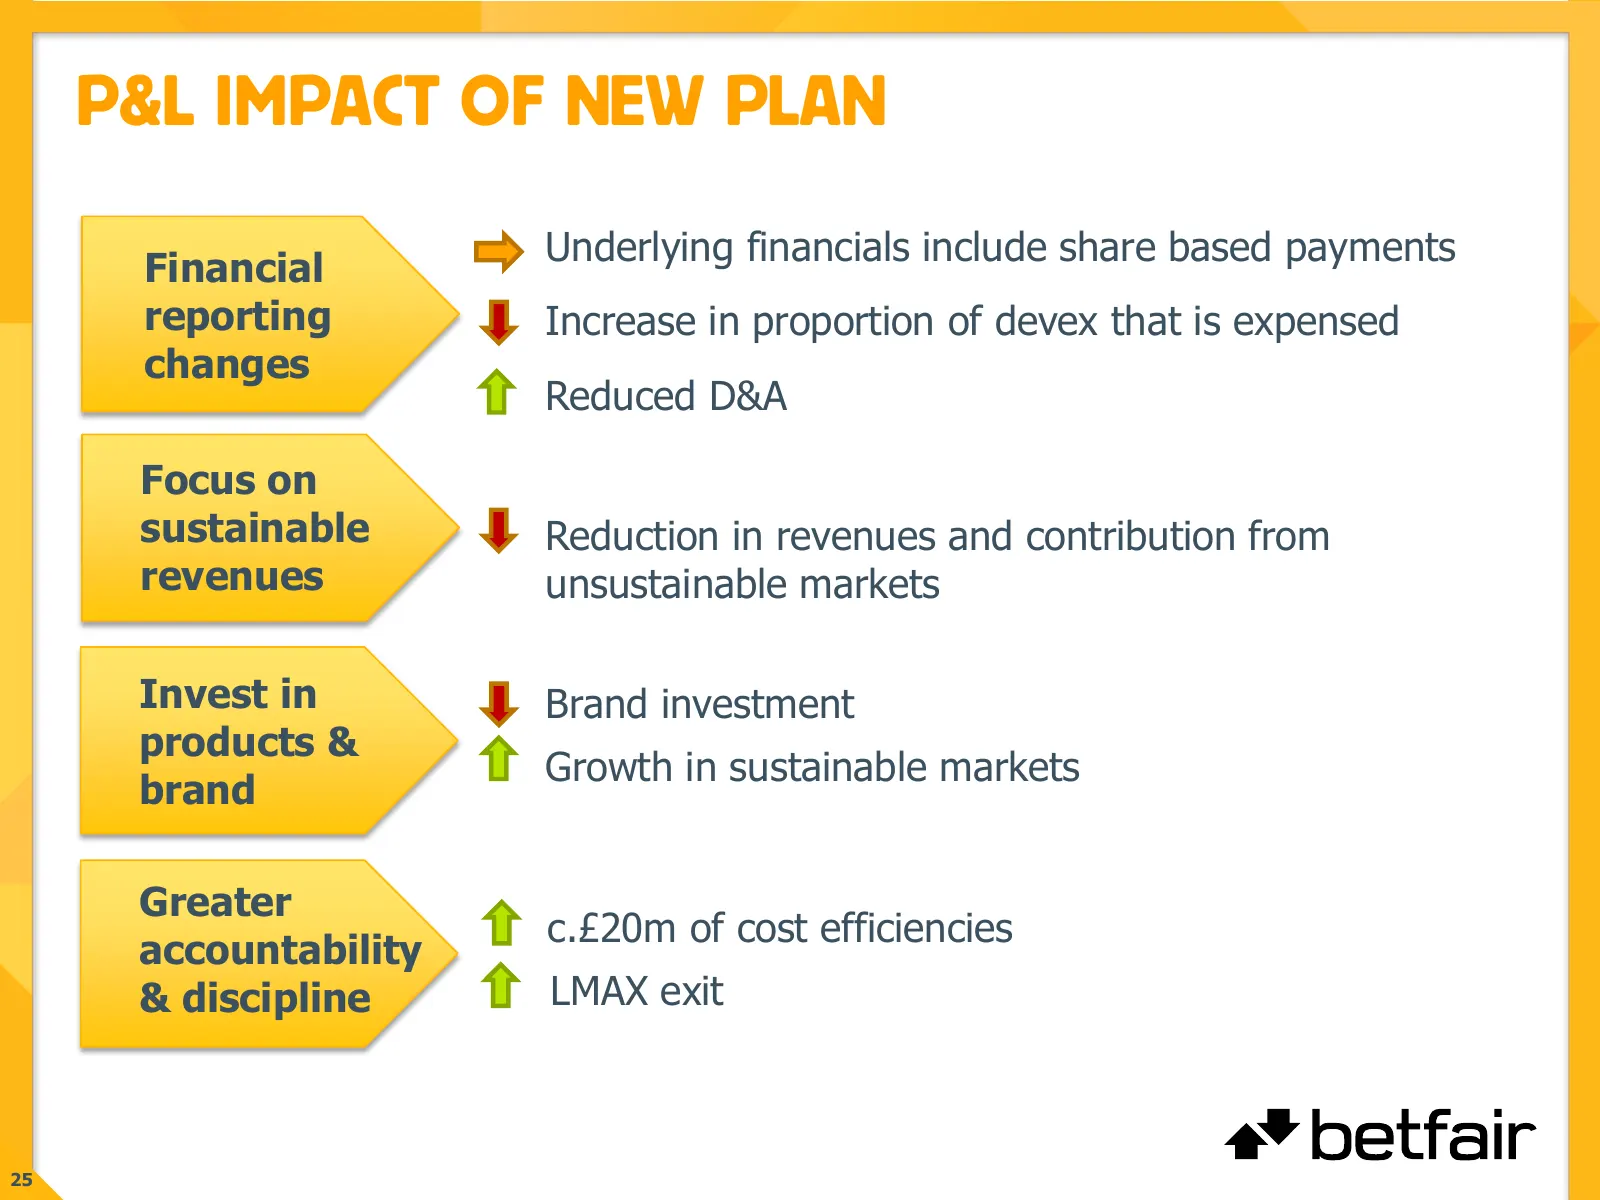
Slide 25: P&L Impact of New Plan
P&L IMPACT OF NEW PLAN Underlying financials include share based payments Financial reporting Increase in proportion of devex that is expensed changes Reduced D&A Focus on sustainable Reduction in revenues and contribution from revenues unsustainable markets Invest in Brand investment products & Gro
Slide 26: Outlook
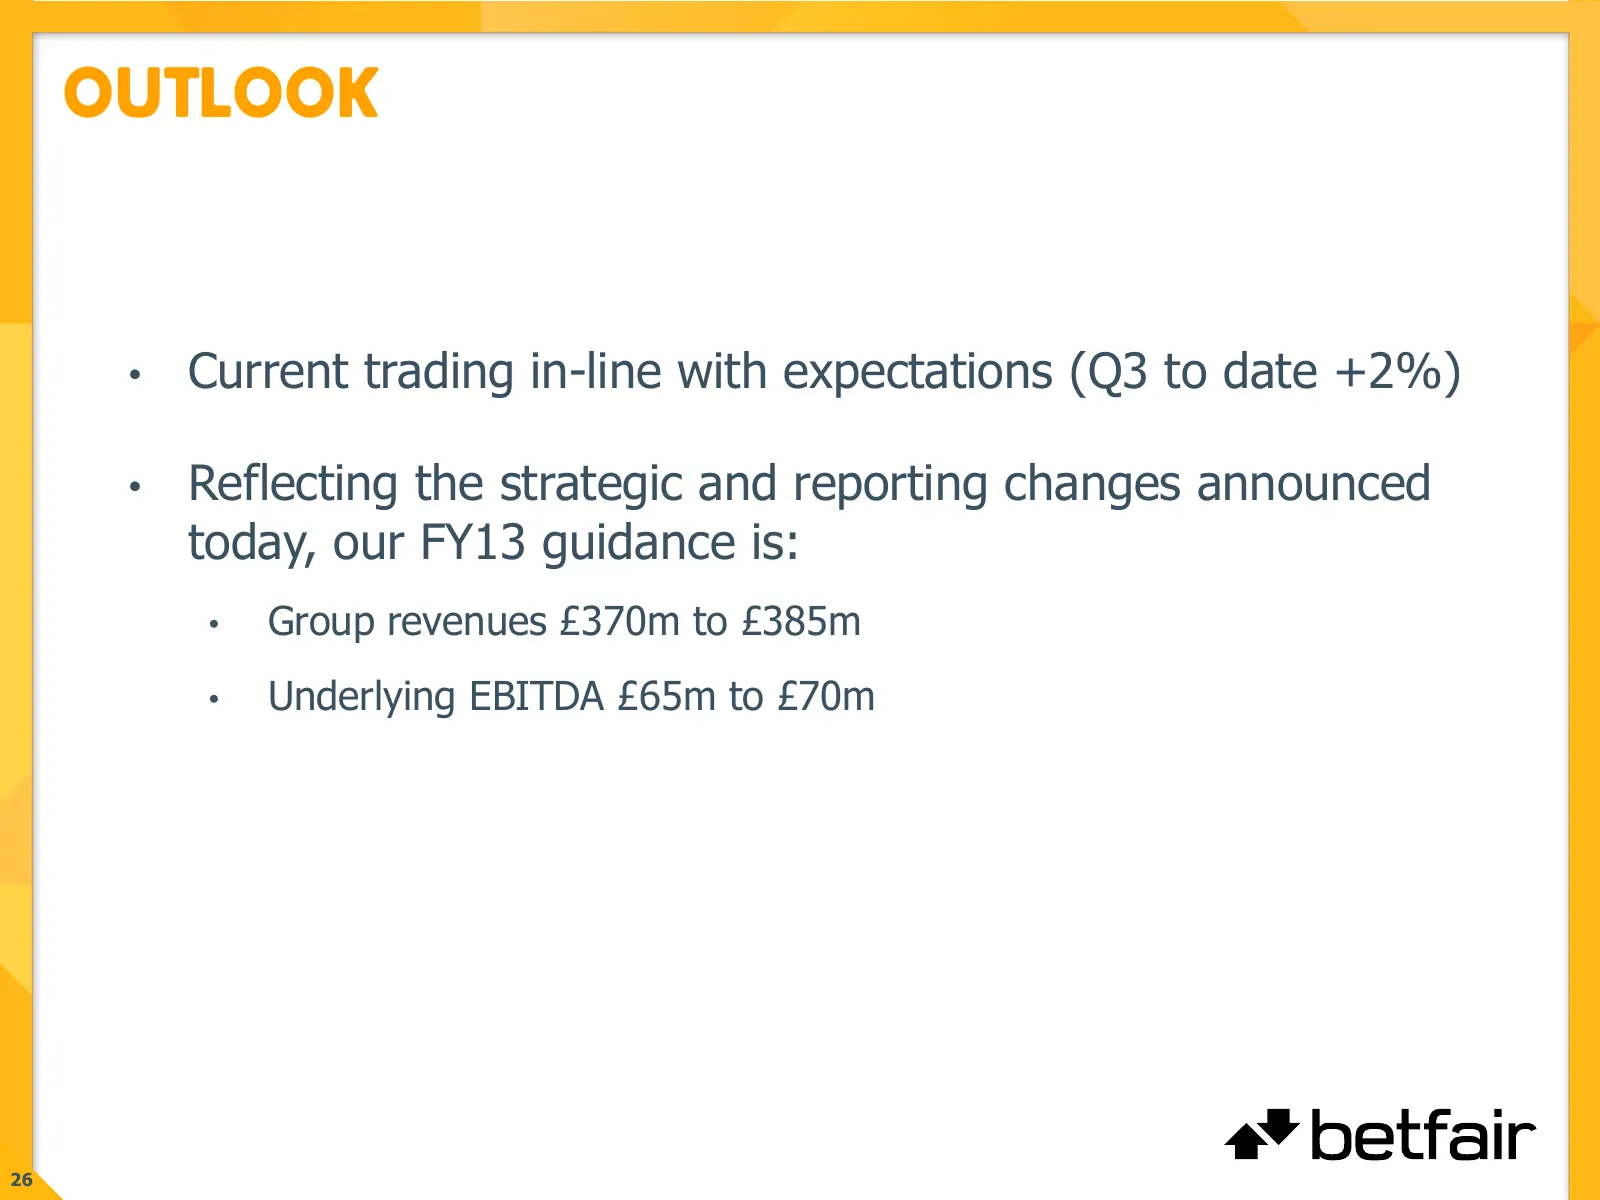
OUTLOOK • Current trading in-line with expectations (Q3 to date +2%) • Reflecting the strategic and reporting changes announced today, our FY13 guidance is: • Group revenues £370m to £385m • Underlying EBITDA £65m to £70m 26
Slide 27: Dividend
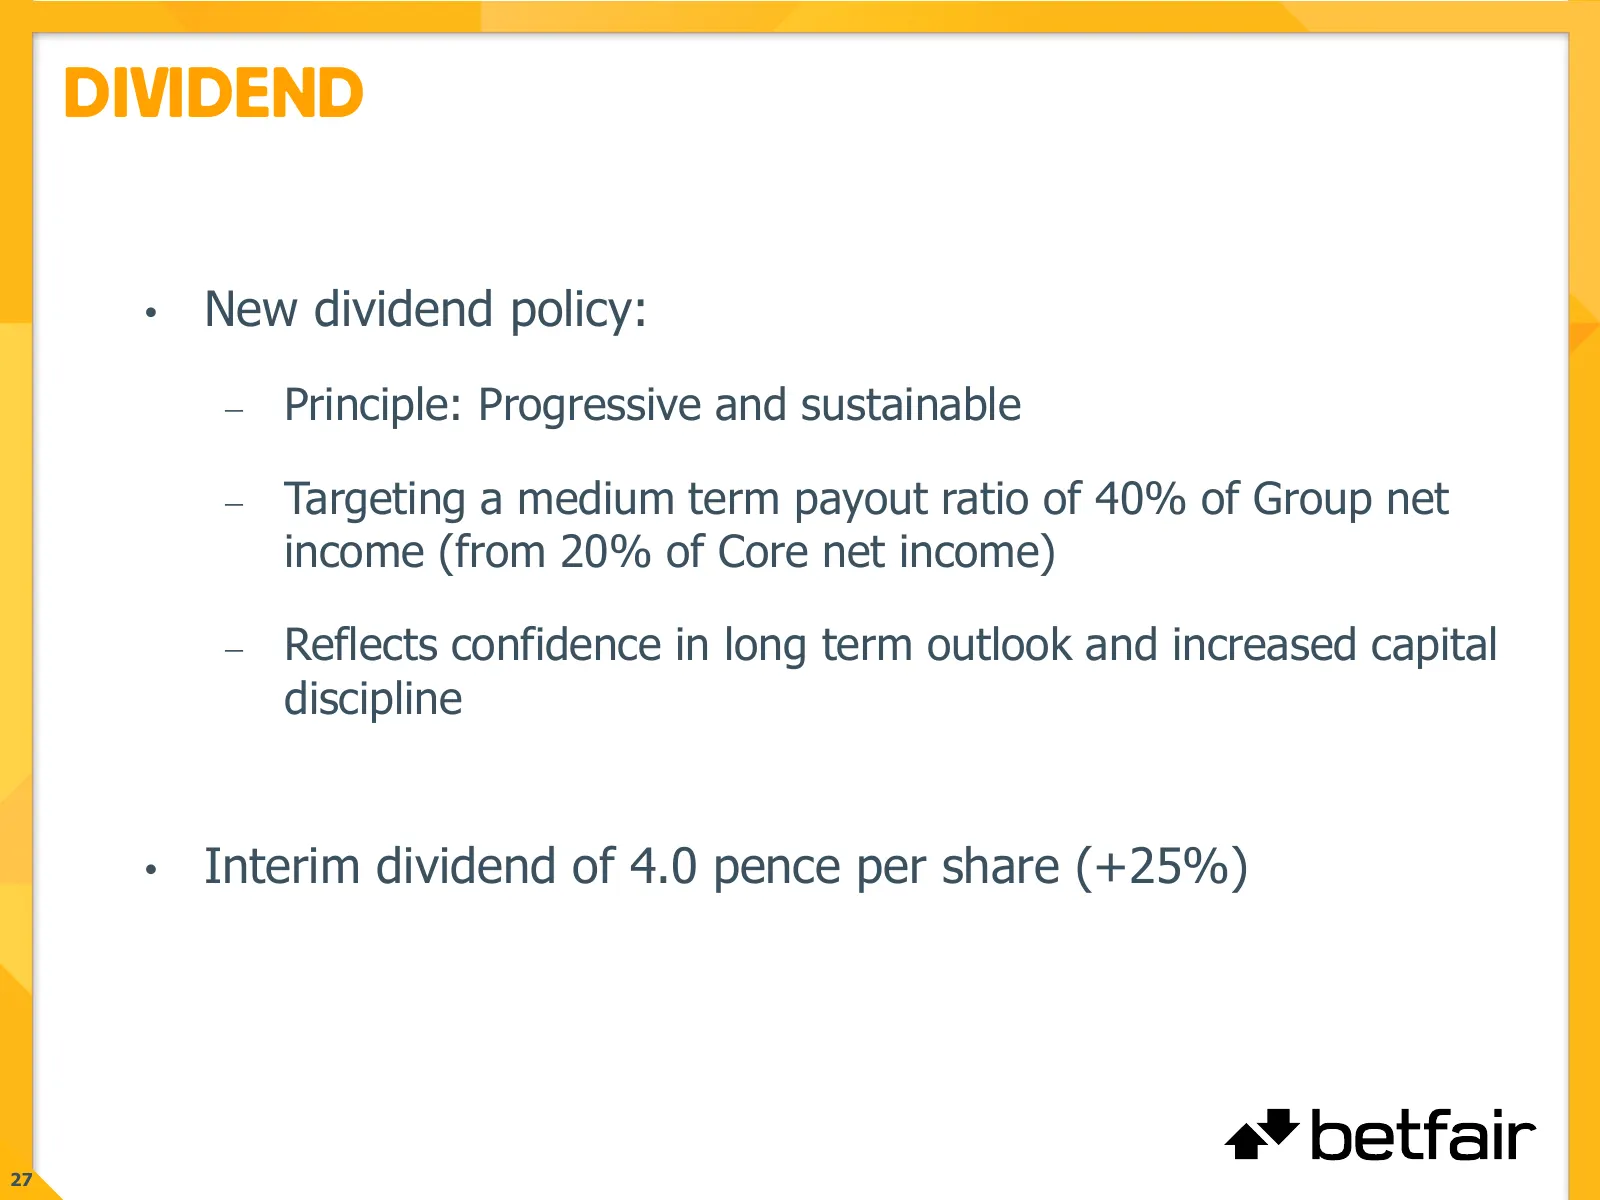
DIVIDEND • New dividend policy: Principle: Progressive and sustainable Targeting a medium term payout ratio of 40% of Group net income (from 20% of Core net income) Reflects confidence in long term outlook and increased capital discipline • Interim dividend of 4.0 pence per share (+25%) 27
Slide 28: Summary
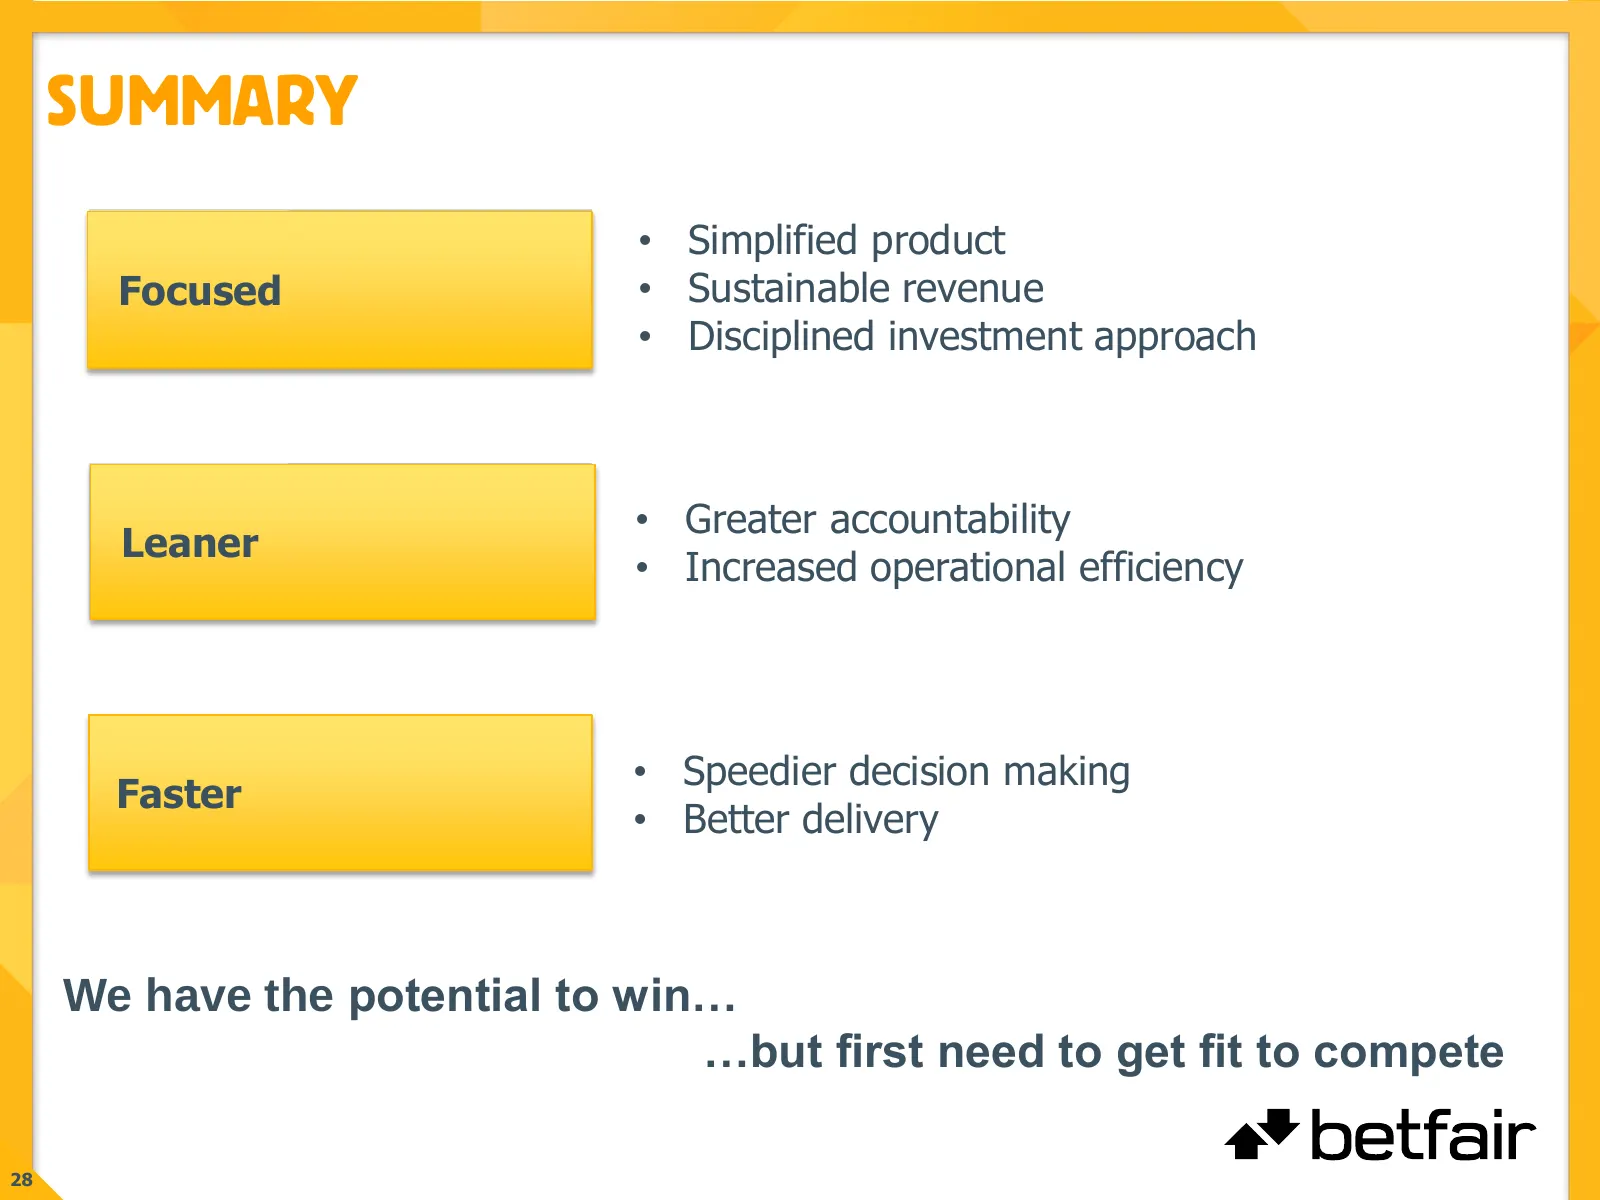
SUMMARY • Simplified product Focused • Sustainable revenue • Disciplined investment approach • Greater accountability Fitter Leaner • Increased operational efficiency • Speedier decision making Faster • Better delivery We have the potential to win… …but first need to get fit to compete 28

Slide 29: Q&A
Q&A a* betfair

Slide 30: Appendix
APPENDIX a* betfair
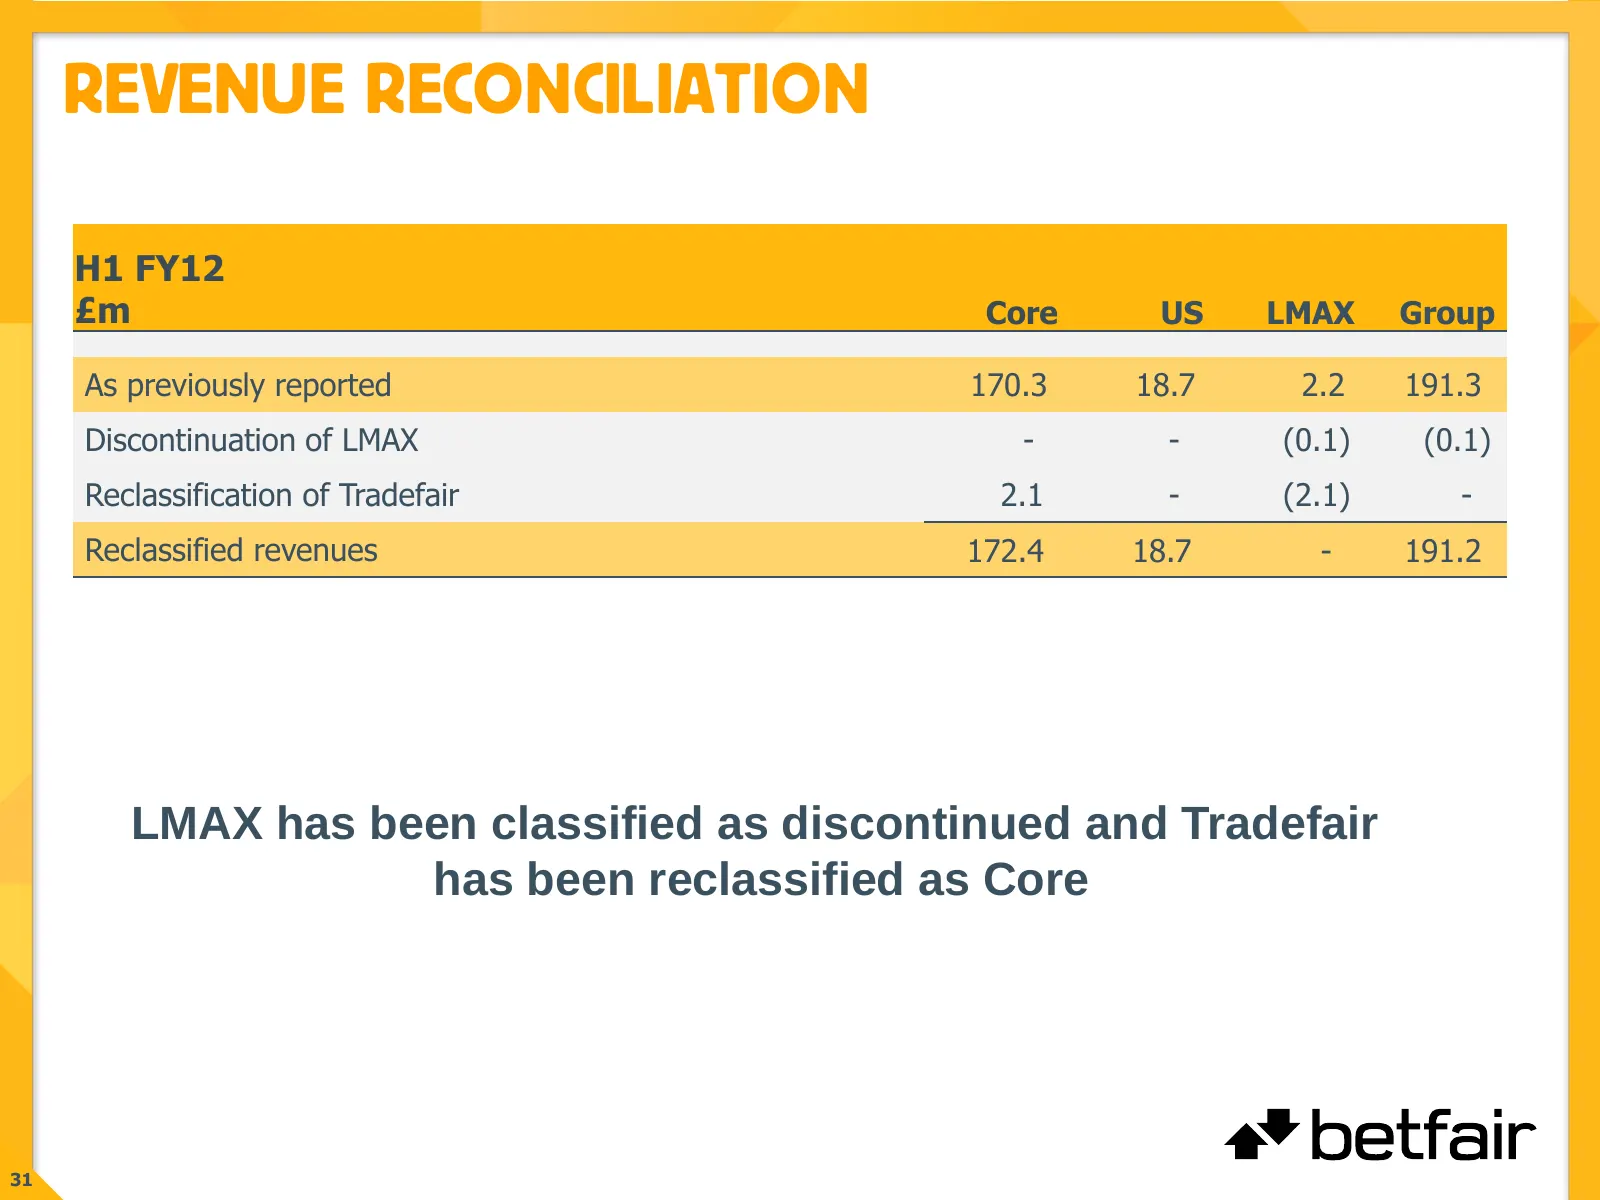
Slide 31: Revenue Reconciliation
REVENUE RECONCILIATION H1 FY12 £m Core. US. LMAX. Group. As previously reported 170.3. 18.7. 2.2. 191.3. Discontinuation of LMAX -.. -.. (0.1) (0.1) Reclassification of Tradefair 2.1. -.. (2.1) -.. Reclassified revenues 172.4. 18.7. -.. 191.2. LMAX has been classified as discontinued and Tradefair h
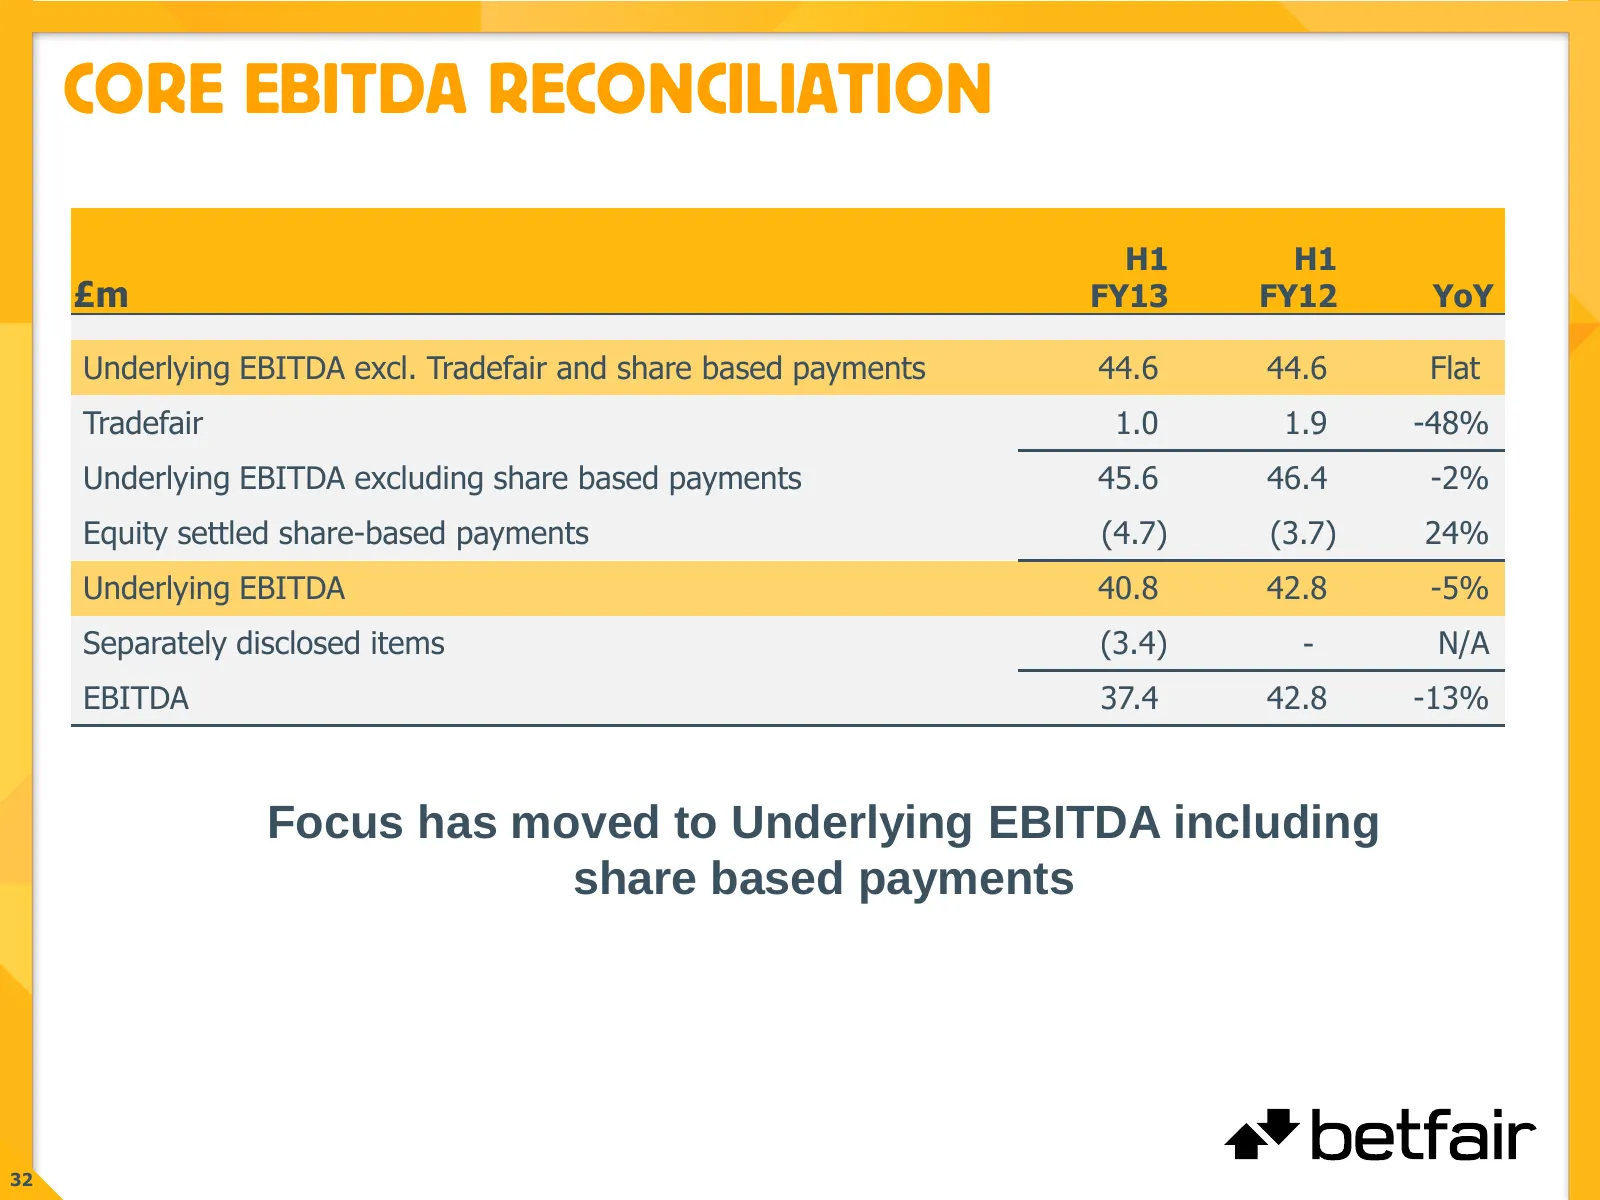
Slide 32: Core EBITDA Reconciliation
CORE EBITDA RECONCILIATION H1. H1. £m FY13. FY12. YoY. Underlying EBITDA excl. Tradefair and share based payments 44.6. 44.6. Flat. Tradefair 1.0. 1.9. -48% Underlying EBITDA excluding share based payments 45.6. 46.4. -2% Equity settled share-based payments (4.7) (3.7) 24% Underlying EBITDA 40.8. 42
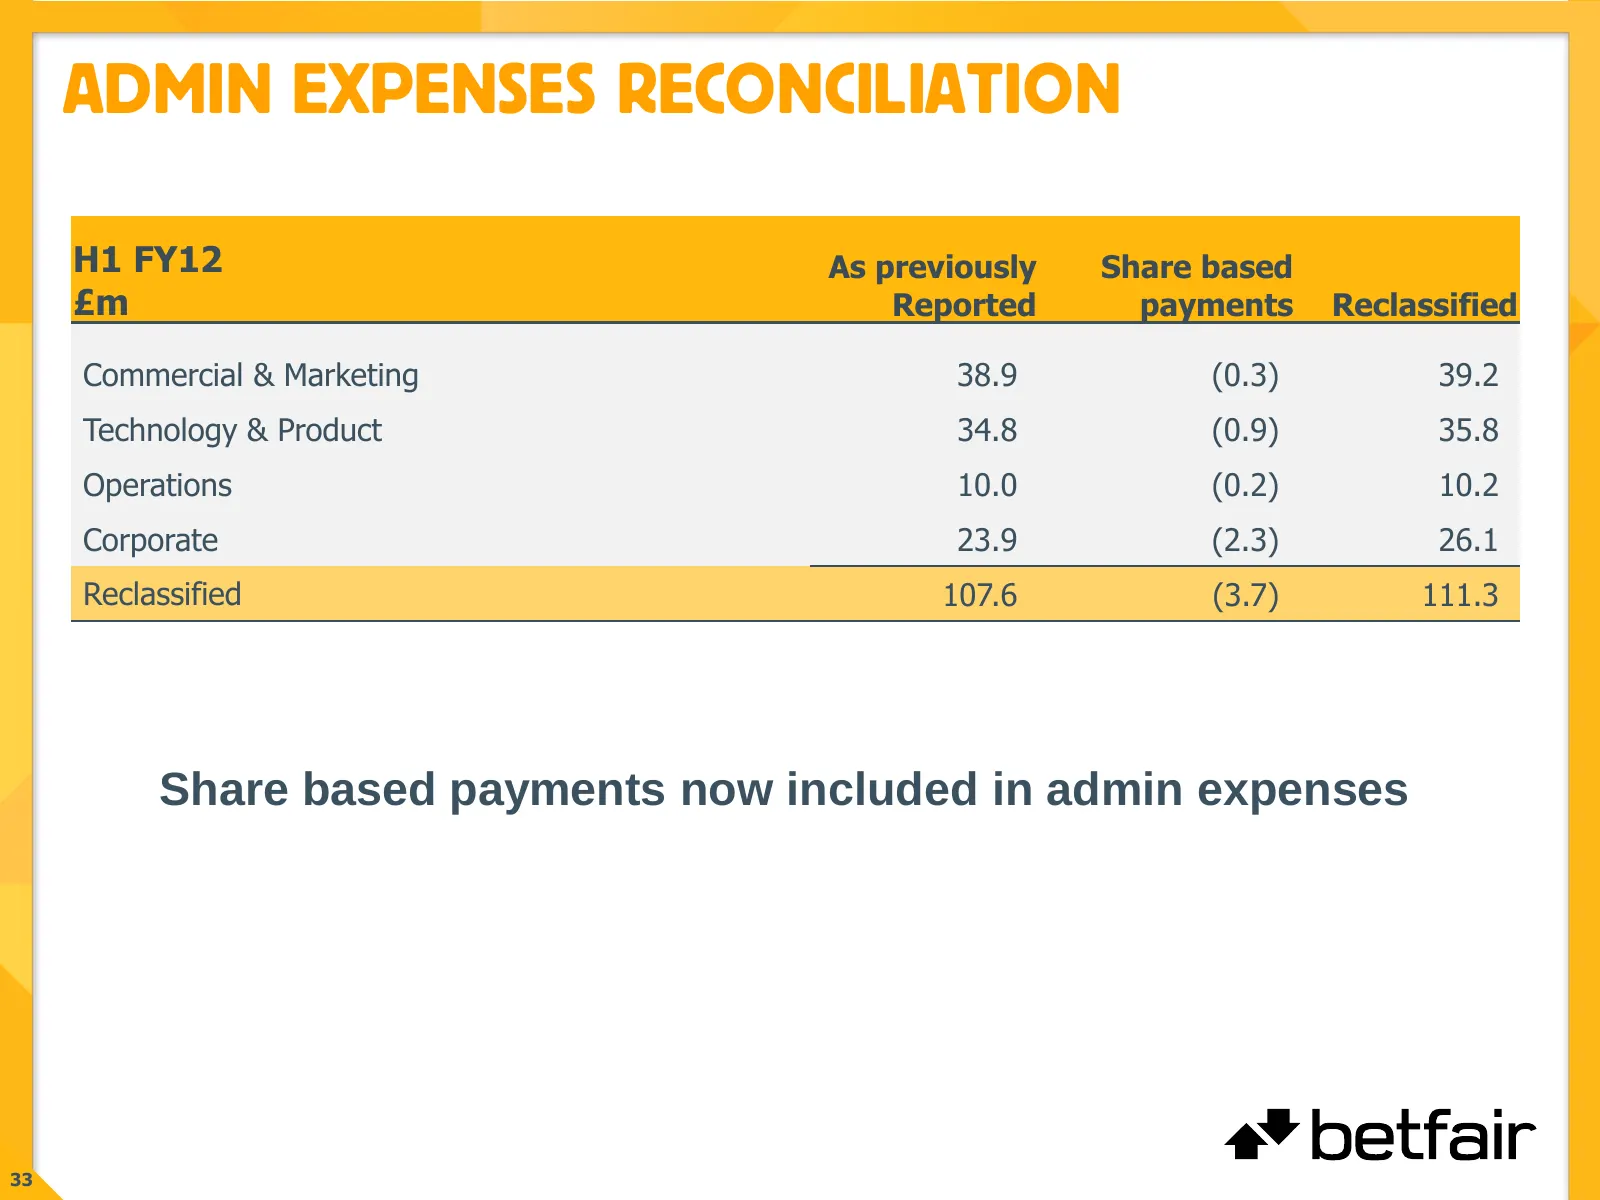
Slide 33: Admin Expenses Reconciliation
ADMIN EXPENSES RECONCILIATION H1 FY12 As previously Share based £m Reported payments Reclassified Commercial & Marketing 38.9 (0.3) 39.2 Technology & Product 34.8 (0.9) 35.8 Operations 10.0 (0.2) 10.2 Corporate 23.9 (2.3) 26.1 Reclassified 107.6 (3.7) 111.3 Share based payments now included in admin
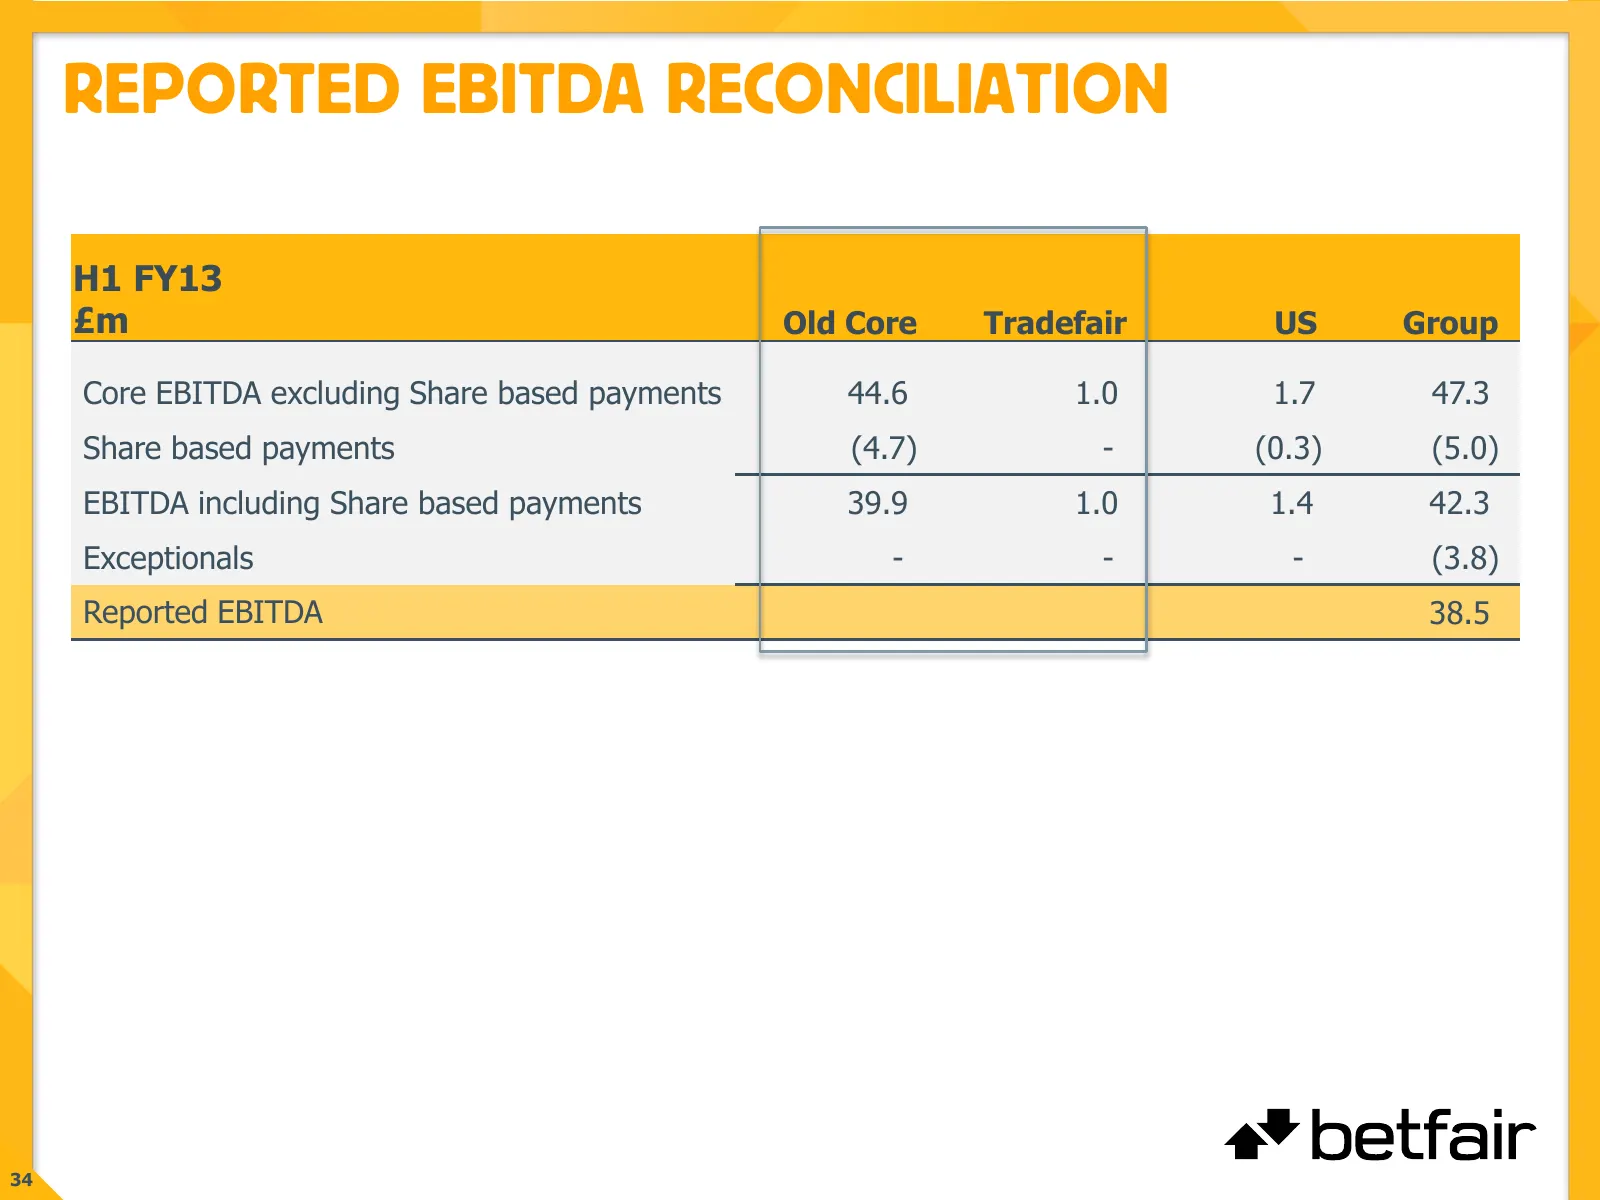
Slide 34: Reported EBITDA Reconciliation
REPORTED EBITDA RECONCILIATION H1 FY13 £m Old Core.. Tradefair.. US.. Group.. Core EBITDA excluding Share based payments 44.6. 1.0. 1.7. 47.3. Share based payments (4.7) -.. (0.3) (5.0) EBITDA including Share based payments 39.9. 1.0. 1.4. 42.3. Exceptionals -.. -.. -.. (3.8) Reported EBITDA 38.5. 3
Source: Internet Archive copy of flutter.com
More decks from Flutter Entertainment plc
 Q3 2026 Earnings Presentation15 slides · Nov 4, 2026
 Q2 2026 Earnings Presentation14 slides · Aug 5, 2026
 Investor Day (September 2024)152 slides · Sep 25, 2024
 Q2 2024 Earnings Presentation20 slides · Aug 13, 2024
 Q1 2024 Earnings Presentation20 slides · May 14, 2024
 FY2023 Earnings Presentation36 slides · Mar 26, 2024